Embed Size (px)
Citation preview
7/28/2019 Purificazione e studio cinetico - Lattato deidrogenasi (LDH) da fegato di coniglio
http://slidepdf.com/reader/full/purificazione-e-studio-cinetico-lattato-deidrogenasi-ldh-da-fegato-di-coniglio 1/10
Biochimica Sperimentale – Serena Cucinotta 467345
Partial purification, characterization and kinetic properties
of Lactate Dehydrogenase from rabbit liver
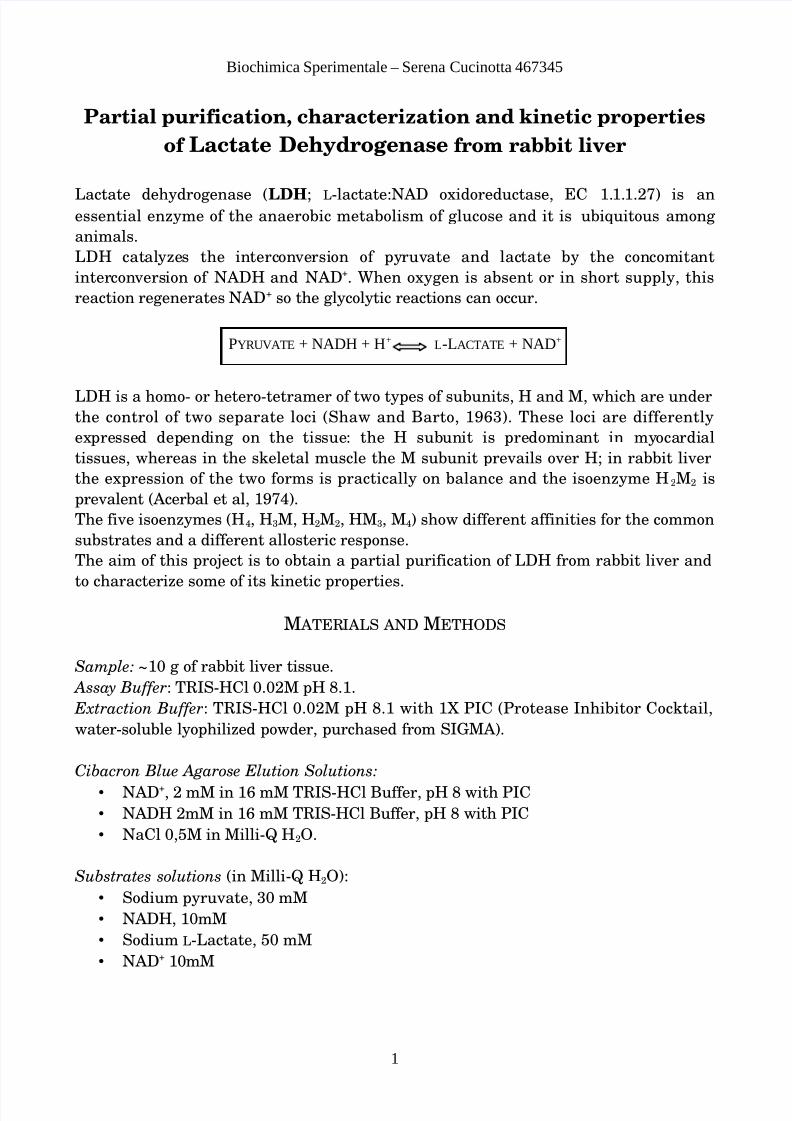
Lactate dehydrogenase (LDH; L-lactate:NAD oxidoreductase, EC 1.1.1.27) is anessential enzyme of the anaerobic metabolism of glucose and it is ubiquitous among
animals.
LDH catalyzes the interconversion of pyruvate and lactate by the concomitant
interconversion of NADH and NAD+. When oxygen is absent or in short supply, this
reaction regenerates NAD+ so the glycolytic reactions can occur.
PYRUVATE + NADH + H+L-LACTATE + NAD+
LDH is a homo- or hetero-tetramer of two types of subunits, H and M, which are underthe control of two separate loci (Shaw and Barto, 1963). These loci are differently
expressed depending on the tissue: the H subunit is predominant in myocardial
tissues, whereas in the skeletal muscle the M subunit prevails over H; in rabbit liver
the expression of the two forms is practically on balance and the isoenzyme H 2M2 is
prevalent (Acerbal et al, 1974).
The five isoenzymes (H4, H3M, H2M2, HM3, M4) show different affinities for the common
substrates and a different allosteric response.
The aim of this project is to obtain a partial purification of LDH from rabbit liver and
to characterize some of its kinetic properties.
M ATERIALS AND METHODS
Sample: ~10 g of rabbit liver tissue.
Assay Buffer: TRIS-HCl 0.02M pH 8.1.
Extraction Buffer: TRIS-HCl 0.02M pH 8.1 with 1X PIC (Protease Inhibitor Cocktail,
water-soluble lyophilized powder, purchased from SIGMA).
Cibacron Blue Agarose Elution Solutions:
NAD+, 2 mM in 16 mM TRIS-HCl Buffer, pH 8 with PIC
NADH 2mM in 16 mM TRIS-HCl Buffer, pH 8 with PIC
NaCl 0,5M in Milli-Q H2O.
Substrates solutions (in Milli-Q H2O):
Sodium pyruvate, 30 mM
NADH, 10mM
Sodium L-Lactate, 50 mM
NAD+ 10mM
1
7/28/2019 Purificazione e studio cinetico - Lattato deidrogenasi (LDH) da fegato di coniglio
http://slidepdf.com/reader/full/purificazione-e-studio-cinetico-lattato-deidrogenasi-ldh-da-fegato-di-coniglio 2/10
Biochimica Sperimentale – Serena Cucinotta 467345
Bradford Protein Assay – Protein level measurements were carried out according to
Bradford (1979), using 200 μL of the 1X dye reagent (Bio-Rad). A Bovine Serum
Albumin (BSA, purchased from Sigma) 0.1 mg/ml solution was used as a standard.
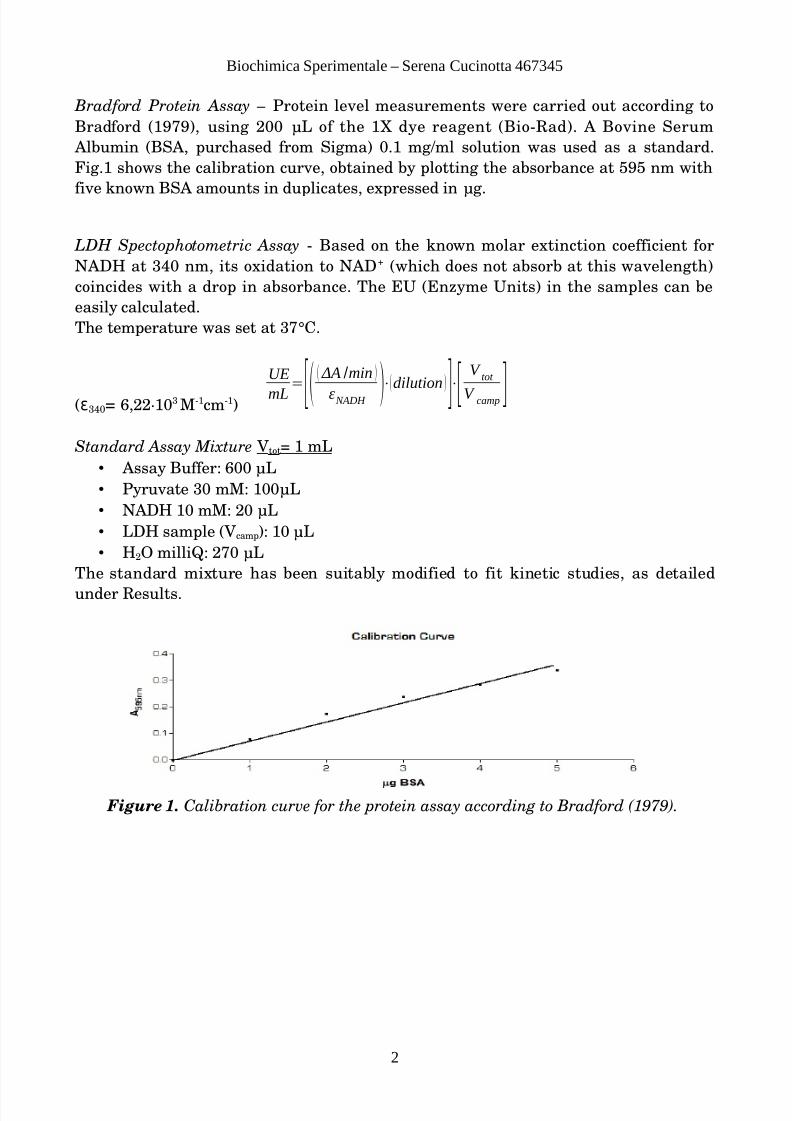
Fig.1 shows the calibration curve, obtained by plotting the absorbance at 595 nm with
five known BSA amounts in duplicates, expressed in μg.
LDH Spectophotometric Assay - Based on the known molar extinction coefficient for
NADH at 340 nm, its oxidation to NAD+ (which does not absorb at this wavelength)
coincides with a drop in absorbance. The EU (Enzyme Units) in the samples can be
easily calculated.
The temperature was set at 37°C.
(ε340= 6,22∙103 M-1cm-1)
UE
mL=
[(( ΔA /min )
ε NADH
)⋅(dilution )
]⋅
[V
tot
V camp
]Standard Assay Mixture V tot= 1 mL
Assay Buffer: 600 μL
Pyruvate 30 mM: 100μL
NADH 10 mM: 20 μL
LDH sample (V camp): 10 μL
H2O milliQ: 270 μL
The standard mixture has been suitably modified to fit kinetic studies, as detailed
under Results.
Figure 1. Calibration curve for the protein assay according to Bradford (1979).
2
7/28/2019 Purificazione e studio cinetico - Lattato deidrogenasi (LDH) da fegato di coniglio
http://slidepdf.com/reader/full/purificazione-e-studio-cinetico-lattato-deidrogenasi-ldh-da-fegato-di-coniglio 3/10
20 30 40 50 60 70 80 90
0
0,5
1
1,5
2
2,5
0
0,15
0,3
0,45
0,6
0,75
0,9
#fractions
A b s
A / m i n
Biochimica Sperimentale – Serena Cucinotta 467345
RESULTS
Homogenate. Ten grams of liver were homogenized in 3 volumes of extraction buffer
(1:3 w/v) with a Potter homogenizer and then centrifuged at 10,000 rpm for 1h at 4 °C.
The supernatant was collected and measured in a ice-cooled cylinder and labeled ascrude extract (EG); 100μL of EG were put aside for protein and enzyme activity assays
(frozen at -20°C)
Salting-out. The EG was fractionated with ammonium sulfate (AS) as follows.
Solid AS was added to the EG set on a stirring apparatus at 4°C to reach 35%
saturation. The suspension was then centrifuged at 5,000 rpm for 20 min.
The pellet obtained (P35) was suspended in the minimum volume of extraction buffer.
50 μL of P35 were put aside for assays; the whole P35 fraction was frozen at -20°C.
The supernatant obtained (S35) was poured in a graduated cylinder (for volume
measurement) and then in a cool Becker on the stirring apparatus, and added with AS
to reach 70% saturation. Then, after 20 mins of centrifugation at 5,000 rpm, the pellet
was resuspended as above (P70) and both the supernatant and the P70 were measured in
a cylinder and then frozen at -20°C (50 μL of each were put in Eppendorff tubes for
assays).
Gel exclusion chromatography – A column was packed with Sephacryl-200, a
dextran-polyacrylamide gel that separates proteins with a molecular size ranging from
5 to 250 kDa; the gel was equilibrated with Extraction Buffer at a flow rate of about 14
mL/h. After loading a 1-mL aliquot of P70, fractions of ~2 mL were collected every 8
min overnight by an automated collector.
After the elution, 80 fractions were collected. Beginning from the 20th, the absorbance
at 280 nm (A 280) of all fractions was measured, in order to determine the approximate
value of protein content.
Fractions with high optical density were assayed for LDH activity by the standard
assay.
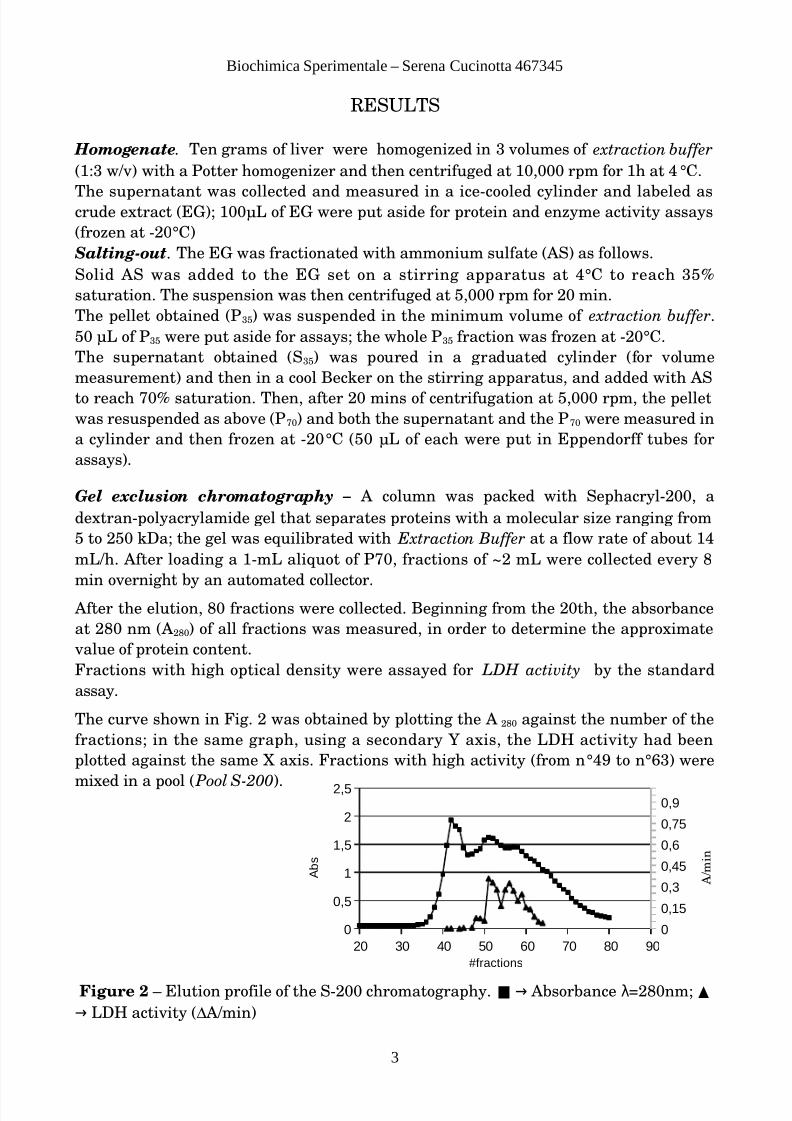
The curve shown in Fig. 2 was obtained by plotting the A 280 against the number of the
fractions; in the same graph, using a secondary Y axis, the LDH activity had been
plotted against the same X axis. Fractions with high activity (from n°49 to n°63) were
mixed in a pool ( Pool S-200).
Figure 2 – Elution profile of the S-200 chromatography. ■ Absorbance =280nm;→ λ ▲
LDH activity (Δ A/min)→
3
7/28/2019 Purificazione e studio cinetico - Lattato deidrogenasi (LDH) da fegato di coniglio
http://slidepdf.com/reader/full/purificazione-e-studio-cinetico-lattato-deidrogenasi-ldh-da-fegato-di-coniglio 4/10
Biochimica Sperimentale – Serena Cucinotta 467345
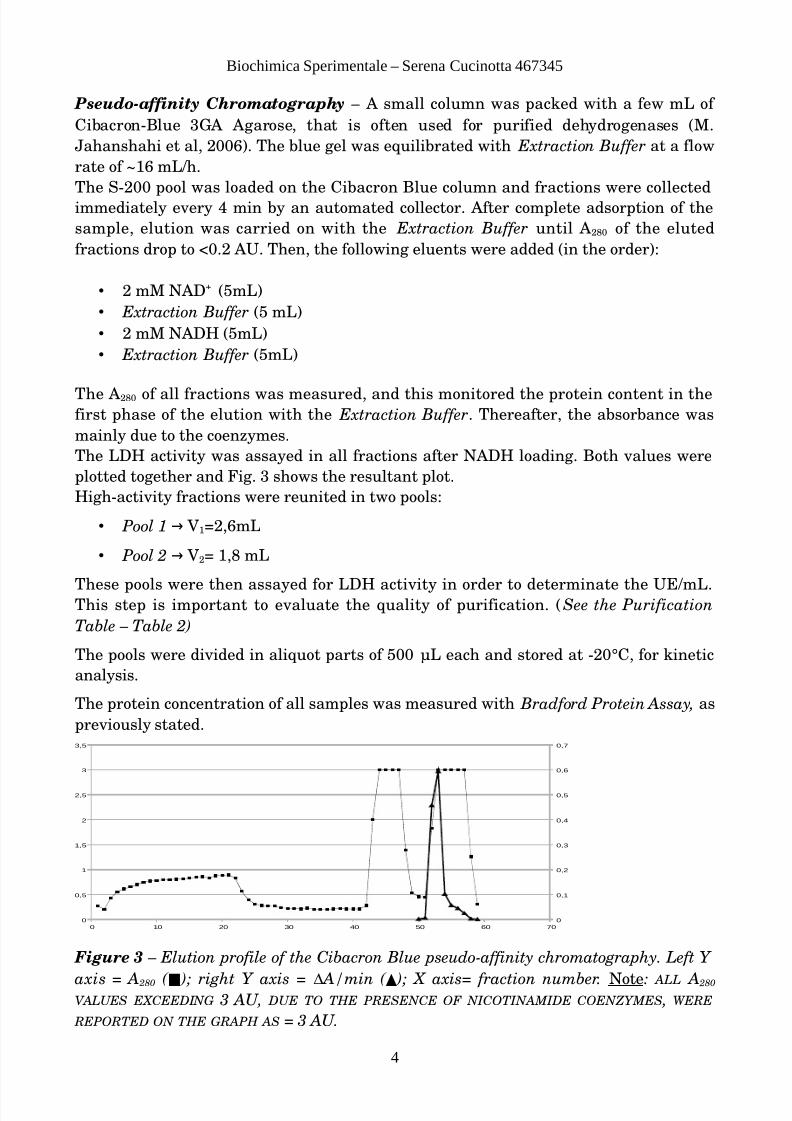
Pseudo-affinity Chromatography – A small column was packed with a few mL of
Cibacron-Blue 3GA Agarose, that is often used for purified dehydrogenases (M.
Jahanshahi et al, 2006). The blue gel was equilibrated with Extraction Buffer at a flow
rate of ~16 mL/h.
The S-200 pool was loaded on the Cibacron Blue column and fractions were collected
immediately every 4 min by an automated collector. After complete adsorption of the
sample, elution was carried on with the Extraction Buffer until A 280 of the eluted
fractions drop to <0.2 AU. Then, the following eluents were added (in the order):
2 mM NAD+ (5mL)
Extraction Buffer (5 mL)
2 mM NADH (5mL)
Extraction Buffer (5mL)
The A 280 of all fractions was measured, and this monitored the protein content in thefirst phase of the elution with the Extraction Buffer. Thereafter, the absorbance was
mainly due to the coenzymes.
The LDH activity was assayed in all fractions after NADH loading. Both values were
plotted together and Fig. 3 shows the resultant plot.
High-activity fractions were reunited in two pools:
Pool 1 V → 1=2,6mL
Pool 2 V → 2= 1,8 mL
These pools were then assayed for LDH activity in order to determinate the UE/mL.This step is important to evaluate the quality of purification. ( See the Purification
Table – Table 2)
The pools were divided in aliquot parts of 500 μL each and stored at -20°C, for kinetic
analysis.
The protein concentration of all samples was measured with Bradford Protein Assay, as
previously stated.
0 10 20 30 40 50 60 70
0
0,5
1
1,5
2
2,5
3
3,5
0
0,1
0,2
0,3
0,4
0,5
0,6
0,7
Figure 3 – Elution profile of the Cibacron Blue pseudo-affinity chromatography. Left Y
axis = A 280 ( ■ ); right Y axis = Δ A/min ( ▲ ); X axis= fraction number. Note: ALL A 280
VALUES EXCEEDING 3 AU, DUE TO THE PRESENCE OF NICOTINAMIDE COENZYMES , WERE
REPORTED ON THE GRAPH AS = 3 AU.
4
7/28/2019 Purificazione e studio cinetico - Lattato deidrogenasi (LDH) da fegato di coniglio
http://slidepdf.com/reader/full/purificazione-e-studio-cinetico-lattato-deidrogenasi-ldh-da-fegato-di-coniglio 5/10
Biochimica Sperimentale – Serena Cucinotta 467345
The Purification Table, shown in Table 1, summarizes the results of the purification
procedure.
The relevant values are:
Specific activity (AS =
UE
mg )
Purification Factor ( AS
sample
AS EG)
Yield % of purification (U
sample
U EG
)
Table 1 – Summary of data from purification procedure
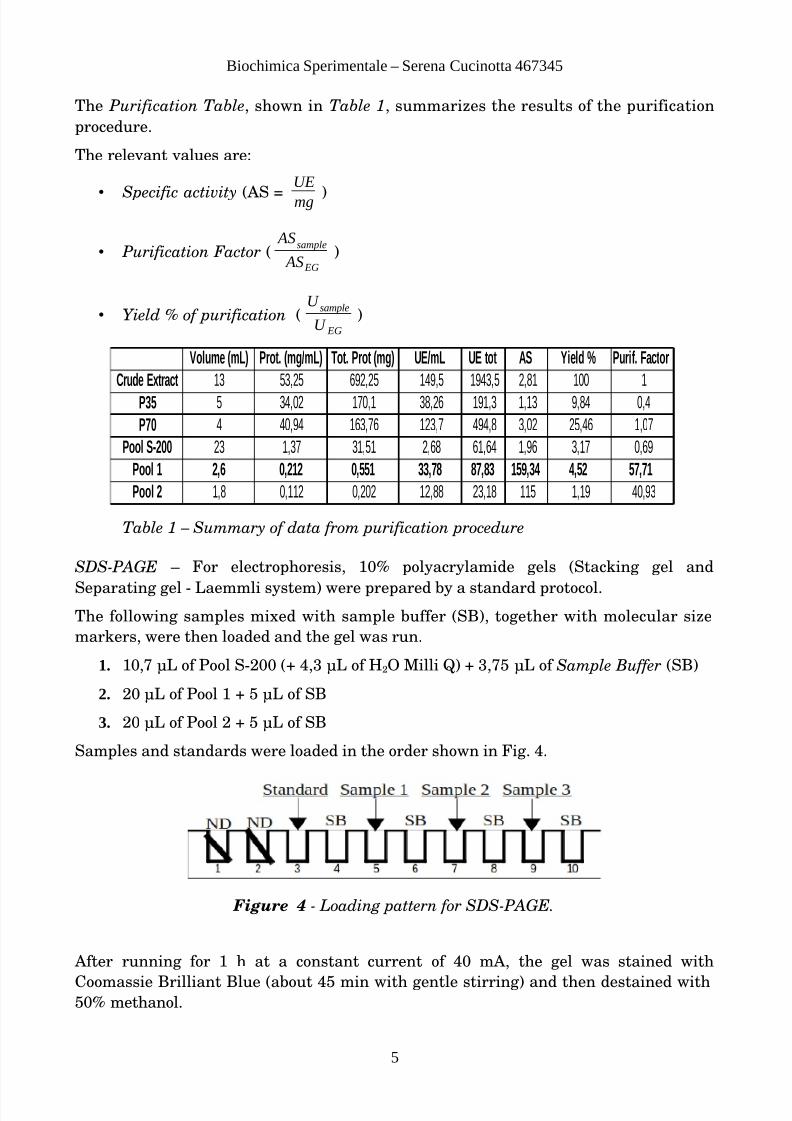
SDS-PAGE – For electrophoresis, 10% polyacrylamide gels (Stacking gel and
Separating gel - Laemmli system) were prepared by a standard protocol.
The following samples mixed with sample buffer (SB), together with molecular size
markers, were then loaded and the gel was run.
1. 10,7 μL of Pool S-200 (+ 4,3 μL of H2O Milli Q) + 3,75 μL of Sample Buffer (SB)
2. 20 μL of Pool 1 + 5 μL of SB
3. 20 μL of Pool 2 + 5 μL of SB
Samples and standards were loaded in the order shown in Fig. 4.
Figure 4 - Loading pattern for SDS-PAGE.
After running for 1 h at a constant current of 40 mA, the gel was stained with
Coomassie Brilliant Blue (about 45 min with gentle stirring) and then destained with50% methanol.
5
Volume (mL) Prot. (mg/mL) Tot. Prot (mg) UE/mL UE tot AS Yield % Purif. Factor
Crude Extract 13 53,25 692,25 149,5 1943,5 2,81 100 1
P35 5 34,02 170,1 38,26 191,3 1,13 9,84 0,4
P70 4 40,94 163,76 123,7 494,8 3,02 25,46 1,07
Pool S-200 23 1,37 31,51 2,68 61,64 1,96 3,17 0,69
Pool 1 2,6 0,212 0,551 33,78 87,83 159,34 4,52 57,71
Pool 2 1,8 0,112 0,202 12,88 23,18 115 1,19 40,93
7/28/2019 Purificazione e studio cinetico - Lattato deidrogenasi (LDH) da fegato di coniglio
http://slidepdf.com/reader/full/purificazione-e-studio-cinetico-lattato-deidrogenasi-ldh-da-fegato-di-coniglio 6/10
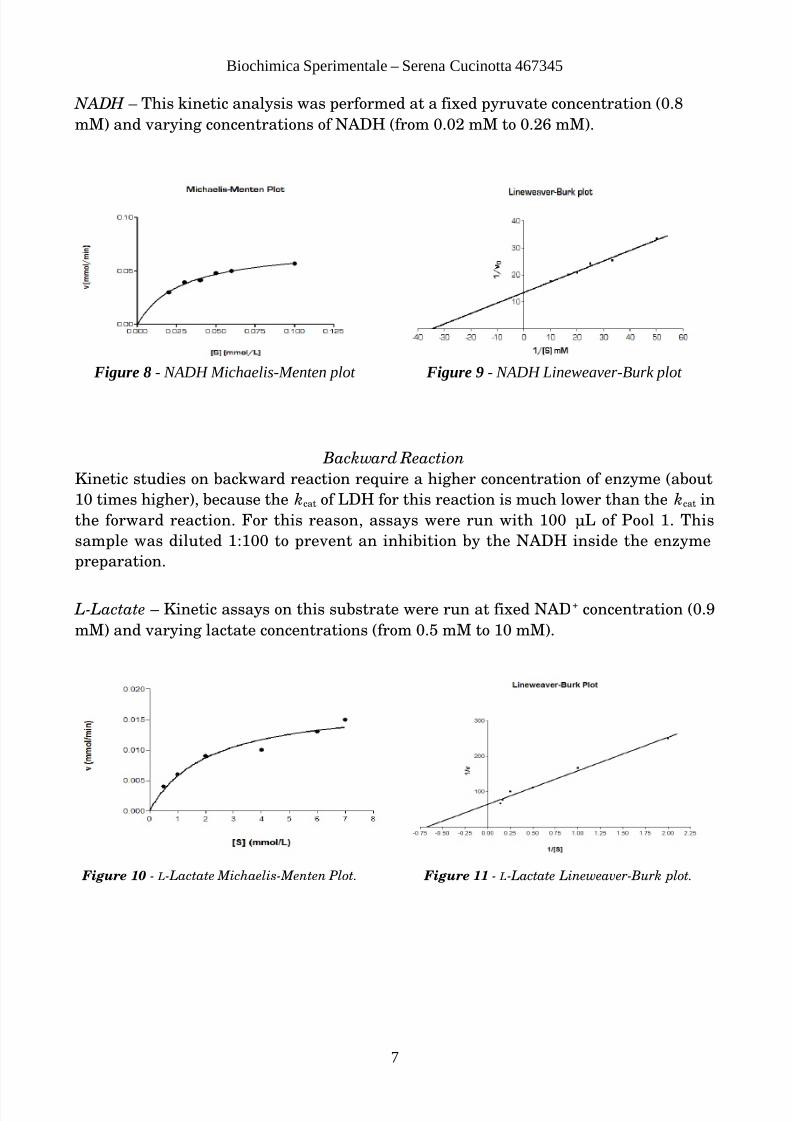
Figure 6 - Pyruvate Michaelis-Menten plot. Figure 7 - Pyruvate Lineweaver-Burk plot.
Biochimica Sperimentale – Serena Cucinotta 467345
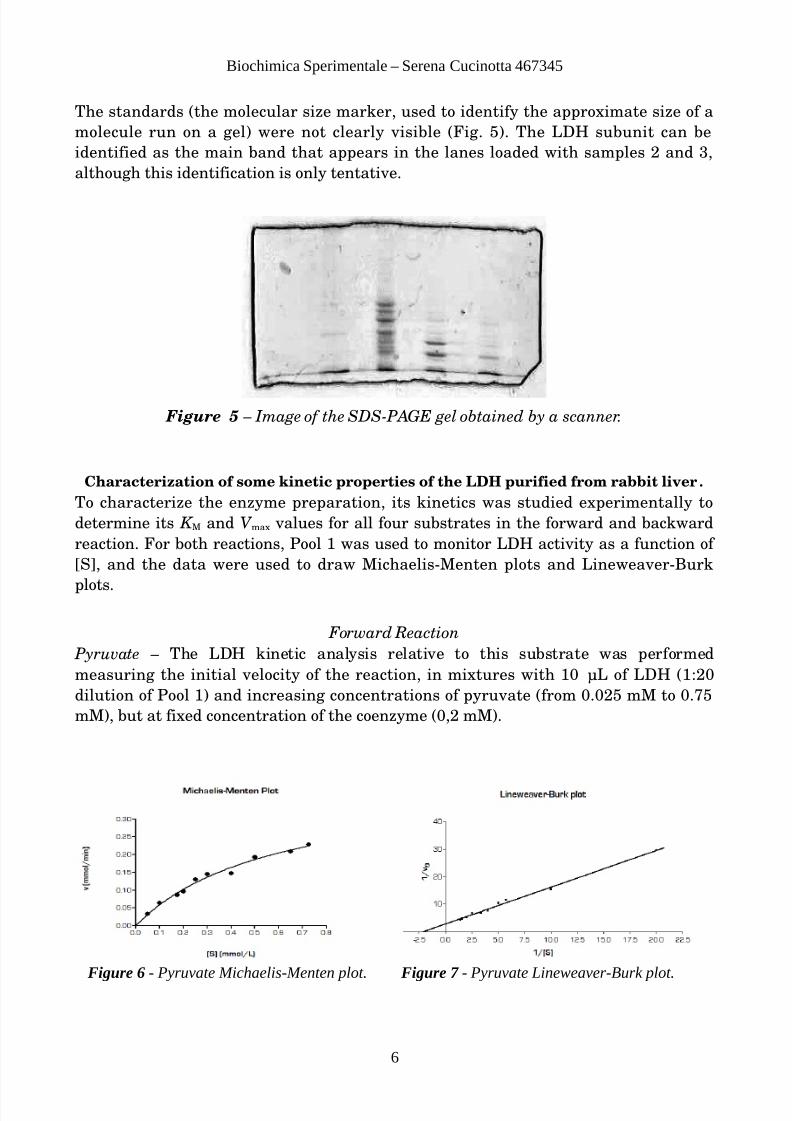
The standards (the molecular size marker, used to identify the approximate size of a
molecule run on a gel) were not clearly visible (Fig. 5). The LDH subunit can be
identified as the main band that appears in the lanes loaded with samples 2 and 3,
although this identification is only tentative.
Figure 5 – Image of the SDS-PAGE gel obtained by a scanner.
Characterization of some kinetic properties of the LDH purified from rabbit liver .
To characterize the enzyme preparation, its kinetics was studied experimentally to
determine its K M and V max values for all four substrates in the forward and backward
reaction. For both reactions, Pool 1 was used to monitor LDH activity as a function of
[S], and the data were used to draw Michaelis-Menten plots and Lineweaver-Burk
plots.
Forward Reaction
Pyruvate – The LDH kinetic analysis relative to this substrate was performed
measuring the initial velocity of the reaction, in mixtures with 10 µL of LDH (1:20
dilution of Pool 1) and increasing concentrations of pyruvate (from 0.025 mM to 0.75
mM), but at fixed concentration of the coenzyme (0,2 mM).
6
7/28/2019 Purificazione e studio cinetico - Lattato deidrogenasi (LDH) da fegato di coniglio
http://slidepdf.com/reader/full/purificazione-e-studio-cinetico-lattato-deidrogenasi-ldh-da-fegato-di-coniglio 7/10
Figure 8 - NADH Michaelis-Menten plot Figure 9 - NADH Lineweaver-Burk plot
Biochimica Sperimentale – Serena Cucinotta 467345
NADH – This kinetic analysis was performed at a fixed pyruvate concentration (0.8
mM) and varying concentrations of NADH (from 0.02 mM to 0.26 mM).
Backward Reaction
Kinetic studies on backward reaction require a higher concentration of enzyme (about
10 times higher), because the kcat of LDH for this reaction is much lower than the kcat in
the forward reaction. For this reason, assays were run with 100 µL of Pool 1. This
sample was diluted 1:100 to prevent an inhibition by the NADH inside the enzyme
preparation.
L-Lactate – Kinetic assays on this substrate were run at fixed NAD+ concentration (0.9
mM) and varying lactate concentrations (from 0.5 mM to 10 mM).
Figure 10 - L-Lactate Michaelis-Menten Plot. Figure 11 - L-Lactate Lineweaver-Burk plot.
7
7/28/2019 Purificazione e studio cinetico - Lattato deidrogenasi (LDH) da fegato di coniglio
http://slidepdf.com/reader/full/purificazione-e-studio-cinetico-lattato-deidrogenasi-ldh-da-fegato-di-coniglio 8/10
Biochimica Sperimentale – Serena Cucinotta 467345
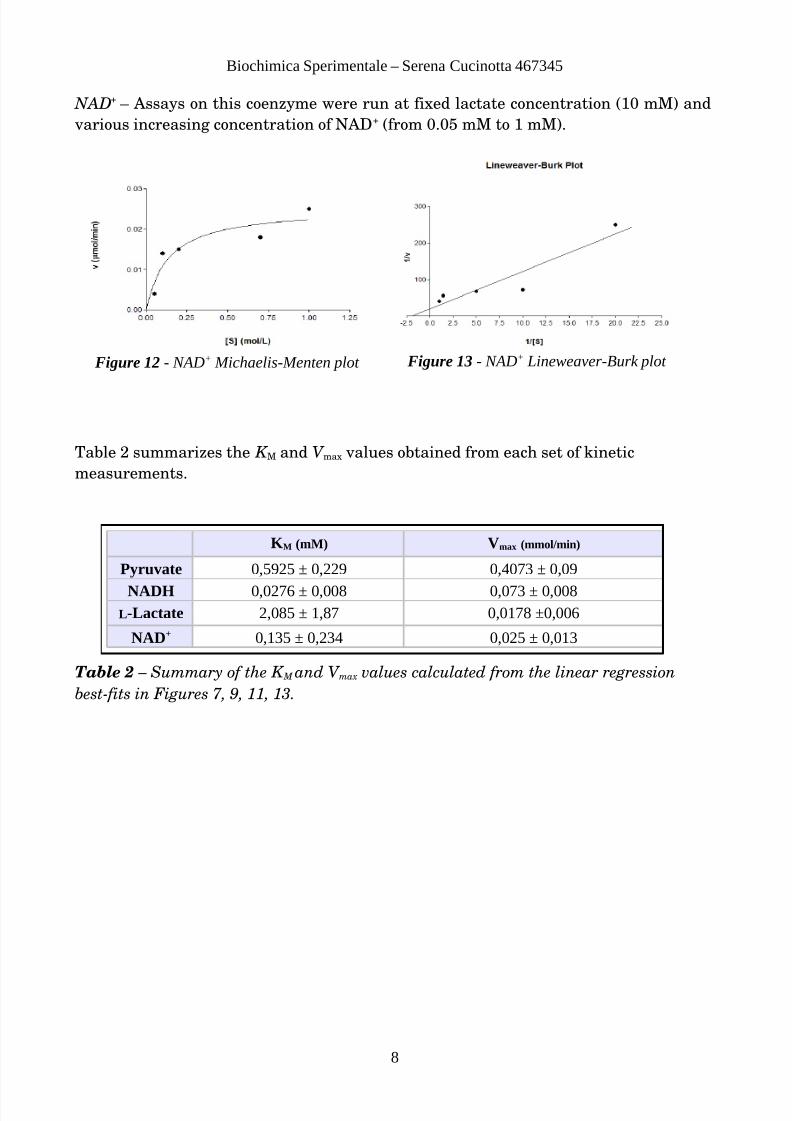
NAD+ – Assays on this coenzyme were run at fixed lactate concentration (10 mM) and
various increasing concentration of NAD+ (from 0.05 mM to 1 mM).
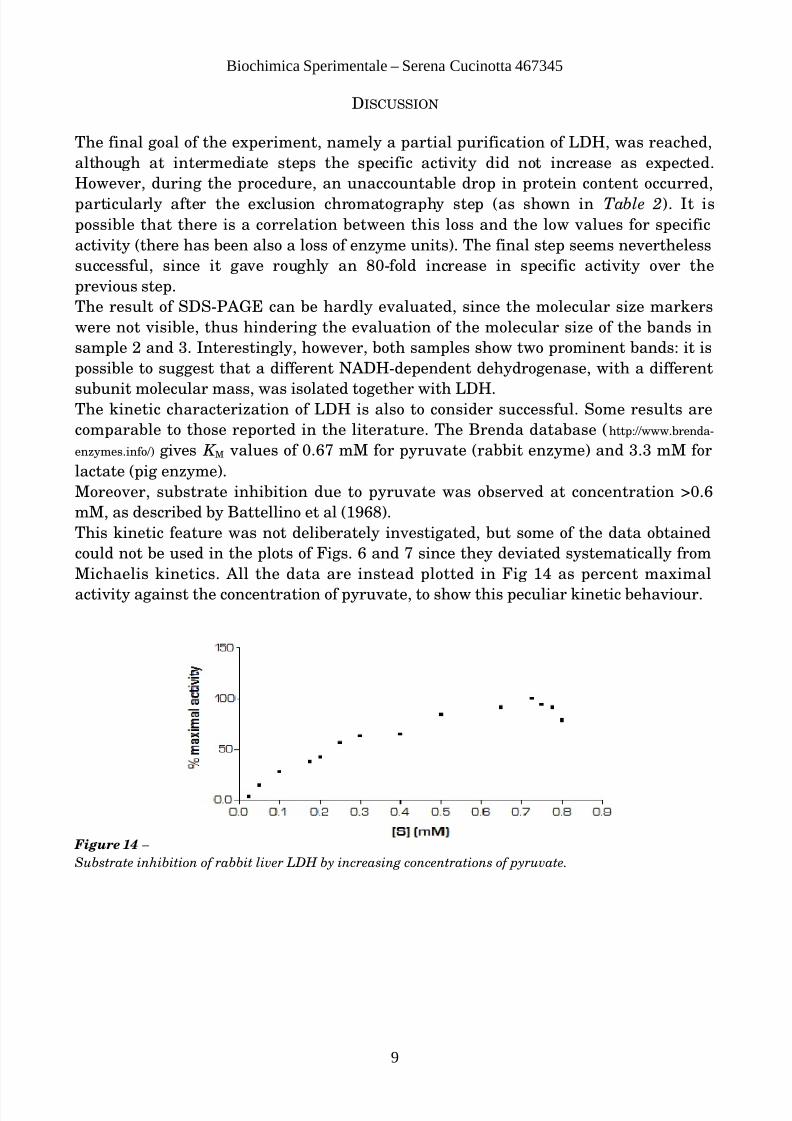
Table 2 summarizes the K M and V max values obtained from each set of kinetic
measurements.
Table 2 – Summary of the K M and V max values calculated from the linear regression
best-fits in Figures 7, 9, 11, 13.
8
Figure 12 - NAD+ Michaelis-Menten plot Figure 13 - NAD+ Lineweaver-Burk plot
KM (mM) Vmax (mmol/min)
Pyruvate 0,5925 ± 0,229 0,4073 ± 0,09
NADH 0,0276 ± 0,008 0,073 ± 0,008L-Lactate 2,085 ± 1,87 0,0178 ±0,006
NAD+ 0,135 ± 0,234 0,025 ± 0,013
7/28/2019 Purificazione e studio cinetico - Lattato deidrogenasi (LDH) da fegato di coniglio
http://slidepdf.com/reader/full/purificazione-e-studio-cinetico-lattato-deidrogenasi-ldh-da-fegato-di-coniglio 9/10
Biochimica Sperimentale – Serena Cucinotta 467345
DISCUSSION
The final goal of the experiment, namely a partial purification of LDH, was reached,
although at intermediate steps the specific activity did not increase as expected.
However, during the procedure, an unaccountable drop in protein content occurred,
particularly after the exclusion chromatography step (as shown in Table 2). It is
possible that there is a correlation between this loss and the low values for specific
activity (there has been also a loss of enzyme units). The final step seems nevertheless
successful, since it gave roughly an 80-fold increase in specific activity over the
previous step.
The result of SDS-PAGE can be hardly evaluated, since the molecular size markers
were not visible, thus hindering the evaluation of the molecular size of the bands in
sample 2 and 3. Interestingly, however, both samples show two prominent bands: it is
possible to suggest that a different NADH-dependent dehydrogenase, with a different
subunit molecular mass, was isolated together with LDH.The kinetic characterization of LDH is also to consider successful. Some results are
comparable to those reported in the literature. The Brenda database (http://www.brenda-
enzymes.info/) gives K M values of 0.67 mM for pyruvate (rabbit enzyme) and 3.3 mM for
lactate (pig enzyme).
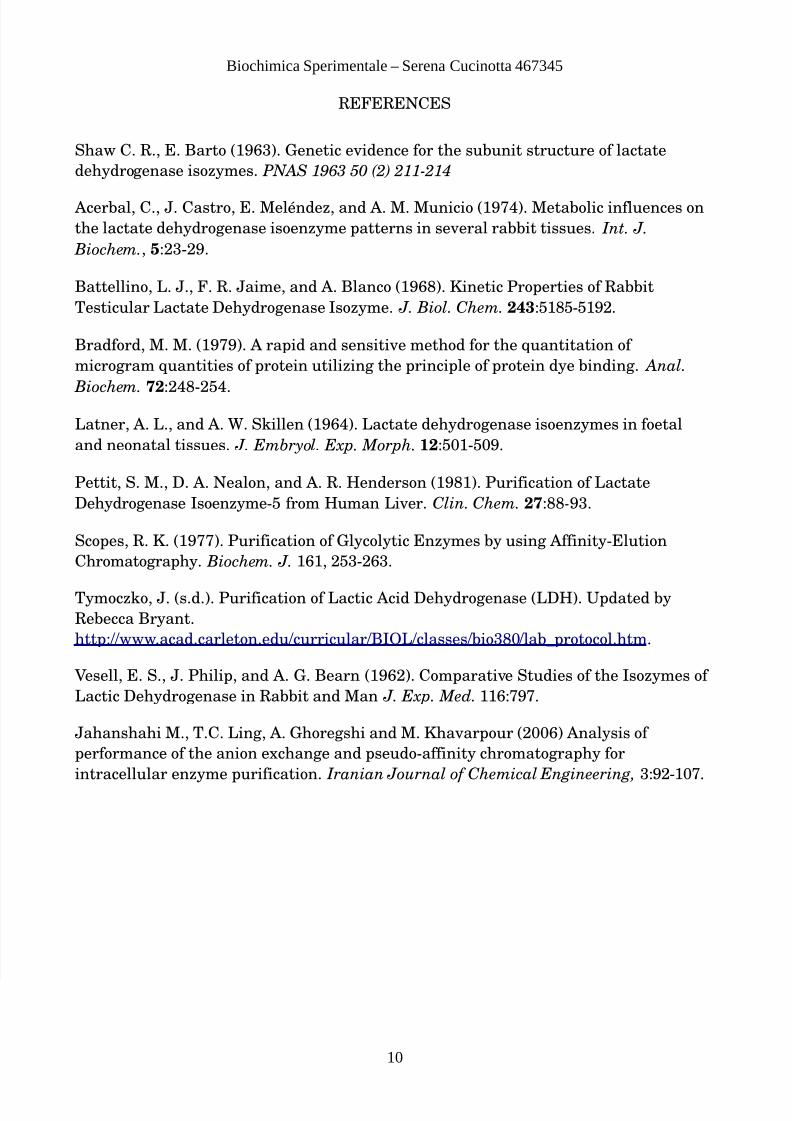
Moreover, substrate inhibition due to pyruvate was observed at concentration >0.6
mM, as described by Battellino et al (1968).
This kinetic feature was not deliberately investigated, but some of the data obtained
could not be used in the plots of Figs. 6 and 7 since they deviated systematically from
Michaelis kinetics. All the data are instead plotted in Fig 14 as percent maximal
activity against the concentration of pyruvate, to show this peculiar kinetic behaviour.
Figure 14 –
Substrate inhibition of rabbit liver LDH by increasing concentrations of pyruvate.
9
7/28/2019 Purificazione e studio cinetico - Lattato deidrogenasi (LDH) da fegato di coniglio
http://slidepdf.com/reader/full/purificazione-e-studio-cinetico-lattato-deidrogenasi-ldh-da-fegato-di-coniglio 10/10
Biochimica Sperimentale – Serena Cucinotta 467345
REFERENCES
Shaw C. R., E. Barto (1963). Genetic evidence for the subunit structure of lactate
dehydrogenase isozymes. PNAS 1963 50 (2) 211-214
Acerbal, C., J. Castro, E. Meléndez, and A. M. Municio (1974). Metabolic influences on
the lactate dehydrogenase isoenzyme patterns in several rabbit tissues. Int. J.
Biochem., 5:23-29.
Battellino, L. J., F. R. Jaime, and A. Blanco (1968). Kinetic Properties of Rabbit
Testicular Lactate Dehydrogenase Isozyme. J. Biol. Chem. 243:5185-5192.
Bradford, M. M. (1979). A rapid and sensitive method for the quantitation of
microgram quantities of protein utilizing the principle of protein dye binding. Anal.
Biochem. 72:248-254.
Latner, A. L., and A. W. Skillen (1964). Lactate dehydrogenase isoenzymes in foetal
and neonatal tissues. J. Embryol. Exp. Morph. 12:501-509.
Pettit, S. M., D. A. Nealon, and A. R. Henderson (1981). Purification of Lactate
Dehydrogenase Isoenzyme-5 from Human Liver. Clin. Chem. 27:88-93.
Scopes, R. K. (1977). Purification of Glycolytic Enzymes by using Affinity-Elution
Chromatography. Biochem. J. 161, 253-263.
Tymoczko, J. (s.d.). Purification of Lactic Acid Dehydrogenase (LDH). Updated by
Rebecca Bryant.
http://www.acad.carleton.edu/curricular/BIOL/classes/bio380/lab_protocol.htm.
Vesell, E. S., J. Philip, and A. G. Bearn (1962). Comparative Studies of the Isozymes of
Lactic Dehydrogenase in Rabbit and Man J. Exp. Med. 116:797.
Jahanshahi M., T.C. Ling, A. Ghoregshi and M. Khavarpour (2006) Analysis of
performance of the anion exchange and pseudo-affinity chromatography for
intracellular enzyme purification. Iranian Journal of Chemical Engineering, 3:92-107.
10