Embed Size (px)
Citation preview
Int.J.Curr.Microbiol.App.Sci (2015) 4(7): 367-375
367
Original Research Article
Purification and Evaluation of Horseradish Peroxidase Activity
D. Sarika, P.S.S. Ashwin Kumar, Shaik Arshad and M. K. Sukumaran*
Department of Biochemistry, Bhavan s Vivekananda College, Secunderabad-500094, Telangana, India
*Corresponding author
A B S T R A C T
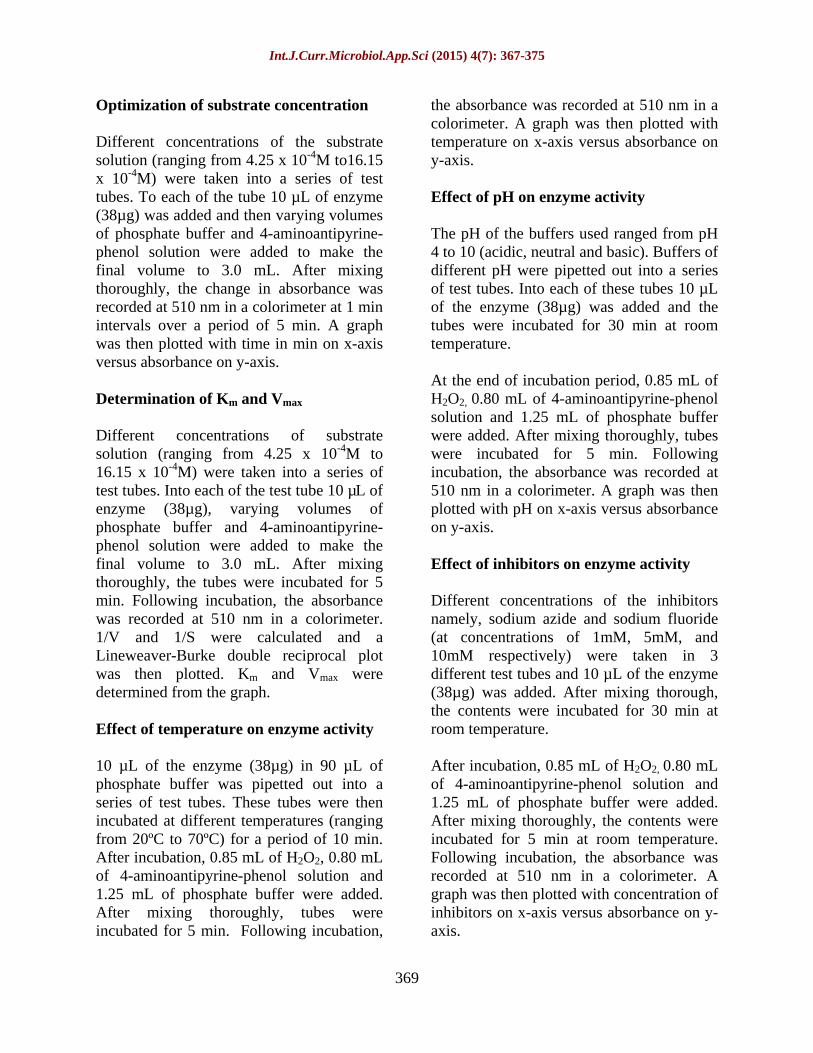
Introduction
Peroxidases (E.C. 1.11.1.7) are widely distributed in nature (plants, micro-organisms and animals). Their main function is to catalyze the reduction of hydrogen peroxide (H2O2- a common end product of oxidative metabolism) to water, rendering it harmless. H2O2 is a strong oxidizing agent; it can be toxic if allowed to accumulate. Thus, peroxidases play a major role in removing excess H2O2 in cells under normal and stress conditions. Horseradish (Armoracia rusticana) is widely used plants and has thick pulpy yellow roots, spicy taste and antibiotic and anti-inflammatory ability. Peroxidases are versatile biocatalyst with an ever increasing number of applications
At present the roots of horseradish serves as the major source of commercially available peroxidase, however, investigations are being carried out for new peroxidases with higher stability and properties that can be exploited for different biotechnological, biomedical and other application. E.g. spring cabbage peroxidase was suggested as a potential tool in biocatalysis and bioelectrocatalysis (Anna et al., 2007). HRP has allowed the standardization of non-radioactive detection of nucleic acids and proteins. Use of HRP has become common in medical research, including neuroanatomy. HRP was recently found to bind to the terminal end of neurons.
ISSN: 2319-7706 Volume 4 Number 7 (2015) pp. 367-375 http://www.ijcmas.com
In this study peroxide was purified from roots of horseradish employing Concanavalin A agarose affinity chromatography. 4-aminoantipyrine-phenol solution was used as substrate to evaluate the enzymatic activity, effect of pH, temperature and inhibitors on enzyme activity. The purified enzyme (HRP) showed an effective activity at an enzyme concentration of 38 x 10-2µg and substrate concentration at 14.45 x 10⁻⁴M. The pH optimum and temperature optimum was found out to be 6.0 and 40ºC respectively. Purified HRP moved as a single band on Native PAGE with a molecular weight of 40Kda. Activity staining indicated that the purified protein was HRP.
K e y w o r d s
Horseradish peroxidase, Concanavalin A agarose affinity chromatography, 4-Aminoantipyrine, Phenol, Activity staining

Int.J.Curr.Microbiol.App.Sci (2015) 4(7): 367-375
368
Materials and Methods
1. Enzyme purification was carried out by the method described in Concanavalin A agarose affinity chromatography (Con A affinity chromatography) kit HIMEDIA laboratories, Mumbai, India.
2. 0.2M Potassium phosphate buffer pH 7.0: 5.44g of potassium dihydrogen phosphate was dissolved in 200 mL of distilled water. To this potassium hydroxide solution (1.682g dissolved in 30 mL distilled water) was added gradually to adjust the pH of the solution to 7.0.
3. 0.0017M Hydrogen peroxide: H2O2
solution was prepared by diluting 1 mL of commercially available 30% H2O2 to 100 mL with distilled water. 1 mL of the 0.0017M H2O2 solution was further diluted to 50 mL with 0.2M potassium phosphate buffer pH 7.0 just before use.
4. 0.0025M 4-Aminoantipyrine - 0.17M Phenol: 810mg of phenol was dissolved in 40 mL of distilled water and then 25mg 4-aminoantipyrine was added to it. After dissolving completely the volume was made to 50 mL with distilled water in a standard flask.
Protein estimation by Lowry method
Protein concentration in both crude and Concanavalin A agarose affinity purified samples were determined in triplicate by the method of Lowry et al. (1951) using bovine serum albumin as a standard.
Enzyme activity
The enzyme activity was carried out by the method described in Concanavalin A agarose affinity chromatography kit, Himedia laboratories, Mumbai, India with slight modifications. The substrate used was hydrogen peroxide (H2O2)/phenol/4-aminoantipyrine solution (Bärbel Porstmann, 1981). H2O2 rapidly reacts with 4-aminoantipyrine-phenol solution in the presence of peroxide to produce a quinoneimine chromogen (http://www. amano-enzyme.co.jp/) which shows intense pink colour with a maximum absorbance at 510 nm. Aminoantipyrine and phenol were used at concentrations of 0.0025M and 0.17M respectively. In this method the amount of quinoneimine formed was influenced by the amount of peroxidase present.
Optimization of enzyme concentration
Different aliquots of the enzyme (concentrations ranging from 5.7 to 3.8 x 10-
2mM) were taken into a series of test tubes. After making up the volume to 0.1 mL with phosphate buffer, 0.75 mL of H2O2, 0.7 mL of 4-aminoantipyrine-phenol solution and 1.45 mL of phosphate buffer were added. After mixing thoroughly, the change in absorbance was recorded at 510 nm in a colorimeter at 1 min intervals over a period of 5 min. A graph was then plotted with time in min on x-axis versus absorbance on y-axis.
Int.J.Curr.Microbiol.App.Sci (2015) 4(7): 367-375
369
Optimization of substrate concentration
Different concentrations of the substrate solution (ranging from 4.25 x 10⁻⁴M to16.15 x 10-4M) were taken into a series of test tubes. To each of the tube 10 µL of enzyme (38µg) was added and then varying volumes of phosphate buffer and 4-aminoantipyrine-phenol solution were added to make the final volume to 3.0 mL. After mixing thoroughly, the change in absorbance was recorded at 510 nm in a colorimeter at 1 min intervals over a period of 5 min. A graph was then plotted with time in min on x-axis versus absorbance on y-axis.
Determination of Km and Vmax
Different concentrations of substrate solution (ranging from 4.25 x 10⁻⁴M to 16.15 x 10⁻⁴M) were taken into a series of test tubes. Into each of the test tube 10 µL of enzyme (38µg), varying volumes of phosphate buffer and 4-aminoantipyrine-phenol solution were added to make the final volume to 3.0 mL. After mixing thoroughly, the tubes were incubated for 5 min. Following incubation, the absorbance was recorded at 510 nm in a colorimeter. 1/V and 1/S were calculated and a Lineweaver-Burke double reciprocal plot was then plotted. Km and Vmax were determined from the graph.
Effect of temperature on enzyme activity
10 µL of the enzyme (38µg) in 90 µL of phosphate buffer was pipetted out into a series of test tubes. These tubes were then incubated at different temperatures (ranging from 20ºC to 70ºC) for a period of 10 min. After incubation, 0.85 mL of H2O2, 0.80 mL of 4-aminoantipyrine-phenol solution and 1.25 mL of phosphate buffer were added. After mixing thoroughly, tubes were incubated for 5 min. Following incubation,
the absorbance was recorded at 510 nm in a colorimeter. A graph was then plotted with temperature on x-axis versus absorbance on y-axis.
Effect of pH on enzyme activity
The pH of the buffers used ranged from pH 4 to 10 (acidic, neutral and basic). Buffers of different pH were pipetted out into a series of test tubes. Into each of these tubes 10 µL of the enzyme (38µg) was added and the tubes were incubated for 30 min at room temperature.
At the end of incubation period, 0.85 mL of H2O2, 0.80 mL of 4-aminoantipyrine-phenol solution and 1.25 mL of phosphate buffer were added. After mixing thoroughly, tubes were incubated for 5 min. Following incubation, the absorbance was recorded at 510 nm in a colorimeter. A graph was then plotted with pH on x-axis versus absorbance on y-axis.
Effect of inhibitors on enzyme activity
Different concentrations of the inhibitors namely, sodium azide and sodium fluoride (at concentrations of 1mM, 5mM, and 10mM respectively) were taken in 3 different test tubes and 10 µL of the enzyme (38µg) was added. After mixing thorough, the contents were incubated for 30 min at room temperature.
After incubation, 0.85 mL of H2O2, 0.80 mL of 4-aminoantipyrine-phenol solution and 1.25 mL of phosphate buffer were added. After mixing thoroughly, the contents were incubated for 5 min at room temperature. Following incubation, the absorbance was recorded at 510 nm in a colorimeter. A graph was then plotted with concentration of inhibitors on x-axis versus absorbance on y-axis.
Int.J.Curr.Microbiol.App.Sci (2015) 4(7): 367-375
370
Sodium Dodecyl Sulphate - Polyacrylamide Gel Electrophoresis
Protein from Con A affinity purified sample were analyzed by denaturating SDS-PAGE essentially as described by Laemmli (Laemmli, U.K. 1970). Slab gels consisting of 10-12% separating and 4-6% stacking gels were generally used.
Con A purified sample was diluted with equal volume of sample buffer and boiled for 10 min. 30-40 µL of the sample was loaded in well. The sample was electrophoresed at 100V along with standard protein markers that have been treated similarly. After completion of electrophoresis, the gel was subjected to Coomassie Brilliant Blue R 250 staining.
For determining the molecular weight of the protein, Rf values of the standard marker proteins and Con A affinity purified HRP were measured and a semi logarithmic graph was plotted with the Rf values of standard marker proteins on the cm scale (x-axis) and molecular weights on the log scale (y-axis). From the graph, the relative molecular weight of Con A agarose purified HRP was determined.
Activity staining
Protein from Con A affinity purified sample was analyzed by activity staining. Slab gel consisting of 10% separating and 4-6% stacking gels were generally used. The Con A purified sample was diluted with equal volume of sample buffer. 30-40 µL of the Con A affinity purified HRP sample was loaded into the well. Sample was electrophoresed at 100V. After completion of electrophoresis, the gel was agitated in substrate solution (DAB system) till band developed.
Results and Discussion
Con A affinity chromatography
The enzyme HRP is a glycoprotein this property was exploited in its purification employing Con A agarose affinity column, since Con A binds to different sugar moieties.
Protein estimation by Lowry method
The concentration of protein in both the crude sample and the Con A agarose purified sample was estimated by Lowry s method. The concentration of protein in the crude and Con A agarose purified samples were found out to be 6.4mg/mL and 3.8mg/mL respectively. This indicated that 50% of the crude HRP sample contained the enzyme HRP.
Enzyme activity
Using 4-aminoantipyrine system the activity of the enzyme in the crude and Con A agarose affinity sample were determined as described in the methodology section. The enzyme activity in the crude sample was found out to be 1.06moles/min and that for Con A agarose affinity purified HRP to be 3.37moles/min.
Calculations:
Enzyme activity (moles/min) = (A/min)/ (6.58 x path length) A/min = Absorbance at 510 nm per min 6.58 = Absorption coefficient of the chromogen product
Therefore, activity in crude sample = (0.35/5) / (6.58 x 1) = 1.06moles/min
Activity in purified sample = (1.11/5) / (6.58 x 1)

Int.J.Curr.Microbiol.App.Sci (2015) 4(7): 367-375
371
=3.37moles/min
Specific activity = Enzyme activity / mg of protein Therefore, Specific activity in crude sample = 1.06/6.4 = 0.165 Specific activity in purified sample = 3.37/3.8 = 0.88 Fold purification = Specific activity in purified sample / Specific activity in crude sample = 0.88/0.165 = 5.33
Optimization of enzyme concentration
The enzymatic activity was determined at different concentrations of enzyme with a fixed substrate concentration at a time interval of 1 min over a total period of 5 min. Result is presented in figure 1. As evident from figure 1, lower concentrations of the enzyme (5.7 x 10⁻² to 34.2 x 10⁻²µg) showed a sub-optimal increase in the activity for about 2 min and no significant increase in activity was observed after 2 min interval. However, enzyme at a concentration of 38 x 10-2µg showed a linear increase in activity at each of the time intervals at which the enzyme activity was measured. Since the enzyme activity obtained with 38 x 10-2µg of the enzyme showed a linear increase over the other concentrations evaluated (Figure 1) further studies were planned with enzyme concentration 38 x 10-2 µg enzyme.
Optimization of substrate concentration
Effect of substrate concentration on Con A purified HRP is presented in figure 2. Lower substrate concentrations (4.25 x 10⁻⁴M to 12.75 x 10⁻⁴M) showed a gradual increase in the activity which seems to be sub-optimal. However, at substrate concentration (16.15 x 10⁻⁴M) there was a gradual increase in the enzyme activity over a 2 min interval following which there was a steep rise in the
activity. Substrate at a concentration of 14.45 x 10⁻⁴M (38 g) showed a linear increase in activity at each of the time intervals at which the enzyme activity was measured. Since the enzyme activity obtained with 14.45 x 10⁻⁴M of the substrate showed a linear increase over the other concentrations evaluated (Figure 2) further studies were planned with substrate concentration of 14.45 x 10⁻⁴M.
Determination of Km andVmax
The kinetic constants Km and Vmax for the enzyme activity were determined at varying substrate concentrations. Using Lineweaver Burke plot (Figure 3), the Km was found to
be 7.14 mM and Vmax was found to be 0.1mole/min respectively.
Calculations
From the graph, 1/Vmax = 10 Vmax= 1/10 = 0.1mole/min -1/Km = -0.14x10³
Km = 1/0.14x103
= 7.14x10-3
= 7.14mM Therefore Vmax = 0.1mole/min and Km = 7.14mM
Effect of temperature on enzyme activity
Figure 5 demonstrates the temperature profiles of Con A purified HRP. As evident from the figure a typical bell shaped curve was obtained. The enzyme activity gradually increased up to a temperature of 40ºC and then declined thereafter. This clearly suggests that the temperature optima for Con A purified HRP was 40ºC which is in accordance with the earlier data reported (F. Ghaemmaghami et al., 2010; ILA Bania, 2012; http://www.amano-enzyme.co.jp).

Int.J.Curr.Microbiol.App.Sci (2015) 4(7): 367-375
372

Int.J.Curr.Microbiol.App.Sci (2015) 4(7): 367-375
373

Int.J.Curr.Microbiol.App.Sci (2015) 4(7): 367-375
374
Figure.7 SDS-PAGE Analysis of Con A Purified HRP
Figure.8 Activity stainingof Con A Purified HRP
Effect of pH on enzyme activity
Figure 6 demonstrates the pH profiles of Con A purified HRP. It was observed that there is an increase in the enzyme activity from pH 4 to 6 followed by a decline in activity up to pH 10. This indicates the optimal pH for the enzyme is 6 which is in accordance with the earlier data reported (Ghaemmaghami et al., 2010; ILA Bania, 2012; http://www.amano-enzyme.co.jp).
Effect of inhibitors on enzymatic activity
Effect of inhibitors on Con A purified HRP is presented figure 6. Both the inhibitors showed a dose dependent inhibition on enzyme activity. However, azide proved to be more potent inhibitor than sodium fluoride (ILA Bania, 2012; http://www.amano-enzyme.co.jp) Native
PAGE Analysis of Con A agarose purified HRP.
The purity of the enzyme was confirmed by the appearance of single band on the gel. The relative molecular weight of Con A agarose purified HRP was found out to be 40 KDa (Figure 7) http://www.amano-enzyme.co.jp;) Shahanzkatun and his colleagues have purified HRP from horse radish. Native PAGE was carried out to determine the molecular weight of purified HRP. Molecular weight determined by these workers was found out to be 43KDa, (Shahanaz Khatun et al., 2012).
Activity staining
Activity stained gel is shown in figure 8, Con A purified HRP reacted with the substrate/chromogen system producing a coloured band indicating that the purified protein was HRP.
The enzyme, Horse Radish Peroxidase was purified on Con A agarose column using a

Int.J.Curr.Microbiol.App.Sci (2015) 4(7): 367-375
375
free sugar (fructose). The purified enzyme (HRP) showed an effective activity at an enzyme concentration of 38 x 10-2 µg and substrate concentration at 14.45 x 10⁻⁴M. The enzyme showed a pH optimum at 6.0 and temperature optimum at 40 ºC. The kinetic constants Km and Vmax for the enzyme were determined using Lineweaver
Burke plot and the Km was found to be 7.14 mM and Vmax was found to be 0.1mole/min respectively. The enzyme was competitively inhibited by sodium Azide more effectively than sodium fluoride. The purity and the relative molecular weight of the enzyme were determined on SDS-PAGE and the molecular weight of HRP was found out to be 40,000 Da. Activity staining indicated that the purified protein was HRP. All these conclusions are in accordance with the earlier reported values (http://www. amano-enzyme.co.jp).
Acknowledgement
The authors are thankful to Prof. Y. Ashok, Principal, Bhavan s Vivekananda College and Dr. A. Sai Padma HOD Dept of Biochemistry, Bhavan s Vivekananda College for providing necessary facilities to carry out the project.
References
Anna Belcarz, GrazynaGinalska, Barbara Kowalewska, PawelKulesza, 2007. Spring cabbage peroxidases
Potential tool in biocatalysis and bioelectro-catalysis. Phytochemistry xxx (2007) xxx xxx.
Bärbel Porstmann, 1981. Comparison of chromogens for the determination of horseradish peroxidase as a marker in enzyme immunoassay. J. Clin. Chem. Clin. Biochem., 19: 435 439.
Colonna, S., Gaggero, N., Richelmic, P.P. 1999. Recent biotechnological
developments in the use of peroxidases. Trends Biotechnol., 17: 163 168.
Ghaemmaghami, F., Alemzadeh, I., Motamed, S. 2010. Iran. J. Chem. Eng., 7(2) (Spring).
http://www.amano-enzyme.co.jp ILA Bania, 2012. Rita Mahanta Int. J. Sci.
Res. Publ., 2(5). www.ijsrp.org, Evaluation of peroxidases from various plant sources.
Laemmli, U.K. 1970. Cleavage of structural proteins during the assembly of the head of bacteriophage T4. Nature, 227: 680 685.
Lowry, O.H., Rosebrough, N.J., Farr, A.L., Randal, R.L. 1951. Protein measurement with the Folin phenol reagent. J. Biol. Chem., 193: 265275.
Shahanaz Khatun, Md. Ashraduzzaman, Md. Rezual Karim, Farzana Pervin, Nurul Absar, Ahmad Rosma, 2012. Purification and characterization of peroxidase from Moringa Olifera L. leaves. Bioresource, 7(3): 32373251, 3237.
Veitch, N.C. 2004. Horseradish peroxidase: a modern view of a classic enzyme. Phytochemistry, 65: 249 259.
www.elsevier.com/locate/phytochem