Embed Size (px)
Citation preview
TSX ǀ RVD
Pure Play Brazilian Fertilizer Company Investor Presentation | November 2012
- 2 -
TSX ǀ RVD Forward-Looking Statements Except for historical information contained in this presentation relating to Rio Verde Minerals Development Corp., certain disclosure statements and information contained herein constitute forward-looking statements. Forward-looking statements include, but are not limited to, statements concerning exploration, exploration results, requirements for additional capital, and possible outcome of pending and future regulatory applications and other statements which are not historical facts. When used in this document, the words such as “could,” “plan,” “estimate,” “expect,” “intend,” “may,” “potential,” “should,” and similar expressions are forward-looking statements. Although the Company believes that its expectations reflected in these forward-looking statements are reasonable, such statements involve risks and uncertainties and no assurance can be given that actual results will be consistent with these forward-looking statements. Important factors that could cause actual results to differ from these forward-looking statements include risks related to failure to define mineral resources, to convert estimated mineral resources to reserves, the grade and recovery of ore which is mined varying from estimates, future potash and phosphate prices, capital and operating costs varying significantly from estimates, political risks arising from operating in Brazil, uncertainties relating to the availability and costs and availability of financing needed in the future, changes in equity markets, inflation, changes in exchange rates, fluctuations in commodity prices, delays in the development of projects, conclusions of economic evaluations, changes in project parameters as plans continue to be refined, uninsured risks and other risks involved in the mineral exploration and development industry. Although the Company has attempted to identify important factors that could cause actual actions, events or results to differ materially from those described in forward-looking statements, there may be other factors that cause actions, events or results not to be as anticipated, estimated or intended. There can be no assurance that forward-looking statements will prove to be accurate, as actual results and future events could differ materially from those anticipated in such statements. Accordingly, readers should not place undue reliance on forward-looking statements. These forward-looking statements are made as of the date hereof and the Company makes no responsibility to update them or to revise them to reflect new events or circumstances, except as required by law.

- 3 -
TSX ǀ RVD Key Investment Highlights
Only Fertilizers, Only Brazil
• Poised to capitalize on Brazil’s unique agriculture supply and demand dynamics
• Targeting known mineralization in Brazil, on or near infrastructure
• Blended asset portfolio of potash & phosphate properties
• Multiple shots on target, multiple value drivers
• Fast-tracking to development—targeting potash resource and scoping studies in 2013
• Production planned Q1 2013 at the Bonito Phosphate Project (previously the Fosfatar
Phosphate Project)*
* PEA was prepared by Coffey Mining Pty Ltd, an international consultant with offices in Brazil. For more information, see the March 1, 2012, press release, “Rio Verde Minerals Releases Positive Preliminary Economic Assessment for its Fosfatar Phosphate Project,” filed on www.sedar.com.
- 4 -
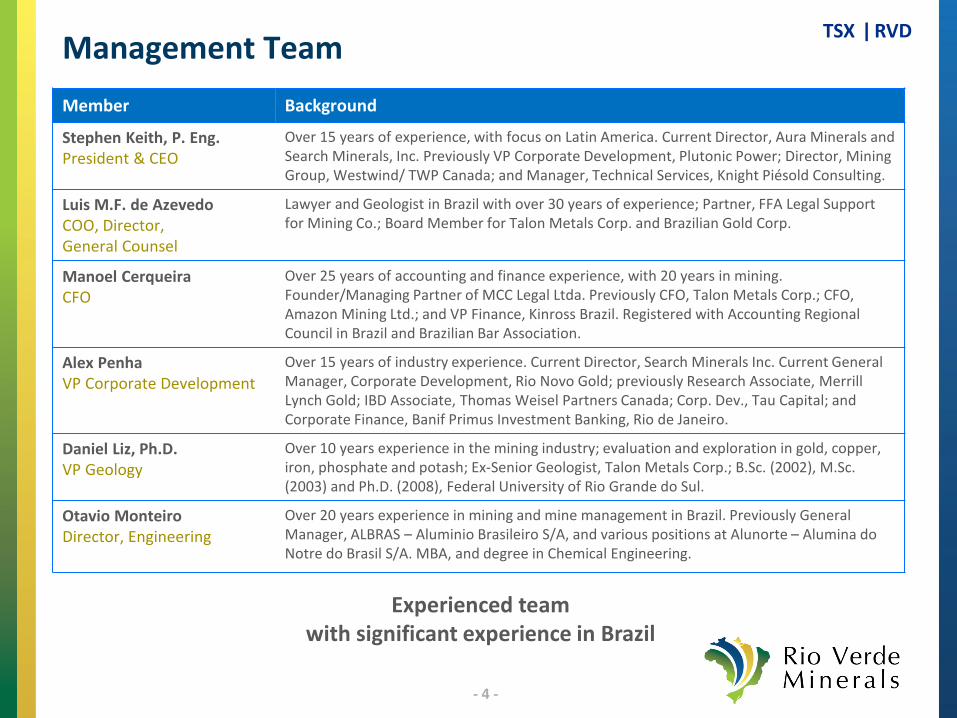
TSX ǀ RVD Management Team Member Background
Stephen Keith, P. Eng. President & CEO
Over 15 years of experience, with focus on Latin America. Current Director, Aura Minerals and Search Minerals, Inc. Previously VP Corporate Development, Plutonic Power; Director, Mining Group, Westwind/ TWP Canada; and Manager, Technical Services, Knight Piésold Consulting.
Luis M.F. de Azevedo COO, Director, General Counsel
Lawyer and Geologist in Brazil with over 30 years of experience; Partner, FFA Legal Support for Mining Co.; Board Member for Talon Metals Corp. and Brazilian Gold Corp.
Manoel Cerqueira CFO
Over 25 years of accounting and finance experience, with 20 years in mining. Founder/Managing Partner of MCC Legal Ltda. Previously CFO, Talon Metals Corp.; CFO, Amazon Mining Ltd.; and VP Finance, Kinross Brazil. Registered with Accounting Regional Council in Brazil and Brazilian Bar Association.
Alex Penha VP Corporate Development
Over 15 years of industry experience. Current Director, Search Minerals Inc. Current General Manager, Corporate Development, Rio Novo Gold; previously Research Associate, Merrill Lynch Gold; IBD Associate, Thomas Weisel Partners Canada; Corp. Dev., Tau Capital; and Corporate Finance, Banif Primus Investment Banking, Rio de Janeiro.
Daniel Liz, Ph.D. VP Geology
Over 10 years experience in the mining industry; evaluation and exploration in gold, copper, iron, phosphate and potash; Ex-Senior Geologist, Talon Metals Corp.; B.Sc. (2002), M.Sc. (2003) and Ph.D. (2008), Federal University of Rio Grande do Sul.
Otavio Monteiro Director, Engineering
Over 20 years experience in mining and mine management in Brazil. Previously General Manager, ALBRAS – Aluminio Brasileiro S/A, and various positions at Alunorte – Alumina do Notre do Brasil S/A. MBA, and degree in Chemical Engineering.
Experienced team with significant experience in Brazil

- 5 -
TSX ǀ RVD Board of Directors Member Background
David M. Beatty Chairman
Over 25 years of experience in mining M&A and finance; current CEO, Rio Novo Gold Inc.; Co-Founder, investment bank Westwind Partners Inc., sold to Thomas Weisel Partners Canada; previous Head, Mining & Minerals, First Marathon Securities (now NB Financial) and Gordon Capital Corporation; Co-Founder, Yamana Gold Inc. with Vic Bradley; past TSX/OSC Mining Standards Task Force Member.
Victor H. Bradley Director
Chartered Accountant with over 45 years of experience in the international mining sector; current Chairman and Director, Osisko Mining; Founder, CEO, Director, Chairman and Lead Director, Yamana Gold Inc.
John Van Brunt Director
Over 40 years of experience in international fertilizer sector; past President and CEO, Cominco Fertilizers Inc. (now Agrium Inc.); past President, International Fertilizer Industry Association (IFA); past Director and Chairman, Canadian Fertilizer Institute (CFI), Potash/Phosphate Institute (IPNI), Foundation for Agronomic Research (FAR), The Fertilizer Institute (TFI) and Canpotex Ltd.
Eduardo Ledsham Director
Over 28 years of experience in mineral exploration project development and in implementation of greenfield projects; current CEO, B&A Mineração Ltda.; past Executive Director for Exploration, Energy and Project Implementation, Vale; and past Board Member, Fosfertil S.A.
Luis M.F. de Azevedo COO, Director, General Counsel
Brazilian lawyer and geologist with over 30 years of experience; current Partner, FFA Legal Support for Mining Co.; current Board Member, Talon Metals Corp. and Brazilian Gold Corp.; past Attorney/Geologist, Western Mining and Barrick Gold Corp.
Julio Carvalho Director
Over 40 years of experience in Brazilian mineral resources; current President and Director, Rio Novo Gold Inc.; past President and CEO, Peak Gold Limited (now New Gold Inc.); past Executive VP South and Central America, Goldcorp Inc.; past President and CEO, Mineração Onça Puma Ltda.; and 35 years as past Chief Financial Officer and Executive Director, Rio Tinto Brazil.
Brazilian & Canadian Experience in
Exploration | Mining | Capital Markets

- 6 -
TSX ǀ RVD Assets – Strategically Located, Geologically Proven
- 7 -
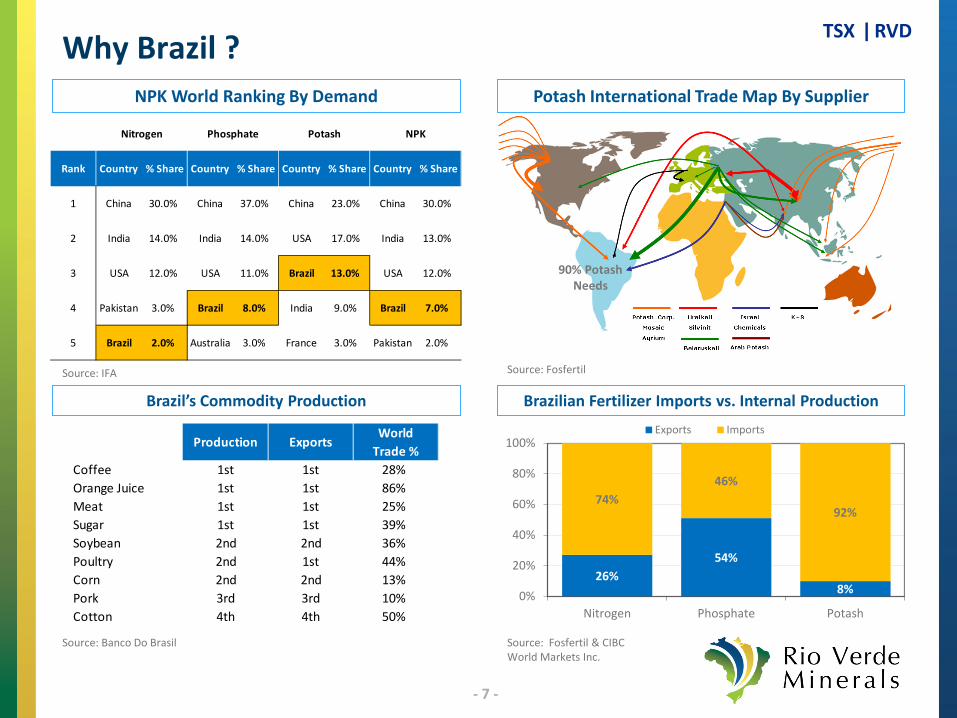
TSX ǀ RVD Why Brazil ? Potash International Trade Map By Supplier
Nitrogen Phosphate Potash NPK
Rank Country % Share Country % Share Country % Share Country % Share
1 China 30.0% China 37.0% China 23.0% China 30.0%
2 India 14.0% India 14.0% USA 17.0% India 13.0%
3 USA 12.0% USA 11.0% Brazil 13.0% USA 12.0%
4 Pakistan 3.0% Brazil 8.0% India 9.0% Brazil 7.0%
5 Brazil 2.0% Australia 3.0% France 3.0% Pakistan 2.0%
NPK World Ranking By Demand
Source: Fosfertil Source: IFA
Production ExportsWorld
Trade %Coffee 1st 1st 28%Orange Juice 1st 1st 86%Meat 1st 1st 25%Sugar 1st 1st 39%Soybean 2nd 2nd 36%Poultry 2nd 1st 44%Corn 2nd 2nd 13%Pork 3rd 3rd 10%Cotton 4th 4th 50%
Source: Fosfertil & CIBC World Markets Inc.
26% 54%
8%
74% 46%
92%
0%
20%
40%
60%
80%
100%
Nitrogen Phosphate Potash
Exports Imports
Brazilian Fertilizer Imports vs. Internal Production Brazil’s Commodity Production
Source: Banco Do Brasil
90% Potash Needs
- 8 -
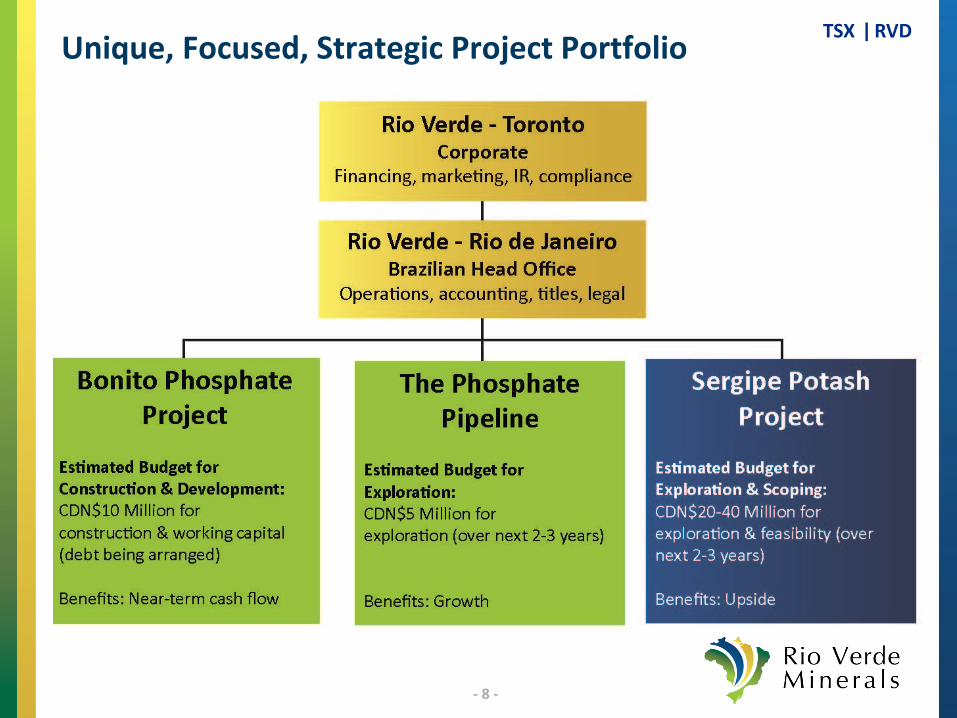
TSX ǀ RVD Unique, Focused, Strategic Project Portfolio

- 9 -
TSX ǀ RVD Rio Verde Capitalisation
1 Shares to Talon Metals for Potash assets (distributed to Talon shareholders) – 26,619,508 2 Shares to Sercor Ltd. for Phosphate assets - 8,873,169 3 Shares to Biscoe Trading Ltd., Colfax Management Inc. and Moriarty Services Inc. for Fosfatar Acquisition – 14,127,219 4 8,189,554 options, and 19,619,538 warrants
Total Shares Outstanding 1,2,3 121.6 M
Options & Warrants 27.8 M
Deferred Share Units (DSUs) 4 0.71 M
Total Fully Diluted (as at Sep 30, 2012) 150.1 M
Recent Share Price (52-week range: $0.18 - $0.55) $0.29
Basic Market Capitalisation (at $0.29; Sep 30, 2012) $35.3 M
Cash & Equivalents (as at end of Q3, Sep 30, 2012) $11.4 M
Debt $0
Institution 60%
Other Brazilian 58.7%
Insiders & Mgmt 46.9%
Other Retail 38% Institution
62%
TSX ǀ RVD
Bonito Phosphate Project Near-Term Cash Flow

- 11 -
TSX ǀ RVD Bonito Phosphate Project – Location • Previously: the Fosfatar Phosphate Project
• Near Belém in Pará State, with favourable infrastructure and access
• Located close to target markets of Pará, Mato Grosso and Maranhão States
• Highly productive agricultural states
• These states currently import fertilizer from international and national sources, with shortest shipping distances of over 1,000km
- 12 -
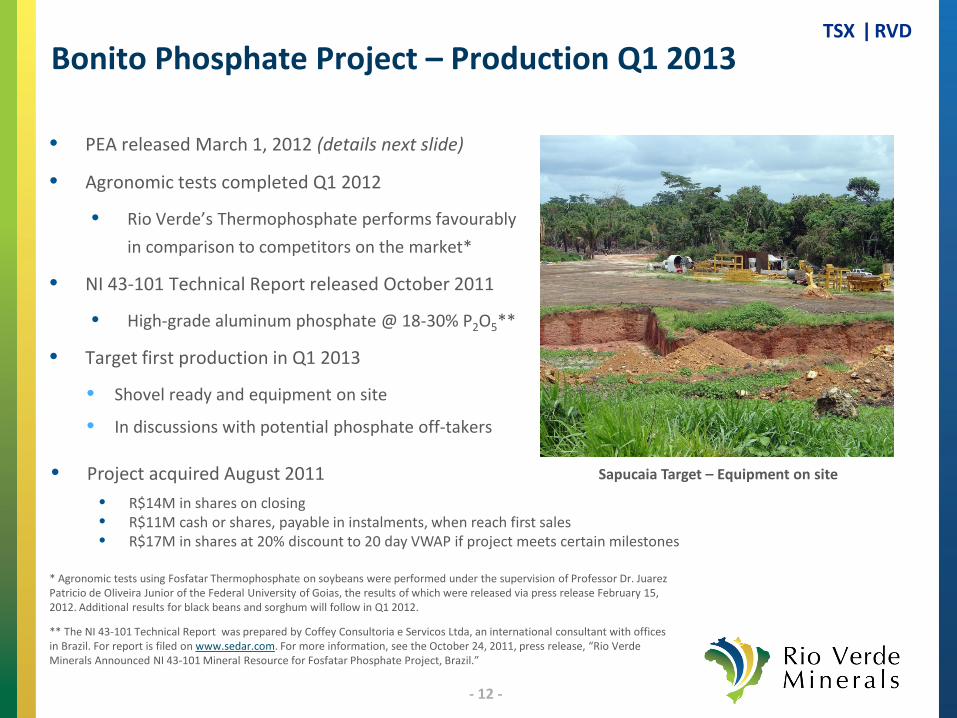
TSX ǀ RVD Bonito Phosphate Project – Production Q1 2013
• PEA released March 1, 2012 (details next slide)
• Agronomic tests completed Q1 2012
• Rio Verde’s Thermophosphate performs favourably in comparison to competitors on the market*
• NI 43-101 Technical Report released October 2011
• High-grade aluminum phosphate @ 18-30% P2O5**
• Target first production in Q1 2013
• Shovel ready and equipment on site
• In discussions with potential phosphate off-takers
Sapucaia Target – Equipment on site
* Agronomic tests using Fosfatar Thermophosphate on soybeans were performed under the supervision of Professor Dr. Juarez Patricio de Oliveira Junior of the Federal University of Goias, the results of which were released via press release February 15, 2012. Additional results for black beans and sorghum will follow in Q1 2012.
• Project acquired August 2011 • R$14M in shares on closing • R$11M cash or shares, payable in instalments, when reach first sales • R$17M in shares at 20% discount to 20 day VWAP if project meets certain milestones
** The NI 43-101 Technical Report was prepared by Coffey Consultoria e Servicos Ltda, an international consultant with offices in Brazil. For report is filed on www.sedar.com. For more information, see the October 24, 2011, press release, “Rio Verde Minerals Announced NI 43-101 Mineral Resource for Fosfatar Phosphate Project, Brazil.”

- 13 -
TSX ǀ RVD Bonito Phosphate Project – PEA
• The Preliminary Economic Assessment (PEA) for the Sapucaia Target, one of three phosphate targets at the Bonito (Fosfatar) Phosphate Project, was released on March 1, 2012*
* The PEA was prepared by Coffey Mining Pty Ltd, an international consultant with offices in Brazil. For more information, see the March 1, 2012, press release, “Rio Verde Minerals Releases Positive Preliminary Economic Assessment for its Fosfatar Phosphate Project,” filed on www.sedar.com.
Bonito (Fosfatar) Project Base Case Metrics
• Resource (tonnes) 1.63 million
• % P2O5 Grade 20.3%
• Throughput (‘000 tonnes) 206k tpa
• Strip Ratio 0.36
• Life of Mine 8 years
• Total Capital Expenditures C$10.0 million
• Annual Production (full capacity) 150,000 tpa Thermophosphate, 25% P2O5
• Product Price C$300/tonne
• Total Operating Expenditures C$131.8/tonne
• Foreign Exchange Rate Assumption BRL$1.75 : US$1.00
• After-tax Net Present Value (NPV10%) C$62.9 million
• After-tax Internal Rate of Return (IRR) 113%
• Payback Period 1 year

- 14 -
TSX ǀ RVD
Targeting known mineralization, at surface
Typical Cross Section
Bonito Phosphate Project – Ore at Surface
- 15 -
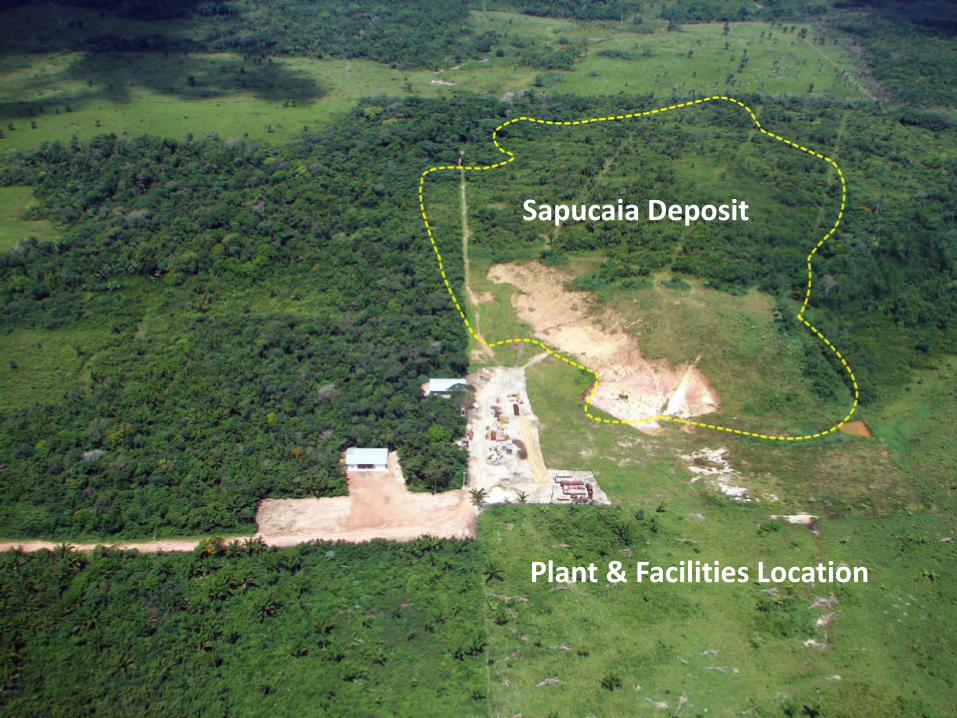
TSX ǀ RVD Exploration Potential
Sapucaia Deposit
Plant & Facilities Location

- 16 -
TSX ǀ RVD Bonito Phosphate Project – Market & Logistics
• Pará State: largest palm oil producer in the country
• 118,000 ha of cultivated area
• One of the largest beef producers
• Mato Grosso State: largest soybean, beef and cotton producer in Brazil,
• Maranhão State: one of the country's largest producers of soybean and rice
• Discussions underway with potential off-takers located in Pará

- 17 -
TSX ǀ RVD Bonito Phosphate Project – Marketing Strategy
Market Total P2O5 Demand
Current Source / Competitors
Bonito Target Market Share
Freight (Distance & Method)
Pará (PA)
Maranhão (MA) Piauí (PI)
Tocantins (TO)
PA: 23Kt MA: 63Kt PI: 40Kt TO: 30Kt
TOTAL: 165Kt
Imports
10 – 15%
16.5 – 24.75Kt
Distance: ≤ 1000km Method: Roads
Rondônia (RO)
Mato Grosso (MT)
RO: 30Kt MT: 660kt
TOTAL = 690Kt
Domestic Imports: - Uberada - Paranaguá Port (South of Brazil)
2 – 3%
13.8 – 20.4Kt
Distance: > 1000km Methods: - River - Return Freight (Soy Delivery Trucks)

- 18 -
TSX ǀ RVD Exploration Potential
Sapucaia Deposit
Palm Oil Areas
Palm Oil Areas

- 19 -
TSX ǀ RVD Calcination Process

- 20 -
TSX ǀ RVD
25% P2O5 18% NAC-soluble
Bonito Thermophosphate

- 21 -
TSX ǀ RVD Prices (US$ per tonne) – Collected in May 2012
Sources Location MAP SS TSP FNR
Fertipar NE São Luiz 758 352 303
Peninsula Paranaguá 705 319
CHS Paranaguá 638 319 582
Mosaic Paranaguá 767 435
Fertipar Sul Paranaguá 712 312 690 280
Average 712 319 636 292
Grade 52% 20% 45% 32%
US$ per 1% de P2O5 (1) 13,7 16,0 14,1 9,1
(1) Bonito (Fosfatar) model uses a range of US$10-12 per 1% of P2O5

- 22 -
TSX ǀ RVD Long-Term Price Curve vs. Bonito (Fosfatar) Price Assumption – International Prices FOB
MAP vs. Bonito DAP vs. Bonito
Source: Bloomberg

TSX ǀ RVD
Phosphate Projects The Pipeline

- 24 -
TSX ǀ RVD Phosphate Projects – Diverse Portfolio • Multiple exploration targets (~750,000 ha), with known mineralization
• Less complex than potash development; cheaper to explore and construct
• Typical timeline from exploration to development of greenfield projects: 2-4 years

- 25 -
TSX ǀ RVD Phosphate Projects – Exploration Pipeline
Bonito (Fosfatar)
São Gotardo Various Exploration Licenses (~600,000 ha)
Tier 1 – Near-Term Production
Tier 2 – Development
Tier 3 – Exploration
Tier 4 – Grassroots
Monte Alegre
Serra Negra
Mandacaru
Canindé Trauíra
Santa Quitéria
Exploration Objective 2012-2013:
Advance 1-2x Targets to Development-stage
_________ _________
Cash Flow
- 26 -
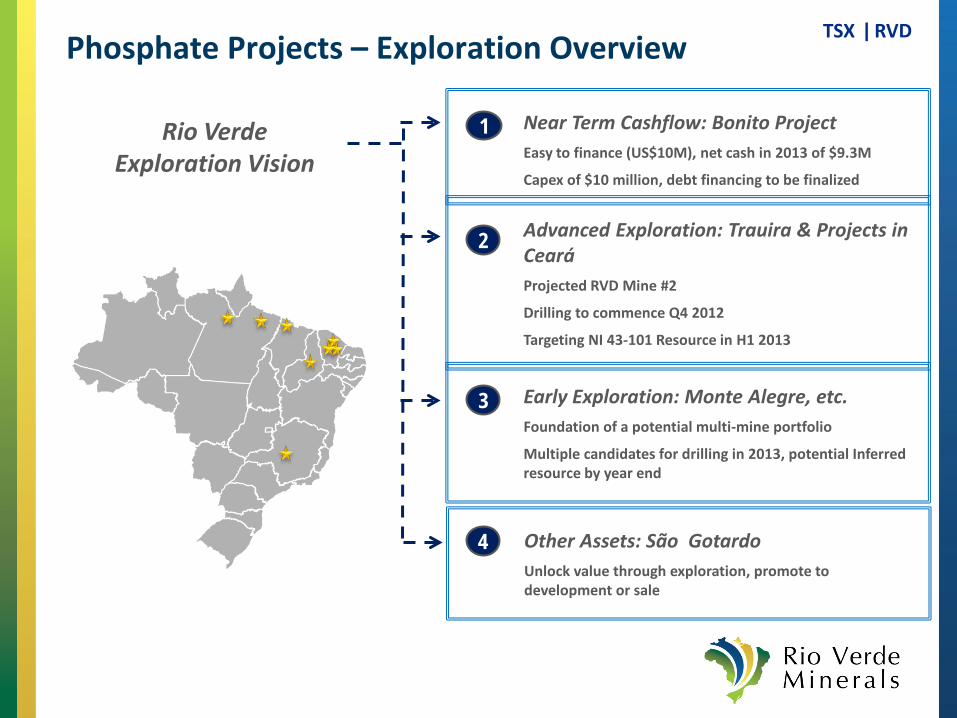
TSX ǀ RVD Phosphate Projects – Exploration Overview
Near Term Cashflow: Bonito Project Easy to finance (US$10M), net cash in 2013 of $9.3M
Capex of $10 million, debt financing to be finalized
1
Advanced Exploration: Trauira & Projects in Ceará Projected RVD Mine #2
Drilling to commence Q4 2012
Targeting NI 43-101 Resource in H1 2013
2
Early Exploration: Monte Alegre, etc. Foundation of a potential multi-mine portfolio
Multiple candidates for drilling in 2013, potential Inferred resource by year end
Other Assets: São Gotardo Unlock value through exploration, promote to development or sale
Rio Verde Exploration Vision
3
4

TSX ǀ RVD
Sergipe Potash Project
- 28 -
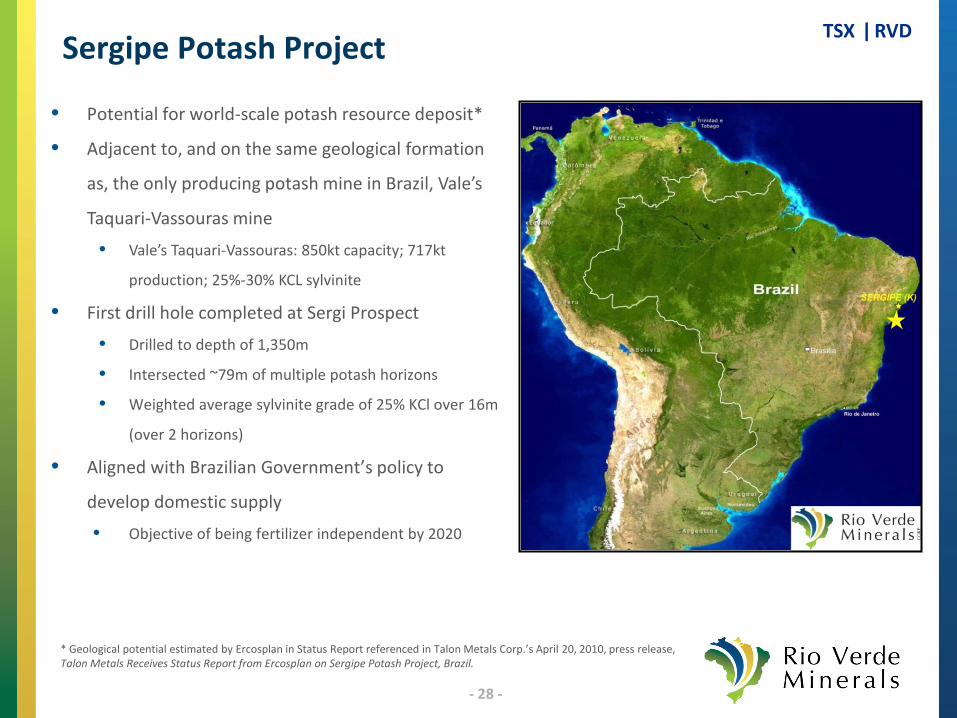
TSX ǀ RVD Sergipe Potash Project
• Potential for world-scale potash resource deposit*
• Adjacent to, and on the same geological formation
as, the only producing potash mine in Brazil, Vale’s
Taquari-Vassouras mine
• Vale’s Taquari-Vassouras: 850kt capacity; 717kt
production; 25%-30% KCL sylvinite
• First drill hole completed at Sergi Prospect
• Drilled to depth of 1,350m
• Intersected ~79m of multiple potash horizons
• Weighted average sylvinite grade of 25% KCl over 16m
(over 2 horizons)
• Aligned with Brazilian Government’s policy to
develop domestic supply
• Objective of being fertilizer independent by 2020
* Geological potential estimated by Ercosplan in Status Report referenced in Talon Metals Corp.’s April 20, 2010, press release, Talon Metals Receives Status Report from Ercosplan on Sergipe Potash Project, Brazil.

- 29 -
TSX ǀ RVD Sergipe Potash Project – Established Infrastructure
Close to hydroelectric, with access to power lines
Seaport infrastructure - 38,000 tonnes capacity
Regional gas pipelines
Railroad connection to NE and SW major cities; close to hydroelectric, with access to power lines and gas pipelines

- 30 -
TSX ǀ RVD Sergipe Potash Project – Historical Data Base • Extensive historical geological database from Petrobras work
• 11 drill holes identified with potash mineralization*
• Thicknesses based on historical drill hole data*
• Grade inferred from geophysical logs and core inspection*
• 7 regional targets, each with drilled intersections and potash mineralization
618 2D-seismic lines available 234 line kms of data processed
4,590 oil wells available : Data from 286 wells processed
Drilling 2D Seismic RIO VERDE
* Estimated by Ercosplan in Status Report referenced in Talon Metals Corp.’s April 20, 2010, press release, Talon Metals Receives Status Report from Ercosplan on Sergipe Potash Project, Brazil.

- 31 -
TSX ǀ RVD Sergi Prospect – Results of First Drill Hole
• First drill hole, SED-001-11, completed at Sergi Prospect on
November 12, 2011
• Twin of historical Petrobras oil well, located 115m to the
northwest; SED-001-11 intercepts correlate
• Drilled to depth of 1,350m
• Intersected ~79m of potash horizons
• Intersected two sylvinite-bearing zones, with a weighted
average grade of 25.01% KCL over 16.73m*
• Upper zone: 8.27m intercept averaging 20.94% KCl,
including 5.08m at 24.84% KCl
• Lower zone: 8.46m intercept at 28.98% KCl, including
5.47m at 39.65% KCl
• Intersected two carnallitite-bearing zones of relevance*
• Upper zone: 7.25m intercept averaging 13.32% KCl
• Lower zone: 5.56m intercept averaging 21.11% KCl * Sylvinite and carnallitite assays analysed by Ercosplan; results released via press release on February 7, 2012 and March 13, 2012, respectively.

- 32 -
TSX ǀ RVD Sergi Prospect – Potash Core Photos – SED-001-11 Sylvinite
Sylvinite
Carnallitite
Carnallitite
- 33 -
TSX ǀ RVD
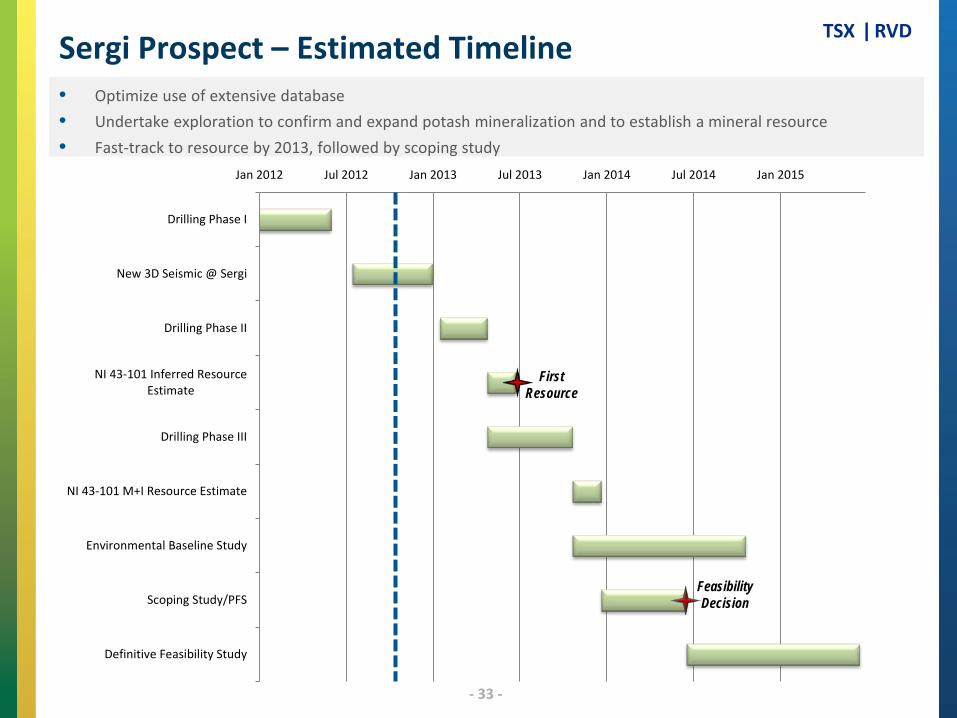
Jan 2012 Jul 2012 Jan 2013 Jul 2013 Jan 2014 Jul 2014 Jan 2015
Drilling Phase I
New 3D Seismic @ Sergi
Drilling Phase II
NI 43-101 Inferred ResourceEstimate
Drilling Phase III
NI 43-101 M+I Resource Estimate
Environmental Baseline Study
Scoping Study/PFS
Definitive Feasibility Study
First Resource
Feasibility Decision
Sergi Prospect – Estimated Timeline • Optimize use of extensive database • Undertake exploration to confirm and expand potash mineralization and to establish a mineral resource • Fast-track to resource by 2013, followed by scoping study

TSX ǀ RVD
Investment Summary

- 35 -
TSX ǀ RVD
Deliverables - Phosphate Area of Activity Timing
• Hold discussions with off-takers Phosphate Ongoing
• Completion of mine design and optimization by Promon Phosphate Q4 2012
• Beneficiation License Phosphate Q4 2012
• Arrangement of debt for Bonito (Fosfatar) Phosphate Project Phosphate Q4 2012
• Preliminary exploration work and drill target definition at up to two Phosphate Projects
Phosphate Q4 2012
• Construction/first production at Bonito Phosphate Project Phosphate Q1 2013
Deliverables - Potash Area of Activity Timing
• New land acquisitions Potash Ongoing
• Seismic Program at Sergi and Capela Targets Potash Q4 2012
• Preliminary NI 43-101 Mineral Resource at Sergipe Potash Project Potash 2013
• Scoping Study at Sergipe Potash Project Potash 2013
Key Deliverables – Upcoming Milestones

- 36 -
TSX ǀ RVD Creating Shareholder Value
• Brazil-focused fertilizer exploration & development company
• Targeting known mineralization in Brazil, on or near infrastructure
• Diverse potash and phosphate portfolio
• Favourable supply and demand dynamics, with a significant cost advantage in Brazil
• Prime strategic location of potash asset—adjacent to only potash mine in Brazil
• Fast-tracking to development—targeting potash resource and scoping studies in 2013
• Acquired advanced-stage Bonito Phosphate Project to generate near-term cash flow
• NI 43-101 Technical Report released October 2011 • PEA released March 2012

- 37 -
TSX ǀ RVD Analyst Coverage & Contact Information
Rio Verde Contact Information:
Rio Verde Minerals Development Corp. 155 University Avenue, Suite 1240 Toronto, Ontario Canada M5H 3B7 Phone: +1 416.368.8288 Fax: +1 416.368.2988 Web: www.Rvminerals.com Email: [email protected]
Analyst Coverage: Ascendant Securities Stephen Arvanitidis, 416-477-3410 GMP Securities Anoop Prihar, 416-943-6127 Mackie Research Capital Jeremy Dason, 416-860-6325 Northern Securities Fadi Benjamin, 416-644-8127 Paradigm Capital, Spencer Churchill, 416-361-6056 Salman Partners Andrea Rubakovic, 416-861-9387 Stonecap Securities Michael Goldberg, 416-342-8594

TSX ǀ RVD
Appendix

- 39 -
TSX ǀ RVD Bonito (Fosfatar) Phosphate Project – NI 43-101 • NI 43-101 Technical Report released October 2011*
• M&I mineral resource estimate of 1.93 Mt at Sapucaia and Boa Vista targets (NI 43-101)
• High-grade aluminum phosphate; average 19% P2O5 – potential to become one of the highest-grade phosphate mines in Brazil
• Easy extraction and low-strip ratio (0.6:1)
Deposit Resource Category
Tonnes Mt
P2O5 %
Sapucaia
Measured Indicated TOTAL
1.31 0.32 1.63
21.81 14.12 20.30
Boa Vista Measured Indicated TOTAL
0.24 0.06 0.30
12.21 9.65 11.71
• Block Model: 25m E X 25m N X 1m RL (3% P2O5 cut-off applied)
* The NI 43-101 Technical Report was prepared by Coffey Consultoria e Servicos Ltda, an international consultant with offices in Brazil. For report is filed on www.sedar.com. For more information, see the October 24, 2011, press release, “Rio Verde Minerals Announced NI 43-101 Mineral Resource for Fosfatar Phosphate Project, Brazil.”
- 40 -
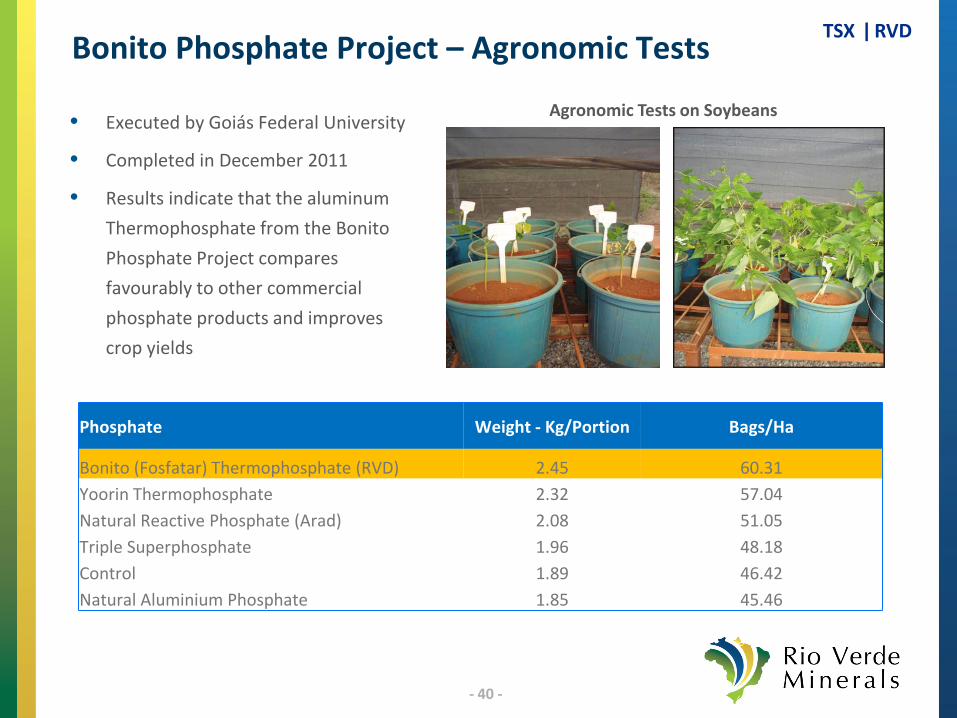
TSX ǀ RVD Bonito Phosphate Project – Agronomic Tests
• Executed by Goiás Federal University
• Completed in December 2011
• Results indicate that the aluminum Thermophosphate from the Bonito Phosphate Project compares favourably to other commercial phosphate products and improves crop yields
Agronomic Tests on Soybeans
Phosphate Weight - Kg/Portion Bags/Ha
Bonito (Fosfatar) Thermophosphate (RVD) 2.45 60.31 Yoorin Thermophosphate 2.32 57.04 Natural Reactive Phosphate (Arad) 2.08 51.05 Triple Superphosphate 1.96 48.18 Control 1.89 46.42 Natural Aluminium Phosphate 1.85 45.46
- 41 -
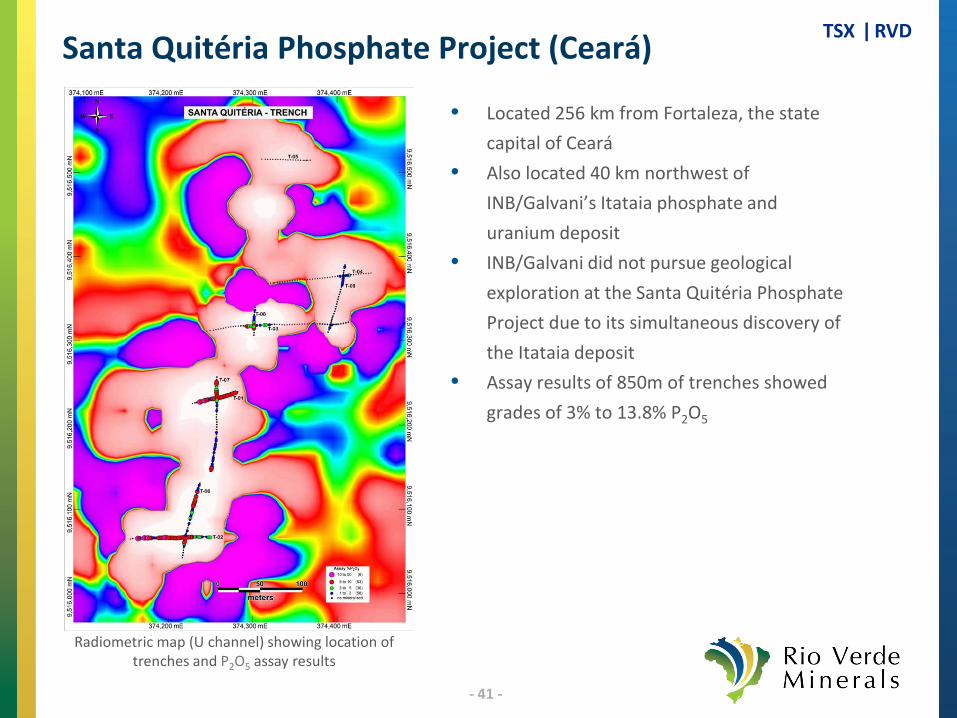
TSX ǀ RVD Santa Quitéria Phosphate Project (Ceará)
• Located 256 km from Fortaleza, the state capital of Ceará
• Also located 40 km northwest of INB/Galvani’s Itataia phosphate and uranium deposit
• INB/Galvani did not pursue geological exploration at the Santa Quitéria Phosphate Project due to its simultaneous discovery of the Itataia deposit
• Assay results of 850m of trenches showed grades of 3% to 13.8% P2O5
Radiometric map (U channel) showing location of trenches and P2O5 assay results

- 42 -
TSX ǀ RVD Mandacaru Phosphate Project (Ceará) • Located 144 km from Fortaleza, the state capital • 77 km north of INB/Galvani’s Itataia deposit
• Mandacaru closely resembles Itataia, both in lithologies bearing uranium and phosphate mineralization, and in host rocks
• Radiometric survey identified 5 well-defined anomalies • Rock grab and channel samples (trench) demonstrated
grades ranging from 15.8% to 35.9% P2O5
Location of phosphate samples and radiometric anomalies (phosphate occurrences outlined in red)
- 43 -
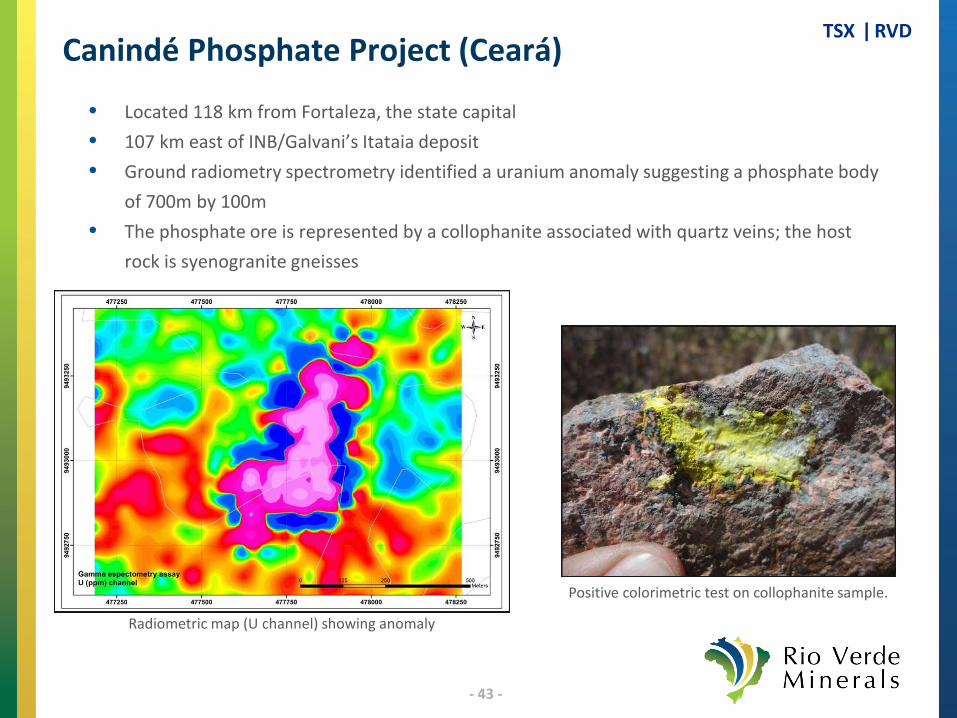
TSX ǀ RVD Canindé Phosphate Project (Ceará)
• Located 118 km from Fortaleza, the state capital • 107 km east of INB/Galvani’s Itataia deposit • Ground radiometry spectrometry identified a uranium anomaly suggesting a phosphate body
of 700m by 100m • The phosphate ore is represented by a collophanite associated with quartz veins; the host
rock is syenogranite gneisses
Radiometric map (U channel) showing anomaly
Positive colorimetric test on collophanite sample.
- 44 -
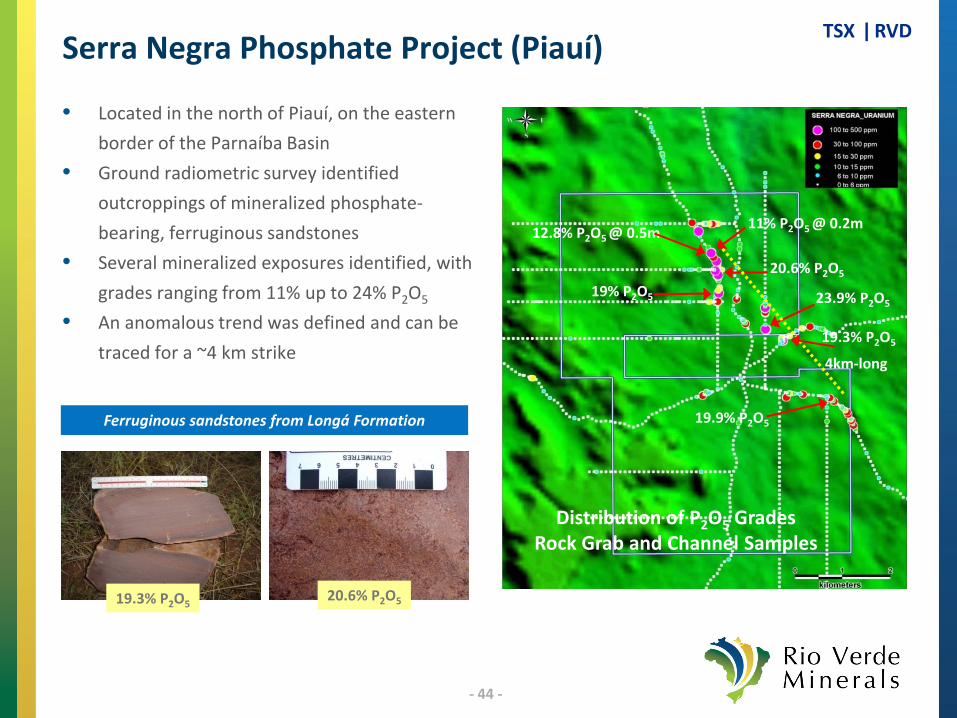
TSX ǀ RVD Serra Negra Phosphate Project (Piauí)
• Located in the north of Piauí, on the eastern border of the Parnaíba Basin
• Ground radiometric survey identified outcroppings of mineralized phosphate-bearing, ferruginous sandstones
• Several mineralized exposures identified, with grades ranging from 11% up to 24% P2O5
• An anomalous trend was defined and can be traced for a ~4 km strike
Ferruginous sandstones from Longá Formation
19.3% P2O5 20.6% P2O5
23.9% P2O5
11% P2O5 @ 0.2m
19% P2O5
19.3% P2O5
19.9% P2O5
12.8% P2O5 @ 0.5m
20.6% P2O5
4km-long
Distribution of P2O5 Grades Rock Grab and Channel Samples
- 45 -
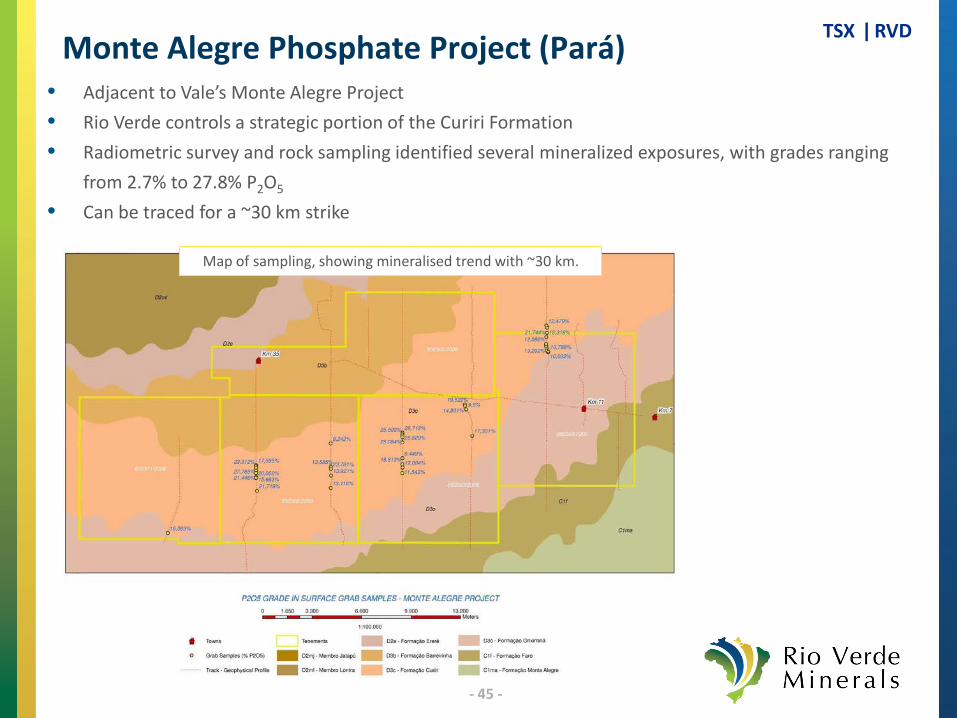
TSX ǀ RVD Monte Alegre Phosphate Project (Pará) • Adjacent to Vale’s Monte Alegre Project • Rio Verde controls a strategic portion of the Curiri Formation • Radiometric survey and rock sampling identified several mineralized exposures, with grades ranging
from 2.7% to 27.8% P2O5 • Can be traced for a ~30 km strike
Map of sampling, showing mineralised trend with ~30 km.
- 46 -
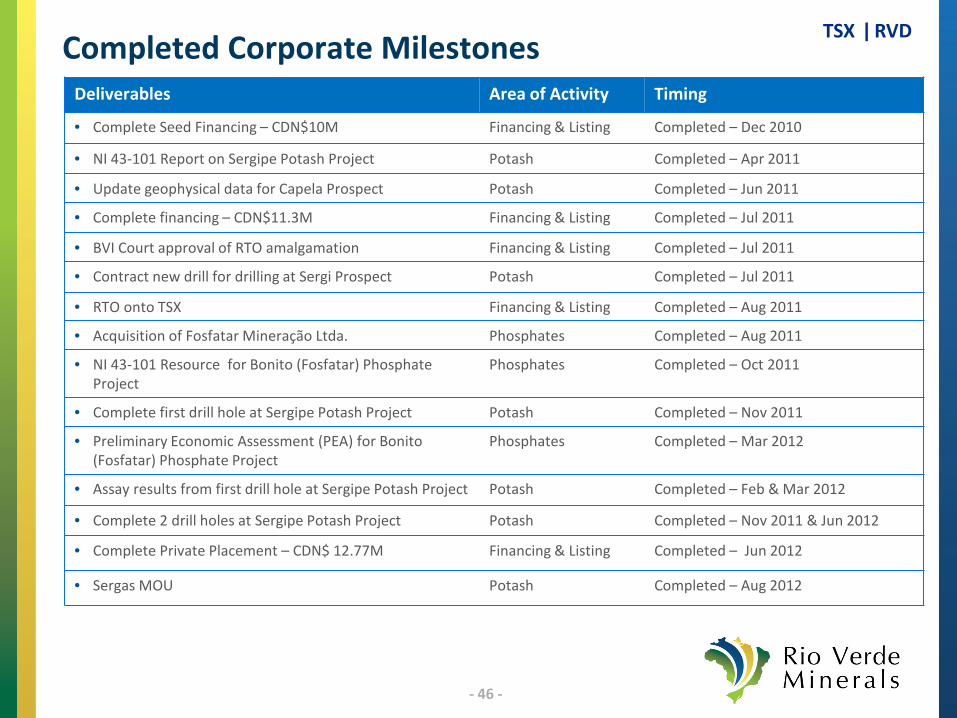
TSX ǀ RVD Completed Corporate Milestones Deliverables Area of Activity Timing
• Complete Seed Financing – CDN$10M Financing & Listing Completed – Dec 2010
• NI 43-101 Report on Sergipe Potash Project Potash Completed – Apr 2011
• Update geophysical data for Capela Prospect Potash Completed – Jun 2011
• Complete financing – CDN$11.3M Financing & Listing Completed – Jul 2011
• BVI Court approval of RTO amalgamation Financing & Listing Completed – Jul 2011
• Contract new drill for drilling at Sergi Prospect Potash Completed – Jul 2011
• RTO onto TSX Financing & Listing Completed – Aug 2011
• Acquisition of Fosfatar Mineração Ltda. Phosphates Completed – Aug 2011
• NI 43-101 Resource for Bonito (Fosfatar) Phosphate Project
Phosphates Completed – Oct 2011
• Complete first drill hole at Sergipe Potash Project Potash Completed – Nov 2011
• Preliminary Economic Assessment (PEA) for Bonito (Fosfatar) Phosphate Project
Phosphates Completed – Mar 2012
• Assay results from first drill hole at Sergipe Potash Project Potash Completed – Feb & Mar 2012
• Complete 2 drill holes at Sergipe Potash Project Potash Completed – Nov 2011 & Jun 2012
• Complete Private Placement – CDN$ 12.77M Financing & Listing Completed – Jun 2012
• Sergas MOU Potash Completed – Aug 2012

- 47 -
TSX ǀ RVD Comparables
1.Potash One shown at unaffected price, prior to K+S acquisition offer of C$4.50/share 2. Aguia’s resource is a non-NI 43-101 compliant management estimate based on an average of the expected range of resource size and grade. 3. Rio Verde potash resource estimate is based on management guidance: 450 Mt sylvinite ore @ 25% KCl and 1.1 Bt carnallitite ore @ 12% KCl
Market Data as at 31-October-12
Potash Resource & Reserve (Mt) (KCl)
EV / Potash (US$/t) (KCl)
Avg. Grade (% KCl) Phosphate (Mt) (P2O5)
Company Primary Asset Location Price (C$) Basic S/O
(mm) Basic M. Cap
(US$ mm)
Enterprise Value
(C$ mm) P&P M&I Inf. Ttl. R&R Ttl. R&R Ttl. R&R P&P M&I Inf. Ttl.
R&R
Potash Developers
Elemental Minerals Republic of Congo $0.60 243.6 $146 $136 48 157 243 448 $303 30.8% - - - -
Karnalyte Resource Saskatchewan $7.75 21.6 $167 $146 155 - 269 424 $345 17.9% - - - - Potash One (1) Saskatchewan $3.55 80.8 $287 $320 136 80 860 1,076 $297 28.9% - - - - Verde Potash Brazil $3.61 36.9 $133 $120 - 10 390 400 $300 14.1% - - - - Allana Potash Ethiopia $0.51 228.5 $117 $69 - 250 109 360 $193 30.6% - - - - Western Potash Sask., Manitoba $0.47 161.3 $75 $69 - 788 2,729 3,517 $20 25.9% - - - - IC Potash New Mexico $0.73 151.4 $111 $77 75 184 83 341 $224 23.4% - - - - Aguia Resources (2) Brazil $0.14 106.7 $15 $12 - - 132 132 $90 12.0% - - - - Ethiopian Potash Corp. Ethiopia $0.08 108.6 $8 $11 - - 27 27 $400 20.7% - - - - Encanto Potash Saskatchewan $0.17 275.7 $45 $50 - 393 706 1,099 $45 29.0% - - - - Median $261 24.7% Mean $222 23.3% Phosphate Developers Stonegate Agricom Peru, Idaho $0.38 144.4 $55 $65 - - - - - - 3 27 37 67 MBAC Brazil $3.16 106.3 $336 $517 - - - - - - 20 10 5 35 Minemakers Australia $0.17 227.0 $37 $29 - - - - - - - 117 416 534 Arianne Resources Ontario $1.06 67.8 $72 $75 - - - - - - - 23 6 29 Phoscan Chemical Ontario $0.29 168.6 $48 $14 - - - - - - - 15 12 27 Median $0 n/a Mean $66 n/a Rio Verde (3) Brazil $0.31 121.6 $38 $32 0 0 0 0 n/a 12%-25% 0 0.3 0.1 0.4
Potash One at Acquisition (C$4.50/share) Saskatchewan $4.50 80.8 $363 $384 136 80 860 1,075 $357 n/a 153 90 966 1,209
- 48 -
TSX ǀ RVD Footnotes
The potential quantity of potash is conceptual in nature as there has been insufficient exploration to define a
mineral resource, and it is uncertain if further exploration will result in the target being delineated as a
mineral resource. Ercosplan has based potential quantities of target mineralization on sylvinite and
carnallitite logged in drill holes or identified in down hole geophysical logs and applying an area of influence
of 1,500 metres around the individual mineralized drill holes within the Rio Verde properties. Target
resources quantities are internal estimates based on management’s interpretation of reprocessed, historical
geophysical survey lines and drill results, taking into consideration management’s current understanding of
the various sub basins, layer thicknesses, area sizes and evaporite densities.
The estimated quantities do not represent a mineral resource. Further drilling and assaying is required to
confirm historical data.