Embed Size (px)
Citation preview
Purdue Agricultural Economics Report, December 2016
1 | P a g e
PURDUE AGRICULTURAL
ECONOMICS REPORT
YOUR SOURCE FOR IN-DEPTH AGRICULTURAL
NEWS STRAIGHT FROM THE EXPERTS.
2017 AGRICULTURAL OUTLOOK
This edition contains short video summaries direct from our experts.
Click on the video icon below the title of each article to see the
authors discuss their subject.
CONTENTS
Editor’s Welcome Note ................................................................................................................................................................................. 2
Trump’s Election Changes the General Economy Outlook .................................................................................................................. 2
Weak Ag Trade Outlook for 2017 ............................................................................................................................................................. 4
Lower Grocery Store Food Prices: Good for Consumers and Bad for Farmers ............................................................................ 6
Another Difficult Year for Beef Cattle Producers ................................................................................................................................... 7
Milk Prices Expected to Increase with Stable Feed Costs ..................................................................................................................... 9
Hog Production Losses Continue .............................................................................................................................................................. 10
High Grain Yields Contribute to Low Prices .......................................................................................................................................... 11
2017 Indiana Crop Cost and Expected Returns .................................................................................................................................... 12
Farmland Values Face Third Year of Decline .......................................................................................................................................... 15
Cash Rents to Drop in 2017 ....................................................................................................................................................................... 16
Financial Outlook Continues to Weaken ................................................................................................................................................ 17
Purdue Agricultural Economics Report, December 2016
2 | P a g e
EDITOR’S WELCOME NOTE
Welcome to our 2017 Agricultural Outlook. It’s a new year that will bring opportunities and challenges for agricultural industries.
While no one can accurately predict the future, it is our mission to help you understand the major economic drivers of the agricultural
economy in 2017. That begins with a new administration in D.C., which is expected to immediately pass an economic stimulus
package to accelerate economic growth. That should have some positive impacts for U.S. agriculture but what about the strength of
the U.S. dollar, and expectations for higher interest rates and higher inflation?
Speaking of the new administration, there was more anti-trade rhetoric this election season than has been around for a long time.
Trade is a foundation of the U.S. agricultural economy. Are we moving into a more protectionist era and shifting away from
globalization?
Farm incomes are depressed and the theme of the 2017 outlook is for a continuation of low farm incomes from both crop production
as well as the animal industries. In these articles we give you a commodity-by-commodity evaluation. How long will this downturn
last? What does it mean to the financial position of the Ag sector? It’s all right here for you to read.
- Chris Hurt, Editor and Professor of Agricultural Economics
TRUMP’S ELECTION CHANGES THE GENERAL ECONOMY OUTLOOK
LARRY DEBOER, PROFESSOR OF AGRICULTURAL ECONOMICS
The unexpected Election Day outcome changed the
outlook for the U.S. economy. The day before the
election, the outlook was for more of the same: real GDP
growth near 2%, inflation less than 2%, an unemployment
rate falling a bit below 5%, and very gradual increases in
interest rates. That meant not much was going to change
from 2014, 2015 or 2016.
Once the realization that it would be a Trump
administration set in, the outlook changed. The stock
market has set new record highs, Treasury bond interest
rates have increased, inflationary expectations have
increased, and the value of the dollar has risen to 13-year
highs.
The economy is near capacity, with the unemployment
rate at 4.6% in November. It will be harder for businesses
to find new employees if they want to expand. That
means that output growth is limited by the growth in the
labor force. The labor force is growing slowly, only 0.9%
over the past year, because baby boomers are retiring in
large numbers. Output also depends on productivity,
which is output per employee. That is influenced by the
quantity of machinery and quality of technology that
workers use. Productivity has actually been falling over
the past year, down 0.3%. That’s unlikely to continue, but
modest labor force growth plus modest productivity
growth means that the economy’s capacity to increase
production of goods and services is limited too.
Purdue Agricultural Economics Report, December 2016
3 | P a g e
With the election, Federal fiscal policy could be unbound
after six years of stalemate between the White House
and Congress. Federal fiscal policy will likely become
more stimulative to a higher rate of economic growth.
There will likely be an income tax cut that will add to
consumer and business spending, and perhaps increases
in defense and infrastructure spending creating more
jobs. Pressure from baby boom retirements and health
care costs will keep entitlement costs rising. Substantial
changes in Obamacare and Medicare may be a few years
off but are now anticipated. All this means increased
federal budget deficits. Federal borrowing will increase
and push up interest rates.
Consumer spending increased by 2.7% above inflation
over the past year. There are many reasons to think that
consumers will keep spending. Falling unemployment
means job prospects keep improving. Wages have begun
to rise. Home values and stock prices are up. Add a tax
cut, and we can expect consumer spending to rise 3.3%
next year.
Investment in housing construction grew 1.5% above
inflation over the past year, a slower pace than over the
past few years. However, housing is still in short supply.
Rising housing prices will encourage construction, and
still-low mortgage rates should support demand. I am
looking for a 5% increase next year.
Other components of spending will show less growth.
Investment in business buildings and equipment is falling,
by 1.4% over the past year. Since business interest rates
are very low, this decline must mean that businesses have
low expectations for returns to expansion. Policy
uncertainty over the next year might inhibit investment
too. Trade growth has stagnated, falling as a share of total
output, though exports grew 2% while imports grew
0.6% this past year, so trade was a small net addition to
spending. A rising value of the dollar and slow growth
abroad probably will hold down export growth. Trade
restrictions could inhibit imports.
Add it up, and spending is likely to rise by 2.3% over the
next year. Can an economy at capacity, with a slowly
growing labor force and slowly growing productivity,
raise production to meet that new demand?
In the short run the answer is probably yes. Real GDP is
likely to increase by about 2.3%. The short supply of labor
will raise wages, and some labor market indicators show
several million people who could join the labor force with
such encouragement. Faster labor force growth means
that unemployment may not change very much in 2017.
It should remain around 4.5% by next December.
What about inflation? Added spending beyond capacity
would encourage businesses to raise prices. Higher costs
would do the same. OPEC oil producers intend to
restrict supply, which should increase gasoline prices.
The headline inflation rate has been 1.6% over the past
year. With added demand, limited supply and higher
gasoline prices inflation should run near 2.3% over the
next year.
Falling unemployment and higher inflation should
embolden the Federal Reserve to raise their policy
interest rate more frequently. We may see a quarter-
point increase every three months, which would mean a
one-point hike over the next year. The 3-month
Treasury interest rate could rise from 0.5% now to 1.4%
by next December and the ten-year Treasury rate may
rise from 2.4% to 2.7%.
Will the Trump administration really increase tariffs?
Congress may resist. But markets have already
anticipated lower demand for the Mexican peso. Its value
has fallen and the dollar’s value has risen by about 10%
since the election, which makes U.S. exports to Mexico
more expensive. That may cost U.S. jobs in exporting
industries like agriculture. If tariffs are imposed, some
manufacturing activity may shift back to the U.S., though
ever-increasing automation may limit the number of
added jobs. Tariffs also would increase the prices that
consumers pay, adding to inflation.
Purdue Agricultural Economics Report, December 2016
4 | P a g e
Our 2017 story is one of tax cuts and rising government
spending in an economy near capacity. Output and
inflation will rise, countered by higher interest rates and
a higher exchange value of the dollar. Unless, of course,
policy doesn’t change. Then we’ll see slower growth,
lower inflation, fewer interest rate hikes and slower
increases in the dollar than in this forecast.
What President Trump does will be important, but
remember there is still a lot of uncertainty about what
the new administration will actually do.
WEAK AG TRADE OUTLOOK FOR 2017
PHILIP ABBOTT , PROFESSOR OF AGRICULTURAL ECONOMICS
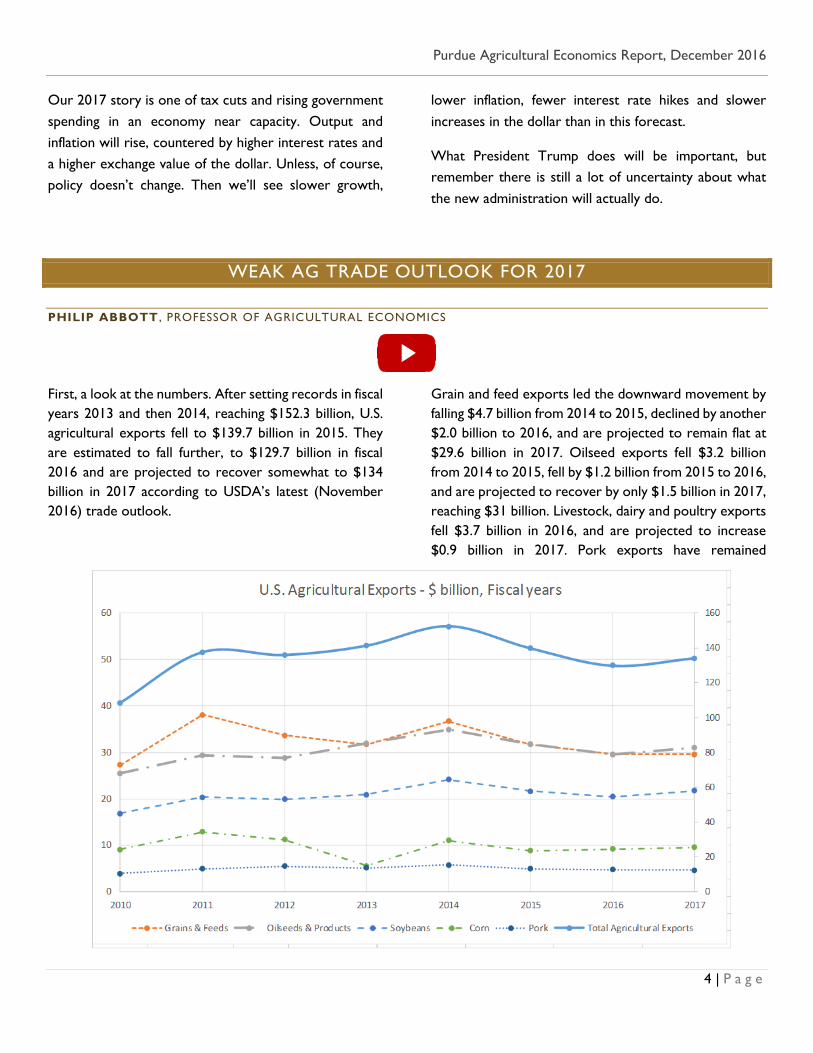
First, a look at the numbers. After setting records in fiscal
years 2013 and then 2014, reaching $152.3 billion, U.S.
agricultural exports fell to $139.7 billion in 2015. They
are estimated to fall further, to $129.7 billion in fiscal
2016 and are projected to recover somewhat to $134
billion in 2017 according to USDA’s latest (November
2016) trade outlook.
Grain and feed exports led the downward movement by
falling $4.7 billion from 2014 to 2015, declined by another
$2.0 billion to 2016, and are projected to remain flat at
$29.6 billion in 2017. Oilseed exports fell $3.2 billion
from 2014 to 2015, fell by $1.2 billion from 2015 to 2016,
and are projected to recover by only $1.5 billion in 2017,
reaching $31 billion. Livestock, dairy and poultry exports
fell $3.7 billion in 2016, and are projected to increase
$0.9 billion in 2017. Pork exports have remained
Purdue Agricultural Economics Report, December 2016
5 | P a g e
relatively flat since 2014 at about $4.7 billion. (ERS,
2016t).
These reductions are largely attributable to lower
commodity prices. In 2016 soybean export prices were
down 19.5% in 2015 and 12% in 2016; corn was down
14.1% in 2015 and 4.8% in 2016; and pork was down 9.8%
in 2015 and 6.9% in 2016. USDA’s 2017 forecasts see a
3% recovery in soybean prices, but further declines in
corn and pork prices at around 5%. (FAS, 2016g).
The low commodity prices plus shortfalls in grain and
oilseed production in South America have led to
unexpected improvements in export volume (WAOB
2016). Corn export volume for 2016 is up 9.4%, but is
expected to fall back by 5.1% in 2017. Soybean export
volume is up 7% in 2016 and another 3% is projected for
2017. Weekly export sales reports show increases over
past sales trends in the second half of the 2015/16 crop
year that are continuing into the current crop year,
corresponding with the southern hemisphere shortfall
(FAS, 2016e). The declines of Brazilian corn production
by 21% and Argentine oilseed production of 7.5%,
contributed significantly to this outcome. Production and
export volumes in South America are expected to
recover in 2017 (FAS, 2016p).
Two factors contributing to low export values are weak
global macroeconomic performance and the extremely
strong dollar. Since 2014 the dollar has appreciated 25%
relative to the Euro, 32% relative to the British pound,
and 45% relative to the Brazilian real. USDA estimates
that its real exchange rate index, which accounts for
inflation here and abroad, appreciated 12% since 2014,
2.6% in 2016, and will appreciate an additional 2.1% in
2017. A strong exchange rate has historically contributed
to low commodity prices, as U.S. exports are more
expensive for their trading partners and competitors.
Both USDA and the IMF (2016) have predicted slow
global economic growth in 2016 followed by modest
recovery in 2017. While U.S. weak macroeconomic
performance (1.6% GDP growth for 2016) has been one
of the surprises leading to reductions in projections from
one report to the next, very recent optimism calls for
somewhat faster growth in 2017. The IMF estimate for
2017 U.S. GDP growth is 2.2%. Brazil and Russia are
expected to emerge from recessions, China remains at
over 6% growth, but the Euro area is expected to slow
to just 1.5% growth.
One factor that potentially contributes to a better
agricultural trade outlook, though not for the immediate
future, is the successful completion of trade agreements.
Historically, U.S. agriculture has benefited substantially
from exports, and in particular from reforms in trade
agreements like NAFTA and the URAA of WTO.
The U.S. concluded negotiations for the Trans Pacific
Partnership (TPP) in October 2015 but ratification is now
extremely doubtful. Not surprisingly, many agricultural
interest groups have come out strongly in support of
TPP. But president-elect Trump has indicated he will
withdraw from TPP on his first day in office. The USDA
noted in its outlook that “A change in the U.S. trade
relationship with China and Mexico is of particular
concern for agricultural competitiveness. Together,
these two countries were the destination for an average
of almost one-third of total U.S. agricultural exports from
2013-2015. China alone was the destination for roughly
60% of U.S. soybean exports, on average, during this
period.”
Negative perceptions of trade agreements and
globalization are not limited to the U.S. and its election
outcome. Brexit, the U.K. vote to leave the European
Union, also reflects inward, protectionist sentiment that
is also found elsewhere now. In addition to potential
negative effects on trade, Brexit is credited with GDP
slowdown in both Britain and the EU. These come at a
time when the IMF in its recent outlook had already
highlighted a global trade slowdown (IMF 2016). Trade
volume worldwide is expected to increase only 1.3% in
2016. Trade value will decline given low commodity
prices generally. While trade growth is expected to
recover somewhat in 2017, the more rapid growth of
global trade than GDP growth appears to be a relic of
the past.
Weak export demand was one key to recent agricultural
price and value declines. Global economic weakness and
a strong dollar mean agricultural trade will not turn
Purdue Agricultural Economics Report, December 2016
6 | P a g e
around quickly nor dramatically. In spite of lower prices
and good crops this year, agricultural exports are likely
to remain weak, showing only marginal improvement for
the coming year. This weakness is likely to be reflected
in prices and farm income, as well.
References:
Economic Research Service (ERS), USDA. Agricultural
Exchange Rate Data Set, USDA, Washington, DC, 2016e.
Economic Research Service (ERS), USDA. Outlook for
U.S. Agricultural Trade, USDA, Washington, DC,
November 2016t.
Foreign Agricultural Service (FAS), USDA. Export Sales
Query System, USDA, Washington, DC, 2016e.
Foreign Agricultural Service (FAS), USDA. Global
Agricultural Trade System (GATS database), USDA,
Washington, DC, 2016g.
Foreign Agricultural Service (FAS), USDA. Production
Supply and Demand estimates (PS&D database), USDA,
Washington, DC, 2016p.
International Monetary Fund (IMF), World Economic
Outlook (WEO): Adjusting to Lower Commodity
Prices, IMF, Washington DC, October 2016.
World Agricultural Outlook Board (WAOB). World
Agricultural Supply and Demand Estimates (WASDE),
USDA, Washington, DC, May 2016 and November
2016.
LOWER GROCERY STORE FOOD PRICES: GOOD FOR CONSUMERS AND BAD
FOR FARMERS
KEN FOSTER, PROFESSOR OF AGRICULTURAL ECONOMICS AND DEPARTMENT HEAD
In the most recent (November 2016) report on food
prices by the U.S. Department of Commerce, monthly
year over previous year average retail grocery store
prices for food consumed “at home” were down for the
eleventh straight month. This is the longest such streak
of declines since 1959-60 and tells a dramatic story of
agricultural supply response.
It was less than a decade ago that many were expressing
dire food security concerns as food prices rose strongly
on demand from biofuel production and food demand in
other parts of the world. Farmers and other participants
in the food and agricultural industry responded with
increased supply and now, after several good grain
harvests in the U.S, agricultural commodity prices have
fallen dramatically. Thus, the most important reason for
lower grocery store prices this year are lower farm
prices. Abundant harvests over the past three years have
reduced the prices farmers receive.
In addition, lower prices for feed items like corn and
soybean meal have increased animal production and
lowered animal product prices from beef to milk. Food
consumers are the benefactors this year. Record U.S.
yields for corn, soybeans, and wheat in 2016 should keep
grocery store food price increases at modest levels into
2017 with perhaps continued declines in the near term.
Lower farm prices filter through the supply chain in the
form of lower grain-based food products. Retail food
products in the Cereals and Bakery Products category,
for example, were down 1.2% in October 2016 versus
the same month the previous year. The year to date
average decline in prices of those items has been 0.5%
suggesting that the record 2016 corn, wheat, and
soybean yields have already impacted retail prices.
Purdue Agricultural Economics Report, December 2016
7 | P a g e
The story is even more dramatic when looking at the
category of meat, poultry, fish, and eggs. Those prices are
down almost 5% so far in 2016 with beef and pork leading
the way with 6% and 4% declines so far this year,
respectively. Likewise, dairy product retail prices are
down 2.5% so far this year compared to last. These
animal-derived food proteins are partial substitutes for
each other and thus a relatively large supply of one
weighs down the prices of others. When there are
relatively high supplies, such as now, then prices tumble
to clear markets for these perishable products.
For the year to date, through October, only fruit and
vegetable prices have increased on average since last year
(about 1.4%) and even those are softening this fall with
average prices for that category down 0.7% and 0.8% for
September and October 2016 versus the previous year.
While grocery store prices are down, we also purchase
food at fast food outlets and restaurants, a category
called “away from home.” Prices in that category of food
purchases have risen 2.6% with steady increases in each
month this year versus the corresponding month in 2015.
This suggests that while the commodity, or the farm
portion, of food prices are declining, the cost of
delivering marketing services is increasing as
unemployment in the labor market rapidly declines.
There is no reason to expect that this trend will change
and is likely to continue into 2017.
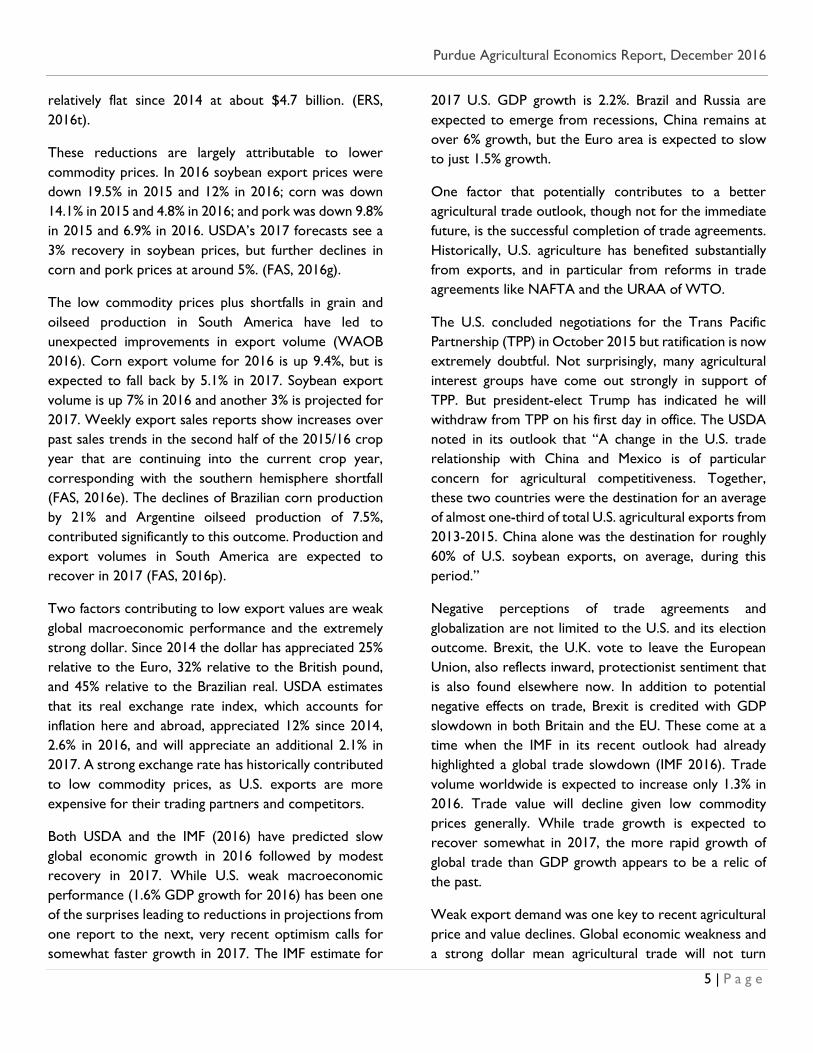
All food costs, a combination of at home and away from
home, will rise by only .5% in 2016. In 2017, USDA
expects the increase to be 1.5% to 2.5%. The figure
shows the trend in “at home” and “away from home”
prices. Clearly, the level of prices has been steadily rising
until this year for at home purchases. In the longer term,
this overall upward trend is likely to continue as food
marketing costs like labor, packaging, utilities, and
transportation continue to rise.
ANOTHER DIFFICULT YEAR FOR BEEF CATTLE PRODUCERS
JAMES MINTERT, PROFESSOR AND DIRECTOR OF THE CENTER FOR COMMERCIAL AGRICULTURE
Cattle prices fell harder, and faster, during 2016 than
most beef industry participants expected. The peak in
slaughter cattle prices during this cattle cycle occurred in
2014 when slaughter weight steers in the Southern Plains
averaged $154 per cwt. and prices remained above or
near that level through much of 2015, before dropping
precipitously during the fall of 2015. At the beginning of
2016 weekly average prices for slaughter steers in the
Southern Plains were 22% lower than a year earlier.
Prices for slaughter steers remained below a year earlier
throughout 2016 and dipped below $100 per cwt. in mid-
October before recovering to about $114 per cwt. in
early December. For the year, slaughter steer prices in
the Southern Plains averaged about $120 per cwt. in 2016,
nearly 20% lower than in 2015, when they averaged $148
per cwt.
Weaker than expected slaughter cattle prices meant
most cattle feeding programs were unprofitable again
during 2016. Iowa State Extension’s estimates of Corn
Belt cattle feeding returns indicate that a program of
routinely placing 750-pound steers on feed each month
and then marketing approximately 150 days later yielded
an average loss during 2016 of over $100 per head. The
largest losses for this simulated feeding program took
70
90
110
130
2000 2004 2008 2012 2016
All Food Consumer Price Indexes (2010=100)
At Home Away From Home
Purdue Agricultural Economics Report, December 2016
8 | P a g e
place early in the year, exceeding $300 per head in
January, before briefly moving into the black in late spring.
Losses began anew in the summer, and by October
estimated losses were once again over $200 per head.
The accumulated losses of 2015 and 2016 have placed a
tremendous amount of stress on cattle feeders as equity
built up in prior years has vanished.
Lower prices for feeder cattle and calves reduced prices
needed by cattle feeders to breakeven when selling
slaughter weight steers and heifers, but not by enough to
make feeding cattle profitable during most of 2016. This
despite the fact that prices for 700-800 pound feeder
steers in Kentucky averaged $151 per cwt. during the
first quarter of 2016, more than $50 per cwt. (26%)
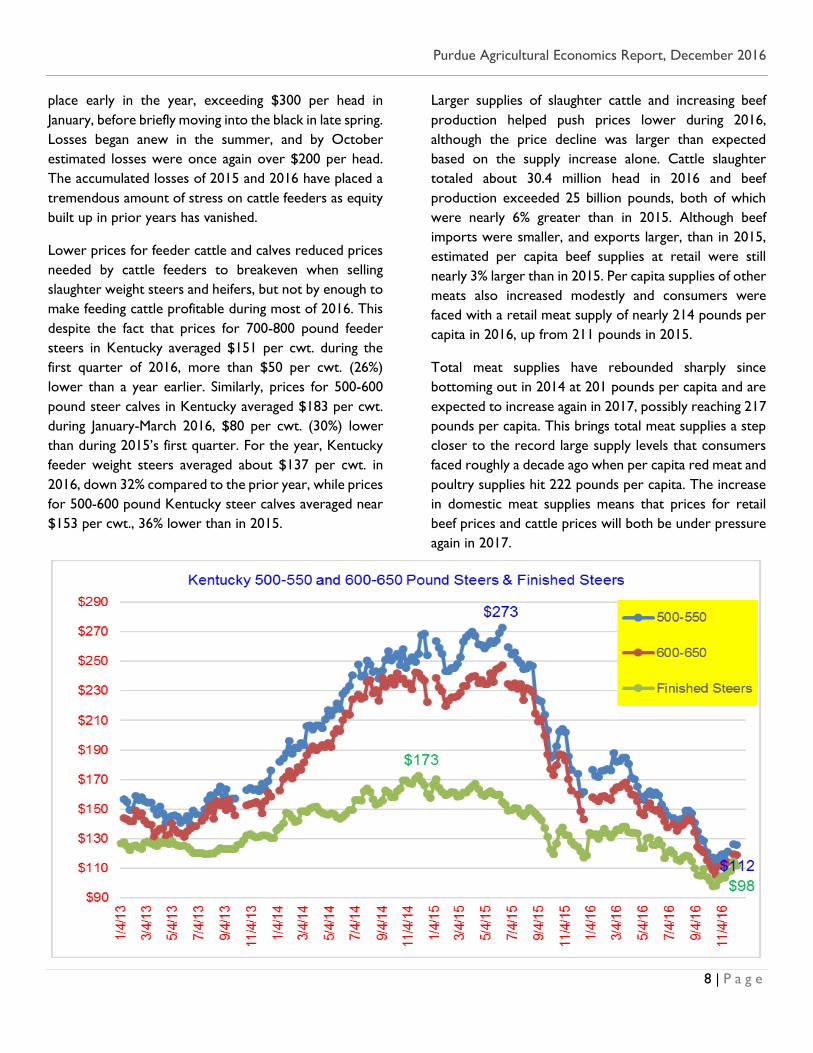
lower than a year earlier. Similarly, prices for 500-600
pound steer calves in Kentucky averaged $183 per cwt.
during January-March 2016, $80 per cwt. (30%) lower
than during 2015’s first quarter. For the year, Kentucky
feeder weight steers averaged about $137 per cwt. in
2016, down 32% compared to the prior year, while prices
for 500-600 pound Kentucky steer calves averaged near
$153 per cwt., 36% lower than in 2015.
Larger supplies of slaughter cattle and increasing beef
production helped push prices lower during 2016,
although the price decline was larger than expected
based on the supply increase alone. Cattle slaughter
totaled about 30.4 million head in 2016 and beef
production exceeded 25 billion pounds, both of which
were nearly 6% greater than in 2015. Although beef
imports were smaller, and exports larger, than in 2015,
estimated per capita beef supplies at retail were still
nearly 3% larger than in 2015. Per capita supplies of other
meats also increased modestly and consumers were
faced with a retail meat supply of nearly 214 pounds per
capita in 2016, up from 211 pounds in 2015.
Total meat supplies have rebounded sharply since
bottoming out in 2014 at 201 pounds per capita and are
expected to increase again in 2017, possibly reaching 217
pounds per capita. This brings total meat supplies a step
closer to the record large supply levels that consumers
faced roughly a decade ago when per capita red meat and
poultry supplies hit 222 pounds per capita. The increase
in domestic meat supplies means that prices for retail
beef prices and cattle prices will both be under pressure
again in 2017.
Purdue Agricultural Economics Report, December 2016
9 | P a g e
What’s ahead in 2017? Beef producers started expanding
their herds during 2014 and continued to expand in 2015
and 2016. The expansion means that cattle slaughter and
beef production during 2017 will both increase compared
to 2016, but the increase is expected to be smaller than
what took place in 2016, perhaps ranging between 3%
and 4%. Still, the increase in supplies is expected to push
prices for slaughter steers in the Southern Plains lower
with an annual average near $110 per cwt. likely.
Another decline in slaughter cattle prices means
downward pressure on calves and feeder cattle is likely.
After averaging near $153 per cwt. in 2016, prices for
500-600 pound steers in Kentucky could average in the
$120’s in 2017. Calf prices at this level are below the
breakeven price on many cow-calf operations, which
could bring herd expansion to a halt in 2017. Recent
cattle slaughter data supports this idea as female
slaughter has been rising relative to steer slaughter,
which indicates the interest in expansion is waning.
The visual shows the extraordinary rise and fall of
Kentucky steer calves and finished cattle prices in the
past four years.
MILK PRICES EXPECTED TO INCREASE WITH STABLE FEED COSTS
MICHAEL SCHUTZ , PROFESSOR OF ANIMAL SCIENCES
NICOLE WIDMAR , ASSOCIATE PROFESSOR OF AGRICULTURAL ECONOMICS
Some improvement in milk production returns may be
on the way. In the latest update, USDA has reduced its
forecast for national cow numbers in 2017, resulting in
slightly reduced forecast from earlier estimates for milk
production. The USDA is projecting the 2017 national
milk cowherd at 9.37 million head (up 40,000 cows) and
milk-per-cow at 23,160 pounds (up 395 pounds). This
would be a production increase of about 2% over 2016
production.
Global financial markets and economic, as well as political
situations around the World have continued to be less
favorable for US markets. This is true across the livestock
sector. Numerous factors are impacting dairy trade,
including (but not limited to) the strong US dollar
undermining export opportunities for most US
agricultural products, the slowing of the Chinese
economy, general political and economic pandemonium
occurring in the Middle East and North Africa, removal
of milk quotas in the European Union, and the Russian
embargo on imports from the European Union following
their annexation of Crimea. Recent election results and
their impact on possible renegotiation of trade deals
leave export forecasts uncertain.
Despite these uncertainties milk exports on a milk-fat
basis are expected to rise by over 2% and imports are
expected to be down as well next year.
Looking to the domestic market, USDA Agricultural
Marketing Service reported average national wholesale
prices for cheese, nonfat dry milk, whey, and butter
moving in various directions during the November to
December time period. Block cheddar cheese price rose
through much of November to $1.95 per lb. but has now
declined $1.76. Butter price too has softened from $2.23
to $2.11 per pound, but both cheese and butter prices
are historically quite strong. On the other hand, nonfat
dry milk price increased from $0.84 to $1.01 per pound.
Stocks for cheese have remained high relative to recent
years; however, butter and nonfat dry milk have matched
reports for recent years. Stocks of dry whey have
declined substantially since May.
The December USDA all-milk price forecast for 2016 is
currently $16.10 per cwt. Their 2017 forecast is for the
all-milk price to rise to an annual average between $16.85
and $17.65 ($17.25 is the mid-point of their range).
The Chicago Mercantile Exchange Class III futures have
shown considerable gains in the past 2 months and are
Purdue Agricultural Economics Report, December 2016
10 | P a g e
trading near $16.75 for early 2017 with increases during
the summer months to $17.50. These prices would
correspond to an all-milk price around $17.80 to $18.60,
respectively.
HOG PRODUCTION LOSSES CONTINUE
CHRIS HURT , PROFESSOR OF AGRICULTURAL ECONOMICS
For 2016 live hog prices are going to average about $46
per live hundredweight which is down from around $50
in 2015. They are expected to be higher in 2017, around
$47.
Hog prices in the final quarter of 2016 will average about
$37 per hundredweight representing the lowest fourth
quarter price since 2002. Prices have been depressed
since the third quarter of 2016 and have dropped more
sharply than expected.
Pork production in 2016 was about 2% greater than the
year before, but with exports up over 3% and imports
down, the actual amount of pork available to consumers
was actually down. This would have suggested stronger
prices, not weaker.
The culprit appears to be a shortage of processing
capacity in the last quarter of 2016. It is generally thought
that 2.5 million head per week is near federal inspection
capacity. In four of the past seven weeks, the number of
head processed at federal inspected plants has been
above 2.5 million head.
When there is a shortage of capacity in any industry there
tends to be high returns to those who own that capacity.
That seems to be the case this fall as the farm-to-
wholesale margin is at record high levels. Looking at the
most recent data, the farm-to-wholesale margin for
January through October has averaged 68 cents per retail
pound this year compared to 56 cents per retail pound
for the same period in 2015, (USDA).
If all of this higher margin were bid into the farm level
price it would increase live hog prices by $5 to $7 per
live hundredweight.
After averaging about $37 for the final quarter of 2016,
prices are expected to improve to about $43 for the first
quarter of 2017 with head counts that are a little smaller.
Then, seasonally smaller supplies in the second and third
quarter could support live hog prices in the low $50s.
Two new processing plants are expected to come on-line
by the fall of 2017 and these should relieve the capacity
shortage and allow hog prices to be higher a year from
now, even though hog supplies will be higher. Current
forecast are for live hog prices to average about $44 in
the fourth quarter of 2017.
With current costs estimated at $49, this means large
losses for the current quarter of about $34 per head.
First quarter 2017 losses would drop to $18 per head.
Small profits of about $5 a head are expected for the
spring and summer, but returning to losses of around $16
in the final quarter.
My estimates of annual losses of about $11 per head in
2016 are expected to drop to $6 a head in 2017. More
packer capacity will help hog prices in 2017. In addition,
retail pork prices are expected to continue to drop and
provide stronger domestic usage, and pork exports are
expected to grow in 2017 as well.
Nevertheless, these positive factors will not be enough
to bring the industry back to the breakeven level.
Therefore, the industry will need to consider a reduction
in the breeding herd in the last half of 2017 in order to
boost prices back closer to breakevens in 2018.
Purdue Agricultural Economics Report, December 2016
11 | P a g e
HIGH GRAIN YIELDS CONTRIBUTE TO LOW PRICES
CHRIS HURT, PROFESSOR OF AGRICULTURAL ECONOMICS
High yields were an important part of the story for the
grain sector in 2016. Corn, soybeans and wheat all had
record national yields and corn and soybeans had their
third consecutive year of favorable production.
In the last three years, U.S. production has outpaced
usage for corn, soybeans, and wheat. This means that end
of year inventory levels have steadily increased. In fact,
the stocks-to-use percentage for wheat is expected to be
at the highest level in 30 years. Corn and soybean stocks-
to-use percentages are the highest in a decade.
Abundant inventories of grains and soybeans mean low
prices. Wheat prices for the 2016 crop are expected to
be at $3.70 per bushel, the lowest level since the 2005
crop. Corn and soybean prices for the 2016 crop are
expected to be at the lowest level since the 2006 crops.
All three are reflecting decade-low prices. Unfortunately,
costs of production have not nearly dropped back to the
levels they were a decade ago, so margins for the 2016
crops will be narrow or even negative for many
producers.
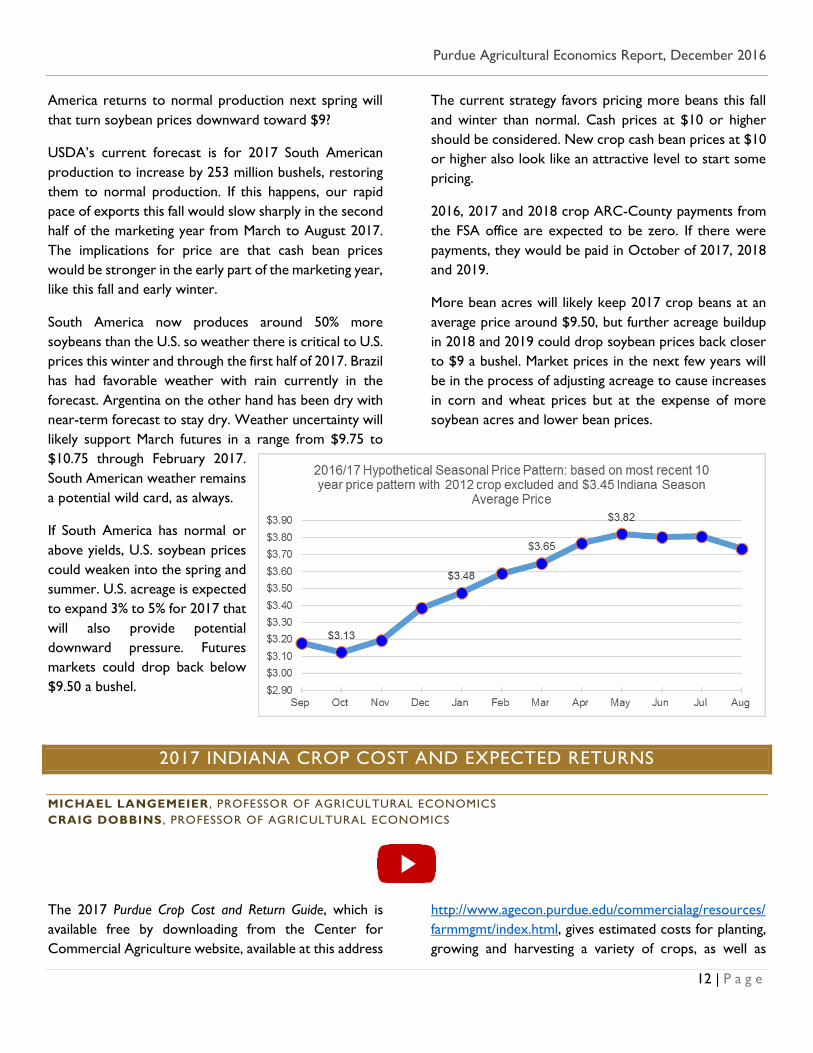
Corn prices received by Indiana farmers are expected to
average $3.45 a bushel. This is down from $3.85 a bushel
for the 2015 crop. The visual provides a hypothetical
seasonal price pattern if Indiana prices follow a typical
pattern of the past 10 years (without the 2012 crop) and
average $3.45. That has January prices around $3.50 and
reaching $3.70 to $3.80 in the spring or early summer.
If this were to be the price pattern, then storage into the
late spring would be favorable for corn in commercial
storage and especially on-farm storage. The goal is to
acquire as much of the return to storage as possible.
Keep in mind that these prices are averages for the state
and they assume that current information does not
change. Of course location has an impact on price levels,
and new information can have an impact as well. As an
example, a weather concern in South America’s major
corn production region might provide opportunities for
cash prices to rise closer to $4 or higher.
Corn acreage is expected to drop in 2017 as returns to
soybeans are expected to be more favorable. Thus for
the 2017 corn crop, the average p rice received by
Indiana farmers is expected to be about $3.75 a bushel.
Small additional price increases are currently expected
for the 2018 and 2019 crops.
2016 crop ARC-County payments in Indiana are
currently expected to be about $40 per corn base acre
before sequestration. These would be payable in
October 2017. The exact payments cannot be calculated
until October 2017, so payment levels remain uncertain.
In addition, my estimate is for the entire state (on
average) so individual counties could be sharply different.
At this point 2017 and 2018 ARC-County corn payments
are expected to be zero. If there were payments from
these crops, they would be made in October 2018 and
2019.
The soybean situation is different from corn and is
providing stronger prices as compared to corn. The
primary reason is the reduced production in South
America at the end of their growing season last spring
when production fell about 220 million bushels short of
expectations. Many of those bushels were destined for
the export market, and world buyers instead came to the
U.S. for those soybeans this past summer. USDA revised
the U.S. exports of soybeans upward by about 200 million
bushels after May 2016. The pace of soybean exports has
been robust this fall and the primary reason prices have
been able to be above $10 per bushel.
Cash soybean prices in Indiana were at the higher $8 per
bushel level prior to the unfavorable weather in South
America. This causes us to ask the question, “If South
Purdue Agricultural Economics Report, December 2016
12 | P a g e
America returns to normal production next spring will
that turn soybean prices downward toward $9?
USDA’s current forecast is for 2017 South American
production to increase by 253 million bushels, restoring
them to normal production. If this happens, our rapid
pace of exports this fall would slow sharply in the second
half of the marketing year from March to August 2017.
The implications for price are that cash bean prices
would be stronger in the early part of the marketing year,
like this fall and early winter.
South America now produces around 50% more
soybeans than the U.S. so weather there is critical to U.S.
prices this winter and through the first half of 2017. Brazil
has had favorable weather with rain currently in the
forecast. Argentina on the other hand has been dry with
near-term forecast to stay dry. Weather uncertainty will
likely support March futures in a range from $9.75 to
$10.75 through February 2017.
South American weather remains
a potential wild card, as always.
If South America has normal or
above yields, U.S. soybean prices
could weaken into the spring and
summer. U.S. acreage is expected
to expand 3% to 5% for 2017 that
will also provide potential
downward pressure. Futures
markets could drop back below
$9.50 a bushel.
The current strategy favors pricing more beans this fall
and winter than normal. Cash prices at $10 or higher
should be considered. New crop cash bean prices at $10
or higher also look like an attractive level to start some
pricing.
2016, 2017 and 2018 crop ARC-County payments from
the FSA office are expected to be zero. If there were
payments, they would be paid in October of 2017, 2018
and 2019.
More bean acres will likely keep 2017 crop beans at an
average price around $9.50, but further acreage buildup
in 2018 and 2019 could drop soybean prices back closer
to $9 a bushel. Market prices in the next few years will
be in the process of adjusting acreage to cause increases
in corn and wheat prices but at the expense of more
soybean acres and lower bean prices.
2017 INDIANA CROP COST AND EXPECTED RETURNS
MICHAEL LANGEMEIER , PROFESSOR OF AGRICULTURAL ECONOMICS
CRAIG DOBBINS , PROFESSOR OF AGRICULTURAL ECONOMICS
The 2017 Purdue Crop Cost and Return Guide, which is
available free by downloading from the Center for
Commercial Agriculture website, available at this address
http://www.agecon.purdue.edu/commercialag/resources/
farmmgmt/index.html, gives estimated costs for planting,
growing and harvesting a variety of crops, as well as
Purdue Agricultural Economics Report, December 2016
13 | P a g e
estimated contribution margins and earnings. The guide
is updated frequently as grain futures prices change and
the costs of inputs, such as seed, fertilizer, pesticides and
fuel, fluctuate. This paper discusses estimates made in
October 2016.
The guide presents cost and return information for low,
average, and high productivity soils. The discussion in this
article will focus on the estimates for average
productivity soil only. Table 1 presents crop budget
information for continuous corn, rotation corn, rotation
soybeans, wheat, and double-crop soybeans for average
productivity soil. Double-crop soybeans are typically
planted after wheat so it is typical to combine the
contribution margin for these two crops when
comparing to continuous corn, rotation corn, and
rotation soybeans. It is important to note that crop yields
have been modified in this year’s guide. The current yield
estimates reflect trend yields for Indiana for each crop.
The contribution margin, obtained by subtracting total
variable cost from market revenue, ranges from $156 per
acre for continuous corn to $293 per acre for wheat plus
double-crop soybeans. The contribution margins for
rotation corn and rotation soybeans on average
productivity soil are $211 and $261 per acre,
respectively. It is important to
note that the contribution
margin is used to cover
overhead costs such as
machinery costs, family and
hired labor, and land rent.
Failure to cover these
overhead costs typically puts
downward pressure on cash
rents.
From 2010 to 2013, the
contribution margin for
rotation corn was higher than
the contribution margin for
rotation soybeans. The
average difference in the
contribution margin was
approximately $50 per acre
during this period. However,
since 2014, the average difference in the contribution
margin has been an advantage to soybeans of about $80
per acre. The higher contribution margin for rotation
soybeans in 2017 versus rotation corn as shown in Table
1, is expected to encourage some shifting of acres from
corn to soybeans.
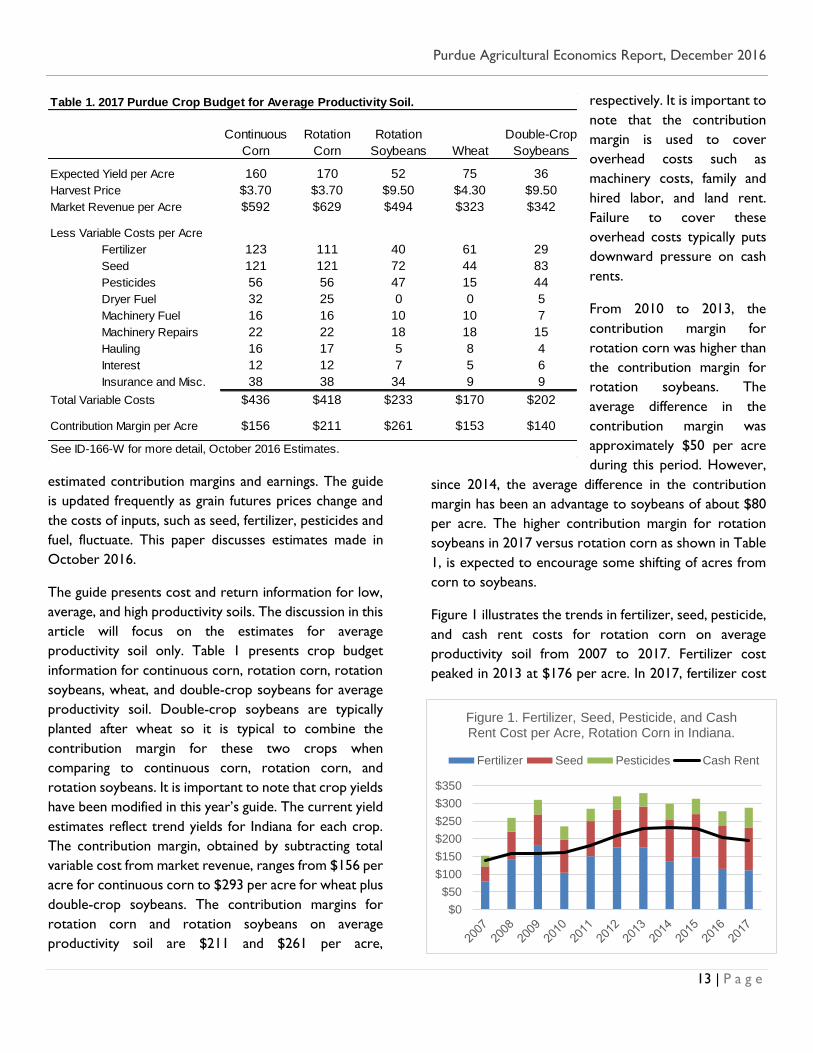
Figure 1 illustrates the trends in fertilizer, seed, pesticide,
and cash rent costs for rotation corn on average
productivity soil from 2007 to 2017. Fertilizer cost
peaked in 2013 at $176 per acre. In 2017, fertilizer cost
Table 1. 2017 Purdue Crop Budget for Average Productivity Soil.
Continuous Rotation Rotation Double-Crop
Corn Corn Soybeans Wheat Soybeans
Expected Yield per Acre 160 170 52 75 36
Harvest Price $3.70 $3.70 $9.50 $4.30 $9.50
Market Revenue per Acre $592 $629 $494 $323 $342
Less Variable Costs per Acre
Fertilizer 123 111 40 61 29
Seed 121 121 72 44 83
Pesticides 56 56 47 15 44
Dryer Fuel 32 25 0 0 5
Machinery Fuel 16 16 10 10 7
Machinery Repairs 22 22 18 18 15
Hauling 16 17 5 8 4
Interest 12 12 7 5 6
Insurance and Misc. 38 38 34 9 9
Total Variable Costs $436 $418 $233 $170 $202
Contribution Margin per Acre $156 $211 $261 $153 $140
See ID-166-W for more detail, October 2016 Estimates.
$0
$50
$100
$150
$200
$250
$300
$350
Figure 1. Fertilizer, Seed, Pesticide, and Cash Rent Cost per Acre, Rotation Corn in Indiana.
Fertilizer Seed Pesticides Cash Rent
Purdue Agricultural Economics Report, December 2016
14 | P a g e
per acre is projected to be $111 per acre. Cash rent per
acre peaked in 2014 at $232 per acre at $194 per acre,
2017 projected cash rent is approximately $40 per acre
lower than it was at the peak in 2014. Pesticide cost per
acre in 2017 are expected to be higher
than in 2013 and 2014, this is partially
due to resistant weed problems.
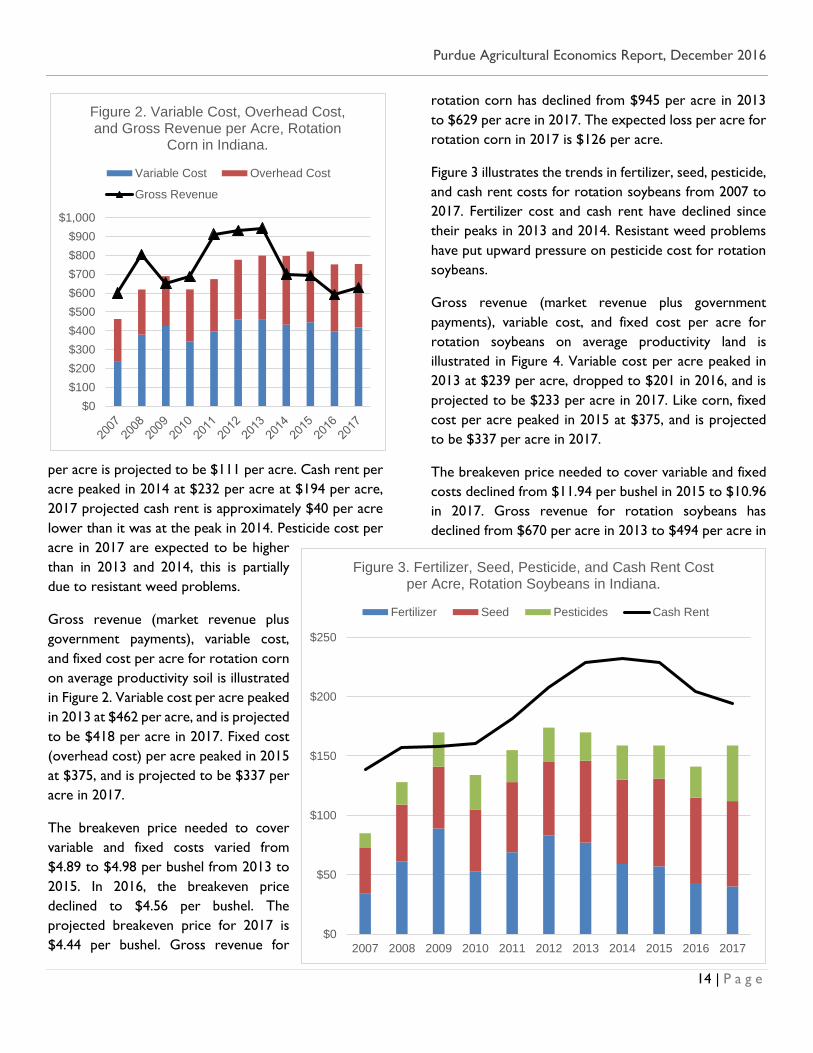
Gross revenue (market revenue plus
government payments), variable cost,
and fixed cost per acre for rotation corn
on average productivity soil is illustrated
in Figure 2. Variable cost per acre peaked
in 2013 at $462 per acre, and is projected
to be $418 per acre in 2017. Fixed cost
(overhead cost) per acre peaked in 2015
at $375, and is projected to be $337 per
acre in 2017.
The breakeven price needed to cover
variable and fixed costs varied from
$4.89 to $4.98 per bushel from 2013 to
2015. In 2016, the breakeven price
declined to $4.56 per bushel. The
projected breakeven price for 2017 is
$4.44 per bushel. Gross revenue for
rotation corn has declined from $945 per acre in 2013
to $629 per acre in 2017. The expected loss per acre for
rotation corn in 2017 is $126 per acre.
Figure 3 illustrates the trends in fertilizer, seed, pesticide,
and cash rent costs for rotation soybeans from 2007 to
2017. Fertilizer cost and cash rent have declined since
their peaks in 2013 and 2014. Resistant weed problems
have put upward pressure on pesticide cost for rotation
soybeans.
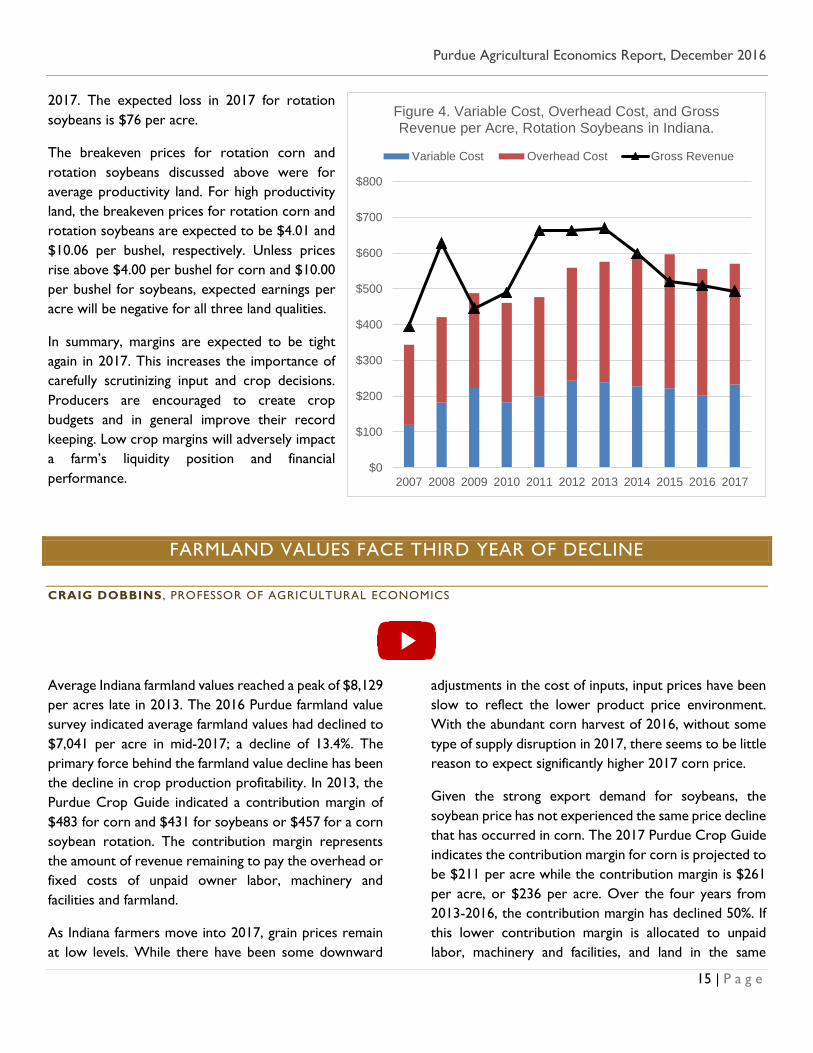
Gross revenue (market revenue plus government
payments), variable cost, and fixed cost per acre for
rotation soybeans on average productivity land is
illustrated in Figure 4. Variable cost per acre peaked in
2013 at $239 per acre, dropped to $201 in 2016, and is
projected to be $233 per acre in 2017. Like corn, fixed
cost per acre peaked in 2015 at $375, and is projected
to be $337 per acre in 2017.
The breakeven price needed to cover variable and fixed
costs declined from $11.94 per bushel in 2015 to $10.96
in 2017. Gross revenue for rotation soybeans has
declined from $670 per acre in 2013 to $494 per acre in
$0
$100
$200
$300
$400
$500
$600
$700
$800
$900
$1,000
Figure 2. Variable Cost, Overhead Cost, and Gross Revenue per Acre, Rotation
Corn in Indiana.
Variable Cost Overhead Cost
Gross Revenue
$0
$50
$100
$150
$200
$250
2007 2008 2009 2010 2011 2012 2013 2014 2015 2016 2017
Figure 3. Fertilizer, Seed, Pesticide, and Cash Rent Cost per Acre, Rotation Soybeans in Indiana.
Fertilizer Seed Pesticides Cash Rent
Purdue Agricultural Economics Report, December 2016
15 | P a g e
2017. The expected loss in 2017 for rotation
soybeans is $76 per acre.
The breakeven prices for rotation corn and
rotation soybeans discussed above were for
average productivity land. For high productivity
land, the breakeven prices for rotation corn and
rotation soybeans are expected to be $4.01 and
$10.06 per bushel, respectively. Unless prices
rise above $4.00 per bushel for corn and $10.00
per bushel for soybeans, expected earnings per
acre will be negative for all three land qualities.
In summary, margins are expected to be tight
again in 2017. This increases the importance of
carefully scrutinizing input and crop decisions.
Producers are encouraged to create crop
budgets and in general improve their record
keeping. Low crop margins will adversely impact
a farm’s liquidity position and financial
performance.
FARMLAND VALUES FACE THIRD YEAR OF DECLINE
CRAIG DOBBINS , PROFESSOR OF AGRICULTURAL ECONOMICS
Average Indiana farmland values reached a peak of $8,129
per acres late in 2013. The 2016 Purdue farmland value
survey indicated average farmland values had declined to
$7,041 per acre in mid-2017; a decline of 13.4%. The
primary force behind the farmland value decline has been
the decline in crop production profitability. In 2013, the
Purdue Crop Guide indicated a contribution margin of
$483 for corn and $431 for soybeans or $457 for a corn
soybean rotation. The contribution margin represents
the amount of revenue remaining to pay the overhead or
fixed costs of unpaid owner labor, machinery and
facilities and farmland.
As Indiana farmers move into 2017, grain prices remain
at low levels. While there have been some downward
adjustments in the cost of inputs, input prices have been
slow to reflect the lower product price environment.
With the abundant corn harvest of 2016, without some
type of supply disruption in 2017, there seems to be little
reason to expect significantly higher 2017 corn price.
Given the strong export demand for soybeans, the
soybean price has not experienced the same price decline
that has occurred in corn. The 2017 Purdue Crop Guide
indicates the contribution margin for corn is projected to
be $211 per acre while the contribution margin is $261
per acre, or $236 per acre. Over the four years from
2013-2016, the contribution margin has declined 50%. If
this lower contribution margin is allocated to unpaid
labor, machinery and facilities, and land in the same
$0
$100
$200
$300
$400
$500
$600
$700
$800
2007 2008 2009 2010 2011 2012 2013 2014 2015 2016 2017
Figure 4. Variable Cost, Overhead Cost, and Gross Revenue per Acre, Rotation Soybeans in Indiana.
Variable Cost Overhead Cost Gross Revenue
Purdue Agricultural Economics Report, December 2016
16 | P a g e
proportions as 2013, these payments would be 50% less.
Capital asset pricing theory indicates that if the amount
of long-term income generated by a capital asset is
reduced by 50% then the assets price will decline by 50%,
if other factors stay the same.
While the margin from crop production is strongly
negative, there are several other factors that influence
farmland values. Most of these factors are positive. First,
long run interest rates continue to be at historically low
levels. Increases in interest rates have been expected for
a number of years, but they have not occurred, at least
not yet. The supply of land being brought to market
continues to be in balance with the demand. Both sales
and purchases have declined.
One of the important dynamics of the farmland market
in the 1980s was the excess supply of farmland on the
market. Farmland is still viewed as a good investment for
those looking to diversify their portfolios. Inflation
expectations also remain low. Low expectations about
future inflation contributes to low long-term interest
rates. Finally, there are still buyers in a strong cash
position, but fewer are likely to be farmers. On the
negative side, the current farm policy is not as supportive
of farmland values as prior policies. There are currently
no expected policy support payments associated with the
2017 crops for corn or soybeans. Prior policies would
likely be providing significant support payments in this
price environment rather than none.
Current low grain prices continue to set a negative tone
for farmland values. While there are several positive
forces in the farmland market, these positive factors are
overridden by low farm commodity prices and narrow
contribution margins. Producers continue to look for
ways to lower the per bushel direct and fixed costs of
producing corn and soybeans. Futures prices indicate a
rise in the price of corn for 2018 and 2019, but a
decline in the price of soybeans. With the continued
tight margin situation, farmland value declines are
expected to continue. For 2017, it seems likely that
farmland values may decline another 5% to 10%.
CASH RENTS TO DROP IN 2017
CRAIG DOBBINS , PROFESSOR OF AGRICULTURAL ECONOMICS
In the farmland market, the adjustment in market value
can be a slow process because the value of farmland is
not only influenced by current conditions but also by
expected future conditions. Initially a sharp downturn in
the profitability of crop production may be viewed as a
temporary event. While evidence is collected on the
likelihood that the future will be a lower profit
environment, values hold steady. As buyers adjust their
expectations about future profitability, farmland values
will begin to decline.
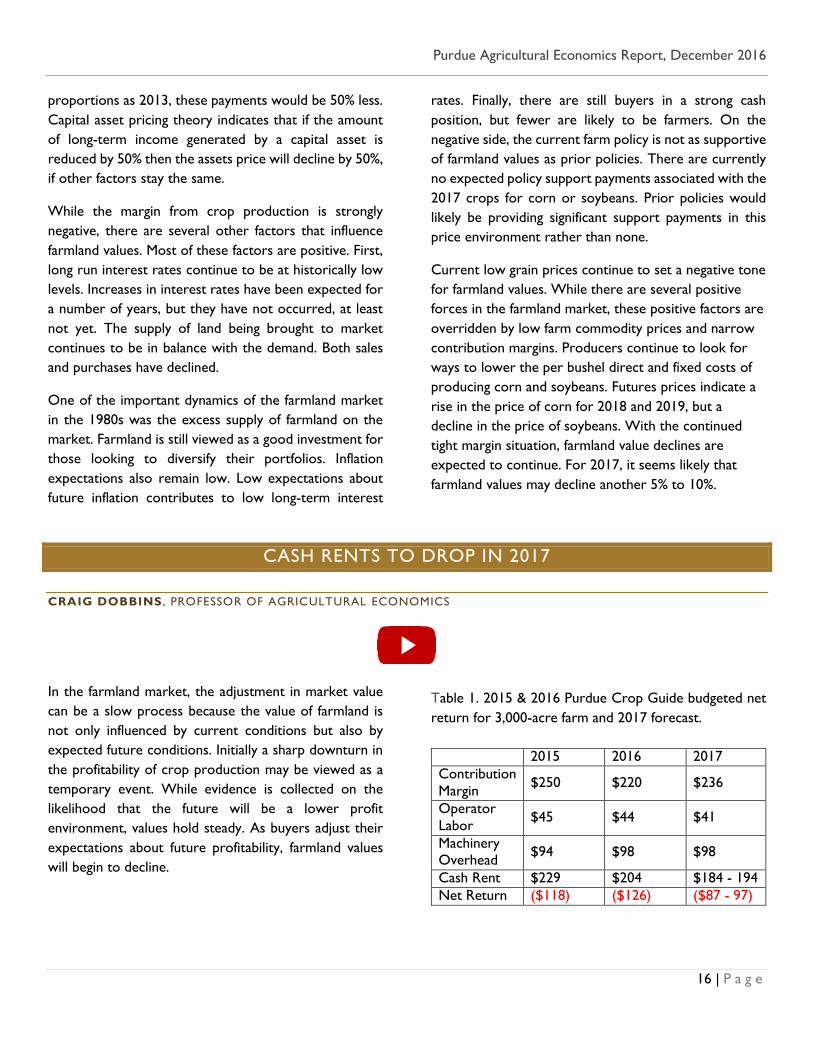
Table 1. 2015 & 2016 Purdue Crop Guide budgeted net
return for 3,000-acre farm and 2017 forecast.
2015 2016 2017
Contribution
Margin $250 $220 $236
Operator
Labor $45 $44 $41
Machinery
Overhead $94 $98 $98
Cash Rent $229 $204 $184 - 194
Net Return ($118) ($126) ($87 - 97)
Purdue Agricultural Economics Report, December 2016
17 | P a g e
As with Indiana farmland values, current and expected
future profitability in grain production is an important
force in the farmland rental market. However, if the cash
rent being paid by the operator is too high, this situation
can quickly erode the working capital position of the
business. As a result, it is important that operators are
able to make adjustments in production costs, including
cash rent, in a reasonable period.
The Purdue Crop Guide contribution margin, the margin
remaining to pay overhead costs of operator labor,
machinery, and cash rent from a corn and soybean
rotation, for 2015, 2016, and 2017 are estimated to be
$250, $220 and $236 per acre, respectively. Cash rents
from the Purdue Farmland Value Survey for average
farmland during 2015, and 2016 were $229, and $204 per
acre. Subtracting the cash rent from the contribution
margin in 2015 and 2016 leaves $21 and $16 per acre to
pay for operator labor and machinery overhead. The
Purdue Crop Guide estimates operator labor expense to
be $45 per acre in 2015 and $44 per acre in 2016.
Machinery overhead for a 3,000-acre farm was estimated
to be $94 in 2015 and $98 in 2016. Subtracting these
expenses from the contribution margin results in a
negative net return of $118 in 2015 and $126 in 2016.
These budgets indicate that there is not enough income
to cover total production and overhead costs.
These losses have motivated operators to attempt to
lower the cost of producing crops. Declines in the price
of fertilizer and fuel prices have helped. Reducing the use
of seed traits, lowering seeding rates, cutting back on
fertilizer rates, reducing the application of crop
protection products, reducing family living expenses and
working to reduce cash rents are all things being tried to
lower the per bushel cost of corn and soybean
production.
These losses also indicate more work needs to be done
to lower total production costs. It is expected that on
average cash rents in 2017 are likely to decline by 5% to
10%. If these cost and return projections become reality,
the 2017 net return loss will be $39 - $49 per acre less.
It would also be the second year of a 5% or larger
reduction in cash rent; the first time since the 1980s to
have cash rent reductions this large in consecutive years.
The budget numbers presented do not represent a
specific farm. In the current environment it is important
to know what numbers represent your situation in order
to establish an equable cash rent. In the current
economic environment, contribution margins (revenues
minus direct costs) are small. If cash rent is less than the
contribution margin, the difference that remains helps to
pay overhead costs. The loss minimization strategy would
be to continue farming the farm. On the other hand, if
the cash rent is more than the contribution margin, there
is no positive contribution associated with renting the
land. In this case, the loss minimization strategy is to stop
renting the farm.
FINANCIAL OUTLOOK CONTINUES TO WEAKEN
MICHAEL BOEHLJE, PROFESSOR OF AGRICULTURAL ECONOMICS
MICHAEL LANGEMEIER, PROFESSOR OF AGRICULTURAL ECONOMICS
U.S. net farm income is projected to drop approximately
17% in 2016 according to USDA. Incomes are expected
to be lower for both crop and livestock farmers in 2016
compared to 2015. Farm asset values in the U.S. are
projected to fall approximately 2% in 2016, and farm debt
is projected to increase approximately 5%. The drop in
farm income and corresponding increase in farm debt will
put additional pressure on working capital. Surveys from
the Federal Reserve Banks indicate that land values in the
Purdue Agricultural Economics Report, December 2016
18 | P a g e
Corn Belt continue to show softer values, and debt
servicing challenges are increasing.
Let’s now turn to prospects for farm income and the
financial challenges for Indiana crop producers for the
upcoming year. Using the 2017 Purdue Crop Cost &
Return Guide, the contribution margin for rotation corn
and rotation soybeans on average productivity land is
projected to be $211 and $261 per acre, respectively, in
2017. Government payments per acre for the 2017 crop
year are projected to be zero. Government payments for
the 2016 crop year, which will be paid in the fall of 2017,
are likely to be considerably smaller than those for the
2015 crop year, and are a very sensitive to changes in
crop prices during the next few months. The payments
for the 2016 crop year will also be impacted by 2016
county crop yields.
The contribution margin is used to cover machinery
ownership costs, operator and hired labor, and cash rent
and land ownership costs. These costs are often referred
to as overhead costs or fixed costs. For average
productivity land, overhead costs for 2017 are projected
to be $333 per acre. After subtracting overhead costs
from the contribution margins for corn and soybeans, the
earnings per acre for a corn/soybean rotation in 2017 is
projected to be a negative $96 per acre. This is the fourth
year in a row for which budgeted earnings per acre were
projected to be negative. Though actual earnings have
differed from budgeted earnings for the last three years,
actual earnings were negative in each year since 2014.
Low earnings will put pressure on working capital. A
commonly used benchmark for the working capital to
value of farm production is 35% or higher. The median
value for Illinois FBFM farms was 52% in 2014, dropping
to 45% in 2015. Even if the working capital to value of
farm production declined another 7 percentage points in
2016, the average farm will still be above the 35%
benchmark. However, Illinois FBFM farms in the lower
quartile had an average value of just 9% in 2015. These
farms will have very little maneuvering room to deal with
low earnings in 2016 and again in 2017.
What about the longer term – when will this downturn
end and farmers’ incomes improve. No one knows for
sure, but three studies at Purdue provide some useful
insight. The first looks at the farm safety net and its
effectiveness in buffering crop farmers from the
downturn – the farm commodity program through FSA
and crop insurance.
The majority of Midwest corn and soybean farmers chose
the Agricultural Revenue Coverage – County Option
(ARC-CO) farm program option that in essence provides
a payment per base acre of corn and soybeans that
depends on the level of yields and prices. The crop
insurance program provides an indemnity payment to
farmers if prices and/or yields decline, depending on the
program and coverage level chosen. The most common
program choice is revenue protection (RP) which buffers
gross revenue from price and/or yield reductions –
coverage level choices range from 50% to 85% of market
revenue.
$393$422 $427
$565
$619
$575
$628
$729$755
$740 $740
$672 $683$663 $650
$435
$601$624
$581
$728
$794$824
$769
$657
$592 $620$605 $616
$642
$350
$400
$450
$500
$550
$600
$650
$700
$750
$800
$850
2005 2006 2007 2008 2009 2010 2011 2012 2013 2014 2015 2016 2017 2018 2019
Estimated Revenue and Costs/Acre on a 50/50 Corn/Soybean Farm on Average Quality Indiana Land
Cost/Acre Revenue
Purdue Agricultural Economics Report, December 2016
19 | P a g e
When the crop insurance and farm programs were
initiated, it was anticipated that they would provide an
effective safety net for farmers who might encounter
significant price and/or yield reductions due to changing
market conditions or weather/disease events. But crop
insurance indemnities adjust to market conditions over
time. If prices systematically decline, the potential
indemnity also declines. Farm program payments under
the ARC-CO program are capped, and the level of
support declines as market prices increase.
Budgeting analysis using price forecasts from FAPRI, and
trend yields from WASDE for a 50/50 corn/soybean
rotation on a White County case farm indicate that ARC-
CO payments and crop insurance implements are
projected to be zero or less than $10 per acre for even
a low price scenario in 2017 and 2018. Given that
government program payments account for almost 20%
of the expected net farm income in 2016, these numbers
suggest that the government safety net is not going to be
a very effective buffer from the downturn in the longer
run.
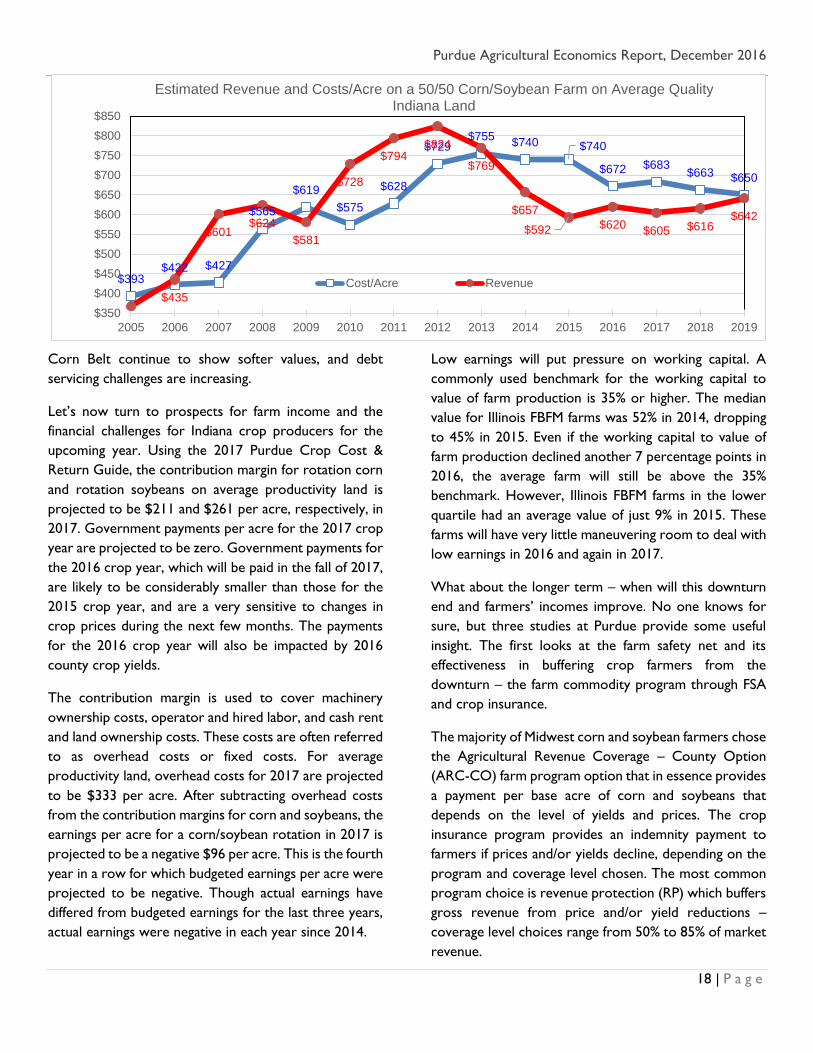
The second study uses budgeted data to project
expected cost and returns per acre for a 50/50
corn/soybean rotation on average quality land in Indiana.
A summary of this analysis is presented in the figure. The
base assumptions for costs, prices and yields for these
estimates come from Purdue University budgets for past
years; and projections of trend yields, prices as reflected
in futures markets and a 5% per year reduction in costs
for future years. The bottom line of this analysis is that
crop costs are expected to exceed revenues in 2017 and
2018, and then crop farmers have the potential to see
costs and revenues back in balance by 2019. But notice a
very important take-way – positive incomes in the longer
run will primarily result from cost reductions rather than
yield or price increases based on these current
projections.
A third study looks at the financial vulnerability of
farmers using a broader set of financial measurements
than income. The focus of this study was to assess the
financial performance of illustrative Midwest grain farms
with different size, tenure status, and capital structures
over a three-year period under the shocks of volatile
crop prices, fertilizer prices, farmland values and cash
rent.
These “stress test” results suggest that the financial
vulnerability and resiliency of Midwest grain farms to
price, cost, yield and asset value shocks are, not
surprisingly, dependent on their size, tenure and leverage
positions. Farms with modest size (i.e. 550 acres) and a
large proportion of their land rented are very vulnerable
irrespective of their leverage positions unless they have
significant income from off-farm sources. These same
modest size farms are more financially resilient if they
have a higher proportion of their acreage that is owned
rather than rented.
Larger size farms (2500 acres) with modest leverage
(25% debt-to-asset ratio) that combine rental and
ownership of the land they operate have relatively strong
financial performance and limited vulnerability to price,
cost, yield and asset value shocks. In addition, these farms
can increase their leverage positions significantly (from
25% to 50% in this study) with only modest deterioration
in their financial performance and a slight increase in their
vulnerability.
These results suggest that farmers are resilient to price,
cost, yield and asset value shocks because of the current
low use of debt in the industry (currently a 13% debt-to-
asset ratio for the farming sector) does not adequately
recognize the financial vulnerable of many typical family
farms to those shocks. Not nearly as many farmers are
expected to face bankruptcy compared to the 1980s
bust, but many will still face cash flow and debt servicing
problems and will need to make major adjustments to
reduce their costs or extend their loan repayment terms.
References:
Illinois Farm Business Farm Management. “Financial Benchmarks.”
http://farmdoc.illinois.edu/finance/benchmarks.asp
Langemeier, M. and M. Boehlje. “An Update on the Farm Safety
Net.” Farmdoc daily (6): 190, Department of Agricultural and
Consumer Economics, University of Illinois at Urbana-Champaign,
October 7, 2016.
Boehlje, M. and Li, S. “Financial Vulnerability of Midwestern Grain
Farms: Implications of Price, Yield, and Cost Shocks.” Forthcoming
in the Journal of Applied Farm Economics.
Purdue Agricultural Economics Report, December 2016
20 | P a g e
CONTRIBUTORS
Chris Hurt, PAER Editor and Professor of Agricultural Economics
Craig Dobbins, Professor of Agricultural Economics
Larry DeBoer, Professor of Agricultural Economics
Philip Abbott, Professor of Agricultural Economics
Ken Foster, Professor of Agricultural Economics and Department Head
Michael R. Langemeier, Professor of Agricultural Economics
James Mintert, Professor of Agricultural Economics and Director of the Center for Commercial Agriculture
Michael D. Boehlje, Professor of Agricultural Economics
Michael Shutz, Professor of Animal Sciences
Nicole Widmar, Associate Professor of Agricultural Economics
Jessica Eise, Director of Communications of the Department of Agricultural Economics
PURDUE UNIVERSITY
It is the policy of Purdue University that all persons have equal opportunity and access to its educational programs,
services, activities, and facilities without regard to race, religion, color, sex, age, national origin or ancestry, marital
status, parental status, sexual orientation, disability or status as a veteran.
Purdue University is an Affirmative Action institution.
This material may be available in alternative formats.