Embed Size (px)
Citation preview

Pupil Performance and Age
A Study of Promotion, Repetition, and Dropout Rates among Pupils in Four Age Groups in 35 Developing Countries
EPDC Working Paper No. EPDC-09-02
Winter 2009
EDUCATION POLICY AND DATA CENTERMaking sense of data to improve education
Arushi TerwayBrian DooleyAnne Smiley
Access to education and patterns of non-attendance
MOST VULNERABLE CHILDREN IN
In 2011, FHI acquired the programs, assets, and expertise of AED.

Pupil Performance and Age: A Study of Promotion, Repetition, and Dropout Rates among Pupils in Four Age Groups in 35 Developing Countries
EPDC Working Paper No. WP-09-02
Pupil Performance and Age A Study of Promotion, Repetition, and Dropout Rates among Pupils in Four Age Groups in 35 Developing Countries ‡
ABSTRACT In recent years, many school systems have increased gross intake rates and come closer to meeting Education for All goals. One side effect of this increase is larger numbers of overage pupils in primary and secondary school. This study uses household survey data from 35 countries to measure the extent and effects of school attendance by overage pupils. The study finds that in the lower grades of primary school, older pupils generally outperform younger ones. Younger pupils are far more likely to repeat grades than older pupils. There are particularly high repetition rates of underage pupils in first grade; these suggest there is an unmet need for kindergarten facilities. In higher grades of primary school and in all grades of secondary school, older pupils are less likely to be promoted and more likely to drop out of school, resulting in lower survival rates than those of younger pupils. The two most important policy implications of this study are: 1) the unmet need for education facilities for younger children should be met, and 2) there is need for special focus on older pupils in higher grades to ensure that they remain in school.
The Education Policy and Data Center (EPDC), a partnership of FHI 360 and the US Agency for International Development, was founded in 2004 to contribute to better education policy making and planning through improved access to and use of data and analysis. For more information, see www.epdc.org.
‡ This report has been prepared by the Education Policy and Data Center (EPDC) from a series of studies commissioned by the GMR as background to the 2009 EFA Global Monitoring Report.
Working papers disseminated by the EPDC reflect ongoing research and have received limited review. Views or opinions expressed herein do not necessarily reflect the policy or views of FHI 360 or of any of the EPDC sponsors.
W I N T E R 2 0 0 9 1

Pupil Performance and Age: A Study of Promotion, Repetition, and Dropout Rates among Pupils in Four Age Groups in 35 Developing Countries
EPDC Working Paper No. WP-09-02
BACKGROUND
Over attendance is widespread in developing countries. According to one common measure of overage pupils, in 2005 in 20% of countries, more than 20% of primary pupils were overage. In fact, this number underestimates the extent of overage attendance because it only measures the proportion of children attending primary school who are older than the highest primary school age. It does not include the many children who are overage for their grade but still fall within the range of primary school children – all the
first graders who are 9, 10, and 11 years old, for example. Grade and age-specific data for 2004 from UIS show that in 40% of 74 developing countries with available data, 20%-61% of the pupils are registered as two or more years older than the official age for their grade. The EPDC background report to the GMR 2008 (EPDC, 2007b:58) shows that overage attendance increased in many Sub-Saharan African countries in the past decade, while it declined in countries in other regions.
Figure 1. Change in GIR and change in overage entry in 60 developing countries from 2000-2006.
-30
-20
-10
0
10
20
30
-100 -50 0 50 100
Change in gross intake 2000-2006
Cha
nge
in n
et o
ver-
age
inta
ke 0
0-06
In those countries where primary intake increased since 2000, it appears that overage school intake also increased, perhaps partly as a result. Figure 1 shows that there is some correlation between change in the gross intake rate (GIR) and the proportion of overage entrants from 1999-2006 in 60 developing countries. Thus, at least in some countries, the issue of overage students may be getting more pronounced. Overage pupils are a group with unique needs. Overage pupils are more likely to be from disadvantaged groups (UNESCO, 2006:26), and
they also have different interests and responsibilities than their official-age peers. There is already some evidence to support the belief that overage pupils have higher repetition and drop-out rates than official age pupils (UNESCO, 2007:43; Cameron, 2005; Mendelson and Roberts, 1996; Wils, 2004). Because the incidence of overage attendance is widespread, and because it is believed that overage pupils have higher than average repetition and drop-out rates, it is worth investigating impacts of pupil age on school performance more carefully.
W I N T E R 2 0 0 9 2

Pupil Performance and Age: A Study of Promotion, Repetition, and Dropout Rates among Pupils in Four Age Groups in 35 Developing Countries
EPDC Working Paper No. WP-09-02
DATA
The data for this study are from 35 Demographic and Health Surveys (DHS). The data from DHS surveys can be used to calculate promotion, repetition and dropout rates of pupils by their age. The surveys used are the most recent ones for which the datasets are available: all are post-2000 surveys. The majority (22) of the surveys represent countries in sub-Saharan Africa; six represent countries in Latin America; four are from Asia, two from Eastern Europe, and one from North Africa. Table 1 lists the datasets used in this study.
Table 1. DHS datasets included in the study. Armenia 2005 Benin 2006 Burkina Faso 2003 Cambodia 2005 Cameroon 2004 Colombia 2005 Congo, Rep. 2005 Dominican Rep. 2002 Egypt 2005 Ethiopia 2005 Ghana 2003 Guinea 2005 Haiti 2005 Honduras 2005 India 2006 Kenya 2003 Lesotho 2004 Madagascar 2004 Malawi 2004 Mali 2001 Moldova 2005 Mozambique 2003 Namibia 2000 Nepal 2006 Nicaragua 2001 Niger 2006 Nigeria 2003 Peru 2005 Philippines 2003 Rwanda 2005 Senegal 2005 Tanzania 2004 Uganda 2006 Zambia 2002 Zimbabwe 2006
Measurement of pupils flows – promotion, repetition, and dropout
The calculation of pupil flows is based on a set of six questions in each DHS survey which, in tandem, can be used to determine the school levels and grades that a pupil attended over a two year period:
• Did you attend school in the previous school year?
o What school level did you attend that year? o Within that level, what grade did you
attend? • Did/Are you attending school in the current
school year o What school level are you attending? o Within that level, what grade are you
attending?
This study analyzes pupils who were in school in the previous school year because it is only for these pupils that flows can be calculated. The flows–promotion, repetition and dropout –are calculated as follows:
Promotion rate grade X: Pupils who were attending grade X+1 or higher in the current year and who attended grade X in the previous year, divided by the pupils who were attending grade X in the previous year.
Repetition rate grade X: Pupils who were attending grade X or a lower grade2 in the current year and who attended grade X in the previous year, divided by the pupils who were attending grade X in the previous year.
Dropout rate grade X: Children who were not attending school in the current year but did attend grade X in the previous year, divided by the pupils who attended grade X in the previous year. This is a broad definition of dropouts, and includes both 1) pupils who dropped out without completing the grade or level they most recently
2 Pupils who repeat to a lower grade are believed to be a very rare observation, although the data extraction files were not written to count these cases.
W I N T E R 2 0 0 9 3

Pupil Performance and Age: A Study of Promotion, Repetition, and Dropout Rates among Pupils in Four Age Groups in 35 Developing Countries
EPDC Working Paper No. WP-09-02
W I N T E R 2 0 0 9 4
attended, and 2) pupils who completed a grade or level but did not move on the next.3
With this definition, pupils who quit school at one of the transition grades, such as the end of primary, basic, mandatory, or lower secondary school, are counted as dropouts – peak dropout rates at these points indicate barriers that prevent pupils from moving on the next level. The study does not extend past the last grade of secondary; so all pupils who report having completed the last grade of secondary4 are classified as ‘promoted’.
Promotion rate last grade secondary school: Pupils who were attending the last grade of secondary school in the previous year and report currently having attained “complete secondary”, divided by the pupils who were attending the last grade of secondary school in the previous year.
Because the study analyzes the pupils who attended school in the previous year for each dataset, New Entrants to the school system in the present year are not considered in this study. A pupil would be classified as a new entrant if they reported not attending school in the previous year, but did attend school in current year.
Relative age groups
To categorize pupils into underage, on-time and overage groups, the concept of relative age is introduced. The relative age of pupils refers to how many years the pupils’ age departs from the official age for their grade. The official ages for each grade are based on UNESCO Institute for Statistics (UIS) definitions. Relative age groupings are designated as follows:
3 For example, in a system where there are five grades of primary, a pupil who completed grade five and graduated from primary school, but did not move on to secondary, would be classified as a ‘dropout’ along with the pupil who withdrew after attending grade five for just one month. 4 From a different set of questions on educational attainment.
Underage: The pupil’s age for the previous year is lower than the official age for the grade they reported attending during the previous year.
On-time: The pupil’s age for the previous year is equal to the official age for the grade they reported attending during the previous year.
One year overage: The pupil’s age for the previous year is one year higher than the official age for grade they reported attending during the previous year.
2+ years overage: The pupil’s age for the previous year is two or more years higher than the official age for grade they reported attending during the previous year.
Note that this definition of overage is overage for grade, as opposed the definition of overage commonly used by UIS and GMR, where the overage pupils in primary are those who are older than the official primary school age range.
Correcting for over-estimation of age due to birthdays between the beginning of school year and interview date A weakness of the data lies in the fact that DHS surveys do not include children’s actual birth-dates. The DHS surveys ask for the household members’ age, in years, at the time of the survey. The DHS surveys do not ask for birth date or age in months because the respondent of the survey may not know exact birthdates. This means that, while it is possible to determine whether a pupil was of the appropriate age for the grade at the time of the interview, it is not possible to be sure if the pupil was of the appropriate age for the grade at the time that they entered the grade, which is problematic because it is the age at the beginning of the school year that is relevant in the classification of a pupil as underage, on-time, or overage. When there is a large interval between the beginning of the school year and the date that a pupil’s age is recorded, there is a greater likelihood that the pupil has had a birthday in the meantime. This could mean, for example, that an underage pupil might be falsely reported as on-time, that an on-time pupil might be falsely reported as one year overage, and so on.
Pupil Performance and Age: A Study of Promotion, Repetition, and Dropout Rates among Pupils in Four Age Groups in 35 Developing Countries
EPDC Working Paper No. WP-09-02
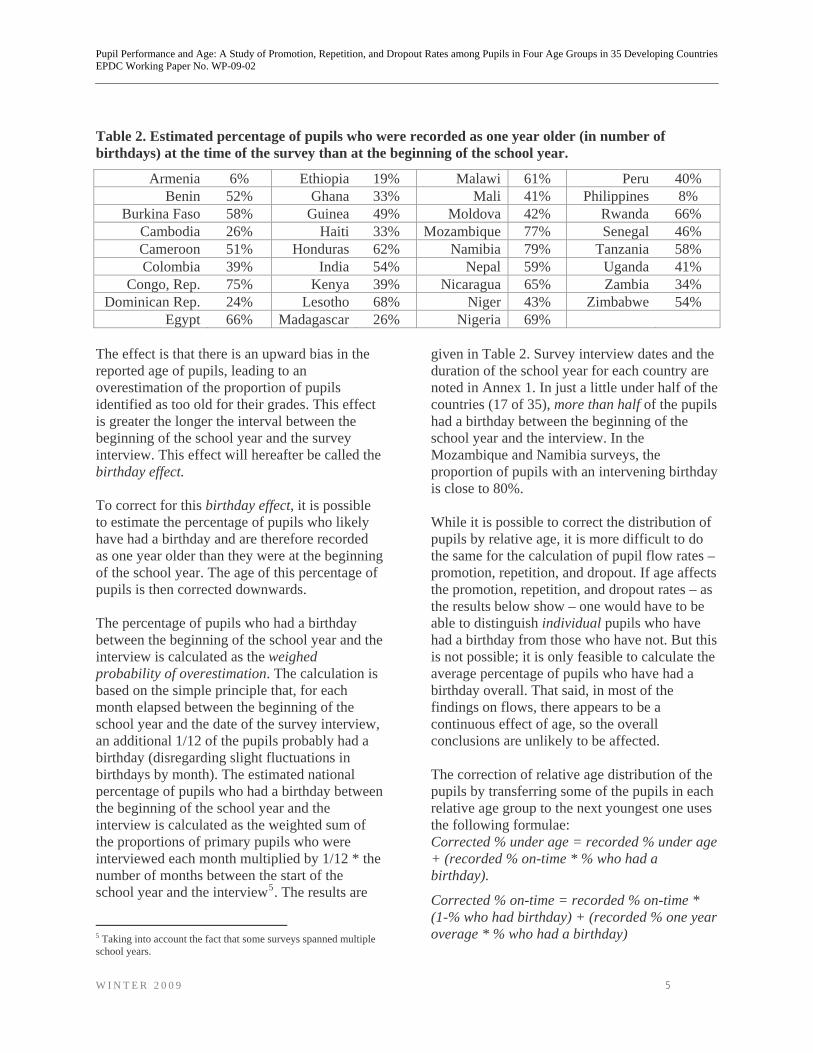
Table 2. Estimated percentage of pupils who were recorded as one year older (in number of birthdays) at the time of the survey than at the beginning of the school year.
Armenia 6% Ethiopia 19% Malawi 61% Peru 40% Benin 52% Ghana 33% Mali 41% Philippines 8%
Burkina Faso 58% Guinea 49% Moldova 42% Rwanda 66% Cambodia 26% Haiti 33% Mozambique 77% Senegal 46% Cameroon 51% Honduras 62% Namibia 79% Tanzania 58% Colombia 39% India 54% Nepal 59% Uganda 41%
Congo, Rep. 75% Kenya 39% Nicaragua 65% Zambia 34% Dominican Rep. 24% Lesotho 68% Niger 43% Zimbabwe 54%
Egypt 66% Madagascar 26% Nigeria 69% The effect is that there is an upward bias in the reported age of pupils, leading to an overestimation of the proportion of pupils identified as too old for their grades. This effect is greater the longer the interval between the beginning of the school year and the survey interview. This effect will hereafter be called the birthday effect. To correct for this birthday effect, it is possible to estimate the percentage of pupils who likely have had a birthday and are therefore recorded as one year older than they were at the beginning of the school year. The age of this percentage of pupils is then corrected downwards. The percentage of pupils who had a birthday between the beginning of the school year and the interview is calculated as the weighed probability of overestimation. The calculation is based on the simple principle that, for each month elapsed between the beginning of the school year and the date of the survey interview, an additional 1/12 of the pupils probably had a birthday (disregarding slight fluctuations in birthdays by month). The estimated national percentage of pupils who had a birthday between the beginning of the school year and the interview is calculated as the weighted sum of the proportions of primary pupils who were interviewed each month multiplied by 1/12 * the number of months between the start of the school year and the interview5. The results are
5 Taking into account the fact that some surveys spanned multiple school years.
given in Table 2. Survey interview dates and the duration of the school year for each country are noted in Annex 1. In just a little under half of the countries (17 of 35), more than half of the pupils had a birthday between the beginning of the school year and the interview. In the Mozambique and Namibia surveys, the proportion of pupils with an intervening birthday is close to 80%. While it is possible to correct the distribution of pupils by relative age, it is more difficult to do the same for the calculation of pupil flow rates – promotion, repetition, and dropout. If age affects the promotion, repetition, and dropout rates – as the results below show – one would have to be able to distinguish individual pupils who have had a birthday from those who have not. But this is not possible; it is only feasible to calculate the average percentage of pupils who have had a birthday overall. That said, in most of the findings on flows, there appears to be a continuous effect of age, so the overall conclusions are unlikely to be affected. The correction of relative age distribution of the pupils by transferring some of the pupils in each relative age group to the next youngest one uses the following formulae: Corrected % under age = recorded % under age + (recorded % on-time * % who had a birthday).
Corrected % on-time = recorded % on-time * (1-% who had birthday) + (recorded % one year overage * % who had a birthday)
W I N T E R 2 0 0 9 5

Pupil Performance and Age: A Study of Promotion, Repetition, and Dropout Rates among Pupils in Four Age Groups in 35 Developing Countries
EPDC Working Paper No. WP-09-02
Corrected % one year overage = recorded % one year overage * (1-% who had birthday) +.5 * (recorded % 2+ years overage * % who had a birthday)
Corrected % 2+ years overage = recorded % one year overage * (1-.5*% who had birthday)
Note that for correcting the 2+ years overage, only half of the pupils are counted as exactly 2 years overage – an educated guess of the proportion of pupils who are this age; the rest are counted as 3+ years overage pupils who do not change relative age groups regardless of when their birthdays occurred.
Defining school grades and levels
The DHS surveys ask for the level and grade of pupils who are attending school. In some surveys, the number of grades in a level according to the DHS dataset differs from the UIS definition. When this occurs, the UIS definition is used to define the grades and school level. If a school system has separate lower and upper secondary programs, these are classified together as ‘secondary.’ The age and grade intervals used in the study are listed in Annex 1.
PREVALENCE OF OVERAGE PUPILS
Distribution of pupils by relative age in primary and secondary school Figure 2 shows the distribution of pupils in primary school and secondary school by relative age in four age categories – underage, on-time, one year overage, and 2+ years overage – arranged in order of the percentage of pupils who are 2+ years overage in primary school. The numbers are corrected for the birthday effect as discussed in the previous section. Although the graphs refer to primary and secondary school overall the relative age of pupils is still determined by age in relation to grade (as discussed above). Pupils who are on-time make up a minority of primary school pupils in most countries in the sample; there is a high prevalence of pupils who
are 2+ years over age, but also sizeable groups of underage and one year overage pupils. The percentage of primary pupils who are 2+ years overage—the primary focus group of this study—ranges from 6% to 73%. Among the 35 countries included in the study, there are only 11 where the percentage of primary-level pupils 2+ years overage is lower than 25% -- Moldova, Egypt, Armenia, Peru, India, Niger, Zimbabwe, Colombia, Burkina Faso, Philippines, and Nicaragua. In five countries, pupils 2+ years overage account for more than half of the primary-level student body – Ghana, Uganda, Ethiopia, Cambodia, Haiti. The bottom graph of Figure 2 shows the percentage of pupils by relative age group for secondary grades, arranged in the same order as for primary grades. Overall, there is a higher proportion of pupils overage for their grade at the secondary level than at the primary level. At the secondary level, only six countries have less than 25% of secondary pupils 2+ years overage – Egypt, Moldova, Armenia, India, Peru, and Zimbabwe. In 12 of 35 countries, pupils 2+ years overage account for more than half of secondary pupils – Madagascar, Benin, Rwanda, Nepal, Guinea, Kenya, Mozambique, Dominican Republic, Ethiopia, Cambodia, Haiti. In 28 of the 35 countries, the proportion of pupils who are 2+ years overage is higher in secondary school than in primary. Among those, in eight countries the difference is significant: between 10 and 18 percentage points. In seven countries, the percentages of pupils 2+ years overage are lower in secondary than in primary – Cambodia, Ethiopia, Ghana, Egypt, Armenia, India, Tanzania. Among these, Tanzania shows the most significant decline – 13 percentage points.
W I N T E R 2 0 0 9 6

Pupil Performance and Age: A Study of Promotion, Repetition, and Dropout Rates among Pupils in Four Age Groups in 35 Developing Countries
EPDC Working Paper No. WP-09-02
W I N T E R 2 0 0 9 7
Figure 2. Percentage of pupils by relative age group, primary school (top graph) and secondary school (bottom graph).
0%
20%
40%
60%
80%
100%Eg
ypt
Mol
dova
Arm
enia
Indi
a
Peru
Zim
babw
e
Col
ombi
a
Phi
lippi
nes
Nic
arag
ua
Nig
er
Tanz
ania
Nig
eria
Burk
ina
Faso
Sene
gal
Hon
dura
s
Con
go, R
ep.
Nam
ibia
Leso
tho
Mal
i
Zam
bia
Cam
eroo
n
Mal
awi
Gha
na
Mad
agas
car
Beni
n
Rw
anda
Nep
al
Gui
nea
Keny
a
Moz
ambi
que
Uga
nda
Dom
inic
an R
ep.
Ethi
opia
Cam
bodi
a
Hai
ti
% s
econ
dary
pup
ils b
y ag
e gr
oup
2+ years overage 1 year overage On-time Underage
0%
20%
40%
60%
80%
100%
Mol
dova
Egy
pt
Arm
enia
Per
u
Indi
a
Nig
er
Zim
babw
e
Col
ombi
a
Burk
ina
Faso
Phi
lippi
nes
Nic
arag
ua Mal
i
Sen
egal
Nam
ibia
Con
go, R
ep.
Nig
eria
Cam
eroo
n
Gui
nea
Ben
in
Zam
bia
Hon
dura
s
Leso
tho
Mal
awi
Rw
anda
Moz
ambi
que
Nep
al
Dom
inic
an R
ep.
Keny
a
Tanz
ania
Mad
agas
car
Gha
na
Uga
nda
Eth
iopi
a
Cam
bodi
a
Hai
ti
% p
rimar
y pu
pils
by
age
grou
p
2+ years overage 1 Year overage On-time Underage
Proportion of pupils overage higher at start of secondary than at start of primary. Another way to show that the proportion of pupils 2+ years overage is greater in higher grades is by comparing the proportions of pupils 2+ years overage in two grades. Figure 3 shows the proportions of pupils 2+ years overage in primary grade 1 and in the first grade of secondary school. Overall, the percentage of overage pupils increases over this grade interval (exceptions are: Egypt, Moldova, and India). In one-third (13 of 35) of the countries in the sample, the percentage of overage pupils increased by more than 10 percentage points
between the first grade of primary and the first grade of secondary. It is likely that overage pupils become more prevalent in later grades as a result of high repetition rates—when a pupil repeats a grade, their age in the second year is one year higher that it was before. As a group, the repeaters contribute to an increase in the population of overage pupils. The prevalence of overage pupils can decline when overage pupils have relatively higher dropout rates. It appears that, in most countries, the effect of repetition is stronger than the effect of selective overage dropout.

Pupil Performance and Age: A Study of Promotion, Repetition, and Dropout Rates among Pupils in Four Age Groups in 35 Developing Countries
EPDC Working Paper No. WP-09-02
Figure 3. Percentage of pupils 2+ years overage in the first grade of primary school and in the first grade of secondary school.
0%
20%
40%
60%
80%
100%Ar
men
iaE
gypt
Mol
dova
Peru
Bur
kina
Zim
babw
eIn
dia
Nig
erC
olom
bia
Mal
iC
ongo
, Rep
.C
amer
oon
Nam
ibia
Sen
egal
Nic
arag
uaPh
ilippi
nes
Nig
eria
Leso
tho
Ben
inG
uine
aR
wan
daM
alaw
iM
ozam
biqu
eZa
mbi
aTa
nzan
iaH
ondu
ras
Uga
nda
Mad
agas
car
Dom
inic
anK
enya
Nep
alG
hana
Cam
bodi
aE
thio
pia
Hai
ti
% P
upils
2+
year
s ov
erag
e
First Grade of Primary First Grade of Secondary
Comparison of the distribution of pupils by age from household surveys and from administrative data Attendance rates from household surveys often differ, at least slightly, from enrolment rates collected via administrative systems (see e.g. UNESCO, 2007; EPDC, 2007a). It is no different for the estimates of the distribution of pupils by relative age. Figure 4 shows the percentage of on-time primary pupils and the percentage of pupils 2+ years overage for grade, in 22 countries, as calculated from 1) UIS data, 2) the DHS surveys corrected for birthdays, and 3) the uncorrected DHS survey data. Regarding the recording of pupils by age, the administrative data includes on-time pupils for all primary grades, but in some countries the overage pupils beyond a certain age are not counted, which could result in the proportion of overage pupils being underestimated.
W I N T E R 2 0 0 9 8
It is clear from the figure that there are large differences between the two data types, whether using the raw DHS data for age groups or the DHS data corrected for birthdays. In fact, the correlation coefficients for the UIS on-time pupils with the raw DHS data and the corrected DHS data are c=-.05 and c=-.02 respectively.
For the percent overage pupils, the correlation coefficients are better: c=.76 for UIS and the raw DHS data and c=.66 for UIS and the corrected DHS data. It is not within the scope of this study to analyze the causes of these differences, but these discrepancies indicate that the results should be treated with caution. It is not possible to compare the flow rates by age—promotion, repetition and dropout—from household surveys and administrative data because the administrative data is not sufficiently detailed

Pupil Performance and Age: A Study of Promotion, Repetition, and Dropout Rates among Pupils in Four Age Groups in 35 Developing Countries
EPDC Working Paper No. WP-09-02
Figure 4. Percentage of primary pupils who are on time (top graph) and who are 2+ years overage (bottom graph), according to administrative data from UIS, corrected DHS data and raw DHS data in order of the percent of pupils on time according to UIS data.
0%
10%
20%
30%
40%
50%Ar
men
ia
Moz
ambi
que
Sene
gal
Leso
tho
Rw
anda
Keny
a
Mad
agas
car
Nig
er
Gha
na
Nic
arag
ua
Ethi
opia
Mal
i
Mal
awi
Zam
bia
Gui
nea
Hon
dura
s
Dom
inic
an R
ep.
Burk
ina
Faso
Col
ombi
a
Beni
n
Tanz
ania
% p
rimar
y pu
pils
on-
time
UIS Corrected DHS Raw DHS
0
10
20
30
40
50
60
70
80
Arm
enia
Sene
gal
Burk
ina
Faso
Ben
in
Mal
i
Nig
er
Col
ombi
a
Tanz
ania
Gui
nea
Dom
inic
an R
epub
lic
Hon
dura
s
Zam
bia
Nic
arag
ua
Mal
awi
Gha
na
Eth
iopi
a
Ken
ya
Mad
agas
car
Leso
tho
Rw
anda
Moz
ambi
que
% 2
or m
ore
year
s ov
erag
e
UIS Corrected DHS Raw DHS
EFFICIENCY RATES—PROMOTION, SURVIVAL REPETITION AND DROPOUT—FOR OVERAGE PUPILS AS COMPARED TO ON-TIME AND UNDERAGE PUPILS
This section reviews the efficiency—promotion, survival, repetition and dropout—rates for overage pupils compared to on-time and underage pupils. For the efficiency flows the DHS data cannot be corrected for birthdays,
because it is not possible to distinguish children who have had birthdays from those who have not (it is only possible to calculate an overall probability of having had a birthday). In summary, the data show that overage pupils do not progress through the school system with the same efficiency as their on-time or underage peers, but they do not necessarily fare any worse, at least in the earlier grades. At the primary level, promotion rates for pupils 2+
W I N T E R 2 0 0 9 9

Pupil Performance and Age: A Study of Promotion, Repetition, and Dropout Rates among Pupils in Four Age Groups in 35 Developing Countries
EPDC Working Paper No. WP-09-02
Figure 5. Promotion rates by relative age group in primary (top graph) and secondary (bottom graph).
40%
50%
60%
70%
80%
90%
100%M
alaw
iR
wan
daU
gand
aM
adag
asc
Cam
eroo
nM
ozam
biq
Nep
alBu
rkin
aN
icar
agua
Leso
tho
Mal
iC
ongo
,Be
nin
Keny
aC
ambo
dia
Sene
gal
Zam
bia
Hai
tiEt
hiop
iaC
olom
bia
Zim
babw
eH
ondu
ras
Nig
erN
amib
iaD
omin
ican
Tanz
ania
Peru
Philip
pine
sG
uine
aN
iger
iaIn
dia
Egyp
tG
hana
Mol
dova
Arm
enia
Prim
ary
prom
otio
n ra
te
2+ Years Overage 1 Year Overage On time Underage Average
40%
50%
60%
70%
80%
90%
100%
Uga
nda
Burk
ina
Moz
ambi
que
Cam
eroo
nM
alaw
iZi
mba
bwe
Nam
ibia
Mal
iKe
nya
Con
go, R
ep.
Nic
arag
uaM
adag
asca
rN
epal
Leso
tho
Tanz
ania
Zam
bia
Beni
nR
wan
daN
iger
Gha
naEt
hiop
iaSe
nega
lAr
men
iaD
omin
ican
Indi
aC
ambo
dia
Col
ombi
aH
aiti
Egyp
tPh
ilippi
nes
Gui
nea
Mol
dova
Peru
Hon
dura
sN
iger
ia
Seco
ndar
y pr
omot
ion
rate
2+ Years Overage 1 Year Overage On time Underage Average
years overage are equal to6 or greater than those of on-time pupils in 24 of the 35 countries sampled. At the secondary level however, pupils 2+ years overage do less well; promotion rates for pupils 2+ years overage are lower than those of on-time pupils in 29 out of the 35 countries. The survival rates to grade 5 are similar for on-time and one year overage pupils; and somewhat lower for the pupils 2+ years overage. By the middle of secondary school, the differences in survival rates by relative age have widened considerably; there is a gap between on-time and pupils just one year overage, and a wider gap between these two groups and the pupils who are 2+ years overage. This pattern is consistent across countries.
6 ‘Equal’ is defined conservatively as ± two percentage points.
When not promoted, pupils one and 2+ years overage are more likely to drop out than are underage or on-time pupils. In particular, at the last grade of primary school and in secondary grades, older pupils are far more likely to drop out of school than on-time or underage pupils. Promotion at the primary and secondary levels Figure 5 shows the average primary and secondary promotion rates for pupils by relative age group, arranged by the overall promotion rates. There are five lines for each country in each graph: a black one for average promotion rates; orange lines (from dark to light hues) for 2+ years overage, one year overage, on-time, and underage. Countries are arranged in
W I N T E R 2 0 0 9 10
Pupil Performance and Age: A Study of Promotion, Repetition, and Dropout Rates among Pupils in Four Age Groups in 35 Developing Countries
EPDC Working Paper No. WP-09-02
ascending order of average promotion. The graphs show that promotion rates vary between countries, but also that the promotion rates of the relative age groups differ in a number of countries. Note the scale on the graphs is from 40%-100% because there are no relative age groups in any countries with promotion rates below 40%. Average primary promotion rates range from 67% in Malawi and Rwanda to 99% in Moldova and Armenia. There are 7 countries with promotion rates of 95% or higher; 10 with average promotion rates of 85% and lower. In the countries with lower overall promotion rates, there is a greater range of promotion rates between the different relative age groups. Among the ten countries with the lowest overall primary promotion rates (Malawi -- Lesotho on the figure), there is a clear positive relationship
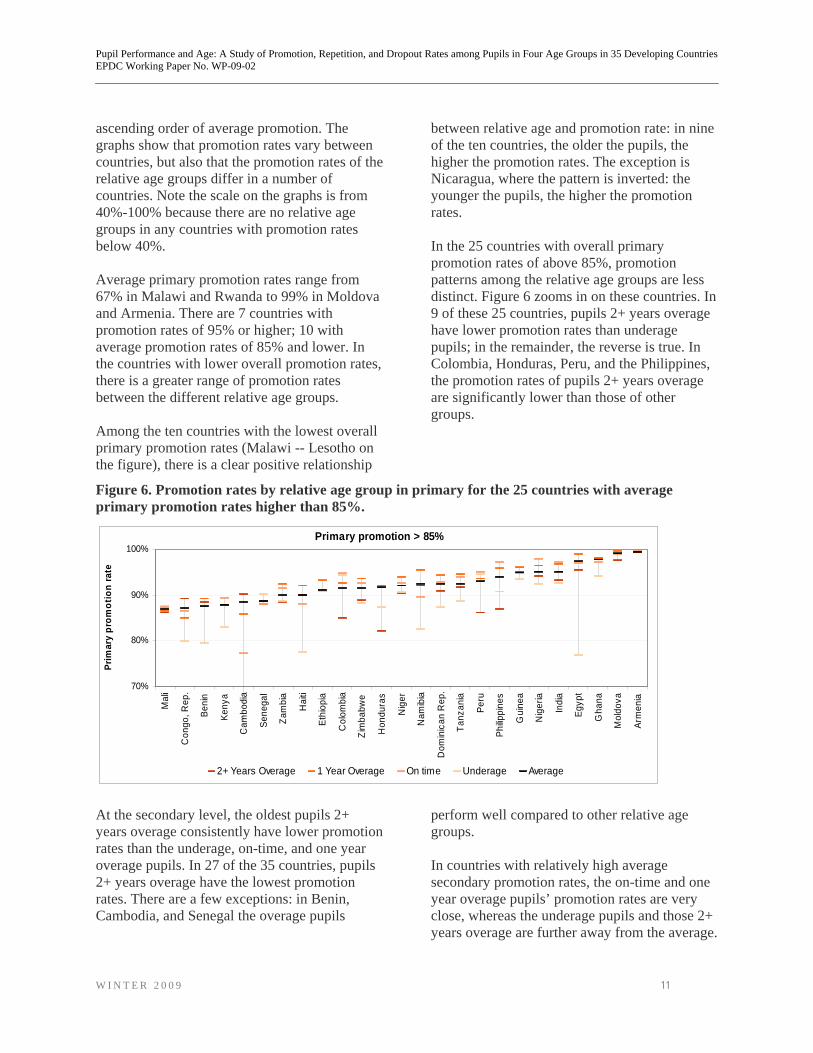
between relative age and promotion rate: in nine of the ten countries, the older the pupils, the higher the promotion rates. The exception is Nicaragua, where the pattern is inverted: the younger the pupils, the higher the promotion rates. In the 25 countries with overall primary promotion rates of above 85%, promotion patterns among the relative age groups are less distinct. Figure 6 zooms in on these countries. In 9 of these 25 countries, pupils 2+ years overage have lower promotion rates than underage pupils; in the remainder, the reverse is true. In Colombia, Honduras, Peru, and the Philippines, the promotion rates of pupils 2+ years overage are significantly lower than those of other groups.
Figure 6. Promotion rates by relative age group in primary for the 25 countries with average primary promotion rates higher than 85%.
Primary promotion > 85%
70%
80%
90%
100%
Mal
i
Con
go, R
ep.
Beni
n
Keny
a
Cam
bodi
a
Sene
gal
Zam
bia
Hai
ti
Ethi
opia
Col
ombi
a
Zim
babw
e
Hon
dura
s
Nig
er
Nam
ibia
Dom
inic
an R
ep.
Tanz
ania
Peru
Philip
pine
s
Gui
nea
Nig
eria
Indi
a
Egyp
t
Gha
na
Mol
dova
Arm
enia
Prim
ary
prom
otio
n ra
te
2+ Years Overage 1 Year Overage On time Underage Average
At the secondary level, the oldest pupils 2+ years overage consistently have lower promotion rates than the underage, on-time, and one year overage pupils. In 27 of the 35 countries, pupils 2+ years overage have the lowest promotion rates. There are a few exceptions: in Benin, Cambodia, and Senegal the overage pupils
perform well compared to other relative age groups. In countries with relatively high average secondary promotion rates, the on-time and one year overage pupils’ promotion rates are very close, whereas the underage pupils and those 2+ years overage are further away from the average.
W I N T E R 2 0 0 9 11

Pupil Performance and Age: A Study of Promotion, Repetition, and Dropout Rates among Pupils in Four Age Groups in 35 Developing Countries
EPDC Working Paper No. WP-09-02
Survival rates by relative age Another key measure of success is pupils’ ability to progress through the school system and reach higher grades – the survival rate. The survival rate is largely determined by cumulative dropout rates, although repetition plays a secondary role, because each time pupils repeat there is a chance they will drop out after the repetition. The survival rate can be calculated based on promotion, repetition, and dropout rates for each of the four relative age groups. The survival rates are somewhat artificial because they are not the survival rates of cohorts of pupils who start school in a particular relative age group; they are simply calculated based on the promotion, repetition, and dropout rates for each relative age group. On-time pupils can move to being one or 2+ years overage if they repeat; and one year overage pupils can move to being 2+ years overage if they repeat, thus shifting from one survival curve to another. That said, the survival rates remain a useful summary indicator of the performance of the relative age groups. The top graph, survival to grade 5, shows relatively high survival rates in all countries—notably higher than the survival rates from administrative data in some countries, such as Uganda—in particular for the on-time and one year overage pupils. Both of these groups have very similar survival rates, except in Nicaragua, where the one year overage pupils have lower survival. The age gap of one year has little effect on survival rates. Figure 7 shows the survival rates to grade 5 and to the middle of secondary school (grade 9) for three relative age groups: on-time, one year overage, and 2+ years overage. At the highest grades of secondary school, 10-13, a comparison is not possible in many countries because there are too few on-time and one year overage pupils to calculate the flows. The underage group is not shown in the figure because there are too few data points. Country-specific graphs with survival rates by grade are shown in Annex 2.
The top graph, survival to grade 5, shows relatively high survival rates in all countries7—notably higher than the survival rates from administrative data in some countries, such as Uganda—in particular for the on-time and one year overage pupils. Both of these groups have very similar survival rates, except in Nicaragua, where the one year overage pupils have lower survival. The age gap of one year has little effect on survival rates. Pupils 2+ years overage fare worse than the two younger groups. Their survival rates are up to 20 percentage points lower, even 37 percentage points lower in the case of Nicaragua. By grade 9, the survival differences between the relative age groups are much stronger. One year overage pupils do worse than on-time pupils in most countries, although there are a few exceptions. Pupils 2+ years overage, however, clearly have even lower performance. In Nicaragua, almost no pupils 2+ years overage reach grade 9; in many countries only half do so, compared to 60-80% for the on-time and one year overage pupils in most countries. The graphs in Annex 2 show that much of the loss occurs at the transition from primary to (lower) secondary school, although at each successive grade, the 2+ overage pupils fare worse. Repetition and dropout by grade When pupils are not promoted to the next grade or level, they must, by definition, either repeat the same grade or drop out of school.8 It is therefore possible to analyze non-promotion in terms of repetition and dropout rates. This section presents grade-specific and age-specific repetition and dropout rates, as well as some
7 Readers who are familiar with the survival rates calculated from administrative data and published, for example, by UIS, will note that the survival rates calculated from DHS data are significantly higher for some countries, such as Uganda. A partial explanation may be that in the administrative data, repetition rates are under-reported, causing a lower estimate of survival. It is beyond the scope of this paper to analyze exactly what causes the differences, but again, the reader should be cognizant of the fact that these differences exist and may influence the validity of the results. 8 In other words, ‘Repetition Rate + Promotion Rate + Dropout Rate = 100%’.
W I N T E R 2 0 0 9 12

Pupil Performance and Age: A Study of Promotion, Repetition, and Dropout Rates among Pupils in Four Age Groups in 35 Developing Countries
EPDC Working Paper No. WP-09-02
W I N T E R 2 0 0 9 13
general findings on repetition and dropout that are not necessarily associated with relative age groups.
Figure 7. Survival rates to grade 5 (top graph) and grade 9 (bottom graph) for three relative age groups: on-time, one year overage, and 2+ years overage. The survival to grade 5 is arranged in descending order of on-time survival; the survival to grade 9 in order of one year overage survival because there is no on-time survival data for five countries.
Survival grade 5
0.0
0.2
0.4
0.6
0.8
1.0
Arm
enia
Mol
dova
Tanz
ania
Ken
yaE
gypt
Gha
naC
ongo
, Rep
.N
iger
iaP
hilip
pine
sS
eneg
alIn
dia
Cam
bodi
aN
amib
iaG
uine
aB
enin
Hai
tiD
omin
ican
Rep
ublic
Per
uH
ondu
ras
Mal
iC
amer
oon
Nep
alC
olom
bia
Mad
agas
car
Rw
anda
Moz
ambi
que
Leso
tho
Nig
erU
gand
aB
urki
na F
aso
Zam
bia
Zim
babw
eM
alaw
iN
icar
agua
Eth
iopi
a
Surv
ival
rate
On-time One year overage 2+ years overage
Survival grade 9
0.0
0.2
0.4
0.6
0.8
1.0
Arm
enia
Rw
anda
Hai
tiG
hana
Nep
alM
oldo
vaD
omin
ican
Rep
ublic
Egy
ptH
ondu
ras
Gui
nea
Nam
ibia
Ben
inC
amer
oon
Mad
agas
car
Cam
bodi
aM
ali
Sen
egal
Con
go, R
ep.
Leso
tho
Per
uP
hilip
pine
sM
alaw
iC
olom
bia
Eth
iopi
aK
enya
Indi
aM
ozam
biqu
eN
iger
iaU
gand
aB
urki
na F
aso
Zim
babw
eZa
mbi
aN
iger
Tanz
ania
Nic
arag
ua
Sur
viva
l rat
e
On-time One year overage 2+ years overage

Pupil Performance and Age: A Study of Promotion, Repetition, and Dropout Rates among Pupils in Four Age Groups in 35 Developing Countries
EPDC Working Paper No. WP-09-02
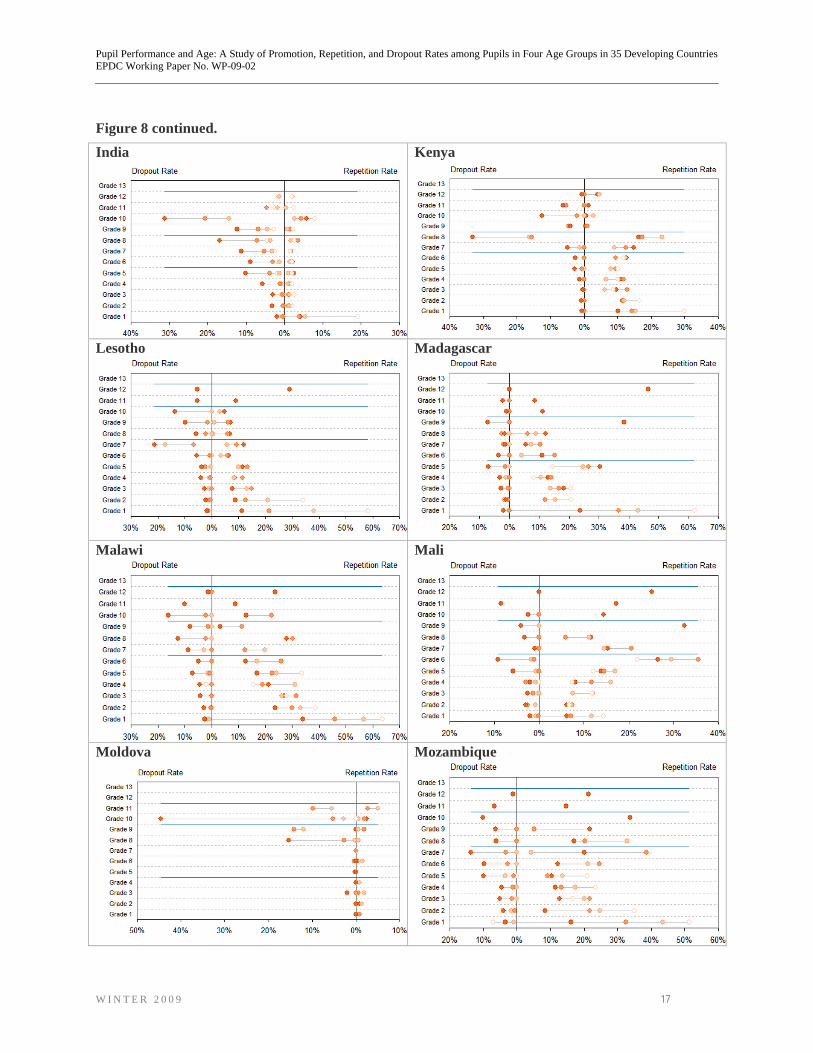
Recall that in primary school, when promotion rates are low, overage pupils generally have higher promotion rates than younger pupils; when promotion rates are above 85% there is no pattern; and in secondary school, overage pupils generally have lower promotion rates than younger pupils. Figure 3 presents country-specific repetition and dropout rates in detail, by grade and relative age group in dropout and repetition graphs. In these graphs, grades are given along the vertical axis; repetition rates are along the horizontal axis to the right, and dropout rates are to the left, both increasing away from the central axis. Blue lines between school grades represent transitions between school levels (primary to lower-secondary; lower- to upper-secondary; end of secondary). The repetition and dropout rates for each relative age group are indicated by the same orange colors as in Figure 5. When a repetition or dropout rate for a particular age group is not shown, it is because the sample size for that group was too small. Though different countries exhibit unique trends in repetition and dropout rates across the various relative age groups, some general trends can be observed: • Dropouts are more likely to be older pupils;
repeaters are more likely to be younger pupils.
• Certain school systems have a clear bias towards repetition rather than dropping out. In Benin for example, repetition rates far exceed dropout rates for all relative age groups and at all grade levels.
• In many countries, repetition rates are highest in the first grade of primary, and are sometimes also high the last grades of a level. Within each grade, successively younger groups have successively high repetition rates. This is especially true in grade 1. One can imagine that in some countries, high repetition rates in grade 1 are the result of extremely crowded first grades where fewer pupils master the skills needed to be promoted. Additionally, particularly high repetition rates among underage pupils
in first grade suggest that parents are sending their underage children to school early as a replacement for kindergarten or early childhood care.
• In many countries, dropout rates increase with grade and school level and spike at grades preceding the transition to a next level (the last grades of primary and lower secondary). This pattern is especially pronounced for older pupils. Moreover, the older the pupils within each grade, the higher the dropout rates. The spike in dropout or repetition rates at transition grades suggests that there are higher barriers to success in these grades. Obstacles may include an exam or a fee that must be paid before the student can progress to the next level.
The repetition and dropout patterns illustrated in the graphs explain some of the changes in the composition of relative age groups from primary to secondary or from the first grade of primary to the first grade of secondary, shown in Figure 2 and Figure 3. In India, for example, high dropout rates among overage pupils at the primary level reduce the number of overage pupils in the system, while low repetition rates among younger age groups ensure that the number of overage pupils is not replenished – as a result, the proportion of overage pupils in that country falls. In Burkina Faso, a spike in repetition rates at the last grade of primary (grade 6) that is especially pronounced among pupils who are overage and on-time helps explain the relatively large increase in overage pupils illustrated in Figure 3. In Moldova, where repetition and dropout rates are very low until well into lower secondary, there is little observed change in the proportion of overage pupils. In the Philippines, there is also little change in the proportion of overage pupils from primary to secondary school, only in this case it is because the high repetition rates in the earliest levels of primary are offset by high dropout rates among overage pupils at the highest grade of primary.
W I N T E R 2 0 0 9 14

Pupil Performance and Age: A Study of Promotion, Repetition, and Dropout Rates among Pupils in Four Age Groups in 35 Developing Countries
EPDC Working Paper No. WP-09-02
Figure 8. Dropout and repetition by grade for 35 countries.
under-ageon timeone year over-agetwo or more years over-age
Armenia Benin
Burkina Faso Cambodia
Cameroon Colombia
W I N T E R 2 0 0 9 15

Pupil Performance and Age: A Study of Promotion, Repetition, and Dropout Rates among Pupils in Four Age Groups in 35 Developing Countries
EPDC Working Paper No. WP-09-02
Figure 8 continued. Congo, Rep. Dominican Republic
Egypt Ethiopia
Ghana Guinea
Haiti Honduras
W I N T E R 2 0 0 9 16
Pupil Performance and Age: A Study of Promotion, Repetition, and Dropout Rates among Pupils in Four Age Groups in 35 Developing Countries
EPDC Working Paper No. WP-09-02
Figure 8 continued. India Kenya
Lesotho Madagascar
Malawi Mali
Moldova Mozambique
W I N T E R 2 0 0 9 17

Pupil Performance and Age: A Study of Promotion, Repetition, and Dropout Rates among Pupils in Four Age Groups in 35 Developing Countries
EPDC Working Paper No. WP-09-02
Figure 8 continued. Namibia Nepal
Nicaragua Niger
Nigeria Peru
Philippines Rwanda
W I N T E R 2 0 0 9 18

Pupil Performance and Age: A Study of Promotion, Repetition, and Dropout Rates among Pupils in Four Age Groups in 35 Developing Countries
EPDC Working Paper No. WP-09-02
W I N T E R 2 0 0 9 19
Figure 8 continued. Senegal Tanzania
Uganda Zambia
Zimbabwe
Transition grades: the first and last grades of primary
rates for these grades exposes some exceptionally high inefficiencies occurring at these grades for particular groups. Through pinpointing specific inefficiencies, it should be easier to decide where focused interventions are needed. The section first discusses repetition in the first and last grade of primary, and then discusses dropout rates.
This section analyzes the repetition and dropout rates in two ‘transition grades’ that pupils are most likely to encounter – the first grade of primary and the last grade of primary.9 Juxtaposing age-specific repetition and dropout
9 Because the last grade of primary can be a different grade in each country, specific grade numbers are not referenced.

Pupil Performance and Age: A Study of Promotion, Repetition, and Dropout Rates among Pupils in Four Age Groups in 35 Developing Countries
EPDC Working Paper No. WP-09-02
Figure 9 presents repetition rates for each relative age group for the first grade (top graph), average primary across all grades (middle graph), and the last grade of primary (bottom graph). In all three graphs, countries are ranged in order of increasing average primary promotion rate. In most countries, repetition rates at the first grade of primary are higher than average primary repetition rates, and repetition rates at the last grade of primary are lower than average primary rates. This pattern extends across relative age groups; repetition for each particular age group is higher in the first grade of primary than the average primary repetition for each age group. There are six countries with the opposite pattern: low repetition rates in first grade and high rates in the last grade: Burkina Faso, Mali, Senegal, Niger, Guinea, and Egypt. It is notable that all these countries are in Africa, and many in the same Western region with a Francophone colonial history. The proximity and shared history may be related to the unique pattern in these countries. Variation in repetition rates across age groups is highest in countries where overall repetition rates are highest and also in the grades where repetition is highest: in first grade for most countries, and in the last grade of primary for the six exceptional countries mentioned above. In Cambodia, Haiti, Lesotho, and Madagascar, the margin between repetition for underage pupils and repetition for on-time pupils exceeds 20
percentage points. For the last grade of primary in many countries, where repetition rates are low, the repetition rates between age groups vary little – often one to two percentage points. In general, as observed earlier in the discussion of the dropout and repetition graphs in Figure 8, the younger the pupils are, the higher the repetition rates. This exact pattern is found in 21 of the 35 countries, but in another eight, this general pattern is altered only slightly with two of the four age groups switched. In Columbia, Honduras and Peru (all in Latin America) the exact opposite pattern is observed – the youngest pupils have the lowest repetition rates and the oldest pupils had the highest rates. In three countries, the pattern is mixed. Underage pupils in grade 1 are of particular note, because with their substantially higher repetition rates, they are significant contributors to overall grade 1 repetition rates. Among countries where underage pupils make up a large proportion of the pupils in first grade and underage pupils have unusually high repetition rates, repetition among underage pupils can account for a large portion of overall repetition in the grade. In Cameroon for example, where 26% of grade 1 pupils are underage and 47% of underage pupils in grade 1 repeat the grade, 11.3% all grade 1 pupils are underage pupils who are repeating.
W I N T E R 2 0 0 9 20

Pupil Performance and Age: A Study of Promotion, Repetition, and Dropout Rates among Pupils in Four Age Groups in 35 Developing Countries
EPDC Working Paper No. WP-09-02
Figure 9. Repetition rates for each relative age group at the first grade of primary, primary, and the last grade of primary.
0%
10%
20%
30%
40%
50%
60%
70%
80%
Mal
awi
Rw
anda
Uga
nda
Mad
agas
car
Cam
eroo
nM
ozam
biqu
eN
epal
Burk
ina
Faso
Nic
arag
uaLe
soth
oM
ali
Con
go, R
ep.
Beni
nKe
nya
Cam
bodi
aSe
nega
lZa
mbi
aH
aiti
Ethi
opia
Col
ombi
aZi
mba
bwe
Hon
dura
sN
iger
Nam
ibia
Dom
inic
an R
ep.
Tanz
ania
Peru
Philip
pine
sG
uine
aN
iger
iaIn
dia
Egyp
tG
hana
Mol
dova
Arm
enia
Firs
t Gra
de o
f Prim
ary
0%
10%
20%
30%
40%
50%
60%
70%
80%
Prim
ary
0%
10%
20%
30%
40%
50%
60%
70%
80%
Mal
awi
Rw
anda
Uga
nda
Mad
agas
car
Cam
eroo
nM
ozam
biqu
eN
epal
Burk
ina
Faso
Nic
arag
uaLe
soth
oM
ali
Con
go, R
ep.
Beni
nKe
nya
Cam
bodi
aSe
nega
lZa
mbi
aH
aiti
Ethi
opia
Col
ombi
aZi
mba
bwe
Hon
dura
sN
iger
Nam
ibia
Dom
inic
an R
ep.
Tanz
ania
Peru
Philip
pine
sG
uine
aN
iger
iaIn
dia
Egyp
tG
hana
Mol
dova
Arm
enia
Last
Gra
de o
f Prim
ary
2+ Yrs Overage 1 Yr Overage On Time Underage
W I N T E R 2 0 0 9 21

Pupil Performance and Age: A Study of Promotion, Repetition, and Dropout Rates among Pupils in Four Age Groups in 35 Developing Countries
EPDC Working Paper No. WP-09-02
W I N T E R 2 0 0 9 22
Figure 10. Underage pupils and underage repeaters as a percentage of pupils in the first grade of primary.
0%
10%
20%
30%
40%
Nam
ibia
Arm
enia
Egy
pt
Mol
dova
Hon
dura
s
Gha
na
Per
u
Hai
ti
Eth
iopi
a
Phi
lippi
nes
Tanz
ania
Dom
inic
an R
ep.
Gui
nea
Zam
bia
Cam
bodi
a
Zim
babw
e
Nig
eria
Col
ombi
a
Ken
ya
Sen
egal
Ben
in
Nig
er
Mal
i
Con
go, R
ep.
Moz
ambi
que
Bur
kina
Fas
o
Uga
nda
Nep
al
Nic
arag
ua
Rw
anda
Indi
a
Leso
tho
Mad
agas
car
Mal
awi
Cam
eroo
n
Underage Pupils as a % of Grade 1 Pupils Underage Repeaters as a % of Grade 1 Pupils % Grade 1 Repeaters
Figure 10 shows the magnitude of this problem across countries. The graph shows the percentage of grade one pupils who are underage (total column height), the percentage of grade one pupils who are underage repeaters (filled in portion of column), and overall grade 1 repetition (black bar). In Cameroon, Madagascar, Malawi, and Uganda, underage pupils make up the largest proportion of grade 1 pupils and underage pupils have high repetition rates. In India, Niger, and Nigeria, where the overall repetition is relatively low, nearly all of the pupils who repeat are underage. presents dropout rates for each relative age group for the first grade (top graph), average primary across all grades (middle graph), and the last grade of primary (bottom graph). The countries are arranged as in Figure 10, in order of increasing average primary promotion rate. For dropout rates, the patterns are almost the exact mirror of the observations for repetition. Whereas repetition rates are higher in the first grade of primary and lower in the last grade of primary, the inverse is true for dropout rates:
dropout rates for first grade are lower than average dropout rates; dropout rates for the last grade of primary high. This pattern extends across all relative age groups with few notable exceptions. For dropout rates, there is a strong positive relationship between relative age and dropout rate (the opposite of the relationship for repetition). At the last grade of primary, pupils 2+ years overage have the highest dropout rates; pupils one year overage have the next highest dropout rates; on-time pupils have the second lowest dropout rates and underage pupils have the lowest dropout rates. This hierarchy is the general pattern observed in the sample countries. As with repetition, variation in dropout rates between relative age groups is the highest where dropout rates are high. In the last grade of primary, dropout rates for pupils 2+ years overage exceed those for the group with the next highest rate by a large margin. In Uganda, Nicaragua, Zimbabwe, Peru, and the Philippines, this margin exceeds 15 percentage points.

Pupil Performance and Age: A Study of Promotion, Repetition, and Dropout Rates among Pupils in Four Age Groups in 35 Developing Countries
EPDC Working Paper No. WP-09-02
Figure 11. Dropout rates for each relative age group at the first grade of primary, primary, and the last grade of primary.
0%
10%
20%
30%
40%
Mal
awi
Rw
anda
Uga
nda
Mad
agas
car
Cam
eroo
nM
ozam
biqu
eN
epal
Burk
ina
Faso
Nic
arag
uaLe
soth
oM
ali
Con
go, R
ep.
Beni
nKe
nya
Cam
bodi
aSe
nega
lZa
mbi
aH
aiti
Ethi
opia
Col
ombi
aZi
mba
bwe
Hon
dura
sN
iger
Nam
ibia
Dom
inic
an R
ep.
Tanz
ania
Peru
Philip
pine
sG
uine
aN
iger
iaIn
dia
Egyp
tG
hana
Mol
dova
Arm
enia
Firs
t Gra
de o
f Prim
ary
0%
10%
20%
30%
40%
Prim
ary
2 Yr Overage: 69%1 Yr Overage: 52%
0%
10%
20%
30%
40%
Mal
awi
Rw
anda
Uga
nda
Mad
agas
car
Cam
eroo
nM
ozam
biqu
eN
epal
Burk
ina
Faso
Nic
arag
uaLe
soth
oM
ali
Con
go, R
ep.
Beni
nKe
nya
Cam
bodi
aSe
nega
lZa
mbi
aH
aiti
Ethi
opia
Col
ombi
aZi
mba
bwe
Hon
dura
sN
iger
Nam
ibia
Dom
inic
an R
ep.
Tanz
ania
Peru
Philip
pine
sG
uine
aN
iger
iaIn
dia
Egyp
tG
hana
Mol
dova
Arm
enia
Last
Gra
de o
f Prim
ary
2+ Yrs Overage 1 Yr Overage On Time Underage
W I N T E R 2 0 0 9 23

Pupil Performance and Age: A Study of Promotion, Repetition, and Dropout Rates among Pupils in Four Age Groups in 35 Developing Countries
EPDC Working Paper No. WP-09-02
CONCLUSION: OPPORTUNITIES FOR TARGETED POLICY INTERVENTION
There is wide variation of pupils’ ages within grades in many developing countries with some pupils being underage, some on-time, and others one, two or more years overage. Pupils of different ages face unique age-specific challenges, even when they are enrolled in the same grade. It may be that the variation of ages has classroom-wide effects on all the pupils, but it was not possible to investigate that question here; rather this study focuses on the relative performance—in terms of promotion, repetition, and dropout—of pupils by age. Extractions from recent Demographic and Health Surveys from 2000-06 provide the age-specific pupils and flows. The study finds that in the early grades of primary school, promotion rates are positively correlated with age; the overage pupils generally have the highest promotion rates, and underage pupils the lowest. There may be multiple explanations for this: overage pupils may be repeaters who are seeing material for a second time; they may be highly motivated in the early grades; or teachers may promote them out of sympathy. Underage pupils in some countries have much higher repetition rates in the first grade of school than on-time and older pupils. This finding suggests that there is an unmet need for early childhood education in these countries: parents may be utilizing first grade as a replacement for nonexistent or insufficient kindergarten and pre-school facilities. Of the 35 countries included in this study, the countries where this effect appears strongest are: Nicaragua, India, Uganda, Malawi, Madagascar, and Cameroon. In these countries, there may be an urgent need to expand age-appropriate facilities for these young children. Once they reach the upper grades of primary school and secondary school, overage pupils encounter stronger pressures to drop out. In
many countries the promotion and survival rates of overage pupils in these grades are lower, and in most countries the dropout rates higher, than those of on-time or underage pupils. Dropout rates of overage pupils gradually increase throughout primary school, and in many countries peak at the last grade of primary (the transition to secondary school). As the older pupils reach these higher grades, they are also reaching ages where they must find work, get married, or otherwise take on adult responsibilities. It may be that the higher dropout rates they experience are simply a function of age, rather than the effect of being overage within the grade. That said, the under-performance of overage pupils at higher grades is particularly noteworthy when compared to their above-average performance in lower grades. There is a need to develop focused programs for this group of students to encourage them to continue school at higher levels. The programs should be based on knowledge of the particular obstacles faced by these pupils in upper grades. It is beyond the scope of this study to identify what these obstacles are, although a separate analysis is possible, using the surveys with the question on the “Reasons you left school”, and comparing the reasons overage pupils drop out to why on-time or underage pupils drop out. A deepened understanding the nature of the pressures faced by pupils of different age groups, and the manner in which these pressures are amplified or diminished at various points in their educational careers, can be an invaluable tool for policymakers. Through carefully-targeted interventions designed to address the specific needs of a single age group at a barrier grade, it may be possible to achieve improvements in the internal efficiency of a school system.
W I N T E R 2 0 0 9 24

Pupil Performance and Age: A Study of Promotion, Repetition, and Dropout Rates among Pupils in Four Age Groups in 35 Developing Countries
EPDC Working Paper No. WP-09-02
REFERENCES
Cameron, Laurie. 2005. Primary Completion Rates. Technical Paper WP-09-01. Washington, DC., Education Policy and Data Center, FHI 360.
Education Policy and Data Center. 2007a. Past and future school participation around the world: comparisons by school level, sub-national region and over time. Background paper for EFA Global Monitoring Report 2008.
Mendelsohn, JM, Roberts, CS. 1996. A profile of education in Namibia. Ministry of Basic Education and Culture,Windhoek, Namibia.
UNESCO. 2006. EFA Global Monitoring Report 2007: Strong Foundations. Paris, UNESCO
UNESCO. 2007. EFA Global Monitoring Report 2008. Education for All by 2015: Will we make it?. Paris, UNESCO.
Wils, A. 2004. "Late Entrants Leave School Earlier: Evidence from Mozambique”, International Review of Education / Internationale Zeitschrift für Erziehungswissenschaft / Revue internationale de Éducation 50: 17-37.
ABBREVIATIONS
DHS Demographic and Health Surveys EFA Education for All EPDC Education Policy and Data Center GIR Gross Intake Rate GMR Global Monitoring Report UIS UNESCO Institute of Statistics UNESCO United Nations Education,
Science, and Culture Organization USAID United States Agency for
International Development
DEFINITIONS
Children of primary school age. The total number of children who are of the ages in the primary school age interval.
Children of secondary school age. The total number of children who are of the ages in the secondary school age interval.
Dropout rate grade X. Pupils who were not attending school in the current year but did attend grade X in the previous year, divided by the pupils who attended grade X in the previous year. This is a broad definition of dropouts, and includes both 1) pupils who dropped out without completing the grade or level they most recently attended, and 2) pupils who completed a grade or level but did not move on the next. With this definition, pupils who quit school at one of the transition grades, such as the end of primary, basic, mandatory, or lower secondary school, are counted as dropouts – peak dropout rates at these points indicate barriers that prevent pupils from moving on to the next level. The study does not extend past the last grade of secondary and all pupils who report having completed the last grade of secondary are classified as ‘promoted’.
Gross intake rate (GIR). The number of new first grade entrants regardless of age, divided by the number of children who are of the official school start age.
Length of primary school. The number of grades included in primary school, taken from the UIS data system for level ISCED1 for enrolment rates, and the national definitions for the attendance rates.
Length of secondary school. The number of grades included in secondary school, taken from the UIS data system for level ISCED2 for enrolment rates, and the national definitions for the attendance rates.
W I N T E R 2 0 0 9 25

Pupil Performance and Age: A Study of Promotion, Repetition, and Dropout Rates among Pupils in Four Age Groups in 35 Developing Countries
EPDC Working Paper No. WP-09-02
Official age to start school. Official age at which children should enter first grade of primary school.
On-time. The pupil’s age for the previous year is equal to the official age for the grade they reported attending during the previous year.
One year overage. The pupil’s age for the previous year is one year higher than the official age for grade they reported attending during the previous year.
Primary age-specific attendance rates. The total number of children who said they were attending primary school, expressed as a percentage of the specific age populations.
Primary school age. The age between the official age to start school and the official age to end primary school (official start age plus number of grades in primary school).
Promotion rate grade X. Pupils who were attending grade X+1 or higher in the current year and who attended grade X in the previous year, divided by the pupils who were attending grade X in the previous year. This category includes pupils who were reported to have advanced one or more grades from the first year to the next.
Promotion rate last grade of secondary school. Pupils who were attending the last grade of secondary school in the previous year and report currently having attained “complete secondary”, divided by the pupils who were attending the last grade of secondary school in the previous year. Because the study analyzes the pupils who attended school in the previous year for each dataset, new entrants to the school system in the present year are not considered in this study. A pupil would be classified as a new entrant if they reported not having attended school in the previous year, but did attend school in current year.
Reconstructed cohort method. A more pertinent and commonly used method that places less demand on the availability of detailed data over time. To apply this method, data on enrolment by grade for two consecutive years and on repeaters by grade from the first to second year will be sufficient to enable the estimation of three main flow rates: promotion, repetition and dropout. Once obtained, these rates may be analyzed first of all by grade to study the patterns of repetition and dropout. Then, they are used in a reconstructed pupil-cohort flow to derive other indicators of internal efficiency.
Relative age of pupils. Refers to how many years the pupils’ age departs from the official age for their grade. The official ages for each grade are based on UNESCO Institute for Statistics (UIS) definitions.
Repetition rate grade X. Pupils who were attending grade X or a lower grade in the current year and who attended grade X in the previous year, divided by the pupils who were attending grade X in the previous year.
School survival to grade 5. Calculated using the reconstructed cohort method based on promotion, repetition, and dropout rates up to grade 5. It is primarily determined by dropout rates; secondarily by repetition. Promotion, repetition and dropout can be calculated from DHS data on attendance by grade in the present and the previous year. The promotion rate for grade n is the percent of children in grade n+1 in the present year, who were in school in grade n in the previous year. The repetition rate is the percent of children in grade n in the present year, which was also in grade n in the previous year. The dropout rate for grade n is children who were in grade n in the previous year, but are not attending school in the present year.
Secondary age-specific attendance rates. The total number of children who said they were
W I N T E R 2 0 0 9 26

Pupil Performance and Age: A Study of Promotion, Repetition, and Dropout Rates among Pupils in Four Age Groups in 35 Developing Countries
EPDC Working Paper No. WP-09-02
W I N T E R 2 0 0 9 27
attending secondary school, expressed as a percentage of the specific age populations.
Secondary school age. The age between the official start age for secondary (the last official age of primary school plus one), and official age to end secondary school (the official start age for secondary plus the number of grades secondary school).
Underage. The pupil’s age for the previous year is lower than the official age for the grade they reported attending during the previous year.
2+ years overage. The pupil’s age for the previous year is two or more years higher than the official age for grade they reported attending during the previous year. Note that this definition of overage is overage for grade, as opposed the definition of overage commonly used by UIS and GMR, where the overage pupils in primary are those who are older than the official primary school age range.
ACKNOWLEDGEMENT
This report has been prepared by the Education Policy and Data Center (EPDC) staff, Annababette Wils, Sarah Oliver, and Ben Sylla, and reviewed by George Ingram. The first draft of this paper was prepared as one of a series of reports the EPDC provided as background for the 2009 EFA Global Monitoring Report. The EPDC team is grateful to the GMR team for excellent guidance and commentary and for the collegial spirit in which this work was conducted. However, the views presented in this report are those of the EPDC only and do not necessarily reflect those of the Global Monitoring Report or any other organization.

Pupil Performance and Age: A Study of Promotion, Repetition, and Dropout Rates among Pupils in Four Age Groups in 35 Developing Countries
EPDC Working Paper No. WP-09-02
ANNEX 1. KEY SCHOOL SYSTEM AND SURVEY METADATA.
Country Survey Interview Dates School year Grade Ranges Age Ranges
Prim. Sec. Prim. Sec. Armenia Sep., 2005 - Nov., 2005 Sep. - May. 1 - 7 8 - 10 6 - 12 13 - 15 Benin Aug., 2006 - Nov., 2006 Oct. - Jul. 1 - 6 7 - 13 6 - 11 12 - 18 Burkina Faso Jun., 2003 - Nov., 2003 Oct. - Jun. 1 - 6 7 - 13 7 - 12 13 - 19 Cambodia Sep., 2005 - Mar., 2006 Oct. - Jul. 1 - 6 7 - 12 6 - 11 12 - 17 Cameroon Feb., 2004 - Aug., 2004 Sep. - Jun. 1 - 6 7 - 13 6 - 11 12 - 18 Colombia Oct., 2004 - Jun., 2005 Feb. - Nov. 1 - 5 6 - 11 6 - 10 11 - 16 Congo, Rep. Jul., 2005 - Nov., 2005 Oct. - Jun. 1 - 6 7 - 13 6 - 11 12 - 18 Dominican Rep. Jun., 2002 - Nov., 2002 Aug. - Jun. 1 - 6 7 - 12 6 - 11 12 - 17 Egypt Apr., 2005 - Jun., 2005 Sep. - Jun. 1 - 6 7 - 12 6 - 11 12 - 17 Ethiopia Apr., 2005 - Aug., 2005 Sep. - Jul. 1 - 4 5 - 12 7 - 10 11 - 18 Ghana Aug., 2003 - Oct., 2003 Sep. - Jul. 1 - 6 7 - 12 6 - 11 12 - 17 Guinea Feb., 2005 - Jun., 2005 Oct. - Jun. 1 - 6 7 - 13 7 - 12 13 - 19
Haiti Oct., 2005 - Apr., 2006 Oct., 2004 -Sep., 2005 -
Jun., 2005 Jun., 2006 1 - 6 7 - 13 6 - 11 12 - 18
Honduras Nov., 2005 - May., 2006 Feb. - Dec. 1 - 6 7 - 11 6 - 11 12 - 16 India Dec., 2005 - Aug., 2006 Apr. - Mar. 1 - 5 6 - 12 6 - 10 11 - 17 Kenya Apr., 2003 - Aug., 2003 Jan. - Dec. 1 - 6 7 - 12 6 - 11 12 - 17 Lesotho Sep., 2004 - Jan., 2005 Mar. - Dec. 1 - 7 8 - 12 6 - 12 13 - 17 Madagascar Nov., 2003 - Mar., 2004 Oct. - Jul. 1 - 5 6 - 12 6 - 10 11 - 17 Malawi Oct., 2004 - Jan., 2005 Jan. - Nov. 1 - 6 7 - 12 6 - 11 12 - 17 Mali Jan., 2001 - May., 2001 Oct. - Jun. 1 - 6 7 - 12 7 - 12 13 - 18 Moldova Jun., 2005 - Aug., 2005 Sep. - May. 1 - 4 5 - 11 7 - 10 11 - 17 Mozambique Sep., 2003 - Dec., 2003 Jan. - Dec. 1 - 7 8 - 12 6 - 12 13 - 17 Namibia Sep., 2000 - Dec., 2000 Jan. - Dec. 1 - 7 8 - 12 6 - 12 13 - 17 Nepal Feb., 2006 - Aug., 2006 Jul. - Apr. 1 - 5 6 - 12 5 - 9 10 - 16 Nicaragua Sep., 2001 - Nov., 2001 Feb. - Dec. 1 - 6 7 - 11 7 - 12 13 - 17 Niger Jan., 2006 - May., 2006 Oct. - Jul. 1 - 6 7 - 13 6 - 11 12 - 18 Nigeria Mar., 2003 - Aug., 2003 Sep. - Jul. 1 - 6 7 - 12 6 - 11 12 - 17 Peru10 Jan., 2005 - Sept., 2005 Apr. - Dec. 1 - 6 7 - 11 6 - 11 12 - 16 Philippines Jun., 2003 - Aug., 2003 Jun. - Mar. 1 - 6 7 - 12 6 - 11 12 - 17
Rwanda Mar., 2005 - Jul., 2005 Sep., 2004 -Jan., 2006 -
Jun., 2005 Nov., 2006 1 - 6 7 - 12 7 - 12 13 - 18
Senegal Feb., 2005 - Jun., 2005 Oct. - Jul. 1 - 7 8 - 13 6 - 12 13 - 18 Tanzania Oct., 2004 - Feb., 2005 Jan. - Dec. 1 - 7 8 - 13 7 - 13 14 - 19 Uganda May., 2006 - Sep., 2006 Feb. - Dec. 1 - 7 8 - 13 6 - 12 13 - 18 Zambia Nov., 2001 - May., 2002 Jan. - Dec. 1 - 7 8 - 12 7 - 13 14 - 18 Zimbabwe Aug., 2005 - Feb., 2006 Jan. - Dec. 1 - 7 8 - 13 6 - 12 13 - 18
10 The Peru survey is a continuous survey with interviews planned for every year from 2004-2008. In order to keep the Peru data consistent with data taken from other surveys, this study used only the results of interviews conducted during the 2005 calendar year (the more recently available data).
W I N T E R 2 0 0 9 28

Pupil Performance and Age: A Study of Promotion, Repetition, and Dropout Rates among Pupils in Four Age Groups in 35 Developing Countries
EPDC Working Paper No. WP-09-02
ANNEX 2. SURVIVAL RATES BY GRADE AND FOUR RELATIVE AGE GROUPS FOR 35 COUNTRIES.
Armeniaend of primary
end of low er secondary
0%
20%
40%
60%
80%
100%
1 2 3 4 5 6 7 8 9 10grade
surv
ival
to g
rade
Beninend of primary
end of low er secondary
0%
20%
40%
60%
80%
100%
1 2 3 4 5 6 7 8 9 10 11 12 13grade
surv
ival
to g
rade
Burkina Fasoend of primary
end of low er secondary
0%
20%
40%
60%
80%
100%
1 2 3 4 5 6 7 8 9 10 11 12 13grade
surv
ival
to g
rade
Cambodiaend of primary
end of low er secondary
0%
20%
40%
60%
80%
100%
1 2 3 4 5 6 7 8 9 10 11 12grade
surv
ival
to g
rade
Cameroonend of primary
end of low er secondary
0%
20%
40%
60%
80%
100%
1 2 3 4 5 6 7 8 9 10 11 12 13grade
surv
ival
to g
rade
Colombiaend of primary
end of low er secondary
0%
20%
40%
60%
80%
100%
1 2 3 4 5 6 7 8 9 10 11grade
surv
ival
to g
rade
Congo, Rep.end of primary
end of low er secondary
0%
20%
40%
60%
80%
100%
1 2 3 4 5 6 7 8 9 10 11 12 13grade
surv
ival
to g
rade
Dominican Republicend of primary
end of low er secondary
0%
20%
40%
60%
80%
100%
1 2 3 4 5 6 7 8 9 10 11 12grade
surv
ival
to g
rade
W I N T E R 2 0 0 9 29
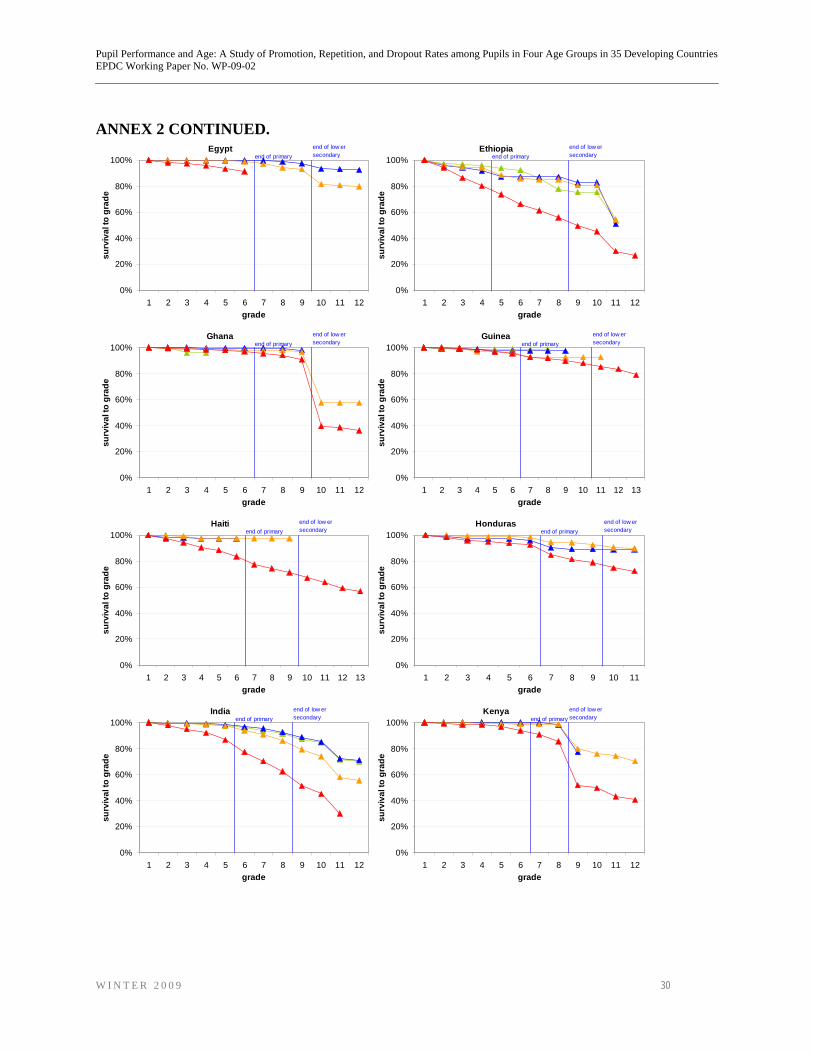
Pupil Performance and Age: A Study of Promotion, Repetition, and Dropout Rates among Pupils in Four Age Groups in 35 Developing Countries
EPDC Working Paper No. WP-09-02
ANNEX 2 CONTINUED. Egypt
end of primaryend of low er secondary
0%
20%
40%
60%
80%
100%
1 2 3 4 5 6 7 8 9 10 11 12grade
surv
ival
to g
rade
Ethiopiaend of primary
end of low er secondary
0%
20%
40%
60%
80%
100%
1 2 3 4 5 6 7 8 9 10 11 12grade
surv
ival
to g
rade
Ghanaend of primary
end of low er secondary
0%
20%
40%
60%
80%
100%
1 2 3 4 5 6 7 8 9 10 11 12grade
surv
ival
to g
rade
Guineaend of primary
end of low er secondary
0%
20%
40%
60%
80%
100%
1 2 3 4 5 6 7 8 9 10 11 12 13grade
surv
ival
to g
rade
Haitiend of primary
end of low er secondary
0%
20%
40%
60%
80%
100%
1 2 3 4 5 6 7 8 9 10 11 12 13grade
surv
ival
to g
rade
Hondurasend of primary
end of low er secondary
0%
20%
40%
60%
80%
100%
1 2 3 4 5 6 7 8 9 10 11grade
surv
ival
to g
rade
Indiaend of primary
end of low er secondary
0%
20%
40%
60%
80%
100%
1 2 3 4 5 6 7 8 9 10 11 12grade
surv
ival
to g
rade
Kenyaend of primary
end of low er secondary
0%
20%
40%
60%
80%
100%
1 2 3 4 5 6 7 8 9 10 11 12grade
surv
ival
to g
rade
W I N T E R 2 0 0 9 30
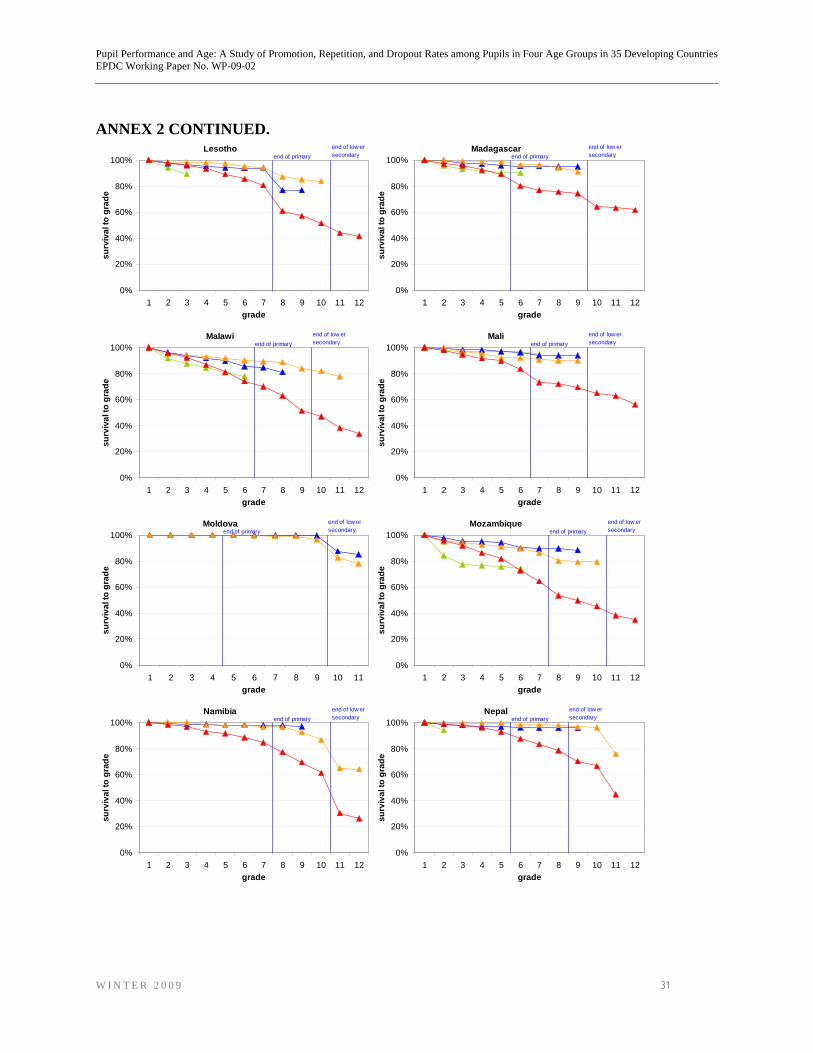
Pupil Performance and Age: A Study of Promotion, Repetition, and Dropout Rates among Pupils in Four Age Groups in 35 Developing Countries
EPDC Working Paper No. WP-09-02
ANNEX 2 CONTINUED. Lesotho
end of primaryend of low er secondary
0%
20%
40%
60%
80%
100%
1 2 3 4 5 6 7 8 9 10 11 12grade
surv
ival
to g
rade
Madagascarend of primary
end of low er secondary
0%
20%
40%
60%
80%
100%
1 2 3 4 5 6 7 8 9 10 11 12grade
surv
ival
to g
rade
Malawiend of primary
end of low er secondary
0%
20%
40%
60%
80%
100%
1 2 3 4 5 6 7 8 9 10 11 12grade
surv
ival
to g
rade
Maliend of primary
end of low er secondary
0%
20%
40%
60%
80%
100%
1 2 3 4 5 6 7 8 9 10 11 12grade
surv
ival
to g
rade
Moldovaend of primary
end of low er secondary
0%
20%
40%
60%
80%
100%
1 2 3 4 5 6 7 8 9 10 11grade
surv
ival
to g
rade
Mozambiqueend of primary
end of low er secondary
0%
20%
40%
60%
80%
100%
1 2 3 4 5 6 7 8 9 10 11 12grade
surv
ival
to g
rade
Namibiaend of primary
end of low er secondary
0%
20%
40%
60%
80%
100%
1 2 3 4 5 6 7 8 9 10 11 12grade
surv
ival
to g
rade
Nepalend of primary
end of low er secondary
0%
20%
40%
60%
80%
100%
1 2 3 4 5 6 7 8 9 10 11 12grade
surv
ival
to g
rade
W I N T E R 2 0 0 9 31

Pupil Performance and Age: A Study of Promotion, Repetition, and Dropout Rates among Pupils in Four Age Groups in 35 Developing Countries
EPDC Working Paper No. WP-09-02
ANNEX 2 CONTINUED. Nicaragua
end of primaryend of low er secondary
0%
20%
40%
60%
80%
100%
1 2 3 4 5 6 7 8 9 10 11grade
surv
ival
to g
rade
Nigerend of primary
end of low er secondary
0%
20%
40%
60%
80%
100%
1 2 3 4 5 6 7 8 9 10 11 12 13grade
surv
ival
to g
rade
Nigeriaend of primary
end of low er secondary
0%
20%
40%
60%
80%
100%
1 2 3 4 5 6 7 8 9 10 11 12grade
surv
ival
to g
rade
Peruend of primary
end of low er secondary
0%
20%
40%
60%
80%
100%
1 2 3 4 5 6 7 8 9 10 11grade
surv
ival
to g
rade
Philippinesend of primary
end of low er secondary
0%
20%
40%
60%
80%
100%
1 2 3 4 5 6 7 8 9 10grade
surv
ival
to g
rade
Rwandaend of primary
end of low er secondary
0%
20%
40%
60%
80%
100%
1 2 3 4 5 6 7 8 9 10 11 12grade
surv
ival
to g
rade
Senegalend of primary
end of low er secondary
0%
20%
40%
60%
80%
100%
1 2 3 4 5 6 7 8 9 10 11 12 13grade
surv
ival
to g
rade
Tanzaniaend of primary
end of low er secondary
0%
20%
40%
60%
80%
100%
1 2 3 4 5 6 7 8 9 10 11 12 13grade
surv
ival
to g
rade
W I N T E R 2 0 0 9 32

Pupil Performance and Age: A Study of Promotion, Repetition, and Dropout Rates among Pupils in Four Age Groups in 35 Developing Countries
EPDC Working Paper No. WP-09-02
W I N T E R 2 0 0 9 33
ANNEX 2 CONTINUED. Uganda
end of primaryend of low er secondary
0%
20%
40%
60%
80%
100%
1 2 3 4 5 6 7 8 9 10 11 12 13grade
surv
ival
to g
rade
Zambiaend of primary
end of low er secondary
0%
20%
40%
60%
80%
100%
1 2 3 4 5 6 7 8 9 10 11 12grade
surv
ival
to g
rade
Zimbabweend of primary
end of low er secondary
0%
20%
40%
60%
80%
100%
1 2 3 4 5 6 7 8 9 10 11 12 13grade
surv
ival
to g
rade