Embed Size (px)
Citation preview
8/2/2019 Punj Lloyd Result Updated
http://slidepdf.com/reader/full/punj-lloyd-result-updated 1/10
Please refer to important disclosures at the end of this report 1
Y/E March (` cr) 4QFY12 4QFY11 % chg (yoy) 3QFY12 % chg (qoq)
Net sales 3,038 2,299 32.2 2,826 7.5
Operating profit 255 245 3.9 164 55.7
Net profit 9 9 (2.9) 70 (87.2)
Source: Company, Angel Research
For 4QFY2012, Punj Lloyd (Punj) posted a mixed set of numbers with decent
performance on the revenue front; however, the company reported dismal
performance on the earnings front mainly on account of higher interest cost. Punj
has received orders worth ` 13,817cr (commendable job in a gloomy
environment) during FY2012 against ` 9,978cr in FY2011, taking its order
backlog to ` 27,276cr (2.6x FY2012 revenue). However, we maintain our Neutral
view on the stock on account of various overhangs – uncertainty over receivable
claims, stretched working capital, increasing leverage on the balance sheet and
auditor qualifications.
Mixed performance: For 4QFY2012, Punj posted 32.2% yoy top-line growth to
` 3,038cr. The company’s EBITDA margin for the quarter stood at 8.4% in
4QFY2012 against 10.7% in 4QFY2011. Interest and depreciation cost came in
at ` 187cr and ` 70cr, respectively. Interest cost witnessed a jump of 37.0%/15.2%
on a yoy/qoq basis, respectively. On the earnings front, Punj reported profit of
` 9cr, registering a decline of 2.9% on a yoy basis.
Outlook and valuation: We are revising our estimates for FY2013 and FY2014 to
factor in the company’s mixed performance in 4QFY2012. As compared to the
previous quarters, Punj has performed better in 2HFY2012; also, a few positives
(such as healthy order inflow and reduction in auditor qualification) have
emerged during the past two quarters. However, owing to the erratic performance
posted by the company in the past, continuance of this performance remains in
doubt. We continue to remain Neutral on the stock due to headwinds faced by the
company (mentioned above).
Key financials (Consolidated)
Y/E March (` cr) FY2011 FY2012 FY2013E FY2014E
Net sales 8,139 10,557 11,592 12,993
% chg (22.1) 29.7 9.8 12.1
Adj. net profit (60) 92 60 106
% chg - - (34.2) 74.8
FDEPS (`) (1.8) 2.8 1.8 3.2
EBITDA margin (%) 8.9 8.5 8.4 8.4
P/E (x) - 18.9 28.7 16.4
RoAE (%) (2.0) 3.0 2.0 3.4
RoACE (%) 5.9 7.2 7.3 8.0
P/BV (x) 0.6 0.6 0.6 0.5
EV/Sales (x) 0.6 0.6 0.6 0.6
EV/EBITDA (x) 7.0 7.4 6.9 6.6
Source: Company, Angel Research
NEUTRALCMP ` 54
Target Price -
Investment Period -
Stock Info
Sector
Bloomberg Code
Shareholding Pattern (%)
Promoters 37.2
MF / Banks / Indian Fls 19.4
FII / NRIs / OCBs 11.7
Indian Public / Others 31.7
Abs. (%) 3m 1yr 3yr
Sensex (0.8) (8.9) 51.7
Punj Lloyd (4.8) (20.6) (59.0)
2
17,3025,239
PUJL.BO
PUNJ@IN
1,734
1.8
82/37
1,079,719
Infrastructure
Avg. Daily Volume
Market Cap ( ` cr)
Beta
52 Week High / Low
Face Value ( ` )
BSE SensexNifty
Reuters Code
Nitin Arora
022-39357800 Ext: 6842
Punj Lloyd
Performance Highlights
4QFY2012 Result Update | Infrastructure
May 2, 2012

8/2/2019 Punj Lloyd Result Updated
http://slidepdf.com/reader/full/punj-lloyd-result-updated 2/10
Punj Lloyd | 4QFY2012 Result Update
May 2, 2012 2
Exhibit 1: 4QFY2012 performance (Consolidated)
Y/E March (` cr) 4QFY12 4QFY11 % yoy chg 3QFY12 % qoq chg FY2012 FY2011 % chg
Net sales 3,038 2,299 32.2 2,826 7.5 10,557 8,139 29.7
Total expenditure 2,783 2,053 35.5 2,662 4.5 9,660 7,411 30.3Operating profit 255 245 3.9 164 55.7 897 728 23.3
OPM (%) 8.4 10.7 (230)bp 5.8 260bp 8.5 8.9 (40)bp
Interest 187 136 37.0 162 15.2 633 463 36.5
Depreciation 70 70 (0.1) 89 (21.7) 299 269 11.0
Non operating income 17 6 200.9 195 (91.2) 227 21 994.0
Nonrecurring items - - - - - - - -
Profit Before tax 16 45 (65.3) 107 (85.5) 193 16 1,115.8
Tax (5) 26 (119.2) 33 (115.6) 81 66 21.7
PAT 21 18 12.1 75 (72.3) 112 (50) -
Share of Profits/ (Losses) of Asso. (3) (3) - (5) - (11) 2 -
Share of Profits/ (Losses) of MI (9) 2 - 1 - (9) (3) -
PAT after MI and Share of Asso. 9 9 (2.9) 70 (87.2) 92 (60) -
PAT (%) 0.3 0.8 - 2.6 - 1.1 (0.6) -
Adjusted PAT 9 9 (2.9) 70 (87.2) 92 (60) -
Adj. PAT (%) 0.3 0.4 - 2.5 - 0.9 (0.7) -
FDEPS (`) 0.3 0.3 (2.9) 2.1 - 2.8 (1.8) -
Source: Company, Angel Research
Decent top-line growth
For 4QFY2012, Punj posted 32.2% yoy top-line growth to ` 3,038cr. On a
sequential basis as well, revenue increased by 7.5%. As per management, the
company’s 4QFY2012 performance has been strong on the back of robust growth
delivered by its domestic business, mainly driven by the oil and gas and power
sectors. Internationally, Punj is looking to expand its presence in Africa. As per
management, high working capital and borrowing costs continue to pose
challenges and, hence, Punj is exploring avenues of paring this debt and
improving the quality of its balance sheet.
Going forward, the company would be focusing on the following:
1) Bringing down the cost of debt by shifting debt to some other geography
where cost of debt is lower.
2) Improving profitability and working capital cycle.
Libya: On the Libyan orders (~ ` 3,900cr) front, Punj is hopeful that the new
government will honor the contracts. As per the company, resource mobilization is
continuing at Libya and execution of upstream and oil and gas projects is expected
to resume shortly. Accordingly, auditors have invited attention to the Libya issue as
Emphasis of Matter only. However, political situation in Libya has not stabilized yet
and the company is hoping that some stability will emerge in the next 3-6 months.
Heera: In ONGC Heera matter, arbitration proceedings, which had been initiated,
have been adjourned on mutual agreement. The dispute is being referred
to Outside Expert Committee (OEC). This would likely resolve the
dispute expeditiously. Further, there has been a reduction in auditor qualifications
regarding non-accounting of liquidation damages on Heera project from
` 65cr to ` 7cr.

8/2/2019 Punj Lloyd Result Updated
http://slidepdf.com/reader/full/punj-lloyd-result-updated 3/10
Punj Lloyd | 4QFY2012 Result Update
May 2, 2012 3
Exhibit 2: Revenue growth on a healthy execution pace
Source: Company, Angel Research
Exhibit 3: Quarterly order inflow and backlog
Source: Company, Angel Research
Higher interest cost mars earnings growth
The company’s EBITDA margin for the quarter stood at 8.4% against 10.7% in
4QFY2011. Going ahead, management is confident that the company will be able
to maintain its EBITDA margin at 8-11%. Hence, we are estimating EBITDAM of
8.4% for FY2013 and FY2014, respectively. Interest and depreciation cost came in
at ` 187cr and ` 70cr, respectively. Interest cost witnessed a jump of 37.0%/15.2%
on a yoy/qoq basis, respectively. On the earnings front, Punj reported profit of
` 9cr, registering a decline of 2.9% on a yoy basis.
Exhibit 4: EBITDAM trend
Source: Company, Angel Research
Exhibit 5: Erratic performance at earnings level continues
Source: Company, Angel Research
Order book analysis
Order inflow during FY2012 stood at ` 13,817cr vs. ` 9,978cr in FY2011, taking
the company’s outstanding order book to ` 27,276cr (2.6x FY2012 revenue). Punj
has done a commendable job in terms of order inflow in an otherwise gloomy
environment for orders. However, order inflow for 4QFY2012 has been muted
with the company bagging orders worth ` 1,453cr during the quarter. The
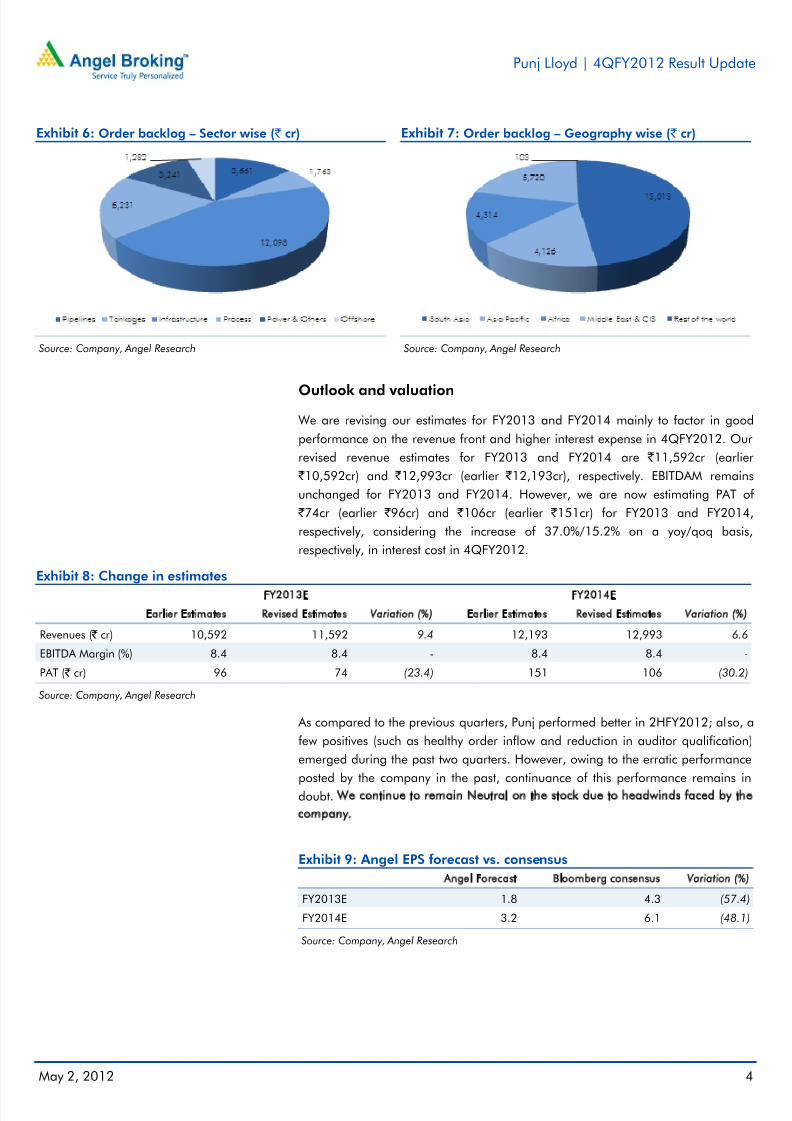
company’s order book is dominated by the infrastructure (44.4%) and process
(19.2%) segments. Geographically, South Asia contributes 47.7% to the company’s
order book, followed by Middle East & CIS and Asia Pacific, which contribute21.0% and 15.1%, respectively. Going ahead, management will continue to
explore opportunities in Southeast Asia, Middle East and Africa.
37.4
12.2
(1.9)(6.9)
(44.9)(41.7)
(30.8)(27.0)
29.4 30.5
20.3
33.4 32.2
(50.0)
(40.0)
(30.0)
(20.0)
(10.0)
-
10.020.0
30.0
40.0
50.0
0
500
1,000
1,500
2,000
2,500
3,000
3,500
4 Q F Y 0 9
1 Q F Y 1 0
2 Q F Y 1 0
3 Q F Y 1 0
4 Q F Y 1 0
1 Q F Y 1 1
2 Q F Y 1 1
3 Q F Y 1 1
4 Q F Y 1 1
1 Q F Y 1 2
2 Q F Y 1 2
3 Q F Y 1 2
4 Q F Y 1 2
Sales (` cr, LHS) Growth (yoy %, RHS)
-
5,000
10,000
15,000
20,000
25,000
30,000
4 Q F Y 0 9
1 Q F Y 1 0
2 Q F Y 1 0
3 Q F Y 1 0
4 Q F Y 1 0
1 Q F Y 1 1
2 Q F Y 1 1
3 Q F Y 1 1
4 Q F Y 1 1
1 Q F Y 1 2
2 Q F Y 1 2
3 Q F Y 1 2
4 Q F Y 1 2
Order Inflow (` cr, LHS) Order Book (` cr, LHS)
(2.2)
10.4 7.4 7.7
(29.0)
7.7 9.2 4.5 10.7 8.0 8.4 5.8 8.4
(35.0)
(30.0)
(25.0)
(20.0)
(15.0)
(10.0)
(5.0)
-
5.0
10.0
15.0
-600
-500
-400
-300
-200
-100
0
100
200
300
400
4 Q F Y 0 9
1 Q F Y 1 0
2 Q F Y 1 0
3 Q F Y 1 0
4 Q F Y 1 0
1 Q F Y 1 1
2 Q F Y 1 1
3 Q F Y 1 1
4 Q F Y 1 1
1 Q F Y 1 2
2 Q F Y 1 2
3 Q F Y 1 2
4 Q F Y 1 2
EBITDA ` cr, LHS EBITDAM %, RHS
(8.1)
4.21.8
0.5
(1.8) (1.8)
1.2
(2.8)
0.4(0.6)
1.0
2.5
0.3
(10.0)
(8.0)
(6.0)
(4.0)
(2.0)
-
2.0
4.0
6.0
-300
-250
-200
-150
-100
-50
0
50
100
150
4 Q F Y 0 9
1 Q F Y 1 0
2 Q F Y 1 0
3 Q F Y 1 0
4 Q F Y 1 0
1 Q F Y 1 1
2 Q F Y 1 1
3 Q F Y 1 1
4 Q F Y 1 1
1 Q F Y 1 2
2 Q F Y 1 2
3 Q F Y 1 2
4 Q F Y 1 2
PAT (` cr, LHS) PATM (%, RHS)
8/2/2019 Punj Lloyd Result Updated
http://slidepdf.com/reader/full/punj-lloyd-result-updated 4/10
Punj Lloyd | 4QFY2012 Result Update
May 2, 2012 4
Exhibit 6: Order backlog – Sector wise ( ` cr)
Source: Company, Angel Research
Exhibit 7: Order backlog – Geography wise ( ` cr)
Source: Company, Angel Research
Outlook and valuation
We are revising our estimates for FY2013 and FY2014 mainly to factor in good
performance on the revenue front and higher interest expense in 4QFY2012. Our
revised revenue estimates for FY2013 and FY2014 are ` 11,592cr (earlier
` 10,592cr) and ` 12,993cr (earlier ` 12,193cr), respectively. EBITDAM remains
unchanged for FY2013 and FY2014. However, we are now estimating PAT of
` 74cr (earlier ` 96cr) and ` 106cr (earlier ` 151cr) for FY2013 and FY2014,
respectively, considering the increase of 37.0%/15.2% on a yoy/qoq basis,
respectively, in interest cost in 4QFY2012.
Exhibit 8: Change in estimates
FY2013E FY2014E
Earlier Estimates Revised Estimates Variation (%) Earlier Estimates Revised Estimates Variation (%)
Revenues ( ` cr) 10,592 11,592 9.4 12,193 12,993 6.6
EBITDA Margin (%) 8.4 8.4 - 8.4 8.4 -
PAT ( ` cr) 96 74 (23.4) 151 106 (30.2)
Source: Company, Angel Research
As compared to the previous quarters, Punj performed better in 2HFY2012; also, a
few positives (such as healthy order inflow and reduction in auditor qualification)
emerged during the past two quarters. However, owing to the erratic performance
posted by the company in the past, continuance of this performance remains in
doubt. We continue to remain Neutral on the stock due to headwinds faced by the
company.
Exhibit 9: Angel EPS forecast vs. consensus
Angel Forecast Bloomberg consensus Variation (%)
FY2013E 1.8 4.3 (57.4)
FY2014E 3.2 6.1 (48.1)
Source: Company, Angel Research

8/2/2019 Punj Lloyd Result Updated
http://slidepdf.com/reader/full/punj-lloyd-result-updated 5/10
Punj Lloyd | 4QFY2012 Result Update
May 2, 2012 5
Exhibit 10: Recommendation Summary
Company CMP TP Rating Top-line (` cr) EPS (`) Adj. P/E OB/
FY12E FY13E FY14E CAGR (%) FY12E FY13E FY14E CAGR (%) FY12E FY13E FY14E Sales(x)
ABL 210 302 Buy 1,522 2,014 2,294 22.7 18.0 28.4 30.8 30.8 11.7 7.4 6.8 4.2CCCL 15 - Neutral 2,145 2,526 2,792 14.1 (1.1) 1.8 2.8 - - 8.2 5.3 2.7
HCC 20 - Neutral 3,988 4,239 4,522 6.5 (3.7) (1.8) (0.8) - - - - 3.8
IRB Infra 168 228 Buy 3,176 3,821 4,582 20.1 14.2 15.0 16.9 9.4 11.9 11.2 9.9 -
ITNL 184 265 Buy 5,178 6,619 7,263 18.4 22.4 24.7 26.2 8.3 8.2 7.4 7.0 5.2
IVRCL 61 79 Buy 5,057 5,758 6,860 16.5 2.0 4.7 6.0 72.7 30.1 13.0 10.1 4.4
JP Assoc. 74 104 Buy 13,963 16,017 18,359 14.7 2.9 4.2 5.0 30.9 25.2 17.6 14.7 -
L&T 1,215 1,641 Buy 53,779 60,258 69,900 14.0 63.5 70.7 76.2 9.5 19.1 17.2 15.9 3.3
Madhucon 54 84 Buy 1,952 2,503 2,903 21.9 4.4 5.8 6.5 21.8 12.1 9.2 8.2 3.8
NCC 47 76 Buy 4,946 5,790 7,022 19.1 1.4 3.5 5.4 97.6 34.3 13.6 8.8 4.3
Patel Engg 106 - Neutral 3,573 3,609 3,836 3.6 14.9 14.0 14.5 (1.1) 7.1 7.5 7.3 2.7
Punj Lloyd 52 - Neutral 10,557 11,592 12,993 10.9 2.8 1.8 3.2 7.2 18.9 28.7 16.4 2.6
Sadbhav 138 199 Buy 2,604 2,989 3,314 12.8 9.3 10.2 11.3 10.5 14.9 13.6 12.2 2.7
Simplex In. 227 316 Buy 5,929 6,732 7,902 15.4 19.6 27.2 35.1 33.9 11.6 8.3 6.5 2.9
Source: Company, Angel Research
Exhibit 11: SOTP break-up
Company Core Const. Real Estate Road BOT Invst. In Subsidiaries Others Total
` % to TP ` % to TP ` % to TP ` % to TP ` % to TP ` ABL 128 42 - - 174 58 - - - - 302
CCCL 20 100 - - - - - - - - 20
HCC (5) (20) 12 50 16 70 - - - - 23
IRB Infra 136 60 - - 88 38 4 2 - - 228
ITNL 38 14 - - 195 74 - - 32 12 265
IVRCL 54 69 - - - - 25 31 - - 79
JP Assoc. 34 32 27 26 - - - - 43 42 104
L&T 1,296 79 - - - - 344 21 - - 1,641
Madhucon 33 39 2 2 50 59 - - - 84
NCC 43 57 2 2 10 13 - - 22 28 76
Patel Engg 55 51 17 16 16 15 - - 19 18 106
Punj Lloyd 72 100 - - - - - - - - 72
Sadbhav 102 51 - - 98 49 - - - - 199
Simplex In. 316 100 - - - - - - - - 316
Source: Company, Angel Research
8/2/2019 Punj Lloyd Result Updated
http://slidepdf.com/reader/full/punj-lloyd-result-updated 6/10
Punj Lloyd | 4QFY2012 Result Update
May 2, 2012 6
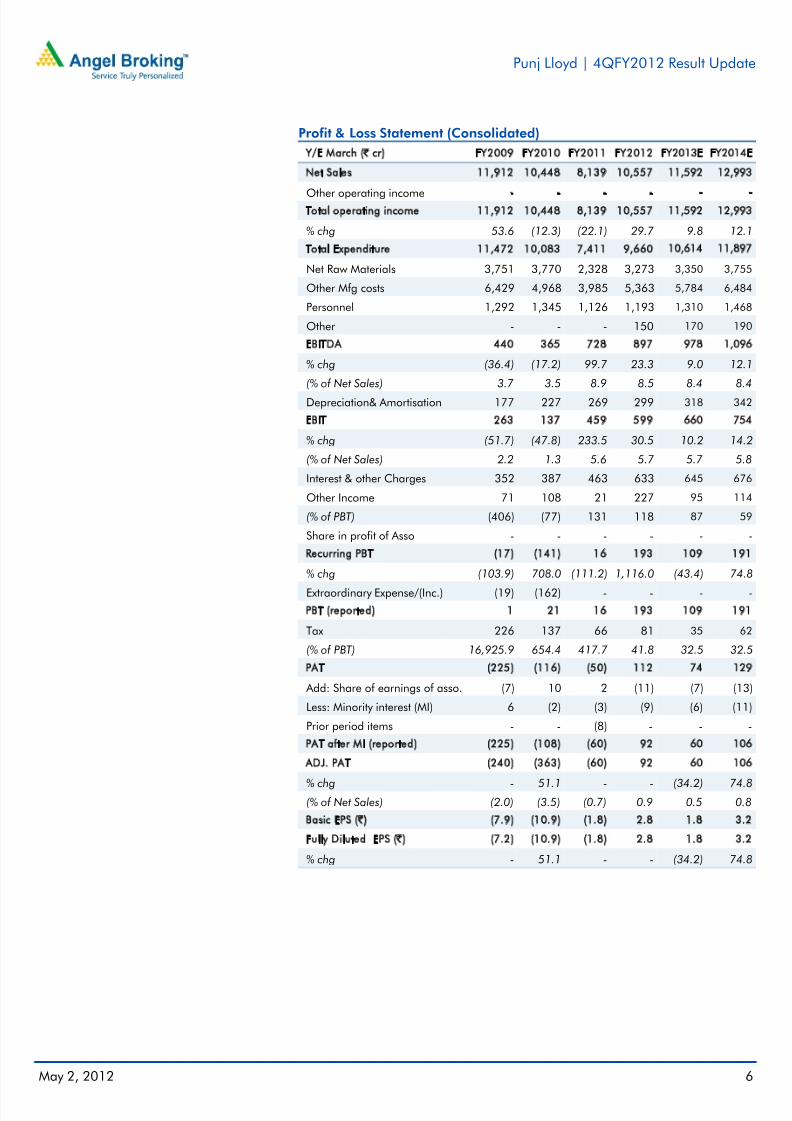
Profit & Loss Statement (Consolidated)
Y/E March (` cr) FY2009 FY2010 FY2011 FY2012 FY2013E FY2014E
Net Sales 11,912 10,448 8,139 10,557 11,592 12,993
Other operating income - - - - - -Total operating income 11,912 10,448 8,139 10,557 11,592 12,993
% chg 53.6 (12.3) (22.1) 29.7 9.8 12.1
Total Expenditure 11,472 10,083 7,411 9,660 10,614 11,897
Net Raw Materials 3,751 3,770 2,328 3,273 3,350 3,755
Other Mfg costs 6,429 4,968 3,985 5,363 5,784 6,484
Personnel 1,292 1,345 1,126 1,193 1,310 1,468
Other - - - 150 170 190
EBITDA 440 365 728 897 978 1,096
% chg (36.4) (17.2) 99.7 23.3 9.0 12.1
(% of Net Sales) 3.7 3.5 8.9 8.5 8.4 8.4
Depreciation& Amortisation 177 227 269 299 318 342
EBIT 263 137 459 599 660 754
% chg (51.7) (47.8) 233.5 30.5 10.2 14.2
(% of Net Sales) 2.2 1.3 5.6 5.7 5.7 5.8
Interest & other Charges 352 387 463 633 645 676
Other Income 71 108 21 227 95 114
(% of PBT) (406) (77) 131 118 87 59
Share in profit of Asso - - - - - -
Recurring PBT (17) (141) 16 193 109 191
% chg (103.9) 708.0 (111.2) 1,116.0 (43.4) 74.8
Extraordinary Expense/(Inc.) (19) (162) - - - -
PBT (reported) 1 21 16 193 109 191
Tax 226 137 66 81 35 62
(% of PBT) 16,925.9 654.4 417.7 41.8 32.5 32.5
PAT (225) (116) (50) 112 74 129
Add: Share of earnings of asso. (7) 10 2 (11) (7) (13)
Less: Minority interest (MI) 6 (2) (3) (9) (6) (11)
Prior period items - - (8) - - -
PAT after MI (reported) (225) (108) (60) 92 60 106
ADJ. PAT (240) (363) (60) 92 60 106
% chg - 51.1 - - (34.2) 74.8(% of Net Sales) (2.0) (3.5) (0.7) 0.9 0.5 0.8
Basic EPS (`) (7.9) (10.9) (1.8) 2.8 1.8 3.2
Fully Diluted EPS (̀ ) (7.2) (10.9) (1.8) 2.8 1.8 3.2
% chg - 51.1 - - (34.2) 74.8
8/2/2019 Punj Lloyd Result Updated
http://slidepdf.com/reader/full/punj-lloyd-result-updated 7/10
Punj Lloyd | 4QFY2012 Result Update
May 2, 2012 7
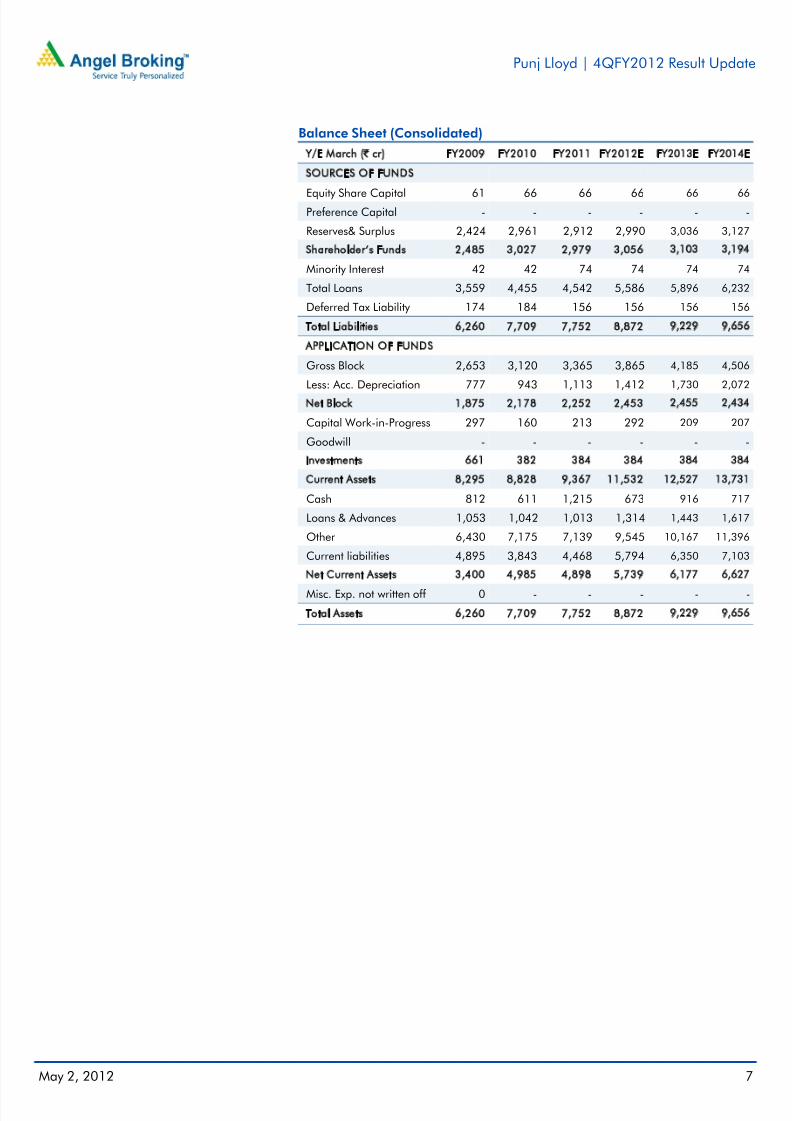
Balance Sheet (Consolidated)
Y/E March (` cr) FY2009 FY2010 FY2011 FY2012E FY2013E FY2014E
SOURCES OF FUNDS
Equity Share Capital 61 66 66 66 66 66Preference Capital - - - - - -
Reserves& Surplus 2,424 2,961 2,912 2,990 3,036 3,127
Shareholder’s Funds 2,485 3,027 2,979 3,056 3,103 3,194
Minority Interest 42 42 74 74 74 74
Total Loans 3,559 4,455 4,542 5,586 5,896 6,232
Deferred Tax Liability 174 184 156 156 156 156
Total Liabilities 6,260 7,709 7,752 8,872 9,229 9,656
APPLICATION OF FUNDS
Gross Block 2,653 3,120 3,365 3,865 4,185 4,506
Less: Acc. Depreciation 777 943 1,113 1,412 1,730 2,072
Net Block 1,875 2,178 2,252 2,453 2,455 2,434
Capital Work-in-Progress 297 160 213 292 209 207
Goodwill - - - - - -
Investments 661 382 384 384 384 384
Current Assets 8,295 8,828 9,367 11,532 12,527 13,731
Cash 812 611 1,215 673 916 717
Loans & Advances 1,053 1,042 1,013 1,314 1,443 1,617
Other 6,430 7,175 7,139 9,545 10,167 11,396
Current liabilities 4,895 3,843 4,468 5,794 6,350 7,103
Net Current Assets 3,400 4,985 4,898 5,739 6,177 6,627
Misc. Exp. not written off 0 - - - - -
Total Assets 6,260 7,709 7,752 8,872 9,229 9,656
8/2/2019 Punj Lloyd Result Updated
http://slidepdf.com/reader/full/punj-lloyd-result-updated 8/10
Punj Lloyd | 4QFY2012 Result Update
May 2, 2012 8
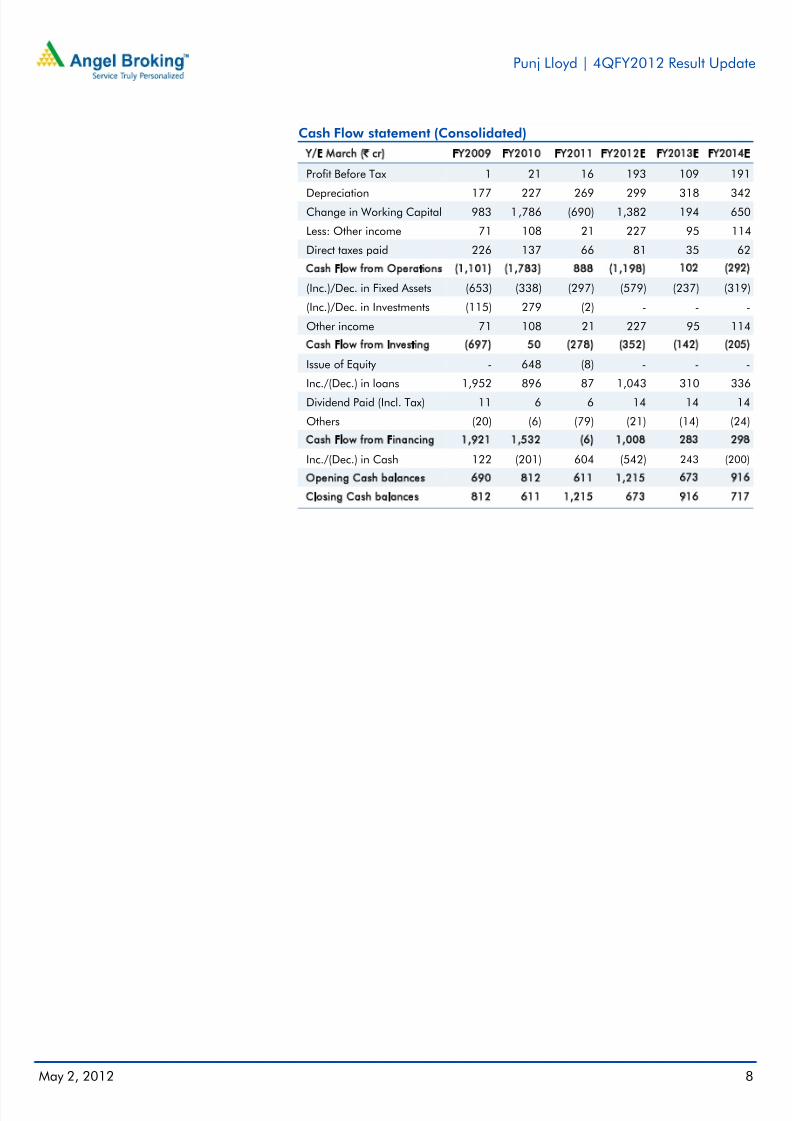
Cash Flow statement (Consolidated)
Y/E March (` cr) FY2009 FY2010 FY2011 FY2012E FY2013E FY2014E
Profit Before Tax 1 21 16 193 109 191
Depreciation 177 227 269 299 318 342Change in Working Capital 983 1,786 (690) 1,382 194 650
Less: Other income 71 108 21 227 95 114
Direct taxes paid 226 137 66 81 35 62
Cash Flow from Operations (1,101) (1,783) 888 (1,198) 102 (292)
(Inc.)/Dec. in Fixed Assets (653) (338) (297) (579) (237) (319)
(Inc.)/Dec. in Investments (115) 279 (2) - - -
Other income 71 108 21 227 95 114
Cash Flow from Investing (697) 50 (278) (352) (142) (205)
Issue of Equity - 648 (8) - - -
Inc./(Dec.) in loans 1,952 896 87 1,043 310 336
Dividend Paid (Incl. Tax) 11 6 6 14 14 14
Others (20) (6) (79) (21) (14) (24)
Cash Flow from Financing 1,921 1,532 (6) 1,008 283 298
Inc./(Dec.) in Cash 122 (201) 604 (542) 243 (200)
Opening Cash balances 690 812 611 1,215 673 916
Closing Cash balances 812 611 1,215 673 916 717
8/2/2019 Punj Lloyd Result Updated
http://slidepdf.com/reader/full/punj-lloyd-result-updated 9/10
Punj Lloyd | 4QFY2012 Result Update
May 2, 2012 9
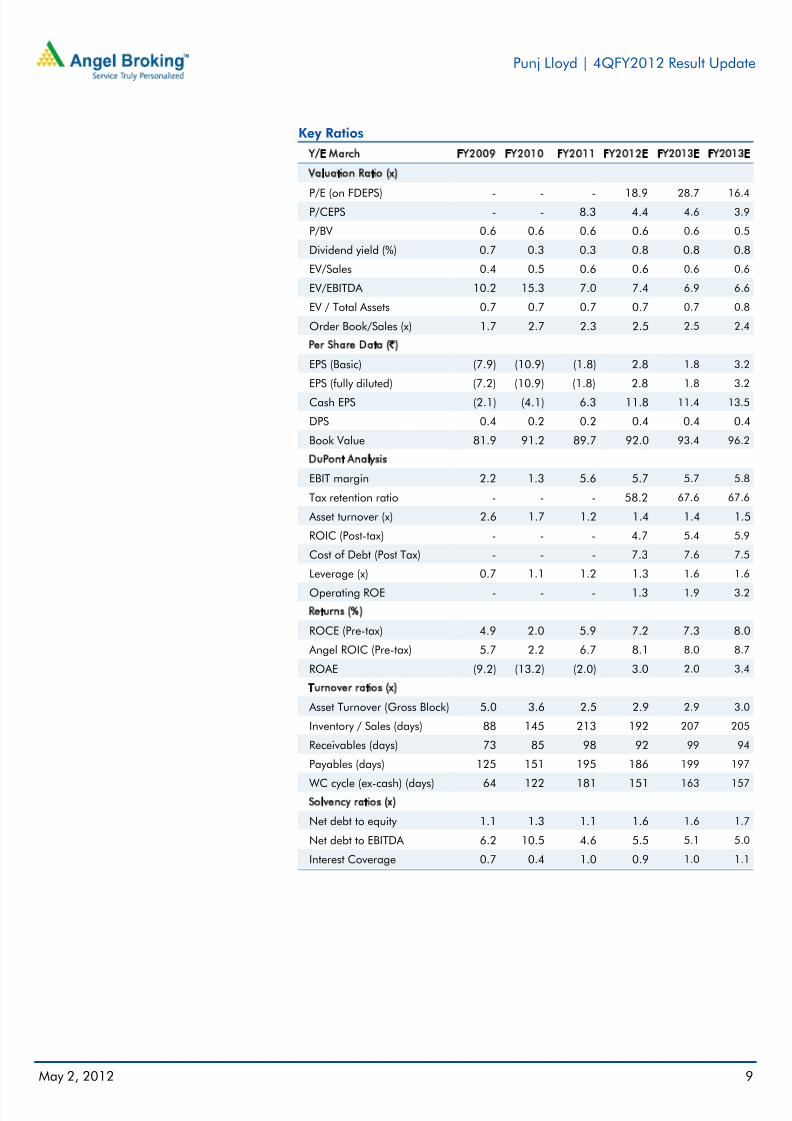
Key Ratios
Y/E March FY2009 FY2010 FY2011 FY2012E FY2013E FY2013E
Valuation Ratio (x)
P/E (on FDEPS) - - - 18.9 28.7 16.4P/CEPS - - 8.3 4.4 4.6 3.9
P/BV 0.6 0.6 0.6 0.6 0.6 0.5
Dividend yield (%) 0.7 0.3 0.3 0.8 0.8 0.8
EV/Sales 0.4 0.5 0.6 0.6 0.6 0.6
EV/EBITDA 10.2 15.3 7.0 7.4 6.9 6.6
EV / Total Assets 0.7 0.7 0.7 0.7 0.7 0.8
Order Book/Sales (x) 1.7 2.7 2.3 2.5 2.5 2.4
Per Share Data (`)EPS (Basic) (7.9) (10.9) (1.8) 2.8 1.8 3.2
EPS (fully diluted) (7.2) (10.9) (1.8) 2.8 1.8 3.2
Cash EPS (2.1) (4.1) 6.3 11.8 11.4 13.5
DPS 0.4 0.2 0.2 0.4 0.4 0.4
Book Value 81.9 91.2 89.7 92.0 93.4 96.2
DuPont Analysis
EBIT margin 2.2 1.3 5.6 5.7 5.7 5.8
Tax retention ratio - - - 58.2 67.6 67.6
Asset turnover (x) 2.6 1.7 1.2 1.4 1.4 1.5
ROIC (Post-tax) - - - 4.7 5.4 5.9
Cost of Debt (Post Tax) - - - 7.3 7.6 7.5
Leverage (x) 0.7 1.1 1.2 1.3 1.6 1.6
Operating ROE - - - 1.3 1.9 3.2
Returns (%)
ROCE (Pre-tax) 4.9 2.0 5.9 7.2 7.3 8.0
Angel ROIC (Pre-tax) 5.7 2.2 6.7 8.1 8.0 8.7
ROAE (9.2) (13.2) (2.0) 3.0 2.0 3.4
Turnover ratios (x)
Asset Turnover (Gross Block) 5.0 3.6 2.5 2.9 2.9 3.0
Inventory / Sales (days) 88 145 213 192 207 205
Receivables (days) 73 85 98 92 99 94
Payables (days) 125 151 195 186 199 197
WC cycle (ex-cash) (days) 64 122 181 151 163 157Solvency ratios (x)
Net debt to equity 1.1 1.3 1.1 1.6 1.6 1.7
Net debt to EBITDA 6.2 10.5 4.6 5.5 5.1 5.0
Interest Coverage 0.7 0.4 1.0 0.9 1.0 1.1
8/2/2019 Punj Lloyd Result Updated
http://slidepdf.com/reader/full/punj-lloyd-result-updated 10/10
Punj Lloyd | 4QFY2012 Result Update
May 2, 2012 10
Research Team Tel: 022 - 39357800 E-mail: [email protected] Website: www.angelbrokling.com
DISCLAIMER
This document is solely for the personal information of the recipient, and must not be singularly used as the basis of any investmentdecision. Nothing in this document should be construed as investment or financial advice. Each recipient of this document should make
such investigations as they deem necessary to arrive at an independent evaluation of an investment in the securities of the companies
referred to in this document (including the merits and risks involved), and should consult their own advisors to determine the merits and
risks of such an investment.
Angel Broking Limited, its affiliates, directors, its proprietary trading and investment businesses may, from time to time, make
investment decisions that are inconsistent with or contradictory to the recommendations expressed herein. The views contained in this
document are those of the analyst, and the company may or may not subscribe to all the views expressed within.
Reports based on technical and derivative analysis center on studying charts of a stock's price movement, outstanding positions and
trading volume, as opposed to focusing on a company's fundamentals and, as such, may not match with a report on a company's
fundamentals.
The information in this document has been printed on the basis of publicly available information, internal data and other reliablesources believed to be true, but we do not represent that it is accurate or complete and it should not be relied on as such, as thisdocument is for general guidance only. Angel Broking Limited or any of its affiliates/ group companies shall not be in any way responsible for any loss or damage that may arise to any person from any inadvertent error in the information contained in this report .
Angel Broking Limited has not independently verified all the information contained within this document. Accordingly, we cannot testify,nor make any representation or warranty, express or implied, to the accuracy, contents or data contained within this document. While Angel Broking Limited endeavours to update on a reasonable basis the information discussed in this material, there may be regulatory,compliance, or other reasons that prevent us from doing so.
This document is being supplied to you solely for your information, and its contents, information or data may not be reproduced,
redistributed or passed on, directly or indirectly.
Angel Broking Limited and its affiliates may seek to provide or have engaged in providing corporate finance, investment banking or
other advisory services in a merger or specific transaction to the companies referred to in this report, as on the date of this report or in
the past.
Neither Angel Broking Limited, nor its directors, employees or affiliates shall be liable for any loss or damage that may arise from or in
connection with the use of this information.
Note: Please refer to the important `Stock Holding Disclosure' report on the Angel website (Research Section). Also, pleaserefer to the latest update on respective stocks for the disclosure status in respect of those stocks. Angel Broking Limited andits affiliates may have investment positions in the stocks recommended in this report.
Disclosure of Interest Statement Punj Lloyd
1. Analyst ownership of the stock No
2. Angel and its Group companies ownership of the stock No
3. Angel and its Group companies' Directors ownership of the stock No
4. Broking relationship with company covered No
Note: We have not considered any Exposure below ` 1 lakh for Angel, its Group companies and Directors.
Ratings (Returns): Buy (> 15%) Accumulate (5% to 15%) Neutral (-5 to 5%)Reduce (-5% to 15%) Sell (< -15%)