Embed Size (px)
Citation preview
Engineering Structures 147 (2017) 177–194
Contents lists available at ScienceDirect
Engineering Structures
journal homepage: www.elsevier .com/ locate /engstruct
Punching shear failure in blast-loaded RC slabs and panels
http://dx.doi.org/10.1016/j.engstruct.2017.04.0510141-0296/� 2017 The Author(s). Published by Elsevier Ltd.This is an open access article under the CC BY license (http://creativecommons.org/licenses/by/4.0/).
⇑ Corresponding author at: Faculty of Engineering and Physical Sciences, CivilEngineering C5, Guildford, Surrey GU2 7XH, UK.
E-mail address: [email protected] (J. Sagaseta).1 Currently at Tokyo Polytechnic University, Kanagawa, Japan.2 Currently at Skidmore, Owings & Merrill, Inc., London, UK.
J. Sagaseta a,⇑, P. Olmati a,1, K. Micallef a,2, D. Cormie b
aDepartment of Civil and Environmental Engineering, University of Surrey, Guildford GU2 7XH, UKbResilience Security and Risk, Arup, London, UK
a r t i c l e i n f o a b s t r a c t
Article history:Received 23 August 2016Revised 30 March 2017Accepted 26 April 2017
Keywords:Punching shearBlast loadingStrain-rate effectsCritical Shear Crack TheoryNumerical simulations
Reinforced concrete (RC) slabs and panels are commonly encountered in critical infrastructure and indus-trial facilities with a high risk of close-range explosions due to accidents or terrorist attacks. Close-in det-onations lead to high intensity concentrated loads which can cause a premature brittle punching failureof the member. The assessment of such type of failure mode is challenging since the loading source variesits magnitude in space and time. This paper proposes an analytical method by which the occurrence ofpunching (or otherwise) is assessed by comparing the dynamic shear demand and capacity (supply).An exponentially decaying distribution of reflected overpressures on the RC surface is presented for thisanalysis. The punching shear demand is estimated from the pressure and inertial forces acting in the free-body diagram. The dynamic punching shear capacity is obtained using the Critical Shear Crack Theorywith small slab deformations which are predicted from an equivalent single-degree-of-freedom model.The proposed approach takes into account the impulsive behaviour of the member leading to a higherpunching capacity and provides better predictions than using existing formulae for punching whichare based on tests with quasi-static loading and deformations. The proposed analytical equations are fur-ther supported by numerical explicit finite element models providing useful information of crack devel-opment, dynamic reactions and deflections. The application of the proposed method has been illustratedand validated by comparison with various tests with scale distances from 0.2 to 1.5 m/kg1/3. A practicalexample is presented to illustrate the applicability of the proposed method.
� 2017 The Author(s). Published by Elsevier Ltd. This is an open access article under the CC BY license(http://creativecommons.org/licenses/by/4.0/).
1. Introduction
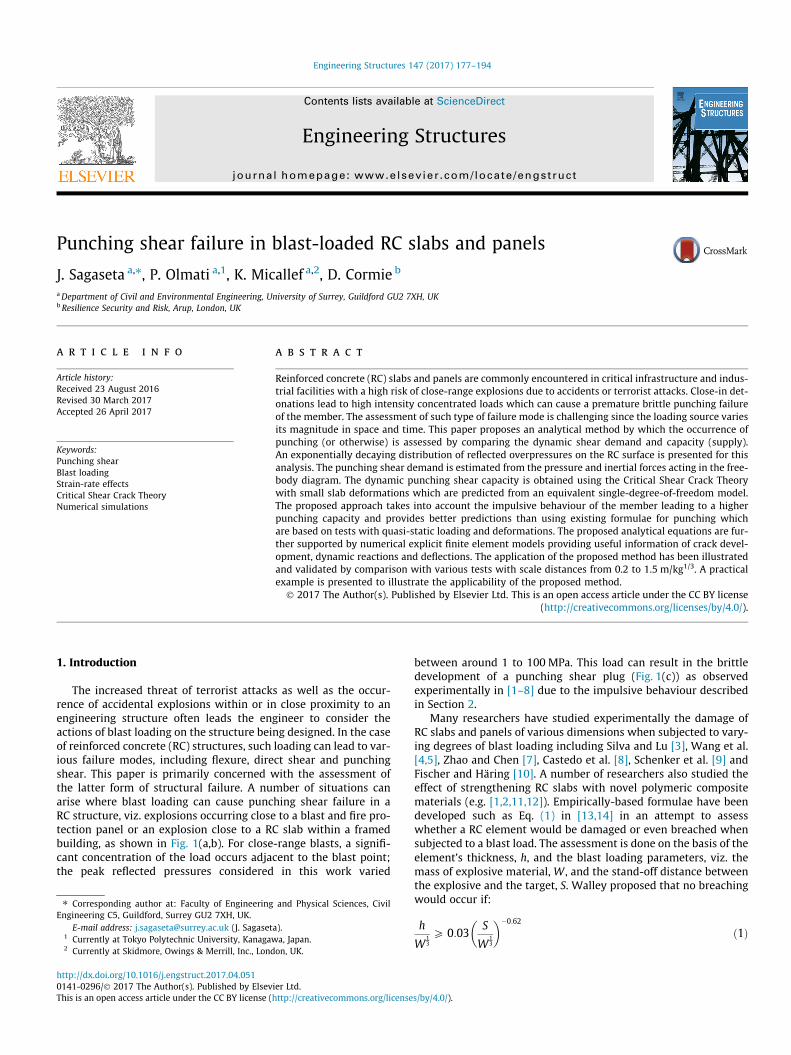
The increased threat of terrorist attacks as well as the occur-rence of accidental explosions within or in close proximity to anengineering structure often leads the engineer to consider theactions of blast loading on the structure being designed. In the caseof reinforced concrete (RC) structures, such loading can lead to var-ious failure modes, including flexure, direct shear and punchingshear. This paper is primarily concerned with the assessment ofthe latter form of structural failure. A number of situations canarise where blast loading can cause punching shear failure in aRC structure, viz. explosions occurring close to a blast and fire pro-tection panel or an explosion close to a RC slab within a framedbuilding, as shown in Fig. 1(a,b). For close-range blasts, a signifi-cant concentration of the load occurs adjacent to the blast point;the peak reflected pressures considered in this work varied
between around 1 to 100 MPa. This load can result in the brittledevelopment of a punching shear plug (Fig. 1(c)) as observedexperimentally in [1–8] due to the impulsive behaviour describedin Section 2.
Many researchers have studied experimentally the damage ofRC slabs and panels of various dimensions when subjected to vary-ing degrees of blast loading including Silva and Lu [3], Wang et al.[4,5], Zhao and Chen [7], Castedo et al. [8], Schenker et al. [9] andFischer and Häring [10]. A number of researchers also studied theeffect of strengthening RC slabs with novel polymeric compositematerials (e.g. [1,2,11,12]). Empirically-based formulae have beendeveloped such as Eq. (1) in [13,14] in an attempt to assesswhether a RC element would be damaged or even breached whensubjected to a blast load. The assessment is done on the basis of theelement’s thickness, h, and the blast loading parameters, viz. themass of explosive material, W , and the stand-off distance betweenthe explosive and the target, S. Walley proposed that no breachingwould occur if:
h
W13P 0:03
S
W13
� ��0:62
ð1Þ
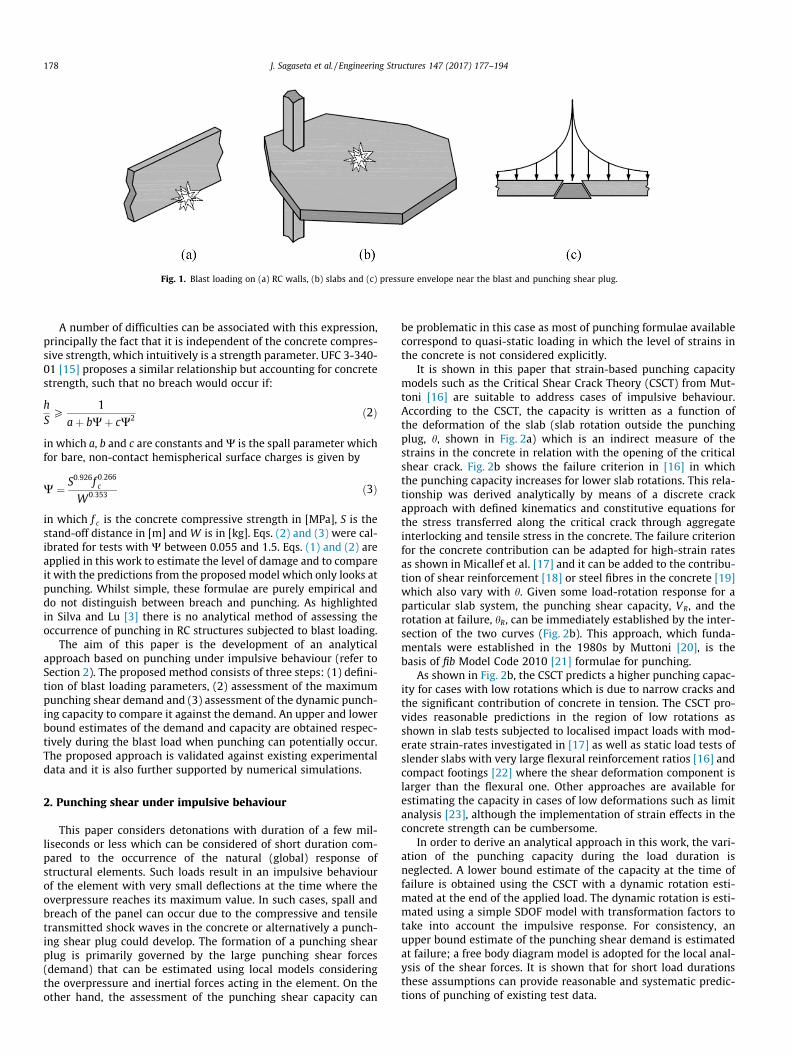
Fig. 1. Blast loading on (a) RC walls, (b) slabs and (c) pressure envelope near the blast and punching shear plug.
178 J. Sagaseta et al. / Engineering Structures 147 (2017) 177–194
A number of difficulties can be associated with this expression,principally the fact that it is independent of the concrete compres-sive strength, which intuitively is a strength parameter. UFC 3-340-01 [15] proposes a similar relationship but accounting for concretestrength, such that no breach would occur if:
hSP
1
aþ bWþ cW2 ð2Þ
in which a, b and c are constants andW is the spall parameter whichfor bare, non-contact hemispherical surface charges is given by
W ¼ S0:926f 0:266c
W0:353 ð3Þ
in which f c is the concrete compressive strength in [MPa], S is thestand-off distance in [m] and W is in [kg]. Eqs. (2) and (3) were cal-ibrated for tests with W between 0.055 and 1.5. Eqs. (1) and (2) areapplied in this work to estimate the level of damage and to compareit with the predictions from the proposed model which only looks atpunching. Whilst simple, these formulae are purely empirical anddo not distinguish between breach and punching. As highlightedin Silva and Lu [3] there is no analytical method of assessing theoccurrence of punching in RC structures subjected to blast loading.
The aim of this paper is the development of an analyticalapproach based on punching under impulsive behaviour (refer toSection 2). The proposed method consists of three steps: (1) defini-tion of blast loading parameters, (2) assessment of the maximumpunching shear demand and (3) assessment of the dynamic punch-ing capacity to compare it against the demand. An upper and lowerbound estimates of the demand and capacity are obtained respec-tively during the blast load when punching can potentially occur.The proposed approach is validated against existing experimentaldata and it is also further supported by numerical simulations.
2. Punching shear under impulsive behaviour
This paper considers detonations with duration of a few mil-liseconds or less which can be considered of short duration com-pared to the occurrence of the natural (global) response ofstructural elements. Such loads result in an impulsive behaviourof the element with very small deflections at the time where theoverpressure reaches its maximum value. In such cases, spall andbreach of the panel can occur due to the compressive and tensiletransmitted shock waves in the concrete or alternatively a punch-ing shear plug could develop. The formation of a punching shearplug is primarily governed by the large punching shear forces(demand) that can be estimated using local models consideringthe overpressure and inertial forces acting in the element. On theother hand, the assessment of the punching shear capacity can
be problematic in this case as most of punching formulae availablecorrespond to quasi-static loading in which the level of strains inthe concrete is not considered explicitly.
It is shown in this paper that strain-based punching capacitymodels such as the Critical Shear Crack Theory (CSCT) from Mut-toni [16] are suitable to address cases of impulsive behaviour.According to the CSCT, the capacity is written as a function ofthe deformation of the slab (slab rotation outside the punchingplug, h, shown in Fig. 2a) which is an indirect measure of thestrains in the concrete in relation with the opening of the criticalshear crack. Fig. 2b shows the failure criterion in [16] in whichthe punching capacity increases for lower slab rotations. This rela-tionship was derived analytically by means of a discrete crackapproach with defined kinematics and constitutive equations forthe stress transferred along the critical crack through aggregateinterlocking and tensile stress in the concrete. The failure criterionfor the concrete contribution can be adapted for high-strain ratesas shown in Micallef et al. [17] and it can be added to the contribu-tion of shear reinforcement [18] or steel fibres in the concrete [19]which also vary with h. Given some load-rotation response for aparticular slab system, the punching shear capacity, VR, and therotation at failure, hR, can be immediately established by the inter-section of the two curves (Fig. 2b). This approach, which funda-mentals were established in the 1980s by Muttoni [20], is thebasis of fib Model Code 2010 [21] formulae for punching.
As shown in Fig. 2b, the CSCT predicts a higher punching capac-ity for cases with low rotations which is due to narrow cracks andthe significant contribution of concrete in tension. The CSCT pro-vides reasonable predictions in the region of low rotations asshown in slab tests subjected to localised impact loads with mod-erate strain-rates investigated in [17] as well as static load tests ofslender slabs with very large flexural reinforcement ratios [16] andcompact footings [22] where the shear deformation component islarger than the flexural one. Other approaches are available forestimating the capacity in cases of low deformations such as limitanalysis [23], although the implementation of strain effects in theconcrete strength can be cumbersome.
In order to derive an analytical approach in this work, the vari-ation of the punching capacity during the load duration isneglected. A lower bound estimate of the capacity at the time offailure is obtained using the CSCT with a dynamic rotation esti-mated at the end of the applied load. The dynamic rotation is esti-mated using a simple SDOF model with transformation factors totake into account the impulsive response. For consistency, anupper bound estimate of the punching shear demand is estimatedat failure; a free body diagram model is adopted for the local anal-ysis of the shear forces. It is shown that for short load durationsthese assumptions can provide reasonable and systematic predic-tions of punching of existing test data.
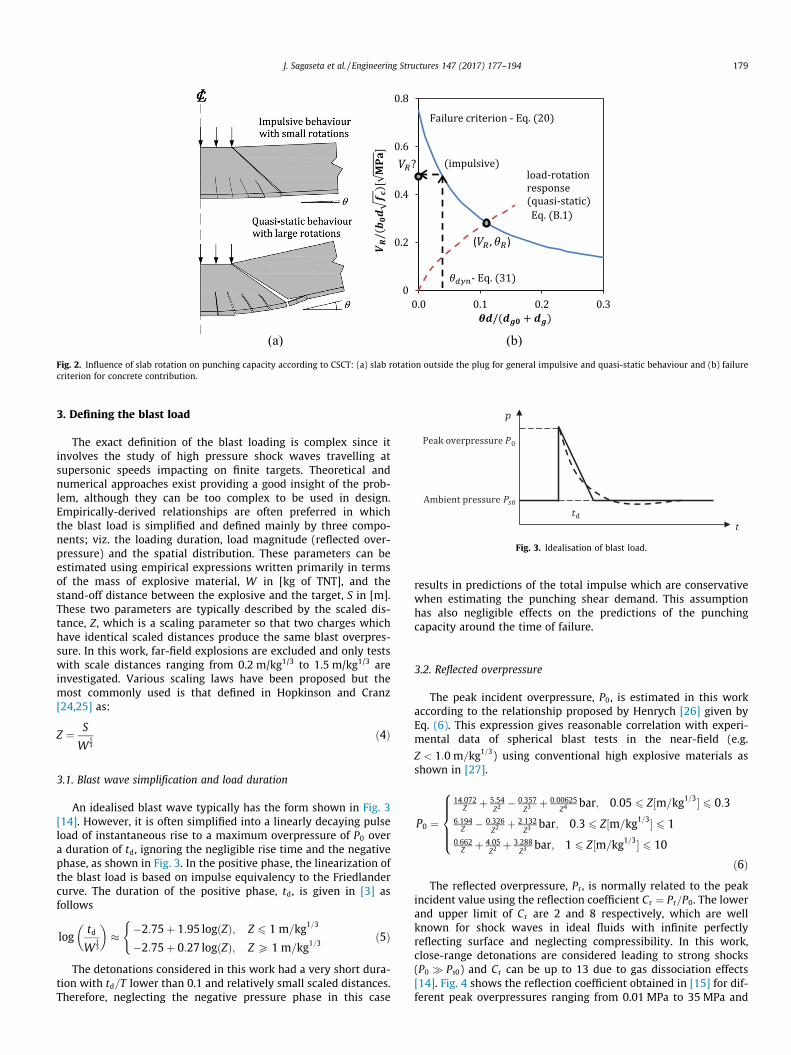
Fig. 2. Influence of slab rotation on punching capacity according to CSCT: (a) slab rotation outside the plug for general impulsive and quasi-static behaviour and (b) failurecriterion for concrete contribution.
Fig. 3. Idealisation of blast load.
J. Sagaseta et al. / Engineering Structures 147 (2017) 177–194 179
3. Defining the blast load
The exact definition of the blast loading is complex since itinvolves the study of high pressure shock waves travelling atsupersonic speeds impacting on finite targets. Theoretical andnumerical approaches exist providing a good insight of the prob-lem, although they can be too complex to be used in design.Empirically-derived relationships are often preferred in whichthe blast load is simplified and defined mainly by three compo-nents; viz. the loading duration, load magnitude (reflected over-pressure) and the spatial distribution. These parameters can beestimated using empirical expressions written primarily in termsof the mass of explosive material, W in [kg of TNT], and thestand-off distance between the explosive and the target, S in [m].These two parameters are typically described by the scaled dis-tance, Z, which is a scaling parameter so that two charges whichhave identical scaled distances produce the same blast overpres-sure. In this work, far-field explosions are excluded and only testswith scale distances ranging from 0.2 m/kg1/3 to 1.5 m/kg1/3 areinvestigated. Various scaling laws have been proposed but themost commonly used is that defined in Hopkinson and Cranz[24,25] as:
Z ¼ S
W13
ð4Þ
3.1. Blast wave simplification and load duration
An idealised blast wave typically has the form shown in Fig. 3[14]. However, it is often simplified into a linearly decaying pulseload of instantaneous rise to a maximum overpressure of P0 overa duration of td, ignoring the negligible rise time and the negativephase, as shown in Fig. 3. In the positive phase, the linearization ofthe blast load is based on impulse equivalency to the Friedlandercurve. The duration of the positive phase, td, is given in [3] asfollows
logtdW
13
� �� �2:75þ 1:95 logðZÞ; Z 6 1 m=kg1=3
�2:75þ 0:27 logðZÞ; Z P 1 m=kg1=3
(ð5Þ
The detonations considered in this work had a very short dura-tion with td=T lower than 0.1 and relatively small scaled distances.Therefore, neglecting the negative pressure phase in this case
results in predictions of the total impulse which are conservativewhen estimating the punching shear demand. This assumptionhas also negligible effects on the predictions of the punchingcapacity around the time of failure.
3.2. Reflected overpressure
The peak incident overpressure, P0, is estimated in this workaccording to the relationship proposed by Henrych [26] given byEq. (6). This expression gives reasonable correlation with experi-mental data of spherical blast tests in the near-field (e.g.
Z < 1:0 m=kg1=3) using conventional high explosive materials asshown in [27].
P0 ¼
14:072Z þ 5:54
Z2� 0:357
Z3þ 0:00625
Z4bar; 0:05 6 Z½m=kg1=3� 6 0:3
6:194Z � 0:326
Z2þ 2:132
Z3bar; 0:3 6 Z½m=kg1=3� 6 1
0:662Z þ 4:05
Z2þ 3:288
Z3bar; 1 6 Z½m=kg1=3� 6 10
8>>><>>>:
ð6ÞThe reflected overpressure, Pr, is normally related to the peak
incident value using the reflection coefficient Cr ¼ Pr=P0. The lowerand upper limit of Cr are 2 and 8 respectively, which are wellknown for shock waves in ideal fluids with infinite perfectlyreflecting surface and neglecting compressibility. In this work,close-range detonations are considered leading to strong shocks(P0 � Ps0) and Cr can be up to 13 due to gas dissociation effects[14]. Fig. 4 shows the reflection coefficient obtained in [15] for dif-ferent peak overpressures ranging from 0.01 MPa to 35 MPa and
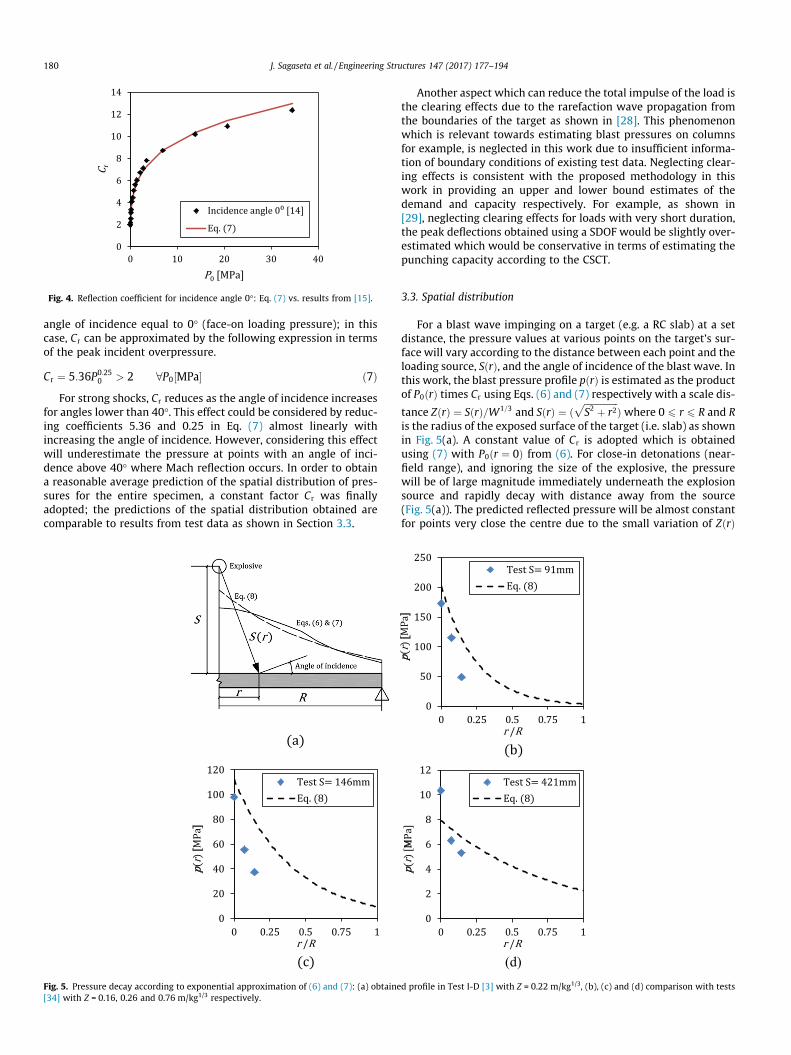
Fig. 4. Reflection coefficient for incidence angle 0�: Eq. (7) vs. results from [15].
180 J. Sagaseta et al. / Engineering Structures 147 (2017) 177–194
angle of incidence equal to 0� (face-on loading pressure); in thiscase, Cr can be approximated by the following expression in termsof the peak incident overpressure.
Cr ¼ 5:36P0:250 > 2 8P0½MPa� ð7Þ
For strong shocks, Cr reduces as the angle of incidence increasesfor angles lower than 40�. This effect could be considered by reduc-ing coefficients 5.36 and 0.25 in Eq. (7) almost linearly withincreasing the angle of incidence. However, considering this effectwill underestimate the pressure at points with an angle of inci-dence above 40� where Mach reflection occurs. In order to obtaina reasonable average prediction of the spatial distribution of pres-sures for the entire specimen, a constant factor Cr was finallyadopted; the predictions of the spatial distribution obtained arecomparable to results from test data as shown in Section 3.3.
Fig. 5. Pressure decay according to exponential approximation of (6) and (7): (a) obtaine[34] with Z = 0.16, 0.26 and 0.76 m/kg1/3 respectively.
Another aspect which can reduce the total impulse of the load isthe clearing effects due to the rarefaction wave propagation fromthe boundaries of the target as shown in [28]. This phenomenonwhich is relevant towards estimating blast pressures on columnsfor example, is neglected in this work due to insufficient informa-tion of boundary conditions of existing test data. Neglecting clear-ing effects is consistent with the proposed methodology in thiswork in providing an upper and lower bound estimates of thedemand and capacity respectively. For example, as shown in[29], neglecting clearing effects for loads with very short duration,the peak deflections obtained using a SDOF would be slightly over-estimated which would be conservative in terms of estimating thepunching capacity according to the CSCT.
3.3. Spatial distribution
For a blast wave impinging on a target (e.g. a RC slab) at a setdistance, the pressure values at various points on the target’s sur-face will vary according to the distance between each point and theloading source, SðrÞ, and the angle of incidence of the blast wave. Inthis work, the blast pressure profile pðrÞ is estimated as the productof P0ðrÞ times Cr using Eqs. (6) and (7) respectively with a scale dis-
tance ZðrÞ ¼ SðrÞ=W1=3 and SðrÞ ¼ ðffiffiffiffiffiffiffiffiffiffiffiffiffiffiffiS2 þ r2
pÞ where 0 6 r 6 R and R
is the radius of the exposed surface of the target (i.e. slab) as shownin Fig. 5(a). A constant value of Cr is adopted which is obtainedusing (7) with P0ðr ¼ 0Þ from (6). For close-in detonations (near-field range), and ignoring the size of the explosive, the pressurewill be of large magnitude immediately underneath the explosionsource and rapidly decay with distance away from the source(Fig. 5(a)). The predicted reflected pressure will be almost constantfor points very close the centre due to the small variation of ZðrÞ
d profile in Test I-D [3] with Z = 0.22 m/kg1/3, (b), (c) and (d) comparison with tests
J. Sagaseta et al. / Engineering Structures 147 (2017) 177–194 181
whereas the pressure decays almost exponentially at furtherpoints. Fig. 5(a) shows that the reflected pressure profile can beapproximated to an exponentially decaying function of the formgiven by (8) which is common in practice ([30–33]). In this paper,parameters a and Pr0 are obtained systematically from a least-square exponential fitting of the results given by Eqs. (6) and (7)for the range of r from 0 to R as shown in Fig. 5(a). Alternatively,parameters a and Pr0 could be obtained empirically from pressuremeasurements (if they were available), however this approach isnot practical for general cases in design and therefore it was notadopted in this work.
pðrÞ ¼ Pr0e�ar ð8ÞParameters a and Pr0 were calculated systematically from (6)
and (7) for different detonations and slab geometries coveringcases where punching is uncertain with Z between 0.2 and1.5 m/kg1/3 and S=R between 0.25 and 1.5; in such cases the twoblast parameters can be approximated as:
a ¼ ð3:5=RÞe�1:7S=R ð9Þ
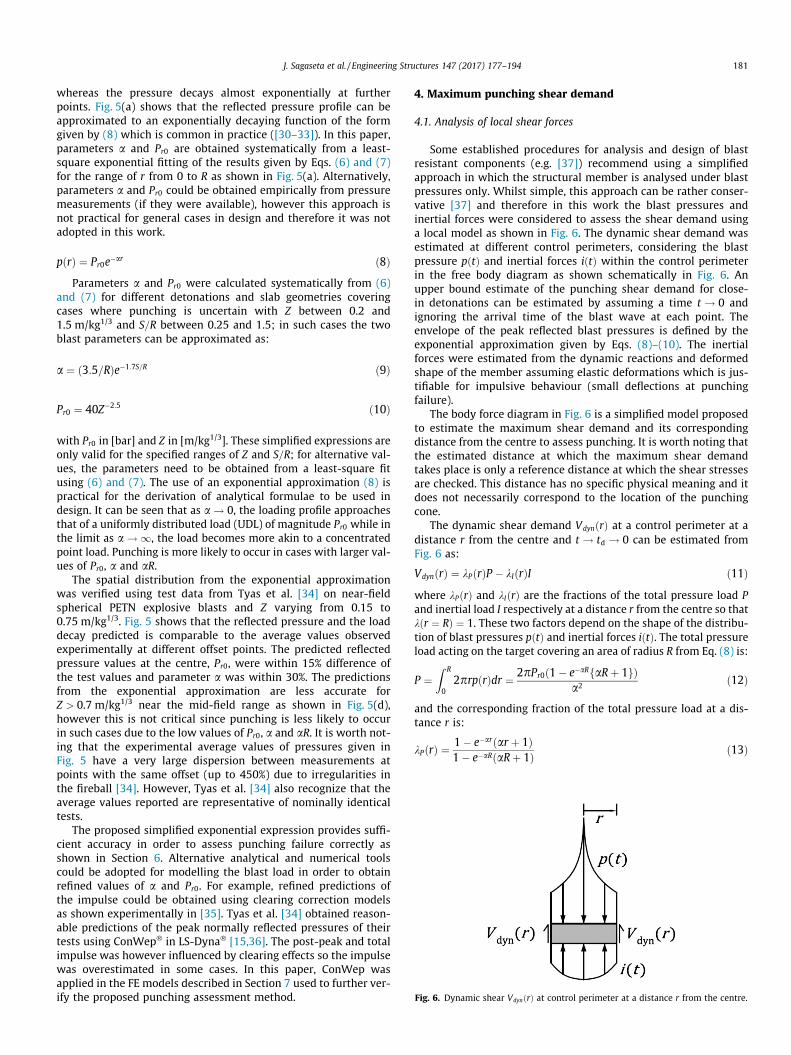
Fig. 6. Dynamic shear VdynðrÞ at control perimeter at a distance r from the centre.
Pr0 ¼ 40Z�2:5 ð10Þ
with Pr0 in [bar] and Z in [m/kg1/3]. These simplified expressions areonly valid for the specified ranges of Z and S=R; for alternative val-ues, the parameters need to be obtained from a least-square fitusing (6) and (7). The use of an exponential approximation (8) ispractical for the derivation of analytical formulae to be used indesign. It can be seen that as a ! 0, the loading profile approachesthat of a uniformly distributed load (UDL) of magnitude Pr0 while inthe limit as a ! 1, the load becomes more akin to a concentratedpoint load. Punching is more likely to occur in cases with larger val-ues of Pr0, a and aR.
The spatial distribution from the exponential approximationwas verified using test data from Tyas et al. [34] on near-fieldspherical PETN explosive blasts and Z varying from 0.15 to0.75 m/kg1/3. Fig. 5 shows that the reflected pressure and the loaddecay predicted is comparable to the average values observedexperimentally at different offset points. The predicted reflectedpressure values at the centre, Pr0, were within 15% difference ofthe test values and parameter a was within 30%. The predictionsfrom the exponential approximation are less accurate forZ > 0.7 m/kg1/3 near the mid-field range as shown in Fig. 5(d),however this is not critical since punching is less likely to occurin such cases due to the low values of Pr0, a and aR. It is worth not-ing that the experimental average values of pressures given inFig. 5 have a very large dispersion between measurements atpoints with the same offset (up to 450%) due to irregularities inthe fireball [34]. However, Tyas et al. [34] also recognize that theaverage values reported are representative of nominally identicaltests.
The proposed simplified exponential expression provides suffi-cient accuracy in order to assess punching failure correctly asshown in Section 6. Alternative analytical and numerical toolscould be adopted for modelling the blast load in order to obtainrefined values of a and Pr0. For example, refined predictions ofthe impulse could be obtained using clearing correction modelsas shown experimentally in [35]. Tyas et al. [34] obtained reason-able predictions of the peak normally reflected pressures of theirtests using ConWep� in LS-Dyna� [15,36]. The post-peak and totalimpulse was however influenced by clearing effects so the impulsewas overestimated in some cases. In this paper, ConWep wasapplied in the FE models described in Section 7 used to further ver-ify the proposed punching assessment method.
4. Maximum punching shear demand
4.1. Analysis of local shear forces
Some established procedures for analysis and design of blastresistant components (e.g. [37]) recommend using a simplifiedapproach in which the structural member is analysed under blastpressures only. Whilst simple, this approach can be rather conser-vative [37] and therefore in this work the blast pressures andinertial forces were considered to assess the shear demand usinga local model as shown in Fig. 6. The dynamic shear demand wasestimated at different control perimeters, considering the blastpressure pðtÞ and inertial forces iðtÞ within the control perimeterin the free body diagram as shown schematically in Fig. 6. Anupper bound estimate of the punching shear demand for close-in detonations can be estimated by assuming a time t ! 0 andignoring the arrival time of the blast wave at each point. Theenvelope of the peak reflected blast pressures is defined by theexponential approximation given by Eqs. (8)–(10). The inertialforces were estimated from the dynamic reactions and deformedshape of the member assuming elastic deformations which is jus-tifiable for impulsive behaviour (small deflections at punchingfailure).
The body force diagram in Fig. 6 is a simplified model proposedto estimate the maximum shear demand and its correspondingdistance from the centre to assess punching. It is worth noting thatthe estimated distance at which the maximum shear demandtakes place is only a reference distance at which the shear stressesare checked. This distance has no specific physical meaning and itdoes not necessarily correspond to the location of the punchingcone.
The dynamic shear demand VdynðrÞ at a control perimeter at adistance r from the centre and t ! td ! 0 can be estimated fromFig. 6 as:
VdynðrÞ ¼ kPðrÞP � kIðrÞI ð11Þwhere kPðrÞ and kIðrÞ are the fractions of the total pressure load Pand inertial load I respectively at a distance r from the centre so thatkðr ¼ RÞ ¼ 1. These two factors depend on the shape of the distribu-tion of blast pressures pðtÞ and inertial forces iðtÞ. The total pressureload acting on the target covering an area of radius R from Eq. (8) is:
P ¼Z R
02prpðrÞdr ¼ 2pPr0ð1� e�aRfaRþ 1gÞ
a2 ð12Þ
and the corresponding fraction of the total pressure load at a dis-tance r is:
kPðrÞ ¼ 1� e�arðar þ 1Þ1� e�aRðaRþ 1Þ ð13Þ
182 J. Sagaseta et al. / Engineering Structures 147 (2017) 177–194
4.1.1. Estimation of inertial forces from dynamic reactionsThe distribution of the inertial forces follows the assumed
deflected shape of the slab which is given by the shape functionuðxÞ. For relatively low values of r, uðxÞ can be approximated usinga parabolic relationship for simply supported slabs or even forslabs fixed at the edges. This assumption was found to have a verysmall effect on the predicted dynamic shear demand compared tousing more complex functions of uðxÞ. Tests investigated in thispaper correspond to slabs supported at two ends, in this caseadopting a parabolic prismatic surface for the distribution of iðtÞresults in expression (14) which also satisfies kIðr ¼ RÞ ¼ 1. Eq.(14) is the fraction between the volumes of a parabolic prismand a truncated one (shown in Fig. 6) with a square base (in planview) with the same area as a circle with a radius equal to r.
kIðrÞ ¼ 1212� p
� �rR
� �21� p
12ðrRÞ2
� �� 1:36ðr=RÞ2 � 0:36ðr=RÞ4
ð14ÞFor slabs which are supported on four edges or situations with
axisymmetric global deformations, a paraboloid surface could beassumed for the calculation of parameter kIðrÞ.
As described in [38], the total inertial force I depends on theload P and the summation of the dynamic reactions at the sup-ports. The dynamic reaction is normally expressed in the form ofVdyn;reaction ¼ KReRe þ KPP where Re and P are the resistance and totalload respectively. The coefficients KRe and KP are normally given intables in the literature (e.g. [38]) for different boundary conditionsand types of loads (e.g. UDL and point load). For t ! 0 the deforma-tions are small and Re is negligible (i.e. Vdyn;reaction � KPP). Thus thetotal inertial force is:
I ¼ P �X
KPP ð15Þ
whereP
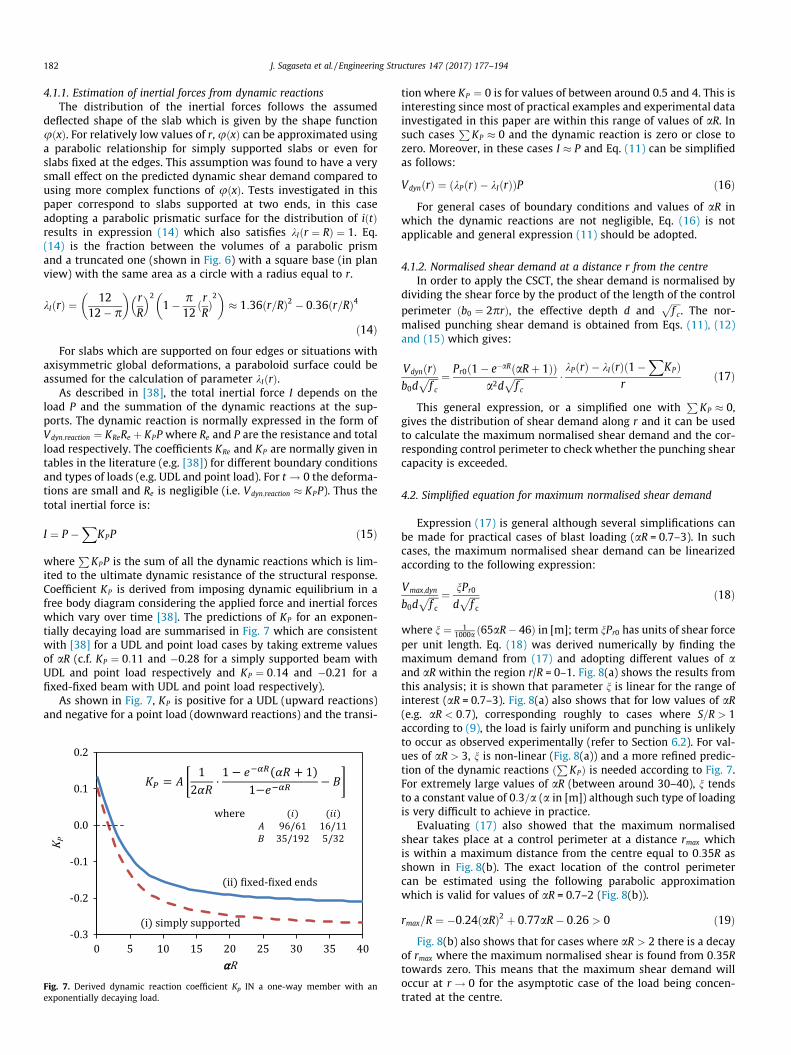
KPP is the sum of all the dynamic reactions which is lim-ited to the ultimate dynamic resistance of the structural response.Coefficient KP is derived from imposing dynamic equilibrium in afree body diagram considering the applied force and inertial forceswhich vary over time [38]. The predictions of KP for an exponen-tially decaying load are summarised in Fig. 7 which are consistentwith [38] for a UDL and point load cases by taking extreme valuesof aR (c.f. KP ¼ 0:11 and �0.28 for a simply supported beam withUDL and point load respectively and KP ¼ 0:14 and �0.21 for afixed-fixed beam with UDL and point load respectively).
As shown in Fig. 7, KP is positive for a UDL (upward reactions)and negative for a point load (downward reactions) and the transi-
Fig. 7. Derived dynamic reaction coefficient Kp IN a one-way member with anexponentially decaying load.
tion where KP ¼ 0 is for values of between around 0.5 and 4. This isinteresting since most of practical examples and experimental datainvestigated in this paper are within this range of values of aR. Insuch cases
PKP � 0 and the dynamic reaction is zero or close to
zero. Moreover, in these cases I � P and Eq. (11) can be simplifiedas follows:
VdynðrÞ ¼ ðkPðrÞ � kIðrÞÞP ð16ÞFor general cases of boundary conditions and values of aR in
which the dynamic reactions are not negligible, Eq. (16) is notapplicable and general expression (11) should be adopted.
4.1.2. Normalised shear demand at a distance r from the centreIn order to apply the CSCT, the shear demand is normalised by
dividing the shear force by the product of the length of the controlperimeter ðb0 ¼ 2prÞ, the effective depth d and
ffiffiffiffif c
p. The nor-
malised punching shear demand is obtained from Eqs. (11), (12)and (15) which gives:
VdynðrÞb0d
ffiffiffiffif c
p ¼ Pr0ð1� e�aRðaRþ 1ÞÞa2d
ffiffiffiffif c
p � kPðrÞ � kIðrÞð1�X
KPÞr
ð17Þ
This general expression, or a simplified one withP
KP � 0,gives the distribution of shear demand along r and it can be usedto calculate the maximum normalised shear demand and the cor-responding control perimeter to check whether the punching shearcapacity is exceeded.
4.2. Simplified equation for maximum normalised shear demand
Expression (17) is general although several simplifications canbe made for practical cases of blast loading (aR = 0.7–3). In suchcases, the maximum normalised shear demand can be linearizedaccording to the following expression:
Vmax;dyn
b0dffiffiffiffif c
p ¼ nPr0
dffiffiffiffif c
p ð18Þ
where n ¼ 11000a ð65aR� 46Þ in [m]; term nPr0 has units of shear force
per unit length. Eq. (18) was derived numerically by finding themaximum demand from (17) and adopting different values of aand aR within the region r/R = 0–1. Fig. 8(a) shows the results fromthis analysis; it is shown that parameter n is linear for the range ofinterest (aR = 0.7–3). Fig. 8(a) also shows that for low values of aR(e.g. aR < 0:7), corresponding roughly to cases where S=R > 1according to (9), the load is fairly uniform and punching is unlikelyto occur as observed experimentally (refer to Section 6.2). For val-ues of aR > 3, n is non-linear (Fig. 8(a)) and a more refined predic-tion of the dynamic reactions ðPKPÞ is needed according to Fig. 7.For extremely large values of aR (between around 30–40), n tendsto a constant value of 0:3=a (a in [m]) although such type of loadingis very difficult to achieve in practice.
Evaluating (17) also showed that the maximum normalisedshear takes place at a control perimeter at a distance rmax whichis within a maximum distance from the centre equal to 0:35R asshown in Fig. 8(b). The exact location of the control perimetercan be estimated using the following parabolic approximationwhich is valid for values of aR = 0.7–2 (Fig. 8(b)).
rmax=R ¼ �0:24ðaRÞ2 þ 0:77aR� 0:26 > 0 ð19ÞFig. 8(b) also shows that for cases where aR > 2 there is a decay
of rmax where the maximum normalised shear is found from 0:35Rtowards zero. This means that the maximum shear demand willoccur at r ! 0 for the asymptotic case of the load being concen-trated at the centre.
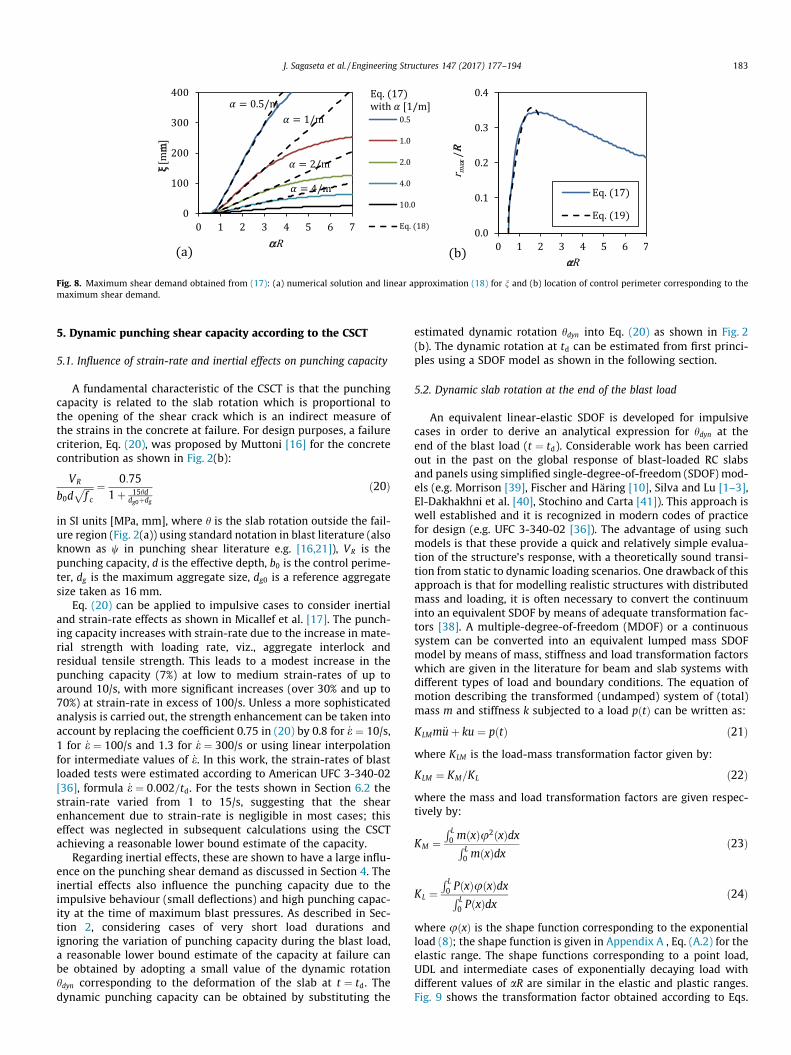
Fig. 8. Maximum shear demand obtained from (17): (a) numerical solution and linear approximation (18) for n and (b) location of control perimeter corresponding to themaximum shear demand.
J. Sagaseta et al. / Engineering Structures 147 (2017) 177–194 183
5. Dynamic punching shear capacity according to the CSCT
5.1. Influence of strain-rate and inertial effects on punching capacity
A fundamental characteristic of the CSCT is that the punchingcapacity is related to the slab rotation which is proportional tothe opening of the shear crack which is an indirect measure ofthe strains in the concrete at failure. For design purposes, a failurecriterion, Eq. (20), was proposed by Muttoni [16] for the concretecontribution as shown in Fig. 2(b):
VR
b0dffiffiffiffif c
p ¼ 0:751þ 15hd
dg0þdg
ð20Þ
in SI units [MPa, mm], where h is the slab rotation outside the fail-ure region (Fig. 2(a)) using standard notation in blast literature (alsoknown as w in punching shear literature e.g. [16,21]), VR is thepunching capacity, d is the effective depth, b0 is the control perime-ter, dg is the maximum aggregate size, dg0 is a reference aggregatesize taken as 16 mm.
Eq. (20) can be applied to impulsive cases to consider inertialand strain-rate effects as shown in Micallef et al. [17]. The punch-ing capacity increases with strain-rate due to the increase in mate-rial strength with loading rate, viz., aggregate interlock andresidual tensile strength. This leads to a modest increase in thepunching capacity (7%) at low to medium strain-rates of up toaround 10/s, with more significant increases (over 30% and up to70%) at strain-rate in excess of 100/s. Unless a more sophisticatedanalysis is carried out, the strength enhancement can be taken intoaccount by replacing the coefficient 0.75 in (20) by 0.8 for _e ¼ 10/s,1 for _e ¼ 100/s and 1.3 for _e ¼ 300/s or using linear interpolationfor intermediate values of _e. In this work, the strain-rates of blastloaded tests were estimated according to American UFC 3-340-02[36], formula _e ¼ 0:002=td. For the tests shown in Section 6.2 thestrain-rate varied from 1 to 15/s, suggesting that the shearenhancement due to strain-rate is negligible in most cases; thiseffect was neglected in subsequent calculations using the CSCTachieving a reasonable lower bound estimate of the capacity.
Regarding inertial effects, these are shown to have a large influ-ence on the punching shear demand as discussed in Section 4. Theinertial effects also influence the punching capacity due to theimpulsive behaviour (small deflections) and high punching capac-ity at the time of maximum blast pressures. As described in Sec-tion 2, considering cases of very short load durations andignoring the variation of punching capacity during the blast load,a reasonable lower bound estimate of the capacity at failure canbe obtained by adopting a small value of the dynamic rotationhdyn corresponding to the deformation of the slab at t ¼ td. Thedynamic punching capacity can be obtained by substituting the
estimated dynamic rotation hdyn into Eq. (20) as shown in Fig. 2(b). The dynamic rotation at td can be estimated from first princi-ples using a SDOF model as shown in the following section.
5.2. Dynamic slab rotation at the end of the blast load
An equivalent linear-elastic SDOF is developed for impulsivecases in order to derive an analytical expression for hdyn at theend of the blast load (t ¼ td). Considerable work has been carriedout in the past on the global response of blast-loaded RC slabsand panels using simplified single-degree-of-freedom (SDOF) mod-els (e.g. Morrison [39], Fischer and Häring [10], Silva and Lu [1–3],El-Dakhakhni et al. [40], Stochino and Carta [41]). This approach iswell established and it is recognized in modern codes of practicefor design (e.g. UFC 3-340-02 [36]). The advantage of using suchmodels is that these provide a quick and relatively simple evalua-tion of the structure’s response, with a theoretically sound transi-tion from static to dynamic loading scenarios. One drawback of thisapproach is that for modelling realistic structures with distributedmass and loading, it is often necessary to convert the continuuminto an equivalent SDOF by means of adequate transformation fac-tors [38]. A multiple-degree-of-freedom (MDOF) or a continuoussystem can be converted into an equivalent lumped mass SDOFmodel by means of mass, stiffness and load transformation factorswhich are given in the literature for beam and slab systems withdifferent types of load and boundary conditions. The equation ofmotion describing the transformed (undamped) system of (total)mass m and stiffness k subjected to a load pðtÞ can be written as:
KLMm€uþ ku ¼ pðtÞ ð21Þwhere KLM is the load-mass transformation factor given by:
KLM ¼ KM=KL ð22Þwhere the mass and load transformation factors are given respec-tively by:
KM ¼R L0 mðxÞu2ðxÞdxR L
0 mðxÞdxð23Þ
KL ¼R L0 PðxÞuðxÞdxR L
0 PðxÞdxð24Þ
where uðxÞ is the shape function corresponding to the exponentialload (8); the shape function is given in Appendix A , Eq. (A.2) for theelastic range. The shape functions corresponding to a point load,UDL and intermediate cases of exponentially decaying load withdifferent values of aR are similar in the elastic and plastic ranges.Fig. 9 shows the transformation factor obtained according to Eqs.
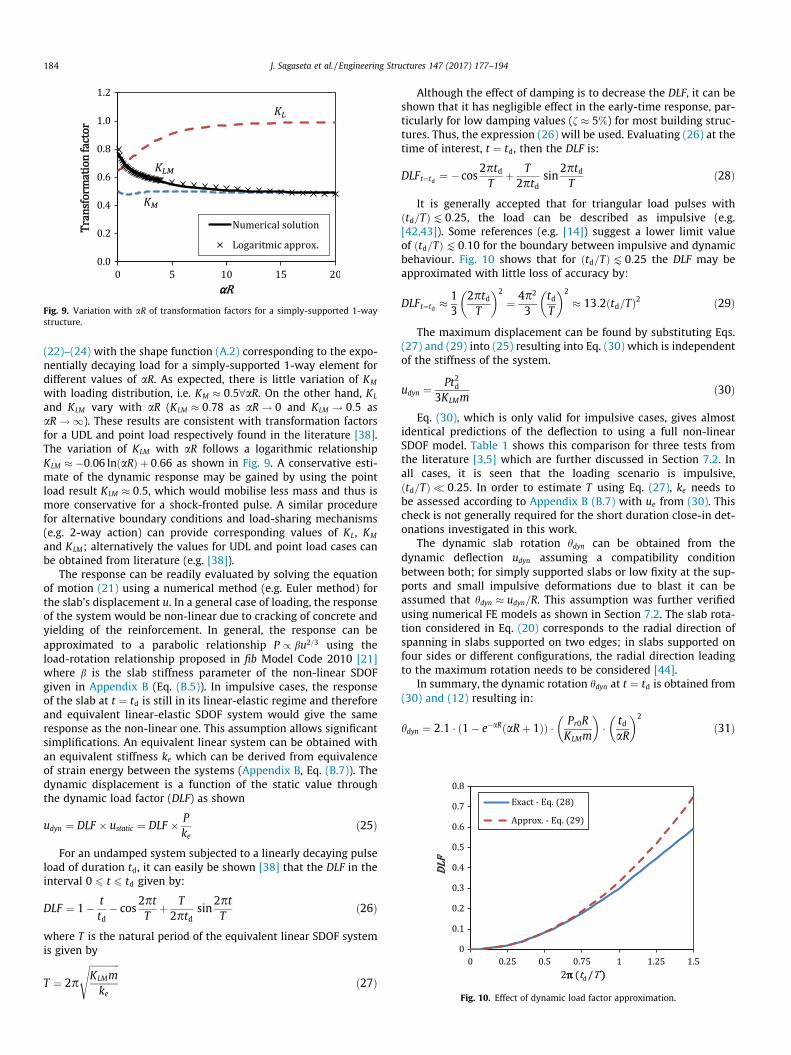
Fig. 9. Variation with aR of transformation factors for a simply-supported 1-waystructure.
Fig. 10. Effect of dynamic load factor approximation.
184 J. Sagaseta et al. / Engineering Structures 147 (2017) 177–194
(22)–(24) with the shape function (A.2) corresponding to the expo-nentially decaying load for a simply-supported 1-way element fordifferent values of aR. As expected, there is little variation of KM
with loading distribution, i.e. KM � 0:58aR. On the other hand, KL
and KLM vary with aR (KLM � 0:78 as aR ! 0 and KLM ! 0:5 asaR ! 1). These results are consistent with transformation factorsfor a UDL and point load respectively found in the literature [38].The variation of KLM with aR follows a logarithmic relationshipKLM � �0:06 lnðaRÞ þ 0:66 as shown in Fig. 9. A conservative esti-mate of the dynamic response may be gained by using the pointload result KLM � 0:5, which would mobilise less mass and thus ismore conservative for a shock-fronted pulse. A similar procedurefor alternative boundary conditions and load-sharing mechanisms(e.g. 2-way action) can provide corresponding values of KL, KM
and KLM; alternatively the values for UDL and point load cases canbe obtained from literature (e.g. [38]).
The response can be readily evaluated by solving the equationof motion (21) using a numerical method (e.g. Euler method) forthe slab’s displacement u. In a general case of loading, the responseof the system would be non-linear due to cracking of concrete andyielding of the reinforcement. In general, the response can beapproximated to a parabolic relationship P / bu2=3 using theload-rotation relationship proposed in fib Model Code 2010 [21]where b is the slab stiffness parameter of the non-linear SDOFgiven in Appendix B (Eq. (B.5)). In impulsive cases, the responseof the slab at t ¼ td is still in its linear-elastic regime and thereforeand equivalent linear-elastic SDOF system would give the sameresponse as the non-linear one. This assumption allows significantsimplifications. An equivalent linear system can be obtained withan equivalent stiffness ke which can be derived from equivalenceof strain energy between the systems (Appendix B, Eq. (B.7)). Thedynamic displacement is a function of the static value throughthe dynamic load factor (DLF) as shown
udyn ¼ DLF � ustatic ¼ DLF � Pke
ð25Þ
For an undamped system subjected to a linearly decaying pulseload of duration td, it can easily be shown [38] that the DLF in theinterval 0 6 t 6 td given by:
DLF ¼ 1� ttd
� cos2ptT
þ T2ptd
sin2ptT
ð26Þ
where T is the natural period of the equivalent linear SDOF systemis given by
T ¼ 2p
ffiffiffiffiffiffiffiffiffiffiffiffiffiKLMmke
sð27Þ
Although the effect of damping is to decrease the DLF, it can beshown that it has negligible effect in the early-time response, par-ticularly for low damping values (f � 5%) for most building struc-tures. Thus, the expression (26) will be used. Evaluating (26) at thetime of interest, t ¼ td, then the DLF is:
DLFt¼td ¼ � cos2ptdT
þ T2ptd
sin2ptdT
ð28Þ
It is generally accepted that for triangular load pulses withðtd=TÞK0:25, the load can be described as impulsive (e.g.[42,43]). Some references (e.g. [14]) suggest a lower limit valueof ðtd=TÞK0:10 for the boundary between impulsive and dynamicbehaviour. Fig. 10 shows that for ðtd=TÞK0:25 the DLF may beapproximated with little loss of accuracy by:
DLFt¼td � 13
2ptdT
� �2
¼ 4p2
3tdT
� �2
� 13:2ðtd=TÞ2 ð29Þ
The maximum displacement can be found by substituting Eqs.(27) and (29) into (25) resulting into Eq. (30) which is independentof the stiffness of the system.
udyn ¼ Pt2d3KLMm
ð30Þ
Eq. (30), which is only valid for impulsive cases, gives almostidentical predictions of the deflection to using a full non-linearSDOF model. Table 1 shows this comparison for three tests fromthe literature [3,5] which are further discussed in Section 7.2. Inall cases, it is seen that the loading scenario is impulsive,ðtd=TÞ � 0:25. In order to estimate T using Eq. (27), ke needs tobe assessed according to Appendix B (B.7) with ue from (30). Thischeck is not generally required for the short duration close-in det-onations investigated in this work.
The dynamic slab rotation hdyn can be obtained from thedynamic deflection udyn assuming a compatibility conditionbetween both; for simply supported slabs or low fixity at the sup-ports and small impulsive deformations due to blast it can beassumed that hdyn � udyn=R. This assumption was further verifiedusing numerical FE models as shown in Section 7.2. The slab rota-tion considered in Eq. (20) corresponds to the radial direction ofspanning in slabs supported on two edges; in slabs supported onfour sides or different configurations, the radial direction leadingto the maximum rotation needs to be considered [44].
In summary, the dynamic rotation hdyn at t ¼ td is obtained from(30) and (12) resulting in:
hdyn ¼ 2:1 � ð1� e�aRðaRþ 1ÞÞ � Pr0RKLMm
� �� td
aR
� �2
ð31Þ
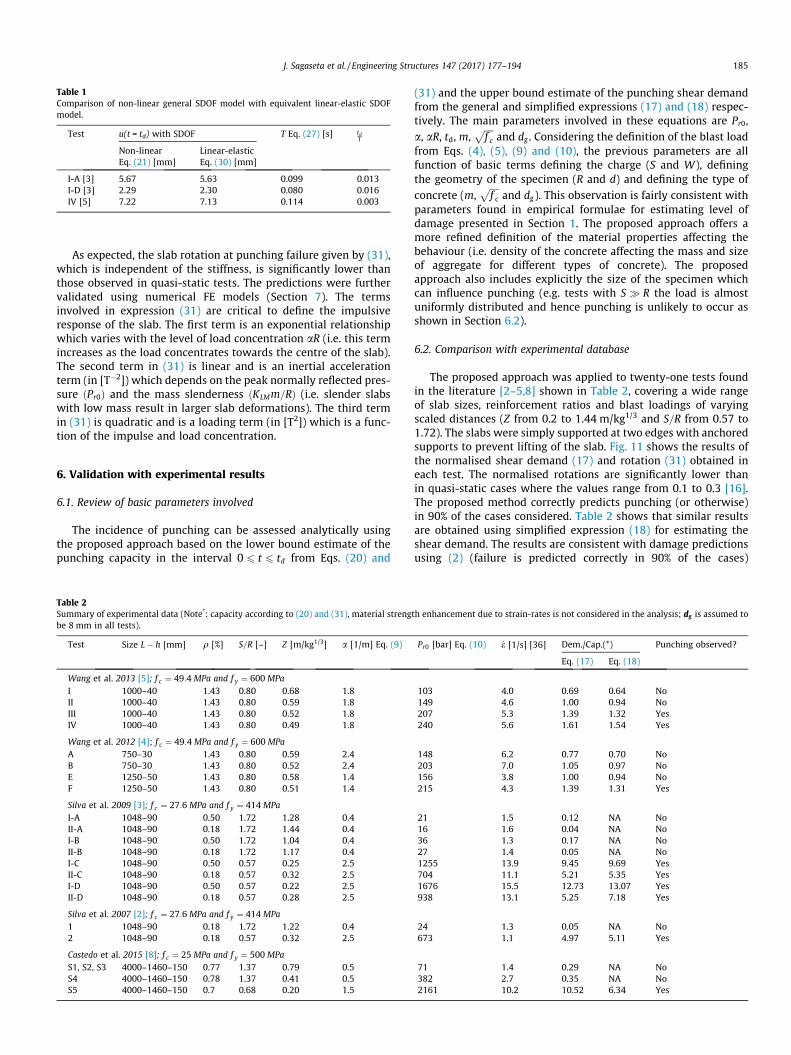
Table 1Comparison of non-linear general SDOF model with equivalent linear-elastic SDOFmodel.
Test u(t = td) with SDOF T Eq. (27) [s] tdT
Non-linearEq. (21) [mm]
Linear-elasticEq. (30) [mm]
I-A [3] 5.67 5.63 0.099 0.013I-D [3] 2.29 2.30 0.080 0.016IV [5] 7.22 7.13 0.114 0.003
J. Sagaseta et al. / Engineering Structures 147 (2017) 177–194 185
As expected, the slab rotation at punching failure given by (31),which is independent of the stiffness, is significantly lower thanthose observed in quasi-static tests. The predictions were furthervalidated using numerical FE models (Section 7). The termsinvolved in expression (31) are critical to define the impulsiveresponse of the slab. The first term is an exponential relationshipwhich varies with the level of load concentration aR (i.e. this termincreases as the load concentrates towards the centre of the slab).The second term in (31) is linear and is an inertial accelerationterm (in [T�2]) which depends on the peak normally reflected pres-sure ðPr0Þ and the mass slenderness ðKLMm=RÞ (i.e. slender slabswith low mass result in larger slab deformations). The third termin (31) is quadratic and is a loading term (in [T2]) which is a func-tion of the impulse and load concentration.
6. Validation with experimental results
6.1. Review of basic parameters involved
The incidence of punching can be assessed analytically usingthe proposed approach based on the lower bound estimate of thepunching capacity in the interval 0 6 t 6 td from Eqs. (20) and
Table 2Summary of experimental data (Note*: capacity according to (20) and (31), material strengbe 8 mm in all tests).
Test Size L� h [mm] q [%] S=R [–] Z [m/kg1/3] a [1/m] Eq. (9)
Wang et al. 2013 [5]; f c ¼ 49:4MPa and f y ¼ 600MPaI 1000–40 1.43 0.80 0.68 1.8II 1000–40 1.43 0.80 0.59 1.8III 1000–40 1.43 0.80 0.52 1.8IV 1000–40 1.43 0.80 0.49 1.8
Wang et al. 2012 [4]; f c ¼ 49:4MPa and f y ¼ 600MPaA 750–30 1.43 0.80 0.59 2.4B 750–30 1.43 0.80 0.52 2.4E 1250–50 1.43 0.80 0.58 1.4F 1250–50 1.43 0.80 0.51 1.4
Silva et al. 2009 [3]; f c ¼ 27:6MPa and f y ¼ 414 MPaI-A 1048–90 0.50 1.72 1.28 0.4II-A 1048–90 0.18 1.72 1.44 0.4I-B 1048–90 0.50 1.72 1.04 0.4II-B 1048–90 0.18 1.72 1.17 0.4I-C 1048–90 0.50 0.57 0.25 2.5II-C 1048–90 0.18 0.57 0.32 2.5I-D 1048–90 0.50 0.57 0.22 2.5II-D 1048–90 0.18 0.57 0.28 2.5
Silva et al. 2007 [2]; f c ¼ 27:6MPa and f y ¼ 414 MPa1 1048–90 0.18 1.72 1.22 0.42 1048–90 0.18 0.57 0.32 2.5
Castedo et al. 2015 [8]; f c ¼ 25 MPa and f y ¼ 500 MPaS1, S2, S3 4000–1460–150 0.77 1.37 0.79 0.5S4 4000–1460–150 0.78 1.37 0.41 0.5S5 4000–1460–150 0.7 0.68 0.20 1.5
(31) and the upper bound estimate of the punching shear demandfrom the general and simplified expressions (17) and (18) respec-tively. The main parameters involved in these equations are Pr0,a, aR, td, m,
ffiffiffiffif c
pand dg . Considering the definition of the blast load
from Eqs. (4), (5), (9) and (10), the previous parameters are allfunction of basic terms defining the charge (S and W), definingthe geometry of the specimen (R and d) and defining the type ofconcrete (m,
ffiffiffiffif c
pand dg). This observation is fairly consistent with
parameters found in empirical formulae for estimating level ofdamage presented in Section 1. The proposed approach offers amore refined definition of the material properties affecting thebehaviour (i.e. density of the concrete affecting the mass and sizeof aggregate for different types of concrete). The proposedapproach also includes explicitly the size of the specimen whichcan influence punching (e.g. tests with S � R the load is almostuniformly distributed and hence punching is unlikely to occur asshown in Section 6.2).
6.2. Comparison with experimental database
The proposed approach was applied to twenty-one tests foundin the literature [2–5,8] shown in Table 2, covering a wide rangeof slab sizes, reinforcement ratios and blast loadings of varyingscaled distances (Z from 0.2 to 1.44 m/kg1/3 and S=R from 0.57 to1.72). The slabs were simply supported at two edges with anchoredsupports to prevent lifting of the slab. Fig. 11 shows the results ofthe normalised shear demand (17) and rotation (31) obtained ineach test. The normalised rotations are significantly lower thanin quasi-static cases where the values range from 0.1 to 0.3 [16].The proposed method correctly predicts punching (or otherwise)in 90% of the cases considered. Table 2 shows that similar resultsare obtained using simplified expression (18) for estimating theshear demand. The results are consistent with damage predictionsusing (2) (failure is predicted correctly in 90% of the cases)
th enhancement due to strain-rates is not considered in the analysis; dg is assumed to
Pr0 [bar] Eq. (10) _e [1/s] [36] Dem./Cap.(*) Punching observed?
Eq. (17) Eq. (18)
103 4.0 0.69 0.64 No149 4.6 1.00 0.94 No207 5.3 1.39 1.32 Yes240 5.6 1.61 1.54 Yes
148 6.2 0.77 0.70 No203 7.0 1.05 0.97 No156 3.8 1.00 0.94 No215 4.3 1.39 1.31 Yes
21 1.5 0.12 NA No16 1.6 0.04 NA No36 1.3 0.17 NA No27 1.4 0.05 NA No1255 13.9 9.45 9.69 Yes704 11.1 5.21 5.35 Yes1676 15.5 12.73 13.07 Yes938 13.1 5.25 7.18 Yes
24 1.3 0.05 NA No673 1.1 4.97 5.11 Yes
71 1.4 0.29 NA No382 2.7 0.35 NA No2161 10.2 10.52 6.34 Yes
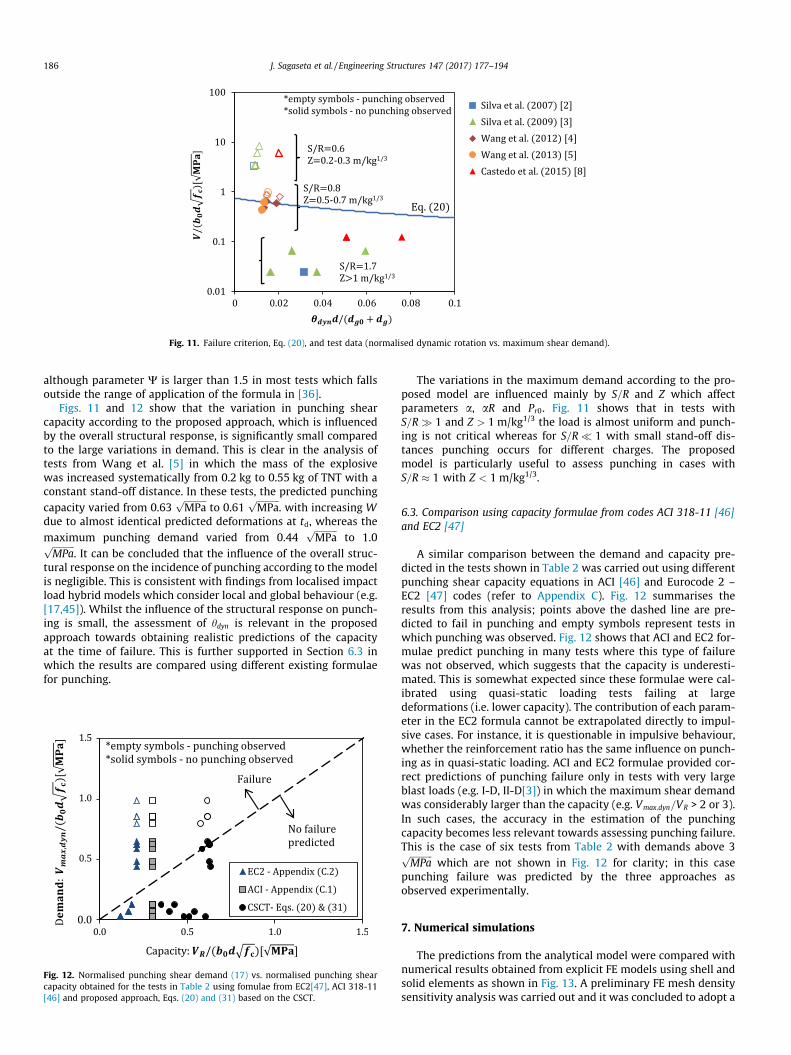
Fig. 11. Failure criterion, Eq. (20), and test data (normalised dynamic rotation vs. maximum shear demand).
186 J. Sagaseta et al. / Engineering Structures 147 (2017) 177–194
although parameter W is larger than 1.5 in most tests which fallsoutside the range of application of the formula in [36].
Figs. 11 and 12 show that the variation in punching shearcapacity according to the proposed approach, which is influencedby the overall structural response, is significantly small comparedto the large variations in demand. This is clear in the analysis oftests from Wang et al. [5] in which the mass of the explosivewas increased systematically from 0.2 kg to 0.55 kg of TNT with aconstant stand-off distance. In these tests, the predicted punchingcapacity varied from 0.63
ffiffiffiffiffiffiffiffiffiffiMPa
pto 0.61
ffiffiffiffiffiffiffiffiffiffiMPa
p. with increasing W
due to almost identical predicted deformations at td, whereas themaximum punching demand varied from 0.44
ffiffiffiffiffiffiffiffiffiffiMPa
pto 1.0ffiffiffiffiffiffiffiffiffiffi
MPap
. It can be concluded that the influence of the overall struc-tural response on the incidence of punching according to the modelis negligible. This is consistent with findings from localised impactload hybrid models which consider local and global behaviour (e.g.[17,45]). Whilst the influence of the structural response on punch-ing is small, the assessment of hdyn is relevant in the proposedapproach towards obtaining realistic predictions of the capacityat the time of failure. This is further supported in Section 6.3 inwhich the results are compared using different existing formulaefor punching.
Fig. 12. Normalised punching shear demand (17) vs. normalised punching shearcapacity obtained for the tests in Table 2 using fomulae from EC2[47], ACI 318-11[46] and proposed approach, Eqs. (20) and (31) based on the CSCT.
The variations in the maximum demand according to the pro-posed model are influenced mainly by S=R and Z which affectparameters a, aR and Pr0. Fig. 11 shows that in tests withS=R � 1 and Z > 1 m/kg1/3 the load is almost uniform and punch-ing is not critical whereas for S=R � 1 with small stand-off dis-tances punching occurs for different charges. The proposedmodel is particularly useful to assess punching in cases withS=R � 1 with Z < 1 m/kg1/3.
6.3. Comparison using capacity formulae from codes ACI 318-11 [46]and EC2 [47]
A similar comparison between the demand and capacity pre-dicted in the tests shown in Table 2 was carried out using differentpunching shear capacity equations in ACI [46] and Eurocode 2 –EC2 [47] codes (refer to Appendix C). Fig. 12 summarises theresults from this analysis; points above the dashed line are pre-dicted to fail in punching and empty symbols represent tests inwhich punching was observed. Fig. 12 shows that ACI and EC2 for-mulae predict punching in many tests where this type of failurewas not observed, which suggests that the capacity is underesti-mated. This is somewhat expected since these formulae were cal-ibrated using quasi-static loading tests failing at largedeformations (i.e. lower capacity). The contribution of each param-eter in the EC2 formula cannot be extrapolated directly to impul-sive cases. For instance, it is questionable in impulsive behaviour,whether the reinforcement ratio has the same influence on punch-ing as in quasi-static loading. ACI and EC2 formulae provided cor-rect predictions of punching failure only in tests with very largeblast loads (e.g. I-D, II-D[3]) in which the maximum shear demandwas considerably larger than the capacity (e.g. Vmax;dyn=VR > 2 or 3).In such cases, the accuracy in the estimation of the punchingcapacity becomes less relevant towards assessing punching failure.This is the case of six tests from Table 2 with demands above 3ffiffiffiffiffiffiffiffiffiffiMPa
pwhich are not shown in Fig. 12 for clarity; in this case
punching failure was predicted by the three approaches asobserved experimentally.
7. Numerical simulations
The predictions from the analytical model were compared withnumerical results obtained from explicit FE models using shell andsolid elements as shown in Fig. 13. A preliminary FE mesh densitysensitivity analysis was carried out and it was concluded to adopt a
(a) (b)
4 mm gap
Fig. 13. FE models carried out by the authors of tests fromWang et al. [5]: (a) FE models using shell elements and (b) FE models using solid elements (only one quarter of theslab was modelled due to symmetry).
Fig. 14. Damage in tests with punching (adapted from [3,5]) (a) Test I-D front, (b) and (c) Test IV back and front.
J. Sagaseta et al. / Engineering Structures 147 (2017) 177–194 187
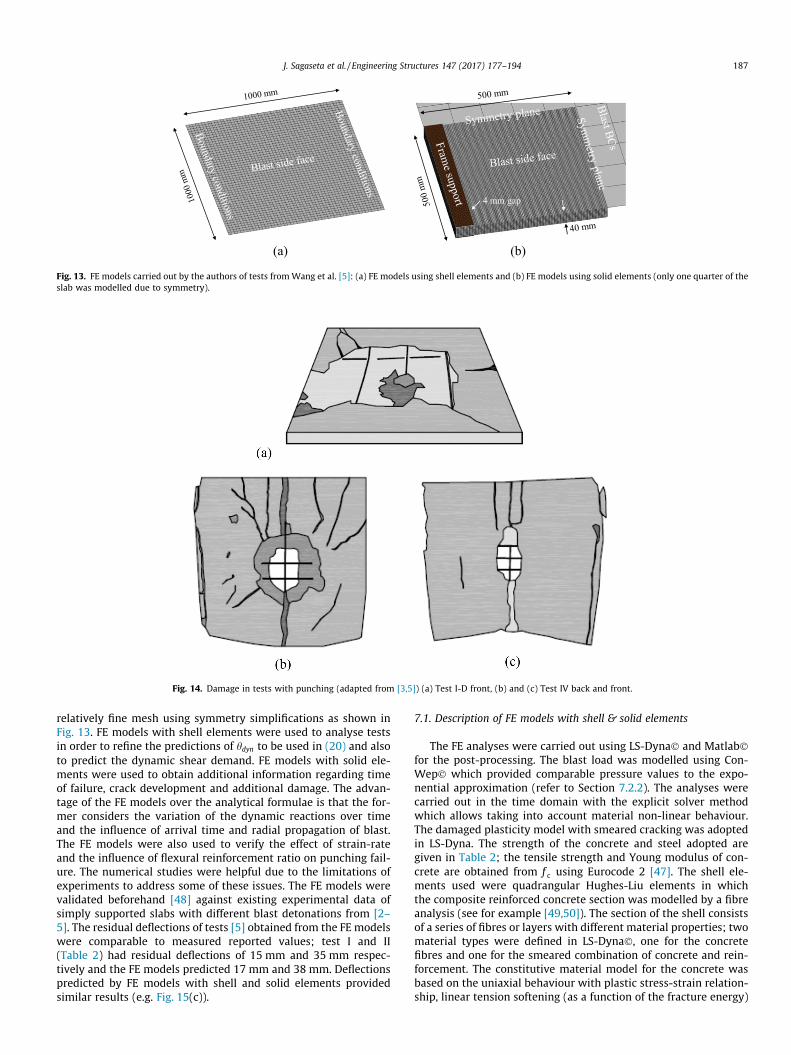
relatively fine mesh using symmetry simplifications as shown inFig. 13. FE models with shell elements were used to analyse testsin order to refine the predictions of hdyn to be used in (20) and alsoto predict the dynamic shear demand. FE models with solid ele-ments were used to obtain additional information regarding timeof failure, crack development and additional damage. The advan-tage of the FE models over the analytical formulae is that the for-mer considers the variation of the dynamic reactions over timeand the influence of arrival time and radial propagation of blast.The FE models were also used to verify the effect of strain-rateand the influence of flexural reinforcement ratio on punching fail-ure. The numerical studies were helpful due to the limitations ofexperiments to address some of these issues. The FE models werevalidated beforehand [48] against existing experimental data ofsimply supported slabs with different blast detonations from [2–5]. The residual deflections of tests [5] obtained from the FE modelswere comparable to measured reported values; test I and II(Table 2) had residual deflections of 15 mm and 35 mm respec-tively and the FE models predicted 17 mm and 38 mm. Deflectionspredicted by FE models with shell and solid elements providedsimilar results (e.g. Fig. 15(c)).
7.1. Description of FE models with shell & solid elements
The FE analyses were carried out using LS-Dyna� and Matlab�for the post-processing. The blast load was modelled using Con-Wep� which provided comparable pressure values to the expo-nential approximation (refer to Section 7.2.2). The analyses werecarried out in the time domain with the explicit solver methodwhich allows taking into account material non-linear behaviour.The damaged plasticity model with smeared cracking was adoptedin LS-Dyna. The strength of the concrete and steel adopted aregiven in Table 2; the tensile strength and Young modulus of con-crete are obtained from f c using Eurocode 2 [47]. The shell ele-ments used were quadrangular Hughes-Liu elements in whichthe composite reinforced concrete section was modelled by a fibreanalysis (see for example [49,50]). The section of the shell consistsof a series of fibres or layers with different material properties; twomaterial types were defined in LS-Dyna�, one for the concretefibres and one for the smeared combination of concrete and rein-forcement. The constitutive material model for the concrete wasbased on the uniaxial behaviour with plastic stress-strain relation-ship, linear tension softening (as a function of the fracture energy)
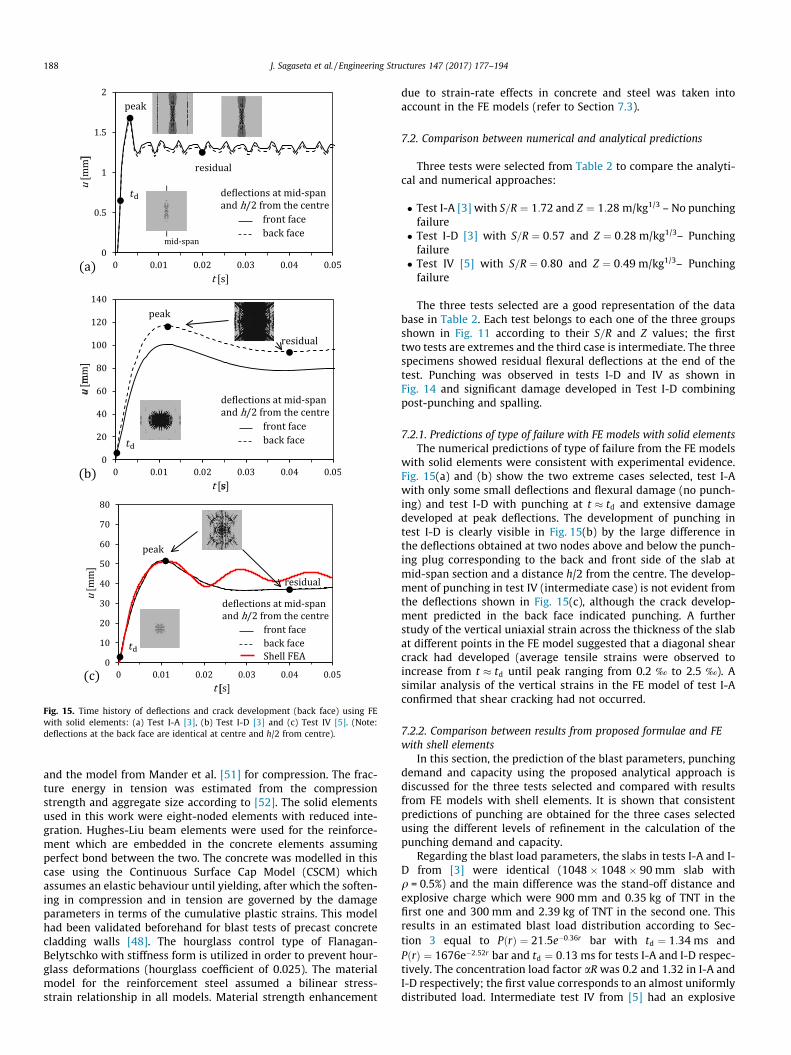
Fig. 15. Time history of deflections and crack development (back face) using FEwith solid elements: (a) Test I-A [3], (b) Test I-D [3] and (c) Test IV [5]. (Note:deflections at the back face are identical at centre and h/2 from centre).
188 J. Sagaseta et al. / Engineering Structures 147 (2017) 177–194
and the model from Mander et al. [51] for compression. The frac-ture energy in tension was estimated from the compressionstrength and aggregate size according to [52]. The solid elementsused in this work were eight-noded elements with reduced inte-gration. Hughes-Liu beam elements were used for the reinforce-ment which are embedded in the concrete elements assumingperfect bond between the two. The concrete was modelled in thiscase using the Continuous Surface Cap Model (CSCM) whichassumes an elastic behaviour until yielding, after which the soften-ing in compression and in tension are governed by the damageparameters in terms of the cumulative plastic strains. This modelhad been validated beforehand for blast tests of precast concretecladding walls [48]. The hourglass control type of Flanagan-Belytschko with stiffness form is utilized in order to prevent hour-glass deformations (hourglass coefficient of 0.025). The materialmodel for the reinforcement steel assumed a bilinear stress-strain relationship in all models. Material strength enhancement
due to strain-rate effects in concrete and steel was taken intoaccount in the FE models (refer to Section 7.3).
7.2. Comparison between numerical and analytical predictions
Three tests were selected from Table 2 to compare the analyti-cal and numerical approaches:
Test I-A [3] with S=R ¼ 1:72 and Z ¼ 1:28 m/kg1/3 – No punchingfailure
Test I-D [3] with S=R ¼ 0:57 and Z ¼ 0:28 m/kg1/3– Punchingfailure
Test IV [5] with S=R ¼ 0:80 and Z ¼ 0:49 m/kg1/3– Punchingfailure
The three tests selected are a good representation of the database in Table 2. Each test belongs to each one of the three groupsshown in Fig. 11 according to their S=R and Z values; the firsttwo tests are extremes and the third case is intermediate. The threespecimens showed residual flexural deflections at the end of thetest. Punching was observed in tests I-D and IV as shown inFig. 14 and significant damage developed in Test I-D combiningpost-punching and spalling.
7.2.1. Predictions of type of failure with FE models with solid elementsThe numerical predictions of type of failure from the FE models
with solid elements were consistent with experimental evidence.Fig. 15(a) and (b) show the two extreme cases selected, test I-Awith only some small deflections and flexural damage (no punch-ing) and test I-D with punching at t � td and extensive damagedeveloped at peak deflections. The development of punching intest I-D is clearly visible in Fig. 15(b) by the large difference inthe deflections obtained at two nodes above and below the punch-ing plug corresponding to the back and front side of the slab atmid-span section and a distance h/2 from the centre. The develop-ment of punching in test IV (intermediate case) is not evident fromthe deflections shown in Fig. 15(c), although the crack develop-ment predicted in the back face indicated punching. A furtherstudy of the vertical uniaxial strain across the thickness of the slabat different points in the FE model suggested that a diagonal shearcrack had developed (average tensile strains were observed toincrease from t � td until peak ranging from 0.2 ‰ to 2.5 ‰). Asimilar analysis of the vertical strains in the FE model of test I-Aconfirmed that shear cracking had not occurred.
7.2.2. Comparison between results from proposed formulae and FEwith shell elements
In this section, the prediction of the blast parameters, punchingdemand and capacity using the proposed analytical approach isdiscussed for the three tests selected and compared with resultsfrom FE models with shell elements. It is shown that consistentpredictions of punching are obtained for the three cases selectedusing the different levels of refinement in the calculation of thepunching demand and capacity.
Regarding the blast load parameters, the slabs in tests I-A and I-D from [3] were identical (1048 � 1048 � 90 mm slab withq = 0.5%) and the main difference was the stand-off distance andexplosive charge which were 900 mm and 0.35 kg of TNT in thefirst one and 300 mm and 2.39 kg of TNT in the second one. Thisresults in an estimated blast load distribution according to Sec-tion 3 equal to PðrÞ ¼ 21:5e�0:36r bar with td ¼ 1:34 ms andPðrÞ ¼ 1676e�2:52r bar and td ¼ 0:13 ms for tests I-A and I-D respec-tively. The concentration load factor aR was 0.2 and 1.32 in I-A andI-D respectively; the first value corresponds to an almost uniformlydistributed load. Intermediate test IV from [5] had an explosive
J. Sagaseta et al. / Engineering Structures 147 (2017) 177–194 189
charge of 0.55 kg of TNT at a stand-off distance of 400 mm, leadingto PðrÞ ¼ 240e�2:80r bar with td ¼ 0:36 ms and aR ¼ 0:9. ConWeppredictions of peak reflected pressure and time duration in testsI-A and I-D were 26 bar with 1.1 ms and 1377 bar with 0.23 msrespectively which are similar to estimated values.
The punching shear demand was obtained using the simplifiedformula (18) in tests I-D and IV with aR > 0:7; general equation(17) was used for test I-A (aR < 0:7). The maximum shear demandobtained in I-A, I-D and IV were 0.07
ffiffiffiffiffiffiffiffiffiffiMPa
p, 8.2
ffiffiffiffiffiffiffiffiffiffiMPa
pand 0.94ffiffiffiffiffiffiffiffiffiffi
MPap
respectively which clearly govern the prediction of failure.These results were verified using alternative approaches, for exam-ple in tests I-D and IV, general equation (17) was used giving val-ues of 8.4
ffiffiffiffiffiffiffiffiffiffiMPa
pand 0.99
ffiffiffiffiffiffiffiffiffiffiMPa
pwhich are very similar to those
from (18). FE models with shell elements provide direct resultsof the shear force (demand) in the elements throughout the timehistory. The results of the maximum shear force at t ¼ td obtainedfrom the FE models were 0.23
ffiffiffiffiffiffiffiffiffiffiMPa
p, 3
ffiffiffiffiffiffiffiffiffiffiMPa
pand 0.89
ffiffiffiffiffiffiffiffiffiffiMPa
pin
tests I-A, I-D and IV respectively which indicate very low, very highand moderate values of the shear demand respectively. The differ-ence between the demand values from the FE and proposed for-mula for the extreme tests I-A and I-D is expected since forextreme values of Z both approaches are less consistent with eachother (e.g. modelling of blast load and dynamic reactions). How-ever, these differences are not relevant towards predicting punch-ing since the demand in these cases is clearly below and above thecapacity. For intermediate cases (e.g. test IV), FE and proposed for-mulae gave very similar results of the distribution of shear demandat t ¼ td and its maximum value as shown in Fig. 16(a).
The punching capacity estimated according to (20) hdyn using
from (31) were 0.54ffiffiffiffiffiffiffiffiffiffiMPa
p, 0.64
ffiffiffiffiffiffiffiffiffiffiMPa
pand 0.61
ffiffiffiffiffiffiffiffiffiffiMPa
pin tests
I-A, I-D and IV respectively. As highlighted in Section 6.2, thecapacity is almost constant between the tests which is interestingconsidering the large differences in loading. These results were fur-ther verified using FE with shell elements to refine the predictionof hdyn. This analysis confirmed that the compatibility conditionhdyn � udyn=R is reasonable to predict the slab rotation outsidethe failure region as shown in Fig. 16(b). The punching capacityobtained using FE with shell elements were 0.60
ffiffiffiffiffiffiffiffiffiffiMPa
p,
0.63ffiffiffiffiffiffiffiffiffiffiMPa
pand 0.68
ffiffiffiffiffiffiffiffiffiffiMPa
pin tests I-A, I-D and IV respectively
which is similar to the values obtained using Eq. (31) based on aSDOF model. It can be concluded that according to the analysis ofdemand and capacity using different levels of refinement, punch-ing is predicted only in tests I-D and IV as observed experimentally.
7.3. Influence of strain-rate effect and reinforcement ratio onnumerical predictions
Previous sections show that the results from the numerical andanalytical approaches are consistent with each other. Further para-
Fig. 16. FE with shell elements (Test IV): (a) shear demand
metric studies were carried out with the FE models to assess theinfluence of strain-rate effects and the amount of flexural rein-forcement on punching. The strength enhancement of the materi-als due to strain velocity was taken into account in the FE modelswith shell elements by means of the so-called dynamic increasefactor (DIF) which is the ratio of the static over dynamic resistance.This ratio, which is a function of the strain-rate, was estimated fol-lowing widely accepted formulae for simplified analysis accordingto [37]; in particular the values of 1.17 for steel, 1.19 and 1.3 forconcrete in compression and tension respectively were used forthe numerical analysis of tests from Silva and Lu [3] and Wanget al. [5] which correspond to an estimated strain-rate of 0.1/s.The strength enhancement due to strain velocity was taken intoaccount directly in the FE models with solid elements by meansof a visco-plastic model for the concrete and a Cowper-Symondsexponential strain-rate model for the reinforcement with parame-ters C = 500/s and p = 6 according to [53]. The strain-rate assump-tions made for shell and solid elements produced similar results asshown in Fig. 15(c).
The consequences of neglecting strain-rate effects in the pre-dicted deflections and failure mode was investigated using FEmodels with solid elements by modifying the constitutive materialmodel to make it non-sensitive to the strain velocity. This analysiswas carried out for Test IV [5] with W = 0.55 kg of TNT; the resultsare summarised in Fig. 17.
The model without strain-rate considerations predicted morepronounced flexural cracks around the proximity of the supportscompared to the model with strain-rate considerations (Fig. 17).However, both FE models predicted similar punching failures att � td with a similar radius of the punching cone as shown inFig. 17; the radius of the damaged region was consistent with testobservation. The predicted deflections at the centre of the slab atthe end of the blast load were 2.9 mm and 3.4 mm in the FE modelswith strain-rate and without strain-rate considerations respec-tively. This suggests that strain-rate considerations in this particu-lar case had a moderate effect on slab stiffness. For the testinvestigated, the estimated strain-rate was of the order of 5/swhich results in a negligible increase in punching capacity accord-ing to [17]. This seems to be broadly consistent with the numericalresults obtained.
Additional FE models with solid elements were carried out toinvestigate the influence of the flexural reinforcement ratio onpunching. According to the proposed analytical model, the rein-forcement ratio does not have a significant role in punching dueto the impulsive behaviour of the plate. This was further investi-gated numerically using test IV [5] (W = 0.55 kg of TNT andq = 1.43%) as the control specimen in the analysis. Three FE analy-ses were carried out reducing the amount of flexural reinforcementratio to 1.36%, 1.02% and 0.5% whilst keeping all other parametersconstant as shown in Fig. 18 .The results from these analyses
vs. capacity and (b) profile of vertical displacements.
Fig. 17. Crack pattern predictions at t = td; Test IV [5] with W = 0.55 kN of TNT: (a) FE model with solid elements and strain-rate considerations and (b) identical modelwithout strain-rate considerations.
Fig. 18. Deflections at early times and crack pattern at t = td for different flexuralreinforcement ratios according to FE models with solid elements (adoptedgeometry, materials and loading from Test IV from [5]).
190 J. Sagaseta et al. / Engineering Structures 147 (2017) 177–194
shown in Fig. 18 indicate that the deflections of the slab were verysimilar at t � td when the punching cone developed. This showsthat punching at early times is fairly independent of the amount
9 m
3 m
Stand-off
1.5 m
3 m
Fig. 19. Example of external detonation near a reinforced concrete wall: (a) geometry, (bfor 100 kg of TNT detonation at 1.4 m.
of flexural reinforcement and therefore the use of parameter qsuch as in EC2 [47] formulae would be inconsistent with impulsivebehaviour. However, the flexural reinforcement in the slab has asignificant role in the development of subsequent flexural andspalling damage as deflections increase (t � td).
8. Application example of proposed analytical approach
This section contains a practical example of a load bearing rein-forced concrete wall, which is part of a structural system of a build-ing subjected to a close-in blast detonation shown in Fig. 19(a). Asimilar geometry was adopted as the case study shown in Cormieet al. [14]. The wall is 500 mm thick, 9 m long and 3 m high(R = 1.5 m); it is reinforced vertically with 20 mm diameter rein-forcement bars equally spaced at 150 mm and horizontally with10 mm diameter bars spaced at 200 mm, and the cover is 50 mm.The concrete compressive strength is 35 MPa with a maximumaggregate size of 25 mm and the tensile yield strength of the rein-forcement steel is 500 MPa. The wall is clamped at the top and bot-tom edges.
Two blast scenarios were investigated consisting of 100 kg ofTNT detonated at 1 m and 1.4 m from the target wall respectivelyand 1.5 m from the ground surface as shown in Fig. 19(a). A refinednon-linear explicit FE model using solid elements predicted punch-ing only for the detonation at 1 m as shown in Fig. 19(b-c).
It is shown in the following calculations that the proposed ana-lytical method is consistent with the numerical predictions. Thesteps required in the analytical approach are as follows:
0.95 - 1 0.95 - 1
3 m
) FE crack prediction for 100 kg of TNT detonation at 1 m and (c) FE crack predictions
Structures 147 (2017) 177–194 191
– Step 1- Estimate load parameters: use Eqs. (4)–(10)
J. Sagaseta et al. / Engineering
For the detonation at 1 m
For the detonation at 1.4 m Pr0 ¼ 185 MPa Pr0 ¼ 80 MPa td ¼ 0.41 ms td ¼ 0:79 ms a ¼ 0.75 m�1 (aR ¼ 1:12) a ¼ 0.48 m�1 (aR ¼ 0:72)– Step 2- Estimate maximum normalised punching sheardemand: use Eq. (18)
For the detonation at 1 mffiffiffiffiffip ffiffiffiffiffiffiffiffiffiffip
For the detonation at 1.4 mffiffiffiffiffip ffiffiffiffiffiffiffiffiffiffip Vmax;dyn=ðb0d f cÞ ¼ 2:53 MPa Vmax;dyn=ðb0d f cÞ ¼ 0:03 MPa– Step 3- Estimate normalised punching shear capacity: use Eqs.
(20) and (31).Assuming KLM � 0:5 for simplicity gives KLMm ¼ 5:4 ton (con-servative estimate) and ignoring punching capacity enhancementdue to strain-rates (conservative)
For the detonation at 1 m
For the detonation at 1.4 m hdyn ¼ 4:53 mRad hdyn ¼ 9.34 mRadVR=ðb0dffiffiffiffiffif c
pÞ ¼ 0:46
ffiffiffiffiffiffiffiffiffiffiMPa
p
VR=ðb0dffiffiffiffiffif c
pÞ ¼ 0:33
ffiffiffiffiffiffiffiffiffiffiMPa
p
) Punching shear is predicted
) No punching shearpredicted9. Conclusions
Close-range blasts can result in punching shear failures adjacentto the detonation in RC slabs or panels due to the localised loadingand high shear demand in this region during the short load dura-tion. This paper proposes a methodology by which punching shearfailures can be assessed; the approach has been validated usingtests with scale distances between 0.2 and 1.5 m/kg1/3. The mainconclusions are:
1. Due to the short load durations considered, a reasonable upperbound estimate of the shear demand can be obtained fromdynamic equilibrium between the pressure and inertial forcesassuming t ! 0. Equally, assuming a constant punching capac-ity during the blast load, based on the CSCT with hdyn at t ¼ td,provides a reasonable lower bound estimate of the capacity atthe time of failure. This approach is shown to give consistentsystematic predictions of punching of existing experimentaldata.
2. The main advantage of the method is that it considers thefavourable effect of impulsive behaviour on punching capacity(low strains in the concrete leading to higher punching capac-ity). It has been shown that this feature allows more accuratepredictions of punching of test data compared to using formu-lae in ACI 318-11 and EC2 which underestimate the capacitysince they are based on quasi-static loading tests.
3. The parameters affecting punching obtained analytically arethose defining the charge (S and W), the geometry (R and d)and the type of concrete (m,
ffiffiffiffif c
pand dg). Punching in tests in
which the blast load was systematically increased was mainlygoverned by the large variation in the predicted shear demand;the variation of the punching capacity was negligible. This con-firms that punching is mainly governed by the local responseaffecting the shear forces (demand) around the failure region.
4. The punching shear demand in the proposed model indicatesthat punching is not critical in cases where S=R � 1 and Z > 1m/kg1/3 as observed in the tests since the load is almost uni-form. The proposed approach is particularly useful to assesspunching when S=R � 1 or lower and Z < 1 m/kg1/3 where testsare in the cusp of failure.
5. The proposed approach has the potential to introduce differentlevels of refinement in the assessment of the demand andcapacity. With regards the punching shear demand, the use ofmore advanced blast load models could be used to refine theparameters used in the exponential approximation. For refinedpredictions of the capacity, the proposed method allows thepossibility of considering strain-rate effects although this wasneglected in the analysis of test data since strain-rates pre-dicted were below 15/s.
6. The numerical studies carried out in this work using explicit FEmodels further supported the proposed methodology. FE mod-els using solid elements, whilst complex, confirmed that thepunching plug develops at early stages. FE models using shellelements and SDOF models provided broadly similar predic-tions of the slab rotation at td, leading to similar predictionsof the punching capacity according to the CSCT. The FE modelsalso confirmed that the flexural reinforcement and strain-rateeffects, which affect the residual damage, have a small influenceon punching at t ¼ td.
7. With further research, the approach has the potential to beapplied to other cases such as fibre reinforced concrete andshear reinforced members by adding consistently the differentcontributions to the punching capacity. High and low densityconcretes could also be investigated since the approach consid-ers explicitly the mass of the specimen.
Acknowledgments
This work is part of a research project financially supported bythe Engineering and Physical Sciences Research Council (E.P.S.R.C.)of the U.K. (Grant reference: EP/K008153/1). Dr. Olmati is currentlyInternational Research Fellow (P-15786) of the Japan Society forthe Promotion of Science (JSPS). Any opinions, findings, and con-clusions or recommendations expressed in this material are thoseof the authors and do not necessarily reflect the views of the JapanSociety for the Promotion of Science. The authors would also like toacknowledge project collaborators Prof. Muttoni and Dr. FernándezRuiz from EPFL (Switzerland) for their feedback and technical dis-cussions on the topic. Data Availability: The authors confirm thatall data underlying the findings are fully available upon request.The data is held at the University of Surrey and requests for accesscan be sent to [email protected].
Appendix A. Deformed shape and shape function forexponentially decaying load
This appendix describes the derivation of the deformed shapeand shape function of a simply-supported 1-way spanning elasticbody of stiffness EI and span L subject to an exponentially decayingload. It can be shown through virtual work that the static deflec-tion of such a body subjected to a load (8) is:
yðxÞ ¼ P0
8EIa4 axe�aL2 16þ a2 L2 � 4x2
3
� �þ 4aL
�
�8ax ln e�aL2
� �þ 4faxg3
3� xa3L2 � 4 ln ðe�axÞ2
þ8e�aL2 f6þ aLg � 24
�ðA:1Þ
192 J. Sagaseta et al. / Engineering Structures 147 (2017) 177–194
Special cases of (A.1) lead to results for UDL or point load sce-narios, depending on the value of a. For example, evaluating(A.1) at x ¼ L=2 and in the limit as a ! 0 gives the familiar expres-sion for a UDL y ¼ 5P0L
4=ð384EIÞ. The corresponding shape func-tion, uðxÞ, describing the deformed shape of a structure such thatuðL=2Þ ¼ 1, can be readily obtained from (A.2) as:
uðxÞ ¼3axe�aL
2 16þ a2 L2 � 4x23
n oþ 4L
� �� 24ax ln e�
aL2
� �þ 4ðaxÞ3 � 3xa3L2 � 12 ln ðe�axÞ2 þ e�axð72þ 24axÞ � 72
e�aL2 ð36aLþ faLg3 þ 6faLg2 þ 72Þ � ðaLÞ3 � 72� 12 ln e�
aL2
� �2� 12aL ln e�
aL2
� � ðA:2Þ
Appendix B. Structural response according to general non-linear SDOF
This appendix shows the derivation of a non-linear SDOF sys-tem which represents the global response of a RC flat slab whichcovers general cases valid for any load duration. The load-rotation response of a RC slab is given by level II of approximationin fib Model Code 2010 [21]:
h ¼ 1:5rsdf yEs
Ms
MR
� �32
ðB:1Þ
where h is the slab rotation, parameter rs indicates the position ofzero radial bending moment with respect to the support axis, Es isthe elastic modulus of reinforcement, Ms is the average bendingmoment per unit width of the slab’s column (support) strip andMR is the average flexural strength per unit length in the columnstrip, given by:
MR ¼ qd2f y 1� qf y2f c
� �ðB:2Þ
where q is the reinforcement ratio at the level being considered(top steel for the case of blast acting on underside of slab or bottomsteel for blasts acting on slab top surface) and f y is the steel rein-forcement yield strength. The various terms in (B.1) affect the crackwidth (and thus the rotation). The term ðrs=dÞ represents the slen-derness of the slab while the term ðf y=EsÞ is the strain when thereinforcement yields which also affects the crack widths. The termðMs=MRÞ is the bending capacity utilisation ratio which depends onthe applied load and flexural reinforcement provided. For internallocalised loads, Ms is related to Vd [21] as follows:
Ms ¼ Vd=8 ðB:3ÞSubstituting (B.3) into (B.1) with h ¼ u=R and re-arranging
gives:
Vd ¼ bu23 ðB:4Þ
where Vd 6 Vflex (ultimate flexural resistance which can be obtainedusing the yield line method) and b is a slab stiffness parameter inthe non-linear SDOF given by:
b ¼ 8MR2dEs
3Rrsf y
!23
ðB:5Þ
Using these model parameters, the response can be readilyevaluated using a numerical method (e.g. Euler method) to solve(21) for the slab’s displacement u. In order to transform a non-linear to an equivalent linear system, an equivalent stiffness kecan be assessed by equating the strain energy obtained in thetwo systems as shown in (B.6)
E ¼Z ue
0Vddu ¼ 3bu
53e
5¼ keu2
e
2ðB:6Þ
Solving for ke in (B.6) gives
ke ¼ 6b
5u13e
ðB:7Þ
Appendix C. Punching shear capacity formulae from codes ACI318-11 [46] and EC2 [47]
The punching shear strength according to ACI 318-11 (in SIunits) for the cases studied is
VR
b0d¼ 1
3
ffiffiffiffif c
qðC:1Þ
The punching shear strength according to EC2 (in SI units) forthe cases studied is
VR
b0d¼ 0:18 1þ
ffiffiffiffiffiffiffiffiffi200d
r !ð100qf cÞ
13 ðC:2Þ
where d in [mm] and size effect factor ð1þffiffiffiffiffiffiffiffiffiffiffiffiffiffi200=d
pÞ 6 2.
Appendix D. Nomenclature
AbbreviationsCSCT Critical Shear Crack TheoryDIF dynamic increase factorDLF dynamic load factorMDOF multiple-degree of freedomSDOF single degree of freedomUDL uniformly distributed load
Latin lower caseb0 control perimeter for punching, [L]dg concrete maximum aggregate size, [L]dg0 reference concrete aggregate size, [L]d slab effective depth, [L]f c concrete compressive strength, [M L�1 T�2]f y steel reinforcement yield stress, [M L�1 T�2]h slab thickness, [L]i distribution of inertial forces, [M L�1 T�2]k slab stiffness, [M T�2]ke equivalent linear-elastic slab stiffness, [M T�2]m slab mass, [M]pðtÞ dynamic loading function, [–]pðrÞ blast pressure, [M L�1 T�2]r radial axis direction, [L]rmax position of perimeter with maximum shear demand, [L]rs position of zero bending moment with respect to support
axis, [L]t time, [T]
J. Sagaseta et al. / Engineering Structures 147 (2017) 177–194 193
td blast duration, [T]u slab displacement, [L]udyn;ustatic slab displacement for dynamic, static loading, [L]€u slab acceleration, [L T�2]
Latin upper caseCr reflection coefficient, [–]Es steel reinforcement elastic modulus, [M L�1 T�2]I resultant of inertial forces, [M L T�2]KL load transformation factor, [–]KM mass transformation factor, [–]KLM load-mass transformation factor, [–]KP coefficient applied to blast load contributing to dynamic
reactionKRe coefficient applied to resistance contributing to dynamic
reactionL slab span, [L]MR unit slab flexural capacity, [M L T�2]Ms unit slab bending moment, [M L T�2]P total load, [M L T�2]P0 peak incident overpressure, [M L�1 T�2]Pr0 peak normally reflected overpressure, [M L�1 T�2]Ps0 ambient pressure, [M L�1 T�2]R radius of blast-loaded area, [L]S stand-off distance, [L]T natural period [T]Vd shear force, [M L T�2]Vdyn dynamic shear force demand, [M L T�2]Vflex ultimate flexural resistance, [M L T�2]Vmax;dyn maximum dynamic shear force demand, [M L T�2]VR punching shear strength, [M L T�2]W mass of explosive, [M]Z scaled distance, [M�1/3 L]
Greek lower casea pressure decay parameter, [L�1]b slab stiffness parameter, [M L1/3 T�2]_e strain-rate, [T�1]q flexural reinforcement ratio, [–]uðxÞ slab deformed configuration shape function, [–]h slab rotation using blast notation, [–]hdyn slab rotation at failure (dynamic loading), [–]hR slab rotation failure (quasi-static loading), [–]kP ; kI fraction coefficients of the total pressure and inertial loads,
[–]n shear demand factor to peak reflected overpressure, [L]x undamped natural frequency, [T�1]
Greek upper caseW spall parameter, [M0:926L�0:66T�0:532]
References
[1] Lu B, Silva PF, Nanni A, Baird J. Retrofit for blast-resistant RC slabs withcomposite materials, 230. ACI Special Publication; 2005. p. 1345-1360.
[2] Silva PF, Lu B. Improving the blast resistance capacity of RC slabs withinnovative composite materials. Compos B Eng 2007;38(5–6):523–34.
[3] Silva PF, Lu B. Blast resistance capacity of reinforced concrete slabs. ASCE JStruct Eng 2009;135(6):708–16.
[4] Wang W, Zhang D, Lu F, Wang S-C, Tang F. Experimental study on scaling theexplosion resistance of a one-way square reinforced concrete slab under aclose-in blast loading. Int J Impact Eng 2012;49:158–64.
[5] Wang W, Zhang D, Lu F, Wang S-C, Tang F. Experimental study and numericalsimulation of the damage mode of a square reinforced concrete slab underclose-in explosion. Eng Fail Anal 2013;27:41–51.
[6] Wang W, Zhang D, Lu F, Tang F, Wang S-C. Pressure-impulse diagram withmultiple failure modes of one-way reinforced concrete slab under blastloading using SDOF method. J Central South Univ 2013;20(2):510–9.
[7] Zhao CF, Chen JY. Damage mechanism and mode of square reinforced concreteslab subjected to blast loading. Theoret Appl Fract Mech 2013;63–64:54–62.
[8] Castedo R, Segarra P, Alañon A, Lopez LM, Santos AP, Sanchidrian JA. Air blastresistance of full-scale slabs with different compositions: numerical modellingand field validation. Int J Impact Eng 2015;86:145–56.
[9] Schenker A, Anteby I, Gal E, Kivity Y, Nizri E, Sadot O, et al. Full-scale field testsof concrete slabs subjected to blast loads. Int J Impact Eng 2008;35(3):184–98.
[10] Fischer K, Häring I. SDOF response model parameters from dynamic blastloading experiments. Eng Struct 2009;31(8):1677–86.
[11] Ghani Razaqpur A, Tolba A, Contestabile E. Blast loading response of reinforcedconcrete panels reinforced with externally bonded GFRP laminates. Compos BEng 2007;38(5–6):535–46.
[12] Tabatabaei ZS, Volz JS, Baird J, Gliha BP, Keener DI. Experimental andnumerical analyses of long carbon fiber reinforced concrete panels exposedto blast loading. Int J Impact Eng 2013;57:70–80.
[13] Walley F. Property Services Agency: Directorate of Civil Engineering Services;1978.
[14] Cormie D, Mays G, Smith P. Blast effects on buildings. 2nd ed. London: ICEPublishing; 2012.
[15] UFC 3-340-01 – Design and analysis of hardened structures to conventionalweapons effects; 2002.
[16] Muttoni A. Punching shear strength of reinforced concrete slabs withouttransverse reinforcement. ACI Struct J 2008;105(4):440–50.
[17] Micallef K, Sagaseta J, Fernández Ruiz M, Muttoni A. Assessing punching shearfailure in reinforced concrete flat slabs subjected to localised impact loading.Int J Impact Eng 2013;71:17–33.
[18] Fernández Ruiz M, Muttoni A. Applications of critical shear crack theory topunching of reinforced concrete slabs with transverse reinforcement. ACIStruct J 2009;106(4):485–94.
[19] Maya LF, Fernández Ruiz M, Muttoni A, Foster SJ. Punching shear strength ofsteel fibre reinforced concrete slabs. Eng Struct 2012;40:83–94.
[20] Muttoni A. SIA Draft Code Proposal (SIA 162/AG5). Zürich, Switzerland: SwissFederal Institute of Technology; 1988.
[21] Fédération internationale du béton. fib Model Code for Concrete Structures2010, ed. E. Sohn 2013, Berlin, Germany. 434 p.
[22] Siburg C, Ricker M, Hegger J. Punching shear design of footings: critical reviewof different code provisions. Struct Concr 2013;15(4):497–508.
[23] Simoes JT, Faria DMV, Fernandez Ruiz M, Muttoni A. Strength of reinforcedconcrete footings without transverse reinforcement according to limitanalysis. Eng Struct 2016;112:146–61.
[24] Hopkinson B, British Ordinance Board Minutes. London; 1915.[25] Cranz, C., Lehrbuch der Ballistic. Berlin; 1926.[26] Henrych J. The dynamics of explosions and its use. Amsterdam: Elsevier; 1979.[27] Smith PD, Hetherington JG. Blast and ballistic loading of
structures. Oxford: Butterworth-Heinemann; 1994.[28] Ballantyne GJ, Whittaker AS, Dargush GF, Aref AJ. Air-blast effects on structural
shapes of finite width. J Struct Eng 2010;136(2):152–9.[29] Rigby SE. Blast wave clearing effects on finite-sized targets subjected to
explosive loads. PhD Thesis, University of Sheffield; 2014.[30] Karagiozova D, Langdon GS, Nurick GN, Yuen SCK. Simulation of the response
of fibre–metal laminates to localised blast loading. Int J Impact Eng2010;37:766–82.
[31] Langdon GS, Karagiozova D, Klemperer CJ, Nurick GN, Ozinsky A, Pickering EG.The air-blast response of sandwich panels with composite face sheets andpolymer foam cores: experiments and predictions. Int J Impact Eng2013;54:64–82.
[32] Bonorchis D, Nurick GN. The influence of boundary conditions on the loadingof rectangular plates subjected to localised blast loading - importance innumerical simulations. Int J Impact Eng 2009;36:40–52.
[33] Micallef K, Fallah AS, Pope DJ, Moatamedi M, Louca LA. On dimensionlessloading parameters for close-in blasts. Int J Multiphys 2015;9(2):171–93.
[34] Tyas A, Reay J, Warren JA, Rigby SE, Clarke SD, Fay S, Pope DJ, Experimentalstudies of blast wave development and target loading from near-fieldspherical PETN explosive charges. In: 16th international symposium on theinteraction of the effects of munitions with structures (ISIEMS), Destin(Florida); 2015.
[35] Tyas A, Warren JA, Bennett T, Fay S. Prediction of clearing effects in far-fieldblast loading of finite targets. Shock Waves 2011;21(2):111–9.
[36] UFC 3-340-02 – Structures to resist the effects of accidental explosions. USADepartment of Defense; 2008.
[37] USACE-PDC. Methodology manual for the single-degree-of-freedom blasteffects design spreadsheets (SBEDS). Unite States Army Corps of Engineers,Protective Design Center; 2008.
[38] Biggs JM. Introduction to structural dynamics. New York: McGraw-Hill; 1964.[39] Morison CM. Dynamic response of walls and slabs by single-degree-of-
freedom analysis: a critical review and revision. Int J Impact Eng 2006;32(8):1214–47.
[40] El-Dakhakhni W, Mekky W, Rezaei S. Validity of SDOF models for analysingtwo-way reinforced concrete panels under blast loading. J Perform Constr Facil2010;24(4):311–25.
[41] Stochino F, Carta G. SDOF models for reinforced concrete beams underimpulsive loads accounting for strain rate effects. Nucl Eng Des2014;276:74–86.
[42] Clough RW, Penzien J. Dynamics of structures. Berkeley: Computers andStructures Inc.; 2003.
[43] Chopra AK. Dynamics of structures. 4th ed. New Jersey: Prentice-Hall; 2011.

194 J. Sagaseta et al. / Engineering Structures 147 (2017) 177–194
[44] Sagaseta J, Muttoni A, Fernández Ruiz M, Tassinari L. Non-axis-symmetricalpunching shear around internal columns of RC slabs without transversereinforcement. Mag Concr Res 2011;63(6):441–57.
[45] Li QM, Ye ZQ, Ma GW, Reid SR. Influence of overall structural response onperforation of concrete targets. Int J Impact Eng 2007;34(5):926–41.
[46] ACI Committee 318. Building code requirements for structural concrete (ACI318-11) and commentary. Farmington Hills: Michigan; 2011.
[47] CEN, EN 1992-1-1 – Design of concrete structures – Part 1–1: General rulesand rules for buildings. Brussels (Belgium); 2004.
[48] Giovino G, Olmati P, Garbati S, Bontempi F. Blast resistance assessment ofconcrete wall panels: experimental and numerical investigations. Int JProtective Struct 2014;5(3):349–66.
[49] Schubert S, Hoffmann C, Leemann A, Moser K, Motavalli M. Recycled aggregateconcrete: experimental shear resistance of slabs without shear reinforcement.Eng Struct 2012;41:490–7.
[50] Lee TH, Mosalam KM. Probabilistic fiber element modeling of reinforcedconcrete structures. Comput Struct 2004;82:2285–99.
[51] Mander JB, Priestley MJN, Park R. Theoretical stress-strain model for confinedconcrete. J Struct Eng 1988;114:1804–26.
[52] CEB, Model Code 1990, 1993, CEB/fib.[53] Su XY, Tu TX, Reid SR. Inertia-sensitive impact energy-absorbing structures
part II: Effect of strain rate. Int J Impact Eng 1995;16(4):673–89.