Embed Size (px)
Citation preview
PUMS Accuracy of the Data (2012) 1. INTRODUCTION
The public use microdata samples (PUMS) are a subset of the 2012 American Community Survey (ACS) and Puerto Rico Community Survey (PRCS) samples. Unless otherwise specified, the term “ACS” in this document will refer to both the ACS and PRCS. Like the 2006 through 2011 PUMS, the 2012 PUMS contains a sample of the group quarters (GQ) population which were not included in the 2005 PUMS. The 2012 PUMS GQ sample is similar to the 2011 sample due to the inclusion of imputed records described in the section on Sample Design. For the 2005 through 2012 PUMS, the ACS selected sample in all counties across the nation, and all municipios in Puerto Rico. The 2012 PUMS data contains 1,340,387 housing unit records and 2,992,629 person records from households and 153,458 person records from GQs which includes imputed records. Estimates from the PUMS are expected to be different from the previously released ACS estimates because they are subject to additional sampling error and further data processing operations. The additional sampling error is a result of selecting the PUMS housing and person records through an additional stage of sampling. In the public use file, the basic unit is an individual housing unit, except for the sample from GQs. For the GQ sample, the basic unit is the person. The population sample is defined as all persons living in households selected in the housing unit sample, plus the persons selected from the GQ sample. Note that microdata records in this sample do not contain names, addresses, or any information that can identify a specific housing unit, GQ or person.
Table of Contents Confidentiality of the Data...............................................................................................................2 Sample Design ................................................................................................................................3 Weighting and Estimation ...............................................................................................................6
Weighting ....................................................................................................................................6 Estimation .....................................................................................................................................9
Errors in the Data ..........................................................................................................................10 Sampling Error ...........................................................................................................................10 Nonsampling Error .....................................................................................................................10
Measuring Sampling Error ............................................................................................................11 Approximating Standard Errors with Replicate Weights ..............................................................13
Approximating Generalized Standard Errors with Design Factors ............................................14 Standard Errors for Total and Percentages .............................................................................14 Standard Errors for Sums and Differences .............................................................................16 Standard Errors for Ratios ......................................................................................................16 Standard Errors for Medians ..................................................................................................16 Standard Errors for Means......................................................................................................17
Examples of Standard Error Calculations using Generalized Standard Error Formulas ............18 Working with Dollar Amounts .....................................................................................................21
Adjustment Factors on the PUMS File ......................................................................................21 Dollars from Different Years .....................................................................................................21
References .....................................................................................................................................22 Design Factors for Calculating PUMS Standard Errors ...............................................................23 PUMAs in Which the Fertility and Telephone Variables Were Suppressed ...............................129

2
2. CONFIDENTIALITY OF THE DATA The Census Bureau has implemented a series of steps to protect the confidentiality of the data. Title 13 United States Code, Section 9, prohibits the Census Bureau from publishing results in which an individual's data can be identified. The Census Bureau’s internal Disclosure Review Board sets the confidentiality rules for all data releases. A checklist approach is used to ensure that all potential risks to the confidentiality of the data are considered and addressed.
• Title 13, United States Code: Title 13 of the United States Code authorizes the Census Bureau to conduct censuses and surveys. Section 9 of the same Title requires that any information collected from the public under the authority of Title 13 be maintained as confidential. Section 214 of Title 13 and Sections 3559 and 3571 of Title 18 of the United States Code provide for the imposition of penalties of up to five years in prison and up to $250,000 in fines for wrongful disclosure of confidential census information.
• Disclosure Avoidance: Disclosure avoidance is the process for protecting the
confidentiality of data. A disclosure of data occurs when someone can use published statistical information to identify an individual that has provided information under a pledge of confidentiality. For data tabulations the Census Bureau uses disclosure avoidance procedures to modify or remove the characteristics that put confidential information at risk for disclosure.
• Data Swapping: Data swapping is a method of disclosure avoidance designed to protect
confidentiality in tables of frequency data (the number or percent of the population with certain characteristics). Data swapping is done by editing the source data or exchanging records for a sample of cases when creating a table. A sample of households is selected and matched on a set of selected key variables with households in neighboring geographic areas that have similar characteristics (such as the same number of adults and same number of children). Because the swap often occurs within a neighboring area, there is no effect on the marginal totals for the area or for totals that include data from multiple areas. Because of data swapping, users should not assume that tables with cells having a value of one or two reveal information about specific individuals. Data swapping procedures were first used in the 1990 Census, and were used again in Census 2000.
• Synthetic Data: The goals of using synthetic data are the same as the goals of data
swapping, namely to protect the confidentiality in tables of frequency data. Persons are identified as being at risk for disclosure based on certain characteristics. The synthetic data technique then models the values for another collection of characteristics to protect the confidentiality of that individual.
The Census Bureau takes further steps to prevent the identification of specific individuals, households, or housing units on the PUMS files. The main disclosure avoidance method used is to limit the geographic detail shown in the files. The smallest geographic unit that is identified is the Public Use Microdata Area (PUMA). PUMAs were created for the 2010 Census PUMS data
3
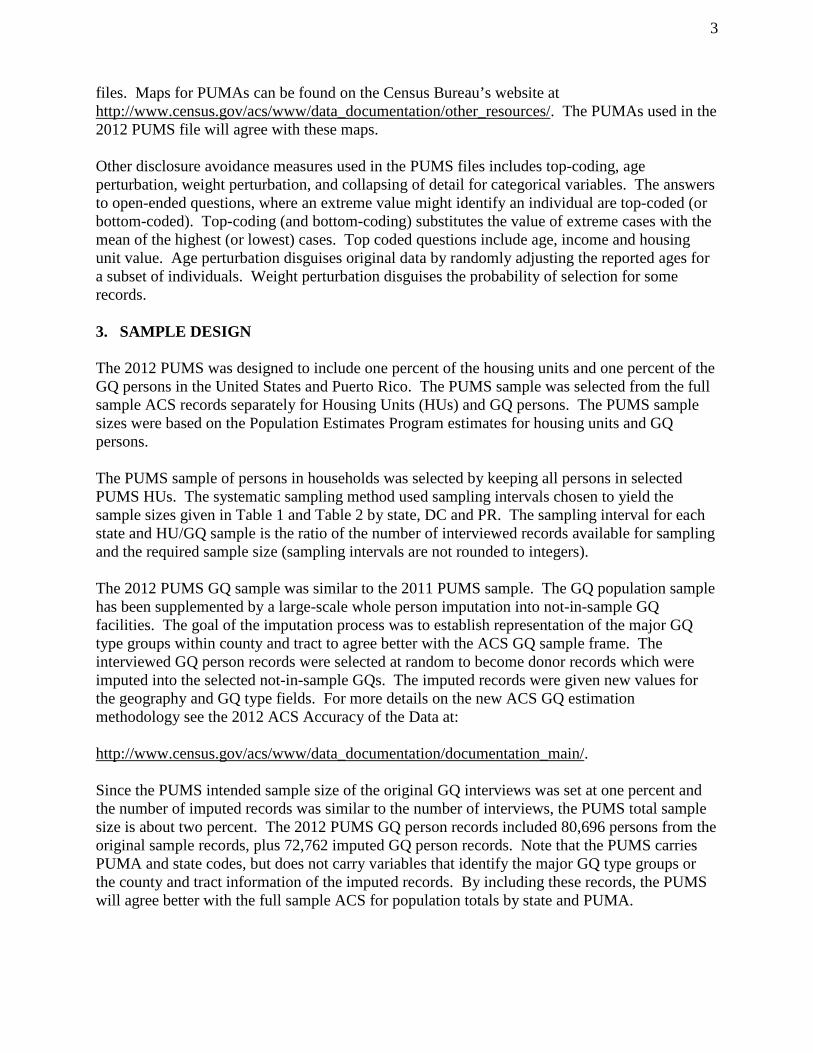
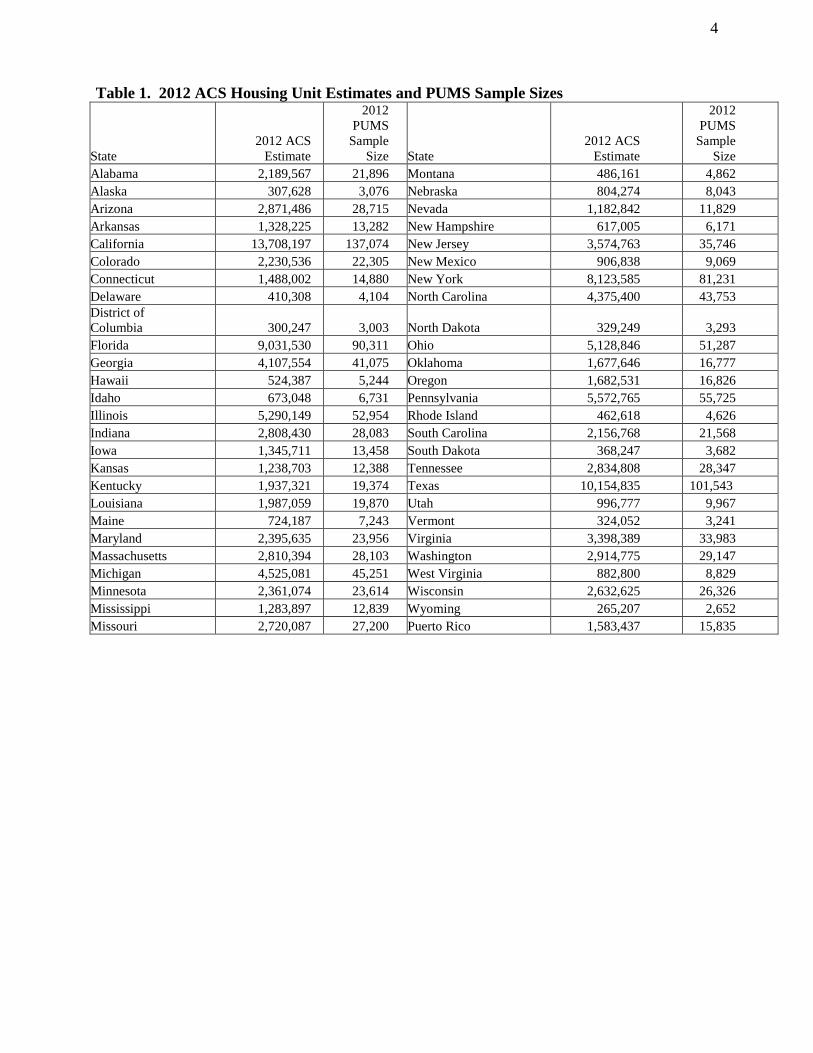
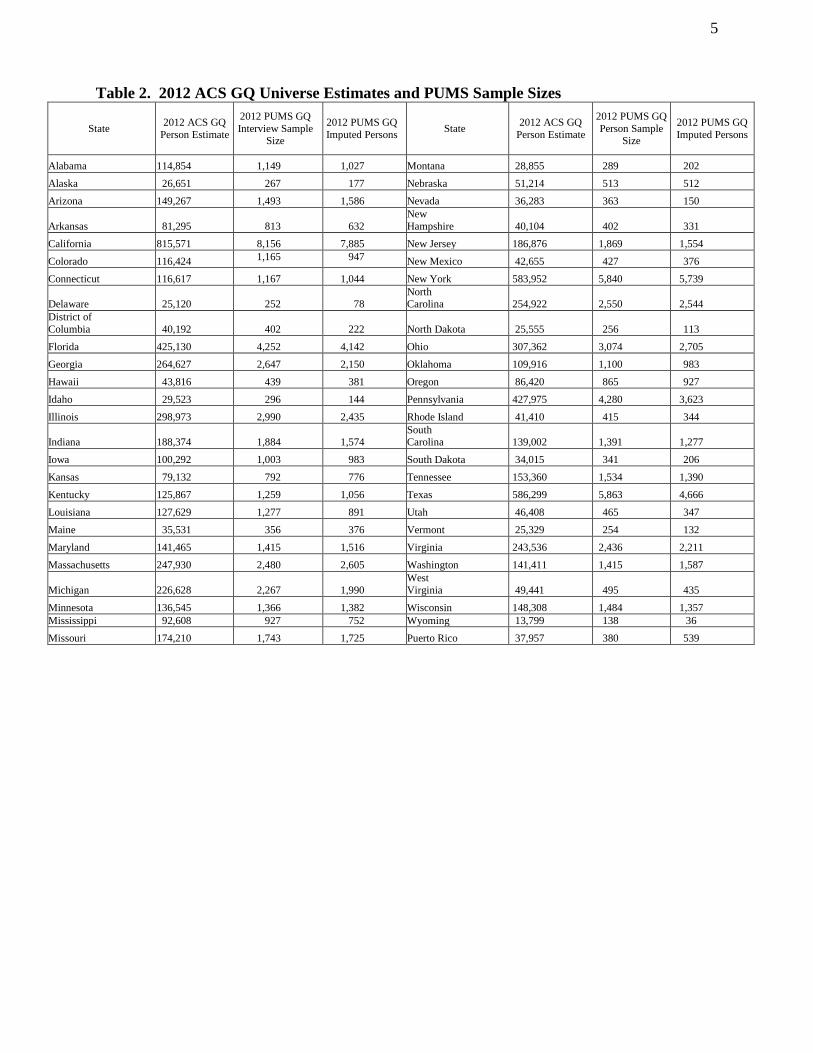
files. Maps for PUMAs can be found on the Census Bureau’s website at http://www.census.gov/acs/www/data_documentation/other_resources/. The PUMAs used in the 2012 PUMS file will agree with these maps. Other disclosure avoidance measures used in the PUMS files includes top-coding, age perturbation, weight perturbation, and collapsing of detail for categorical variables. The answers to open-ended questions, where an extreme value might identify an individual are top-coded (or bottom-coded). Top-coding (and bottom-coding) substitutes the value of extreme cases with the mean of the highest (or lowest) cases. Top coded questions include age, income and housing unit value. Age perturbation disguises original data by randomly adjusting the reported ages for a subset of individuals. Weight perturbation disguises the probability of selection for some records. 3. SAMPLE DESIGN The 2012 PUMS was designed to include one percent of the housing units and one percent of the GQ persons in the United States and Puerto Rico. The PUMS sample was selected from the full sample ACS records separately for Housing Units (HUs) and GQ persons. The PUMS sample sizes were based on the Population Estimates Program estimates for housing units and GQ persons. The PUMS sample of persons in households was selected by keeping all persons in selected PUMS HUs. The systematic sampling method used sampling intervals chosen to yield the sample sizes given in Table 1 and Table 2 by state, DC and PR. The sampling interval for each state and HU/GQ sample is the ratio of the number of interviewed records available for sampling and the required sample size (sampling intervals are not rounded to integers). The 2012 PUMS GQ sample was similar to the 2011 PUMS sample. The GQ population sample has been supplemented by a large-scale whole person imputation into not-in-sample GQ facilities. The goal of the imputation process was to establish representation of the major GQ type groups within county and tract to agree better with the ACS GQ sample frame. The interviewed GQ person records were selected at random to become donor records which were imputed into the selected not-in-sample GQs. The imputed records were given new values for the geography and GQ type fields. For more details on the new ACS GQ estimation methodology see the 2012 ACS Accuracy of the Data at: http://www.census.gov/acs/www/data_documentation/documentation_main/. Since the PUMS intended sample size of the original GQ interviews was set at one percent and the number of imputed records was similar to the number of interviews, the PUMS total sample size is about two percent. The 2012 PUMS GQ person records included 80,696 persons from the original sample records, plus 72,762 imputed GQ person records. Note that the PUMS carries PUMA and state codes, but does not carry variables that identify the major GQ type groups or the county and tract information of the imputed records. By including these records, the PUMS will agree better with the full sample ACS for population totals by state and PUMA.
4
Table 1. 2012 ACS Housing Unit Estimates and PUMS Sample Sizes
State 2012 ACS
Estimate
2012 PUMS
Sample Size State
2012 ACS Estimate
2012 PUMS
Sample Size
Alabama 2,189,567 21,896 Montana 486,161 4,862 Alaska 307,628 3,076 Nebraska 804,274 8,043 Arizona 2,871,486 28,715 Nevada 1,182,842 11,829 Arkansas 1,328,225 13,282 New Hampshire 617,005 6,171 California 13,708,197 137,074 New Jersey 3,574,763 35,746 Colorado 2,230,536 22,305 New Mexico 906,838 9,069 Connecticut 1,488,002 14,880 New York 8,123,585 81,231 Delaware 410,308 4,104 North Carolina 4,375,400 43,753 District of Columbia 300,247 3,003 North Dakota 329,249 3,293 Florida 9,031,530 90,311 Ohio 5,128,846 51,287 Georgia 4,107,554 41,075 Oklahoma 1,677,646 16,777 Hawaii 524,387 5,244 Oregon 1,682,531 16,826 Idaho 673,048 6,731 Pennsylvania 5,572,765 55,725 Illinois 5,290,149 52,954 Rhode Island 462,618 4,626 Indiana 2,808,430 28,083 South Carolina 2,156,768 21,568 Iowa 1,345,711 13,458 South Dakota 368,247 3,682 Kansas 1,238,703 12,388 Tennessee 2,834,808 28,347 Kentucky 1,937,321 19,374 Texas 10,154,835 101,543 Louisiana 1,987,059 19,870 Utah 996,777 9,967 Maine 724,187 7,243 Vermont 324,052 3,241 Maryland 2,395,635 23,956 Virginia 3,398,389 33,983 Massachusetts 2,810,394 28,103 Washington 2,914,775 29,147 Michigan 4,525,081 45,251 West Virginia 882,800 8,829 Minnesota 2,361,074 23,614 Wisconsin 2,632,625 26,326 Mississippi 1,283,897 12,839 Wyoming 265,207 2,652 Missouri 2,720,087 27,200 Puerto Rico 1,583,437 15,835
5
Table 2. 2012 ACS GQ Universe Estimates and PUMS Sample Sizes
State 2012 ACS GQ Person Estimate
2012 PUMS GQ Interview Sample
Size
2012 PUMS GQ Imputed Persons State 2012 ACS GQ
Person Estimate
2012 PUMS GQ Person Sample
Size
2012 PUMS GQ Imputed Persons
Alabama 114,854 1,149 1,027 Montana 28,855 289 202 Alaska 26,651 267 177 Nebraska 51,214 513 512 Arizona 149,267 1,493 1,586 Nevada 36,283 363 150
Arkansas 81,295 813 632 New Hampshire 40,104 402 331
California 815,571 8,156 7,885 New Jersey 186,876 1,869 1,554 Colorado 116,424 1,165 947 New Mexico 42,655 427 376 Connecticut 116,617 1,167 1,044 New York 583,952 5,840 5,739
Delaware 25,120 252 78 North Carolina 254,922 2,550 2,544
District of Columbia 40,192 402 222 North Dakota 25,555 256 113 Florida 425,130 4,252 4,142 Ohio 307,362 3,074 2,705 Georgia 264,627 2,647 2,150 Oklahoma 109,916 1,100 983 Hawaii 43,816 439 381 Oregon 86,420 865 927 Idaho 29,523 296 144 Pennsylvania 427,975 4,280 3,623 Illinois 298,973 2,990 2,435 Rhode Island 41,410 415 344
Indiana 188,374 1,884 1,574 South Carolina 139,002 1,391 1,277
Iowa 100,292 1,003 983 South Dakota 34,015 341 206 Kansas 79,132 792 776 Tennessee 153,360 1,534 1,390 Kentucky 125,867 1,259 1,056 Texas 586,299 5,863 4,666 Louisiana 127,629 1,277 891 Utah 46,408 465 347 Maine 35,531 356 376 Vermont 25,329 254 132 Maryland 141,465 1,415 1,516 Virginia 243,536 2,436 2,211 Massachusetts 247,930 2,480 2,605 Washington 141,411 1,415 1,587
Michigan 226,628 2,267 1,990 West Virginia 49,441 495 435
Minnesota 136,545 1,366 1,382 Wisconsin 148,308 1,484 1,357 Mississippi 92,608 927 752 Wyoming 13,799 138 36 Missouri 174,210 1,743 1,725 Puerto Rico 37,957 380 539
6
The sampling for PUMS HUs was performed on ACS sample of HUs as follows:
1. Records of ACS HUs were sorted within each state by: PUMA, ACS weighting area, interview mode, type of vacant, tenure, building type, household type, householder demographics (race, Hispanic origin, sex and age), county, tract, and housing unit weight.
2. Systematic sampling was applied to ACS HUs as described below: a. Within each state, a random number is chosen between zero and the sampling
interval. A counter is initialized with the random number. b. At each HU record, the value of the counter is incremented by one and compared
to the sampling interval. i. If the counter’s new value is greater than the sampling interval, the HU
record is selected for the PUMS and a flag is set to 1. The counter is decreased by the sampling interval with the new value passed to the next record.
ii. If the counter is less than the sampling interval, the HU record is not selected for the PUMS and the value of the counter is passed to the next record without altering its value.
3. All HUs selected for PUMS were placed in the PUMS HU sample file.
4. The PUMS HU sample file was matched to the ACS sample of persons. All persons in selected HUs were placed in the PUMS person sample.
The sampling for PUMS GQ persons was performed on the ACS sample of GQ persons as follows:
1. Interviewed GQ persons were sorted within each state by the size of their GQ facility (large vs. small), the type of GQ facility, PUMA, demographics (race, Hispanic origin, sex and age), county, tract, and GQ person weight.
2. Systematic sampling was applied as described above under HUs.
3. All selected GQ interviewed persons were added to the PUMS person sample. All imputed records derived from the selected PUMS interviews were also kept in the PUMS person sample. A placeholder record was also placed in the PUMS HU file for each PUMS GQ person record.
4. WEIGHTING AND ESTIMATION 4.1 Weighting Weights for PUMS person records are a product of the final full ACS weight, the PUMS subsampling factor and ratio-estimate factors. The PUMS subsampling factors are the sampling intervals used to sample the PUMS HU or GQ person records within a state. The ratio-estimate factors bring the PUMS estimates into closer agreement with the published ACS estimates for several characteristics explained below.

7
Group Quarters Person Weighting
The group quarters (GQ) person weighting for the PUMS 2012 1-year estimates was similar to the 2011 PUMS weighting in that it included both the sampled interviews and the imputed records described in the section on Sample Design. However, imputed records were treated the same as PUMS sample interviews in the weighting.
The procedure used to assign the weights to the GQ persons is performed independently within state. The steps are as follows:
1. Initial Weight - The PUMS initial weight is the product of the ACS unrounded weights for the record and the PUMS subsampling factor. Each imputed record received the same subsampling factor as its donor interview.
2. GQ Person Post-stratification Factor - This factor adjusts the GQ person weights so that the weighted sample counts equal ACS published estimates at the state level. Due to the ACS GQ sample design and noise added for disclosure avoidance reasons, only state level PUMS GQ person estimates will agree closely with published ACS 2010 estimates. This adjustment uses the following groups:
State × Institutional/noninstitutional × Sex × Age Category
3. Rounding - The final GQ person weight is rounded to an integer. Rounding is performed so that the sum of the rounded weights is within one person of the sum of the ACS total GQ person estimate within state.
Housing Unit and Household Person Weighting
The estimation procedure used to assign the HU and person weights is performed independently within each PUMA. 1. Initial Weight for persons and HUs - The PUMS initial weight is the product of the ACS
final weight for the record and the PUMS subsampling factor.
2. Person Weighting Factors - The person weights are adjusted to agree better with ACS published estimates for householders, spouses, race, Hispanic origin, sex and age by a series of two steps which are repeated until a stopping criterion is met. This is an iterative proportional fitting or raking process. The person weights are individually adjusted at each step as described below.
The two steps are as follows:
• Spouse Equalization/Householder Equalization Raking Factor—This factor is applied to individuals based on the combination of their status of being in a married-couple or unmarried-partner household and whether they are the householder. All persons are assigned to one of four groups:

8
1. Householder in a married-couple or unmarried-partner household 2. Spouse or unmarried partner in a married-couple or unmarried-partner
household (non-householder) 3. Other householder 4. Other non-householder
The weights of persons in the first two groups are adjusted so that their sums are each
equal to the ACS estimate of married-couple or unmarried-partner households using the ACS housing unit weight. The weights of persons in the third group are adjusted so that the sum is equal to the ACS estimate of occupied housing units not having a partner using the housing unit weight. The weights of persons in the fourth group are adjusted to agree with the ACS total population minus the first three groups. The goal of this step is to produce more consistent estimates of spouses or unmarried partners and married-couple and unmarried-partner households while simultaneously producing more consistent estimates of householders, occupied housing units, and households.
• Demographic Raking Factor—This factor is applied to individuals based on their age, race, sex and Hispanic origin. It adjusts the person weights so that the weighted sample counts equal ACS population estimates by age, race, sex, and Hispanic origin at the PUMA level. Because of collapsing of groups in applying this factor, only total population is assured of agreeing precisely with the published ACS 2012 population estimates at the PUMA level.
This uses the following groups within each PUMA (note that there are 13 Age groupings):
Race / Ethnicity (non-Hispanic White, non-Hispanic Black, non-Hispanic American Indian or Alaskan Native, non-Hispanic Asian, non-Hispanic Native Hawaiian or Pacific Islander, and Hispanic (any race)) × Sex × Age Groups.
These two steps are repeated several times until the estimates at the PUMA level achieve their optimal consistency with regard to the spouse and householder equalization. The final Person Weighting Factor is then equal to the product of the factors from all of the iterations of these two adjustments. The unrounded person weight is then equal to the product of Person Weighting Factor times the initial person weight.
3. Rounding of person weights - The person weight after the Person Weighting Factor has been applied is rounded to an integer. Rounding is performed so that the sum of the rounded weights is within one person of the sum of the ACS total person from HU’s estimates within state and PUMA. 4. Householder adjustment Factor (HHRF)—This factor applied to occupied housing units is the same as the Person Weighting factor from the person weighting. After this stage the weight of the housing unit is identical to the unrounded person weight of the householder after the Person Weighting Factor is applied.
9
5. Housing Unit Control factor - This factor adjusts PUMS housing unit estimates to agree with the published ACS housing unit estimates for housing units with married couples (or partners), occupied housing units without partners and vacant housing units.
6. Rounding of Housing Unit weights - The Housing Unit weight after the Housing Unit Control Factor is applied is rounded to an integer. Rounding is performed so that the sum of the rounded weights is within one housing unit of the sum of the ACS total HU’s estimates within state and PUMA.
For a detailed description of how the original ACS weights are computed see ACS Accuracy of the Data for 2012 found on http://www.census.gov/acs/www/data_documentation/documentation_main/ 4.2 Estimation To produce estimates or tabulations of characteristics from the PUMS, simply add the weights of all persons or HUs that possess the characteristic of interest. For instance, if the characteristic of interest is “total number of black teachers”, simply determine the race and occupation of all persons and cumulate the weights of those who match the characteristics of interest. To get estimates of proportions simply divide the weighted estimate of persons or HUs with a given characteristic by the weighted estimate of the base. For example, the proportion of “black teachers” is obtained by dividing the weighted estimate of black teachers by the weighted estimate of teachers. PUMS estimates are expected to be different from published ACS estimates that are based on the full set of data because of the additional sampling. The exception will be characteristics controlled by the ratio-estimate factors at the PUMA level for HUs and persons in HUs and at the state level for GQ persons. Note that the housing unit file contains some records with zero weights. These are the GQ placeholder records1. The housing unit weights were set to zero for these records since they are not housing units, but persons. For confidentiality reasons, the GQ data are not provided at the level of an address but only at the person-level. All of the GQ person data are included in the PUMS person file except the food stamp recipiency variable which is included on the GQ placeholder records in the housing unit file. For food stamp recipiency estimates of persons in GQs, you will need to match the placeholder records to the person file to get the person weights. A note to GQ data users. There are limitations to the usefulness of GQ estimates at the PUMA level. The PUMS weighting controls the GQ estimates to agree with the ACS state level estimates. Depending on the application or analysis, GQ data users should consider working with state level estimates rather than PUMAs.
1 To identify HU and GQ placeholder records on the PUMS housing file, see the TYPE variable in the PUMS data dictionary: http://www.census.gov/acs/www/data_documentation/pums_documentation/

10
For the first time, the ACS PUMS file has suppressed variables in the 2012 1-year PUMS file for a limited number of geographies. This is due to nonsampling error or issues with interpreting the recode. Three variables were affected. The fertility variable (FER) was suppressed in 59 PUMAs within states Florida, Georgia, Kansas, Montana, North Carolina, Ohio and Texas. The telephone variable (TEL) was suppressed in six PUMAs in Georgia. The complete plumbing facilities recode (PLM) was suppressed in Puerto Rico. In these cases, the nonsampling errors could not be edited or corrected before the publication of the PUMS file. Within the PUMAs listed in the user note, the variables FER and TEL were assigned the value ‘8’ to identify them as suppressed due to data problems. In order to estimate the fertility rate or the telephone rate for the states impacted by the suppressed values, use the estimate having the value of ‘1’ divided by the sum of the estimate having the value of ‘1’ and the estimate having the value of ‘2’. Examples are shown:
The variable PLM was assigned the value of ‘9’ in all PUMAs in Puerto Rico to mean not applicable. See the Attachment that follows Table 3.52 for a list of PUMA codes affected by the FER and TEL variables. 5. ERRORS IN THE DATA Every sample survey is subject to two types of error: sampling error and nonsampling error. 5.1 Sampling Error The data in the ACS products are estimates of the actual figures that would have been obtained by interviewing the entire population using the same methodology. The estimates from the chosen sample also differ from other samples of HUs and persons within those HUs. Sampling error in data arises due to the use of probability sampling, which is necessary to ensure the integrity and representativeness of sample survey results. The implementation of statistical sampling procedures provides the basis for the statistical analysis of sample data. Estimates made with PUMS data are subject to additional sampling error because the PUMS data consists of a subset of the full ACS sample. Thus standard errors of PUMS estimates can be larger than standard errors that would be obtained using all of the ACS data. 5.2 Nonsampling Error In addition to sampling error, data users should realize that other types of errors may be introduced during any of the various complex operations used to collect and process survey data. For example, operations such as data entry from questionnaires and editing may introduce error into the estimates. These and other sources of error contribute to the nonsampling error
11
component of the total error of survey estimates. Nonsampling errors may affect the data in two ways. Errors that are introduced randomly increase the variability of the data. Systematic errors, which are consistent in one direction, introduce bias into the results of a sample survey. The Census Bureau protects against the effect of systematic errors on survey estimates by conducting extensive research and evaluation programs on sampling techniques, questionnaire design, and data collection and processing procedures. In addition, an important goal of the ACS is to minimize the amount of nonsampling error introduced through nonresponse for sample HUs. One way of accomplishing this is by following up on mail nonrespondents during the CATI and CAPI phases. As mentioned in the Estimation Section, the suppression of three variables in a limited number of geographies was due to nonsampling error. The amount of nonsampling error for these variables is negligible at the national level and usually small at the state level but may be substantial for smaller geographies that include the PUMAs listed in Table 4. More information about the control of nonsampling error can be found in the ACS Accuracy of the Data for 2012 found on http://www.census.gov/acs/www/data_documentation/documentation_main/ 6. MEASURING SAMPLING ERROR Standard Error: A measure of the deviation of a sample estimate from the average of all possible samples. Sampling error and some types of nonsampling error such as undercoverage and item nonreponse are estimated by the standard error. The sample estimate and its estimated standard error permit the construction of interval estimates with a prescribed confidence that the interval includes the average result of all possible samples. Two methods are provided for estimating the standard errors of PUMS estimates: replicate weights and design factors. Replicate weights have been provided with the ACS PUMS files since the 2005 PUMS. Design factors (a type of generalized variance function) is a method used by the Census PUMS and also in use by the ACS PUMS since 2000. It is important to keep in mind that there will be differences between the standard error approximations computed by the two methods. Generally, using the replicate weights will produce a more accurate estimate of a standard error. Confidence Intervals: A sample estimate and its estimated standard error may be used to construct confidence intervals about the estimate. These intervals are ranges that will contain the average value of the estimated characteristic that results over all possible samples, with a known probability. For example, if all possible samples that could result under the PUMS sample design were independently selected and surveyed under the same conditions, and if the estimate and its estimated standard error were calculated for each of these samples, then:
1. Approximately 68 percent of the intervals from one estimated standard error below the estimate to one estimated standard error above the estimate would contain the average result from all possible samples;
12
2. Approximately 90 percent of the intervals from 1.645 times the estimated standard
error below the estimate to 1.645 times the estimated standard error above the estimate would contain the average result from all possible samples.
3. Approximately 95 percent of the intervals from two estimated standard errors below
the estimate to two estimated standard errors above the estimate would contain the average result from all possible samples.
These intervals are referred to as 68 percent, 90 percent, and 95 percent confidence intervals, respectively. An example of how to construct a 90 percent confidence interval follows:
Add and subtract 1.645 times the standard error to the estimate to yield the lower and upper bounds of a 90% confidence interval around the estimate (EST).
LB=Lower bound = EST - 1.645*SE(EST) UB=Upper bound = EST + 1.645*SE(EST)
The 90% confidence interval is the interval (LB, UB).
Limitations: The user should be careful when computing and interpreting standard errors and confidence intervals.
1. The estimated standard errors included in this data product do not include all portions
of the variability due to nonsampling error that may be present in the data. In particular, the standard errors do not reflect the effect of correlated errors introduced by interviewers, coders, or other field or processing personnel. Nor do they reflect the error from imputed values due to missing responses. Thus, the standard errors calculated represent a lower bound of the total error. As a result, confidence intervals formed using these estimated standard errors may not meet the stated levels of confidence (i.e., 68, 90, or 95 percent). Thus, some care must be exercised in the interpretation of the data in this data product based on the estimated standard errors.
2. Zero or small estimates; very large estimates — The value of almost all PUMS
characteristics is greater than or equal to zero by definition. For zero or small estimates, use of the method given previously for calculating confidence intervals relies on large sample theory, and may result in negative values which for most characteristics are not admissible. In this case the lower limit of the confidence interval is set to zero by default. A similar caution holds for estimates of totals close to a control total or estimated proportions near one, where the upper limit of the confidence interval is set to its largest admissible value. In these situations the level of confidence of the adjusted range of values is less than the prescribed confidence level.
13
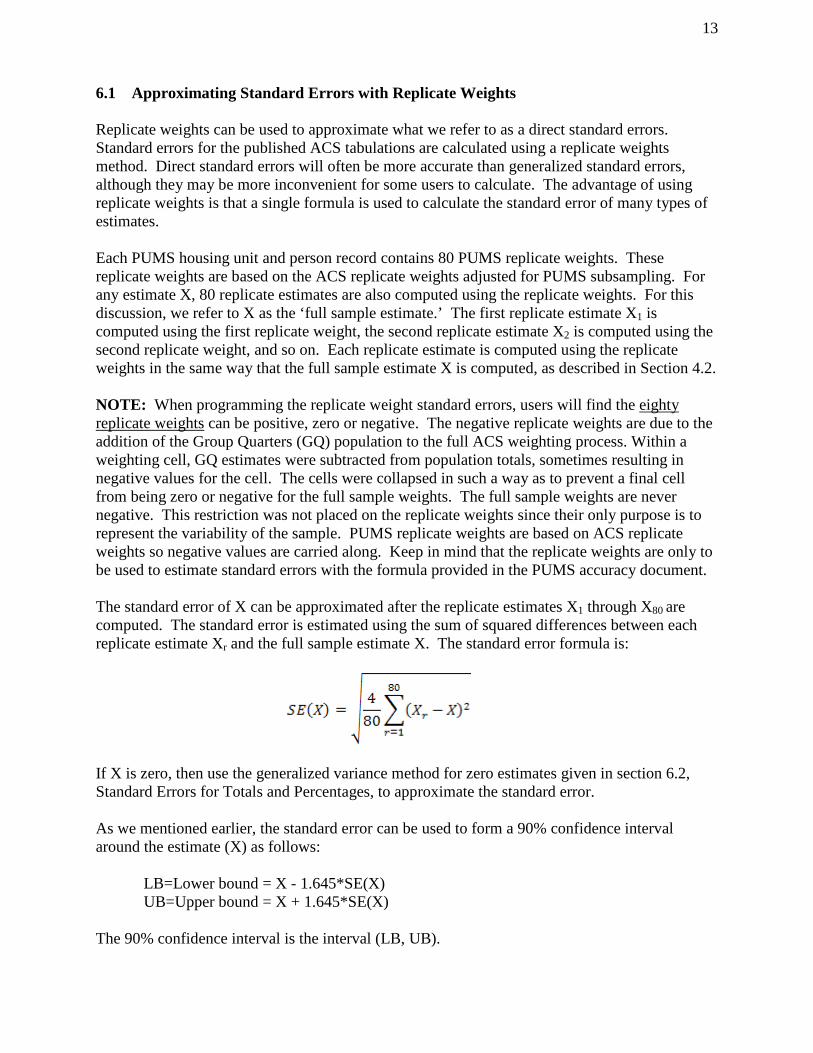
6.1 Approximating Standard Errors with Replicate Weights Replicate weights can be used to approximate what we refer to as a direct standard errors. Standard errors for the published ACS tabulations are calculated using a replicate weights method. Direct standard errors will often be more accurate than generalized standard errors, although they may be more inconvenient for some users to calculate. The advantage of using replicate weights is that a single formula is used to calculate the standard error of many types of estimates. Each PUMS housing unit and person record contains 80 PUMS replicate weights. These replicate weights are based on the ACS replicate weights adjusted for PUMS subsampling. For any estimate X, 80 replicate estimates are also computed using the replicate weights. For this discussion, we refer to X as the ‘full sample estimate.’ The first replicate estimate X1 is computed using the first replicate weight, the second replicate estimate X2 is computed using the second replicate weight, and so on. Each replicate estimate is computed using the replicate weights in the same way that the full sample estimate X is computed, as described in Section 4.2. NOTE: When programming the replicate weight standard errors, users will find the eighty replicate weights can be positive, zero or negative. The negative replicate weights are due to the addition of the Group Quarters (GQ) population to the full ACS weighting process. Within a weighting cell, GQ estimates were subtracted from population totals, sometimes resulting in negative values for the cell. The cells were collapsed in such a way as to prevent a final cell from being zero or negative for the full sample weights. The full sample weights are never negative. This restriction was not placed on the replicate weights since their only purpose is to represent the variability of the sample. PUMS replicate weights are based on ACS replicate weights so negative values are carried along. Keep in mind that the replicate weights are only to be used to estimate standard errors with the formula provided in the PUMS accuracy document. The standard error of X can be approximated after the replicate estimates X1 through X80 are computed. The standard error is estimated using the sum of squared differences between each replicate estimate Xr and the full sample estimate X. The standard error formula is:
If X is zero, then use the generalized variance method for zero estimates given in section 6.2, Standard Errors for Totals and Percentages, to approximate the standard error. As we mentioned earlier, the standard error can be used to form a 90% confidence interval around the estimate (X) as follows:
LB=Lower bound = X - 1.645*SE(X) UB=Upper bound = X + 1.645*SE(X)
The 90% confidence interval is the interval (LB, UB).

14
As mentioned we consider the replicate weight SEs to be more accurate than the design factor SEs. For exceptions, please note the following: After using replicate weight SEs, some users may notice that occasionally the SE is zero for an estimate. The user may want to know if this is accurate. Except for controlled estimates, all PUMS estimates are based on a sample of the population and should not have a SE of zero. However, if your estimate is a median, the replicate weight method can be used, but don’t accept the SE of zero. Often this occurs when the characteristic contains few records, such as a median based on less than five records in a PUMA. The true SE for a median should never be zero because medians are not controlled. So if the replicate weight method gives a SE of zero for a median or other estimate that is not controlled, switch to using the design factor method for that estimate. However, if the estimate is a controlled count (or total) such as total male or total female persons living in households in a state, there is no sampling variability in the estimate. It is expected that the replicate weight SE and MOE will often be zero for a controlled estimate. Examples of PUMS estimates with replicate weight standard errors are found by clicking on PUMS estimates for User Verification at: http://www.census.gov/acs/www/Products/PUMS/pumscontrols.html Users can check national and state level estimates with associated replicate weight standard errors by comparing to values shown in these files. 6.2 Approximating Generalized Standard Errors with Design Factors a. Standard Errors for Totals and Percentages The design factors provided in Tables 3 through 3.52 in the appendix can be used to approximate the standard errors of most sample estimates of totals and proportions. Design factors are given by subject for the United States, all 50 states, the District of Columbia, and Puerto Rico. The term "subject" refers to a characteristic, such as age for persons and tenure for HUs. The design factors reflect the effects of the actual sample design and estimation procedures used for the ACS. To approximate the standard error use the following formulas: Total Formula:
Where:
DF = Design Factor N = Size of Geographic Area Y = Estimate of Characteristic Total
15
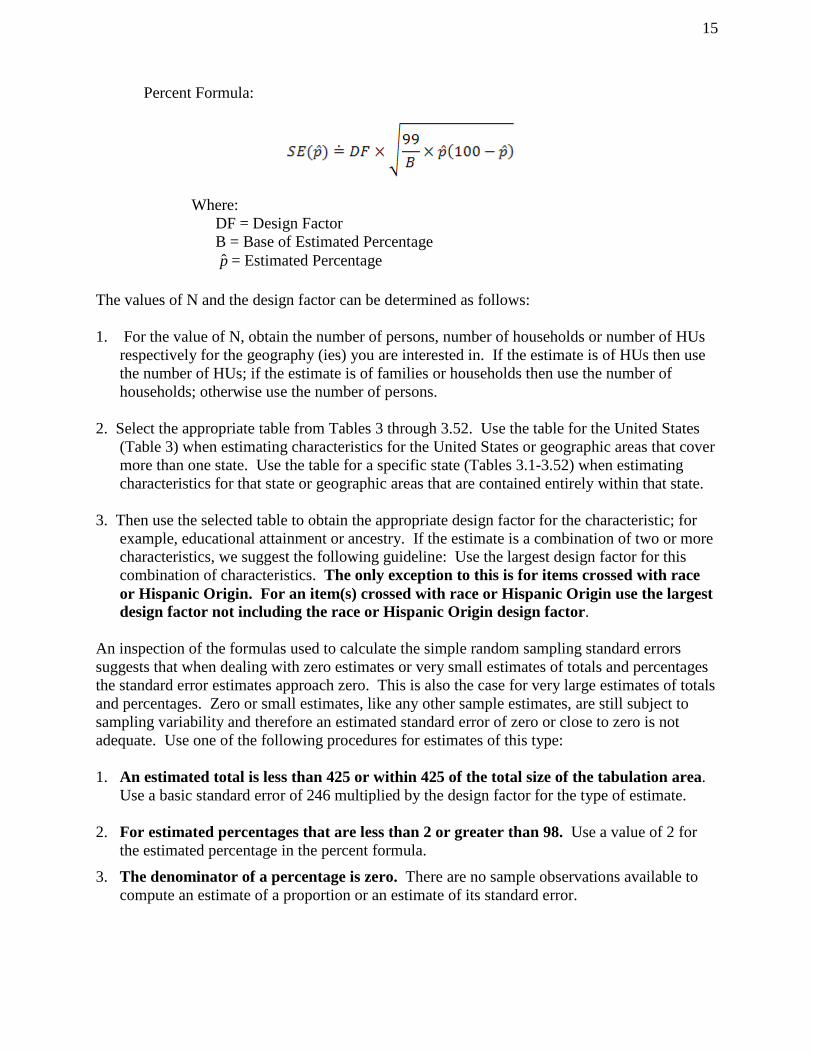
Percent Formula:
Where: DF = Design Factor
B = Base of Estimated Percentage p = Estimated Percentage
The values of N and the design factor can be determined as follows: 1. For the value of N, obtain the number of persons, number of households or number of HUs
respectively for the geography (ies) you are interested in. If the estimate is of HUs then use the number of HUs; if the estimate is of families or households then use the number of households; otherwise use the number of persons.
2. Select the appropriate table from Tables 3 through 3.52. Use the table for the United States
(Table 3) when estimating characteristics for the United States or geographic areas that cover more than one state. Use the table for a specific state (Tables 3.1-3.52) when estimating characteristics for that state or geographic areas that are contained entirely within that state.
3. Then use the selected table to obtain the appropriate design factor for the characteristic; for
example, educational attainment or ancestry. If the estimate is a combination of two or more characteristics, we suggest the following guideline: Use the largest design factor for this combination of characteristics. The only exception to this is for items crossed with race or Hispanic Origin. For an item(s) crossed with race or Hispanic Origin use the largest design factor not including the race or Hispanic Origin design factor.
An inspection of the formulas used to calculate the simple random sampling standard errors suggests that when dealing with zero estimates or very small estimates of totals and percentages the standard error estimates approach zero. This is also the case for very large estimates of totals and percentages. Zero or small estimates, like any other sample estimates, are still subject to sampling variability and therefore an estimated standard error of zero or close to zero is not adequate. Use one of the following procedures for estimates of this type:
1. An estimated total is less than 425 or within 425 of the total size of the tabulation area. Use a basic standard error of 246 multiplied by the design factor for the type of estimate.
2. For estimated percentages that are less than 2 or greater than 98. Use a value of 2 for
the estimated percentage in the percent formula.
3. The denominator of a percentage is zero. There are no sample observations available to compute an estimate of a proportion or an estimate of its standard error.
16
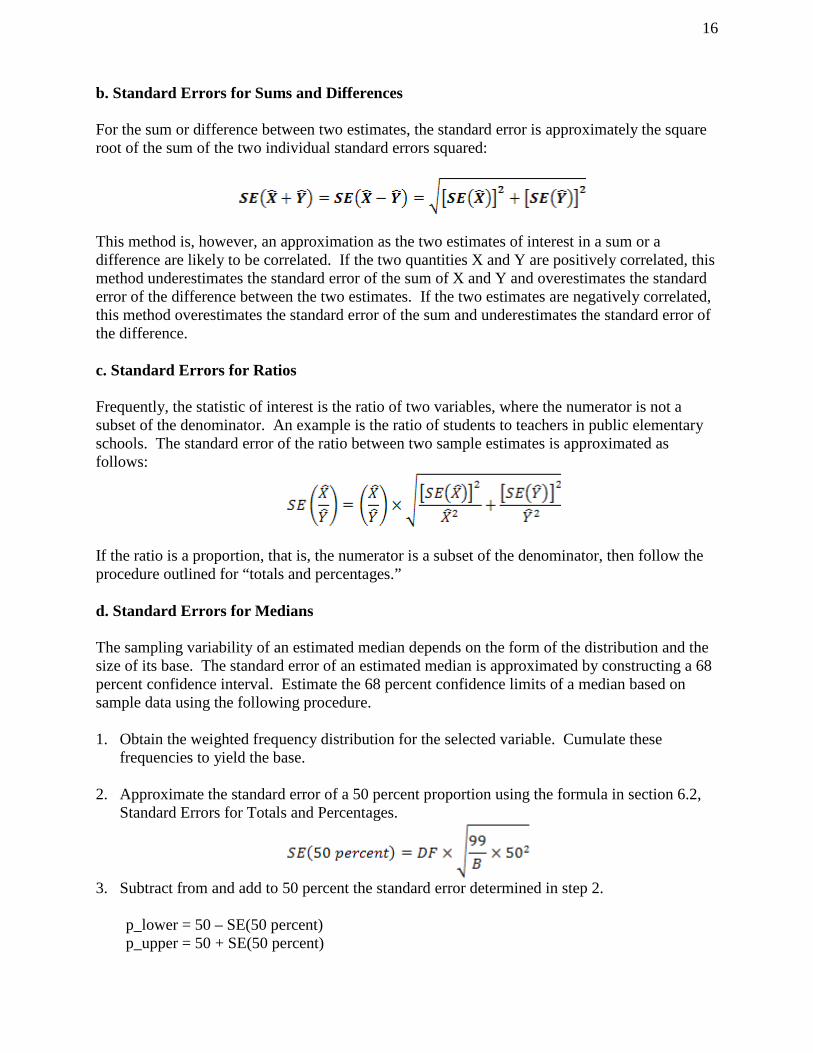
b. Standard Errors for Sums and Differences For the sum or difference between two estimates, the standard error is approximately the square root of the sum of the two individual standard errors squared:
This method is, however, an approximation as the two estimates of interest in a sum or a difference are likely to be correlated. If the two quantities X and Y are positively correlated, this method underestimates the standard error of the sum of X and Y and overestimates the standard error of the difference between the two estimates. If the two estimates are negatively correlated, this method overestimates the standard error of the sum and underestimates the standard error of the difference. c. Standard Errors for Ratios Frequently, the statistic of interest is the ratio of two variables, where the numerator is not a subset of the denominator. An example is the ratio of students to teachers in public elementary schools. The standard error of the ratio between two sample estimates is approximated as follows:
If the ratio is a proportion, that is, the numerator is a subset of the denominator, then follow the procedure outlined for “totals and percentages.” d. Standard Errors for Medians The sampling variability of an estimated median depends on the form of the distribution and the size of its base. The standard error of an estimated median is approximated by constructing a 68 percent confidence interval. Estimate the 68 percent confidence limits of a median based on sample data using the following procedure. 1. Obtain the weighted frequency distribution for the selected variable. Cumulate these
frequencies to yield the base. 2. Approximate the standard error of a 50 percent proportion using the formula in section 6.2,
Standard Errors for Totals and Percentages.
3. Subtract from and add to 50 percent the standard error determined in step 2. p_lower = 50 – SE(50 percent) p_upper = 50 + SE(50 percent)

17
4. Determine the categories in the distribution that contain p_lower and p_upper. If p_lower
and p_upper fall in the same category, follow step 5. If p_lower and p_upper fall in different categories, go to step 6.
5. If p_lower and p_upper fall in the same category, do the following:
• Define A1 as the smallest value in that category. • Define A2 as the smallest value in the next (higher) category. • Define C1 as the cumulative percent of units strictly less than A1. • Define C2 as the cumulative percent of units strictly less than A2.
Use the following formulas to approximate the lower and upper bounds for a confidence
interval about the median:
6. If p_lower and p_upper fall in different categories, do the following:
• For the category containing p_lower: Define A1, A2, C1, and C2 as described in step 5. Use these values and the formula in step 5 to obtain the lower bound.
• For the category containing p_upper: Define new values for A1, A2, C1, and C2 as described in step 5. Use these values and the formula in step 5 to obtain the upper bound.
7. Use the lower and upper bounds approximated in steps 5 or 6 to approximate the standard
error of the median.
e. Standard Errors for Means A mean is defined here as the average quantity of some characteristic (other than the number of people, HUs, households, or families) per person, housing unit, household, or family. For example, a mean could be the average annual income of females age 25 to 34. The standard error of a mean can be approximated by the formula below. Because of the approximation used in developing this formula, the estimated standard error of the mean obtained from this formula will generally underestimate the true standard error.

18
Where: B is the base (denominator) of the mean, and s2 is the sample variance of the characteristic based on weighted data. The value of s2 can be computed using the formula:
Where: wi is the weight of the ith sample record yi is the value of the characteristic for the ith sample record n is the number of sample records Note that is the weighted estimate of persons/HUs in the sample (ex. the number of females age 25 to 34, and is the weighted aggregate estimate for the characteristic of interest (ex. the aggregate income of females age 25 to 34). 6.3 Examples of Standard Error Calculations using Generalized Standard Error Formulas We will present some examples based on the 2012 PUMS data to demonstrate the use of the generalized standard error formulas. Example 1 – Using Design Factors to Estimate a Total The estimated number of people 15 years or over who were never married is 2,107,251 from the PUMS data for the state of Virginia. To calculate the standard error, we use the total formula given in section 6.2, Standard Errors for Totals and Percentages. In this formula, Y is our estimate of 2,107,251 and N is the total PUMS population for the state of Virginia, which is 8,185,867. The design factor (from Table 3.47) for “Marital Status” is 1.3.
To calculate the lower and upper bounds of the 90 percent confidence interval around 2,107,251 using the standard error, simply multiply 16,180.39 by 1.645, then add and subtract the product from 2,107,251. Thus the 90 percent confidence interval for this estimate is [2,107,251 - 1.645(16,180.39)] to [2,107,251 + 1.645(16,180.39)] or 2,080,634.25 to 2,133,867.75. Example 2 – Using Design Factors to Estimate a Proportion or Percentage The estimated percent of people 25 years or over with a bachelor’s degree or higher in Louisiana is 22.1952 from the PUMS data and the base of the estimated percentage is 3,008,114. To calculate the standard error, we use the percent formula given in section 6.2, Standard Errors for Totals and Percentages. The design factor (from Table 3.19) for “Educational Attainment” is 1.4.
19
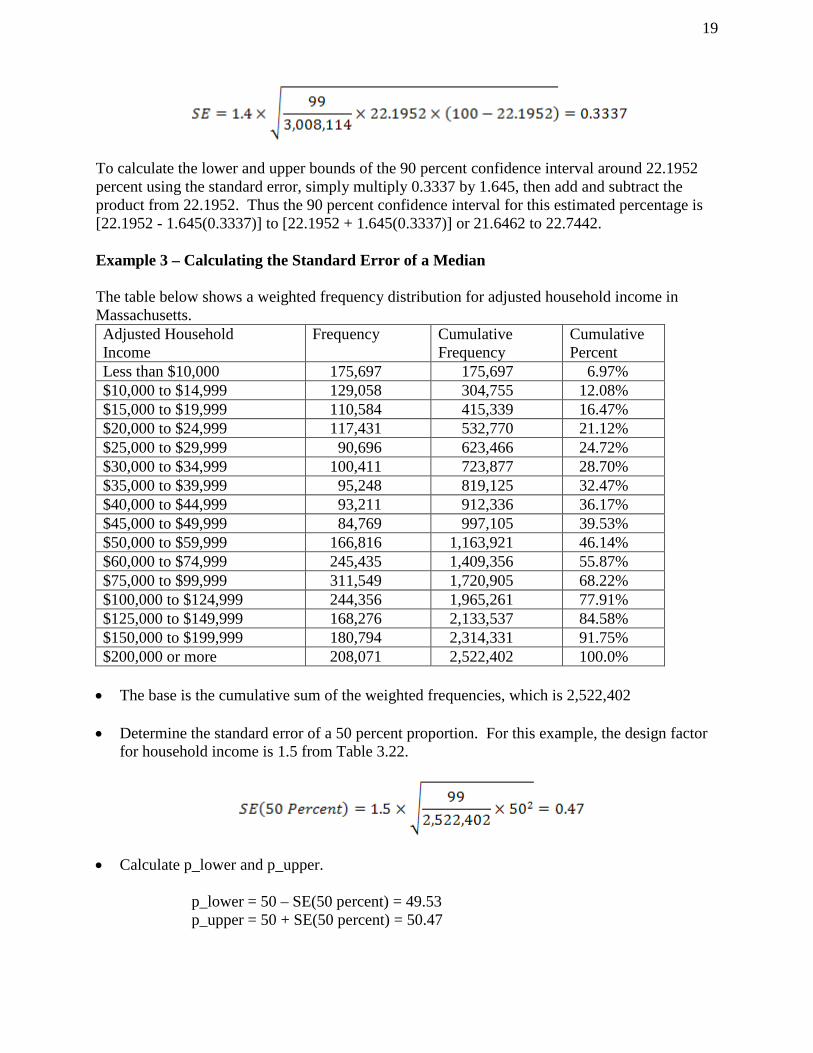
To calculate the lower and upper bounds of the 90 percent confidence interval around 22.1952 percent using the standard error, simply multiply 0.3337 by 1.645, then add and subtract the product from 22.1952. Thus the 90 percent confidence interval for this estimated percentage is [22.1952 - 1.645(0.3337)] to [22.1952 + 1.645(0.3337)] or 21.6462 to 22.7442. Example 3 – Calculating the Standard Error of a Median The table below shows a weighted frequency distribution for adjusted household income in Massachusetts. Adjusted Household Income
Frequency Cumulative Frequency
Cumulative Percent
Less than $10,000 175,697 175,697 6.97% $10,000 to $14,999 129,058 304,755 12.08% $15,000 to $19,999 110,584 415,339 16.47% $20,000 to $24,999 117,431 532,770 21.12% $25,000 to $29,999 90,696 623,466 24.72% $30,000 to $34,999 100,411 723,877 28.70% $35,000 to $39,999 95,248 819,125 32.47% $40,000 to $44,999 93,211 912,336 36.17% $45,000 to $49,999 84,769 997,105 39.53% $50,000 to $59,999 166,816 1,163,921 46.14% $60,000 to $74,999 245,435 1,409,356 55.87% $75,000 to $99,999 311,549 1,720,905 68.22% $100,000 to $124,999 244,356 1,965,261 77.91% $125,000 to $149,999 168,276 2,133,537 84.58% $150,000 to $199,999 180,794 2,314,331 91.75% $200,000 or more 208,071 2,522,402 100.0%
• The base is the cumulative sum of the weighted frequencies, which is 2,522,402 • Determine the standard error of a 50 percent proportion. For this example, the design factor
for household income is 1.5 from Table 3.22.
• Calculate p_lower and p_upper.
p_lower = 50 – SE(50 percent) = 49.53 p_upper = 50 + SE(50 percent) = 50.47

20
• Determine the categories that contain p_lower and p_upper. The first category with a cumulative percentage that is greater than 49.53 is $60,000 to $74,999. The first category with a cumulative percentage that is greater than 50.47 is $60,000 to $74,999. Since p_lower and p_upper fall in the same category, follow the instructions given in step 5 of the procedure for medians.
• Define A1, A2, C1, and C2: A1 = 60,000, A2 = 75,000, C1 = 46.14 and C2 = 55.87
Calculate the lower bound and upper bound using these values.
• Finally, calculate the standard error of the median:
Example 4 – Calculating the Standard Error of a Mean Suppose we wish to estimate mean adjusted person income of females age 25 to 34 in Alabama. The table below summarizes the computation of the terms in the formula for s2. The PUMS data for Alabama has 2,527 records for females age 25 to 34 that have a non-missing value for person income. Sample Record
yi wi wi yi wi yi2
1 15,153 241 3,651,898 55,337,598,465 2 3,334 30 100,010 333,403,290 3 59,602 16 953,635 56,838,780,712 4 2,829 83 234,772 664,071,592 . . 2,527 8,082 143 1,155,677 9,339,782,409 Total 313,444 6,287,884,813 303,902,460,125,078
The mean adjusted income is

21
s2 is computed as follows:
The design factor for person income in Alabama, from Table 3.1, is 1.5. The standard error of the mean can now be calculated:
7. WORKING WITH DOLLAR AMOUNTS Dollar variables must be adjusted before using them to form estimates. First, apply the adjustment factors supplied on the PUMS file. Second, when comparing the 2012 PUMS data to other PUMS years, the dollars must be converted into a common year. 7.1 Adjustment Factors on the PUMS File The PUMS data dictionary for 2012 includes two adjustment factors for dollar values: ADJINC – inflation adjustment factors for income variables, such as household income,
self-employment income, retirement income and wages. ADJHSG – inflation adjustment factor for most housing dollar variables, such as utility
costs, rent, food stamps, and condominium fees. See http://www.census.gov/acs/www/data_documentation/pums_documentation/ for details. For example, multiply the household income variable by ADJINC. The reason this adjustment is needed is because interviews in the ACS were conducted throughout the year for a reference period that included twelve previous months. Application of the adjustment factor will convert amounts to 2012 dollars. Note that the value of ADJINC is the same for all sample cases (its value for 2012 is 1.010207). This is for disclosure avoidance reasons, that is, so that the month of interview cannot be identified by the adjustment factor. For example, multiply ADJHSG times the monthly rent to adjust rent into 2012 dollars. On this file ADJHSG is a factor of 1.000000. 7.2 Dollars From Different Years When working with dollar amounts from different PUMS years, it is necessary to convert the amounts into dollars from a common year (after applying the adjustment factors described in the previous paragraph). We use the CPI-U-RS adjustment factors from the Bureau of Labor Statistics. These factors can be found in column AVG of the first table “All items” in the PDF
22
file at: http://www.bls.gov/cpi/cpiursai1978_2012.pdf. [For example, to express year 2000 dollars in terms of 2012 dollars, multiply the 2000 dollars by 337.2/252.9 = 1.3333]. 8. REFERENCES [1]. ACS Accuracy of the Data (2012) on http://www.census.gov/acs/www/data_documentation/documentation_main/ [2]. Design and Methodology of the American Community Survey: April 2009, revised
2010: http://www.census.gov/acs/www/methodology/methodology_main/
[3]. Updated CPI-U-RS, All Items, 1978-2012. http://www.bls.gov/cpi/cpiursai1978_2012.pdf

23
Table 3. Design Factors for Calculating PUMS Standard Errors – United States Characteristics Design Factor
POPULATION
Families and Nonfamilies 1.7
Population in Households by Race/Hispanic Origin of Householder 1.8
Population by Tenure 3.3
Age 1.0
Sex 1.0
Population of Two or More Races 2.4
White Alone 2.0
Black or African American Alone 1.1
American Indian or Alaska Native Alone, Asian Alone, Native Hawaiian or Other Pacific Islander Alone, or Some Other Race Alone 2.0
Hispanic or Latino 2.0
Marital Status 1.4
Marital History 1.3
Relationship 1.6
Ancestry 2.0
Grandparents Responsible for Grandchildren 1.8
Number of Women Who Had a Birth in the Past 12 Months 1.3
Language Spoken at Home and Ability to Speak English 1.4
Linguistic Isolation 2.5
Place of Birth, Year of Entry, and Citizenship Status 1.9
Residence 1 Year Ago 2.8
School Enrollment, Level of School, Type of School, and Field of Degree 1.3
Educational Attainment 1.4
Armed Forces Status and Veteran Status 1.1
Period of Military Service 1.4
Disability Status 1.2
Employment/Work Status 1.2
Industry, Occupation, and Class of Worker 1.5
Travel Time to Work 1.7
Means of Transportation to Work 1.5
Place of Work 1.4
Time Leaving Home to go to Work 1.6
Private Vehicle Occupancy 1.5
Work Experience, Hours Worked per Week, and Weeks Worked 1.3

24
Characteristics Design Factor
Number of Workers in Family 1.5
Presence of Own Children, Presence of People Under 18 Years, Presence of People 60 Years and Over, and Presence of People 65 Years and Over 1.6
Age of Own Children by Living Arrangements and Employment Status of Parents 1.8
Age of Householder 1.7
Race of Householder 1.5
Household, Family or Nonfamily Income 1.6
Person Earnings/Income 1.5
Type of Household Income 1.2
Poverty Status (Persons) 1.7
Poverty Status (Families/Households) 1.5
Ratio of Income to Poverty Level 2.9
Receipt of Food Stamps and Participation in Free/Reduced Price Meals 1.7
Health Insurance 1.3
HOUSING
Households/Occupied Housing Units 2.3
Family Type, Household Type, and Household Size 1.7
Households by Presence of Nonrelatives 2.9
Unmarried Partner Households 1.9
Tenure 1.8
Vacant 1.9
Rooms and Bedrooms 1.5
Occupants per Room 1.6
Units in Structure 1.5
Year Structure Built and Year Householder Moved Into Unit 1.5
House Heating Fuel 1.5
Telephone Service Available 1.6
Vehicles Available 1.5
Plumbing Facilities and Kitchen Facilities 2.3
Gross Rent, Gross Rent as a Percentage Of Household Income, and Contract Rent 1.6
Meals Included in Rent 1.6
Inclusion of Utilities in Rent 1.6
Value 1.4
Mortgage Status and Selected Monthly Owner Costs 1.4
Selected Physical and Financial Conditions 1.6

25
Table 3.1 Design Factors for Calculating PUMS Standard Errors – Alabama Characteristics Design Factor
POPULATION
Families and Nonfamilies 1.7
Population in Households by Race/Hispanic Origin of Householder 1.7
Population by Tenure 2.7
Age 1.0
Sex 1.0
Population of Two or More Races 1.9
White Alone 1.0
Black or African American Alone 1.0
American Indian or Alaska Native Alone, Asian Alone, Native Hawaiian or Other Pacific Islander Alone, or Some Other Race Alone 1.5
Hispanic or Latino 2.0
Marital Status 1.3
Marital History 1.2
Relationship 1.4
Ancestry 2.0
Grandparents Responsible for Grandchildren 1.7
Number of Women Who Had a Birth in the Past 12 Months 1.3
Language Spoken at Home and Ability to Speak English 1.4
Linguistic Isolation 3.0
Place of Birth, Year of Entry, and Citizenship Status 1.9
Residence 1 Year Ago 2.6
School Enrollment, Level of School, Type of School, and Field of Degree 1.3
Educational Attainment 1.4
Armed Forces Status and Veteran Status 1.3
Period of Military Service 1.4
Disability Status 1.2
Employment/Work Status 1.2
Industry, Occupation, and Class of Worker 1.5
Travel Time to Work 1.6
Means of Transportation to Work 1.5
Place of Work 1.4
Time Leaving Home to go to Work 1.6
Private Vehicle Occupancy 1.5
Work Experience, Hours Worked per Week, and Weeks Worked 1.3

26
Characteristics Design Factor
Number of Workers in Family 1.4
Presence of Own Children, Presence of People Under 18 Years, Presence of People 60 Years and Over, and Presence of People 65 Years and Over 1.5
Age of Own Children by Living Arrangements and Employment Status of Parents 1.6
Age of Householder 1.3
Race of Householder 1.4
Household, Family or Nonfamily Income 1.5
Person Earnings/Income 1.5
Type of Household Income 1.2
Poverty Status (Persons) 1.7
Poverty Status (Families/Households) 1.5
Ratio of Income to Poverty Level 2.6
Receipt of Food Stamps and Participation in Free/Reduced Price Meals 1.7
Health Insurance 1.3
HOUSING
Households/Occupied Housing Units 2.1
Family Type, Household Type, and Household Size 1.6
Households by Presence of Nonrelatives 2.2
Unmarried Partner Households 1.6
Tenure 1.5
Vacant 1.7
Rooms and Bedrooms 1.5
Occupants per Room 1.5
Units in Structure 1.5
Year Structure Built and Year Householder Moved Into Unit 1.4
House Heating Fuel 1.5
Telephone Service Available 1.5
Vehicles Available 1.5
Plumbing Facilities and Kitchen Facilities 2.0
Gross Rent, Gross Rent as a Percentage Of Household Income, and Contract Rent 1.6
Meals Included in Rent 1.5
Inclusion of Utilities in Rent 1.5
Value 1.4
Mortgage Status and Selected Monthly Owner Costs 1.4
Selected Physical and Financial Conditions 1.5

27
Table 3.2 Design Factors for Calculating PUMS Standard Errors – Alaska Characteristics Design Factor
POPULATION
Families and Nonfamilies 1.6
Population in Households by Race/Hispanic Origin of Householder 1.8
Population by Tenure 2.4
Age 1.0
Sex 1.0
Population of Two or More Races 1.8
White Alone 1.1
Black or African American Alone 1.1
American Indian or Alaska Native Alone, Asian Alone, Native Hawaiian or Other Pacific Islander Alone, or Some Other Race Alone 1.5
Hispanic or Latino 2.0
Marital Status 1.4
Marital History 1.3
Relationship 1.4
Ancestry 2.1
Grandparents Responsible for Grandchildren 1.5
Number of Women Who Had a Birth in the Past 12 Months 1.2
Language Spoken at Home and Ability to Speak English 1.8
Linguistic Isolation 2.0
Place of Birth, Year of Entry, and Citizenship Status 1.6
Residence 1 Year Ago 2.5
School Enrollment, Level of School, Type of School, and Field of Degree 1.5
Educational Attainment 1.4
Armed Forces Status and Veteran Status 1.3
Period of Military Service 1.4
Disability Status 1.3
Employment/Work Status 1.3
Industry, Occupation, and Class of Worker 1.4
Travel Time to Work 1.7
Means of Transportation to Work 1.5
Place of Work 1.3
Time Leaving Home to go to Work 1.5
Private Vehicle Occupancy 1.6
Work Experience, Hours Worked per Week, and Weeks Worked 1.3

28
Characteristics Design Factor
Number of Workers in Family 1.4
Presence of Own Children, Presence of People Under 18 Years, Presence of People 60 Years and Over, and Presence of People 65 Years and Over 1.3
Age of Own Children by Living Arrangements and Employment Status of Parents 1.7
Age of Householder 1.2
Race of Householder 1.3
Household, Family or Nonfamily Income 1.5
Person Earnings/Income 1.4
Type of Household Income 1.4
Poverty Status (Persons) 1.7
Poverty Status (Families/Households) 1.4
Ratio of Income to Poverty Level 2.3
Receipt of Food Stamps and Participation in Free/Reduced Price Meals 1.2
Health Insurance 1.3
HOUSING
Households/Occupied Housing Units 1.5
Family Type, Household Type, and Household Size 1.5
Households by Presence of Nonrelatives 1.8
Unmarried Partner Households 1.6
Tenure 1.4
Vacant 1.3
Rooms and Bedrooms 1.3
Occupants per Room 1.3
Units in Structure 1.4
Year Structure Built and Year Householder Moved Into Unit 1.3
House Heating Fuel 1.2
Telephone Service Available 1.4
Vehicles Available 1.4
Plumbing Facilities and Kitchen Facilities 1.2
Gross Rent, Gross Rent as a Percentage Of Household Income, and Contract Rent 1.4
Meals Included in Rent 1.4
Inclusion of Utilities in Rent 1.6
Value 1.3
Mortgage Status and Selected Monthly Owner Costs 1.4
Selected Physical and Financial Conditions 1.3

29
Table 3.3 Design Factors for Calculating PUMS Standard Errors – Arizona Characteristics Design Factor
POPULATION
Families and Nonfamilies 1.7
Population in Households by Race/Hispanic Origin of Householder 2.0
Population by Tenure 2.9
Age 1.1
Sex 1.4
Population of Two or More Races 2.1
White Alone 2.9
Black or African American Alone 1.7
American Indian or Alaska Native Alone, Asian Alone, Native Hawaiian or Other Pacific Islander Alone, or Some Other Race Alone 2.0
Hispanic or Latino 2.0
Marital Status 1.3
Marital History 1.5
Relationship 1.4
Ancestry 2.0
Grandparents Responsible for Grandchildren 1.8
Number of Women Who Had a Birth in the Past 12 Months 1.3
Language Spoken at Home and Ability to Speak English 1.8
Linguistic Isolation 1.7
Place of Birth, Year of Entry, and Citizenship Status 1.9
Residence 1 Year Ago 2.8
School Enrollment, Level of School, Type of School, and Field of Degree 1.3
Educational Attainment 1.4
Armed Forces Status and Veteran Status 1.2
Period of Military Service 1.4
Disability Status 1.3
Employment/Work Status 1.3
Industry, Occupation, and Class of Worker 1.5
Travel Time to Work 1.6
Means of Transportation to Work 1.5
Place of Work 1.4
Time Leaving Home to go to Work 1.6
Private Vehicle Occupancy 1.5
Work Experience, Hours Worked per Week, and Weeks Worked 1.3

30
Characteristics Design Factor
Number of Workers in Family 1.4
Presence of Own Children, Presence of People Under 18 Years, Presence of People 60 Years and Over, and Presence of People 65 Years and Over 1.5
Age of Own Children by Living Arrangements and Employment Status of Parents 1.7
Age of Householder 1.3
Race of Householder 1.5
Household, Family or Nonfamily Income 1.6
Person Earnings/Income 1.5
Type of Household Income 1.2
Poverty Status (Persons) 2.0
Poverty Status (Families/Households) 1.5
Ratio of Income to Poverty Level 2.7
Receipt of Food Stamps and Participation in Free/Reduced Price Meals 1.7
Health Insurance 1.8
HOUSING
Households/Occupied Housing Units 2.2
Family Type, Household Type, and Household Size 1.6
Households by Presence of Nonrelatives 2.2
Unmarried Partner Households 1.6
Tenure 1.5
Vacant 1.7
Rooms and Bedrooms 1.5
Occupants per Room 1.5
Units in Structure 1.5
Year Structure Built and Year Householder Moved Into Unit 1.4
House Heating Fuel 1.5
Telephone Service Available 1.5
Vehicles Available 1.5
Plumbing Facilities and Kitchen Facilities 2.2
Gross Rent, Gross Rent as a Percentage Of Household Income, and Contract Rent 1.6
Meals Included in Rent 1.5
Inclusion of Utilities in Rent 1.5
Value 1.4
Mortgage Status and Selected Monthly Owner Costs 1.4
Selected Physical and Financial Conditions 1.5

31
Table 3.4 Design Factors for Calculating PUMS Standard Errors – Arkansas Characteristics Design Factor
POPULATION
Families and Nonfamilies 1.6
Population in Households by Race/Hispanic Origin of Householder 1.6
Population by Tenure 2.5
Age 1.0
Sex 1.0
Population of Two or More Races 1.8
White Alone 1.1
Black or African American Alone 1.0
American Indian or Alaska Native Alone, Asian Alone, Native Hawaiian or Other Pacific Islander Alone, or Some Other Race Alone 1.8
Hispanic or Latino 1.8
Marital Status 1.3
Marital History 1.0
Relationship 1.4
Ancestry 2.0
Grandparents Responsible for Grandchildren 1.7
Number of Women Who Had a Birth in the Past 12 Months 1.2
Language Spoken at Home and Ability to Speak English 1.4
Linguistic Isolation 2.5
Place of Birth, Year of Entry, and Citizenship Status 1.8
Residence 1 Year Ago 2.5
School Enrollment, Level of School, Type of School, and Field of Degree 1.2
Educational Attainment 1.4
Armed Forces Status and Veteran Status 1.2
Period of Military Service 1.4
Disability Status 1.3
Employment/Work Status 1.1
Industry, Occupation, and Class of Worker 1.5
Travel Time to Work 1.6
Means of Transportation to Work 1.5
Place of Work 1.4
Time Leaving Home to go to Work 1.6
Private Vehicle Occupancy 1.4
Work Experience, Hours Worked per Week, and Weeks Worked 1.2

32
Characteristics Design Factor
Number of Workers in Family 1.4
Presence of Own Children, Presence of People Under 18 Years, Presence of People 60 Years and Over, and Presence of People 65 Years and Over 1.3
Age of Own Children by Living Arrangements and Employment Status of Parents 1.6
Age of Householder 1.3
Race of Householder 1.5
Household, Family or Nonfamily Income 1.5
Person Earnings/Income 1.5
Type of Household Income 1.3
Poverty Status (Persons) 1.7
Poverty Status (Families/Households) 1.5
Ratio of Income to Poverty Level 2.5
Receipt of Food Stamps and Participation in Free/Reduced Price Meals 1.5
Health Insurance 1.5
HOUSING
Households/Occupied Housing Units 1.9
Family Type, Household Type, and Household Size 1.5
Households by Presence of Nonrelatives 2.2
Unmarried Partner Households 1.6
Tenure 1.4
Vacant 1.7
Rooms and Bedrooms 1.5
Occupants per Room 1.5
Units in Structure 1.5
Year Structure Built and Year Householder Moved Into Unit 1.4
House Heating Fuel 1.5
Telephone Service Available 1.4
Vehicles Available 1.5
Plumbing Facilities and Kitchen Facilities 1.8
Gross Rent, Gross Rent as a Percentage Of Household Income, and Contract Rent 1.5
Meals Included in Rent 1.4
Inclusion of Utilities in Rent 1.4
Value 1.4
Mortgage Status and Selected Monthly Owner Costs 1.4
Selected Physical and Financial Conditions 1.5

33
Table 3.5 Design Factors for Calculating PUMS Standard Errors –California Characteristics Design Factor
POPULATION
Families and Nonfamilies 1.7
Population in Households by Race/Hispanic Origin of Householder 2.0
Population by Tenure 2.9
Age 1.1
Sex 1.0
Population of Two or More Races 2.1
White Alone 2.2
Black or African American Alone 1.6
American Indian or Alaska Native Alone, Asian Alone, Native Hawaiian or Other Pacific Islander Alone, or Some Other Race Alone 2.0
Hispanic or Latino 2.0
Marital Status 1.3
Marital History 1.4
Relationship 1.4
Ancestry 2.0
Grandparents Responsible for Grandchildren 1.8
Number of Women Who Had a Birth in the Past 12 Months 1.3
Language Spoken at Home and Ability to Speak English 2.0
Linguistic Isolation 1.4
Place of Birth, Year of Entry, and Citizenship Status 1.9
Residence 1 Year Ago 2.8
School Enrollment, Level of School, Type of School, and Field of Degree 1.3
Educational Attainment 1.4
Armed Forces Status and Veteran Status 1.2
Period of Military Service 1.4
Disability Status 1.2
Employment/Work Status 1.3
Industry, Occupation, and Class of Worker 1.5
Travel Time to Work 1.6
Means of Transportation to Work 1.5
Place of Work 1.4
Time Leaving Home to go to Work 1.6
Private Vehicle Occupancy 1.5
Work Experience, Hours Worked per Week, and Weeks Worked 1.3

34
Characteristics Design Factor
Number of Workers in Family 1.4
Presence of Own Children, Presence of People Under 18 Years, Presence of People 60 Years and Over, and Presence of People 65 Years and Over 1.5
Age of Own Children by Living Arrangements and Employment Status of Parents 1.7
Age of Householder 1.3
Race of Householder 1.5
Household, Family or Nonfamily Income 1.5
Person Earnings/Income 1.5
Type of Household Income 1.2
Poverty Status (Persons) 2.0
Poverty Status (Families/Households) 1.5
Ratio of Income to Poverty Level 2.7
Receipt of Food Stamps and Participation in Free/Reduced Price Meals 1.7
Health Insurance 1.9
HOUSING
Households/Occupied Housing Units 2.2
Family Type, Household Type, and Household Size 1.6
Households by Presence of Nonrelatives 2.2
Unmarried Partner Households 1.6
Tenure 1.5
Vacant 1.7
Rooms and Bedrooms 1.5
Occupants per Room 1.5
Units in Structure 1.5
Year Structure Built and Year Householder Moved Into Unit 1.4
House Heating Fuel 1.5
Telephone Service Available 1.5
Vehicles Available 1.5
Plumbing Facilities and Kitchen Facilities 2.2
Gross Rent, Gross Rent as a Percentage Of Household Income, and Contract Rent 1.6
Meals Included in Rent 1.5
Inclusion of Utilities in Rent 1.5
Value 1.4
Mortgage Status and Selected Monthly Owner Costs 1.4
Selected Physical and Financial Conditions 1.5

35
Table 3.6 Design Factors for Calculating PUMS Standard Errors –Colorado Characteristics Design Factor
POPULATION
Families and Nonfamilies 1.6
Population in Households by Race/Hispanic Origin of Householder 1.8
Population by Tenure 2.9
Age 1.0
Sex 1.0
Population of Two or More Races 2.0
White Alone 2.3
Black or African American Alone 1.2
American Indian or Alaska Native Alone, Asian Alone, Native Hawaiian or Other Pacific Islander Alone, or Some Other Race Alone 2.0
Hispanic or Latino 2.0
Marital Status 1.3
Marital History 1.3
Relationship 1.4
Ancestry 1.9
Grandparents Responsible for Grandchildren 1.8
Number of Women Who Had a Birth in the Past 12 Months 1.3
Language Spoken at Home and Ability to Speak English 1.6
Linguistic Isolation 1.8
Place of Birth, Year of Entry, and Citizenship Status 1.9
Residence 1 Year Ago 2.8
School Enrollment, Level of School, Type of School, and Field of Degree 1.3
Educational Attainment 1.4
Armed Forces Status and Veteran Status 1.2
Period of Military Service 1.4
Disability Status 1.3
Employment/Work Status 1.2
Industry, Occupation, and Class of Worker 1.5
Travel Time to Work 1.6
Means of Transportation to Work 1.5
Place of Work 1.4
Time Leaving Home to go to Work 1.6
Private Vehicle Occupancy 1.5
Work Experience, Hours Worked per Week, and Weeks Worked 1.3

36
Characteristics Design Factor
Number of Workers in Family 1.4
Presence of Own Children, Presence of People Under 18 Years, Presence of People 60 Years and Over, and Presence of People 65 Years and Over 1.5
Age of Own Children by Living Arrangements and Employment Status of Parents 1.7
Age of Householder 1.3
Race of Householder 1.5
Household, Family or Nonfamily Income 1.5
Person Earnings/Income 1.5
Type of Household Income 1.2
Poverty Status (Persons) 1.7
Poverty Status (Families/Households) 1.5
Ratio of Income to Poverty Level 2.6
Receipt of Food Stamps and Participation in Free/Reduced Price Meals 1.7
Health Insurance 1.8
HOUSING
Households/Occupied Housing Units 2.2
Family Type, Household Type, and Household Size 1.6
Households by Presence of Nonrelatives 2.2
Unmarried Partner Households 1.6
Tenure 1.5
Vacant 1.7
Rooms and Bedrooms 1.5
Occupants per Room 1.5
Units in Structure 1.5
Year Structure Built and Year Householder Moved Into Unit 1.4
House Heating Fuel 1.5
Telephone Service Available 1.5
Vehicles Available 1.5
Plumbing Facilities and Kitchen Facilities 2.2
Gross Rent, Gross Rent as a Percentage Of Household Income, and Contract Rent 1.6
Meals Included in Rent 1.5
Inclusion of Utilities in Rent 1.5
Value 1.3
Mortgage Status and Selected Monthly Owner Costs 1.4
Selected Physical and Financial Conditions 1.5

37
Table 3.7 Design Factors for Calculating PUMS Standard Errors –Connecticut Characteristics Design Factor
POPULATION
Families and Nonfamilies 1.6
Population in Households by Race/Hispanic Origin of Householder 1.8
Population by Tenure 2.5
Age 1.0
Sex 1.0
Population of Two or More Races 2.0
White Alone 2.0
Black or African American Alone 1.5
American Indian or Alaska Native Alone, Asian Alone, Native Hawaiian or Other Pacific Islander Alone, or Some Other Race Alone 2.0
Hispanic or Latino 2.0
Marital Status 1.3
Marital History 1.2
Relationship 1.4
Ancestry 2.0
Grandparents Responsible for Grandchildren 1.8
Number of Women Who Had a Birth in the Past 12 Months 1.3
Language Spoken at Home and Ability to Speak English 1.5
Linguistic Isolation 1.6
Place of Birth, Year of Entry, and Citizenship Status 1.9
Residence 1 Year Ago 2.6
School Enrollment, Level of School, Type of School, and Field of Degree 1.3
Educational Attainment 1.4
Armed Forces Status and Veteran Status 1.2
Period of Military Service 1.3
Disability Status 1.2
Employment/Work Status 1.2
Industry, Occupation, and Class of Worker 1.5
Travel Time to Work 1.6
Means of Transportation to Work 1.5
Place of Work 1.4
Time Leaving Home to go to Work 1.6
Private Vehicle Occupancy 1.5
Work Experience, Hours Worked per Week, and Weeks Worked 1.3

38
Characteristics Design Factor
Number of Workers in Family 1.4
Presence of Own Children, Presence of People Under 18 Years, Presence of People 60 Years and Over, and Presence of People 65 Years and Over 1.4
Age of Own Children by Living Arrangements and Employment Status of Parents 1.7
Age of Householder 1.3
Race of Householder 1.5
Household, Family or Nonfamily Income 1.5
Person Earnings/Income 1.5
Type of Household Income 1.2
Poverty Status (Persons) 1.7
Poverty Status (Families/Households) 1.5
Ratio of Income to Poverty Level 2.6
Receipt of Food Stamps and Participation in Free/Reduced Price Meals 1.7
Health Insurance 1.3
HOUSING
Households/Occupied Housing Units 2.2
Family Type, Household Type, and Household Size 1.5
Households by Presence of Nonrelatives 2.0
Unmarried Partner Households 1.6
Tenure 1.5
Vacant 1.7
Rooms and Bedrooms 1.5
Occupants per Room 1.5
Units in Structure 1.5
Year Structure Built and Year Householder Moved Into Unit 1.4
House Heating Fuel 1.5
Telephone Service Available 1.5
Vehicles Available 1.4
Plumbing Facilities and Kitchen Facilities 2.2
Gross Rent, Gross Rent as a Percentage Of Household Income, and Contract Rent 1.6
Meals Included in Rent 1.5
Inclusion of Utilities in Rent 1.5
Value 1.4
Mortgage Status and Selected Monthly Owner Costs 1.4
Selected Physical and Financial Conditions 1.5

39
Table 3.8 Design Factors for Calculating PUMS Standard Errors –Delaware Characteristics Design Factor
POPULATION
Families and Nonfamilies 1.6
Population in Households by Race/Hispanic Origin of Householder 1.8
Population by Tenure 2.6
Age 1.0
Sex 1.0
Population of Two or More Races 1.6
White Alone 1.6
Black or African American Alone 1.1
American Indian or Alaska Native Alone, Asian Alone, Native Hawaiian or Other Pacific Islander Alone, or Some Other Race Alone 1.8
Hispanic or Latino 2.0
Marital Status 1.3
Marital History 1.3
Relationship 1.4
Ancestry 2.0
Grandparents Responsible for Grandchildren 1.8
Number of Women Who Had a Birth in the Past 12 Months 1.3
Language Spoken at Home and Ability to Speak English 1.5
Linguistic Isolation 2.0
Place of Birth, Year of Entry, and Citizenship Status 1.9
Residence 1 Year Ago 2.8
School Enrollment, Level of School, Type of School, and Field of Degree 1.3
Educational Attainment 1.4
Armed Forces Status and Veteran Status 1.2
Period of Military Service 1.3
Disability Status 1.2
Employment/Work Status 1.2
Industry, Occupation, and Class of Worker 1.5
Travel Time to Work 1.6
Means of Transportation to Work 1.5
Place of Work 1.4
Time Leaving Home to go to Work 1.6
Private Vehicle Occupancy 1.5
Work Experience, Hours Worked per Week, and Weeks Worked 1.3

40
Characteristics Design Factor
Number of Workers in Family 1.4
Presence of Own Children, Presence of People Under 18 Years, Presence of People 60 Years and Over, and Presence of People 65 Years and Over 1.3
Age of Own Children by Living Arrangements and Employment Status of Parents 1.7
Age of Householder 1.3
Race of Householder 1.3
Household, Family or Nonfamily Income 1.5
Person Earnings/Income 1.5
Type of Household Income 1.2
Poverty Status (Persons) 1.7
Poverty Status (Families/Households) 1.5
Ratio of Income to Poverty Level 2.6
Receipt of Food Stamps and Participation in Free/Reduced Price Meals 1.4
Health Insurance 1.8
HOUSING
Households/Occupied Housing Units 1.6
Family Type, Household Type, and Household Size 1.5
Households by Presence of Nonrelatives 1.9
Unmarried Partner Households 1.6
Tenure 1.4
Vacant 1.3
Rooms and Bedrooms 1.4
Occupants per Room 1.4
Units in Structure 1.4
Year Structure Built and Year Householder Moved Into Unit 1.4
House Heating Fuel 1.4
Telephone Service Available 1.4
Vehicles Available 1.4
Plumbing Facilities and Kitchen Facilities 1.5
Gross Rent, Gross Rent as a Percentage Of Household Income, and Contract Rent 1.6
Meals Included in Rent 1.5
Inclusion of Utilities in Rent 1.5
Value 1.3
Mortgage Status and Selected Monthly Owner Costs 1.3
Selected Physical and Financial Conditions 1.4

41
Table 3.9 Design Factors for Calculating PUMS Standard Errors –District of Colombia Characteristics Design Factor
POPULATION
Families and Nonfamilies 1.6
Population in Households by Race/Hispanic Origin of Householder 1.6
Population by Tenure 2.6
Age 1.0
Sex 1.3
Population of Two or More Races 1.8
White Alone 1.6
Black or African American Alone 2.3
American Indian or Alaska Native Alone, Asian Alone, Native Hawaiian or Other Pacific Islander Alone, or Some Other Race Alone 2.0
Hispanic or Latino 2.0
Marital Status 1.3
Marital History 1.3
Relationship 1.4
Ancestry 1.7
Grandparents Responsible for Grandchildren 1.6
Number of Women Who Had a Birth in the Past 12 Months 1.3
Language Spoken at Home and Ability to Speak English 1.5
Linguistic Isolation 1.8
Place of Birth, Year of Entry, and Citizenship Status 1.9
Residence 1 Year Ago 2.7
School Enrollment, Level of School, Type of School, and Field of Degree 1.3
Educational Attainment 1.4
Armed Forces Status and Veteran Status 1.2
Period of Military Service 1.4
Disability Status 1.2
Employment/Work Status 1.3
Industry, Occupation, and Class of Worker 1.5
Travel Time to Work 1.6
Means of Transportation to Work 1.5
Place of Work 1.4
Time Leaving Home to go to Work 1.6
Private Vehicle Occupancy 1.5
Work Experience, Hours Worked per Week, and Weeks Worked 1.3

42
Characteristics Design Factor
Number of Workers in Family 1.4
Presence of Own Children, Presence of People Under 18 Years, Presence of People 60 Years and Over, and Presence of People 65 Years and Over 1.4
Age of Own Children by Living Arrangements and Employment Status of Parents 1.7
Age of Householder 1.3
Race of Householder 1.3
Household, Family or Nonfamily Income 1.5
Person Earnings/Income 1.5
Type of Household Income 1.3
Poverty Status (Persons) 2.7
Poverty Status (Families/Households) 1.4
Ratio of Income to Poverty Level 2.6
Receipt of Food Stamps and Participation in Free/Reduced Price Meals 1.5
Health Insurance 1.3
HOUSING
Households/Occupied Housing Units 2.2
Family Type, Household Type, and Household Size 1.6
Households by Presence of Nonrelatives 2.0
Unmarried Partner Households 1.4
Tenure 1.5
Vacant 1.7
Rooms and Bedrooms 1.4
Occupants per Room 1.5
Units in Structure 1.4
Year Structure Built and Year Householder Moved Into Unit 1.4
House Heating Fuel 1.5
Telephone Service Available 1.5
Vehicles Available 1.5
Plumbing Facilities and Kitchen Facilities 2.2
Gross Rent, Gross Rent as a Percentage Of Household Income, and Contract Rent 1.5
Meals Included in Rent 1.5
Inclusion of Utilities in Rent 1.5
Value 1.3
Mortgage Status and Selected Monthly Owner Costs 1.3
Selected Physical and Financial Conditions 1.5

43
Table 3.10 Design Factors for Calculating PUMS Standard Errors –Florida Characteristics Design Factor
POPULATION
Families and Nonfamilies 1.7
Population in Households by Race/Hispanic Origin of Householder 1.8
Population by Tenure 2.9
Age 1.1
Sex 1.4
Population of Two or More Races 2.1
White Alone 2.8
Black or African American Alone 1.8
American Indian or Alaska Native Alone, Asian Alone, Native Hawaiian or Other Pacific Islander Alone, or Some Other Race Alone 2.0
Hispanic or Latino 2.0
Marital Status 1.3
Marital History 1.5
Relationship 1.4
Ancestry 2.0
Grandparents Responsible for Grandchildren 1.8
Number of Women Who Had a Birth in the Past 12 Months 1.3
Language Spoken at Home and Ability to Speak English 1.8
Linguistic Isolation 1.6
Place of Birth, Year of Entry, and Citizenship Status 1.9
Residence 1 Year Ago 2.8
School Enrollment, Level of School, Type of School, and Field of Degree 1.3
Educational Attainment 1.4
Armed Forces Status and Veteran Status 1.2
Period of Military Service 1.4
Disability Status 1.3
Employment/Work Status 1.3
Industry, Occupation, and Class of Worker 1.5
Travel Time to Work 1.6
Means of Transportation to Work 1.5
Place of Work 1.4
Time Leaving Home to go to Work 1.6
Private Vehicle Occupancy 1.5
Work Experience, Hours Worked per Week, and Weeks Worked 1.3

44
Characteristics Design Factor
Number of Workers in Family 1.4
Presence of Own Children, Presence of People Under 18 Years, Presence of People 60 Years and Over, and Presence of People 65 Years and Over 1.5
Age of Own Children by Living Arrangements and Employment Status of Parents 1.7
Age of Householder 1.3
Race of Householder 1.5
Household, Family or Nonfamily Income 1.6
Person Earnings/Income 1.6
Type of Household Income 1.2
Poverty Status (Persons) 1.9
Poverty Status (Families/Households) 1.5
Ratio of Income to Poverty Level 2.7
Receipt of Food Stamps and Participation in Free/Reduced Price Meals 1.7
Health Insurance 1.8
HOUSING
Households/Occupied Housing Units 2.2
Family Type, Household Type, and Household Size 1.6
Households by Presence of Nonrelatives 2.2
Unmarried Partner Households 1.6
Tenure 1.5
Vacant 1.7
Rooms and Bedrooms 1.5
Occupants per Room 1.5
Units in Structure 1.5
Year Structure Built and Year Householder Moved Into Unit 1.4
House Heating Fuel 1.5
Telephone Service Available 1.5
Vehicles Available 1.5
Plumbing Facilities and Kitchen Facilities 2.2
Gross Rent, Gross Rent as a Percentage Of Household Income, and Contract Rent 1.6
Meals Included in Rent 1.5
Inclusion of Utilities in Rent 1.5
Value 1.4
Mortgage Status and Selected Monthly Owner Costs 1.4
Selected Physical and Financial Conditions 1.5

45
Table 3.11 Design Factors for Calculating PUMS Standard Errors –Georgia Characteristics Design Factor
POPULATION
Families and Nonfamilies 1.7
Population in Households by Race/Hispanic Origin of Householder 1.8
Population by Tenure 2.9
Age 1.0
Sex 1.0
Population of Two or More Races 2.1
White Alone 2.0
Black or African American Alone 1.1
American Indian or Alaska Native Alone, Asian Alone, Native Hawaiian or Other Pacific Islander Alone, or Some Other Race Alone 2.0
Hispanic or Latino 2.0
Marital Status 1.3
Marital History 1.3
Relationship 1.4
Ancestry 2.0
Grandparents Responsible for Grandchildren 1.8
Number of Women Who Had a Birth in the Past 12 Months 1.3
Language Spoken at Home and Ability to Speak English 1.4
Linguistic Isolation 1.8
Place of Birth, Year of Entry, and Citizenship Status 1.9
Residence 1 Year Ago 2.8
School Enrollment, Level of School, Type of School, and Field of Degree 1.3
Educational Attainment 1.4
Armed Forces Status and Veteran Status 1.2
Period of Military Service 1.4
Disability Status 1.2
Employment/Work Status 1.2
Industry, Occupation, and Class of Worker 1.5
Travel Time to Work 1.6
Means of Transportation to Work 1.5
Place of Work 1.4
Time Leaving Home to go to Work 1.6
Private Vehicle Occupancy 1.5
Work Experience, Hours Worked per Week, and Weeks Worked 1.3

46
Characteristics Design Factor
Number of Workers in Family 1.4
Presence of Own Children, Presence of People Under 18 Years, Presence of People 60 Years and Over, and Presence of People 65 Years and Over 1.5
Age of Own Children by Living Arrangements and Employment Status of Parents 1.7
Age of Householder 1.3
Race of Householder 1.5
Household, Family or Nonfamily Income 1.6
Person Earnings/Income 1.5
Type of Household Income 1.2
Poverty Status (Persons) 1.8
Poverty Status (Families/Households) 1.5
Ratio of Income to Poverty Level 2.7
Receipt of Food Stamps and Participation in Free/Reduced Price Meals 1.7
Health Insurance 1.4
HOUSING
Households/Occupied Housing Units 2.2
Family Type, Household Type, and Household Size 1.6
Households by Presence of Nonrelatives 2.2
Unmarried Partner Households 1.6
Tenure 1.5
Vacant 1.7
Rooms and Bedrooms 1.5
Occupants per Room 1.5
Units in Structure 1.5
Year Structure Built and Year Householder Moved Into Unit 1.4
House Heating Fuel 1.5
Telephone Service Available 1.5
Vehicles Available 1.5
Plumbing Facilities and Kitchen Facilities 2.2
Gross Rent, Gross Rent as a Percentage Of Household Income, and Contract Rent 1.6
Meals Included in Rent 1.5
Inclusion of Utilities in Rent 1.5
Value 1.4
Mortgage Status and Selected Monthly Owner Costs 1.4
Selected Physical and Financial Conditions 1.5

47
Table 3.12 Design Factors for Calculating PUMS Standard Errors –Hawaii Characteristics Design Factor
POPULATION
Families and Nonfamilies 1.7
Population in Households by Race/Hispanic Origin of Householder 1.8
Population by Tenure 2.9
Age 1.0
Sex 1.1
Population of Two or More Races 2.1
White Alone 1.2
Black or African American Alone 1.7
American Indian or Alaska Native Alone, Asian Alone, Native Hawaiian or Other Pacific Islander Alone, or Some Other Race Alone 2.0
Hispanic or Latino 2.0
Marital Status 1.3
Marital History 1.3
Relationship 1.4
Ancestry 1.9
Grandparents Responsible for Grandchildren 1.7
Number of Women Who Had a Birth in the Past 12 Months 1.0
Language Spoken at Home and Ability to Speak English 1.8
Linguistic Isolation 1.5
Place of Birth, Year of Entry, and Citizenship Status 1.9
Residence 1 Year Ago 2.8
School Enrollment, Level of School, Type of School, and Field of Degree 1.3
Educational Attainment 1.4
Armed Forces Status and Veteran Status 1.3
Period of Military Service 1.4
Disability Status 1.2
Employment/Work Status 1.3
Industry, Occupation, and Class of Worker 1.5
Travel Time to Work 1.6
Means of Transportation to Work 1.5
Place of Work 1.4
Time Leaving Home to go to Work 1.6
Private Vehicle Occupancy 1.5
Work Experience, Hours Worked per Week, and Weeks Worked 1.3

48
Characteristics Design Factor
Number of Workers in Family 1.4
Presence of Own Children, Presence of People Under 18 Years, Presence of People 60 Years and Over, and Presence of People 65 Years and Over 1.5
Age of Own Children by Living Arrangements and Employment Status of Parents 1.7
Age of Householder 1.3
Race of Householder 1.3
Household, Family or Nonfamily Income 1.5
Person Earnings/Income 1.5
Type of Household Income 1.2
Poverty Status (Persons) 1.7
Poverty Status (Families/Households) 1.5
Ratio of Income to Poverty Level 2.7
Receipt of Food Stamps and Participation in Free/Reduced Price Meals 1.6
Health Insurance 1.6
HOUSING
Households/Occupied Housing Units 2.0
Family Type, Household Type, and Household Size 1.6
Households by Presence of Nonrelatives 1.9
Unmarried Partner Households 1.3
Tenure 1.3
Vacant 1.6
Rooms and Bedrooms 1.4
Occupants per Room 1.4
Units in Structure 1.5
Year Structure Built and Year Householder Moved Into Unit 1.4
House Heating Fuel 1.5
Telephone Service Available 1.3
Vehicles Available 1.4
Plumbing Facilities and Kitchen Facilities 1.9
Gross Rent, Gross Rent as a Percentage Of Household Income, and Contract Rent 1.5
Meals Included in Rent 1.5
Inclusion of Utilities in Rent 1.4
Value 1.3
Mortgage Status and Selected Monthly Owner Costs 1.3
Selected Physical and Financial Conditions 1.5

49
Table 3.13 Design Factors for Calculating PUMS Standard Errors –Idaho Characteristics Design Factor
POPULATION
Families and Nonfamilies 1.6
Population in Households by Race/Hispanic Origin of Householder 1.8
Population by Tenure 2.5
Age 1.0
Sex 1.0
Population of Two or More Races 1.8
White Alone 1.9
Black or African American Alone 1.2
American Indian or Alaska Native Alone, Asian Alone, Native Hawaiian or Other Pacific Islander Alone, or Some Other Race Alone 1.9
Hispanic or Latino 1.5
Marital Status 1.3
Marital History 1.2
Relationship 1.4
Ancestry 1.9
Grandparents Responsible for Grandchildren 1.8
Number of Women Who Had a Birth in the Past 12 Months 1.1
Language Spoken at Home and Ability to Speak English 1.4
Linguistic Isolation 2.4
Place of Birth, Year of Entry, and Citizenship Status 1.9
Residence 1 Year Ago 2.6
School Enrollment, Level of School, Type of School, and Field of Degree 1.2
Educational Attainment 1.4
Armed Forces Status and Veteran Status 1.2
Period of Military Service 1.4
Disability Status 1.2
Employment/Work Status 1.2
Industry, Occupation, and Class of Worker 1.5
Travel Time to Work 1.6
Means of Transportation to Work 1.4
Place of Work 1.3
Time Leaving Home to go to Work 1.6
Private Vehicle Occupancy 1.5
Work Experience, Hours Worked per Week, and Weeks Worked 1.3

50
Characteristics Design Factor
Number of Workers in Family 1.4
Presence of Own Children, Presence of People Under 18 Years, Presence of People 60 Years and Over, and Presence of People 65 Years and Over 1.4
Age of Own Children by Living Arrangements and Employment Status of Parents 1.7
Age of Householder 1.3
Race of Householder 1.5
Household, Family or Nonfamily Income 1.6
Person Earnings/Income 1.5
Type of Household Income 1.4
Poverty Status (Persons) 1.7
Poverty Status (Families/Households) 1.5
Ratio of Income to Poverty Level 2.5
Receipt of Food Stamps and Participation in Free/Reduced Price Meals 1.7
Health Insurance 1.4
HOUSING
Households/Occupied Housing Units 1.9
Family Type, Household Type, and Household Size 1.6
Households by Presence of Nonrelatives 2.0
Unmarried Partner Households 1.5
Tenure 1.5
Vacant 1.6
Rooms and Bedrooms 1.4
Occupants per Room 1.5
Units in Structure 1.5
Year Structure Built and Year Householder Moved Into Unit 1.4
House Heating Fuel 1.4
Telephone Service Available 1.5
Vehicles Available 1.5
Plumbing Facilities and Kitchen Facilities 1.7
Gross Rent, Gross Rent as a Percentage Of Household Income, and Contract Rent 1.6
Meals Included in Rent 1.5
Inclusion of Utilities in Rent 1.5
Value 1.4
Mortgage Status and Selected Monthly Owner Costs 1.4
Selected Physical and Financial Conditions 1.5

51
Table 3.14 Design Factors for Calculating PUMS Standard Errors –Illinois Characteristics Design Factor
POPULATION
Families and Nonfamilies 1.5
Population in Households by Race/Hispanic Origin of Householder 1.8
Population by Tenure 2.8
Age 1.0
Sex 1.0
Population of Two or More Races 2.1
White Alone 2.0
Black or African American Alone 1.6
American Indian or Alaska Native Alone, Asian Alone, Native Hawaiian or Other Pacific Islander Alone, or Some Other Race Alone 2.0
Hispanic or Latino 2.0
Marital Status 1.3
Marital History 1.2
Relationship 1.4
Ancestry 1.9
Grandparents Responsible for Grandchildren 1.7
Number of Women Who Had a Birth in the Past 12 Months 1.3
Language Spoken at Home and Ability to Speak English 1.5
Linguistic Isolation 1.8
Place of Birth, Year of Entry, and Citizenship Status 1.9
Residence 1 Year Ago 2.5
School Enrollment, Level of School, Type of School, and Field of Degree 1.3
Educational Attainment 1.4
Armed Forces Status and Veteran Status 1.3
Period of Military Service 1.3
Disability Status 1.3
Employment/Work Status 1.2
Industry, Occupation, and Class of Worker 1.5
Travel Time to Work 1.6
Means of Transportation to Work 1.5
Place of Work 1.4
Time Leaving Home to go to Work 1.6
Private Vehicle Occupancy 1.5
Work Experience, Hours Worked per Week, and Weeks Worked 1.3

52
Characteristics Design Factor
Number of Workers in Family 1.4
Presence of Own Children, Presence of People Under 18 Years, Presence of People 60 Years and Over, and Presence of People 65 Years and Over 1.4
Age of Own Children by Living Arrangements and Employment Status of Parents 1.7
Age of Householder 1.3
Race of Householder 1.5
Household, Family or Nonfamily Income 1.5
Person Earnings/Income 1.5
Type of Household Income 1.3
Poverty Status (Persons) 1.8
Poverty Status (Families/Households) 1.4
Ratio of Income to Poverty Level 2.7
Receipt of Food Stamps and Participation in Free/Reduced Price Meals 1.7
Health Insurance 1.8
HOUSING
Households/Occupied Housing Units 2.2
Family Type, Household Type, and Household Size 1.5
Households by Presence of Nonrelatives 2.2
Unmarried Partner Households 1.5
Tenure 1.5
Vacant 1.7
Rooms and Bedrooms 1.5
Occupants per Room 1.5
Units in Structure 1.5
Year Structure Built and Year Householder Moved Into Unit 1.4
House Heating Fuel 1.4
Telephone Service Available 1.5
Vehicles Available 1.4
Plumbing Facilities and Kitchen Facilities 2.2
Gross Rent, Gross Rent as a Percentage Of Household Income, and Contract Rent 1.5
Meals Included in Rent 1.5
Inclusion of Utilities in Rent 1.5
Value 1.3
Mortgage Status and Selected Monthly Owner Costs 1.3
Selected Physical and Financial Conditions 1.5

53
Table 3.15 Design Factors for Calculating PUMS Standard Errors –Indiana Characteristics Design Factor
POPULATION
Families and Nonfamilies 1.6
Population in Households by Race/Hispanic Origin of Householder 1.8
Population by Tenure 2.5
Age 1.0
Sex 1.0
Population of Two or More Races 1.9
White Alone 2.0
Black or African American Alone 1.1
American Indian or Alaska Native Alone, Asian Alone, Native Hawaiian or Other Pacific Islander Alone, or Some Other Race Alone 2.0
Hispanic or Latino 1.8
Marital Status 1.3
Marital History 1.0
Relationship 1.4
Ancestry 2.0
Grandparents Responsible for Grandchildren 1.7
Number of Women Who Had a Birth in the Past 12 Months 1.1
Language Spoken at Home and Ability to Speak English 1.4
Linguistic Isolation 2.4
Place of Birth, Year of Entry, and Citizenship Status 1.8
Residence 1 Year Ago 2.4
School Enrollment, Level of School, Type of School, and Field of Degree 1.2
Educational Attainment 1.3
Armed Forces Status and Veteran Status 1.2
Period of Military Service 1.3
Disability Status 1.2
Employment/Work Status 1.1
Industry, Occupation, and Class of Worker 1.4
Travel Time to Work 1.6
Means of Transportation to Work 1.4
Place of Work 1.3
Time Leaving Home to go to Work 1.5
Private Vehicle Occupancy 1.4
Work Experience, Hours Worked per Week, and Weeks Worked 1.2

54
Characteristics Design Factor
Number of Workers in Family 1.4
Presence of Own Children, Presence of People Under 18 Years, Presence of People 60 Years and Over, and Presence of People 65 Years and Over 1.4
Age of Own Children by Living Arrangements and Employment Status of Parents 1.6
Age of Householder 1.2
Race of Householder 1.5
Household, Family or Nonfamily Income 1.5
Person Earnings/Income 1.5
Type of Household Income 1.2
Poverty Status (Persons) 1.7
Poverty Status (Families/Households) 1.5
Ratio of Income to Poverty Level 2.5
Receipt of Food Stamps and Participation in Free/Reduced Price Meals 1.7
Health Insurance 1.5
HOUSING
Households/Occupied Housing Units 2.0
Family Type, Household Type, and Household Size 1.5
Households by Presence of Nonrelatives 2.1
Unmarried Partner Households 1.5
Tenure 1.5
Vacant 1.7
Rooms and Bedrooms 1.5
Occupants per Room 1.4
Units in Structure 1.5
Year Structure Built and Year Householder Moved Into Unit 1.4
House Heating Fuel 1.4
Telephone Service Available 1.5
Vehicles Available 1.4
Plumbing Facilities and Kitchen Facilities 2.0
Gross Rent, Gross Rent as a Percentage Of Household Income, and Contract Rent 1.5
Meals Included in Rent 1.5
Inclusion of Utilities in Rent 1.5
Value 1.4
Mortgage Status and Selected Monthly Owner Costs 1.3
Selected Physical and Financial Conditions 1.5

55
Table 3.16 Design Factors for Calculating PUMS Standard Errors –Iowa Characteristics Design Factor
POPULATION
Families and Nonfamilies 1.3
Population in Households by Race/Hispanic Origin of Householder 1.7
Population by Tenure 2.2
Age 1.0
Sex 1.0
Population of Two or More Races 1.7
White Alone 1.4
Black or African American Alone 1.2
American Indian or Alaska Native Alone, Asian Alone, Native Hawaiian or Other Pacific Islander Alone, or Some Other Race Alone 1.5
Hispanic or Latino 1.6
Marital Status 1.1
Marital History 1.0
Relationship 1.2
Ancestry 1.7
Grandparents Responsible for Grandchildren 1.6
Number of Women Who Had a Birth in the Past 12 Months 1.1
Language Spoken at Home and Ability to Speak English 1.3
Linguistic Isolation 2.0
Place of Birth, Year of Entry, and Citizenship Status 1.6
Residence 1 Year Ago 2.1
School Enrollment, Level of School, Type of School, and Field of Degree 1.2
Educational Attainment 1.2
Armed Forces Status and Veteran Status 1.2
Period of Military Service 1.1
Disability Status 1.3
Employment/Work Status 1.1
Industry, Occupation, and Class of Worker 1.3
Travel Time to Work 1.4
Means of Transportation to Work 1.3
Place of Work 1.2
Time Leaving Home to go to Work 1.4
Private Vehicle Occupancy 1.4
Work Experience, Hours Worked per Week, and Weeks Worked 1.2

56
Characteristics Design Factor
Number of Workers in Family 1.2
Presence of Own Children, Presence of People Under 18 Years, Presence of People 60 Years and Over, and Presence of People 65 Years and Over 1.2
Age of Own Children by Living Arrangements and Employment Status of Parents 1.7
Age of Householder 1.1
Race of Householder 1.5
Household, Family or Nonfamily Income 1.5
Person Earnings/Income 1.3
Type of Household Income 1.4
Poverty Status (Persons) 1.7
Poverty Status (Families/Households) 1.3
Ratio of Income to Poverty Level 2.1
Receipt of Food Stamps and Participation in Free/Reduced Price Meals 1.6
Health Insurance 1.3
HOUSING
Households/Occupied Housing Units 1.9
Family Type, Household Type, and Household Size 1.3
Households by Presence of Nonrelatives 1.6
Unmarried Partner Households 1.4
Tenure 1.3
Vacant 1.6
Rooms and Bedrooms 1.3
Occupants per Room 1.3
Units in Structure 1.4
Year Structure Built and Year Householder Moved Into Unit 1.3
House Heating Fuel 1.2
Telephone Service Available 1.3
Vehicles Available 1.3
Plumbing Facilities and Kitchen Facilities 1.8
Gross Rent, Gross Rent as a Percentage Of Household Income, and Contract Rent 1.4
Meals Included in Rent 1.3
Inclusion of Utilities in Rent 1.4
Value 1.2
Mortgage Status and Selected Monthly Owner Costs 1.2
Selected Physical and Financial Conditions 1.3

57
Table 3.17 Design Factors for Calculating PUMS Standard Errors –Kansas Characteristics Design Factor
POPULATION
Families and Nonfamilies 1.4
Population in Households by Race/Hispanic Origin of Householder 1.8
Population by Tenure 2.4
Age 1.0
Sex 1.0
Population of Two or More Races 1.8
White Alone 2.0
Black or African American Alone 1.4
American Indian or Alaska Native Alone, Asian Alone, Native Hawaiian or Other Pacific Islander Alone, or Some Other Race Alone 2.0
Hispanic or Latino 2.0
Marital Status 1.2
Marital History 1.2
Relationship 1.4
Ancestry 1.8
Grandparents Responsible for Grandchildren 1.6
Number of Women Who Had a Birth in the Past 12 Months 1.2
Language Spoken at Home and Ability to Speak English 1.4
Linguistic Isolation 1.7
Place of Birth, Year of Entry, and Citizenship Status 1.6
Residence 1 Year Ago 2.6
School Enrollment, Level of School, Type of School, and Field of Degree 1.2
Educational Attainment 1.3
Armed Forces Status and Veteran Status 1.2
Period of Military Service 1.2
Disability Status 1.2
Employment/Work Status 1.2
Industry, Occupation, and Class of Worker 1.4
Travel Time to Work 1.5
Means of Transportation to Work 1.5
Place of Work 1.3
Time Leaving Home to go to Work 1.4
Private Vehicle Occupancy 1.4
Work Experience, Hours Worked per Week, and Weeks Worked 1.2

58
Characteristics Design Factor
Number of Workers in Family 1.3
Presence of Own Children, Presence of People Under 18 Years, Presence of People 60 Years and Over, and Presence of People 65 Years and Over 1.3
Age of Own Children by Living Arrangements and Employment Status of Parents 1.7
Age of Householder 1.2
Race of Householder 1.5
Household, Family or Nonfamily Income 1.5
Person Earnings/Income 1.4
Type of Household Income 1.2
Poverty Status (Persons) 1.7
Poverty Status (Families/Households) 1.4
Ratio of Income to Poverty Level 2.4
Receipt of Food Stamps and Participation in Free/Reduced Price Meals 1.5
Health Insurance 1.3
HOUSING
Households/Occupied Housing Units 1.9
Family Type, Household Type, and Household Size 1.4
Households by Presence of Nonrelatives 1.9
Unmarried Partner Households 1.5
Tenure 1.4
Vacant 1.6
Rooms and Bedrooms 1.4
Occupants per Room 1.3
Units in Structure 1.4
Year Structure Built and Year Householder Moved Into Unit 1.3
House Heating Fuel 1.4
Telephone Service Available 1.4
Vehicles Available 1.3
Plumbing Facilities and Kitchen Facilities 1.8
Gross Rent, Gross Rent as a Percentage Of Household Income, and Contract Rent 1.5
Meals Included in Rent 1.4
Inclusion of Utilities in Rent 1.4
Value 1.2
Mortgage Status and Selected Monthly Owner Costs 1.2
Selected Physical and Financial Conditions 1.4

59
Table 3.18 Design Factors for Calculating PUMS Standard Errors –Kentucky Characteristics Design Factor
POPULATION
Families and Nonfamilies 1.6
Population in Households by Race/Hispanic Origin of Householder 1.8
Population by Tenure 2.6
Age 1.0
Sex 1.0
Population of Two or More Races 1.9
White Alone 2.0
Black or African American Alone 1.1
American Indian or Alaska Native Alone, Asian Alone, Native Hawaiian or Other Pacific Islander Alone, or Some Other Race Alone 1.9
Hispanic or Latino 1.8
Marital Status 1.3
Marital History 1.2
Relationship 1.4
Ancestry 2.0
Grandparents Responsible for Grandchildren 1.6
Number of Women Who Had a Birth in the Past 12 Months 1.2
Language Spoken at Home and Ability to Speak English 1.4
Linguistic Isolation 3.0
Place of Birth, Year of Entry, and Citizenship Status 1.9
Residence 1 Year Ago 2.5
School Enrollment, Level of School, Type of School, and Field of Degree 1.2
Educational Attainment 1.3
Armed Forces Status and Veteran Status 1.2
Period of Military Service 1.3
Disability Status 1.2
Employment/Work Status 1.2
Industry, Occupation, and Class of Worker 1.4
Travel Time to Work 1.5
Means of Transportation to Work 1.5
Place of Work 1.4
Time Leaving Home to go to Work 1.5
Private Vehicle Occupancy 1.5
Work Experience, Hours Worked per Week, and Weeks Worked 1.3

60
Characteristics Design Factor
Number of Workers in Family 1.4
Presence of Own Children, Presence of People Under 18 Years, Presence of People 60 Years and Over, and Presence of People 65 Years and Over 1.4
Age of Own Children by Living Arrangements and Employment Status of Parents 1.6
Age of Householder 1.2
Race of Householder 1.5
Household, Family or Nonfamily Income 1.5
Person Earnings/Income 1.5
Type of Household Income 1.2
Poverty Status (Persons) 1.7
Poverty Status (Families/Households) 1.5
Ratio of Income to Poverty Level 2.4
Receipt of Food Stamps and Participation in Free/Reduced Price Meals 1.7
Health Insurance 1.6
HOUSING
Households/Occupied Housing Units 2.0
Family Type, Household Type, and Household Size 1.5
Households by Presence of Nonrelatives 2.2
Unmarried Partner Households 1.5
Tenure 1.4
Vacant 1.7
Rooms and Bedrooms 1.4
Occupants per Room 1.5
Units in Structure 1.5
Year Structure Built and Year Householder Moved Into Unit 1.4
House Heating Fuel 1.3
Telephone Service Available 1.4
Vehicles Available 1.4
Plumbing Facilities and Kitchen Facilities 1.9
Gross Rent, Gross Rent as a Percentage Of Household Income, and Contract Rent 1.5
Meals Included in Rent 1.4
Inclusion of Utilities in Rent 1.4
Value 1.3
Mortgage Status and Selected Monthly Owner Costs 1.3
Selected Physical and Financial Conditions 1.5

61
Table 3.19 Design Factors for Calculating PUMS Standard Errors –Louisiana Characteristics Design Factor
POPULATION
Families and Nonfamilies 1.7
Population in Households by Race/Hispanic Origin of Householder 1.8
Population by Tenure 2.8
Age 1.0
Sex 1.0
Population of Two or More Races 1.9
White Alone 1.2
Black or African American Alone 1.1
American Indian or Alaska Native Alone, Asian Alone, Native Hawaiian or Other Pacific Islander Alone, or Some Other Race Alone 1.8
Hispanic or Latino 2.0
Marital Status 1.3
Marital History 1.3
Relationship 1.4
Ancestry 2.0
Grandparents Responsible for Grandchildren 1.7
Number of Women Who Had a Birth in the Past 12 Months 1.3
Language Spoken at Home and Ability to Speak English 1.4
Linguistic Isolation 2.2
Place of Birth, Year of Entry, and Citizenship Status 1.9
Residence 1 Year Ago 2.7
School Enrollment, Level of School, Type of School, and Field of Degree 1.3
Educational Attainment 1.4
Armed Forces Status and Veteran Status 1.2
Period of Military Service 1.4
Disability Status 1.2
Employment/Work Status 1.2
Industry, Occupation, and Class of Worker 1.5
Travel Time to Work 1.6
Means of Transportation to Work 1.5
Place of Work 1.4
Time Leaving Home to go to Work 1.6
Private Vehicle Occupancy 1.5
Work Experience, Hours Worked per Week, and Weeks Worked 1.3

62
Characteristics Design Factor
Number of Workers in Family 1.4
Presence of Own Children, Presence of People Under 18 Years, Presence of People 60 Years and Over, and Presence of People 65 Years and Over 1.5
Age of Own Children by Living Arrangements and Employment Status of Parents 1.7
Age of Householder 1.3
Race of Householder 1.4
Household, Family or Nonfamily Income 1.5
Person Earnings/Income 1.5
Type of Household Income 1.2
Poverty Status (Persons) 1.8
Poverty Status (Families/Households) 1.5
Ratio of Income to Poverty Level 2.7
Receipt of Food Stamps and Participation in Free/Reduced Price Meals 1.7
Health Insurance 1.7
HOUSING
Households/Occupied Housing Units 2.0
Family Type, Household Type, and Household Size 1.6
Households by Presence of Nonrelatives 2.2
Unmarried Partner Households 1.6
Tenure 1.5
Vacant 1.7
Rooms and Bedrooms 1.5
Occupants per Room 1.5
Units in Structure 1.5
Year Structure Built and Year Householder Moved Into Unit 1.4
House Heating Fuel 1.5
Telephone Service Available 1.5
Vehicles Available 1.5
Plumbing Facilities and Kitchen Facilities 2.0
Gross Rent, Gross Rent as a Percentage Of Household Income, and Contract Rent 1.6
Meals Included in Rent 1.5
Inclusion of Utilities in Rent 1.5
Value 1.4
Mortgage Status and Selected Monthly Owner Costs 1.4
Selected Physical and Financial Conditions 1.5

63
Table 3.20 Design Factors for Calculating PUMS Standard Errors –Maine Characteristics Design Factor
POPULATION
Families and Nonfamilies 1.4
Population in Households by Race/Hispanic Origin of Householder 1.8
Population by Tenure 2.4
Age 1.0
Sex 1.0
Population of Two or More Races 1.4
White Alone 2.0
Black or African American Alone 1.1
American Indian or Alaska Native Alone, Asian Alone, Native Hawaiian or Other Pacific Islander Alone, or Some Other Race Alone 1.3
Hispanic or Latino 1.5
Marital Status 1.2
Marital History 1.3
Relationship 1.3
Ancestry 2.0
Grandparents Responsible for Grandchildren 1.7
Number of Women Who Had a Birth in the Past 12 Months 1.3
Language Spoken at Home and Ability to Speak English 1.4
Linguistic Isolation 2.7
Place of Birth, Year of Entry, and Citizenship Status 1.6
Residence 1 Year Ago 2.3
School Enrollment, Level of School, Type of School, and Field of Degree 1.3
Educational Attainment 1.2
Armed Forces Status and Veteran Status 1.2
Period of Military Service 1.1
Disability Status 1.3
Employment/Work Status 1.3
Industry, Occupation, and Class of Worker 1.3
Travel Time to Work 1.5
Means of Transportation to Work 1.4
Place of Work 1.4
Time Leaving Home to go to Work 1.4
Private Vehicle Occupancy 1.5
Work Experience, Hours Worked per Week, and Weeks Worked 1.3

64
Characteristics Design Factor
Number of Workers in Family 1.3
Presence of Own Children, Presence of People Under 18 Years, Presence of People 60 Years and Over, and Presence of People 65 Years and Over 1.2
Age of Own Children by Living Arrangements and Employment Status of Parents 1.7
Age of Householder 1.1
Race of Householder 1.5
Household, Family or Nonfamily Income 1.5
Person Earnings/Income 1.4
Type of Household Income 1.3
Poverty Status (Persons) 1.7
Poverty Status (Families/Households) 1.4
Ratio of Income to Poverty Level 2.2
Receipt of Food Stamps and Participation in Free/Reduced Price Meals 1.5
Health Insurance 1.3
HOUSING
Households/Occupied Housing Units 1.3
Family Type, Household Type, and Household Size 1.4
Households by Presence of Nonrelatives 1.8
Unmarried Partner Households 1.5
Tenure 1.2
Vacant 1.3
Rooms and Bedrooms 1.3
Occupants per Room 1.3
Units in Structure 1.4
Year Structure Built and Year Householder Moved Into Unit 1.3
House Heating Fuel 1.3
Telephone Service Available 1.2
Vehicles Available 1.3
Plumbing Facilities and Kitchen Facilities 1.3
Gross Rent, Gross Rent as a Percentage Of Household Income, and Contract Rent 1.5
Meals Included in Rent 1.3
Inclusion of Utilities in Rent 1.4
Value 1.3
Mortgage Status and Selected Monthly Owner Costs 1.2
Selected Physical and Financial Conditions 1.3

65
Table 3.21 Design Factors for Calculating PUMS Standard Errors –Maryland Characteristics Design Factor
POPULATION
Families and Nonfamilies 1.7
Population in Households by Race/Hispanic Origin of Householder 1.8
Population by Tenure 2.8
Age 1.0
Sex 1.2
Population of Two or More Races 2.1
White Alone 2.0
Black or African American Alone 1.8
American Indian or Alaska Native Alone, Asian Alone, Native Hawaiian or Other Pacific Islander Alone, or Some Other Race Alone 2.0
Hispanic or Latino 2.0
Marital Status 1.3
Marital History 1.3
Relationship 1.4
Ancestry 2.0
Grandparents Responsible for Grandchildren 1.8
Number of Women Who Had a Birth in the Past 12 Months 1.3
Language Spoken at Home and Ability to Speak English 1.6
Linguistic Isolation 1.9
Place of Birth, Year of Entry, and Citizenship Status 1.9
Residence 1 Year Ago 2.8
School Enrollment, Level of School, Type of School, and Field of Degree 1.3
Educational Attainment 1.4
Armed Forces Status and Veteran Status 1.2
Period of Military Service 1.4
Disability Status 1.2
Employment/Work Status 1.2
Industry, Occupation, and Class of Worker 1.5
Travel Time to Work 1.6
Means of Transportation to Work 1.5
Place of Work 1.4
Time Leaving Home to go to Work 1.6
Private Vehicle Occupancy 1.5
Work Experience, Hours Worked per Week, and Weeks Worked 1.3

66
Characteristics Design Factor
Number of Workers in Family 1.4
Presence of Own Children, Presence of People Under 18 Years, Presence of People 60 Years and Over, and Presence of People 65 Years and Over 1.5
Age of Own Children by Living Arrangements and Employment Status of Parents 1.7
Age of Householder 1.3
Race of Householder 1.5
Household, Family or Nonfamily Income 1.5
Person Earnings/Income 1.5
Type of Household Income 1.2
Poverty Status (Persons) 1.7
Poverty Status (Families/Households) 1.5
Ratio of Income to Poverty Level 2.7
Receipt of Food Stamps and Participation in Free/Reduced Price Meals 1.7
Health Insurance 1.8
HOUSING
Households/Occupied Housing Units 2.2
Family Type, Household Type, and Household Size 1.5
Households by Presence of Nonrelatives 2.0
Unmarried Partner Households 1.5
Tenure 1.4
Vacant 1.7
Rooms and Bedrooms 1.5
Occupants per Room 1.5
Units in Structure 1.5
Year Structure Built and Year Householder Moved Into Unit 1.4
House Heating Fuel 1.5
Telephone Service Available 1.5
Vehicles Available 1.5
Plumbing Facilities and Kitchen Facilities 2.2
Gross Rent, Gross Rent as a Percentage Of Household Income, and Contract Rent 1.6
Meals Included in Rent 1.5
Inclusion of Utilities in Rent 1.5
Value 1.3
Mortgage Status and Selected Monthly Owner Costs 1.4
Selected Physical and Financial Conditions 1.5

67
Table 3.22 Design Factors for Calculating PUMS Standard Errors –Massachusetts Characteristics Design Factor
POPULATION
Families and Nonfamilies 1.6
Population in Households by Race/Hispanic Origin of Householder 1.8
Population by Tenure 2.5
Age 1.0
Sex 1.0
Population of Two or More Races 2.0
White Alone 2.0
Black or African American Alone 1.5
American Indian or Alaska Native Alone, Asian Alone, Native Hawaiian or Other Pacific Islander Alone, or Some Other Race Alone 2.0
Hispanic or Latino 2.0
Marital Status 1.3
Marital History 1.3
Relationship 1.4
Ancestry 2.0
Grandparents Responsible for Grandchildren 1.8
Number of Women Who Had a Birth in the Past 12 Months 1.0
Language Spoken at Home and Ability to Speak English 1.5
Linguistic Isolation 1.7
Place of Birth, Year of Entry, and Citizenship Status 1.9
Residence 1 Year Ago 2.6
School Enrollment, Level of School, Type of School, and Field of Degree 1.3
Educational Attainment 1.4
Armed Forces Status and Veteran Status 1.2
Period of Military Service 1.4
Disability Status 1.2
Employment/Work Status 1.2
Industry, Occupation, and Class of Worker 1.5
Travel Time to Work 1.6
Means of Transportation to Work 1.5
Place of Work 1.6
Time Leaving Home to go to Work 1.6
Private Vehicle Occupancy 1.5
Work Experience, Hours Worked per Week, and Weeks Worked 1.3

68
Characteristics Design Factor
Number of Workers in Family 1.4
Presence of Own Children, Presence of People Under 18 Years, Presence of People 60 Years and Over, and Presence of People 65 Years and Over 1.5
Age of Own Children by Living Arrangements and Employment Status of Parents 1.7
Age of Householder 1.3
Race of Householder 1.5
Household, Family or Nonfamily Income 1.5
Person Earnings/Income 1.5
Type of Household Income 1.2
Poverty Status (Persons) 1.8
Poverty Status (Families/Households) 1.5
Ratio of Income to Poverty Level 2.6
Receipt of Food Stamps and Participation in Free/Reduced Price Meals 1.7
Health Insurance 1.8
HOUSING
Households/Occupied Housing Units 2.2
Family Type, Household Type, and Household Size 1.5
Households by Presence of Nonrelatives 2.2
Unmarried Partner Households 1.5
Tenure 1.5
Vacant 1.7
Rooms and Bedrooms 1.5
Occupants per Room 1.5
Units in Structure 1.5
Year Structure Built and Year Householder Moved Into Unit 1.4
House Heating Fuel 1.5
Telephone Service Available 1.5
Vehicles Available 1.5
Plumbing Facilities and Kitchen Facilities 2.2
Gross Rent, Gross Rent as a Percentage Of Household Income, and Contract Rent 1.6
Meals Included in Rent 1.5
Inclusion of Utilities in Rent 1.5
Value 1.4
Mortgage Status and Selected Monthly Owner Costs 1.4
Selected Physical and Financial Conditions 1.5

69
Table 3.23 Design Factors for Calculating PUMS Standard Errors –Michigan Characteristics Design Factor
POPULATION
Families and Nonfamilies 1.5
Population in Households by Race/Hispanic Origin of Householder 1.8
Population by Tenure 2.5
Age 1.0
Sex 1.0
Population of Two or More Races 1.9
White Alone 2.0
Black or African American Alone 1.2
American Indian or Alaska Native Alone, Asian Alone, Native Hawaiian or Other Pacific Islander Alone, or Some Other Race Alone 2.0
Hispanic or Latino 1.8
Marital Status 1.1
Marital History 1.1
Relationship 1.3
Ancestry 1.7
Grandparents Responsible for Grandchildren 1.6
Number of Women Who Had a Birth in the Past 12 Months 1.2
Language Spoken at Home and Ability to Speak English 1.4
Linguistic Isolation 2.2
Place of Birth, Year of Entry, and Citizenship Status 1.7
Residence 1 Year Ago 2.4
School Enrollment, Level of School, Type of School, and Field of Degree 1.2
Educational Attainment 1.2
Armed Forces Status and Veteran Status 1.2
Period of Military Service 1.2
Disability Status 1.3
Employment/Work Status 1.2
Industry, Occupation, and Class of Worker 1.3
Travel Time to Work 1.4
Means of Transportation to Work 1.4
Place of Work 1.3
Time Leaving Home to go to Work 1.4
Private Vehicle Occupancy 1.4
Work Experience, Hours Worked per Week, and Weeks Worked 1.2

70
Characteristics Design Factor
Number of Workers in Family 1.2
Presence of Own Children, Presence of People Under 18 Years, Presence of People 60 Years and Over, and Presence of People 65 Years and Over 1.3
Age of Own Children by Living Arrangements and Employment Status of Parents 1.6
Age of Householder 1.2
Race of Householder 1.5
Household, Family or Nonfamily Income 1.5
Person Earnings/Income 1.4
Type of Household Income 1.3
Poverty Status (Persons) 1.7
Poverty Status (Families/Households) 1.3
Ratio of Income to Poverty Level 2.3
Receipt of Food Stamps and Participation in Free/Reduced Price Meals 1.6
Health Insurance 1.3
HOUSING
Households/Occupied Housing Units 1.6
Family Type, Household Type, and Household Size 1.4
Households by Presence of Nonrelatives 2.0
Unmarried Partner Households 1.4
Tenure 1.4
Vacant 1.4
Rooms and Bedrooms 1.3
Occupants per Room 1.3
Units in Structure 1.4
Year Structure Built and Year Householder Moved Into Unit 1.3
House Heating Fuel 1.3
Telephone Service Available 1.4
Vehicles Available 1.3
Plumbing Facilities and Kitchen Facilities 1.6
Gross Rent, Gross Rent as a Percentage Of Household Income, and Contract Rent 1.4
Meals Included in Rent 1.4
Inclusion of Utilities in Rent 1.4
Value 1.2
Mortgage Status and Selected Monthly Owner Costs 1.2
Selected Physical and Financial Conditions 1.3

71
Table 3.24 Design Factors for Calculating PUMS Standard Errors –Minnesota Characteristics Design Factor
POPULATION
Families and Nonfamilies 1.3
Population in Households by Race/Hispanic Origin of Householder 1.8
Population by Tenure 2.3
Age 1.0
Sex 1.0
Population of Two or More Races 1.8
White Alone 2.0
Black or African American Alone 1.6
American Indian or Alaska Native Alone, Asian Alone, Native Hawaiian or Other Pacific Islander Alone, or Some Other Race Alone 2.0
Hispanic or Latino 2.0
Marital Status 1.1
Marital History 1.2
Relationship 1.2
Ancestry 1.7
Grandparents Responsible for Grandchildren 1.4
Number of Women Who Had a Birth in the Past 12 Months 1.3
Language Spoken at Home and Ability to Speak English 1.5
Linguistic Isolation 2.3
Place of Birth, Year of Entry, and Citizenship Status 1.7
Residence 1 Year Ago 2.2
School Enrollment, Level of School, Type of School, and Field of Degree 1.3
Educational Attainment 1.2
Armed Forces Status and Veteran Status 1.3
Period of Military Service 1.1
Disability Status 1.3
Employment/Work Status 1.2
Industry, Occupation, and Class of Worker 1.3
Travel Time to Work 1.3
Means of Transportation to Work 1.4
Place of Work 1.2
Time Leaving Home to go to Work 1.4
Private Vehicle Occupancy 1.5
Work Experience, Hours Worked per Week, and Weeks Worked 1.3

72
Characteristics Design Factor
Number of Workers in Family 1.2
Presence of Own Children, Presence of People Under 18 Years, Presence of People 60 Years and Over, and Presence of People 65 Years and Over 1.2
Age of Own Children by Living Arrangements and Employment Status of Parents 1.7
Age of Householder 1.1
Race of Householder 1.5
Household, Family or Nonfamily Income 1.5
Person Earnings/Income 1.3
Type of Household Income 1.4
Poverty Status (Persons) 1.7
Poverty Status (Families/Households) 1.4
Ratio of Income to Poverty Level 2.2
Receipt of Food Stamps and Participation in Free/Reduced Price Meals 1.6
Health Insurance 1.5
HOUSING
Households/Occupied Housing Units 1.6
Family Type, Household Type, and Household Size 1.3
Households by Presence of Nonrelatives 1.8
Unmarried Partner Households 1.4
Tenure 1.3
Vacant 1.6
Rooms and Bedrooms 1.3
Occupants per Room 1.3
Units in Structure 1.5
Year Structure Built and Year Householder Moved Into Unit 1.3
House Heating Fuel 1.2
Telephone Service Available 1.3
Vehicles Available 1.2
Plumbing Facilities and Kitchen Facilities 1.5
Gross Rent, Gross Rent as a Percentage Of Household Income, and Contract Rent 1.4
Meals Included in Rent 1.4
Inclusion of Utilities in Rent 1.4
Value 1.1
Mortgage Status and Selected Monthly Owner Costs 1.2
Selected Physical and Financial Conditions 1.3

73
Table 3.25 Design Factors for Calculating PUMS Standard Errors –Mississippi Characteristics Design Factor
POPULATION
Families and Nonfamilies 1.7
Population in Households by Race/Hispanic Origin of Householder 1.5
Population by Tenure 2.8
Age 1.0
Sex 1.0
Population of Two or More Races 1.9
White Alone 1.0
Black or African American Alone 1.0
American Indian or Alaska Native Alone, Asian Alone, Native Hawaiian or Other Pacific Islander Alone, or Some Other Race Alone 1.8
Hispanic or Latino 1.9
Marital Status 1.3
Marital History 1.1
Relationship 1.4
Ancestry 2.0
Grandparents Responsible for Grandchildren 1.8
Number of Women Who Had a Birth in the Past 12 Months 1.3
Language Spoken at Home and Ability to Speak English 1.2
Linguistic Isolation 3.3
Place of Birth, Year of Entry, and Citizenship Status 1.9
Residence 1 Year Ago 2.8
School Enrollment, Level of School, Type of School, and Field of Degree 1.3
Educational Attainment 1.4
Armed Forces Status and Veteran Status 1.2
Period of Military Service 1.4
Disability Status 1.2
Employment/Work Status 1.1
Industry, Occupation, and Class of Worker 1.5
Travel Time to Work 1.6
Means of Transportation to Work 1.5
Place of Work 1.4
Time Leaving Home to go to Work 1.6
Private Vehicle Occupancy 1.5
Work Experience, Hours Worked per Week, and Weeks Worked 1.3

74
Characteristics Design Factor
Number of Workers in Family 1.4
Presence of Own Children, Presence of People Under 18 Years, Presence of People 60 Years and Over, and Presence of People 65 Years and Over 1.5
Age of Own Children by Living Arrangements and Employment Status of Parents 1.7
Age of Householder 1.3
Race of Householder 1.3
Household, Family or Nonfamily Income 1.6
Person Earnings/Income 1.5
Type of Household Income 1.2
Poverty Status (Persons) 1.7
Poverty Status (Families/Households) 1.5
Ratio of Income to Poverty Level 2.7
Receipt of Food Stamps and Participation in Free/Reduced Price Meals 1.7
Health Insurance 1.3
HOUSING
Households/Occupied Housing Units 2.0
Family Type, Household Type, and Household Size 1.6
Households by Presence of Nonrelatives 2.2
Unmarried Partner Households 1.6
Tenure 1.5
Vacant 1.7
Rooms and Bedrooms 1.5
Occupants per Room 1.5
Units in Structure 1.5
Year Structure Built and Year Householder Moved Into Unit 1.4
House Heating Fuel 1.5
Telephone Service Available 1.5
Vehicles Available 1.5
Plumbing Facilities and Kitchen Facilities 1.9
Gross Rent, Gross Rent as a Percentage Of Household Income, and Contract Rent 1.6
Meals Included in Rent 1.5
Inclusion of Utilities in Rent 1.5
Value 1.4
Mortgage Status and Selected Monthly Owner Costs 1.4
Selected Physical and Financial Conditions 1.5

75
Table 3.26 Design Factors for Calculating PUMS Standard Errors –Missouri Characteristics Design Factor
POPULATION
Families and Nonfamilies 1.6
Population in Households by Race/Hispanic Origin of Householder 1.8
Population by Tenure 2.7
Age 1.0
Sex 1.0
Population of Two or More Races 1.9
White Alone 2.0
Black or African American Alone 1.2
American Indian or Alaska Native Alone, Asian Alone, Native Hawaiian or Other Pacific Islander Alone, or Some Other Race Alone 2.0
Hispanic or Latino 1.8
Marital Status 1.3
Marital History 1.2
Relationship 1.4
Ancestry 2.0
Grandparents Responsible for Grandchildren 1.7
Number of Women Who Had a Birth in the Past 12 Months 1.3
Language Spoken at Home and Ability to Speak English 1.4
Linguistic Isolation 2.5
Place of Birth, Year of Entry, and Citizenship Status 1.8
Residence 1 Year Ago 2.6
School Enrollment, Level of School, Type of School, and Field of Degree 1.3
Educational Attainment 1.4
Armed Forces Status and Veteran Status 1.2
Period of Military Service 1.3
Disability Status 1.3
Employment/Work Status 1.2
Industry, Occupation, and Class of Worker 1.5
Travel Time to Work 1.6
Means of Transportation to Work 1.5
Place of Work 1.4
Time Leaving Home to go to Work 1.5
Private Vehicle Occupancy 1.5
Work Experience, Hours Worked per Week, and Weeks Worked 1.3

76
Characteristics Design Factor
Number of Workers in Family 1.4
Presence of Own Children, Presence of People Under 18 Years, Presence of People 60 Years and Over, and Presence of People 65 Years and Over 1.4
Age of Own Children by Living Arrangements and Employment Status of Parents 1.7
Age of Householder 1.3
Race of Householder 1.5
Household, Family or Nonfamily Income 1.5
Person Earnings/Income 1.5
Type of Household Income 1.2
Poverty Status (Persons) 1.7
Poverty Status (Families/Households) 1.5
Ratio of Income to Poverty Level 2.5
Receipt of Food Stamps and Participation in Free/Reduced Price Meals 1.6
Health Insurance 1.6
HOUSING
Households/Occupied Housing Units 2.0
Family Type, Household Type, and Household Size 1.5
Households by Presence of Nonrelatives 2.1
Unmarried Partner Households 1.5
Tenure 1.5
Vacant 1.7
Rooms and Bedrooms 1.5
Occupants per Room 1.5
Units in Structure 1.5
Year Structure Built and Year Householder Moved Into Unit 1.4
House Heating Fuel 1.4
Telephone Service Available 1.5
Vehicles Available 1.4
Plumbing Facilities and Kitchen Facilities 2.0
Gross Rent, Gross Rent as a Percentage Of Household Income, and Contract Rent 1.6
Meals Included in Rent 1.5
Inclusion of Utilities in Rent 1.5
Value 1.3
Mortgage Status and Selected Monthly Owner Costs 1.4
Selected Physical and Financial Conditions 1.5

77
Table 3.27 Design Factors for Calculating PUMS Standard Errors –Montana Characteristics Design Factor
POPULATION
Families and Nonfamilies 1.4
Population in Households by Race/Hispanic Origin of Householder 1.7
Population by Tenure 2.3
Age 1.0
Sex 1.0
Population of Two or More Races 1.6
White Alone 1.1
Black or African American Alone 1.6
American Indian or Alaska Native Alone, Asian Alone, Native Hawaiian or Other Pacific Islander Alone, or Some Other Race Alone 1.1
Hispanic or Latino 1.4
Marital Status 1.2
Marital History 1.2
Relationship 1.2
Ancestry 1.7
Grandparents Responsible for Grandchildren 1.6
Number of Women Who Had a Birth in the Past 12 Months 1.2
Language Spoken at Home and Ability to Speak English 1.5
Linguistic Isolation 2.6
Place of Birth, Year of Entry, and Citizenship Status 1.6
Residence 1 Year Ago 2.3
School Enrollment, Level of School, Type of School, and Field of Degree 1.2
Educational Attainment 1.3
Armed Forces Status and Veteran Status 1.3
Period of Military Service 1.3
Disability Status 1.2
Employment/Work Status 1.2
Industry, Occupation, and Class of Worker 1.4
Travel Time to Work 1.4
Means of Transportation to Work 1.4
Place of Work 1.2
Time Leaving Home to go to Work 1.5
Private Vehicle Occupancy 1.5
Work Experience, Hours Worked per Week, and Weeks Worked 1.3

78
Characteristics Design Factor
Number of Workers in Family 1.3
Presence of Own Children, Presence of People Under 18 Years, Presence of People 60 Years and Over, and Presence of People 65 Years and Over 1.3
Age of Own Children by Living Arrangements and Employment Status of Parents 1.7
Age of Householder 1.2
Race of Householder 1.5
Household, Family or Nonfamily Income 1.5
Person Earnings/Income 1.4
Type of Household Income 1.0
Poverty Status (Persons) 1.7
Poverty Status (Families/Households) 1.4
Ratio of Income to Poverty Level 2.2
Receipt of Food Stamps and Participation in Free/Reduced Price Meals 1.6
Health Insurance 1.3
HOUSING
Households/Occupied Housing Units 1.6
Family Type, Household Type, and Household Size 1.4
Households by Presence of Nonrelatives 1.7
Unmarried Partner Households 1.4
Tenure 1.3
Vacant 1.3
Rooms and Bedrooms 1.3
Occupants per Room 1.4
Units in Structure 1.4
Year Structure Built and Year Householder Moved Into Unit 1.3
House Heating Fuel 1.2
Telephone Service Available 1.3
Vehicles Available 1.3
Plumbing Facilities and Kitchen Facilities 1.3
Gross Rent, Gross Rent as a Percentage Of Household Income, and Contract Rent 1.5
Meals Included in Rent 1.4
Inclusion of Utilities in Rent 1.4
Value 1.3
Mortgage Status and Selected Monthly Owner Costs 1.3
Selected Physical and Financial Conditions 1.3

79
Table 3.28 Design Factors for Calculating PUMS Standard Errors –Nebraska Characteristics Design Factor
POPULATION
Families and Nonfamilies 1.4
Population in Households by Race/Hispanic Origin of Householder 1.8
Population by Tenure 2.3
Age 1.0
Sex 1.0
Population of Two or More Races 1.7
White Alone 1.9
Black or African American Alone 1.2
American Indian or Alaska Native Alone, Asian Alone, Native Hawaiian or Other Pacific Islander Alone, or Some Other Race Alone 2.0
Hispanic or Latino 2.0
Marital Status 1.1
Marital History 1.2
Relationship 1.2
Ancestry 1.7
Grandparents Responsible for Grandchildren 1.5
Number of Women Who Had a Birth in the Past 12 Months 1.1
Language Spoken at Home and Ability to Speak English 1.3
Linguistic Isolation 1.7
Place of Birth, Year of Entry, and Citizenship Status 1.6
Residence 1 Year Ago 2.1
School Enrollment, Level of School, Type of School, and Field of Degree 1.2
Educational Attainment 1.2
Armed Forces Status and Veteran Status 1.2
Period of Military Service 1.2
Disability Status 1.2
Employment/Work Status 1.1
Industry, Occupation, and Class of Worker 1.3
Travel Time to Work 1.3
Means of Transportation to Work 1.3
Place of Work 1.1
Time Leaving Home to go to Work 1.3
Private Vehicle Occupancy 1.5
Work Experience, Hours Worked per Week, and Weeks Worked 1.3

80
Characteristics Design Factor
Number of Workers in Family 1.2
Presence of Own Children, Presence of People Under 18 Years, Presence of People 60 Years and Over, and Presence of People 65 Years and Over 1.2
Age of Own Children by Living Arrangements and Employment Status of Parents 1.7
Age of Householder 1.1
Race of Householder 1.5
Household, Family or Nonfamily Income 1.5
Person Earnings/Income 1.3
Type of Household Income 1.2
Poverty Status (Persons) 1.7
Poverty Status (Families/Households) 1.3
Ratio of Income to Poverty Level 2.2
Receipt of Food Stamps and Participation in Free/Reduced Price Meals 1.3
Health Insurance 1.3
HOUSING
Households/Occupied Housing Units 1.8
Family Type, Household Type, and Household Size 1.3
Households by Presence of Nonrelatives 1.7
Unmarried Partner Households 1.4
Tenure 1.3
Vacant 1.5
Rooms and Bedrooms 1.3
Occupants per Room 1.3
Units in Structure 1.4
Year Structure Built and Year Householder Moved Into Unit 1.2
House Heating Fuel 1.2
Telephone Service Available 1.3
Vehicles Available 1.2
Plumbing Facilities and Kitchen Facilities 1.8
Gross Rent, Gross Rent as a Percentage Of Household Income, and Contract Rent 1.4
Meals Included in Rent 1.3
Inclusion of Utilities in Rent 1.4
Value 1.1
Mortgage Status and Selected Monthly Owner Costs 1.2
Selected Physical and Financial Conditions 1.3

81
Table 3.29 Design Factors for Calculating PUMS Standard Errors –Nevada Characteristics Design Factor
POPULATION
Families and Nonfamilies 1.7
Population in Households by Race/Hispanic Origin of Householder 1.8
Population by Tenure 2.9
Age 1.1
Sex 1.4
Population of Two or More Races 2.1
White Alone 2.3
Black or African American Alone 1.9
American Indian or Alaska Native Alone, Asian Alone, Native Hawaiian or Other Pacific Islander Alone, or Some Other Race Alone 2.0
Hispanic or Latino 2.0
Marital Status 1.3
Marital History 1.4
Relationship 1.4
Ancestry 2.0
Grandparents Responsible for Grandchildren 1.8
Number of Women Who Had a Birth in the Past 12 Months 1.3
Language Spoken at Home and Ability to Speak English 1.8
Linguistic Isolation 1.7
Place of Birth, Year of Entry, and Citizenship Status 1.9
Residence 1 Year Ago 2.8
School Enrollment, Level of School, Type of School, and Field of Degree 1.3
Educational Attainment 1.4
Armed Forces Status and Veteran Status 1.3
Period of Military Service 1.4
Disability Status 1.4
Employment/Work Status 1.3
Industry, Occupation, and Class of Worker 1.5
Travel Time to Work 1.6
Means of Transportation to Work 1.5
Place of Work 1.4
Time Leaving Home to go to Work 1.6
Private Vehicle Occupancy 1.5
Work Experience, Hours Worked per Week, and Weeks Worked 1.3

82
Characteristics Design Factor
Number of Workers in Family 1.4
Presence of Own Children, Presence of People Under 18 Years, Presence of People 60 Years and Over, and Presence of People 65 Years and Over 1.5
Age of Own Children by Living Arrangements and Employment Status of Parents 1.7
Age of Householder 1.3
Race of Householder 1.5
Household, Family or Nonfamily Income 1.5
Person Earnings/Income 1.5
Type of Household Income 1.2
Poverty Status (Persons) 1.9
Poverty Status (Families/Households) 1.5
Ratio of Income to Poverty Level 2.7
Receipt of Food Stamps and Participation in Free/Reduced Price Meals 1.7
Health Insurance 1.8
HOUSING
Households/Occupied Housing Units 2.2
Family Type, Household Type, and Household Size 1.6
Households by Presence of Nonrelatives 2.2
Unmarried Partner Households 1.6
Tenure 1.5
Vacant 1.7
Rooms and Bedrooms 1.5
Occupants per Room 1.5
Units in Structure 1.5
Year Structure Built and Year Householder Moved Into Unit 1.4
House Heating Fuel 1.5
Telephone Service Available 1.5
Vehicles Available 1.5
Plumbing Facilities and Kitchen Facilities 2.2
Gross Rent, Gross Rent as a Percentage Of Household Income, and Contract Rent 1.6
Meals Included in Rent 1.5
Inclusion of Utilities in Rent 1.5
Value 1.4
Mortgage Status and Selected Monthly Owner Costs 1.4
Selected Physical and Financial Conditions 1.5
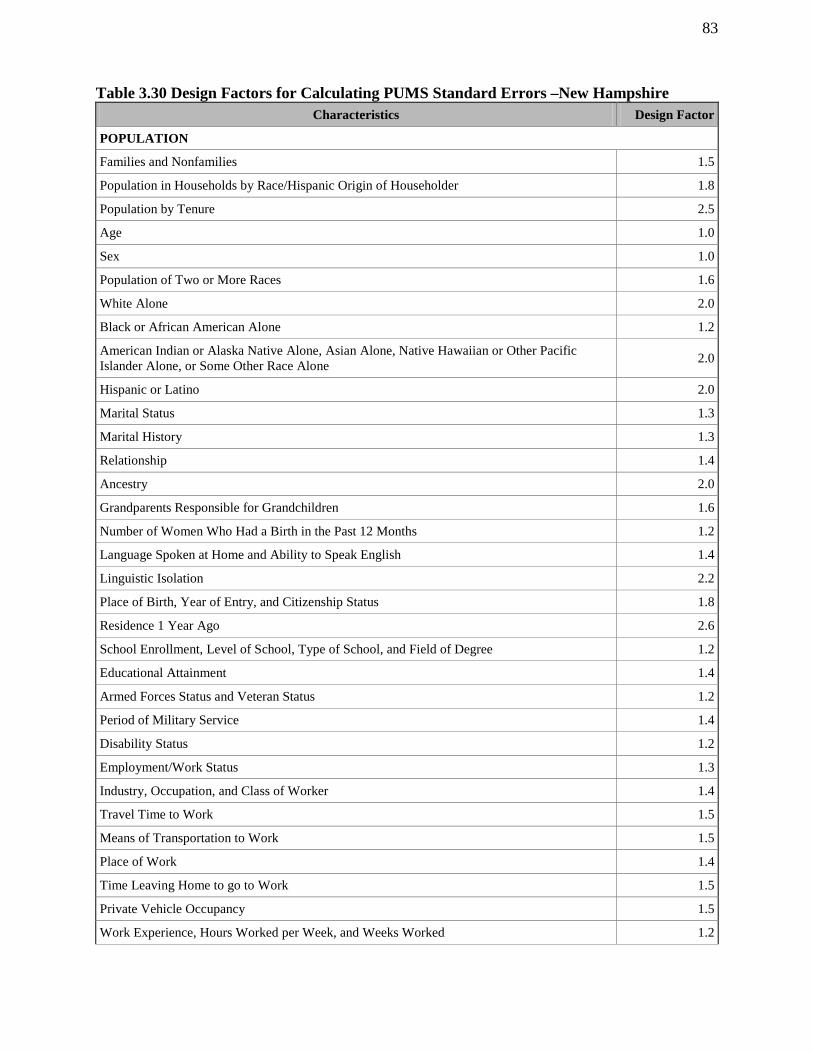
83
Table 3.30 Design Factors for Calculating PUMS Standard Errors –New Hampshire Characteristics Design Factor
POPULATION
Families and Nonfamilies 1.5
Population in Households by Race/Hispanic Origin of Householder 1.8
Population by Tenure 2.5
Age 1.0
Sex 1.0
Population of Two or More Races 1.6
White Alone 2.0
Black or African American Alone 1.2
American Indian or Alaska Native Alone, Asian Alone, Native Hawaiian or Other Pacific Islander Alone, or Some Other Race Alone 2.0
Hispanic or Latino 2.0
Marital Status 1.3
Marital History 1.3
Relationship 1.4
Ancestry 2.0
Grandparents Responsible for Grandchildren 1.6
Number of Women Who Had a Birth in the Past 12 Months 1.2
Language Spoken at Home and Ability to Speak English 1.4
Linguistic Isolation 2.2
Place of Birth, Year of Entry, and Citizenship Status 1.8
Residence 1 Year Ago 2.6
School Enrollment, Level of School, Type of School, and Field of Degree 1.2
Educational Attainment 1.4
Armed Forces Status and Veteran Status 1.2
Period of Military Service 1.4
Disability Status 1.2
Employment/Work Status 1.3
Industry, Occupation, and Class of Worker 1.4
Travel Time to Work 1.5
Means of Transportation to Work 1.5
Place of Work 1.4
Time Leaving Home to go to Work 1.5
Private Vehicle Occupancy 1.5
Work Experience, Hours Worked per Week, and Weeks Worked 1.2

84
Characteristics Design Factor
Number of Workers in Family 1.4
Presence of Own Children, Presence of People Under 18 Years, Presence of People 60 Years and Over, and Presence of People 65 Years and Over 1.4
Age of Own Children by Living Arrangements and Employment Status of Parents 1.6
Age of Householder 1.3
Race of Householder 1.5
Household, Family or Nonfamily Income 1.5
Person Earnings/Income 1.5
Type of Household Income 1.4
Poverty Status (Persons) 1.7
Poverty Status (Families/Households) 1.5
Ratio of Income to Poverty Level 2.4
Receipt of Food Stamps and Participation in Free/Reduced Price Meals 1.6
Health Insurance 1.5
HOUSING
Households/Occupied Housing Units 1.7
Family Type, Household Type, and Household Size 1.5
Households by Presence of Nonrelatives 1.9
Unmarried Partner Households 1.5
Tenure 1.4
Vacant 1.5
Rooms and Bedrooms 1.5
Occupants per Room 1.5
Units in Structure 1.5
Year Structure Built and Year Householder Moved Into Unit 1.4
House Heating Fuel 1.4
Telephone Service Available 1.4
Vehicles Available 1.4
Plumbing Facilities and Kitchen Facilities 1.7
Gross Rent, Gross Rent as a Percentage Of Household Income, and Contract Rent 1.6
Meals Included in Rent 1.5
Inclusion of Utilities in Rent 1.5
Value 1.4
Mortgage Status and Selected Monthly Owner Costs 1.3
Selected Physical and Financial Conditions 1.5

85
Table 3.31 Design Factors for Calculating PUMS Standard Errors –New Jersey Characteristics Design Factor
POPULATION
Families and Nonfamilies 1.7
Population in Households by Race/Hispanic Origin of Householder 1.8
Population by Tenure 2.9
Age 1.0
Sex 1.0
Population of Two or More Races 2.1
White Alone 2.0
Black or African American Alone 1.5
American Indian or Alaska Native Alone, Asian Alone, Native Hawaiian or Other Pacific Islander Alone, or Some Other Race Alone 2.0
Hispanic or Latino 2.0
Marital Status 1.3
Marital History 1.3
Relationship 1.4
Ancestry 2.0
Grandparents Responsible for Grandchildren 1.7
Number of Women Who Had a Birth in the Past 12 Months 1.3
Language Spoken at Home and Ability to Speak English 1.6
Linguistic Isolation 1.5
Place of Birth, Year of Entry, and Citizenship Status 1.9
Residence 1 Year Ago 2.8
School Enrollment, Level of School, Type of School, and Field of Degree 1.3
Educational Attainment 1.4
Armed Forces Status and Veteran Status 1.2
Period of Military Service 1.4
Disability Status 1.2
Employment/Work Status 1.2
Industry, Occupation, and Class of Worker 1.5
Travel Time to Work 1.6
Means of Transportation to Work 1.5
Place of Work 1.6
Time Leaving Home to go to Work 1.6
Private Vehicle Occupancy 1.5
Work Experience, Hours Worked per Week, and Weeks Worked 1.3

86
Characteristics Design Factor
Number of Workers in Family 1.4
Presence of Own Children, Presence of People Under 18 Years, Presence of People 60 Years and Over, and Presence of People 65 Years and Over 1.5
Age of Own Children by Living Arrangements and Employment Status of Parents 1.7
Age of Householder 1.3
Race of Householder 1.5
Household, Family or Nonfamily Income 1.5
Person Earnings/Income 1.5
Type of Household Income 1.3
Poverty Status (Persons) 1.7
Poverty Status (Families/Households) 1.5
Ratio of Income to Poverty Level 2.7
Receipt of Food Stamps and Participation in Free/Reduced Price Meals 1.7
Health Insurance 1.8
HOUSING
Households/Occupied Housing Units 2.2
Family Type, Household Type, and Household Size 1.5
Households by Presence of Nonrelatives 2.2
Unmarried Partner Households 1.6
Tenure 1.5
Vacant 1.7
Rooms and Bedrooms 1.5
Occupants per Room 1.5
Units in Structure 1.5
Year Structure Built and Year Householder Moved Into Unit 1.4
House Heating Fuel 1.5
Telephone Service Available 1.5
Vehicles Available 1.5
Plumbing Facilities and Kitchen Facilities 2.2
Gross Rent, Gross Rent as a Percentage Of Household Income, and Contract Rent 1.6
Meals Included in Rent 1.5
Inclusion of Utilities in Rent 1.5
Value 1.4
Mortgage Status and Selected Monthly Owner Costs 1.4
Selected Physical and Financial Conditions 1.5

87
Table 3.32 Design Factors for Calculating PUMS Standard Errors –New Mexico Characteristics Design Factor
POPULATION
Families and Nonfamilies 1.7
Population in Households by Race/Hispanic Origin of Householder 1.8
Population by Tenure 2.9
Age 1.0
Sex 1.0
Population of Two or More Races 2.1
White Alone 2.0
Black or African American Alone 1.1
American Indian or Alaska Native Alone, Asian Alone, Native Hawaiian or Other Pacific Islander Alone, or Some Other Race Alone 2.0
Hispanic or Latino 2.0
Marital Status 1.3
Marital History 1.2
Relationship 1.4
Ancestry 1.9
Grandparents Responsible for Grandchildren 1.7
Number of Women Who Had a Birth in the Past 12 Months 1.3
Language Spoken at Home and Ability to Speak English 1.5
Linguistic Isolation 1.5
Place of Birth, Year of Entry, and Citizenship Status 1.9
Residence 1 Year Ago 2.6
School Enrollment, Level of School, Type of School, and Field of Degree 1.3
Educational Attainment 1.4
Armed Forces Status and Veteran Status 1.3
Period of Military Service 1.4
Disability Status 1.3
Employment/Work Status 1.3
Industry, Occupation, and Class of Worker 1.5
Travel Time to Work 1.6
Means of Transportation to Work 1.5
Place of Work 1.4
Time Leaving Home to go to Work 1.6
Private Vehicle Occupancy 1.5
Work Experience, Hours Worked per Week, and Weeks Worked 1.3

88
Characteristics Design Factor
Number of Workers in Family 1.4
Presence of Own Children, Presence of People Under 18 Years, Presence of People 60 Years and Over, and Presence of People 65 Years and Over 1.5
Age of Own Children by Living Arrangements and Employment Status of Parents 1.7
Age of Householder 1.3
Race of Householder 1.5
Household, Family or Nonfamily Income 1.5
Person Earnings/Income 1.5
Type of Household Income 1.2
Poverty Status (Persons) 1.7
Poverty Status (Families/Households) 1.5
Ratio of Income to Poverty Level 2.7
Receipt of Food Stamps and Participation in Free/Reduced Price Meals 1.6
Health Insurance 1.7
HOUSING
Households/Occupied Housing Units 1.9
Family Type, Household Type, and Household Size 1.6
Households by Presence of Nonrelatives 2.1
Unmarried Partner Households 1.6
Tenure 1.4
Vacant 1.7
Rooms and Bedrooms 1.5
Occupants per Room 1.5
Units in Structure 1.5
Year Structure Built and Year Householder Moved Into Unit 1.4
House Heating Fuel 1.5
Telephone Service Available 1.5
Vehicles Available 1.5
Plumbing Facilities and Kitchen Facilities 1.8
Gross Rent, Gross Rent as a Percentage Of Household Income, and Contract Rent 1.6
Meals Included in Rent 1.5
Inclusion of Utilities in Rent 1.5
Value 1.4
Mortgage Status and Selected Monthly Owner Costs 1.4
Selected Physical and Financial Conditions 1.5

89
Table 3.33 Design Factors for Calculating PUMS Standard Errors –New York Characteristics Design Factor
POPULATION
Families and Nonfamilies 1.6
Population in Households by Race/Hispanic Origin of Householder 1.8
Population by Tenure 2.9
Age 1.0
Sex 1.0
Population of Two or More Races 2.1
White Alone 2.0
Black or African American Alone 1.7
American Indian or Alaska Native Alone, Asian Alone, Native Hawaiian or Other Pacific Islander Alone, or Some Other Race Alone 2.0
Hispanic or Latino 2.0
Marital Status 1.3
Marital History 1.3
Relationship 1.4
Ancestry 2.0
Grandparents Responsible for Grandchildren 1.7
Number of Women Who Had a Birth in the Past 12 Months 1.3
Language Spoken at Home and Ability to Speak English 1.7
Linguistic Isolation 1.6
Place of Birth, Year of Entry, and Citizenship Status 1.9
Residence 1 Year Ago 2.8
School Enrollment, Level of School, Type of School, and Field of Degree 1.3
Educational Attainment 1.4
Armed Forces Status and Veteran Status 1.2
Period of Military Service 1.3
Disability Status 1.2
Employment/Work Status 1.2
Industry, Occupation, and Class of Worker 1.5
Travel Time to Work 1.6
Means of Transportation to Work 1.5
Place of Work 1.4
Time Leaving Home to go to Work 1.6
Private Vehicle Occupancy 1.5
Work Experience, Hours Worked per Week, and Weeks Worked 1.3

90
Characteristics Design Factor
Number of Workers in Family 1.4
Presence of Own Children, Presence of People Under 18 Years, Presence of People 60 Years and Over, and Presence of People 65 Years and Over 1.5
Age of Own Children by Living Arrangements and Employment Status of Parents 1.7
Age of Householder 1.3
Race of Householder 1.5
Household, Family or Nonfamily Income 1.5
Person Earnings/Income 1.5
Type of Household Income 1.2
Poverty Status (Persons) 1.9
Poverty Status (Families/Households) 1.5
Ratio of Income to Poverty Level 2.7
Receipt of Food Stamps and Participation in Free/Reduced Price Meals 1.7
Health Insurance 1.4
HOUSING
Households/Occupied Housing Units 2.2
Family Type, Household Type, and Household Size 1.6
Households by Presence of Nonrelatives 2.2
Unmarried Partner Households 1.5
Tenure 1.5
Vacant 1.7
Rooms and Bedrooms 1.5
Occupants per Room 1.5
Units in Structure 1.5
Year Structure Built and Year Householder Moved Into Unit 1.4
House Heating Fuel 1.5
Telephone Service Available 1.5
Vehicles Available 1.5
Plumbing Facilities and Kitchen Facilities 2.2
Gross Rent, Gross Rent as a Percentage Of Household Income, and Contract Rent 1.6
Meals Included in Rent 1.5
Inclusion of Utilities in Rent 1.5
Value 1.3
Mortgage Status and Selected Monthly Owner Costs 1.3
Selected Physical and Financial Conditions 1.5

91
Table 3.34 Design Factors for Calculating PUMS Standard Errors –North Carolina Characteristics Design Factor
POPULATION
Families and Nonfamilies 1.7
Population in Households by Race/Hispanic Origin of Householder 1.8
Population by Tenure 2.7
Age 1.0
Sex 1.0
Population of Two or More Races 2.1
White Alone 1.4
Black or African American Alone 1.1
American Indian or Alaska Native Alone, Asian Alone, Native Hawaiian or Other Pacific Islander Alone, or Some Other Race Alone 2.0
Hispanic or Latino 2.0
Marital Status 1.3
Marital History 1.2
Relationship 1.4
Ancestry 2.0
Grandparents Responsible for Grandchildren 1.8
Number of Women Who Had a Birth in the Past 12 Months 1.2
Language Spoken at Home and Ability to Speak English 1.3
Linguistic Isolation 1.9
Place of Birth, Year of Entry, and Citizenship Status 1.9
Residence 1 Year Ago 2.7
School Enrollment, Level of School, Type of School, and Field of Degree 1.3
Educational Attainment 1.4
Armed Forces Status and Veteran Status 1.2
Period of Military Service 1.4
Disability Status 1.2
Employment/Work Status 1.2
Industry, Occupation, and Class of Worker 1.5
Travel Time to Work 1.6
Means of Transportation to Work 1.5
Place of Work 1.4
Time Leaving Home to go to Work 1.6
Private Vehicle Occupancy 1.5
Work Experience, Hours Worked per Week, and Weeks Worked 1.3

92
Characteristics Design Factor
Number of Workers in Family 1.4
Presence of Own Children, Presence of People Under 18 Years, Presence of People 60 Years and Over, and Presence of People 65 Years and Over 1.5
Age of Own Children by Living Arrangements and Employment Status of Parents 1.7
Age of Householder 1.3
Race of Householder 1.5
Household, Family or Nonfamily Income 1.5
Person Earnings/Income 1.5
Type of Household Income 1.2
Poverty Status (Persons) 1.7
Poverty Status (Families/Households) 1.5
Ratio of Income to Poverty Level 2.6
Receipt of Food Stamps and Participation in Free/Reduced Price Meals 1.7
Health Insurance 1.7
HOUSING
Households/Occupied Housing Units 2.1
Family Type, Household Type, and Household Size 1.6
Households by Presence of Nonrelatives 2.2
Unmarried Partner Households 1.6
Tenure 1.5
Vacant 1.7
Rooms and Bedrooms 1.5
Occupants per Room 1.5
Units in Structure 1.5
Year Structure Built and Year Householder Moved Into Unit 1.4
House Heating Fuel 1.5
Telephone Service Available 1.5
Vehicles Available 1.5
Plumbing Facilities and Kitchen Facilities 2.0
Gross Rent, Gross Rent as a Percentage Of Household Income, and Contract Rent 1.6
Meals Included in Rent 1.5
Inclusion of Utilities in Rent 1.5
Value 1.4
Mortgage Status and Selected Monthly Owner Costs 1.4
Selected Physical and Financial Conditions 1.5

93
Table 3.35 Design Factors for Calculating PUMS Standard Errors –North Dakota Characteristics Design Factor
POPULATION
Families and Nonfamilies 1.3
Population in Households by Race/Hispanic Origin of Householder 1.5
Population by Tenure 1.9
Age 1.0
Sex 1.0
Population of Two or More Races 1.6
White Alone 1.0
Black or African American Alone 1.2
American Indian or Alaska Native Alone, Asian Alone, Native Hawaiian or Other Pacific Islander Alone, or Some Other Race Alone 1.2
Hispanic or Latino 1.2
Marital Status 1.2
Marital History 1.2
Relationship 1.2
Ancestry 2.0
Grandparents Responsible for Grandchildren 1.4
Number of Women Who Had a Birth in the Past 12 Months 1.3
Language Spoken at Home and Ability to Speak English 1.4
Linguistic Isolation 2.3
Place of Birth, Year of Entry, and Citizenship Status 1.7
Residence 1 Year Ago 2.0
School Enrollment, Level of School, Type of School, and Field of Degree 1.3
Educational Attainment 1.1
Armed Forces Status and Veteran Status 1.3
Period of Military Service 1.2
Disability Status 1.2
Employment/Work Status 1.2
Industry, Occupation, and Class of Worker 1.3
Travel Time to Work 1.4
Means of Transportation to Work 1.2
Place of Work 1.1
Time Leaving Home to go to Work 1.4
Private Vehicle Occupancy 1.5
Work Experience, Hours Worked per Week, and Weeks Worked 1.2

94
Characteristics Design Factor
Number of Workers in Family 1.2
Presence of Own Children, Presence of People Under 18 Years, Presence of People 60 Years and Over, and Presence of People 65 Years and Over 1.2
Age of Own Children by Living Arrangements and Employment Status of Parents 1.7
Age of Householder 1.0
Race of Householder 1.5
Household, Family or Nonfamily Income 1.5
Person Earnings/Income 1.3
Type of Household Income 1.4
Poverty Status (Persons) 1.6
Poverty Status (Families/Households) 1.3
Ratio of Income to Poverty Level 2.0
Receipt of Food Stamps and Participation in Free/Reduced Price Meals 1.3
Health Insurance 1.3
HOUSING
Households/Occupied Housing Units 1.5
Family Type, Household Type, and Household Size 1.3
Households by Presence of Nonrelatives 1.5
Unmarried Partner Households 1.4
Tenure 1.2
Vacant 1.3
Rooms and Bedrooms 1.3
Occupants per Room 1.3
Units in Structure 1.4
Year Structure Built and Year Householder Moved Into Unit 1.2
House Heating Fuel 1.1
Telephone Service Available 1.3
Vehicles Available 1.2
Plumbing Facilities and Kitchen Facilities 1.3
Gross Rent, Gross Rent as a Percentage Of Household Income, and Contract Rent 1.4
Meals Included in Rent 1.3
Inclusion of Utilities in Rent 1.4
Value 1.2
Mortgage Status and Selected Monthly Owner Costs 1.1
Selected Physical and Financial Conditions 1.3

95
Table 3.36 Design Factors for Calculating PUMS Standard Errors –Ohio Characteristics Design Factor
POPULATION
Families and Nonfamilies 1.5
Population in Households by Race/Hispanic Origin of Householder 1.8
Population by Tenure 2.7
Age 1.0
Sex 1.0
Population of Two or More Races 1.8
White Alone 2.0
Black or African American Alone 1.2
American Indian or Alaska Native Alone, Asian Alone, Native Hawaiian or Other Pacific Islander Alone, or Some Other Race Alone 2.0
Hispanic or Latino 2.0
Marital Status 1.3
Marital History 1.2
Relationship 1.4
Ancestry 1.9
Grandparents Responsible for Grandchildren 1.8
Number of Women Who Had a Birth in the Past 12 Months 1.2
Language Spoken at Home and Ability to Speak English 1.4
Linguistic Isolation 2.6
Place of Birth, Year of Entry, and Citizenship Status 1.8
Residence 1 Year Ago 2.7
School Enrollment, Level of School, Type of School, and Field of Degree 1.3
Educational Attainment 1.3
Armed Forces Status and Veteran Status 1.2
Period of Military Service 1.3
Disability Status 1.2
Employment/Work Status 1.2
Industry, Occupation, and Class of Worker 1.4
Travel Time to Work 1.5
Means of Transportation to Work 1.5
Place of Work 1.4
Time Leaving Home to go to Work 1.5
Private Vehicle Occupancy 1.5
Work Experience, Hours Worked per Week, and Weeks Worked 1.3

96
Characteristics Design Factor
Number of Workers in Family 1.4
Presence of Own Children, Presence of People Under 18 Years, Presence of People 60 Years and Over, and Presence of People 65 Years and Over 1.4
Age of Own Children by Living Arrangements and Employment Status of Parents 1.7
Age of Householder 1.3
Race of Householder 1.5
Household, Family or Nonfamily Income 1.5
Person Earnings/Income 1.5
Type of Household Income 1.2
Poverty Status (Persons) 1.7
Poverty Status (Families/Households) 1.4
Ratio of Income to Poverty Level 2.5
Receipt of Food Stamps and Participation in Free/Reduced Price Meals 1.7
Health Insurance 1.6
HOUSING
Households/Occupied Housing Units 2.2
Family Type, Household Type, and Household Size 1.5
Households by Presence of Nonrelatives 2.2
Unmarried Partner Households 1.5
Tenure 1.4
Vacant 1.7
Rooms and Bedrooms 1.4
Occupants per Room 1.4
Units in Structure 1.5
Year Structure Built and Year Householder Moved Into Unit 1.4
House Heating Fuel 1.4
Telephone Service Available 1.5
Vehicles Available 1.4
Plumbing Facilities and Kitchen Facilities 2.2
Gross Rent, Gross Rent as a Percentage Of Household Income, and Contract Rent 1.5
Meals Included in Rent 1.5
Inclusion of Utilities in Rent 1.5
Value 1.3
Mortgage Status and Selected Monthly Owner Costs 1.3
Selected Physical and Financial Conditions 1.4

97
Table 3.37 Design Factors for Calculating PUMS Standard Errors –Oklahoma Characteristics Design Factor
POPULATION
Families and Nonfamilies 1.3
Population in Households by Race/Hispanic Origin of Householder 1.7
Population by Tenure 2.0
Age 1.0
Sex 1.0
Population of Two or More Races 1.6
White Alone 1.3
Black or African American Alone 1.1
American Indian or Alaska Native Alone, Asian Alone, Native Hawaiian or Other Pacific Islander Alone, or Some Other Race Alone 1.3
Hispanic or Latino 1.5
Marital Status 1.1
Marital History 1.1
Relationship 1.2
Ancestry 1.6
Grandparents Responsible for Grandchildren 1.3
Number of Women Who Had a Birth in the Past 12 Months 1.2
Language Spoken at Home and Ability to Speak English 1.2
Linguistic Isolation 1.9
Place of Birth, Year of Entry, and Citizenship Status 1.6
Residence 1 Year Ago 2.1
School Enrollment, Level of School, Type of School, and Field of Degree 1.2
Educational Attainment 1.2
Armed Forces Status and Veteran Status 1.2
Period of Military Service 1.1
Disability Status 1.2
Employment/Work Status 1.2
Industry, Occupation, and Class of Worker 1.2
Travel Time to Work 1.4
Means of Transportation to Work 1.4
Place of Work 1.2
Time Leaving Home to go to Work 1.3
Private Vehicle Occupancy 1.5
Work Experience, Hours Worked per Week, and Weeks Worked 1.1

98
Characteristics Design Factor
Number of Workers in Family 1.2
Presence of Own Children, Presence of People Under 18 Years, Presence of People 60 Years and Over, and Presence of People 65 Years and Over 1.1
Age of Own Children by Living Arrangements and Employment Status of Parents 1.6
Age of Householder 1.1
Race of Householder 1.1
Household, Family or Nonfamily Income 1.5
Person Earnings/Income 1.3
Type of Household Income 1.2
Poverty Status (Persons) 1.7
Poverty Status (Families/Households) 1.2
Ratio of Income to Poverty Level 2.1
Receipt of Food Stamps and Participation in Free/Reduced Price Meals 1.4
Health Insurance 1.3
HOUSING
Households/Occupied Housing Units 1.4
Family Type, Household Type, and Household Size 1.2
Households by Presence of Nonrelatives 1.7
Unmarried Partner Households 1.3
Tenure 1.1
Vacant 1.2
Rooms and Bedrooms 1.2
Occupants per Room 1.1
Units in Structure 1.2
Year Structure Built and Year Householder Moved Into Unit 1.1
House Heating Fuel 1.1
Telephone Service Available 1.1
Vehicles Available 1.2
Plumbing Facilities and Kitchen Facilities 1.4
Gross Rent, Gross Rent as a Percentage Of Household Income, and Contract Rent 1.3
Meals Included in Rent 1.2
Inclusion of Utilities in Rent 1.1
Value 1.1
Mortgage Status and Selected Monthly Owner Costs 1.1
Selected Physical and Financial Conditions 1.2

99
Table 3.38 Design Factors for Calculating PUMS Standard Errors –Oregon Characteristics Design Factor
POPULATION
Families and Nonfamilies 1.6
Population in Households by Race/Hispanic Origin of Householder 1.8
Population by Tenure 2.7
Age 1.0
Sex 1.0
Population of Two or More Races 2.0
White Alone 2.0
Black or African American Alone 1.1
American Indian or Alaska Native Alone, Asian Alone, Native Hawaiian or Other Pacific Islander Alone, or Some Other Race Alone 2.0
Hispanic or Latino 2.0
Marital Status 1.3
Marital History 1.3
Relationship 1.4
Ancestry 2.0
Grandparents Responsible for Grandchildren 1.8
Number of Women Who Had a Birth in the Past 12 Months 1.3
Language Spoken at Home and Ability to Speak English 1.8
Linguistic Isolation 2.2
Place of Birth, Year of Entry, and Citizenship Status 1.9
Residence 1 Year Ago 2.7
School Enrollment, Level of School, Type of School, and Field of Degree 1.3
Educational Attainment 1.4
Armed Forces Status and Veteran Status 1.2
Period of Military Service 1.3
Disability Status 1.2
Employment/Work Status 1.2
Industry, Occupation, and Class of Worker 1.5
Travel Time to Work 1.6
Means of Transportation to Work 1.5
Place of Work 1.4
Time Leaving Home to go to Work 1.6
Private Vehicle Occupancy 1.5
Work Experience, Hours Worked per Week, and Weeks Worked 1.3
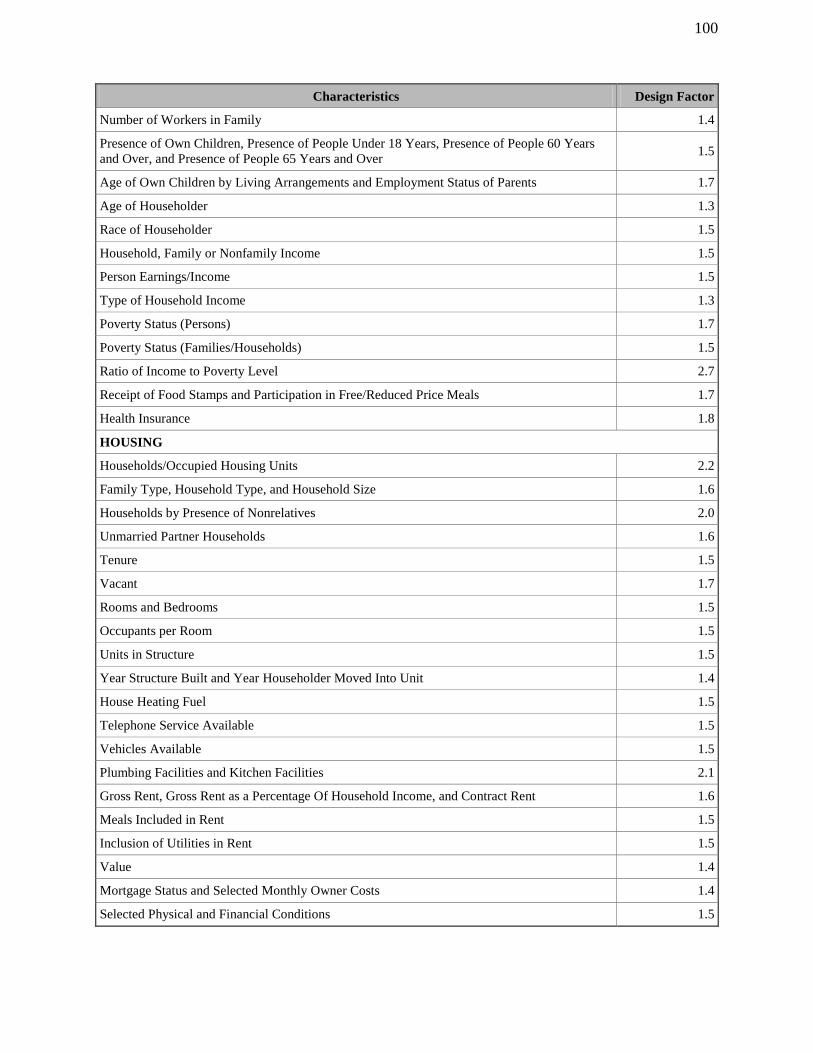
100
Characteristics Design Factor
Number of Workers in Family 1.4
Presence of Own Children, Presence of People Under 18 Years, Presence of People 60 Years and Over, and Presence of People 65 Years and Over 1.5
Age of Own Children by Living Arrangements and Employment Status of Parents 1.7
Age of Householder 1.3
Race of Householder 1.5
Household, Family or Nonfamily Income 1.5
Person Earnings/Income 1.5
Type of Household Income 1.3
Poverty Status (Persons) 1.7
Poverty Status (Families/Households) 1.5
Ratio of Income to Poverty Level 2.7
Receipt of Food Stamps and Participation in Free/Reduced Price Meals 1.7
Health Insurance 1.8
HOUSING
Households/Occupied Housing Units 2.2
Family Type, Household Type, and Household Size 1.6
Households by Presence of Nonrelatives 2.0
Unmarried Partner Households 1.6
Tenure 1.5
Vacant 1.7
Rooms and Bedrooms 1.5
Occupants per Room 1.5
Units in Structure 1.5
Year Structure Built and Year Householder Moved Into Unit 1.4
House Heating Fuel 1.5
Telephone Service Available 1.5
Vehicles Available 1.5
Plumbing Facilities and Kitchen Facilities 2.1
Gross Rent, Gross Rent as a Percentage Of Household Income, and Contract Rent 1.6
Meals Included in Rent 1.5
Inclusion of Utilities in Rent 1.5
Value 1.4
Mortgage Status and Selected Monthly Owner Costs 1.4
Selected Physical and Financial Conditions 1.5
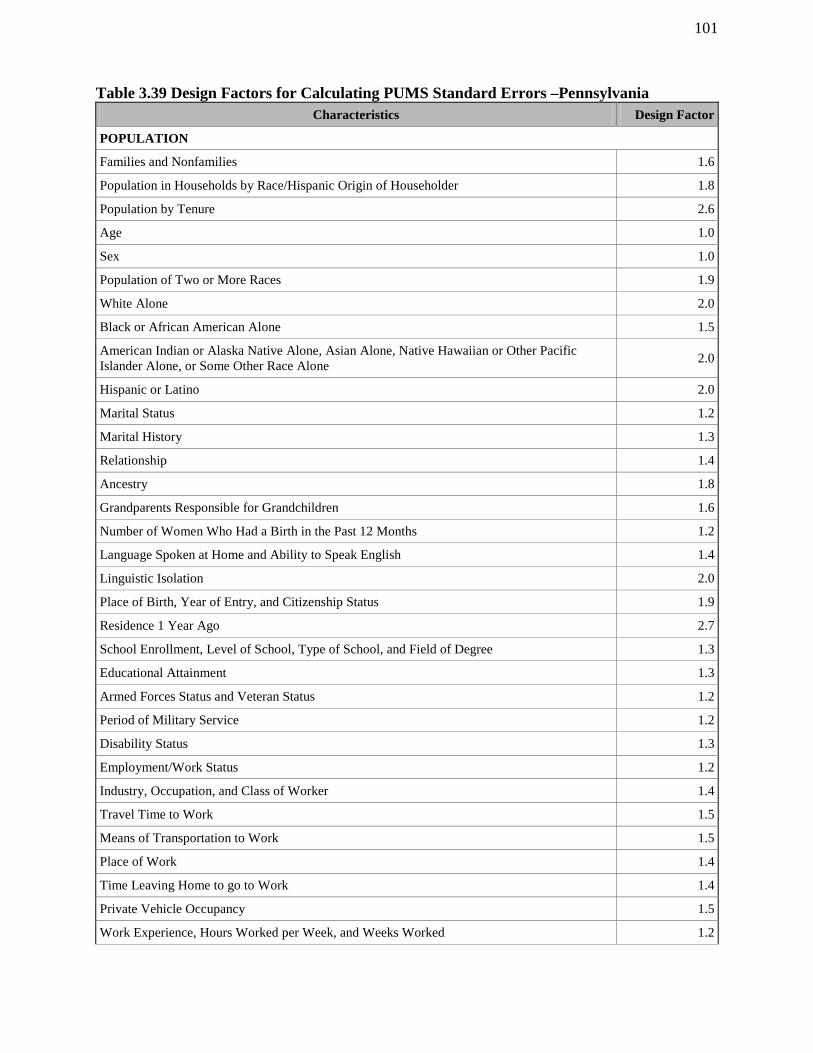
101
Table 3.39 Design Factors for Calculating PUMS Standard Errors –Pennsylvania Characteristics Design Factor
POPULATION
Families and Nonfamilies 1.6
Population in Households by Race/Hispanic Origin of Householder 1.8
Population by Tenure 2.6
Age 1.0
Sex 1.0
Population of Two or More Races 1.9
White Alone 2.0
Black or African American Alone 1.5
American Indian or Alaska Native Alone, Asian Alone, Native Hawaiian or Other Pacific Islander Alone, or Some Other Race Alone 2.0
Hispanic or Latino 2.0
Marital Status 1.2
Marital History 1.3
Relationship 1.4
Ancestry 1.8
Grandparents Responsible for Grandchildren 1.6
Number of Women Who Had a Birth in the Past 12 Months 1.2
Language Spoken at Home and Ability to Speak English 1.4
Linguistic Isolation 2.0
Place of Birth, Year of Entry, and Citizenship Status 1.9
Residence 1 Year Ago 2.7
School Enrollment, Level of School, Type of School, and Field of Degree 1.3
Educational Attainment 1.3
Armed Forces Status and Veteran Status 1.2
Period of Military Service 1.2
Disability Status 1.3
Employment/Work Status 1.2
Industry, Occupation, and Class of Worker 1.4
Travel Time to Work 1.5
Means of Transportation to Work 1.5
Place of Work 1.4
Time Leaving Home to go to Work 1.4
Private Vehicle Occupancy 1.5
Work Experience, Hours Worked per Week, and Weeks Worked 1.2

102
Characteristics Design Factor
Number of Workers in Family 1.3
Presence of Own Children, Presence of People Under 18 Years, Presence of People 60 Years and Over, and Presence of People 65 Years and Over 1.3
Age of Own Children by Living Arrangements and Employment Status of Parents 1.6
Age of Householder 1.2
Race of Householder 1.5
Household, Family or Nonfamily Income 1.5
Person Earnings/Income 1.4
Type of Household Income 1.2
Poverty Status (Persons) 1.7
Poverty Status (Families/Households) 1.4
Ratio of Income to Poverty Level 2.4
Receipt of Food Stamps and Participation in Free/Reduced Price Meals 1.7
Health Insurance 1.7
HOUSING
Households/Occupied Housing Units 2.2
Family Type, Household Type, and Household Size 1.4
Households by Presence of Nonrelatives 2.1
Unmarried Partner Households 1.4
Tenure 1.4
Vacant 1.6
Rooms and Bedrooms 1.4
Occupants per Room 1.4
Units in Structure 1.4
Year Structure Built and Year Householder Moved Into Unit 1.3
House Heating Fuel 1.3
Telephone Service Available 1.4
Vehicles Available 1.3
Plumbing Facilities and Kitchen Facilities 2.2
Gross Rent, Gross Rent as a Percentage Of Household Income, and Contract Rent 1.5
Meals Included in Rent 1.4
Inclusion of Utilities in Rent 1.5
Value 1.2
Mortgage Status and Selected Monthly Owner Costs 1.2
Selected Physical and Financial Conditions 1.4

103
Table 3.40 Design Factors for Calculating PUMS Standard Errors –Rhode Island Characteristics Design Factor
POPULATION
Families and Nonfamilies 1.6
Population in Households by Race/Hispanic Origin of Householder 1.8
Population by Tenure 2.4
Age 1.0
Sex 1.0
Population of Two or More Races 1.8
White Alone 1.9
Black or African American Alone 1.1
American Indian or Alaska Native Alone, Asian Alone, Native Hawaiian or Other Pacific Islander Alone, or Some Other Race Alone 2.0
Hispanic or Latino 2.0
Marital Status 1.3
Marital History 1.2
Relationship 1.4
Ancestry 2.0
Grandparents Responsible for Grandchildren 1.7
Number of Women Who Had a Birth in the Past 12 Months 1.2
Language Spoken at Home and Ability to Speak English 1.3
Linguistic Isolation 1.6
Place of Birth, Year of Entry, and Citizenship Status 1.9
Residence 1 Year Ago 2.5
School Enrollment, Level of School, Type of School, and Field of Degree 1.2
Educational Attainment 1.4
Armed Forces Status and Veteran Status 1.2
Period of Military Service 1.3
Disability Status 1.2
Employment/Work Status 1.1
Industry, Occupation, and Class of Worker 1.5
Travel Time to Work 1.6
Means of Transportation to Work 1.5
Place of Work 1.4
Time Leaving Home to go to Work 1.6
Private Vehicle Occupancy 1.5
Work Experience, Hours Worked per Week, and Weeks Worked 1.3

104
Characteristics Design Factor
Number of Workers in Family 1.4
Presence of Own Children, Presence of People Under 18 Years, Presence of People 60 Years and Over, and Presence of People 65 Years and Over 1.4
Age of Own Children by Living Arrangements and Employment Status of Parents 1.7
Age of Householder 1.3
Race of Householder 1.5
Household, Family or Nonfamily Income 1.5
Person Earnings/Income 1.5
Type of Household Income 1.2
Poverty Status (Persons) 1.7
Poverty Status (Families/Households) 1.5
Ratio of Income to Poverty Level 2.5
Receipt of Food Stamps and Participation in Free/Reduced Price Meals 1.6
Health Insurance 1.3
HOUSING
Households/Occupied Housing Units 1.8
Family Type, Household Type, and Household Size 1.6
Households by Presence of Nonrelatives 1.9
Unmarried Partner Households 1.6
Tenure 1.4
Vacant 1.6
Rooms and Bedrooms 1.5
Occupants per Room 1.5
Units in Structure 1.5
Year Structure Built and Year Householder Moved Into Unit 1.4
House Heating Fuel 1.5
Telephone Service Available 1.4
Vehicles Available 1.5
Plumbing Facilities and Kitchen Facilities 1.8
Gross Rent, Gross Rent as a Percentage Of Household Income, and Contract Rent 1.6
Meals Included in Rent 1.4
Inclusion of Utilities in Rent 1.5
Value 1.4
Mortgage Status and Selected Monthly Owner Costs 1.4
Selected Physical and Financial Conditions 1.5

105
Table 3.41 Design Factors for Calculating PUMS Standard Errors –South Carolina Characteristics Design Factor
POPULATION
Families and Nonfamilies 1.7
Population in Households by Race/Hispanic Origin of Householder 1.6
Population by Tenure 2.6
Age 1.0
Sex 1.0
Population of Two or More Races 2.1
White Alone 1.0
Black or African American Alone 1.0
American Indian or Alaska Native Alone, Asian Alone, Native Hawaiian or Other Pacific Islander Alone, or Some Other Race Alone 2.0
Hispanic or Latino 2.0
Marital Status 1.3
Marital History 1.3
Relationship 1.4
Ancestry 2.0
Grandparents Responsible for Grandchildren 1.8
Number of Women Who Had a Birth in the Past 12 Months 1.2
Language Spoken at Home and Ability to Speak English 1.4
Linguistic Isolation 2.2
Place of Birth, Year of Entry, and Citizenship Status 1.9
Residence 1 Year Ago 2.8
School Enrollment, Level of School, Type of School, and Field of Degree 1.3
Educational Attainment 1.4
Armed Forces Status and Veteran Status 1.2
Period of Military Service 1.4
Disability Status 1.2
Employment/Work Status 1.2
Industry, Occupation, and Class of Worker 1.5
Travel Time to Work 1.6
Means of Transportation to Work 1.5
Place of Work 1.4
Time Leaving Home to go to Work 1.6
Private Vehicle Occupancy 1.5
Work Experience, Hours Worked per Week, and Weeks Worked 1.3

106
Characteristics Design Factor
Number of Workers in Family 1.4
Presence of Own Children, Presence of People Under 18 Years, Presence of People 60 Years and Over, and Presence of People 65 Years and Over 1.5
Age of Own Children by Living Arrangements and Employment Status of Parents 1.7
Age of Householder 1.3
Race of Householder 1.5
Household, Family or Nonfamily Income 1.5
Person Earnings/Income 1.5
Type of Household Income 1.2
Poverty Status (Persons) 1.7
Poverty Status (Families/Households) 1.5
Ratio of Income to Poverty Level 2.7
Receipt of Food Stamps and Participation in Free/Reduced Price Meals 1.7
Health Insurance 1.6
HOUSING
Households/Occupied Housing Units 1.9
Family Type, Household Type, and Household Size 1.6
Households by Presence of Nonrelatives 2.2
Unmarried Partner Households 1.6
Tenure 1.4
Vacant 1.7
Rooms and Bedrooms 1.5
Occupants per Room 1.5
Units in Structure 1.5
Year Structure Built and Year Householder Moved Into Unit 1.4
House Heating Fuel 1.5
Telephone Service Available 1.5
Vehicles Available 1.5
Plumbing Facilities and Kitchen Facilities 1.9
Gross Rent, Gross Rent as a Percentage Of Household Income, and Contract Rent 1.6
Meals Included in Rent 1.5
Inclusion of Utilities in Rent 1.5
Value 1.4
Mortgage Status and Selected Monthly Owner Costs 1.4
Selected Physical and Financial Conditions 1.5

107
Table 3.42 Design Factors for Calculating PUMS Standard Errors –South Dakota Characteristics Design Factor
POPULATION
Families and Nonfamilies 1.4
Population in Households by Race/Hispanic Origin of Householder 1.5
Population by Tenure 2.1
Age 1.0
Sex 1.0
Population of Two or More Races 1.9
White Alone 1.2
Black or African American Alone 1.1
American Indian or Alaska Native Alone, Asian Alone, Native Hawaiian or Other Pacific Islander Alone, or Some Other Race Alone 1.1
Hispanic or Latino 1.5
Marital Status 1.1
Marital History 1.0
Relationship 1.2
Ancestry 2.0
Grandparents Responsible for Grandchildren 1.2
Number of Women Who Had a Birth in the Past 12 Months 1.3
Language Spoken at Home and Ability to Speak English 1.4
Linguistic Isolation 2.2
Place of Birth, Year of Entry, and Citizenship Status 1.7
Residence 1 Year Ago 2.1
School Enrollment, Level of School, Type of School, and Field of Degree 1.2
Educational Attainment 1.2
Armed Forces Status and Veteran Status 1.2
Period of Military Service 1.2
Disability Status 1.3
Employment/Work Status 1.2
Industry, Occupation, and Class of Worker 1.3
Travel Time to Work 1.4
Means of Transportation to Work 1.3
Place of Work 1.2
Time Leaving Home to go to Work 1.4
Private Vehicle Occupancy 1.4
Work Experience, Hours Worked per Week, and Weeks Worked 1.2

108
Characteristics Design Factor
Number of Workers in Family 1.2
Presence of Own Children, Presence of People Under 18 Years, Presence of People 60 Years and Over, and Presence of People 65 Years and Over 1.2
Age of Own Children by Living Arrangements and Employment Status of Parents 1.7
Age of Householder 1.1
Race of Householder 1.5
Household, Family or Nonfamily Income 1.5
Person Earnings/Income 1.3
Type of Household Income 1.4
Poverty Status (Persons) 1.7
Poverty Status (Families/Households) 1.3
Ratio of Income to Poverty Level 2.1
Receipt of Food Stamps and Participation in Free/Reduced Price Meals 1.4
Health Insurance 1.3
HOUSING
Households/Occupied Housing Units 1.7
Family Type, Household Type, and Household Size 1.3
Households by Presence of Nonrelatives 1.7
Unmarried Partner Households 1.4
Tenure 1.2
Vacant 1.5
Rooms and Bedrooms 1.3
Occupants per Room 1.3
Units in Structure 1.4
Year Structure Built and Year Householder Moved Into Unit 1.2
House Heating Fuel 1.2
Telephone Service Available 1.3
Vehicles Available 1.3
Plumbing Facilities and Kitchen Facilities 1.5
Gross Rent, Gross Rent as a Percentage Of Household Income, and Contract Rent 1.4
Meals Included in Rent 1.4
Inclusion of Utilities in Rent 1.4
Value 1.2
Mortgage Status and Selected Monthly Owner Costs 1.2
Selected Physical and Financial Conditions 1.3

109
Table 3.43 Design Factors for Calculating PUMS Standard Errors –Tennessee Characteristics Design Factor
POPULATION
Families and Nonfamilies 1.7
Population in Households by Race/Hispanic Origin of Householder 1.8
Population by Tenure 2.8
Age 1.0
Sex 1.0
Population of Two or More Races 1.9
White Alone 2.0
Black or African American Alone 1.1
American Indian or Alaska Native Alone, Asian Alone, Native Hawaiian or Other Pacific Islander Alone, or Some Other Race Alone 2.0
Hispanic or Latino 2.0
Marital Status 1.3
Marital History 1.2
Relationship 1.4
Ancestry 2.0
Grandparents Responsible for Grandchildren 1.8
Number of Women Who Had a Birth in the Past 12 Months 1.3
Language Spoken at Home and Ability to Speak English 1.3
Linguistic Isolation 2.9
Place of Birth, Year of Entry, and Citizenship Status 1.9
Residence 1 Year Ago 2.6
School Enrollment, Level of School, Type of School, and Field of Degree 1.3
Educational Attainment 1.4
Armed Forces Status and Veteran Status 1.2
Period of Military Service 1.4
Disability Status 1.2
Employment/Work Status 1.2
Industry, Occupation, and Class of Worker 1.5
Travel Time to Work 1.6
Means of Transportation to Work 1.5
Place of Work 1.4
Time Leaving Home to go to Work 1.6
Private Vehicle Occupancy 1.5
Work Experience, Hours Worked per Week, and Weeks Worked 1.3

110
Characteristics Design Factor
Number of Workers in Family 1.4
Presence of Own Children, Presence of People Under 18 Years, Presence of People 60 Years and Over, and Presence of People 65 Years and Over 1.5
Age of Own Children by Living Arrangements and Employment Status of Parents 1.7
Age of Householder 1.3
Race of Householder 1.5
Household, Family or Nonfamily Income 1.5
Person Earnings/Income 1.5
Type of Household Income 1.2
Poverty Status (Persons) 1.7
Poverty Status (Families/Households) 1.5
Ratio of Income to Poverty Level 2.7
Receipt of Food Stamps and Participation in Free/Reduced Price Meals 1.7
Health Insurance 1.7
HOUSING
Households/Occupied Housing Units 2.1
Family Type, Household Type, and Household Size 1.6
Households by Presence of Nonrelatives 2.2
Unmarried Partner Households 1.6
Tenure 1.5
Vacant 1.7
Rooms and Bedrooms 1.5
Occupants per Room 1.5
Units in Structure 1.5
Year Structure Built and Year Householder Moved Into Unit 1.4
House Heating Fuel 1.5
Telephone Service Available 1.5
Vehicles Available 1.5
Plumbing Facilities and Kitchen Facilities 2.1
Gross Rent, Gross Rent as a Percentage Of Household Income, and Contract Rent 1.6
Meals Included in Rent 1.5
Inclusion of Utilities in Rent 1.5
Value 1.4
Mortgage Status and Selected Monthly Owner Costs 1.4
Selected Physical and Financial Conditions 1.5

111
Table 3.44 Design Factors for Calculating PUMS Standard Errors –Texas Characteristics Design Factor
POPULATION
Families and Nonfamilies 1.7
Population in Households by Race/Hispanic Origin of Householder 1.8
Population by Tenure 2.9
Age 1.0
Sex 1.0
Population of Two or More Races 2.1
White Alone 2.0
Black or African American Alone 1.7
American Indian or Alaska Native Alone, Asian Alone, Native Hawaiian or Other Pacific Islander Alone, or Some Other Race Alone 2.0
Hispanic or Latino 2.0
Marital Status 1.3
Marital History 1.4
Relationship 1.4
Ancestry 2.0
Grandparents Responsible for Grandchildren 1.8
Number of Women Who Had a Birth in the Past 12 Months 1.3
Language Spoken at Home and Ability to Speak English 1.8
Linguistic Isolation 1.6
Place of Birth, Year of Entry, and Citizenship Status 1.9
Residence 1 Year Ago 2.8
School Enrollment, Level of School, Type of School, and Field of Degree 1.3
Educational Attainment 1.4
Armed Forces Status and Veteran Status 1.4
Period of Military Service 1.4
Disability Status 1.3
Employment/Work Status 1.3
Industry, Occupation, and Class of Worker 1.5
Travel Time to Work 1.6
Means of Transportation to Work 1.5
Place of Work 1.4
Time Leaving Home to go to Work 1.6
Private Vehicle Occupancy 1.5
Work Experience, Hours Worked per Week, and Weeks Worked 1.3

112
Characteristics Design Factor
Number of Workers in Family 1.4
Presence of Own Children, Presence of People Under 18 Years, Presence of People 60 Years and Over, and Presence of People 65 Years and Over 1.5
Age of Own Children by Living Arrangements and Employment Status of Parents 1.7
Age of Householder 1.3
Race of Householder 1.5
Household, Family or Nonfamily Income 1.6
Person Earnings/Income 1.5
Type of Household Income 1.2
Poverty Status (Persons) 2.0
Poverty Status (Families/Households) 1.5
Ratio of Income to Poverty Level 2.7
Receipt of Food Stamps and Participation in Free/Reduced Price Meals 1.7
Health Insurance 1.5
HOUSING
Households/Occupied Housing Units 2.2
Family Type, Household Type, and Household Size 1.6
Households by Presence of Nonrelatives 2.2
Unmarried Partner Households 1.6
Tenure 1.5
Vacant 1.7
Rooms and Bedrooms 1.5
Occupants per Room 1.5
Units in Structure 1.5
Year Structure Built and Year Householder Moved Into Unit 1.4
House Heating Fuel 1.5
Telephone Service Available 1.5
Vehicles Available 1.5
Plumbing Facilities and Kitchen Facilities 2.2
Gross Rent, Gross Rent as a Percentage Of Household Income, and Contract Rent 1.6
Meals Included in Rent 1.5
Inclusion of Utilities in Rent 1.5
Value 1.4
Mortgage Status and Selected Monthly Owner Costs 1.4
Selected Physical and Financial Conditions 1.5

113
Table 3.45 Design Factors for Calculating PUMS Standard Errors –Utah Characteristics Design Factor
POPULATION
Families and Nonfamilies 1.6
Population in Households by Race/Hispanic Origin of Householder 1.8
Population by Tenure 2.9
Age 1.0
Sex 1.0
Population of Two or More Races 1.9
White Alone 2.2
Black or African American Alone 1.1
American Indian or Alaska Native Alone, Asian Alone, Native Hawaiian or Other Pacific Islander Alone, or Some Other Race Alone 2.0
Hispanic or Latino 2.0
Marital Status 1.3
Marital History 1.2
Relationship 1.4
Ancestry 2.0
Grandparents Responsible for Grandchildren 1.7
Number of Women Who Had a Birth in the Past 12 Months 1.3
Language Spoken at Home and Ability to Speak English 1.7
Linguistic Isolation 2.1
Place of Birth, Year of Entry, and Citizenship Status 1.9
Residence 1 Year Ago 2.7
School Enrollment, Level of School, Type of School, and Field of Degree 1.3
Educational Attainment 1.4
Armed Forces Status and Veteran Status 1.2
Period of Military Service 1.3
Disability Status 1.3
Employment/Work Status 1.2
Industry, Occupation, and Class of Worker 1.5
Travel Time to Work 1.5
Means of Transportation to Work 1.5
Place of Work 1.4
Time Leaving Home to go to Work 1.5
Private Vehicle Occupancy 1.5
Work Experience, Hours Worked per Week, and Weeks Worked 1.3

114
Characteristics Design Factor
Number of Workers in Family 1.4
Presence of Own Children, Presence of People Under 18 Years, Presence of People 60 Years and Over, and Presence of People 65 Years and Over 1.4
Age of Own Children by Living Arrangements and Employment Status of Parents 1.7
Age of Householder 1.3
Race of Householder 1.5
Household, Family or Nonfamily Income 1.5
Person Earnings/Income 1.5
Type of Household Income 1.2
Poverty Status (Persons) 1.7
Poverty Status (Families/Households) 1.5
Ratio of Income to Poverty Level 2.7
Receipt of Food Stamps and Participation in Free/Reduced Price Meals 1.7
Health Insurance 1.8
HOUSING
Households/Occupied Housing Units 2.0
Family Type, Household Type, and Household Size 1.5
Households by Presence of Nonrelatives 2.0
Unmarried Partner Households 1.5
Tenure 1.5
Vacant 1.6
Rooms and Bedrooms 1.4
Occupants per Room 1.4
Units in Structure 1.5
Year Structure Built and Year Householder Moved Into Unit 1.4
House Heating Fuel 1.5
Telephone Service Available 1.5
Vehicles Available 1.4
Plumbing Facilities and Kitchen Facilities 2.0
Gross Rent, Gross Rent as a Percentage Of Household Income, and Contract Rent 1.5
Meals Included in Rent 1.5
Inclusion of Utilities in Rent 1.4
Value 1.3
Mortgage Status and Selected Monthly Owner Costs 1.3
Selected Physical and Financial Conditions 1.5

115
Table 3.46 Design Factors for Calculating PUMS Standard Errors –Vermont Characteristics Design Factor
POPULATION
Families and Nonfamilies 1.3
Population in Households by Race/Hispanic Origin of Householder 1.3
Population by Tenure 1.8
Age 1.0
Sex 1.0
Population of Two or More Races 1.3
White Alone 1.0
Black or African American Alone 1.0
American Indian or Alaska Native Alone, Asian Alone, Native Hawaiian or Other Pacific Islander Alone, or Some Other Race Alone 1.0
Hispanic or Latino 1.2
Marital Status 1.1
Marital History 1.2
Relationship 1.1
Ancestry 1.5
Grandparents Responsible for Grandchildren 1.8
Number of Women Who Had a Birth in the Past 12 Months 1.0
Language Spoken at Home and Ability to Speak English 1.4
Linguistic Isolation 2.4
Place of Birth, Year of Entry, and Citizenship Status 1.4
Residence 1 Year Ago 1.9
School Enrollment, Level of School, Type of School, and Field of Degree 1.1
Educational Attainment 1.1
Armed Forces Status and Veteran Status 1.2
Period of Military Service 1.2
Disability Status 1.2
Employment/Work Status 1.1
Industry, Occupation, and Class of Worker 1.2
Travel Time to Work 1.3
Means of Transportation to Work 1.2
Place of Work 1.2
Time Leaving Home to go to Work 1.3
Private Vehicle Occupancy 1.5
Work Experience, Hours Worked per Week, and Weeks Worked 1.2

116
Characteristics Design Factor
Number of Workers in Family 1.2
Presence of Own Children, Presence of People Under 18 Years, Presence of People 60 Years and Over, and Presence of People 65 Years and Over 1.1
Age of Own Children by Living Arrangements and Employment Status of Parents 1.7
Age of Householder 1.0
Race of Householder 1.5
Household, Family or Nonfamily Income 1.5
Person Earnings/Income 1.2
Type of Household Income 1.0
Poverty Status (Persons) 1.6
Poverty Status (Families/Households) 1.3
Ratio of Income to Poverty Level 1.9
Receipt of Food Stamps and Participation in Free/Reduced Price Meals 1.4
Health Insurance 1.3
HOUSING
Households/Occupied Housing Units 1.2
Family Type, Household Type, and Household Size 1.3
Households by Presence of Nonrelatives 1.5
Unmarried Partner Households 1.3
Tenure 1.1
Vacant 1.2
Rooms and Bedrooms 1.2
Occupants per Room 1.1
Units in Structure 1.3
Year Structure Built and Year Householder Moved Into Unit 1.2
House Heating Fuel 1.2
Telephone Service Available 1.1
Vehicles Available 1.2
Plumbing Facilities and Kitchen Facilities 1.0
Gross Rent, Gross Rent as a Percentage Of Household Income, and Contract Rent 1.3
Meals Included in Rent 1.2
Inclusion of Utilities in Rent 1.2
Value 1.2
Mortgage Status and Selected Monthly Owner Costs 1.1
Selected Physical and Financial Conditions 1.1

117
Table 3.47 Design Factors for Calculating PUMS Standard Errors –Virginia Characteristics Design Factor
POPULATION
Families and Nonfamilies 1.7
Population in Households by Race/Hispanic Origin of Householder 1.8
Population by Tenure 2.7
Age 1.0
Sex 1.0
Population of Two or More Races 2.1
White Alone 1.4
Black or African American Alone 1.1
American Indian or Alaska Native Alone, Asian Alone, Native Hawaiian or Other Pacific Islander Alone, or Some Other Race Alone 2.0
Hispanic or Latino 2.0
Marital Status 1.3
Marital History 1.3
Relationship 1.4
Ancestry 2.0
Grandparents Responsible for Grandchildren 1.7
Number of Women Who Had a Birth in the Past 12 Months 1.2
Language Spoken at Home and Ability to Speak English 1.5
Linguistic Isolation 2.0
Place of Birth, Year of Entry, and Citizenship Status 1.9
Residence 1 Year Ago 2.7
School Enrollment, Level of School, Type of School, and Field of Degree 1.3
Educational Attainment 1.4
Armed Forces Status and Veteran Status 1.2
Period of Military Service 1.4
Disability Status 1.2
Employment/Work Status 1.2
Industry, Occupation, and Class of Worker 1.5
Travel Time to Work 1.6
Means of Transportation to Work 1.5
Place of Work 1.4
Time Leaving Home to go to Work 1.6
Private Vehicle Occupancy 1.5
Work Experience, Hours Worked per Week, and Weeks Worked 1.3

118
Characteristics Design Factor
Number of Workers in Family 1.4
Presence of Own Children, Presence of People Under 18 Years, Presence of People 60 Years and Over, and Presence of People 65 Years and Over 1.5
Age of Own Children by Living Arrangements and Employment Status of Parents 1.6
Age of Householder 1.3
Race of Householder 1.5
Household, Family or Nonfamily Income 1.5
Person Earnings/Income 1.5
Type of Household Income 1.2
Poverty Status (Persons) 1.7
Poverty Status (Families/Households) 1.5
Ratio of Income to Poverty Level 2.6
Receipt of Food Stamps and Participation in Free/Reduced Price Meals 1.7
Health Insurance 1.6
HOUSING
Households/Occupied Housing Units 2.2
Family Type, Household Type, and Household Size 1.6
Households by Presence of Nonrelatives 2.2
Unmarried Partner Households 1.5
Tenure 1.5
Vacant 1.7
Rooms and Bedrooms 1.5
Occupants per Room 1.5
Units in Structure 1.5
Year Structure Built and Year Householder Moved Into Unit 1.4
House Heating Fuel 1.4
Telephone Service Available 1.5
Vehicles Available 1.5
Plumbing Facilities and Kitchen Facilities 2.2
Gross Rent, Gross Rent as a Percentage Of Household Income, and Contract Rent 1.6
Meals Included in Rent 1.5
Inclusion of Utilities in Rent 1.5
Value 1.3
Mortgage Status and Selected Monthly Owner Costs 1.4
Selected Physical and Financial Conditions 1.5

119
Table 3.48 Design Factors for Calculating PUMS Standard Errors –Washington
Characteristics Design Factor
POPULATION
Families and Nonfamilies 1.7
Population in Households by Race/Hispanic Origin of Householder 1.8
Population by Tenure 2.8
Age 1.0
Sex 1.0
Population of Two or More Races 2.0
White Alone 2.0
Black or African American Alone 1.2
American Indian or Alaska Native Alone, Asian Alone, Native Hawaiian or Other Pacific Islander Alone, or Some Other Race Alone 2.0
Hispanic or Latino 2.0
Marital Status 1.3
Marital History 1.4
Relationship 1.4
Ancestry 2.0
Grandparents Responsible for Grandchildren 1.8
Number of Women Who Had a Birth in the Past 12 Months 1.3
Language Spoken at Home and Ability to Speak English 1.6
Linguistic Isolation 1.8
Place of Birth, Year of Entry, and Citizenship Status 1.9
Residence 1 Year Ago 2.8
School Enrollment, Level of School, Type of School, and Field of Degree 1.3
Educational Attainment 1.4
Armed Forces Status and Veteran Status 1.2
Period of Military Service 1.4
Disability Status 1.3
Employment/Work Status 1.3
Industry, Occupation, and Class of Worker 1.5
Travel Time to Work 1.6
Means of Transportation to Work 1.5
Place of Work 1.4
Time Leaving Home to go to Work 1.6
Private Vehicle Occupancy 1.5

120
Characteristics Design Factor
Work Experience, Hours Worked per Week, and Weeks Worked 1.3
Number of Workers in Family 1.4
Presence of Own Children, Presence of People Under 18 Years, Presence of People 60 Years and Over, and Presence of People 65 Years and Over 1.5
Age of Own Children by Living Arrangements and Employment Status of Parents 1.7
Age of Householder 1.3
Race of Householder 1.5
Household, Family or Nonfamily Income 1.5
Person Earnings/Income 1.5
Type of Household Income 1.2
Poverty Status (Persons) 1.7
Poverty Status (Families/Households) 1.5
Ratio of Income to Poverty Level 2.7
Receipt of Food Stamps and Participation in Free/Reduced Price Meals 1.6
Health Insurance 1.8
HOUSING
Households/Occupied Housing Units 2.2
Family Type, Household Type, and Household Size 1.6
Households by Presence of Nonrelatives 2.2
Unmarried Partner Households 1.6
Tenure 1.5
Vacant 1.7
Rooms and Bedrooms 1.5
Occupants per Room 1.5
Units in Structure 1.5
Year Structure Built and Year Householder Moved Into Unit 1.4
House Heating Fuel 1.5
Telephone Service Available 1.5
Vehicles Available 1.5
Plumbing Facilities and Kitchen Facilities 2.2
Gross Rent, Gross Rent as a Percentage Of Household Income, and Contract Rent 1.6
Meals Included in Rent 1.5
Inclusion of Utilities in Rent 1.5
Value 1.4
Mortgage Status and Selected Monthly Owner Costs 1.4
Selected Physical and Financial Conditions 1.5

121
Table 3.49 Design Factors for Calculating PUMS Standard Errors –West Virginia Characteristics Design Factor
POPULATION
Families and Nonfamilies 1.6
Population in Households by Race/Hispanic Origin of Householder 1.6
Population by Tenure 2.2
Age 1.0
Sex 1.0
Population of Two or More Races 1.8
White Alone 1.0
Black or African American Alone 1.1
American Indian or Alaska Native Alone, Asian Alone, Native Hawaiian or Other Pacific Islander Alone, or Some Other Race Alone 1.5
Hispanic or Latino 1.4
Marital Status 1.2
Marital History 1.0
Relationship 1.3
Ancestry 1.9
Grandparents Responsible for Grandchildren 1.6
Number of Women Who Had a Birth in the Past 12 Months 1.1
Language Spoken at Home and Ability to Speak English 1.4
Linguistic Isolation 3.2
Place of Birth, Year of Entry, and Citizenship Status 1.7
Residence 1 Year Ago 2.4
School Enrollment, Level of School, Type of School, and Field of Degree 1.1
Educational Attainment 1.3
Armed Forces Status and Veteran Status 1.2
Period of Military Service 1.3
Disability Status 1.2
Employment/Work Status 1.1
Industry, Occupation, and Class of Worker 1.4
Travel Time to Work 1.5
Means of Transportation to Work 1.5
Place of Work 1.3
Time Leaving Home to go to Work 1.5
Private Vehicle Occupancy 1.5
Work Experience, Hours Worked per Week, and Weeks Worked 1.2

122
Characteristics Design Factor
Number of Workers in Family 1.3
Presence of Own Children, Presence of People Under 18 Years, Presence of People 60 Years and Over, and Presence of People 65 Years and Over 1.3
Age of Own Children by Living Arrangements and Employment Status of Parents 1.6
Age of Householder 1.2
Race of Householder 1.5
Household, Family or Nonfamily Income 1.5
Person Earnings/Income 1.5
Type of Household Income 1.3
Poverty Status (Persons) 1.6
Poverty Status (Families/Households) 1.4
Ratio of Income to Poverty Level 2.4
Receipt of Food Stamps and Participation in Free/Reduced Price Meals 1.7
Health Insurance 1.4
HOUSING
Households/Occupied Housing Units 1.6
Family Type, Household Type, and Household Size 1.5
Households by Presence of Nonrelatives 2.0
Unmarried Partner Households 1.5
Tenure 1.3
Vacant 1.5
Rooms and Bedrooms 1.4
Occupants per Room 1.4
Units in Structure 1.4
Year Structure Built and Year Householder Moved Into Unit 1.4
House Heating Fuel 1.4
Telephone Service Available 1.3
Vehicles Available 1.4
Plumbing Facilities and Kitchen Facilities 1.6
Gross Rent, Gross Rent as a Percentage Of Household Income, and Contract Rent 1.5
Meals Included in Rent 1.4
Inclusion of Utilities in Rent 1.3
Value 1.3
Mortgage Status and Selected Monthly Owner Costs 1.3
Selected Physical and Financial Conditions 1.4

123
Table 3.50 Design Factors for Calculating PUMS Standard Errors –Wisconsin Characteristics Design Factor
POPULATION
Families and Nonfamilies 1.4
Population in Households by Race/Hispanic Origin of Householder 1.8
Population by Tenure 2.2
Age 1.0
Sex 1.0
Population of Two or More Races 1.7
White Alone 1.4
Black or African American Alone 1.2
American Indian or Alaska Native Alone, Asian Alone, Native Hawaiian or Other Pacific Islander Alone, or Some Other Race Alone 1.9
Hispanic or Latino 2.0
Marital Status 1.2
Marital History 1.2
Relationship 1.2
Ancestry 1.7
Grandparents Responsible for Grandchildren 1.4
Number of Women Who Had a Birth in the Past 12 Months 1.3
Language Spoken at Home and Ability to Speak English 1.4
Linguistic Isolation 2.2
Place of Birth, Year of Entry, and Citizenship Status 1.6
Residence 1 Year Ago 2.2
School Enrollment, Level of School, Type of School, and Field of Degree 1.1
Educational Attainment 1.2
Armed Forces Status and Veteran Status 1.2
Period of Military Service 1.1
Disability Status 1.3
Employment/Work Status 1.2
Industry, Occupation, and Class of Worker 1.3
Travel Time to Work 1.3
Means of Transportation to Work 1.3
Place of Work 1.2
Time Leaving Home to go to Work 1.3
Private Vehicle Occupancy 1.4
Work Experience, Hours Worked per Week, and Weeks Worked 1.2

124
Characteristics Design Factor
Number of Workers in Family 1.2
Presence of Own Children, Presence of People Under 18 Years, Presence of People 60 Years and Over, and Presence of People 65 Years and Over 1.2
Age of Own Children by Living Arrangements and Employment Status of Parents 1.7
Age of Householder 1.1
Race of Householder 1.5
Household, Family or Nonfamily Income 1.5
Person Earnings/Income 1.3
Type of Household Income 1.4
Poverty Status (Persons) 1.7
Poverty Status (Families/Households) 1.4
Ratio of Income to Poverty Level 2.2
Receipt of Food Stamps and Participation in Free/Reduced Price Meals 1.6
Health Insurance 1.3
HOUSING
Households/Occupied Housing Units 1.6
Family Type, Household Type, and Household Size 1.3
Households by Presence of Nonrelatives 1.7
Unmarried Partner Households 1.4
Tenure 1.3
Vacant 1.5
Rooms and Bedrooms 1.3
Occupants per Room 1.3
Units in Structure 1.4
Year Structure Built and Year Householder Moved Into Unit 1.3
House Heating Fuel 1.2
Telephone Service Available 1.3
Vehicles Available 1.2
Plumbing Facilities and Kitchen Facilities 1.4
Gross Rent, Gross Rent as a Percentage Of Household Income, and Contract Rent 1.4
Meals Included in Rent 1.4
Inclusion of Utilities in Rent 1.4
Value 1.1
Mortgage Status and Selected Monthly Owner Costs 1.2
Selected Physical and Financial Conditions 1.3

125
Table 3.51 Design Factors for Calculating PUMS Standard Errors –Wyoming Characteristics Design Factor
POPULATION
Families and Nonfamilies 1.5
Population in Households by Race/Hispanic Origin of Householder 1.8
Population by Tenure 2.4
Age 1.0
Sex 1.0
Population of Two or More Races 1.7
White Alone 1.7
Black or African American Alone 1.2
American Indian or Alaska Native Alone, Asian Alone, Native Hawaiian or Other Pacific Islander Alone, or Some Other Race Alone 1.5
Hispanic or Latino 1.5
Marital Status 1.3
Marital History 1.2
Relationship 1.2
Ancestry 1.8
Grandparents Responsible for Grandchildren 1.5
Number of Women Who Had a Birth in the Past 12 Months 1.2
Language Spoken at Home and Ability to Speak English 1.4
Linguistic Isolation 2.1
Place of Birth, Year of Entry, and Citizenship Status 1.7
Residence 1 Year Ago 2.3
School Enrollment, Level of School, Type of School, and Field of Degree 1.2
Educational Attainment 1.3
Armed Forces Status and Veteran Status 1.2
Period of Military Service 1.4
Disability Status 1.2
Employment/Work Status 1.2
Industry, Occupation, and Class of Worker 1.4
Travel Time to Work 1.5
Means of Transportation to Work 1.4
Place of Work 1.2
Time Leaving Home to go to Work 1.5
Private Vehicle Occupancy 1.4
Work Experience, Hours Worked per Week, and Weeks Worked 1.1

126
Characteristics Design Factor
Number of Workers in Family 1.3
Presence of Own Children, Presence of People Under 18 Years, Presence of People 60 Years and Over, and Presence of People 65 Years and Over 1.3
Age of Own Children by Living Arrangements and Employment Status of Parents 1.6
Age of Householder 1.2
Race of Householder 1.5
Household, Family or Nonfamily Income 1.5
Person Earnings/Income 1.5
Type of Household Income 1.2
Poverty Status (Persons) 1.6
Poverty Status (Families/Households) 1.4
Ratio of Income to Poverty Level 2.4
Receipt of Food Stamps and Participation in Free/Reduced Price Meals 1.5
Health Insurance 1.3
HOUSING
Households/Occupied Housing Units 1.7
Family Type, Household Type, and Household Size 1.5
Households by Presence of Nonrelatives 1.7
Unmarried Partner Households 1.5
Tenure 1.4
Vacant 1.6
Rooms and Bedrooms 1.5
Occupants per Room 1.4
Units in Structure 1.4
Year Structure Built and Year Householder Moved Into Unit 1.4
House Heating Fuel 1.4
Telephone Service Available 1.5
Vehicles Available 1.4
Plumbing Facilities and Kitchen Facilities 1.5
Gross Rent, Gross Rent as a Percentage Of Household Income, and Contract Rent 1.5
Meals Included in Rent 1.4
Inclusion of Utilities in Rent 1.4
Value 1.3
Mortgage Status and Selected Monthly Owner Costs 1.4
Selected Physical and Financial Conditions 1.4

127
Table 3.52 Design Factors for Calculating PUMS Standard Errors –Puerto Rico Characteristics Design Factor
POPULATION
Families and Nonfamilies 1.6
Population in Households by Race/Hispanic Origin of Householder 2.0
Population by Tenure 2.6
Age 1.0
Sex 1.0
Population of Two or More Races 2.1
White Alone 2.0
Black or African American Alone 2.0
American Indian or Alaska Native Alone, Asian Alone, Native Hawaiian or Other Pacific Islander Alone, or Some Other Race Alone 2.0
Hispanic or Latino 2.0
Marital Status 1.2
Marital History 1.1
Relationship 1.3
Ancestry 2.0
Grandparents Responsible for Grandchildren 1.7
Number of Women Who Had a Birth in the Past 12 Months 1.2
Language Spoken at Home and Ability to Speak English 1.4
Linguistic Isolation 1.4
Place of Birth, Year of Entry, and Citizenship Status 1.9
Residence 1 Year Ago 2.5
School Enrollment, Level of School, Type of School, and Field of Degree 1.2
Educational Attainment 1.4
Armed Forces Status and Veteran Status 1.2
Period of Military Service 1.4
Disability Status 1.2
Employment/Work Status 1.1
Industry, Occupation, and Class of Worker 1.5
Travel Time to Work 1.6
Means of Transportation to Work 1.5
Place of Work 1.4
Time Leaving Home to go to Work 1.6
Private Vehicle Occupancy 1.5
Work Experience, Hours Worked per Week, and Weeks Worked 1.3

128
Characteristics Design Factor
Number of Workers in Family 1.3
Presence of Own Children, Presence of People Under 18 Years, Presence of People 60 Years and Over, and Presence of People 65 Years and Over 1.3
Age of Own Children by Living Arrangements and Employment Status of Parents 1.6
Age of Householder 1.2
Race of Householder 1.4
Household, Family or Nonfamily Income 1.5
Person Earnings/Income 1.5
Type of Household Income 1.1
Poverty Status (Persons) 1.9
Poverty Status (Families/Households) 1.4
Ratio of Income to Poverty Level 2.7
Receipt of Food Stamps and Participation in Free/Reduced Price Meals 1.5
Health Insurance 1.8
HOUSING
Households/Occupied Housing Units 1.8
Family Type, Household Type, and Household Size 1.4
Households by Presence of Nonrelatives 2.1
Unmarried Partner Households 1.4
Tenure 1.4
Vacant 1.3
Rooms and Bedrooms 1.4
Occupants per Room 1.3
Units in Structure 1.4
Year Structure Built and Year Householder Moved Into Unit 1.4
House Heating Fuel 1.5
Telephone Service Available 1.3
Vehicles Available 1.4
Plumbing Facilities and Kitchen Facilities 1.5
Gross Rent, Gross Rent as a Percentage Of Household Income, and Contract Rent 1.5
Meals Included in Rent 1.4
Inclusion of Utilities in Rent 1.4
Value 1.4
Mortgage Status and Selected Monthly Owner Costs 1.4
Selected Physical and Financial Conditions 1.4
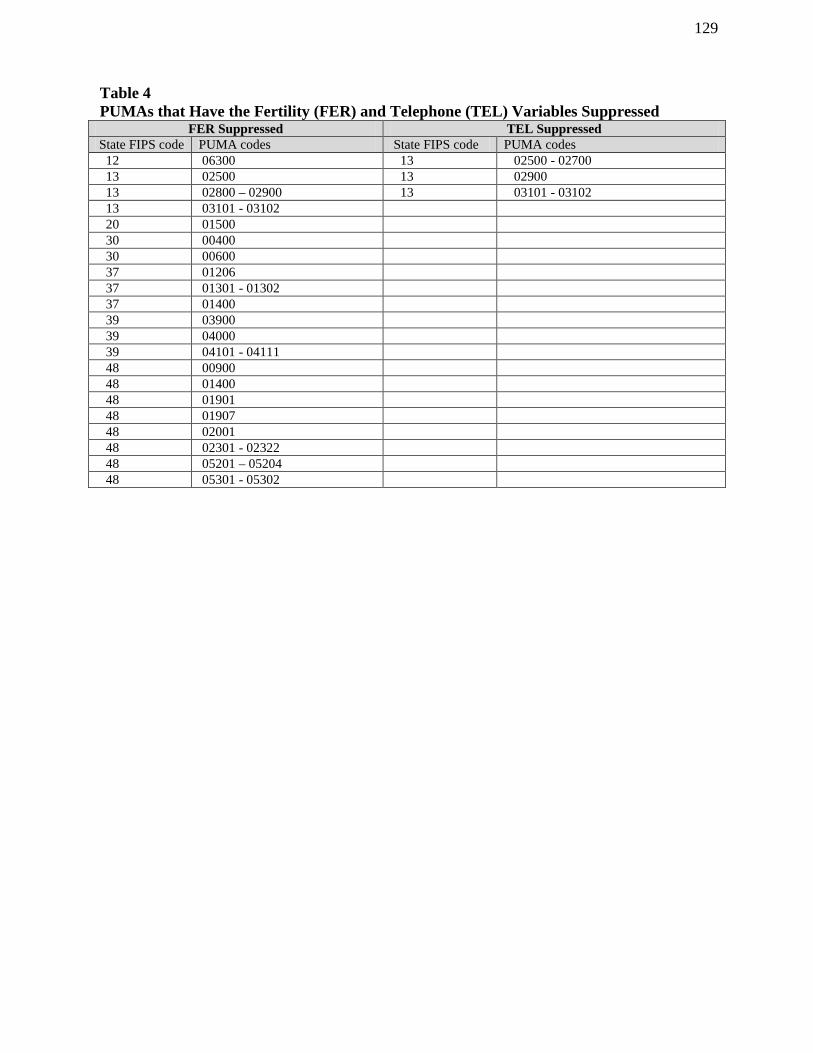
129
Table 4 PUMAs that Have the Fertility (FER) and Telephone (TEL) Variables Suppressed
FER Suppressed TEL Suppressed State FIPS code PUMA codes State FIPS code PUMA codes 12 06300 13 02500 - 02700 13 02500 13 02900 13 02800 – 02900 13 03101 - 03102 13 03101 - 03102 20 01500 30 00400 30 00600 37 01206 37 01301 - 01302 37 01400 39 03900 39 04000 39 04101 - 04111 48 00900 48 01400 48 01901 48 01907 48 02001 48 02301 - 02322 48 05201 – 05204 48 05301 - 05302