Embed Size (px)
Citation preview
PUMP TEST AND FEASIBILITY STUDY REPORT For The
BAISHUITANG LANDFILL BEIHAI, CHINA
Funded By
LANDFILL METHANE OUTREACH PROGRAM UNITED STATES ENVIORNMENTAL PROTECION AGENCY
1200 PENNSYLVANIA AVENUE, NW WASHINGTON DC 20450
Prepared for
ENVIRONMENTAL SANITATION ENGINEERING TECH RESEARCH CENTER, CHINA
Prepared by
GC ENVIRONMENTAL, INC 1230 N. JEFFERSON STREET, SUITE J
ANAHEIM, CA, USA
July 12, 2010
0server\1375-1 EPA - China LFG Utilization Feasibility Study\Docs
i
TABLE of CONTENTS
Section Page
EXECUTIVE SUMMARY ...............................................................................................1
1.0 INTRODUCTION..................................................................................................3 1.1 Background..........................................................................................................3 1.2 Project Approach .................................................................................................3
2.0 LANDFILL INFORMATION ..............................................................................4
3.0 TEST PLAN ...........................................................................................................5
4.0 TEST IMPLEMENTATION ................................................................................6 4.1 Test System Description ......................................................................................6 4.2 LFG Generation and Collection...........................................................................6 4.1 Radius of Influence Test ......................................................................................8 4.2 Methane Variations During the Test....................................................................8 4.3 Data Evaluation....................................................................................................9 4.4 Barometric Pressure Influence...........................................................................10 4.5 Estimate Methane Collection Rate ....................................................................10 4.6 Problems Encountered During the Test and Corrections Made ........................10
5.0 LFG GENERATION MODELING ...................................................................11
6.0 LANDFILL GAS UTILIZATION OPTIONS...................................................12 6.1 Potential Medium BTU fuel users .....................................................................12 6.2 Power Generation ..............................................................................................12 6.3 Combined System ..............................................................................................13 6.4 Small Engines/Power Production ......................................................................13 6.5 Microturbine/Combined Heat and Power ..........................................................14
7.0 RECOMMENDATIONS.....................................................................................14
8.0 CONCLUSIONS ..................................................................................................14
9.0 LIMITATIONS....................................................................................................16
0server\1375-1 EPA - China LFG Utilization Feasibility Study\Docs
ii
Photographs Photo 1 – Landfill Site Map Photo 2 - Landfill and the immediate vicinity around the Landfill Photo 3 - Grass growing on landfill Photo 4 - Exposed Refuse Photo 5 – Gas Vent Photo 6 – LFG Flow Meter Photo 7 – Broken Blower Outlet Fitting Photo 8 – Cut Blower Inlet Fitting Photo 9 – Well Backfill Rock Photo 10 – Well adjusting valve Photo 11 – Typical Wellhead Photo 12 – Well Lateral Sample Port Photo 13 – Typical Well Lateral Pipe Photo 14 – Typical Well Lateral Pipe Photo 15 – Typical Pressure Monitoring Probe Photo 16 – Typical Probe Sampling Array Photo 17 – Area view of wells and flare Photo 18 – PVC Sheet orifice plate Photo 19 – Leachate Pump House (for power) Photo 20 – Orifice Plate Installation Photo 21 – Flare with Flame Arrestor Photo 22 – Flare Burner Photo 23 – Blower Connection Photo 24 – Blower/Flare Assembly Photo 25 – Condensate water sump Photo 26 – Blower and Condensate Water Sump Photo 27 – Cover soil added to landfill surface Photo 28 – Utility Substation Photo 29 – Fish Powder Plant Photo 30 – Fish Powder Plant Photo 31 – Unknown Possible Gas User Tables Table 1 – Waste Composition Table 2 – Initial Well Flows Table 3 – Initial Methane Quality Data Table 4 – Steady State Flow Rate
0server\1375-1 EPA - China LFG Utilization Feasibility Study\Docs
iii
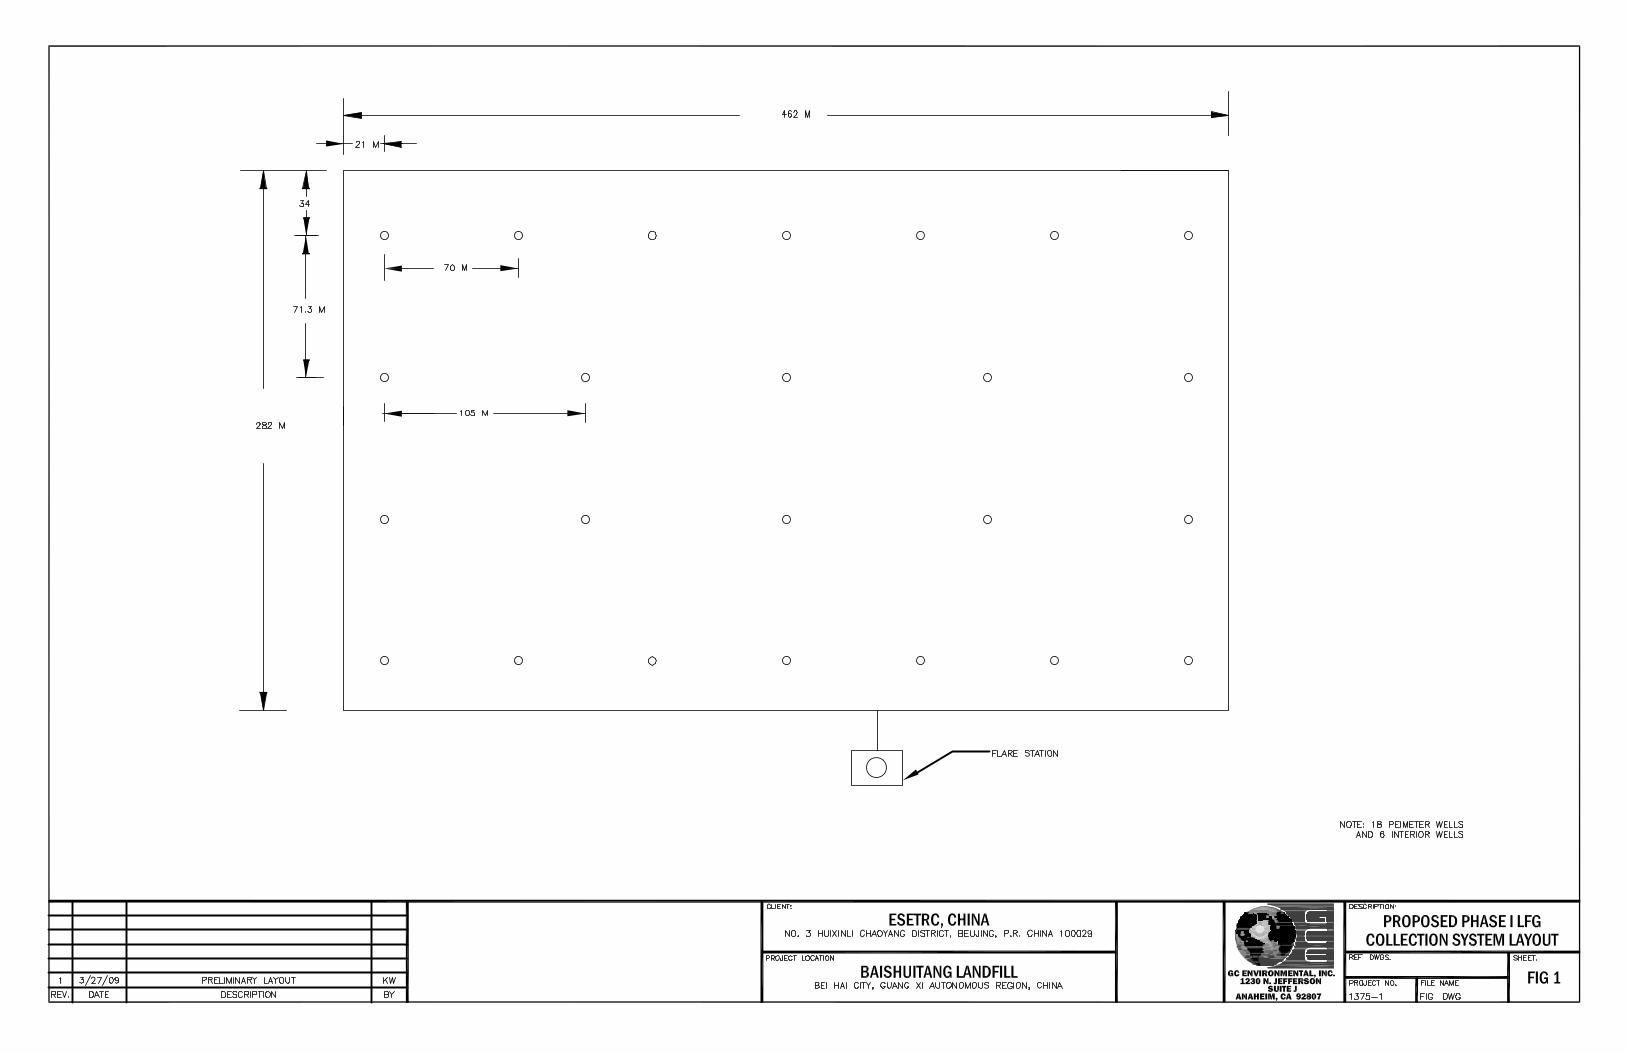
Figures Figure 1 – Proposed Phase I LFG Collection Figures 2 – 7 - Methane Quality Using Raw Data & with Air Removed & Data Normalized Figures 8 – 10 - LFG Flow as Measured by the Orifice Plates Figures 11 – 16 - Shutdown Vacuum Changes Figures 17 – 22 - Methane & Barometric Pressure vs. Time Figure 23 – EPA China Model Figure 24 – Project Economics – Internal Rate of Return Alternatives Drawings C0 – Title Sheet C1 – System Layout C2 – Flare Station Plan View C3 – Header Connection Details C4 – Well / Lateral Connection Details C5 – Sump Connection Details C6 – Extraction Well construction Details C7 – Flare Station Elevation View C8 – Bar Hole Probe Construction Details C9 – Material List Attachments Attachment 1 – LFG Well Influence Test Plant, Baishuitang Landfill, Beihai, China Attachment 2 – Direct Use Project Economics Attachment 3 – Small Power Production Project Economics Attachment 4 – Combined Heat and Power Project Economics Attachment 5 – Small Engines/Power Project Economics Attachment 6 – Microturbine/Combined Heat and Power Project Economics
Page 1 0server\1375-1 EPA - China LFG Utilization Feasibility Study\Docs
EXECUTIVE SUMMARY
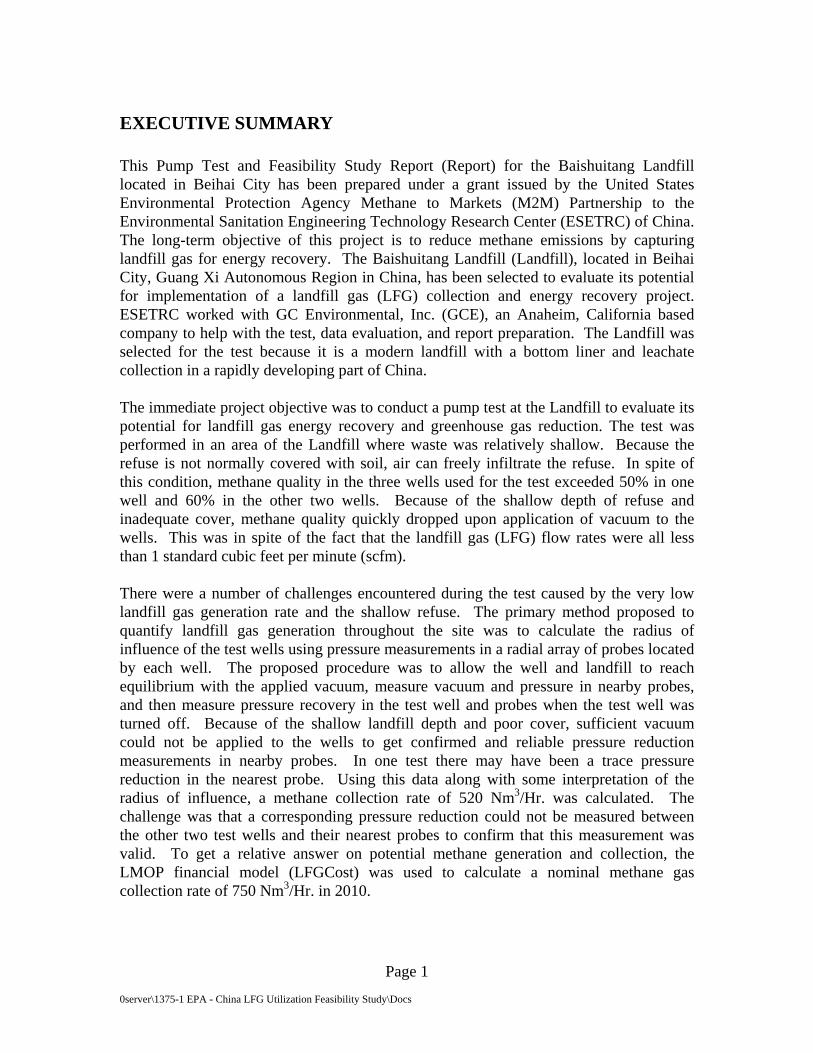
This Pump Test and Feasibility Study Report (Report) for the Baishuitang Landfill located in Beihai City has been prepared under a grant issued by the United States Environmental Protection Agency Methane to Markets (M2M) Partnership to the Environmental Sanitation Engineering Technology Research Center (ESETRC) of China. The long-term objective of this project is to reduce methane emissions by capturing landfill gas for energy recovery. The Baishuitang Landfill (Landfill), located in Beihai City, Guang Xi Autonomous Region in China, has been selected to evaluate its potential for implementation of a landfill gas (LFG) collection and energy recovery project. ESETRC worked with GC Environmental, Inc. (GCE), an Anaheim, California based company to help with the test, data evaluation, and report preparation. The Landfill was selected for the test because it is a modern landfill with a bottom liner and leachate collection in a rapidly developing part of China. The immediate project objective was to conduct a pump test at the Landfill to evaluate its potential for landfill gas energy recovery and greenhouse gas reduction. The test was performed in an area of the Landfill where waste was relatively shallow. Because the refuse is not normally covered with soil, air can freely infiltrate the refuse. In spite of this condition, methane quality in the three wells used for the test exceeded 50% in one well and 60% in the other two wells. Because of the shallow depth of refuse and inadequate cover, methane quality quickly dropped upon application of vacuum to the wells. This was in spite of the fact that the landfill gas (LFG) flow rates were all less than 1 standard cubic feet per minute (scfm). There were a number of challenges encountered during the test caused by the very low landfill gas generation rate and the shallow refuse. The primary method proposed to quantify landfill gas generation throughout the site was to calculate the radius of influence of the test wells using pressure measurements in a radial array of probes located by each well. The proposed procedure was to allow the well and landfill to reach equilibrium with the applied vacuum, measure vacuum and pressure in nearby probes, and then measure pressure recovery in the test well and probes when the test well was turned off. Because of the shallow landfill depth and poor cover, sufficient vacuum could not be applied to the wells to get confirmed and reliable pressure reduction measurements in nearby probes. In one test there may have been a trace pressure reduction in the nearest probe. Using this data along with some interpretation of the radius of influence, a methane collection rate of 520 Nm3/Hr. was calculated. The challenge was that a corresponding pressure reduction could not be measured between the other two test wells and their nearest probes to confirm that this measurement was valid. To get a relative answer on potential methane generation and collection, the LMOP financial model (LFGCost) was used to calculate a nominal methane gas collection rate of 750 Nm3/Hr. in 2010.
Page 2 0server\1375-1 EPA - China LFG Utilization Feasibility Study\Docs
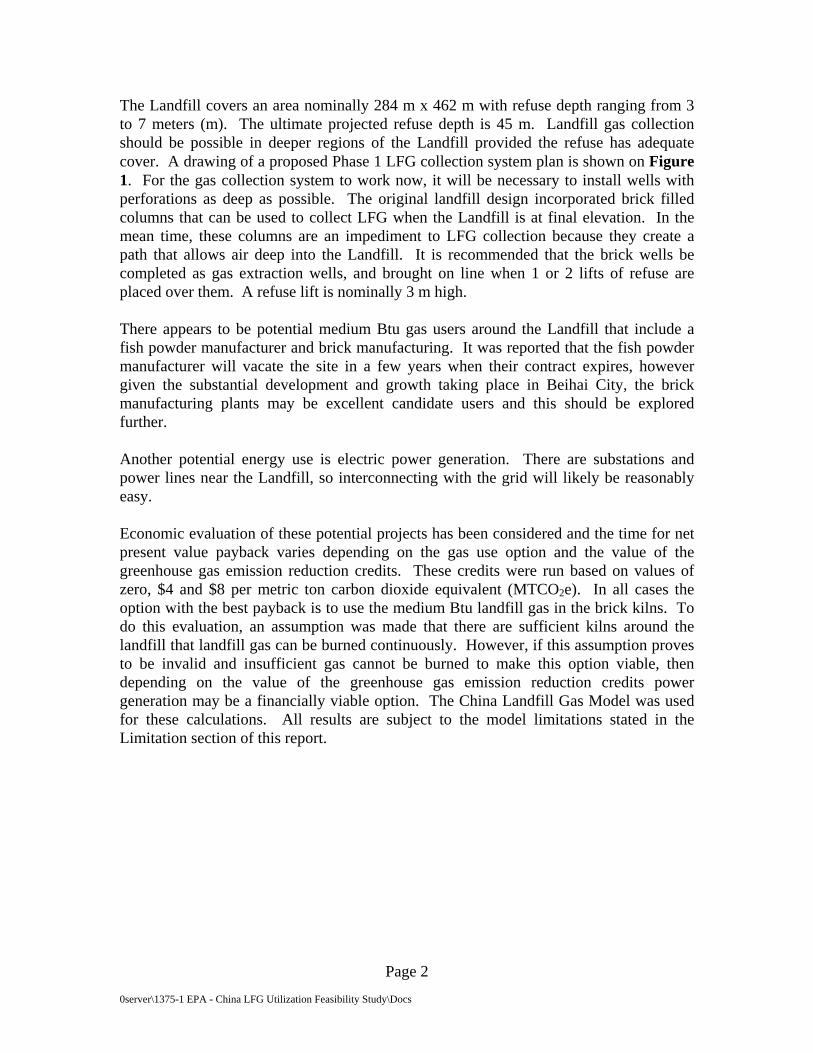
The Landfill covers an area nominally 284 m x 462 m with refuse depth ranging from 3 to 7 meters (m). The ultimate projected refuse depth is 45 m. Landfill gas collection should be possible in deeper regions of the Landfill provided the refuse has adequate cover. A drawing of a proposed Phase 1 LFG collection system plan is shown on Figure 1. For the gas collection system to work now, it will be necessary to install wells with perforations as deep as possible. The original landfill design incorporated brick filled columns that can be used to collect LFG when the Landfill is at final elevation. In the mean time, these columns are an impediment to LFG collection because they create a path that allows air deep into the Landfill. It is recommended that the brick wells be completed as gas extraction wells, and brought on line when 1 or 2 lifts of refuse are placed over them. A refuse lift is nominally 3 m high. There appears to be potential medium Btu gas users around the Landfill that include a fish powder manufacturer and brick manufacturing. It was reported that the fish powder manufacturer will vacate the site in a few years when their contract expires, however given the substantial development and growth taking place in Beihai City, the brick manufacturing plants may be excellent candidate users and this should be explored further. Another potential energy use is electric power generation. There are substations and power lines near the Landfill, so interconnecting with the grid will likely be reasonably easy. Economic evaluation of these potential projects has been considered and the time for net present value payback varies depending on the gas use option and the value of the greenhouse gas emission reduction credits. These credits were run based on values of zero, $4 and $8 per metric ton carbon dioxide equivalent (MTCO2e). In all cases the option with the best payback is to use the medium Btu landfill gas in the brick kilns. To do this evaluation, an assumption was made that there are sufficient kilns around the landfill that landfill gas can be burned continuously. However, if this assumption proves to be invalid and insufficient gas cannot be burned to make this option viable, then depending on the value of the greenhouse gas emission reduction credits power generation may be a financially viable option. The China Landfill Gas Model was used for these calculations. All results are subject to the model limitations stated in the Limitation section of this report.
Page 3 \\90.0.0.14\data\0server\1375-1 EPA - China Beiahai LFG Utilization Feasibility Study\Final Report\Beihai LFG Report.doc
1.0 INTRODUCTION
The Environmental Sanitation Engineering Technology Research Center (ESETRC) of China and GC Environmental, Inc. (GCE) are pleased to present this pump test and Feasibility Study Report for landfill gas (LFG) collection, control and utilization at the Baishuitang Landfill (Landfill) located in Beihai City, Guang Xi Autonomous Region, China. This report has been prepared under a grant from the USEPA M2M Partnership.
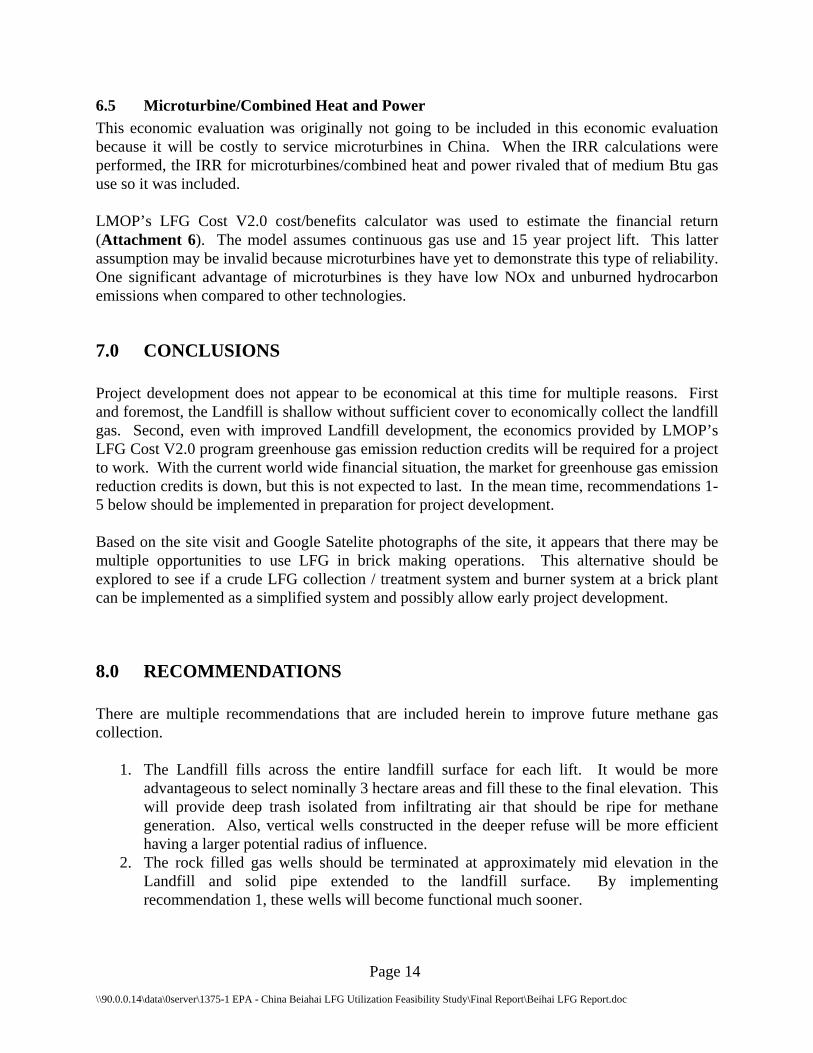
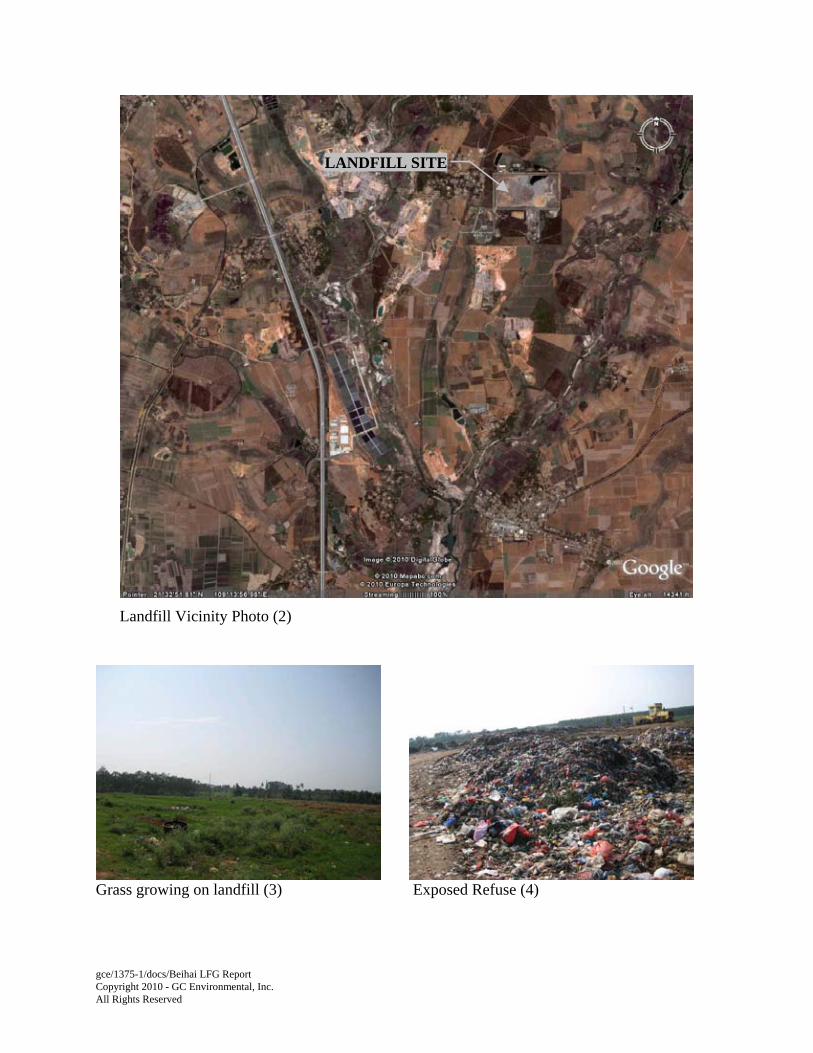
1.1 Background The objective of the test was to determine the approximate methane generation from the landfill and to assess whether the site is suitable for landfill gas energy development. The Baishuitang landfill was selected for the test because it is a relatively large modern landfill. The landfill has both a bottom liner and leachate collection systems; however, refuse is not normally covered with soil. The Baishuitang landfill covers an area 284 m by 462 m and currently contains approximately 1,241,000 Mg of municipal refuse. The landfill began operation in 1999 and will reach capacity in year 2026. The ultimate landfill capacity is 5,000,000 Mg. Landfill operations are such that each refuse lift covers the entire landfill footprint, hence refuse is still relatively shallow. Refuse depth in the area of the test was about 3m and was placed in about years 1999 - 2000. It is reported that the deepest refuse is about 7m in areas that have two lifts in place. The aerial photo 1 shows an aerial view of the Landfill and aerial photo 2 shows the Landfill and the immediate vicinity around the Landfill.
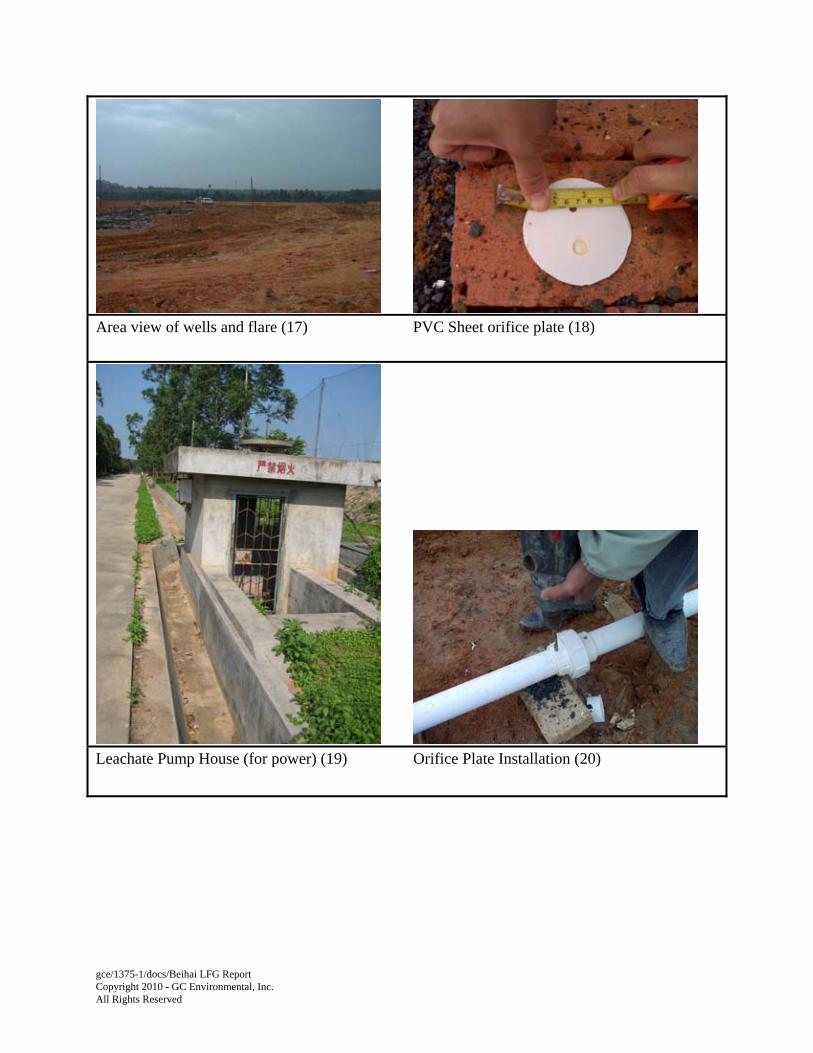
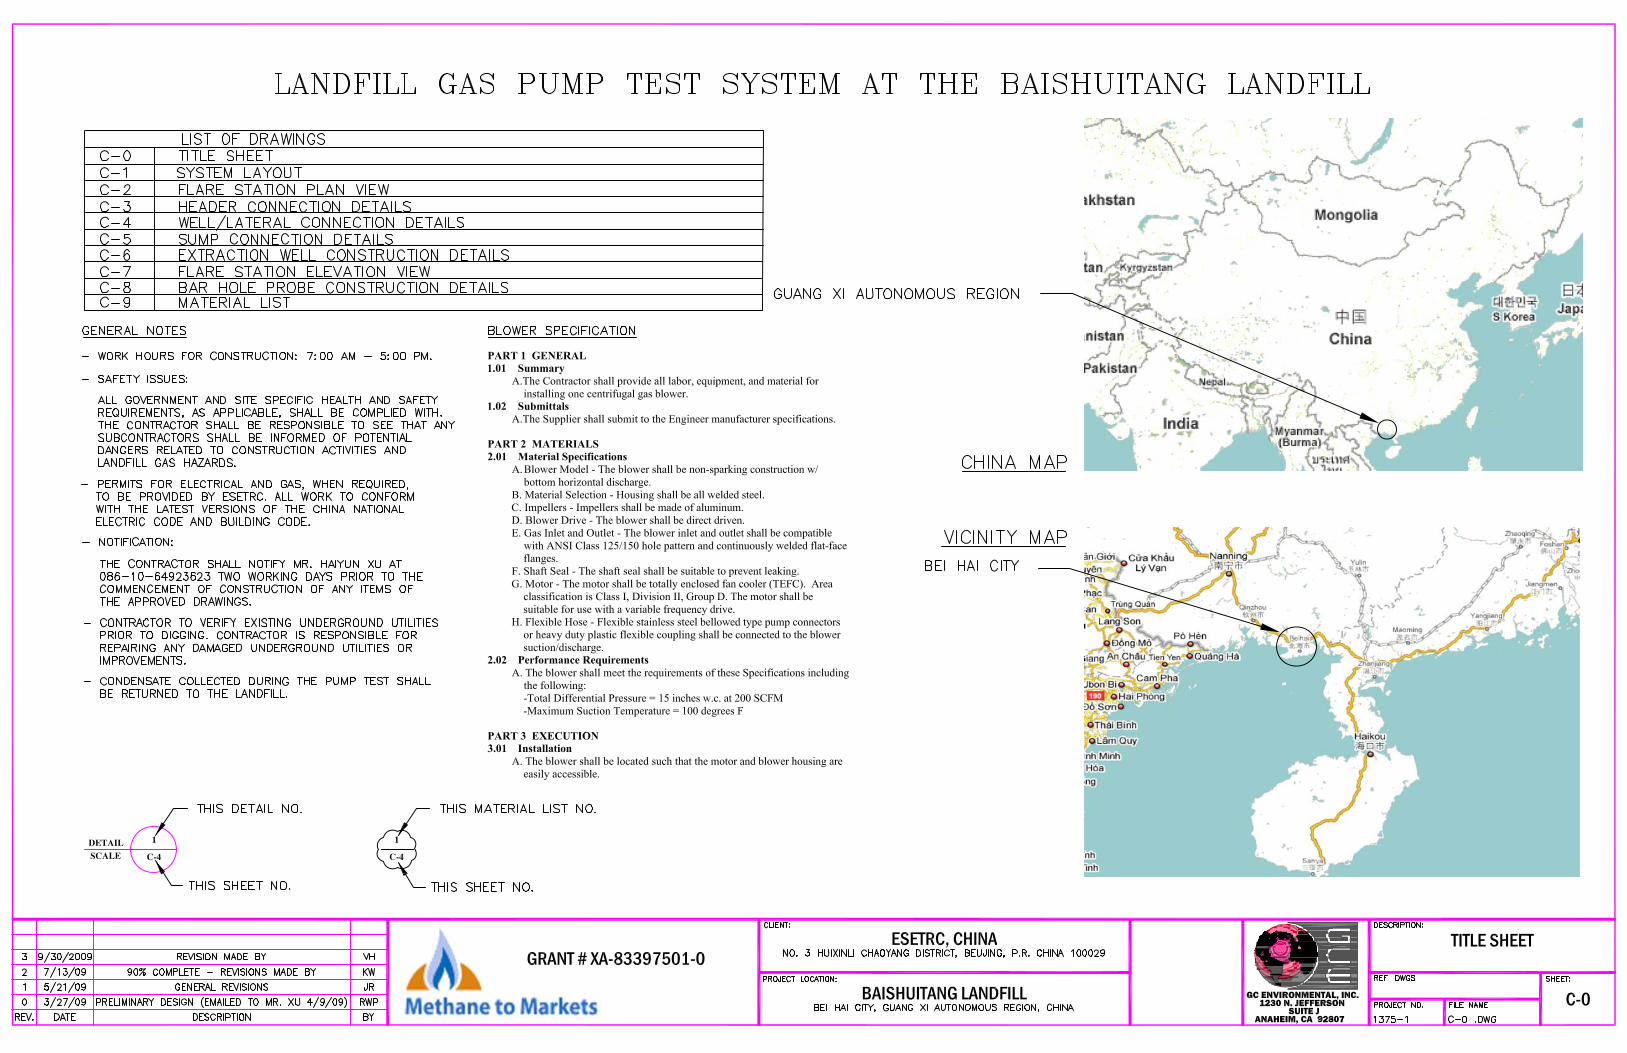
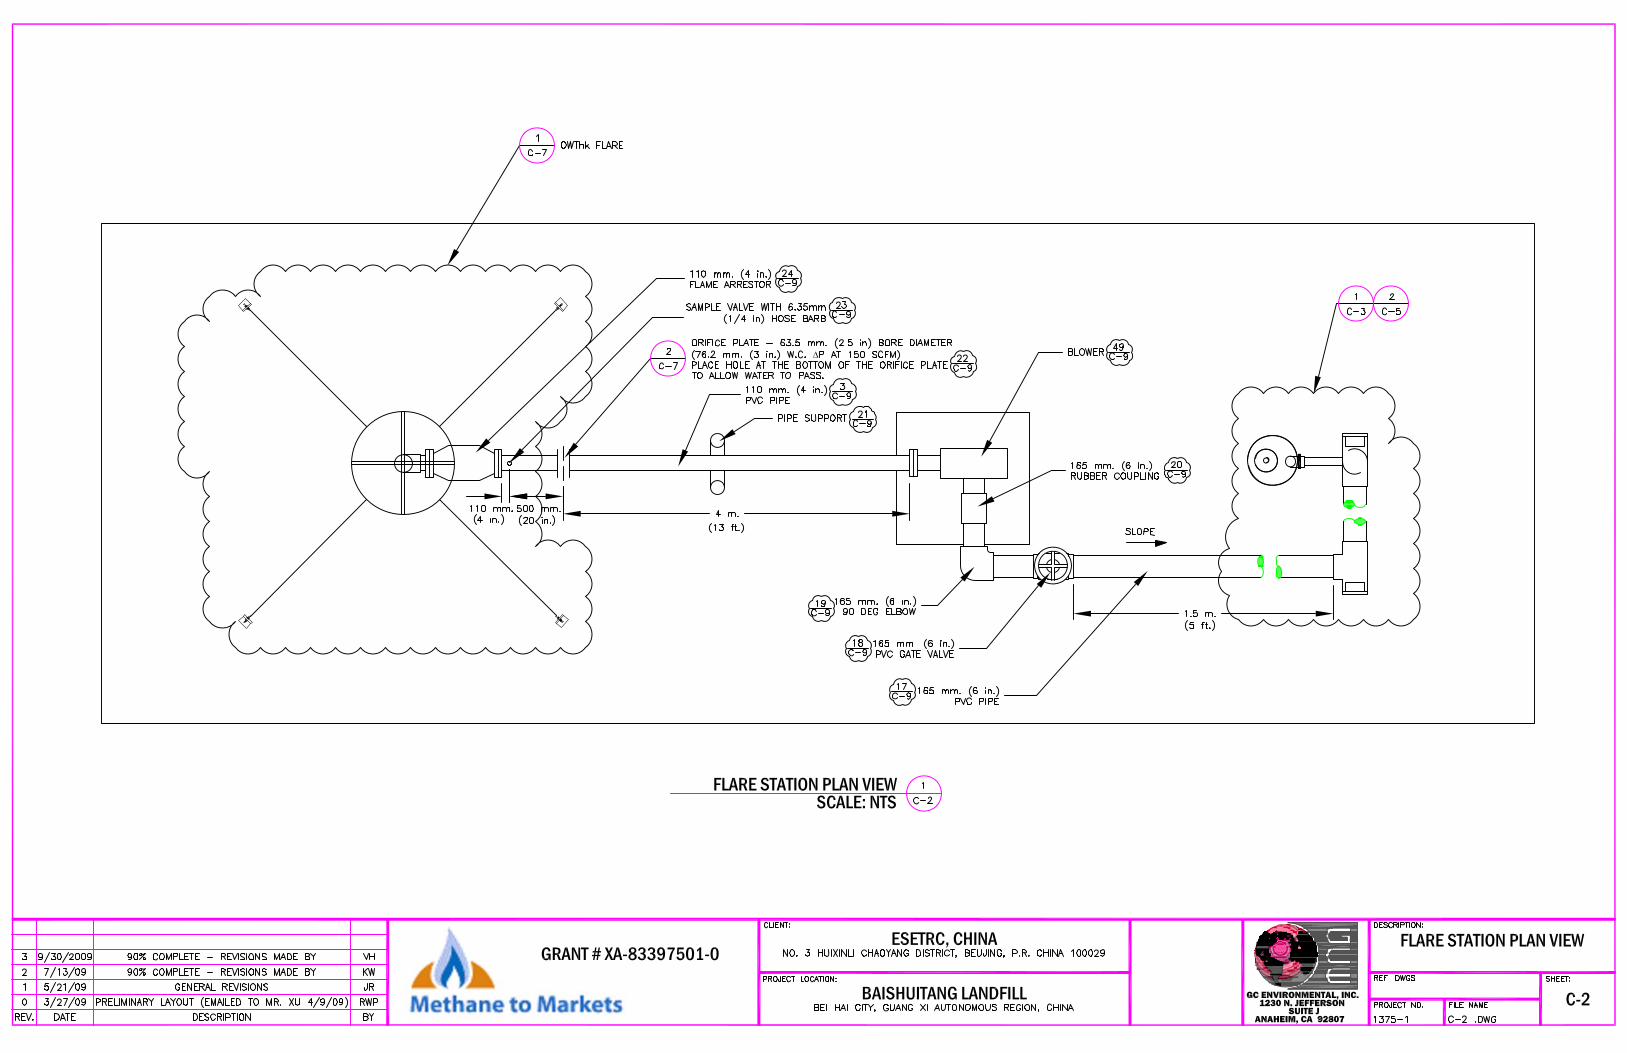
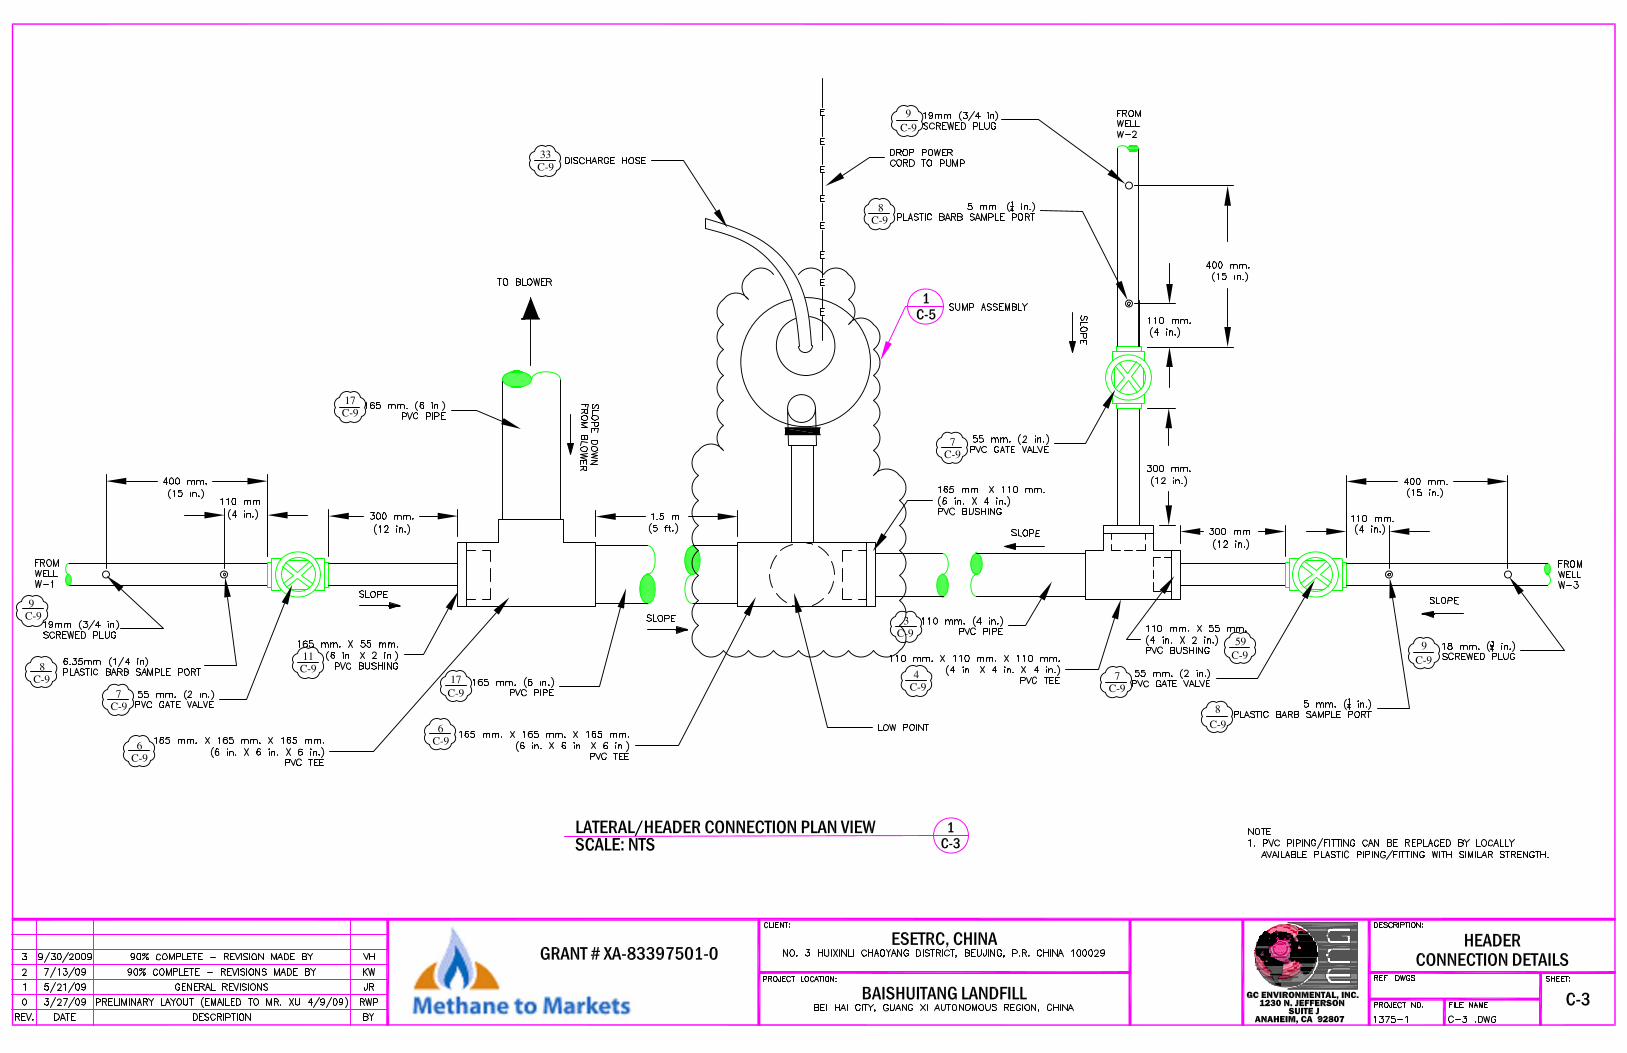
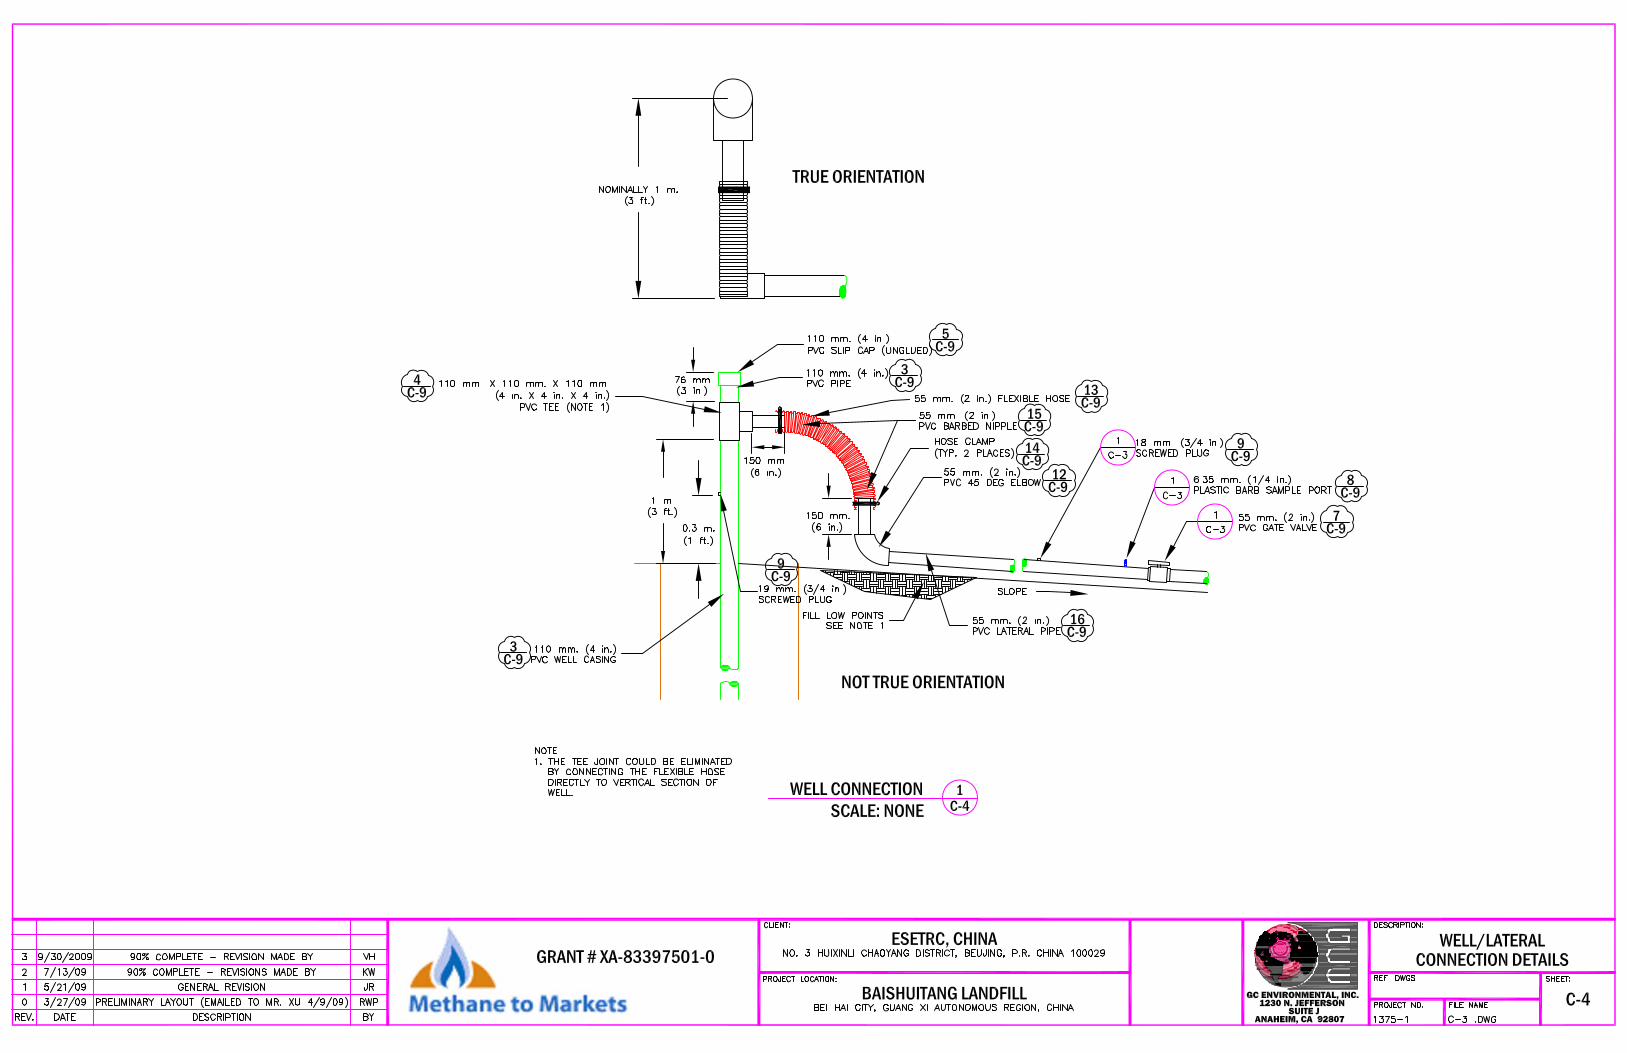
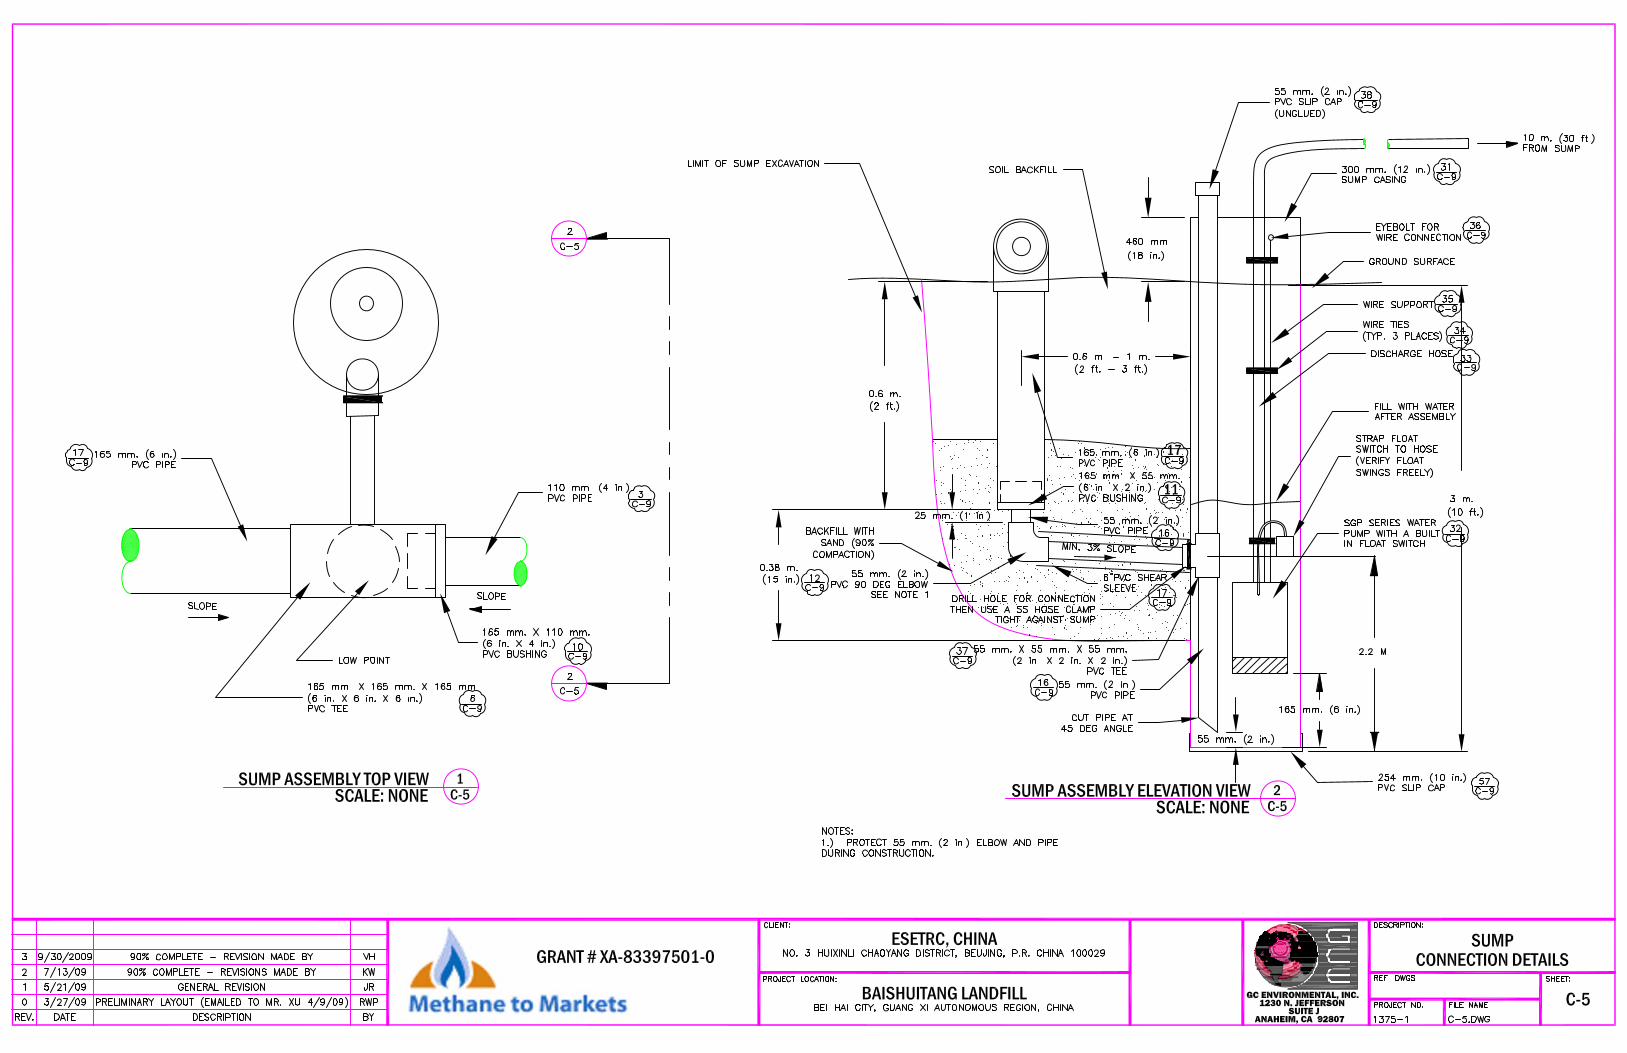
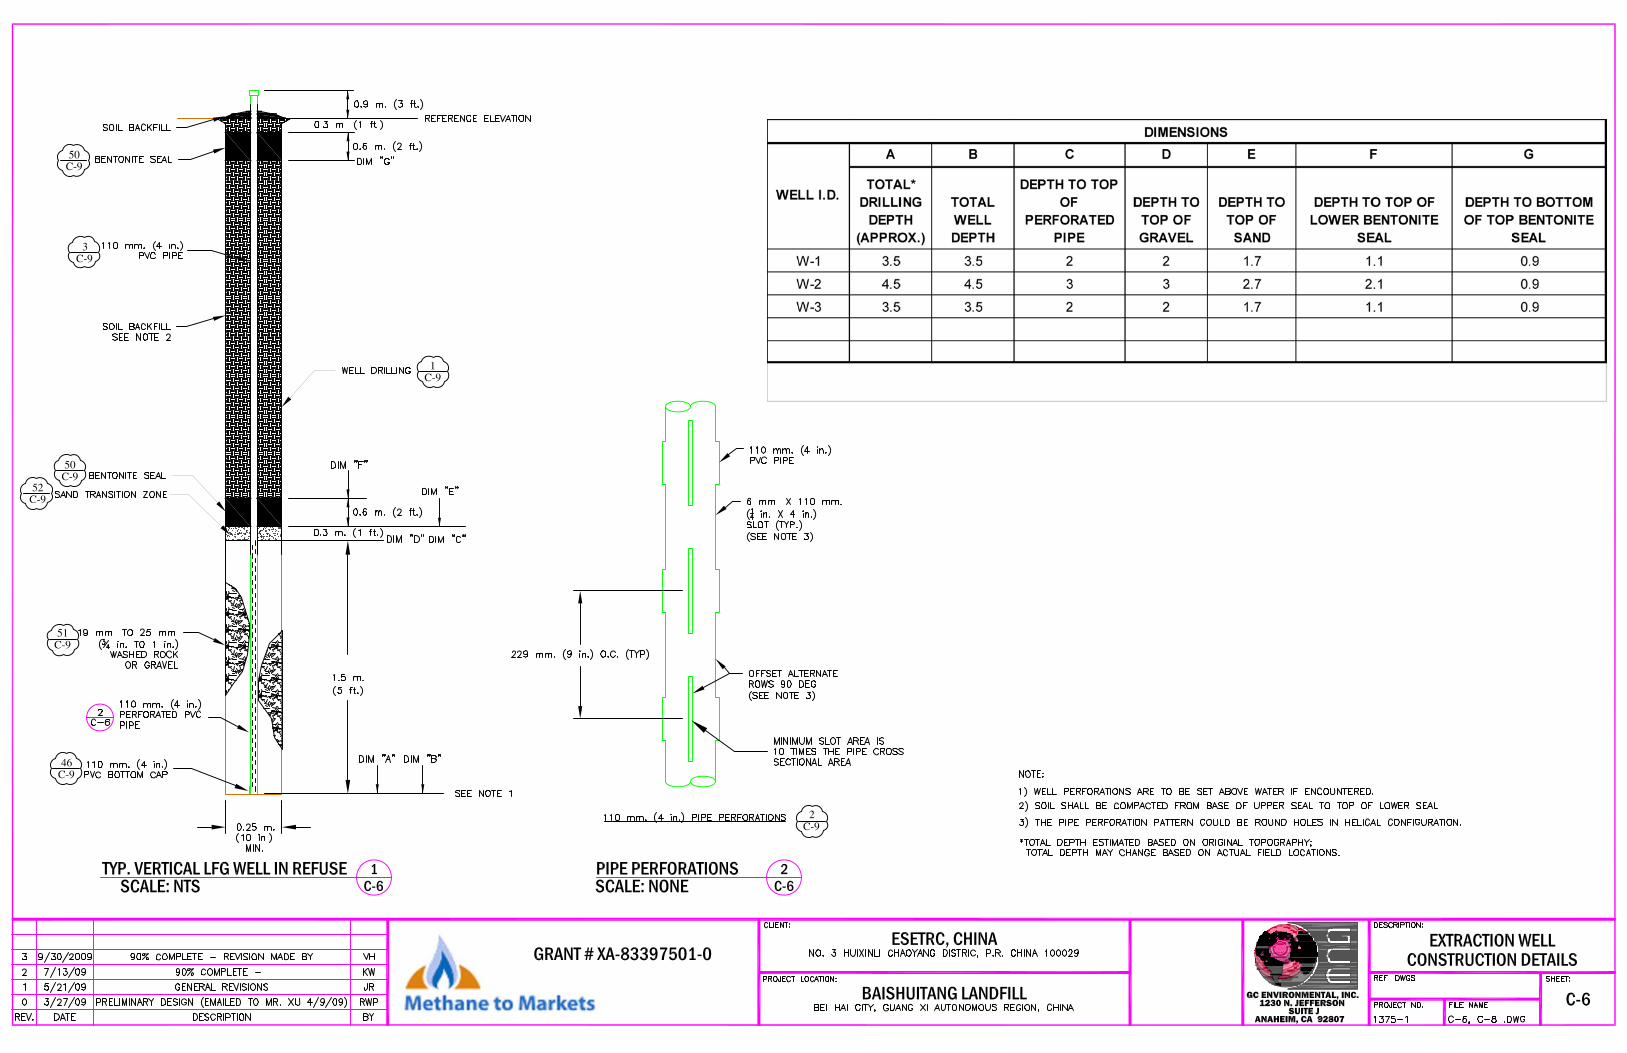
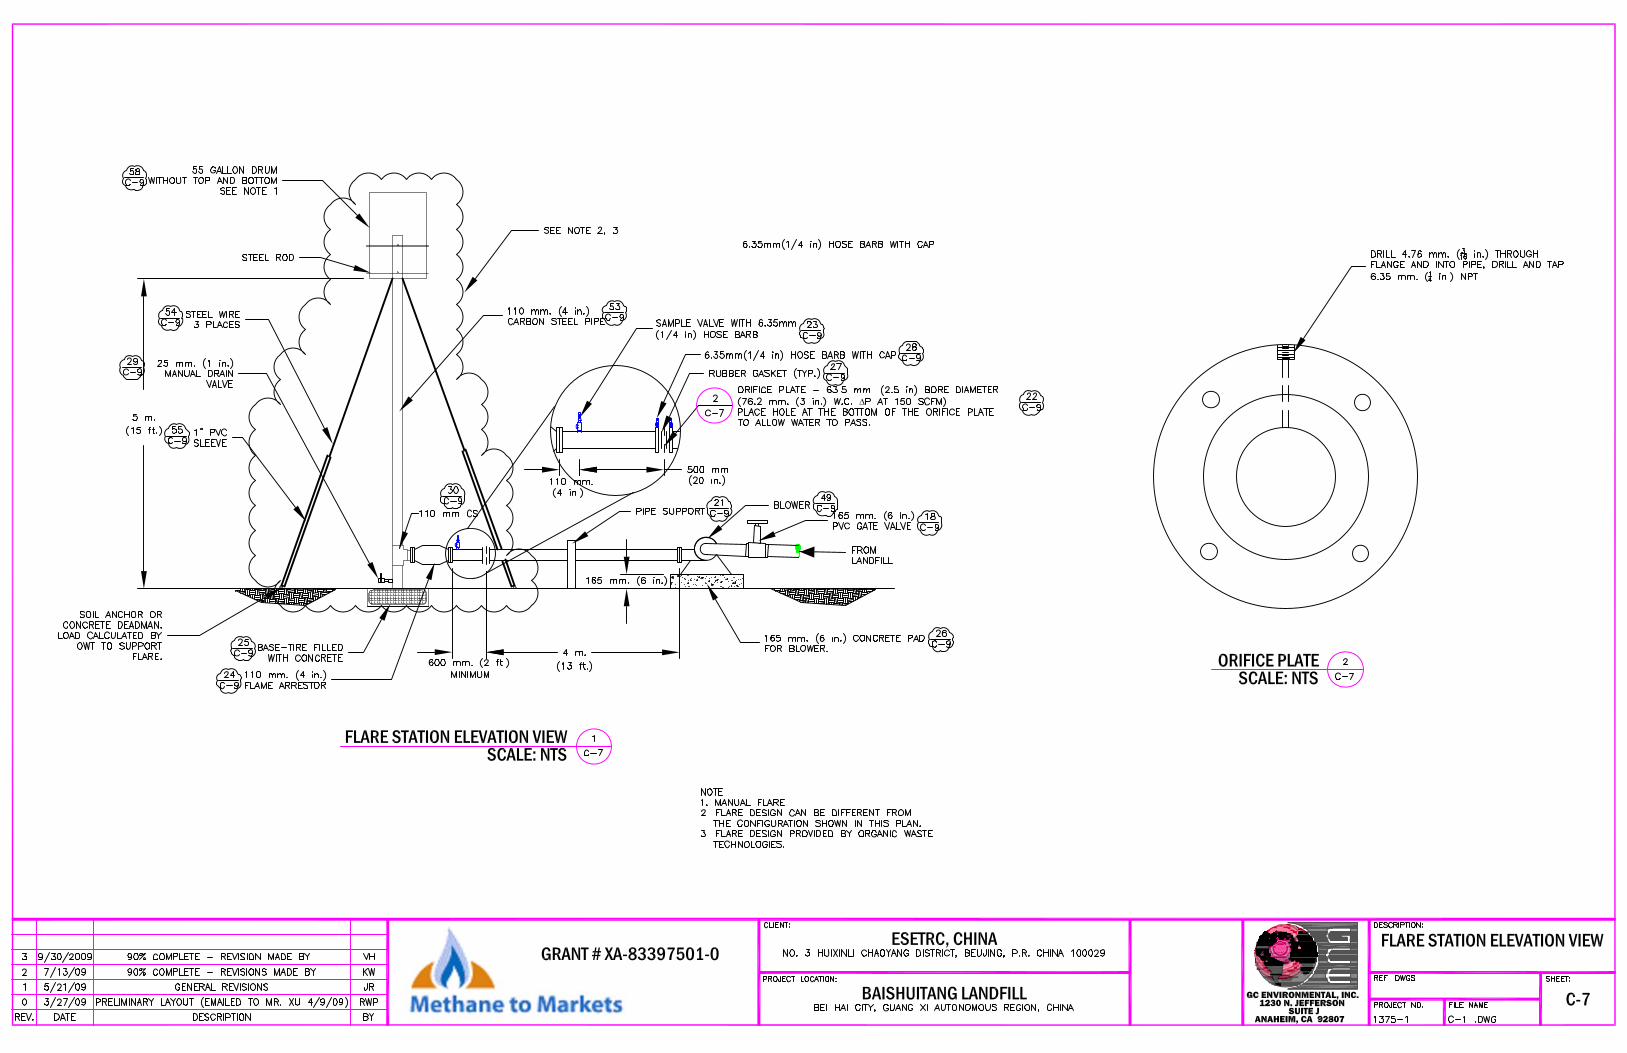
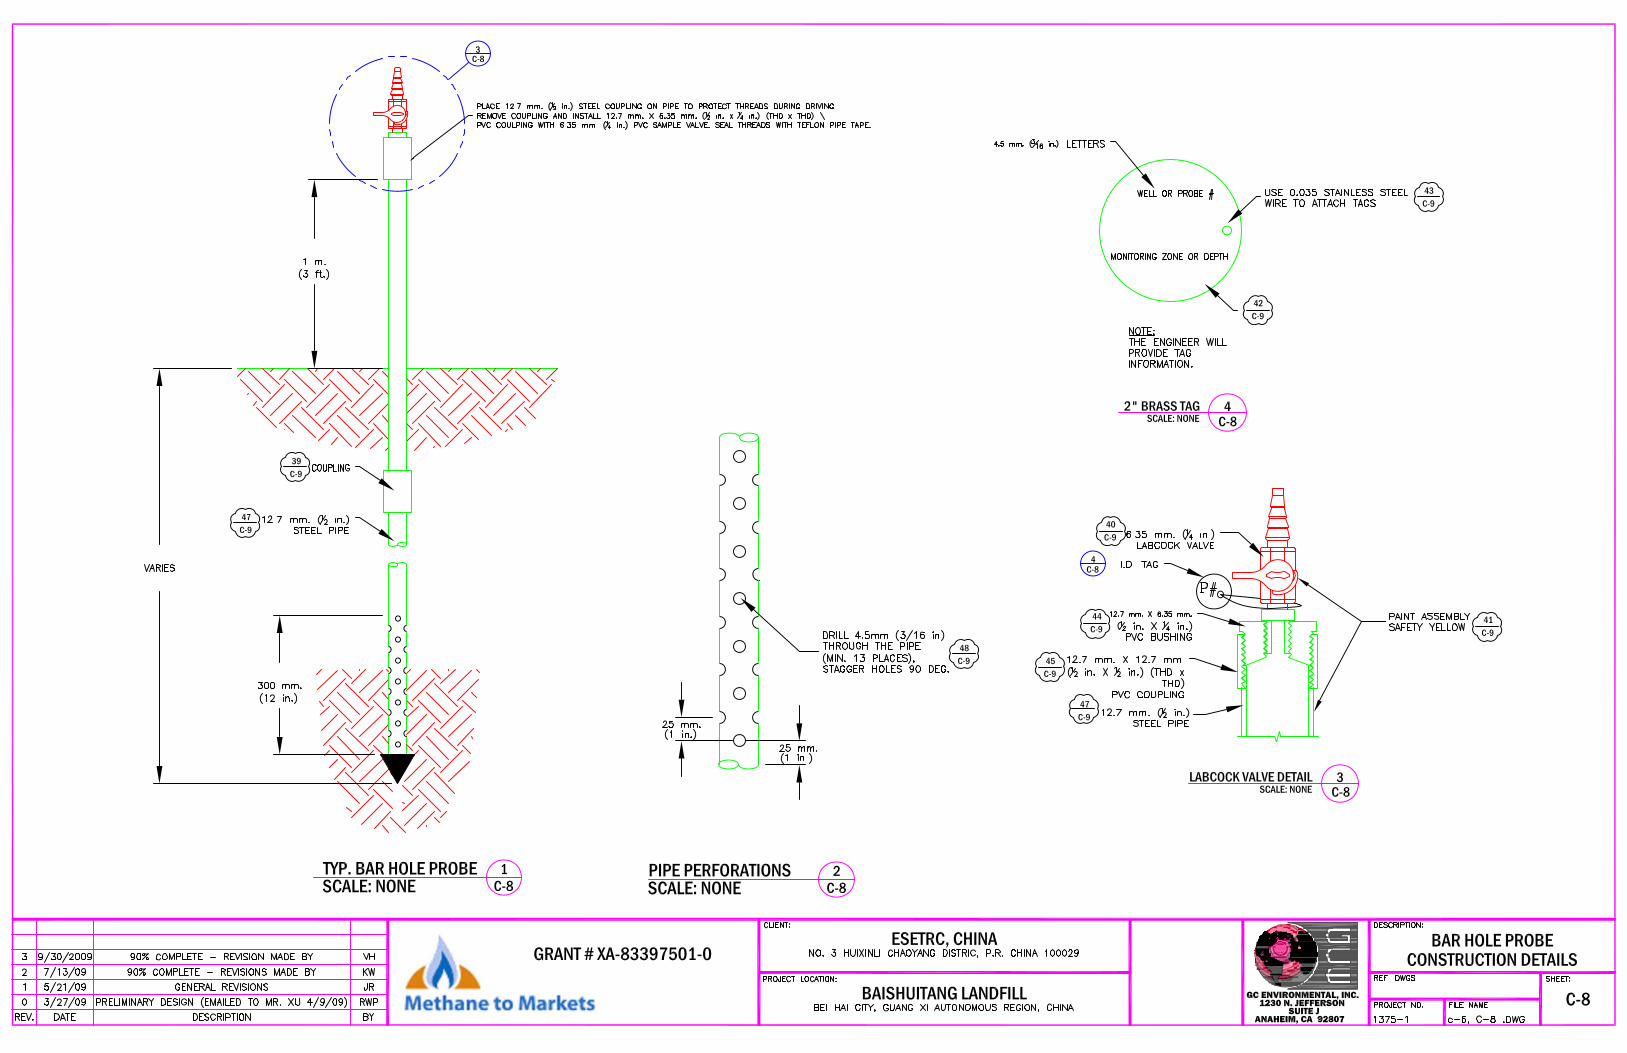
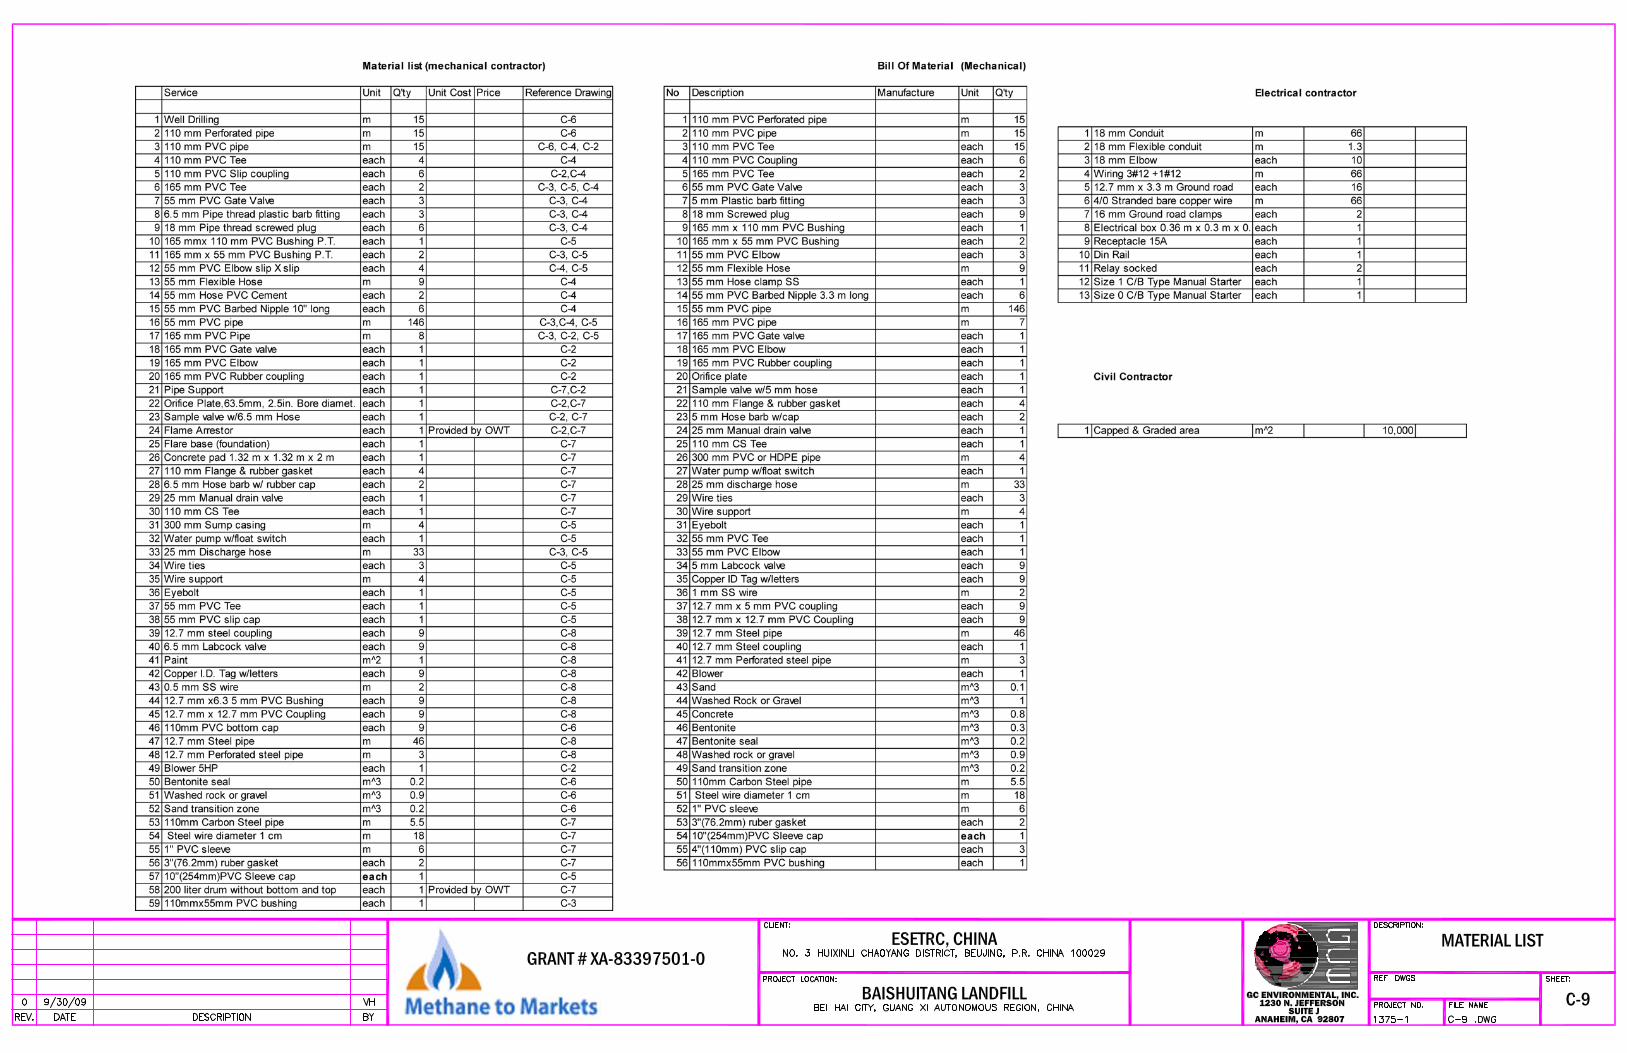
1.2 Project Approach GCE prepared preliminary system design drawings for the installation of a limited scope landfill gas collection system for the pump test. Draft copies of the drawings were submitted to Ms. Rachel Goldstein of EPA, and the PI, Mr. Xu with ESETRC for review and comment. The preliminary system drawings were finalized based on the comments received. Copies of the drawings and the specifications were provided to the construction contractor selected by ESETRC for the installation of the system. Refer to Drawing C-0 through C-9 for the test system design. An initial site visit was made in June 2009 to discuss the Test approach and location with the Chinese Principals. The selected site is located at the northeast corner of the landfill. This area is away from the main landfill operations so it was reasonably well protected and it had power available at a nearby leachate pump station to run the LFG extraction blower and flare.
Page 4 \\90.0.0.14\data\0server\1375-1 EPA - China Beiahai LFG Utilization Feasibility Study\Final Report\Beihai LFG Report.doc
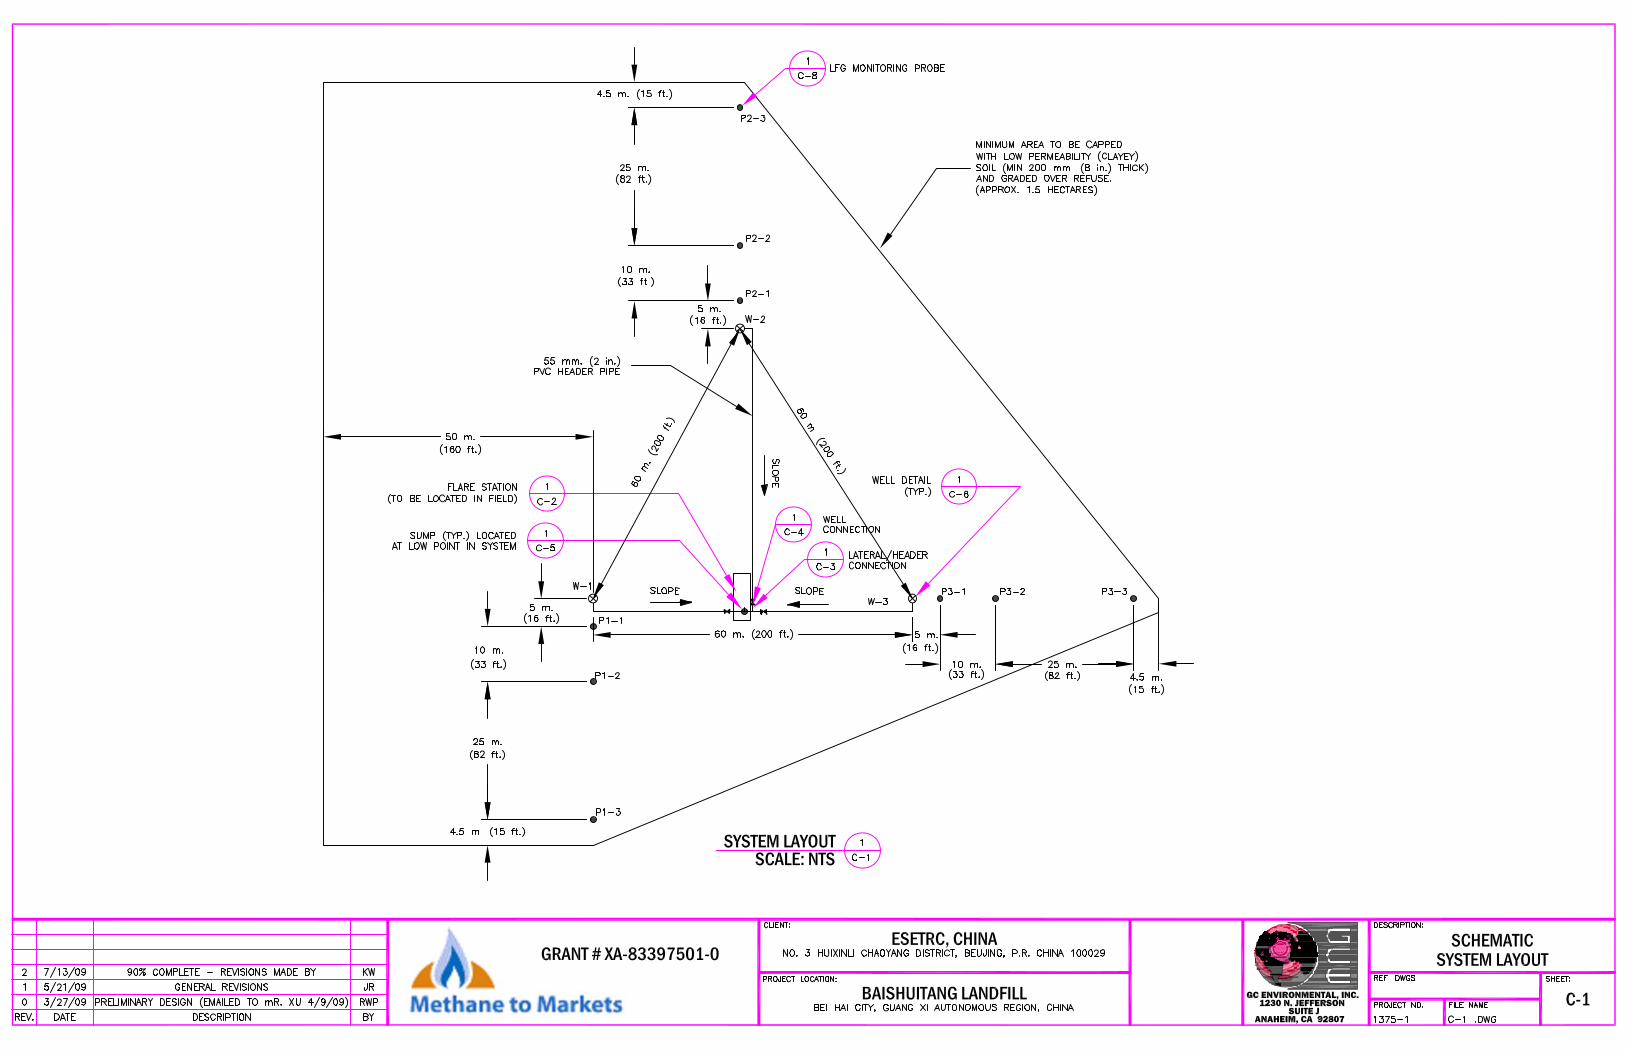
The approach proposed to quantify the methane collection rate was to install a cluster of 3 wells nominally 60 m apart on a triangular pattern. A radial array of probes would be installed by each well to measure well influence (Drawings C0 – C9). Vacuum would be applied to each well to extract landfill gas. Change in pressure measured in the well and probes would be used to calculate the radius of influence of the wells. This information could then be extrapolated over the entire landfill to estimate the current total methane collection rate by the landfill. The test duration was to be 30 days or until sufficient data was collected for the evaluation.
2.0 LANDFILL INFORMATION The Baishuitang landfill design consists of 2 phases (I/II). Only phase I is currently developed (Photo 1).
Phase I Ladnfill Information is provided below:
• Started to accept waste in 1999; as of June 2009 phase I has 17 years of remaining active life.
• Covers an area of 284 meters (N-S) by 462 meters (E-W) (13.1 hectares). • Original ground geometry was a natural triangular trough sloping downwards from
south to north at an angle of approximately 2.5 - 3%. • The irregular bottom surface of the trough was smoothed and covered by a
300 mm compacted clay layer, and HDPE (60 ml) liner, and another clay layer • Based on the design drawings, the landfill will reach a total depth of 45 meters. • There is no daily cover. Refuse was put in at the bottom 4 meters, covered by a 300
mm compacted soil layer, covered by another 3 meters of refuse. There was little cover on the surface. The surface was covered with exposed refuse (plastic, construction debris, stockpile sludge, textile/ clothing, household waste, etc.), and grass/ vegetation growing on the landfill surface in some areas (Photos 3 and 4).
• Landfill accepts waste from the City of Beihai. Daily waste acceptance rate has been 600 tons per day since 2007. Prior to 2007 the daily intake rate was 200 tons per day. Daily rate is recorded at the weigh station on the landfill.
• The area of the landfill receives 1800-2000 mm (70-78 inches) of rain annually. The rainy season is May through October.
• Landfill operates 24 hr. per day, 7 days a week. • Landfill has a high volume of leachate. Based on the information provided by Mr. Xu
(ESETRC), leachate is collected by gravity flow at several locations around the landfill. The design capacity of the leachate treatment plant is 500 m3/day. The collected leachate is treated using an anaerobic digester; followed by aerobic treatment by
Page 5 \\90.0.0.14\data\0server\1375-1 EPA - China Beiahai LFG Utilization Feasibility Study\Final Report\Beihai LFG Report.doc
storage in an unlined leachate pond adjacent to the road on the north side of the landfill. The landfill is currently constructing a concrete lined pond for effluent. Treated leachate is discharged into a small river.
• Sludge from the leachate pond is stockpiled and air dried prior to the use as cover on the landfill.
• Located south and adjacent to the landfill is a fish powder manufacturing facility (Photos 29 and 30).
• An unfinished waste incineration building is located to the west of the landfill. There is no intention of using the incinerator in the future.
• Waste composition is provided in Table 1:
TABLE 1 – Waste Composition
Organic waste 51.75% Paper 5.59% Plastic 11.89% Clay 11.19% Shell (sea) 2.79% Inorganic 11.19% Glass 2.79% Fiber/Cloth 2.79%
The exposed refuse observed at grade had a very high textile content with only a small quantity of observable putrescible organic waste.
3.0 TEST PLAN A test plan was prepared prior to performing the methane collection evaluation at the Baishuitang landfill. The test plan addressed the design and layout of the gas collection wells and monitoring probes, and the procedures used to test for landfill gas flow and gas quality during the test. A copy of the test plan is included in Attachment 1 of this report.
Page 6 \\90.0.0.14\data\0server\1375-1 EPA - China Beiahai LFG Utilization Feasibility Study\Final Report\Beihai LFG Report.doc
4.0 TEST IMPLEMENTATION
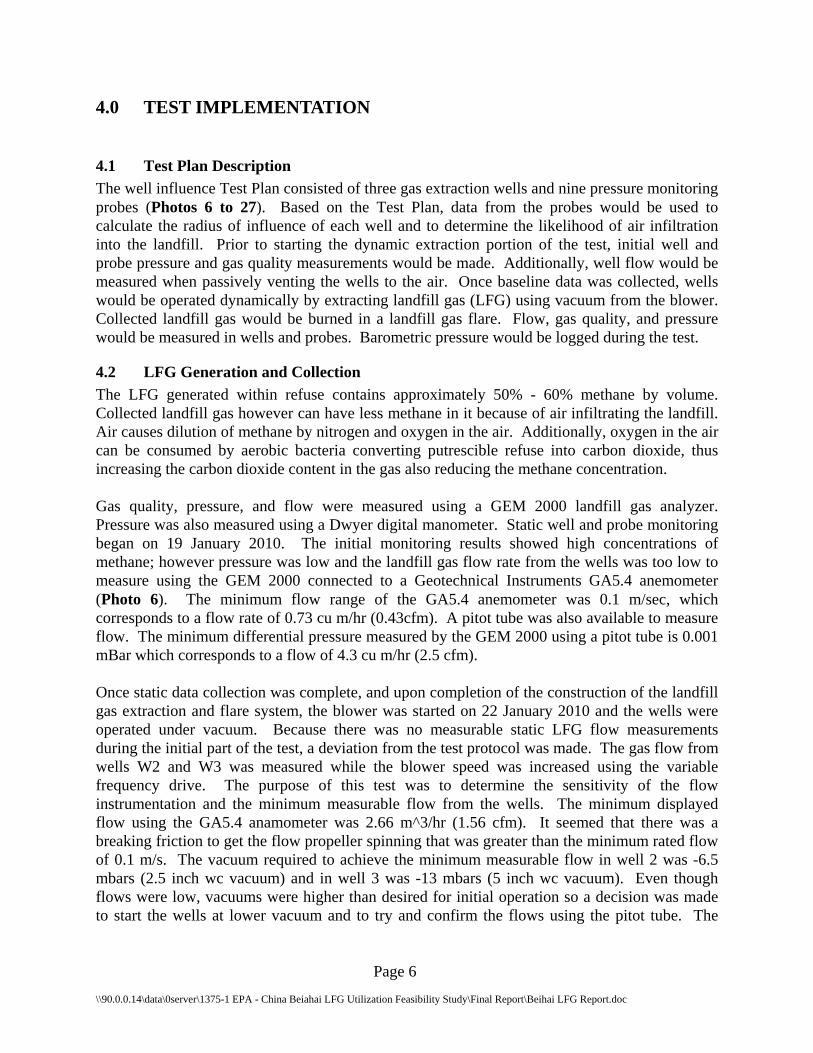
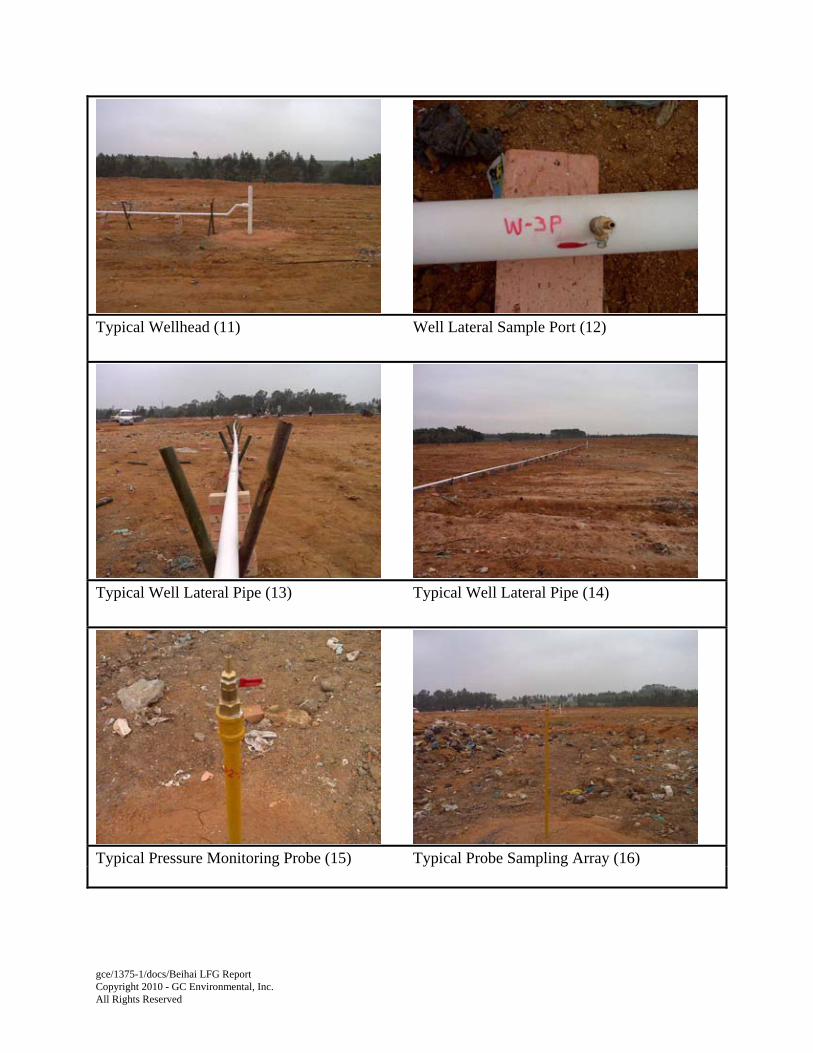
4.1 Test Plan Description The well influence Test Plan consisted of three gas extraction wells and nine pressure monitoring probes (Photos 6 to 27). Based on the Test Plan, data from the probes would be used to calculate the radius of influence of each well and to determine the likelihood of air infiltration into the landfill. Prior to starting the dynamic extraction portion of the test, initial well and probe pressure and gas quality measurements would be made. Additionally, well flow would be measured when passively venting the wells to the air. Once baseline data was collected, wells would be operated dynamically by extracting landfill gas (LFG) using vacuum from the blower. Collected landfill gas would be burned in a landfill gas flare. Flow, gas quality, and pressure would be measured in wells and probes. Barometric pressure would be logged during the test.
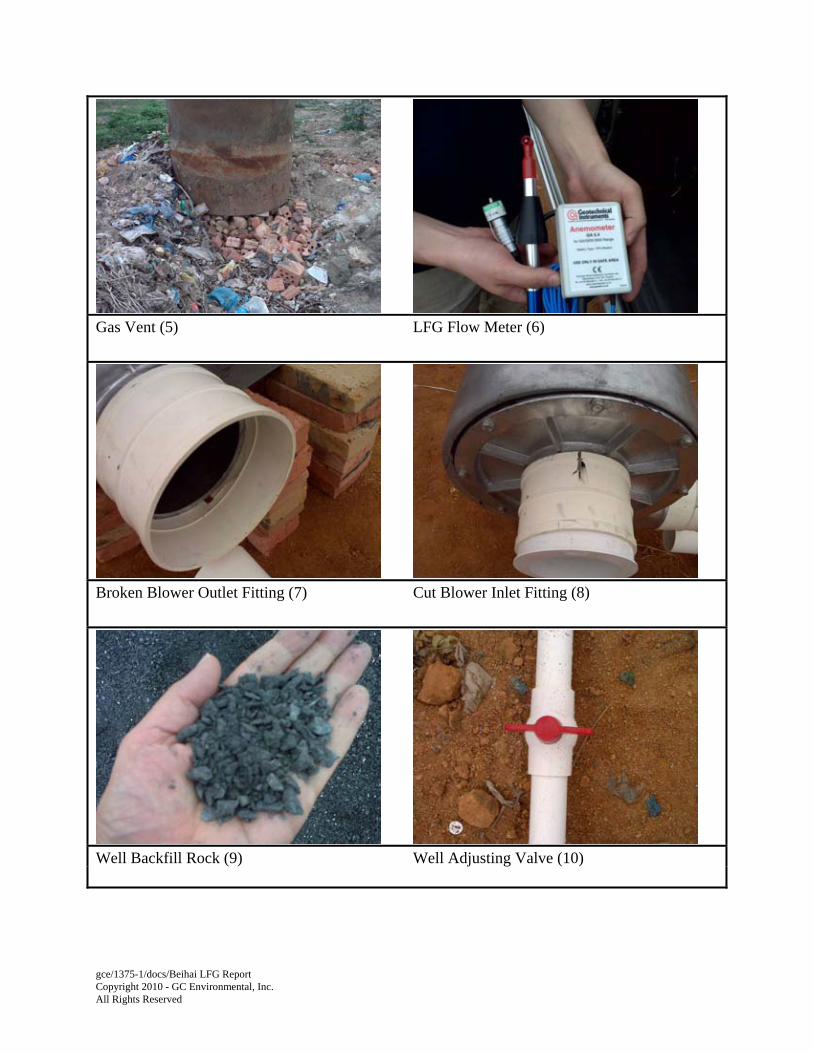
4.2 LFG Generation and Collection The LFG generated within refuse contains approximately 50% - 60% methane by volume. Collected landfill gas however can have less methane in it because of air infiltrating the landfill. Air causes dilution of methane by nitrogen and oxygen in the air. Additionally, oxygen in the air can be consumed by aerobic bacteria converting putrescible refuse into carbon dioxide, thus increasing the carbon dioxide content in the gas also reducing the methane concentration. Gas quality, pressure, and flow were measured using a GEM 2000 landfill gas analyzer. Pressure was also measured using a Dwyer digital manometer. Static well and probe monitoring began on 19 January 2010. The initial monitoring results showed high concentrations of methane; however pressure was low and the landfill gas flow rate from the wells was too low to measure using the GEM 2000 connected to a Geotechnical Instruments GA5.4 anemometer (Photo 6). The minimum flow range of the GA5.4 anemometer was 0.1 m/sec, which corresponds to a flow rate of 0.73 cu m/hr (0.43cfm). A pitot tube was also available to measure flow. The minimum differential pressure measured by the GEM 2000 using a pitot tube is 0.001 mBar which corresponds to a flow of 4.3 cu m/hr (2.5 cfm). Once static data collection was complete, and upon completion of the construction of the landfill gas extraction and flare system, the blower was started on 22 January 2010 and the wells were operated under vacuum. Because there was no measurable static LFG flow measurements during the initial part of the test, a deviation from the test protocol was made. The gas flow from wells W2 and W3 was measured while the blower speed was increased using the variable frequency drive. The purpose of this test was to determine the sensitivity of the flow instrumentation and the minimum measurable flow from the wells. The minimum displayed flow using the GA5.4 anamometer was 2.66 m^3/hr (1.56 cfm). It seemed that there was a breaking friction to get the flow propeller spinning that was greater than the minimum rated flow of 0.1 m/s. The vacuum required to achieve the minimum measurable flow in well 2 was -6.5 mbars (2.5 inch wc vacuum) and in well 3 was -13 mbars (5 inch wc vacuum). Even though flows were low, vacuums were higher than desired for initial operation so a decision was made to start the wells at lower vacuum and to try and confirm the flows using the pitot tube. The
Page 7 \\90.0.0.14\data\0server\1375-1 EPA - China Beiahai LFG Utilization Feasibility Study\Final Report\Beihai LFG Report.doc
blower motor was slowed using the variable frequency drive to 16 hertz (Hz). The corresponding vacuum developed by the blower was nominally -3.1 mbars pressure (1.2 inch w.c. vacuum). When pitot tube measurements were attempted, there was no measurable flow so an alternate flow measurement device was required. The new flow meter consisted of an orifice plate sandwiched between the flat surfaces of a PVC union located in the well lateral pipes near the blower. The orifice was constructed of thin rigid PVC sheet. One side of the orifice plate was sealed to the union using the o-ring that is integral in PVC unions and the other side was sealed by inserting a rubber gasket between the orifice plate and the union. The desired flow measurement range of the orifice plate was estimated and 12 mm holes were drilled in the PVC orifice plates. The initial hole size proved to be too large so they were sealed by gluing PVC sheet over them and a new smaller hole was cut in the orifice plates. The new holes were nominally 6.2 mm diameter. The orifice plates with these small holes were able to provide a flow measurement, although its accuracy is unknown because the beta ratio (the diameter of the orifice divided by the pipe diameter) is substantially below the normal range for orifice plates. Photos 18 and 20 shows an orifice plate as installed in the pipe. The orifice hole was installed at the bottom of the pipe to promote liquid passage through it. Following the installation of the orifice plate flow meters, the flow from the wells was measured while operating at this vacuum. The calculated flows are shown in Table 2.
TABLE 2 – Initial Well Flows
Flow Well Number M^3/Hr SCFM W1 0.42 0.25 W2 0.34 0.20 W3 0.85 0.50 In spite of these very low flows, methane quality in the wells dropped immediately. The following table shows the methane quality at the beginning of the test, at the end of the first day and the following morning (Table 3) at these flow rates. As the test proceeded, the methane quality continued to remain low so the blower vacuum was progressively reduced by slowing the blower speed using the variable frequency drive.
Page 8 \\90.0.0.14\data\0server\1375-1 EPA - China Beiahai LFG Utilization Feasibility Study\Final Report\Beihai LFG Report.doc
TABLE 3 – Initial Methane Quality Data Methane Quality Well Number Initial End of one day Beginning of
Day 2 W1 51.9% 3.3% 2.8% W2 67.4% 34.4% 14.7% W3 69.4% 19.9% 15.6%
4.1 Radius of Influence Test A radial array of probes was installed by each well to measure vacuum influence. The procedure to measure influence was to allow wells to reach steady state operation and then turn them off. Pressure was measured in the probes before and after the wells were turned off to measure the increase in pressure in the probe arrays. One thing that became immediately apparent was a number of the sample valves on the probes leaked. Leaks were present in the threads around the valve hose barbs and where the valves screwed into the steel probes. The valves and hose barbs were removed, new Teflon tape was installed, and they were reinstalled. It was essential that no leaking be present because pressures were so slight it was already difficult to see influence in the probes. Measurements were initially made at the 0.1 mbar level using a Dwyer digital manometer. This instrument did not provide sufficient resolution so its use was discontinued in favor of the GEM 2000. The GEM 2000 had a certain amount of noise and there were variations in pressure readings when the instrument was in free air. There were also unexplained pressure variations measured in the probes when the system was operating in steady state conditions. The challenge became noting changes in probe pressures through the instrument noise and landfill pressure variations. Ultimately it seemed that the noise was greater than any pressure change in the probes so this part of the test was deemed unreliable even though only one data point was obtained.
4.2 Methane Variations During the Test GCE observed substantial methane variation during the test caused by differing amounts of air infiltration. During the test there were bouts of increased methane, however there were questions if this recovery was caused by displacement of air in the refuse caused by generation being greater than collection or caused by changing barometric pressure. To determine if barometric pressure was the source of the change, a test was performed. While the system was operating normally, barometric pressure and methane in the wells were measured through part of the day. A plot of methane quality vs. the rate of change in barometric pressure was made for the evaluation.
Page 9 \\90.0.0.14\data\0server\1375-1 EPA - China Beiahai LFG Utilization Feasibility Study\Final Report\Beihai LFG Report.doc
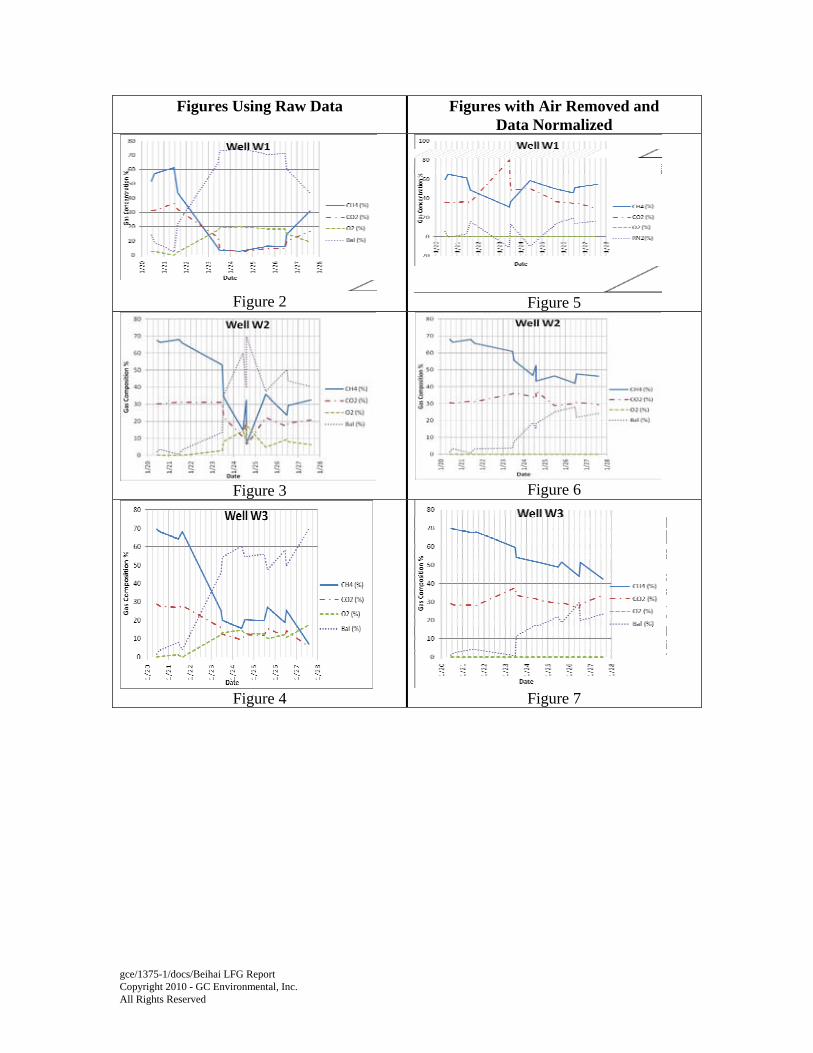
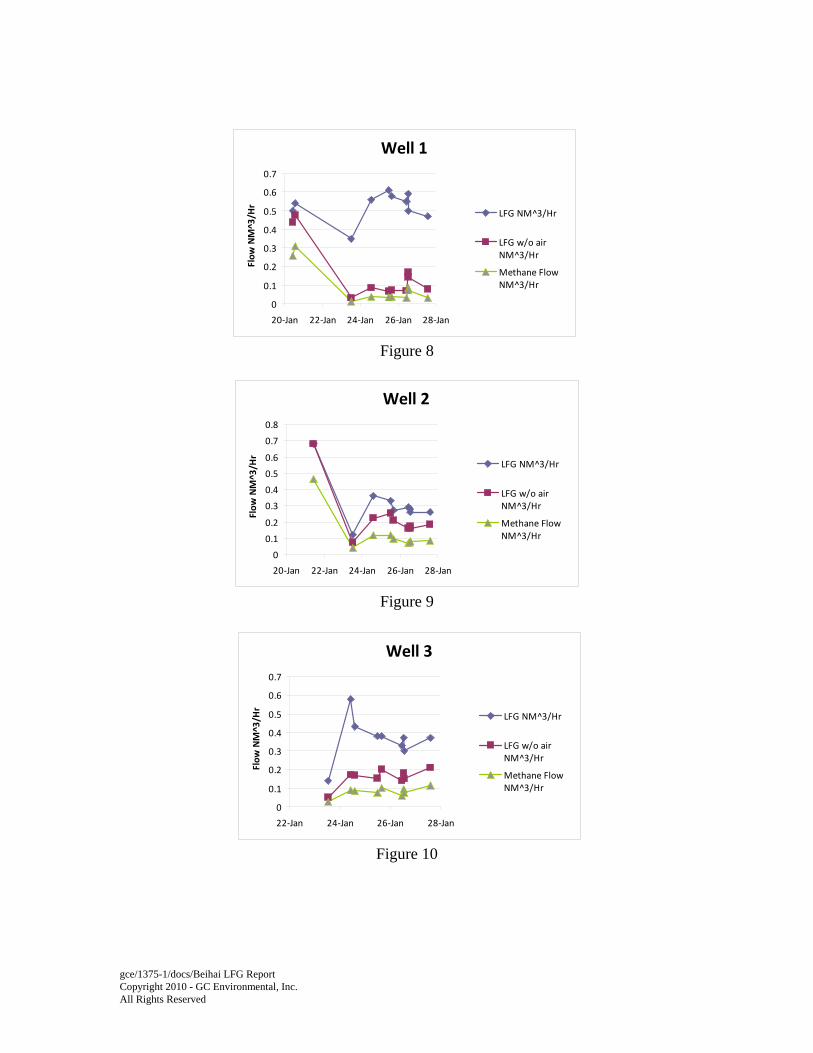
4.3 Data Evaluation Even though the applied vacuum and corresponding LFG extraction rates were low, air readily infiltrated the landfill and the methane quality in the wells began dropping immediately. Because the LFG well flows and vacuums were low, a decision was made to initially leave the flow rate alone because there was a concern that if flows were too low there would be no point in conducting the test. To try and evaluate the methane collection in the vicinity of the wells, data for the wells was plotted two ways. The first shows the methane quality as measured by the GEM 2000 and the second shows the methane quality when the air (21% oxygen and 79% nitrogen) that infiltrated through the landfill surface was subtracted and the remaining gas concentrations normalized. For this second case oxygen in all figures is zero. These results for methane are shown on Figures 2- 7. Using the approach of subtracting infiltrating air showed that the methane quality in the gas dropped, but not nearly as dramatically as the raw data would indicate. The bigger issue is that the relatively low landfill gas extraction rates were actually lower than originally observed because such a large part of the collected gas was actually air. There were two causes for the air infiltration. First, the wells are shallow and the short-circuit path to the landfill surface is short. GCE was aware that this condition may be problematic so the design placed the well perforations as deep as possible in waste. Second, the cover soil on the landfill surface is discontinuous. GCE requested the landfill be covered with soil in the area of the test and this was performed, however the cover depth was minimal and there was still substantial refuse exposed through the cover soil. Similar to the above figures, the LFG flow as measured by the orifice plates and the LFG flow rate after air is subtracted are shown on Figures 8 - 10. The landfill gas extraction rate stayed relatively constant throughout the Test. After the initial drawdown, the undiluted LFG flow rate and methane flow rate also remained relatively constant. The steady state flows for the three wells are estimated in Table 4.
TABLE 4 – Steady State Flow Rates Well Number
Landfill gas flow Nm3/Hr.
Methane gas flow Nm3/Hr.
% Air in Sample
1 0.08 0.03 86% 2 0.18 0.09 36% 3 0.20 0.10 51%
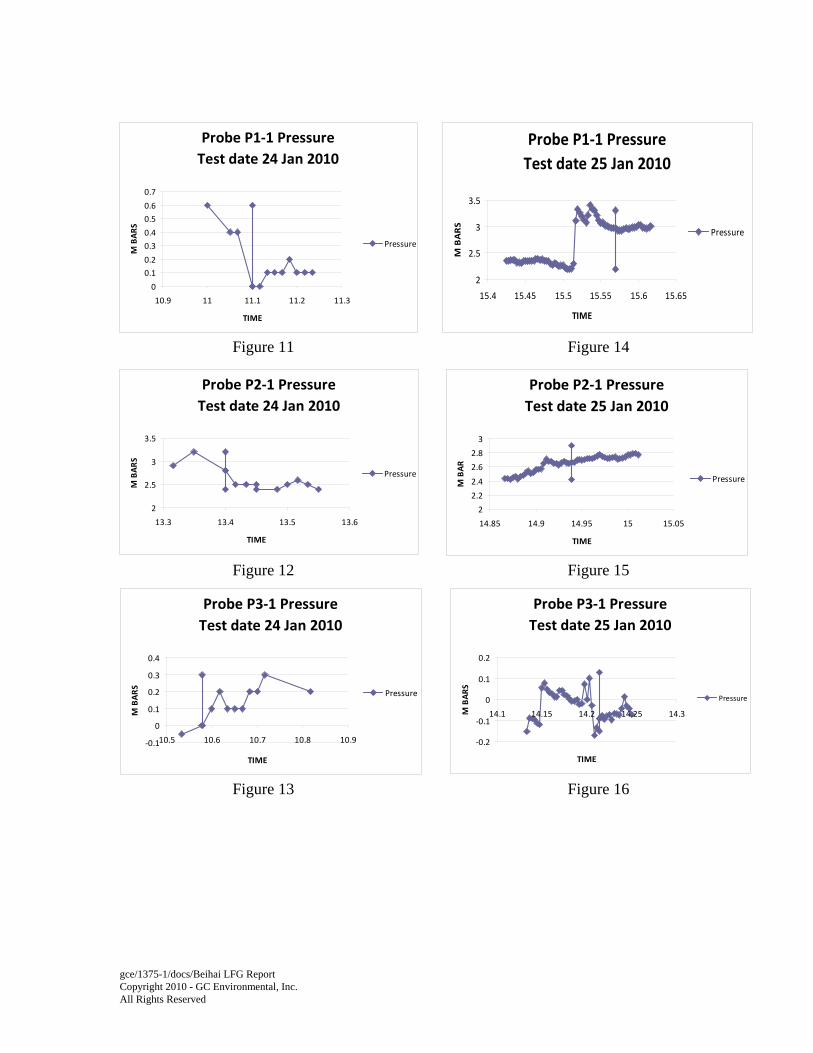
To try and collect improved data, the GEM 2000 was used to measure pressure in the probes. This instrument has a pressure transmitter that is supposed to turn down to 0.001 Mbars. However, the amount of noise in the instrument, drift in the pressure transmitter, and unexplained pressure variants caused by the Landfill made this difficult to use. The only probe that may have showed influence was probe P3-1 located 5 m from Well 3. The well pressure
Page 10 \\90.0.0.14\data\0server\1375-1 EPA - China Beiahai LFG Utilization Feasibility Study\Final Report\Beihai LFG Report.doc
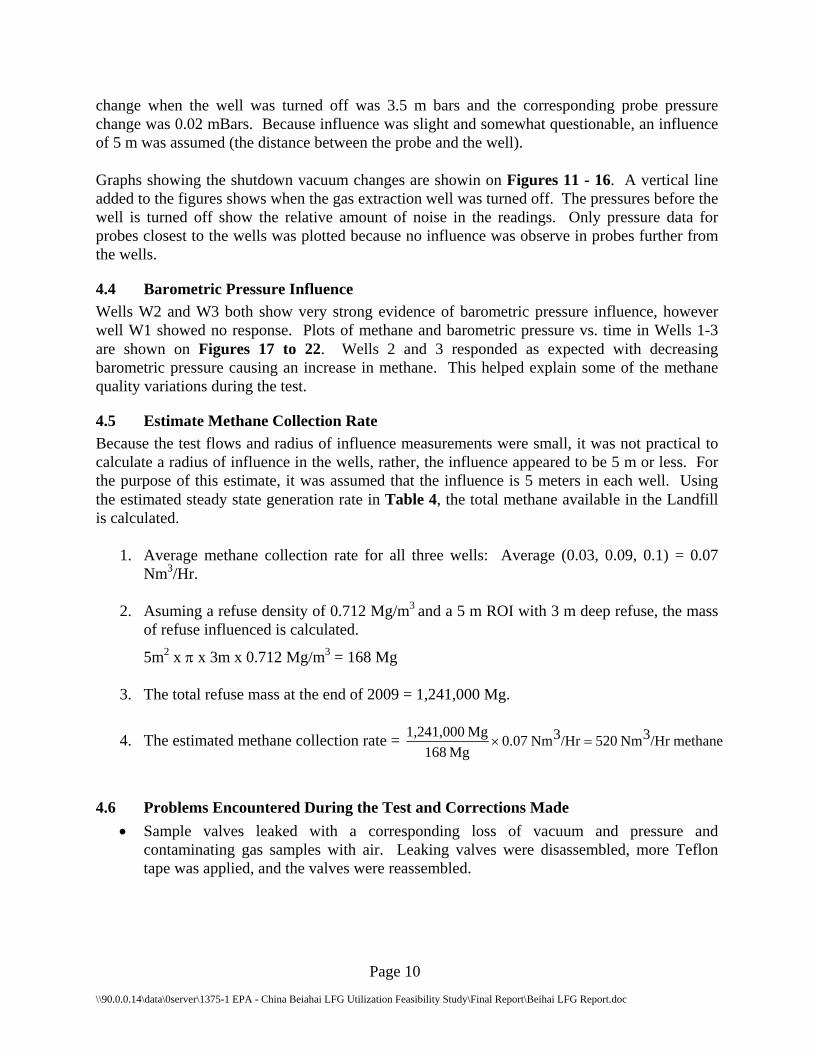
change when the well was turned off was 3.5 m bars and the corresponding probe pressure change was 0.02 mBars. Because influence was slight and somewhat questionable, an influence of 5 m was assumed (the distance between the probe and the well). Graphs showing the shutdown vacuum changes are showin on Figures 11 - 16. A vertical line added to the figures shows when the gas extraction well was turned off. The pressures before the well is turned off show the relative amount of noise in the readings. Only pressure data for probes closest to the wells was plotted because no influence was observe in probes further from the wells.
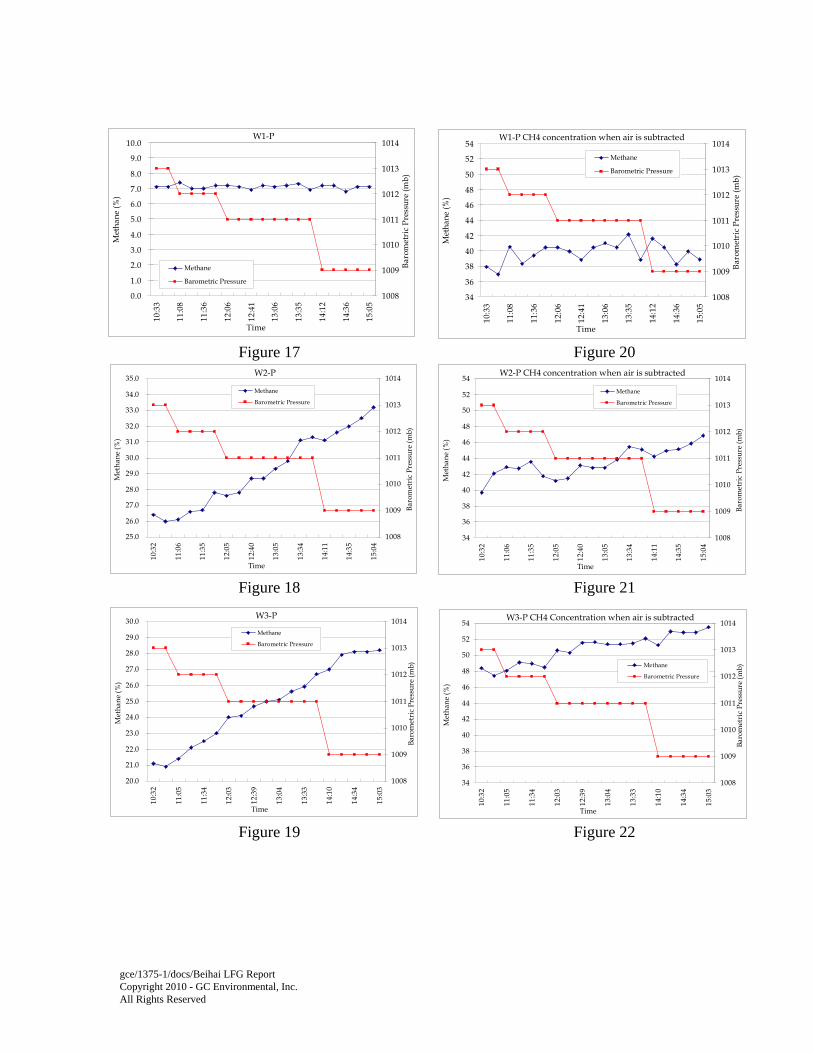
4.4 Barometric Pressure Influence Wells W2 and W3 both show very strong evidence of barometric pressure influence, however well W1 showed no response. Plots of methane and barometric pressure vs. time in Wells 1-3 are shown on Figures 17 to 22. Wells 2 and 3 responded as expected with decreasing barometric pressure causing an increase in methane. This helped explain some of the methane quality variations during the test.
4.5 Estimate Methane Collection Rate Because the test flows and radius of influence measurements were small, it was not practical to calculate a radius of influence in the wells, rather, the influence appeared to be 5 m or less. For the purpose of this estimate, it was assumed that the influence is 5 meters in each well. Using the estimated steady state generation rate in Table 4, the total methane available in the Landfill is calculated.
1. Average methane collection rate for all three wells: Average (0.03, 0.09, 0.1) = 0.07 Nm3/Hr.
2. Asuming a refuse density of 0.712 Mg/m3 and a 5 m ROI with 3 m deep refuse, the mass
of refuse influenced is calculated.
5m2 x π x 3m x 0.712 Mg/m3 = 168 Mg
3. The total refuse mass at the end of 2009 = 1,241,000 Mg.
4. The estimated methane collection rate = methane/Hr 3Nm 520/Hr3Nm 0.07 Mg168
Mg1,241,000=×
4.6 Problems Encountered During the Test and Corrections Made • Sample valves leaked with a corresponding loss of vacuum and pressure and
contaminating gas samples with air. Leaking valves were disassembled, more Teflon tape was applied, and the valves were reassembled.
Page 11 \\90.0.0.14\data\0server\1375-1 EPA - China Beiahai LFG Utilization Feasibility Study\Final Report\Beihai LFG Report.doc
• No measurable vacuum influence at the probes. Because of this, the total gas generation rate from the landfill could not be calculated using conventional measurement techniques.
• Poor landfill cover allowed air to freely infiltrate refuse. Flows were already low so turning wells down didn’t seem like an option. Instead, air diluting landfill gas was subtracted from the results to arrive at the methane and carbon dioxide gas concentrations in the raw landfill gas.
• The total extracted LFG flow rate was too low to burn the gas in the flare. The flare could not be used and extracted gas was allowed to free vent.
• Landfill personnel turned the system off. The system was restarted. • Blower inlet and outlet connections were not tight and leaked air. Remade discharge
connections and sealed the suction fittings. • Ball valves were used for well flow control. The flow from the wells was controlled by
using the variable speed drive that was connected to the blower. • Existing steel vents will allow air infiltration. These were sufficiently far from the wells
to avoid air infiltration. When a complete LFG system is installed, GCE recommends converting the vents to wells and discontinuing this practice in the future.
• Very low flow from wells.
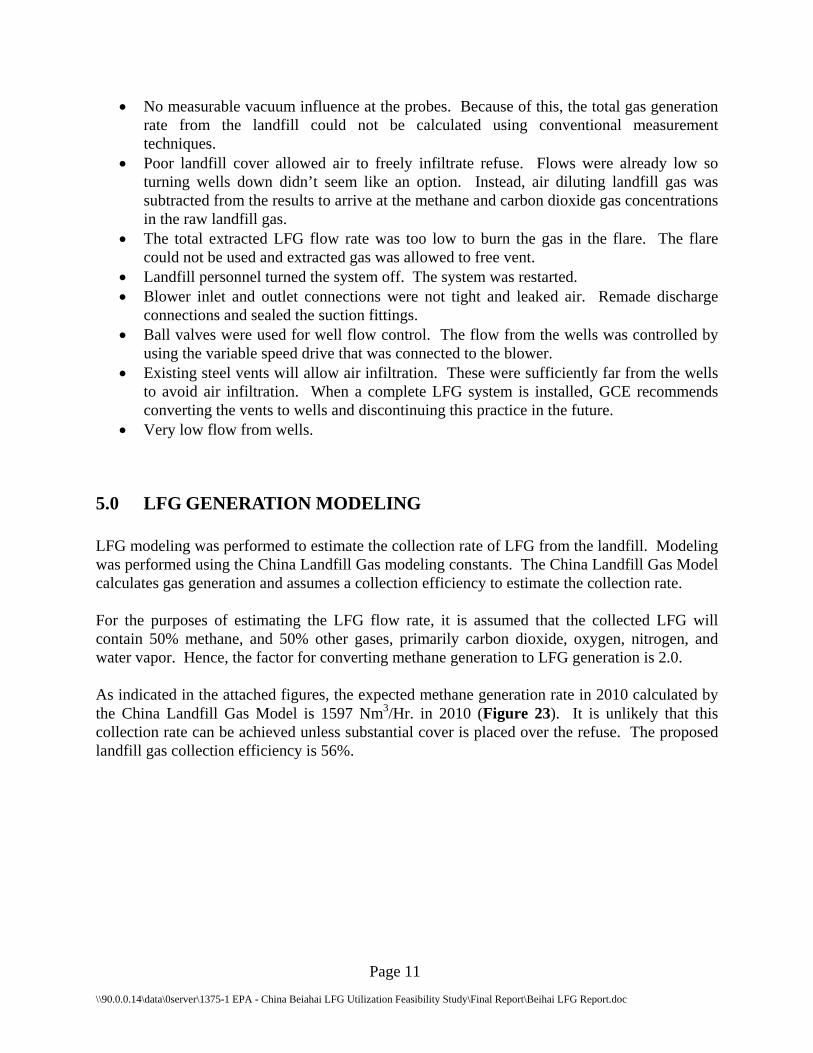
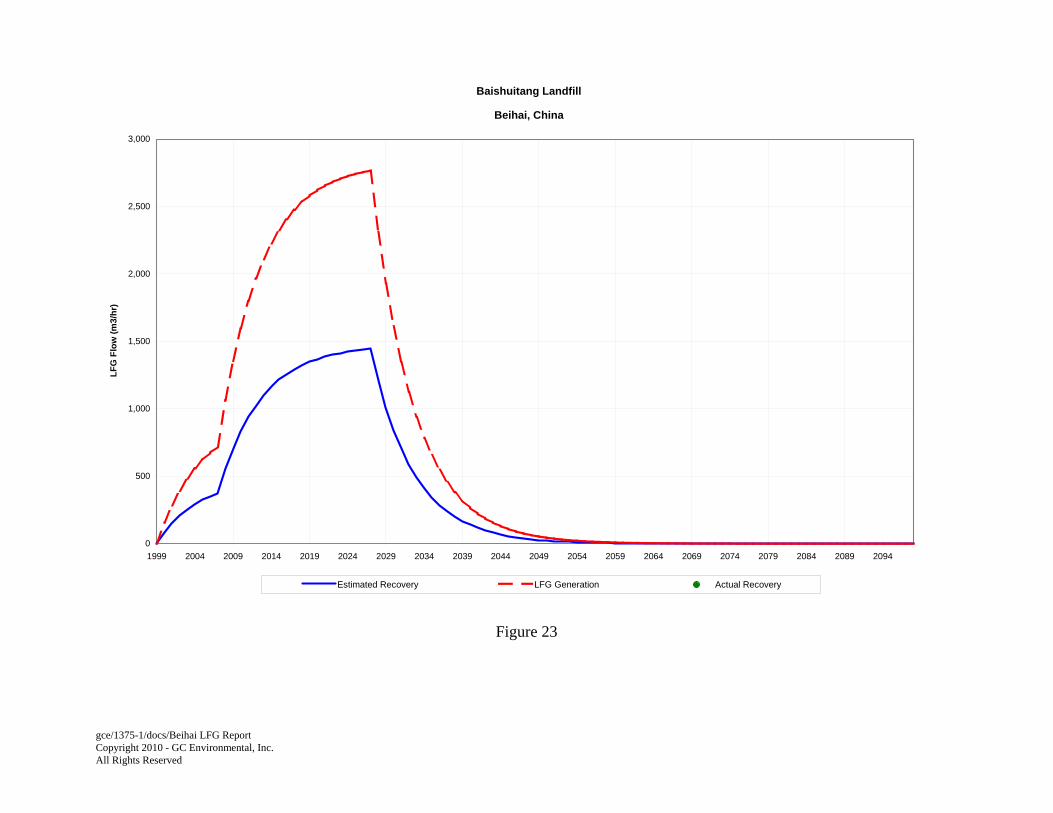
5.0 LFG GENERATION MODELING LFG modeling was performed to estimate the collection rate of LFG from the landfill. Modeling was performed using the China Landfill Gas modeling constants. The China Landfill Gas Model calculates gas generation and assumes a collection efficiency to estimate the collection rate. For the purposes of estimating the LFG flow rate, it is assumed that the collected LFG will contain 50% methane, and 50% other gases, primarily carbon dioxide, oxygen, nitrogen, and water vapor. Hence, the factor for converting methane generation to LFG generation is 2.0. As indicated in the attached figures, the expected methane generation rate in 2010 calculated by the China Landfill Gas Model is 1597 Nm3/Hr. in 2010 (Figure 23). It is unlikely that this collection rate can be achieved unless substantial cover is placed over the refuse. The proposed landfill gas collection efficiency is 56%.
Page 12 \\90.0.0.14\data\0server\1375-1 EPA - China Beiahai LFG Utilization Feasibility Study\Final Report\Beihai LFG Report.doc
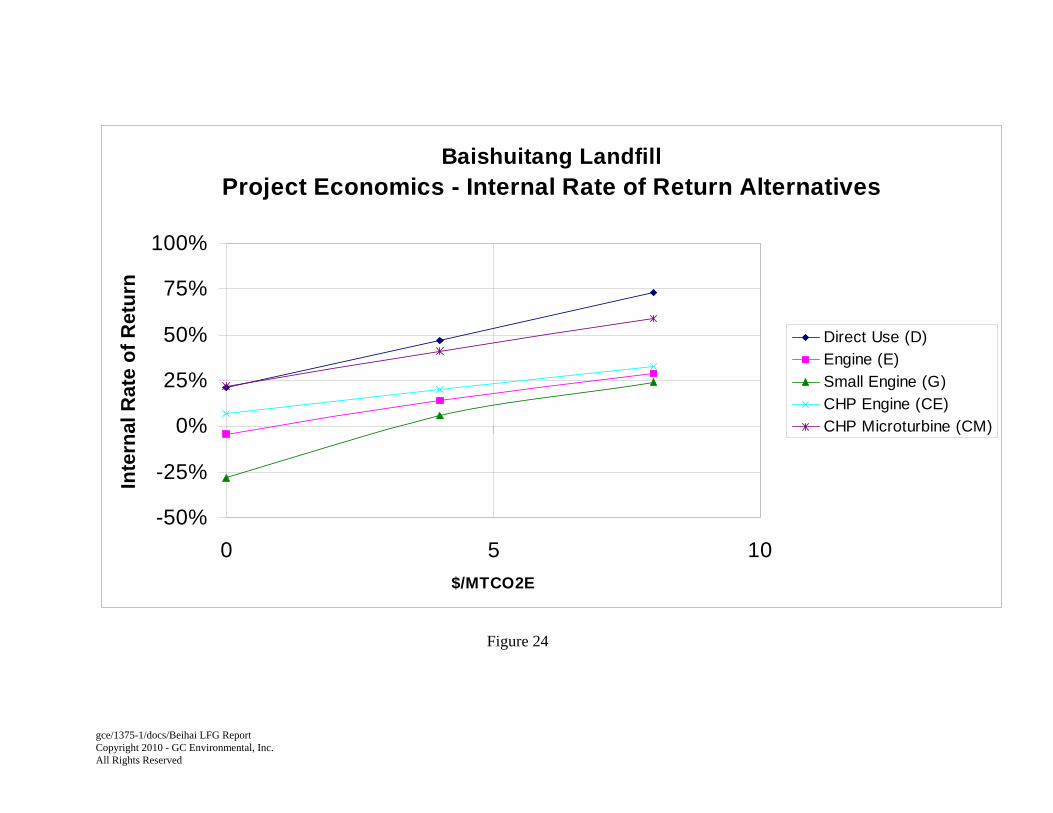
6.0 LANDFILL GAS UTILIZATION OPTIONS Several options exist to utilize landfill gas if and when sufficient gas is available. These include both for industrial users and power generation. Because of the shallow nature of the landfill, upgrading the methane to high btu gas is not considered practical at this time and is not considered in this evaluation. In addition to utilization options, there are also benefits of collecting landfill gas and burning the methane for the greenhouse gas emission reduction credits that are generated. The sale of these credits will provide a second revenue source. Financial evaluations were run using emission reduction credits of $0., $4., and $8./MTCO2e.
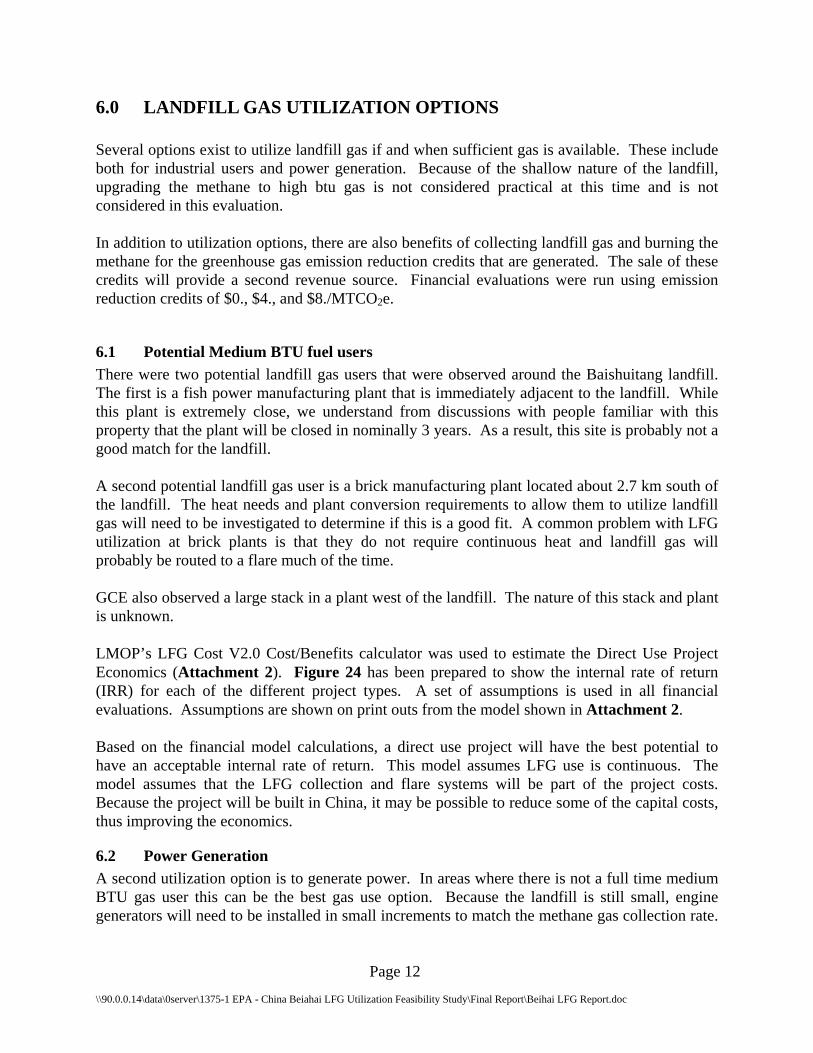
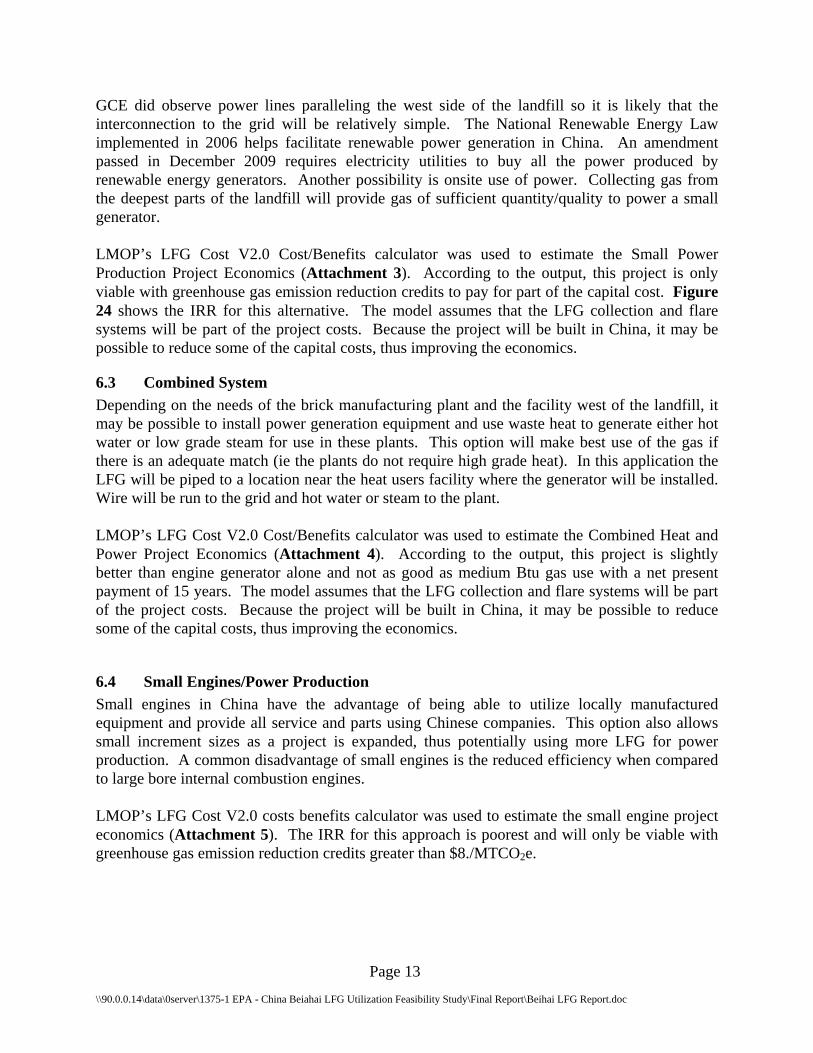
6.1 Potential Medium BTU fuel users There were two potential landfill gas users that were observed around the Baishuitang landfill. The first is a fish power manufacturing plant that is immediately adjacent to the landfill. While this plant is extremely close, we understand from discussions with people familiar with this property that the plant will be closed in nominally 3 years. As a result, this site is probably not a good match for the landfill. A second potential landfill gas user is a brick manufacturing plant located about 2.7 km south of the landfill. The heat needs and plant conversion requirements to allow them to utilize landfill gas will need to be investigated to determine if this is a good fit. A common problem with LFG utilization at brick plants is that they do not require continuous heat and landfill gas will probably be routed to a flare much of the time. GCE also observed a large stack in a plant west of the landfill. The nature of this stack and plant is unknown. LMOP’s LFG Cost V2.0 Cost/Benefits calculator was used to estimate the Direct Use Project Economics (Attachment 2). Figure 24 has been prepared to show the internal rate of return (IRR) for each of the different project types. A set of assumptions is used in all financial evaluations. Assumptions are shown on print outs from the model shown in Attachment 2. Based on the financial model calculations, a direct use project will have the best potential to have an acceptable internal rate of return. This model assumes LFG use is continuous. The model assumes that the LFG collection and flare systems will be part of the project costs. Because the project will be built in China, it may be possible to reduce some of the capital costs, thus improving the economics.
6.2 Power Generation A second utilization option is to generate power. In areas where there is not a full time medium BTU gas user this can be the best gas use option. Because the landfill is still small, engine generators will need to be installed in small increments to match the methane gas collection rate.
Page 13 \\90.0.0.14\data\0server\1375-1 EPA - China Beiahai LFG Utilization Feasibility Study\Final Report\Beihai LFG Report.doc
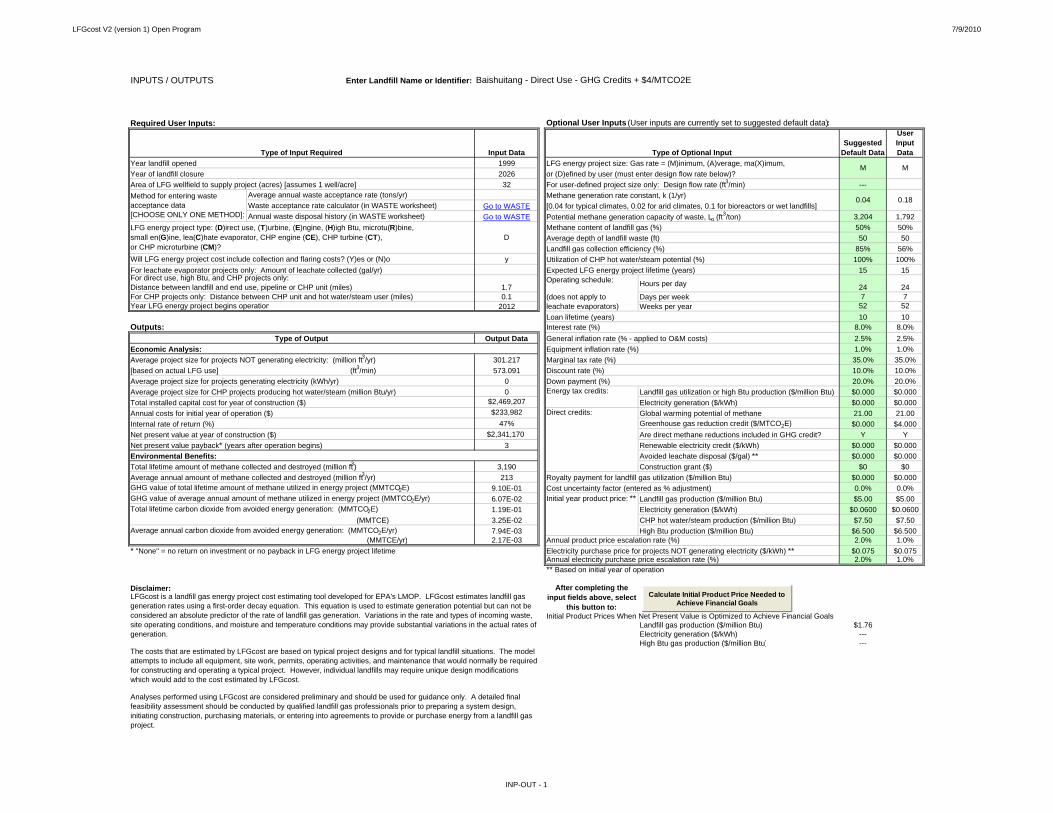
GCE did observe power lines paralleling the west side of the landfill so it is likely that the interconnection to the grid will be relatively simple. The National Renewable Energy Law implemented in 2006 helps facilitate renewable power generation in China. An amendment passed in December 2009 requires electricity utilities to buy all the power produced by renewable energy generators. Another possibility is onsite use of power. Collecting gas from the deepest parts of the landfill will provide gas of sufficient quantity/quality to power a small generator. LMOP’s LFG Cost V2.0 Cost/Benefits calculator was used to estimate the Small Power Production Project Economics (Attachment 3). According to the output, this project is only viable with greenhouse gas emission reduction credits to pay for part of the capital cost. Figure 24 shows the IRR for this alternative. The model assumes that the LFG collection and flare systems will be part of the project costs. Because the project will be built in China, it may be possible to reduce some of the capital costs, thus improving the economics.
6.3 Combined System Depending on the needs of the brick manufacturing plant and the facility west of the landfill, it may be possible to install power generation equipment and use waste heat to generate either hot water or low grade steam for use in these plants. This option will make best use of the gas if there is an adequate match (ie the plants do not require high grade heat). In this application the LFG will be piped to a location near the heat users facility where the generator will be installed. Wire will be run to the grid and hot water or steam to the plant. LMOP’s LFG Cost V2.0 Cost/Benefits calculator was used to estimate the Combined Heat and Power Project Economics (Attachment 4). According to the output, this project is slightly better than engine generator alone and not as good as medium Btu gas use with a net present payment of 15 years. The model assumes that the LFG collection and flare systems will be part of the project costs. Because the project will be built in China, it may be possible to reduce some of the capital costs, thus improving the economics.
6.4 Small Engines/Power Production Small engines in China have the advantage of being able to utilize locally manufactured equipment and provide all service and parts using Chinese companies. This option also allows small increment sizes as a project is expanded, thus potentially using more LFG for power production. A common disadvantage of small engines is the reduced efficiency when compared to large bore internal combustion engines. LMOP’s LFG Cost V2.0 costs benefits calculator was used to estimate the small engine project economics (Attachment 5). The IRR for this approach is poorest and will only be viable with greenhouse gas emission reduction credits greater than $8./MTCO2e.
Page 14 \\90.0.0.14\data\0server\1375-1 EPA - China Beiahai LFG Utilization Feasibility Study\Final Report\Beihai LFG Report.doc
6.5 Microturbine/Combined Heat and Power This economic evaluation was originally not going to be included in this economic evaluation because it will be costly to service microturbines in China. When the IRR calculations were performed, the IRR for microturbines/combined heat and power rivaled that of medium Btu gas use so it was included. LMOP’s LFG Cost V2.0 cost/benefits calculator was used to estimate the financial return (Attachment 6). The model assumes continuous gas use and 15 year project lift. This latter assumption may be invalid because microturbines have yet to demonstrate this type of reliability. One significant advantage of microturbines is they have low NOx and unburned hydrocarbon emissions when compared to other technologies.
7.0 CONCLUSIONS Project development does not appear to be economical at this time for multiple reasons. First and foremost, the Landfill is shallow without sufficient cover to economically collect the landfill gas. Second, even with improved Landfill development, the economics provided by LMOP’s LFG Cost V2.0 program greenhouse gas emission reduction credits will be required for a project to work. With the current world wide financial situation, the market for greenhouse gas emission reduction credits is down, but this is not expected to last. In the mean time, recommendations 1-5 below should be implemented in preparation for project development. Based on the site visit and Google Satelite photographs of the site, it appears that there may be multiple opportunities to use LFG in brick making operations. This alternative should be explored to see if a crude LFG collection / treatment system and burner system at a brick plant can be implemented as a simplified system and possibly allow early project development.
8.0 RECOMMENDATIONS There are multiple recommendations that are included herein to improve future methane gas collection.
1. The Landfill fills across the entire landfill surface for each lift. It would be more advantageous to select nominally 3 hectare areas and fill these to the final elevation. This will provide deep trash isolated from infiltrating air that should be ripe for methane generation. Also, vertical wells constructed in the deeper refuse will be more efficient having a larger potential radius of influence.
2. The rock filled gas wells should be terminated at approximately mid elevation in the Landfill and solid pipe extended to the landfill surface. By implementing recommendation 1, these wells will become functional much sooner.
Page 15 \\90.0.0.14\data\0server\1375-1 EPA - China Beiahai LFG Utilization Feasibility Study\Final Report\Beihai LFG Report.doc
3. Improved cover is essential for best LFG generation and collection. Thin intermediate cover and good final cover should make a substantial improvement in LFG generation.
4. A landfill fill plan should be developed that enhances methane gas production and collection. The fill plan should show the sequence of areas to fill, elevations, and slopes. Concurrent with this plan, a master landfill gas collection plan should be developed. The LFG plan should show the size and locations of headers, wells, and flare system. Additionally, the flare blower system should be sized and designed.
5. Potential system developers should be allowed to determine if this project might be able to move forward. Because the project economics are not that attractive, a good candidate may be Beihai City.
Page 16 \\90.0.0.14\data\0server\1375-1 EPA - China Beiahai LFG Utilization Feasibility Study\Final Report\Beihai LFG Report.doc
9.0 LIMITATIONS LFGcost is a landfill gas energy project cost estimating tool developed for EPA's LMOP. LFGcost estimates landfill gas generation rates using a first-order decay equation. This equation is used to estimate generation potential but cannot be considered an absolute predictor of the rate of landfill gas generation. Variations in the rate and types of incoming waste, site operating conditions, and moisture and temperature conditions may provide substantial variations in the actual rates of generation. The costs that are estimated by LFGcost are based on typical project designs and for typical landfill situations. The model attempts to include all equipment, site work, permits, operating activities, and maintenance that would normally be required for constructing and operating a typical project. However, individual landfills may require unique design modifications which would add to the cost estimated by LFGcost. Analyses performed using LFGcost are considered preliminary and should be used for guidance only. A detailed final feasibility assessment should be conducted by qualified landfill gas professionals prior to preparing a system design, initiating construction, purchasing materials, or entering into agreements to provide or purchase energy from a landfill gas project. This report may be used only by the client and only for the purposes stated, within a reasonable time from its issuance. Land use, site conditions (both on site and off site) or other factors may change over time, and additional work may be required with the passage of time. Any party other than the client who wishes to use this report shall notify GC Environmental, Inc. of such intended use. Based on the intended use of the report, GC Environmental, Inc. may require that additional work be performed and that an updated report be issued. Non-compliance with any of these requirements by the client or anyone else will release GC Environmental, Inc. from any liability resulting from the use of this report by any unauthorized party. Information used in the China Landfill Gas Model includes numerous assumptions concerning refuse composition, decomposition rate, moisture content and other semi or non quantifiable information. It should be recognized that the decomposable fraction of refuse at any landfill along with numerous other semi-quantifiable variables are impossible to quantify. While specific methane and/or LFG production rates are included in this report, or shown on figures, these rates are impossible to accurately predict. All results must be used with caution. No warranty is expressed or implied. The work provided is consistent with the standard of care and skill ordinarily exercised by members of our profession currently practicing under similar conditions.

gce/1375-1/docs/Beihai LFG Report Copyright 2010 - GC Environmental, Inc. All Rights Reserved
PHOTOGRAPHS
gce/1375-1/docs/Beihai LFG Report Copyright 2010 - GC Environmental, Inc. All Rights Reserved
Photo - Landfill Site Map (1)
gce/1375-1/docs/Beihai LFG Report Copyright 2010 - GC Environmental, Inc. All Rights Reserved
Landfill Vicinity Photo (2)
Grass growing on landfill (3) Exposed Refuse (4)
LANDFILL SITE
gce/1375-1/docs/Beihai LFG Report Copyright 2010 - GC Environmental, Inc. All Rights Reserved
Gas Vent (5) LFG Flow Meter (6)
Broken Blower Outlet Fitting (7) Cut Blower Inlet Fitting (8)
Well Backfill Rock (9) Well Adjusting Valve (10)
gce/1375-1/docs/Beihai LFG Report Copyright 2010 - GC Environmental, Inc. All Rights Reserved
Typical Wellhead (11) Well Lateral Sample Port (12)
Typical Well Lateral Pipe (13) Typical Well Lateral Pipe (14)
Typical Pressure Monitoring Probe (15) Typical Probe Sampling Array (16)
gce/1375-1/docs/Beihai LFG Report Copyright 2010 - GC Environmental, Inc. All Rights Reserved
Area view of wells and flare (17) PVC Sheet orifice plate (18)
Leachate Pump House (for power) (19) Orifice Plate Installation (20)
gce/1375-1/docs/Beihai LFG Report Copyright 2010 - GC Environmental, Inc. All Rights Reserved
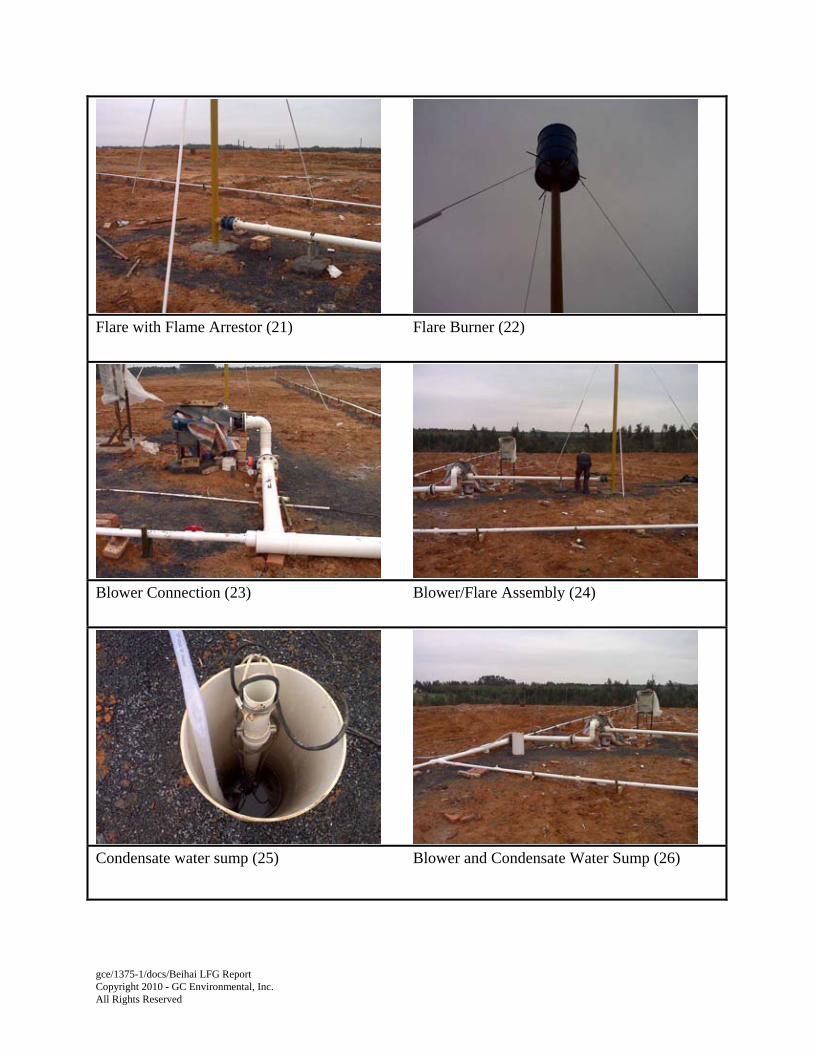
Flare with Flame Arrestor (21) Flare Burner (22)
Blower Connection (23) Blower/Flare Assembly (24)
Condensate water sump (25) Blower and Condensate Water Sump (26)
gce/1375-1/docs/Beihai LFG Report Copyright 2010 - GC Environmental, Inc. All Rights Reserved
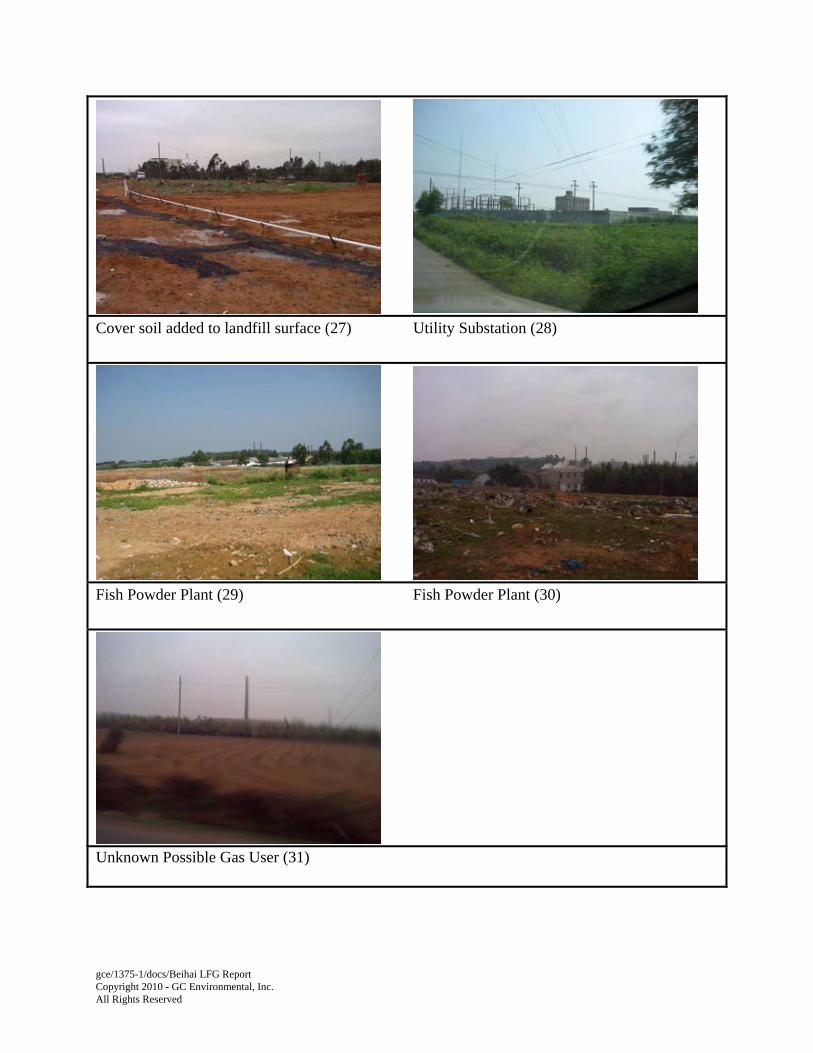
Cover soil added to landfill surface (27) Utility Substation (28)
Fish Powder Plant (29) Fish Powder Plant (30)
Unknown Possible Gas User (31)
gce/1375-1/docs/Beihai LFG Report Copyright 2010 - GC Environmental, Inc. All Rights Reserved
FIGURES
gce/1375-1/docs/Beihai LFG Report Copyright 2010 - GC Environmental, Inc. All Rights Reserved
Figures Using Raw Data Figures with Air Removed and Data Normalized
Figure 2
Figure 5
Figure 3
Figure 6
Figure 4
Figure 7
gce/1375-1/docs/Beihai LFG Report Copyright 2010 - GC Environmental, Inc. All Rights Reserved
Figure 8
Figure 9
Figure 10
Well 1
0
0.1
0.2
0.3
0.4
0.5
0.6
0.7
20‐Jan 22‐Jan 24‐Jan 26‐Jan 28‐Jan
Flow
NM^3/H
r
LFG NM^3/Hr
LFG w/o airNM^3/Hr
Methane FlowNM^3/Hr
Well 2
0
0.1
0.2
0.3
0.4
0.5
0.6
0.7
0.8
20‐Jan 22‐Jan 24‐Jan 26‐Jan 28‐Jan
Flow
NM^3/H
r
LFG NM^3/Hr
LFG w/o airNM^3/Hr
Methane FlowNM^3/Hr
Well 3
0
0.1
0.2
0.3
0.4
0.5
0.6
0.7
22‐Jan 24‐Jan 26‐Jan 28‐Jan
Flow
NM^3/H
r
LFG NM^3/Hr
LFG w/o airNM^3/Hr
Methane FlowNM^3/Hr
gce/1375-1/docs/Beihai LFG Report Copyright 2010 - GC Environmental, Inc. All Rights Reserved
Figure 11 Figure 14
Figure 12 Figure 15
Figure 13 Figure 16
Probe P1‐1 PressureTest date 24 Jan 2010
0
0.1
0.2
0.3
0.4
0.5
0.6
0.7
10.9 11 11.1 11.2 11.3
TIME
M BARS
Pressure
Probe P1‐1 PressureTest date 25 Jan 2010
2
2.5
3
3.5
15.4 15.45 15.5 15.55 15.6 15.65
TIME
M BARS
Pressure
Probe P2‐1 PressureTest date 24 Jan 2010
2
2.5
3
3.5
13.3 13.4 13.5 13.6
TIME
M BARS
Pressure
Probe P3‐1 PressureTest date 24 Jan 2010
‐0.1
0
0.1
0.2
0.3
0.4
10.5 10.6 10.7 10.8 10.9
TIME
M BARS
Pressure
Probe P2‐1 PressureTest date 25 Jan 2010
2
2.2
2.4
2.6
2.8
3
14.85 14.9 14.95 15 15.05
TIME
M BAR
Pressure
Probe P3‐1 PressureTest date 25 Jan 2010
‐0.2
‐0.1
0
0.1
0.2
14.1 14.15 14.2 14.25 14.3
TIME
M BARS
Pressure
gce/1375-1/docs/Beihai LFG Report Copyright 2010 - GC Environmental, Inc. All Rights Reserved
Figure 17 Figure 20
Figure 18 Figure 21
Figure 19 Figure 22
W1-P
0.0
1.0
2.0
3.0
4.0
5.0
6.0
7.0
8.0
9.0
10.010
:33
11:0
8
11:3
6
12:0
6
12:4
1
13:0
6
13:3
5
14:1
2
14:3
6
15:0
5
Time
Met
hane
(%)
1008
1009
1010
1011
1012
1013
1014
Baro
met
ric
Pres
sure
(mb)
Methane
Barometric Pressure
W2-P
25.0
26.0
27.0
28.0
29.0
30.0
31.0
32.0
33.0
34.0
35.0
10:3
2
11:0
6
11:3
5
12:0
5
12:4
0
13:0
5
13:3
4
14:1
1
14:3
5
15:0
4
Time
Met
hane
(%)
1008
1009
1010
1011
1012
1013
1014
Baro
met
ric
Pres
sure
(mb)
Methane
Barometric Pressure
W3-P
20.0
21.0
22.0
23.0
24.0
25.0
26.0
27.0
28.0
29.0
30.0
10:3
2
11:0
5
11:3
4
12:0
3
12:3
9
13:0
4
13:3
3
14:1
0
14:3
4
15:0
3
Time
Met
hane
(%)
1008
1009
1010
1011
1012
1013
1014
Baro
met
ric
Pres
sure
(mb)
Methane
Barometric Pressure
W3-P CH4 Concentration when air is subtracted
34
36
38
40
42
44
46
48
50
52
54
10:3
2
11:0
5
11:3
4
12:0
3
12:3
9
13:0
4
13:3
3
14:1
0
14:3
4
15:0
3
Time
Met
hane
(%)
1008
1009
1010
1011
1012
1013
1014
Baro
met
ric
Pres
sure
(mb)Methane
Barometric Pressure
W2-P CH4 concentration when air is subtracted
34
36
38
40
42
44
46
48
50
52
54
10:3
2
11:0
6
11:3
5
12:0
5
12:4
0
13:0
5
13:3
4
14:1
1
14:3
5
15:0
4
Time
Met
hane
(%)
1008
1009
1010
1011
1012
1013
1014
Baro
met
ric
Pres
sure
(mb)
Methane
Barometric Pressure
W1-P CH4 concentration when air is subtracted
34
36
38
40
42
44
46
48
50
52
54
10:3
3
11:0
8
11:3
6
12:0
6
12:4
1
13:0
6
13:3
5
14:1
2
14:3
6
15:0
5
Time
Met
hane
(%)
1008
1009
1010
1011
1012
1013
1014
Baro
met
ric
Pres
sure
(mb)
Methane
Barometric Pressure
gce/1375-1/docs/Beihai LFG Report Copyright 2010 - GC Environmental, Inc. All Rights Reserved
Figure 23
0
500
1,000
1,500
2,000
2,500
3,000
1999 2004 2009 2014 2019 2024 2029 2034 2039 2044 2049 2054 2059 2064 2069 2074 2079 2084 2089 2094
LFG
Flo
w (m
3/hr
)
Estimated Recovery LFG Generation Actual Recovery
Baishuitang Landfill
Beihai, China
gce/1375-1/docs/Beihai LFG Report Copyright 2010 - GC Environmental, Inc. All Rights Reserved
Figure 24
Baishuitang LandfillProject Economics - Internal Rate of Return Alternatives
-50%
-25%
0%
25%
50%
75%
100%
0 5 10$/MTCO2E
Inte
rnal
Rat
e of
Ret
urn
Direct Use (D)Engine (E)Small Engine (G)CHP Engine (CE)CHP Microturbine (CM)

gce/1375-1/docs/Beihai LFG Report Copyright 2010 - GC Environmental, Inc. All Rights Reserved
DRAWINGS
gce/1375-1/docs/Beihai LFG Report Copyright 2010 - GC Environmental, Inc. All Rights Reserved
ATTACHMENT 1
gce/1375-1/docs/Beihai LFG Report Copyright 2010 - GC Environmental, Inc. All Rights Reserved
LFG WELL INFLUENCE TEST PLAN BAISHUITANG LANDFILL
BEIHAI, CHINA
Prepared by
GC ENVIRONMENTAL, INC. 1230 N. Jefferson Street, Suite J
Anaheim, CA 92807 USA
GCE Project #1375-1 JANUARY 9, 2009
i \\90.0.0.14\data\0server\1375-1 EPA - China Beiahai LFG Utilization Feasibility Study\Final Report\Beihai LFG Report.doc
TABLE OF CONTENTS Section Page
1.0 PURPOSE OF TEST .................................................................................................1
2.0 SUMMARY TEST DESCRIPTION ........................................................................1
3.0 DETAILED TESTING DESCRIPTION .................................................................1 3.1 Static Testing........................................................................................................1 3.2 Dynamic Testing ..................................................................................................1
4.0 POTENTIAL TECHNICAL DIFFICULTIES .......................................................2
5.0 TEST EQUIPMENT LIST........................................................................................3
6.0 CALCULATIONS .....................................................................................................3 Drawings C0 – Title Sheet C1 – System Layout C2 – Flare Station Plan View C3 – Header Connection Details C4 – Well / Lateral Connection Details C5 – Sump Connection Details C6 – Extraction Well construction Details C7 – Flare Station Elevation View C8 – Bar Hole Probe Construction Details C9 – Material List
Page 1 \\90.0.0.14\data\0server\1375-1 EPA - China Beiahai LFG Utilization Feasibility Study\Final Report\Beihai LFG Report.doc
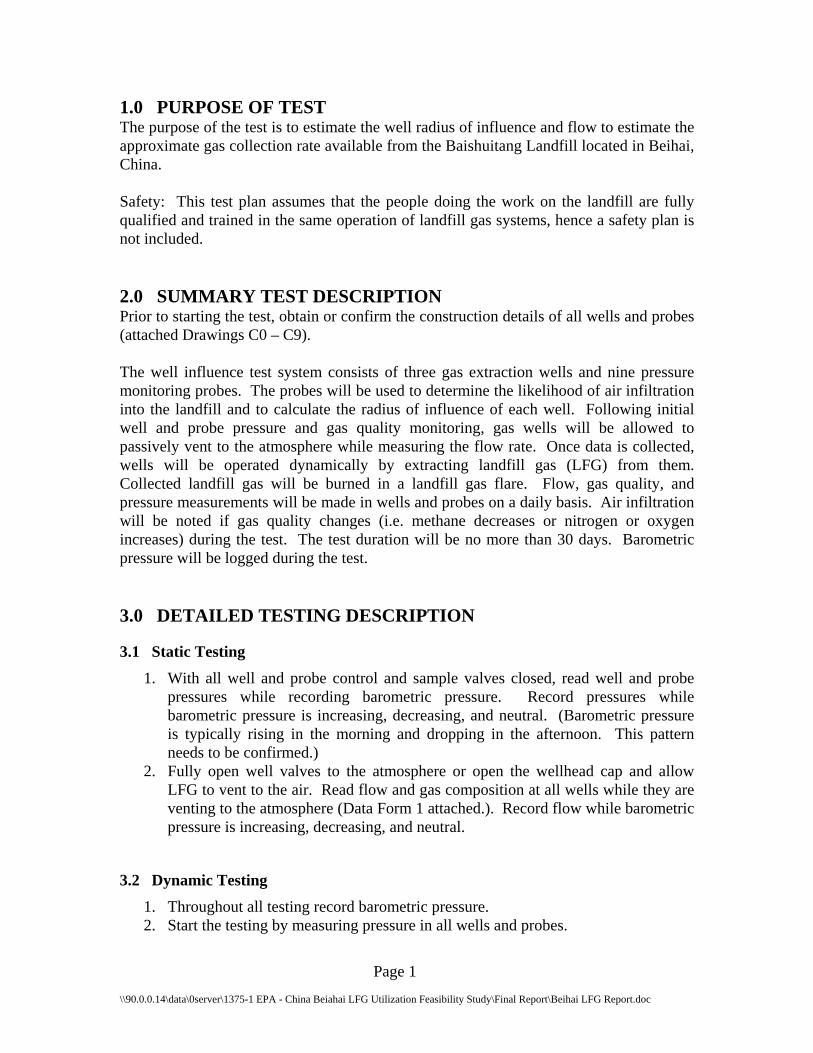
1.0 PURPOSE OF TEST The purpose of the test is to estimate the well radius of influence and flow to estimate the approximate gas collection rate available from the Baishuitang Landfill located in Beihai, China. Safety: This test plan assumes that the people doing the work on the landfill are fully qualified and trained in the same operation of landfill gas systems, hence a safety plan is not included. 2.0 SUMMARY TEST DESCRIPTION Prior to starting the test, obtain or confirm the construction details of all wells and probes (attached Drawings C0 – C9). The well influence test system consists of three gas extraction wells and nine pressure monitoring probes. The probes will be used to determine the likelihood of air infiltration into the landfill and to calculate the radius of influence of each well. Following initial well and probe pressure and gas quality monitoring, gas wells will be allowed to passively vent to the atmosphere while measuring the flow rate. Once data is collected, wells will be operated dynamically by extracting landfill gas (LFG) from them. Collected landfill gas will be burned in a landfill gas flare. Flow, gas quality, and pressure measurements will be made in wells and probes on a daily basis. Air infiltration will be noted if gas quality changes (i.e. methane decreases or nitrogen or oxygen increases) during the test. The test duration will be no more than 30 days. Barometric pressure will be logged during the test. 3.0 DETAILED TESTING DESCRIPTION
3.1 Static Testing
1. With all well and probe control and sample valves closed, read well and probe pressures while recording barometric pressure. Record pressures while barometric pressure is increasing, decreasing, and neutral. (Barometric pressure is typically rising in the morning and dropping in the afternoon. This pattern needs to be confirmed.)
2. Fully open well valves to the atmosphere or open the wellhead cap and allow LFG to vent to the air. Read flow and gas composition at all wells while they are venting to the atmosphere (Data Form 1 attached.). Record flow while barometric pressure is increasing, decreasing, and neutral.
3.2 Dynamic Testing
1. Throughout all testing record barometric pressure. 2. Start the testing by measuring pressure in all wells and probes.
Page 2 \\90.0.0.14\data\0server\1375-1 EPA - China Beiahai LFG Utilization Feasibility Study\Final Report\Beihai LFG Report.doc
3. Open one wellhead valve so the well flow is about 2 times the vent flow rate measured in 3.1.2. After pressure in the landfill stabilizes (usually about 15 minutes) measure pressure in all wells and probes. Confirm pressure is stable by measuring pressure in several of the probes over at least a 10-minute period. This will then establish the time required to get stabile pressures in the landfill for the rest of the monitoring.
4. Close the first well and wait 15 minutes then repeat the well and probe pressure readings.
5. Open the second wellhead valve so the well flow is about 2 times the vent flow rate measured in 3.1.2. After pressure in the landfill stabilizes measure pressure in all wells and probes.
6. Close the second well and wait 15 minutes then repeat the well and probe pressure readings.
7. Open the third wellhead valve so the well flow is about 2 times the vent flow rate measured in 3.1.2. After pressure in the landfill stabilizes measure pressure in all wells and probes.
8. If pressure in shallow probes is positive, then open all wells to the previous setting. If pressure in shallow probes is negative, then reduce the vacuum in the closest well. The minimum flow will be the flow measured in 3.1.2 above. After the pressure in the landfill stabilizes, measure pressure in all wells and probes.
9. If pressure in all probes is positive, then well flows can be increased. Increase flows by no more than 10% at a time. Wait at least 1 day between well adjustments.
10. Measure gas flow and composition at the blower discharge and compare these readings with the well readings. Use this data to verify that the pipe system is not leaking.
11. Continue testing for 30 days or until at least 1 void volume of gas is extracted from the landfill. Use a refuse void volume of 40% in the calculations.
12. Prior to the conclusion of the test collect Tedlar bag samples and if laboratories are available, submit the samples for analysis of methane, carbon dioxide, nitrogen, oxygen, speciated NMOCs including siloxanes, hydrogen sulfide, and chlorinated hydrocarbons, and total NMOCs.
PLEASE PROVIDE MONITORING DATA TO [email protected] ON A DAILY BASIS. At the conclusion of the test, all wells, probes, blower, flare, etc will remain in place for continued operation to reduce greenhouse gases. 4.0 POTENTIAL TECHNICAL DIFFICULTIES The following technical issues may require special accommodations or further evaluation:
Page 3 \\90.0.0.14\data\0server\1375-1 EPA - China Beiahai LFG Utilization Feasibility Study\Final Report\Beihai LFG Report.doc
1. The blower or flare system operation may not be stable. If the either of these shuts down during a test, the test may need to be extended.
2. Water in the landfill may flood the wells rendering them ineffective. If this happens, it may be possible to pump water from the wells. If pumping is not possible, then the test cannot continue.
3. Condensate water in the pipes may not drain. 4. The barometric pressure data logger needs to be kept in a dry, protected
environment. 5. Laboratories may not be available in China that can analyze the gas
samples. In this case, this task will not be performed. 5.0 TEST EQUIPMENT LIST The following equipment items will be required to conduct the test:
1. Well head pressure and vacuum: Magnehelic pressure gauges, GEM gas analyzer, or other suitable pressure gauges or indicators. Ranges from low of 0.01 to 25 inches WC.
2. Methane, oxygen, and carbon dioxide measurement: A GEM, RKI, or other similar portable gas analyzer. Have spare hydrophobic filters and carbon filters available for the instruments. Calibrate instruments per the manufacturers recommendations.
3. Well head temperature: Thermocouple or thermometer. 4. Well head flow measurement: Anemometer or other suitable flow
measurement equipment. A 3/4” screwed pipe plug is provided for inserting a flow measurement device into the pipe for flow measurement at the wells.
5. Total flow measurement: An orifice plate is provided at the flare station for total flow measurement. Differential pressure across the orifice plate will be between 0.08 and 3.0 for flows ranging from 25 to 150 SCFM.
6. Liquid sounder to measure water level in the wells. 7. Miscellaneous tubes, hoses, sample valves, hose barbs, caps, etc to help
facilitate field measurements. 8. Tedlar bags for gas sampling and laboratory analysis. 9. Barometric Pressure: Barometric pressure data logger (Provided by
GCE). 10. Small tools needed to install and or thread pipe and install fittings needed
for the test. 11. Teflon pipe tape or other sealant for the pipe threads. 12. One half inch steel rod for installing additional shallow monitoring
probes, if needed. 6.0 CALCULATIONS

Page 4 \\90.0.0.14\data\0server\1375-1 EPA - China Beiahai LFG Utilization Feasibility Study\Final Report\Beihai LFG Report.doc
GCE will perform calculations for the following items:
1. Pressure changes in wells and probes. 2. Radius of influence of wells. 3. Depth of influence of the wells. 4. Void volume of gas removed during the test. 5. Estimated volume of landfill refuse influenced by the test. 6. Total estimated landfill volume 7. Total estimated landfill gas collection rate for the entire landfill 8. Modeling constants Lo and k. 9. Landfill gas collection model.
DRAWINGS FOR TEST PLAN
(included in Section “DRAWINGS” of Pump Test and Feasibility Study
Report”)
ATTACHMENT 2
Direct Use Project Economics

LFGcost V2 (version 1) Open Program 7/9/2010
INPUTS / OUTPUTS Enter Landfill Name or Identifier:
Required User Inputs: Optional User Inputs (User inputs are currently set to suggested default data):
Type of Input Required Input Data Type of Optional InputSuggested
Default Data
User Input Data
Year landfill opened 1999 LFG energy project size: Gas rate = (M)inimum, (A)verage, ma(X)imum,Year of landfill closure 2026 or (D)efined by user (must enter design flow rate below)?Area of LFG wellfield to supply project (acres) [assumes 1 well/acre] 32 For user-defined project size only: Design flow rate (ft3/min) ---
Average annual waste acceptance rate (tons/yr) Methane generation rate constant, k (1/yr) Waste acceptance rate calculator (in WASTE worksheet) Go to WASTE [0.04 for typical climates, 0.02 for arid climates, 0.1 for bioreactors or wet landfills]Annual waste disposal history (in WASTE worksheet) Go to WASTE Potential methane generation capacity of waste, Lo (ft
3/ton) 3,204 1,792Methane content of landfill gas (%) 50% 50%Average depth of landfill waste (ft) 50 50Landfill gas collection efficiency (%) 85% 56%
Will LFG energy project cost include collection and flaring costs? (Y)es or (N)o y Utilization of CHP hot water/steam potential (%) 100% 100%For leachate evaporator projects only: Amount of leachate collected (gal/yr) Expected LFG energy project lifetime (years) 15 15
1.7Operating schedule: Hours per day 24 24
For CHP projects only: Distance between CHP unit and hot water/steam user (miles) 0.1 (does not apply to Days per week 7 7Year LFG energy project begins operation 2012 leachate evaporators) Weeks per year 52 52
Loan lifetime (years) 10 10Outputs: Interest rate (%) 8.0% 8.0%
Type of Output Output Data General inflation rate (% - applied to O&M costs) 2.5% 2.5%Economic Analysis: Equipment inflation rate (%) 1.0% 1.0%Average project size for projects NOT generating electricity: (million ft3/yr) 301.217 Marginal tax rate (%) 35.0% 35.0%[based on actual LFG use] (ft3/min) 573.091 Discount rate (%) 10.0% 10.0%Average project size for projects generating electricity (kWh/yr) 0 Down payment (%) 20.0% 20.0%Average project size for CHP projects producing hot water/steam (million Btu/yr) 0 Energy tax credits: Landfill gas utilization or high Btu production ($/million Btu) $0.000 $0.000Total installed capital cost for year of construction ($) $2,469,207 Electricity generation ($/kWh) $0.000 $0.000Annual costs for initial year of operation ($) $233,982 Direct credits: Global warming potential of methane 21.00 21.00Internal rate of return (%) 21% Greenhouse gas reduction credit ($/MTCO2E) $0.000 $0.000Net present value at year of construction ($) $716,535 Are direct methane reductions included in GHG credit? Y YNet present value payback* (years after operation begins) 9 Renewable electricity credit ($/kWh) $0.000 $0.000Environmental Benefits: Avoided leachate disposal ($/gal) ** $0.000 $0.000Total lifetime amount of methane collected and destroyed (million ft3) 3,190 Construction grant ($) $0 $0Average annual amount of methane collected and destroyed (million ft3/yr) 213 Royalty payment for landfill gas utilization ($/million Btu) $0.000 $0.000GHG value of total lifetime amount of methane utilized in energy project (MMTCO2E) 9.10E-01 Cost uncertainty factor (entered as % adjustment) 0.0% 0.0%GHG value of average annual amount of methane utilized in energy project (MMTCO2E/yr) 6.07E-02 Initial year product price: ** Landfill gas production ($/million Btu) $5.00 $5.00Total lifetime carbon dioxide from avoided energy generation: (MMTCO2E) 1.19E-01 Electricity generation ($/kWh) $0.0600 $0.0600
(MMTCE) 3.25E-02 CHP hot water/steam production ($/million Btu) $7.50 $7.50Average annual carbon dioxide from avoided energy generation: (MMTCO2E/yr) 7.94E-03 High Btu production ($/million Btu) $6.500 $6.500
(MMTCE/yr) 2.17E-03 Annual product price escalation rate (%) 2.0% 1.0%* "None" = no return on investment or no payback in LFG energy project lifetime Electricity purchase price for projects NOT generating electricity ($/kWh) ** $0.075 $0.075
Annual electricity purchase price escalation rate (%) 2.0% 1.0%** Based on initial year of operation
Disclaimer:
Initial Product Prices When Net Present Value is Optimized to Achieve Financial Goals:Landfill gas production ($/million Btu) $4.01Electricity generation ($/kWh) ---High Btu gas production ($/million Btu) ---
Method for entering waste acceptance data[CHOOSE ONLY ONE METHOD]:
The costs that are estimated by LFGcost are based on typical project designs and for typical landfill situations. The model attempts to include all equipment, site work, permits, operating activities, and maintenance that would normally be required for constructing and operating a typical project. However, individual landfills may require unique design modifications which would add to the cost estimated by LFGcost.
Analyses performed using LFGcost are considered preliminary and should be used for guidance only. A detailed final feasibility assessment should be conducted by qualified landfill gas professionals prior to preparing a system design, initiating construction, purchasing materials, or entering into agreements to provide or purchase energy from a landfill gas project.
LFG energy project type: (D)irect use, (T)urbine, (E)ngine, (H)igh Btu, microtu(R)bine,small en(G)ine, lea(C)hate evaporator, CHP engine (CE), CHP turbine (CT), or CHP microturbine (CM)?
D
LFGcost is a landfill gas energy project cost estimating tool developed for EPA's LMOP. LFGcost estimates landfill gas generation rates using a first-order decay equation. This equation is used to estimate generation potential but can not be considered an absolute predictor of the rate of landfill gas generation. Variations in the rate and types of incoming waste, site operating conditions, and moisture and temperature conditions may provide substantial variations in the actual rates of generation.
For direct use, high Btu, and CHP projects only: Distance between landfill and end use, pipeline or CHP unit (miles)
After completing the input fields above, select
this button to:
MM
0.180.04
Baishuitang - Direct Use - GHG Credits + $0/MTCO2E
Calculate Initial Product Price Needed to Achieve Financial Goals
INP-OUT - 1
LFGcost V2 (version 1) Open Program 7/9/2010
INPUTS / OUTPUTS Enter Landfill Name or Identifier:
Required User Inputs: Optional User Inputs (User inputs are currently set to suggested default data):
Type of Input Required Input Data Type of Optional InputSuggested
Default Data
User Input Data
Year landfill opened 1999 LFG energy project size: Gas rate = (M)inimum, (A)verage, ma(X)imum,Year of landfill closure 2026 or (D)efined by user (must enter design flow rate below)?Area of LFG wellfield to supply project (acres) [assumes 1 well/acre] 32 For user-defined project size only: Design flow rate (ft3/min) ---
Average annual waste acceptance rate (tons/yr) Methane generation rate constant, k (1/yr) Waste acceptance rate calculator (in WASTE worksheet) Go to WASTE [0.04 for typical climates, 0.02 for arid climates, 0.1 for bioreactors or wet landfills]Annual waste disposal history (in WASTE worksheet) Go to WASTE Potential methane generation capacity of waste, Lo (ft
3/ton) 3,204 1,792Methane content of landfill gas (%) 50% 50%Average depth of landfill waste (ft) 50 50Landfill gas collection efficiency (%) 85% 56%
Will LFG energy project cost include collection and flaring costs? (Y)es or (N)o y Utilization of CHP hot water/steam potential (%) 100% 100%For leachate evaporator projects only: Amount of leachate collected (gal/yr) Expected LFG energy project lifetime (years) 15 15
1.7Operating schedule: Hours per day 24 24
For CHP projects only: Distance between CHP unit and hot water/steam user (miles) 0.1 (does not apply to Days per week 7 7Year LFG energy project begins operation 2012 leachate evaporators) Weeks per year 52 52
Loan lifetime (years) 10 10Outputs: Interest rate (%) 8.0% 8.0%
Type of Output Output Data General inflation rate (% - applied to O&M costs) 2.5% 2.5%Economic Analysis: Equipment inflation rate (%) 1.0% 1.0%Average project size for projects NOT generating electricity: (million ft3/yr) 301.217 Marginal tax rate (%) 35.0% 35.0%[based on actual LFG use] (ft3/min) 573.091 Discount rate (%) 10.0% 10.0%Average project size for projects generating electricity (kWh/yr) 0 Down payment (%) 20.0% 20.0%Average project size for CHP projects producing hot water/steam (million Btu/yr) 0 Energy tax credits: Landfill gas utilization or high Btu production ($/million Btu) $0.000 $0.000Total installed capital cost for year of construction ($) $2,469,207 Electricity generation ($/kWh) $0.000 $0.000Annual costs for initial year of operation ($) $233,982 Direct credits: Global warming potential of methane 21.00 21.00Internal rate of return (%) 47% Greenhouse gas reduction credit ($/MTCO2E) $0.000 $4.000Net present value at year of construction ($) $2,341,170 Are direct methane reductions included in GHG credit? Y YNet present value payback* (years after operation begins) 3 Renewable electricity credit ($/kWh) $0.000 $0.000Environmental Benefits: Avoided leachate disposal ($/gal) ** $0.000 $0.000Total lifetime amount of methane collected and destroyed (million ft3) 3,190 Construction grant ($) $0 $0Average annual amount of methane collected and destroyed (million ft3/yr) 213 Royalty payment for landfill gas utilization ($/million Btu) $0.000 $0.000GHG value of total lifetime amount of methane utilized in energy project (MMTCO2E) 9.10E-01 Cost uncertainty factor (entered as % adjustment) 0.0% 0.0%GHG value of average annual amount of methane utilized in energy project (MMTCO2E/yr) 6.07E-02 Initial year product price: ** Landfill gas production ($/million Btu) $5.00 $5.00Total lifetime carbon dioxide from avoided energy generation: (MMTCO2E) 1.19E-01 Electricity generation ($/kWh) $0.0600 $0.0600
(MMTCE) 3.25E-02 CHP hot water/steam production ($/million Btu) $7.50 $7.50Average annual carbon dioxide from avoided energy generation: (MMTCO2E/yr) 7.94E-03 High Btu production ($/million Btu) $6.500 $6.500
(MMTCE/yr) 2.17E-03 Annual product price escalation rate (%) 2.0% 1.0%* "None" = no return on investment or no payback in LFG energy project lifetime Electricity purchase price for projects NOT generating electricity ($/kWh) ** $0.075 $0.075
Annual electricity purchase price escalation rate (%) 2.0% 1.0%** Based on initial year of operation
Disclaimer:
Initial Product Prices When Net Present Value is Optimized to Achieve Financial Goals:Landfill gas production ($/million Btu) $1.76Electricity generation ($/kWh) ---High Btu gas production ($/million Btu) ---
Method for entering waste acceptance data[CHOOSE ONLY ONE METHOD]:
The costs that are estimated by LFGcost are based on typical project designs and for typical landfill situations. The model attempts to include all equipment, site work, permits, operating activities, and maintenance that would normally be required for constructing and operating a typical project. However, individual landfills may require unique design modifications which would add to the cost estimated by LFGcost.
Analyses performed using LFGcost are considered preliminary and should be used for guidance only. A detailed final feasibility assessment should be conducted by qualified landfill gas professionals prior to preparing a system design, initiating construction, purchasing materials, or entering into agreements to provide or purchase energy from a landfill gas project.
LFG energy project type: (D)irect use, (T)urbine, (E)ngine, (H)igh Btu, microtu(R)bine,small en(G)ine, lea(C)hate evaporator, CHP engine (CE), CHP turbine (CT), or CHP microturbine (CM)?
D
LFGcost is a landfill gas energy project cost estimating tool developed for EPA's LMOP. LFGcost estimates landfill gas generation rates using a first-order decay equation. This equation is used to estimate generation potential but can not be considered an absolute predictor of the rate of landfill gas generation. Variations in the rate and types of incoming waste, site operating conditions, and moisture and temperature conditions may provide substantial variations in the actual rates of generation.
For direct use, high Btu, and CHP projects only: Distance between landfill and end use, pipeline or CHP unit (miles)
After completing the input fields above, select
this button to:
MM
0.180.04
Baishuitang - Direct Use - GHG Credits + $4/MTCO2E
Calculate Initial Product Price Needed to Achieve Financial Goals
INP-OUT - 1

LFGcost V2 (version 1) Open Program 7/9/2010
INPUTS / OUTPUTS Enter Landfill Name or Identifier:
Required User Inputs: Optional User Inputs (User inputs are currently set to suggested default data):
Type of Input Required Input Data Type of Optional InputSuggested
Default Data
User Input Data
Year landfill opened 1999 LFG energy project size: Gas rate = (M)inimum, (A)verage, ma(X)imum,Year of landfill closure 2026 or (D)efined by user (must enter design flow rate below)?Area of LFG wellfield to supply project (acres) [assumes 1 well/acre] 32 For user-defined project size only: Design flow rate (ft3/min) ---
Average annual waste acceptance rate (tons/yr) Methane generation rate constant, k (1/yr) Waste acceptance rate calculator (in WASTE worksheet) Go to WASTE [0.04 for typical climates, 0.02 for arid climates, 0.1 for bioreactors or wet landfills]Annual waste disposal history (in WASTE worksheet) Go to WASTE Potential methane generation capacity of waste, Lo (ft
3/ton) 3,204 1,792Methane content of landfill gas (%) 50% 50%Average depth of landfill waste (ft) 50 50Landfill gas collection efficiency (%) 85% 56%
Will LFG energy project cost include collection and flaring costs? (Y)es or (N)o y Utilization of CHP hot water/steam potential (%) 100% 100%For leachate evaporator projects only: Amount of leachate collected (gal/yr) Expected LFG energy project lifetime (years) 15 15
1.7Operating schedule: Hours per day 24 24
For CHP projects only: Distance between CHP unit and hot water/steam user (miles) 0.1 (does not apply to Days per week 7 7Year LFG energy project begins operation 2012 leachate evaporators) Weeks per year 52 52
Loan lifetime (years) 10 10Outputs: Interest rate (%) 8.0% 8.0%
Type of Output Output Data General inflation rate (% - applied to O&M costs) 2.5% 2.5%Economic Analysis: Equipment inflation rate (%) 1.0% 1.0%Average project size for projects NOT generating electricity: (million ft3/yr) 301.217 Marginal tax rate (%) 35.0% 35.0%[based on actual LFG use] (ft3/min) 573.091 Discount rate (%) 10.0% 10.0%Average project size for projects generating electricity (kWh/yr) 0 Down payment (%) 20.0% 20.0%Average project size for CHP projects producing hot water/steam (million Btu/yr) 0 Energy tax credits: Landfill gas utilization or high Btu production ($/million Btu) $0.000 $0.000Total installed capital cost for year of construction ($) $2,469,207 Electricity generation ($/kWh) $0.000 $0.000Annual costs for initial year of operation ($) $233,982 Direct credits: Global warming potential of methane 21.00 21.00Internal rate of return (%) 73% Greenhouse gas reduction credit ($/MTCO2E) $0.000 $8.000Net present value at year of construction ($) $3,965,805 Are direct methane reductions included in GHG credit? Y YNet present value payback* (years after operation begins) 2 Renewable electricity credit ($/kWh) $0.000 $0.000Environmental Benefits: Avoided leachate disposal ($/gal) ** $0.000 $0.000Total lifetime amount of methane collected and destroyed (million ft3) 3,190 Construction grant ($) $0 $0Average annual amount of methane collected and destroyed (million ft3/yr) 213 Royalty payment for landfill gas utilization ($/million Btu) $0.000 $0.000GHG value of total lifetime amount of methane utilized in energy project (MMTCO2E) 9.10E-01 Cost uncertainty factor (entered as % adjustment) 0.0% 0.0%GHG value of average annual amount of methane utilized in energy project (MMTCO2E/yr) 6.07E-02 Initial year product price: ** Landfill gas production ($/million Btu) $5.00 $5.00Total lifetime carbon dioxide from avoided energy generation: (MMTCO2E) 1.19E-01 Electricity generation ($/kWh) $0.0600 $0.0600
(MMTCE) 3.25E-02 CHP hot water/steam production ($/million Btu) $7.50 $7.50Average annual carbon dioxide from avoided energy generation: (MMTCO2E/yr) 7.94E-03 High Btu production ($/million Btu) $6.500 $6.500
(MMTCE/yr) 2.17E-03 Annual product price escalation rate (%) 2.0% 1.0%* "None" = no return on investment or no payback in LFG energy project lifetime Electricity purchase price for projects NOT generating electricity ($/kWh) ** $0.075 $0.075
Annual electricity purchase price escalation rate (%) 2.0% 1.0%** Based on initial year of operation
Disclaimer:
Initial Product Prices When Net Present Value is Optimized to Achieve Financial Goals:Landfill gas production ($/million Btu) -$0.48Electricity generation ($/kWh) ---High Btu gas production ($/million Btu) ---
Method for entering waste acceptance data[CHOOSE ONLY ONE METHOD]:
The costs that are estimated by LFGcost are based on typical project designs and for typical landfill situations. The model attempts to include all equipment, site work, permits, operating activities, and maintenance that would normally be required for constructing and operating a typical project. However, individual landfills may require unique design modifications which would add to the cost estimated by LFGcost.
Analyses performed using LFGcost are considered preliminary and should be used for guidance only. A detailed final feasibility assessment should be conducted by qualified landfill gas professionals prior to preparing a system design, initiating construction, purchasing materials, or entering into agreements to provide or purchase energy from a landfill gas project.
LFG energy project type: (D)irect use, (T)urbine, (E)ngine, (H)igh Btu, microtu(R)bine,small en(G)ine, lea(C)hate evaporator, CHP engine (CE), CHP turbine (CT), or CHP microturbine (CM)?
D
LFGcost is a landfill gas energy project cost estimating tool developed for EPA's LMOP. LFGcost estimates landfill gas generation rates using a first-order decay equation. This equation is used to estimate generation potential but can not be considered an absolute predictor of the rate of landfill gas generation. Variations in the rate and types of incoming waste, site operating conditions, and moisture and temperature conditions may provide substantial variations in the actual rates of generation.
For direct use, high Btu, and CHP projects only: Distance between landfill and end use, pipeline or CHP unit (miles)
After completing the input fields above, select
this button to:
MM
0.180.04
Baishuitang - Direct Use - GHG Credits + $8/MTCO2E
Calculate Initial Product Price Needed to Achieve Financial Goals
INP-OUT - 1
ATTACHMENT 3
Small Power Production Project Economics

LFGcost V2 (version 1) Open Program 7/9/2010
INPUTS / OUTPUTS Enter Landfill Name or Identifier:
Required User Inputs: Optional User Inputs (User inputs are currently set to suggested default data):
Type of Input Required Input Data Type of Optional InputSuggested
Default Data
User Input Data
Year landfill opened 1999 LFG energy project size: Gas rate = (M)inimum, (A)verage, ma(X)imum,Year of landfill closure 2026 or (D)efined by user (must enter design flow rate below)?Area of LFG wellfield to supply project (acres) [assumes 1 well/acre] 32 For user-defined project size only: Design flow rate (ft3/min) ---
Average annual waste acceptance rate (tons/yr) Methane generation rate constant, k (1/yr) Waste acceptance rate calculator (in WASTE worksheet) Go to WASTE [0.04 for typical climates, 0.02 for arid climates, 0.1 for bioreactors or wet landfills]Annual waste disposal history (in WASTE worksheet) Go to WASTE Potential methane generation capacity of waste, Lo (ft
3/ton) 3,204 1,792Methane content of landfill gas (%) 50% 50%Average depth of landfill waste (ft) 50 50Landfill gas collection efficiency (%) 85% 56%
Will LFG energy project cost include collection and flaring costs? (Y)es or (N)o y Utilization of CHP hot water/steam potential (%) 100% 100%For leachate evaporator projects only: Amount of leachate collected (gal/yr) Expected LFG energy project lifetime (years) 15 15
1.7Operating schedule: Hours per day 24 24
For CHP projects only: Distance between CHP unit and hot water/steam user (miles) 0.1 (does not apply to Days per week 7 7Year LFG energy project begins operation 2012 leachate evaporators) Weeks per year 52 52
Loan lifetime (years) 10 10Outputs: Interest rate (%) 8.0% 8.0%
Type of Output Output Data General inflation rate (% - applied to O&M costs) 2.5% 2.5%Economic Analysis: Equipment inflation rate (%) 1.0% 1.0%Average project size for projects NOT generating electricity: (million ft3/yr) 0.000 Marginal tax rate (%) 35.0% 35.0%[based on actual LFG use] (ft3/min) 0.000 Discount rate (%) 10.0% 10.0%Average project size for projects generating electricity (kWh/yr) 13,019,676 Down payment (%) 20.0% 20.0%Average project size for CHP projects producing hot water/steam (million Btu/yr) 0 Energy tax credits: Landfill gas utilization or high Btu production ($/million Btu) $0.000 $0.000Total installed capital cost for year of construction ($) $3,995,627 Electricity generation ($/kWh) $0.000 $0.000Annual costs for initial year of operation ($) $433,664 Direct credits: Global warming potential of methane 21.00 21.00Internal rate of return (%) -4% Greenhouse gas reduction credit ($/MTCO2E) $0.000 $0.000Net present value at year of construction ($) ($1,447,602) Are direct methane reductions included in GHG credit? Y YNet present value payback* (years after operation begins) None Renewable electricity credit ($/kWh) $0.000 $0.000Environmental Benefits: Avoided leachate disposal ($/gal) ** $0.000 $0.000Total lifetime amount of methane collected and destroyed (million ft3) 3,190 Construction grant ($) $0 $0Average annual amount of methane collected and destroyed (million ft3/yr) 213 Royalty payment for landfill gas utilization ($/million Btu) $0.000 $0.000GHG value of total lifetime amount of methane utilized in energy project (MMTCO2E) 9.41E-01 Cost uncertainty factor (entered as % adjustment) 0.0% 0.0%GHG value of average annual amount of methane utilized in energy project (MMTCO2E/yr) 6.27E-02 Initial year product price: ** Landfill gas production ($/million Btu) $5.00 $5.00Total lifetime carbon dioxide from avoided energy generation: (MMTCO2E) 1.40E-01 Electricity generation ($/kWh) $0.0600 $0.0600
(MMTCE) 3.82E-02 CHP hot water/steam production ($/million Btu) $7.50 $7.50Average annual carbon dioxide from avoided energy generation: (MMTCO2E/yr) 9.33E-03 High Btu production ($/million Btu) $6.500 $6.500
(MMTCE/yr) 2.54E-03 Annual product price escalation rate (%) 2.0% 1.0%* "None" = no return on investment or no payback in LFG energy project lifetime Electricity purchase price for projects NOT generating electricity ($/kWh) ** $0.075 $0.075
Annual electricity purchase price escalation rate (%) 2.0% 1.0%** Based on initial year of operation
Disclaimer:
Initial Product Prices When Net Present Value is Optimized to Achieve Financial Goals:Landfill gas production ($/million Btu) ---Electricity generation ($/kWh) $0.0819High Btu gas production ($/million Btu) ---
Method for entering waste acceptance data[CHOOSE ONLY ONE METHOD]:
The costs that are estimated by LFGcost are based on typical project designs and for typical landfill situations. The model attempts to include all equipment, site work, permits, operating activities, and maintenance that would normally be required for constructing and operating a typical project. However, individual landfills may require unique design modifications which would add to the cost estimated by LFGcost.
Analyses performed using LFGcost are considered preliminary and should be used for guidance only. A detailed final feasibility assessment should be conducted by qualified landfill gas professionals prior to preparing a system design, initiating construction, purchasing materials, or entering into agreements to provide or purchase energy from a landfill gas project.
LFG energy project type: (D)irect use, (T)urbine, (E)ngine, (H)igh Btu, microtu(R)bine,small en(G)ine, lea(C)hate evaporator, CHP engine (CE), CHP turbine (CT), or CHP microturbine (CM)?
E
LFGcost is a landfill gas energy project cost estimating tool developed for EPA's LMOP. LFGcost estimates landfill gas generation rates using a first-order decay equation. This equation is used to estimate generation potential but can not be considered an absolute predictor of the rate of landfill gas generation. Variations in the rate and types of incoming waste, site operating conditions, and moisture and temperature conditions may provide substantial variations in the actual rates of generation.
For direct use, high Btu, and CHP projects only: Distance between landfill and end use, pipeline or CHP unit (miles)
After completing the input fields above, select
this button to:
MM
0.180.04
Baishuitang - Engine - GHG Credits + $0/MTCO2E
Calculate Initial Product Price Needed to Achieve Financial Goals
INP-OUT - 1
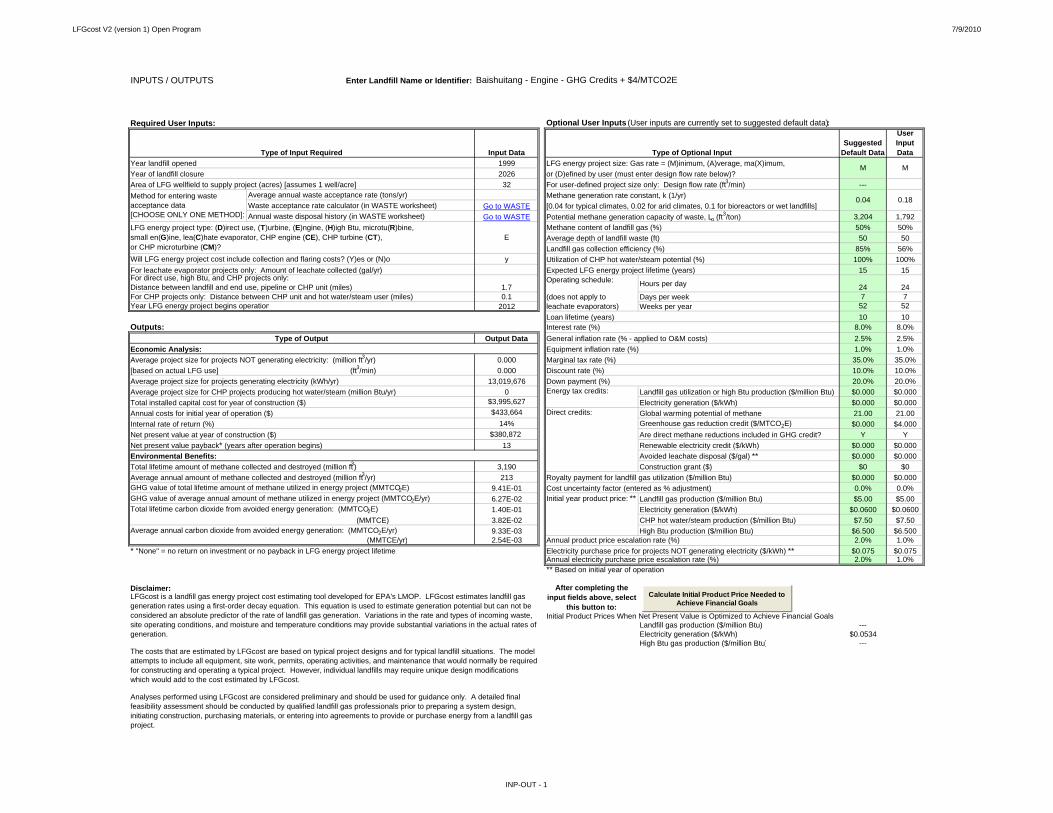
LFGcost V2 (version 1) Open Program 7/9/2010
INPUTS / OUTPUTS Enter Landfill Name or Identifier:
Required User Inputs: Optional User Inputs (User inputs are currently set to suggested default data):
Type of Input Required Input Data Type of Optional InputSuggested
Default Data
User Input Data
Year landfill opened 1999 LFG energy project size: Gas rate = (M)inimum, (A)verage, ma(X)imum,Year of landfill closure 2026 or (D)efined by user (must enter design flow rate below)?Area of LFG wellfield to supply project (acres) [assumes 1 well/acre] 32 For user-defined project size only: Design flow rate (ft3/min) ---
Average annual waste acceptance rate (tons/yr) Methane generation rate constant, k (1/yr) Waste acceptance rate calculator (in WASTE worksheet) Go to WASTE [0.04 for typical climates, 0.02 for arid climates, 0.1 for bioreactors or wet landfills]Annual waste disposal history (in WASTE worksheet) Go to WASTE Potential methane generation capacity of waste, Lo (ft
3/ton) 3,204 1,792Methane content of landfill gas (%) 50% 50%Average depth of landfill waste (ft) 50 50Landfill gas collection efficiency (%) 85% 56%
Will LFG energy project cost include collection and flaring costs? (Y)es or (N)o y Utilization of CHP hot water/steam potential (%) 100% 100%For leachate evaporator projects only: Amount of leachate collected (gal/yr) Expected LFG energy project lifetime (years) 15 15
1.7Operating schedule: Hours per day 24 24
For CHP projects only: Distance between CHP unit and hot water/steam user (miles) 0.1 (does not apply to Days per week 7 7Year LFG energy project begins operation 2012 leachate evaporators) Weeks per year 52 52
Loan lifetime (years) 10 10Outputs: Interest rate (%) 8.0% 8.0%
Type of Output Output Data General inflation rate (% - applied to O&M costs) 2.5% 2.5%Economic Analysis: Equipment inflation rate (%) 1.0% 1.0%Average project size for projects NOT generating electricity: (million ft3/yr) 0.000 Marginal tax rate (%) 35.0% 35.0%[based on actual LFG use] (ft3/min) 0.000 Discount rate (%) 10.0% 10.0%Average project size for projects generating electricity (kWh/yr) 13,019,676 Down payment (%) 20.0% 20.0%Average project size for CHP projects producing hot water/steam (million Btu/yr) 0 Energy tax credits: Landfill gas utilization or high Btu production ($/million Btu) $0.000 $0.000Total installed capital cost for year of construction ($) $3,995,627 Electricity generation ($/kWh) $0.000 $0.000Annual costs for initial year of operation ($) $433,664 Direct credits: Global warming potential of methane 21.00 21.00Internal rate of return (%) 14% Greenhouse gas reduction credit ($/MTCO2E) $0.000 $4.000Net present value at year of construction ($) $380,872 Are direct methane reductions included in GHG credit? Y YNet present value payback* (years after operation begins) 13 Renewable electricity credit ($/kWh) $0.000 $0.000Environmental Benefits: Avoided leachate disposal ($/gal) ** $0.000 $0.000Total lifetime amount of methane collected and destroyed (million ft3) 3,190 Construction grant ($) $0 $0Average annual amount of methane collected and destroyed (million ft3/yr) 213 Royalty payment for landfill gas utilization ($/million Btu) $0.000 $0.000GHG value of total lifetime amount of methane utilized in energy project (MMTCO2E) 9.41E-01 Cost uncertainty factor (entered as % adjustment) 0.0% 0.0%GHG value of average annual amount of methane utilized in energy project (MMTCO2E/yr) 6.27E-02 Initial year product price: ** Landfill gas production ($/million Btu) $5.00 $5.00Total lifetime carbon dioxide from avoided energy generation: (MMTCO2E) 1.40E-01 Electricity generation ($/kWh) $0.0600 $0.0600
(MMTCE) 3.82E-02 CHP hot water/steam production ($/million Btu) $7.50 $7.50Average annual carbon dioxide from avoided energy generation: (MMTCO2E/yr) 9.33E-03 High Btu production ($/million Btu) $6.500 $6.500
(MMTCE/yr) 2.54E-03 Annual product price escalation rate (%) 2.0% 1.0%* "None" = no return on investment or no payback in LFG energy project lifetime Electricity purchase price for projects NOT generating electricity ($/kWh) ** $0.075 $0.075
Annual electricity purchase price escalation rate (%) 2.0% 1.0%** Based on initial year of operation
Disclaimer:
Initial Product Prices When Net Present Value is Optimized to Achieve Financial Goals:Landfill gas production ($/million Btu) ---Electricity generation ($/kWh) $0.0534High Btu gas production ($/million Btu) ---
Method for entering waste acceptance data[CHOOSE ONLY ONE METHOD]:
The costs that are estimated by LFGcost are based on typical project designs and for typical landfill situations. The model attempts to include all equipment, site work, permits, operating activities, and maintenance that would normally be required for constructing and operating a typical project. However, individual landfills may require unique design modifications which would add to the cost estimated by LFGcost.
Analyses performed using LFGcost are considered preliminary and should be used for guidance only. A detailed final feasibility assessment should be conducted by qualified landfill gas professionals prior to preparing a system design, initiating construction, purchasing materials, or entering into agreements to provide or purchase energy from a landfill gas project.
LFG energy project type: (D)irect use, (T)urbine, (E)ngine, (H)igh Btu, microtu(R)bine,small en(G)ine, lea(C)hate evaporator, CHP engine (CE), CHP turbine (CT), or CHP microturbine (CM)?
E
LFGcost is a landfill gas energy project cost estimating tool developed for EPA's LMOP. LFGcost estimates landfill gas generation rates using a first-order decay equation. This equation is used to estimate generation potential but can not be considered an absolute predictor of the rate of landfill gas generation. Variations in the rate and types of incoming waste, site operating conditions, and moisture and temperature conditions may provide substantial variations in the actual rates of generation.
For direct use, high Btu, and CHP projects only: Distance between landfill and end use, pipeline or CHP unit (miles)
After completing the input fields above, select
this button to:
MM
0.180.04
Baishuitang - Engine - GHG Credits + $4/MTCO2E
Calculate Initial Product Price Needed to Achieve Financial Goals
INP-OUT - 1

LFGcost V2 (version 1) Open Program 7/9/2010
INPUTS / OUTPUTS Enter Landfill Name or Identifier:
Required User Inputs: Optional User Inputs (User inputs are currently set to suggested default data):
Type of Input Required Input Data Type of Optional InputSuggested
Default Data
User Input Data
Year landfill opened 1999 LFG energy project size: Gas rate = (M)inimum, (A)verage, ma(X)imum,Year of landfill closure 2026 or (D)efined by user (must enter design flow rate below)?Area of LFG wellfield to supply project (acres) [assumes 1 well/acre] 32 For user-defined project size only: Design flow rate (ft3/min) ---
Average annual waste acceptance rate (tons/yr) Methane generation rate constant, k (1/yr) Waste acceptance rate calculator (in WASTE worksheet) Go to WASTE [0.04 for typical climates, 0.02 for arid climates, 0.1 for bioreactors or wet landfills]Annual waste disposal history (in WASTE worksheet) Go to WASTE Potential methane generation capacity of waste, Lo (ft
3/ton) 3,204 1,792Methane content of landfill gas (%) 50% 50%Average depth of landfill waste (ft) 50 50Landfill gas collection efficiency (%) 85% 56%
Will LFG energy project cost include collection and flaring costs? (Y)es or (N)o y Utilization of CHP hot water/steam potential (%) 100% 100%For leachate evaporator projects only: Amount of leachate collected (gal/yr) Expected LFG energy project lifetime (years) 15 15
1.7Operating schedule: Hours per day 24 24
For CHP projects only: Distance between CHP unit and hot water/steam user (miles) 0.1 (does not apply to Days per week 7 7Year LFG energy project begins operation 2012 leachate evaporators) Weeks per year 52 52
Loan lifetime (years) 10 10Outputs: Interest rate (%) 8.0% 8.0%
Type of Output Output Data General inflation rate (% - applied to O&M costs) 2.5% 2.5%Economic Analysis: Equipment inflation rate (%) 1.0% 1.0%Average project size for projects NOT generating electricity: (million ft3/yr) 0.000 Marginal tax rate (%) 35.0% 35.0%[based on actual LFG use] (ft3/min) 0.000 Discount rate (%) 10.0% 10.0%Average project size for projects generating electricity (kWh/yr) 13,019,676 Down payment (%) 20.0% 20.0%Average project size for CHP projects producing hot water/steam (million Btu/yr) 0 Energy tax credits: Landfill gas utilization or high Btu production ($/million Btu) $0.000 $0.000Total installed capital cost for year of construction ($) $3,995,627 Electricity generation ($/kWh) $0.000 $0.000Annual costs for initial year of operation ($) $433,664 Direct credits: Global warming potential of methane 21.00 21.00Internal rate of return (%) 29% Greenhouse gas reduction credit ($/MTCO2E) $0.000 $8.000Net present value at year of construction ($) $2,030,513 Are direct methane reductions included in GHG credit? Y YNet present value payback* (years after operation begins) 5 Renewable electricity credit ($/kWh) $0.000 $0.000Environmental Benefits: Avoided leachate disposal ($/gal) ** $0.000 $0.000Total lifetime amount of methane collected and destroyed (million ft3) 3,190 Construction grant ($) $0 $0Average annual amount of methane collected and destroyed (million ft3/yr) 213 Royalty payment for landfill gas utilization ($/million Btu) $0.000 $0.000GHG value of total lifetime amount of methane utilized in energy project (MMTCO2E) 9.41E-01 Cost uncertainty factor (entered as % adjustment) 0.0% 0.0%GHG value of average annual amount of methane utilized in energy project (MMTCO2E/yr) 6.27E-02 Initial year product price: ** Landfill gas production ($/million Btu) $5.00 $5.00Total lifetime carbon dioxide from avoided energy generation: (MMTCO2E) 1.40E-01 Electricity generation ($/kWh) $0.0600 $0.0600
(MMTCE) 3.82E-02 CHP hot water/steam production ($/million Btu) $7.50 $7.50Average annual carbon dioxide from avoided energy generation: (MMTCO2E/yr) 9.33E-03 High Btu production ($/million Btu) $6.500 $6.500
(MMTCE/yr) 2.54E-03 Annual product price escalation rate (%) 2.0% 1.0%* "None" = no return on investment or no payback in LFG energy project lifetime Electricity purchase price for projects NOT generating electricity ($/kWh) ** $0.075 $0.075
Annual electricity purchase price escalation rate (%) 2.0% 1.0%** Based on initial year of operation
Disclaimer:
Initial Product Prices When Net Present Value is Optimized to Achieve Financial Goals:Landfill gas production ($/million Btu) ---Electricity generation ($/kWh) $0.0249High Btu gas production ($/million Btu) ---
Method for entering waste acceptance data[CHOOSE ONLY ONE METHOD]:
The costs that are estimated by LFGcost are based on typical project designs and for typical landfill situations. The model attempts to include all equipment, site work, permits, operating activities, and maintenance that would normally be required for constructing and operating a typical project. However, individual landfills may require unique design modifications which would add to the cost estimated by LFGcost.
Analyses performed using LFGcost are considered preliminary and should be used for guidance only. A detailed final feasibility assessment should be conducted by qualified landfill gas professionals prior to preparing a system design, initiating construction, purchasing materials, or entering into agreements to provide or purchase energy from a landfill gas project.
LFG energy project type: (D)irect use, (T)urbine, (E)ngine, (H)igh Btu, microtu(R)bine,small en(G)ine, lea(C)hate evaporator, CHP engine (CE), CHP turbine (CT), or CHP microturbine (CM)?
E
LFGcost is a landfill gas energy project cost estimating tool developed for EPA's LMOP. LFGcost estimates landfill gas generation rates using a first-order decay equation. This equation is used to estimate generation potential but can not be considered an absolute predictor of the rate of landfill gas generation. Variations in the rate and types of incoming waste, site operating conditions, and moisture and temperature conditions may provide substantial variations in the actual rates of generation.
For direct use, high Btu, and CHP projects only: Distance between landfill and end use, pipeline or CHP unit (miles)
After completing the input fields above, select
this button to:
MM
0.180.04
Baishuitang - Engine - GHG Credits + $8/MTCO2E
Calculate Initial Product Price Needed to Achieve Financial Goals
INP-OUT - 1
ATTACHMENT 4
Combined Heat and Power Project Economics

LFGcost V2 (version 1) Open Program 7/9/2010
INPUTS / OUTPUTS Enter Landfill Name or Identifier:
Required User Inputs: Optional User Inputs (User inputs are currently set to suggested default data):
Type of Input Required Input Data Type of Optional InputSuggested
Default Data
User Input Data
Year landfill opened 1999 LFG energy project size: Gas rate = (M)inimum, (A)verage, ma(X)imum,Year of landfill closure 2026 or (D)efined by user (must enter design flow rate below)?Area of LFG wellfield to supply project (acres) [assumes 1 well/acre] 32 For user-defined project size only: Design flow rate (ft3/min) ---
Average annual waste acceptance rate (tons/yr) Methane generation rate constant, k (1/yr) Waste acceptance rate calculator (in WASTE worksheet) Go to WASTE [0.04 for typical climates, 0.02 for arid climates, 0.1 for bioreactors or wet landfills]Annual waste disposal history (in WASTE worksheet) Go to WASTE Potential methane generation capacity of waste, Lo (ft
3/ton) 3,204 1,792Methane content of landfill gas (%) 50% 50%Average depth of landfill waste (ft) 50 50Landfill gas collection efficiency (%) 85% 56%
Will LFG energy project cost include collection and flaring costs? (Y)es or (N)o y Utilization of CHP hot water/steam potential (%) 100% 100%For leachate evaporator projects only: Amount of leachate collected (gal/yr) Expected LFG energy project lifetime (years) 15 15
1.7Operating schedule: Hours per day 24 24
For CHP projects only: Distance between CHP unit and hot water/steam user (miles) 0.1 (does not apply to Days per week 7 7Year LFG energy project begins operation 2012 leachate evaporators) Weeks per year 52 52
Loan lifetime (years) 10 10Outputs: Interest rate (%) 8.0% 8.0%
Type of Output Output Data General inflation rate (% - applied to O&M costs) 2.5% 2.5%Economic Analysis: Equipment inflation rate (%) 1.0% 1.0%Average project size for projects NOT generating electricity: (million ft3/yr) 0.000 Marginal tax rate (%) 35.0% 35.0%[based on actual LFG use] (ft3/min) 0.000 Discount rate (%) 10.0% 10.0%Average project size for projects generating electricity (kWh/yr) 13,019,676 Down payment (%) 20.0% 20.0%Average project size for CHP projects producing hot water/steam (million Btu/yr) 49,475 Energy tax credits: Landfill gas utilization or high Btu production ($/million Btu) $0.000 $0.000Total installed capital cost for year of construction ($) $5,179,425 Electricity generation ($/kWh) $0.000 $0.000Annual costs for initial year of operation ($) $443,704 Direct credits: Global warming potential of methane 21.00 21.00Internal rate of return (%) 7% Greenhouse gas reduction credit ($/MTCO2E) $0.000 $0.000Net present value at year of construction ($) ($371,874) Are direct methane reductions included in GHG credit? Y YNet present value payback* (years after operation begins) None Renewable electricity credit ($/kWh) $0.000 $0.000Environmental Benefits: Avoided leachate disposal ($/gal) ** $0.000 $0.000Total lifetime amount of methane collected and destroyed (million ft3) 3,190 Construction grant ($) $0 $0Average annual amount of methane collected and destroyed (million ft3/yr) 213 Royalty payment for landfill gas utilization ($/million Btu) $0.000 $0.000GHG value of total lifetime amount of methane utilized in energy project (MMTCO2E) 9.41E-01 Cost uncertainty factor (entered as % adjustment) 0.0% 0.0%GHG value of average annual amount of methane utilized in energy project (MMTCO2E/yr) 6.27E-02 Initial year product price: ** Landfill gas production ($/million Btu) $5.00 $5.00Total lifetime carbon dioxide from avoided energy generation: (MMTCO2E) 1.88E-01 Electricity generation ($/kWh) $0.0600 $0.0600
(MMTCE) 5.14E-02 CHP hot water/steam production ($/million Btu) $7.50 $7.50Average annual carbon dioxide from avoided energy generation: (MMTCO2E/yr) 1.26E-02 High Btu production ($/million Btu) $6.500 $6.500
(MMTCE/yr) 3.42E-03 Annual product price escalation rate (%) 2.0% 1.0%* "None" = no return on investment or no payback in LFG energy project lifetime Electricity purchase price for projects NOT generating electricity ($/kWh) ** $0.075 $0.075
Annual electricity purchase price escalation rate (%) 2.0% 1.0%** Based on initial year of operation
Disclaimer:
Initial Product Prices When Net Present Value is Optimized to Achieve Financial Goals:Landfill gas production ($/million Btu) ---Electricity generation ($/kWh) $0.0660High Btu gas production ($/million Btu) ---
0.04
Baishuitang - Combined Heat and Power Engine - GHG Credits + $0/MTCO2E
After completing the input fields above, select
this button to:
MM
0.18Method for entering waste acceptance data[CHOOSE ONLY ONE METHOD]:
The costs that are estimated by LFGcost are based on typical project designs and for typical landfill situations. The model attempts to include all equipment, site work, permits, operating activities, and maintenance that would normally be required for constructing and operating a typical project. However, individual landfills may require unique design modifications which would add to the cost estimated by LFGcost.
Analyses performed using LFGcost are considered preliminary and should be used for guidance only. A detailed final feasibility assessment should be conducted by qualified landfill gas professionals prior to preparing a system design, initiating construction, purchasing materials, or entering into agreements to provide or purchase energy from a landfill gas project.
LFG energy project type: (D)irect use, (T)urbine, (E)ngine, (H)igh Btu, microtu(R)bine,small en(G)ine, lea(C)hate evaporator, CHP engine (CE), CHP turbine (CT), or CHP microturbine (CM)?
CE
LFGcost is a landfill gas energy project cost estimating tool developed for EPA's LMOP. LFGcost estimates landfill gas generation rates using a first-order decay equation. This equation is used to estimate generation potential but can not be considered an absolute predictor of the rate of landfill gas generation. Variations in the rate and types of incoming waste, site operating conditions, and moisture and temperature conditions may provide substantial variations in the actual rates of generation.
For direct use, high Btu, and CHP projects only: Distance between landfill and end use, pipeline or CHP unit (miles)
Calculate Initial Product Price Needed to Achieve Financial Goals
INP-OUT - 1

LFGcost V2 (version 1) Open Program 7/9/2010
INPUTS / OUTPUTS Enter Landfill Name or Identifier:
Required User Inputs: Optional User Inputs (User inputs are currently set to suggested default data):
Type of Input Required Input Data Type of Optional InputSuggested
Default Data
User Input Data
Year landfill opened 1999 LFG energy project size: Gas rate = (M)inimum, (A)verage, ma(X)imum,Year of landfill closure 2026 or (D)efined by user (must enter design flow rate below)?Area of LFG wellfield to supply project (acres) [assumes 1 well/acre] 32 For user-defined project size only: Design flow rate (ft3/min) ---
Average annual waste acceptance rate (tons/yr) Methane generation rate constant, k (1/yr) Waste acceptance rate calculator (in WASTE worksheet) Go to WASTE [0.04 for typical climates, 0.02 for arid climates, 0.1 for bioreactors or wet landfills]Annual waste disposal history (in WASTE worksheet) Go to WASTE Potential methane generation capacity of waste, Lo (ft
3/ton) 3,204 1,792Methane content of landfill gas (%) 50% 50%Average depth of landfill waste (ft) 50 50Landfill gas collection efficiency (%) 85% 56%
Will LFG energy project cost include collection and flaring costs? (Y)es or (N)o y Utilization of CHP hot water/steam potential (%) 100% 100%For leachate evaporator projects only: Amount of leachate collected (gal/yr) Expected LFG energy project lifetime (years) 15 15
1.7Operating schedule: Hours per day 24 24
For CHP projects only: Distance between CHP unit and hot water/steam user (miles) 0.1 (does not apply to Days per week 7 7Year LFG energy project begins operation 2012 leachate evaporators) Weeks per year 52 52
Loan lifetime (years) 10 10Outputs: Interest rate (%) 8.0% 8.0%
Type of Output Output Data General inflation rate (% - applied to O&M costs) 2.5% 2.5%Economic Analysis: Equipment inflation rate (%) 1.0% 1.0%Average project size for projects NOT generating electricity: (million ft3/yr) 0.000 Marginal tax rate (%) 35.0% 35.0%[based on actual LFG use] (ft3/min) 0.000 Discount rate (%) 10.0% 10.0%Average project size for projects generating electricity (kWh/yr) 13,019,676 Down payment (%) 20.0% 20.0%Average project size for CHP projects producing hot water/steam (million Btu/yr) 49,475 Energy tax credits: Landfill gas utilization or high Btu production ($/million Btu) $0.000 $0.000Total installed capital cost for year of construction ($) $5,179,425 Electricity generation ($/kWh) $0.000 $0.000Annual costs for initial year of operation ($) $443,704 Direct credits: Global warming potential of methane 21.00 21.00Internal rate of return (%) 20% Greenhouse gas reduction credit ($/MTCO2E) $0.000 $4.000Net present value at year of construction ($) $1,335,688 Are direct methane reductions included in GHG credit? Y YNet present value payback* (years after operation begins) 10 Renewable electricity credit ($/kWh) $0.000 $0.000Environmental Benefits: Avoided leachate disposal ($/gal) ** $0.000 $0.000Total lifetime amount of methane collected and destroyed (million ft3) 3,190 Construction grant ($) $0 $0Average annual amount of methane collected and destroyed (million ft3/yr) 213 Royalty payment for landfill gas utilization ($/million Btu) $0.000 $0.000GHG value of total lifetime amount of methane utilized in energy project (MMTCO2E) 9.41E-01 Cost uncertainty factor (entered as % adjustment) 0.0% 0.0%GHG value of average annual amount of methane utilized in energy project (MMTCO2E/yr) 6.27E-02 Initial year product price: ** Landfill gas production ($/million Btu) $5.00 $5.00Total lifetime carbon dioxide from avoided energy generation: (MMTCO2E) 1.88E-01 Electricity generation ($/kWh) $0.0600 $0.0600
(MMTCE) 5.14E-02 CHP hot water/steam production ($/million Btu) $7.50 $7.50Average annual carbon dioxide from avoided energy generation: (MMTCO2E/yr) 1.26E-02 High Btu production ($/million Btu) $6.500 $6.500
(MMTCE/yr) 3.42E-03 Annual product price escalation rate (%) 2.0% 1.0%* "None" = no return on investment or no payback in LFG energy project lifetime Electricity purchase price for projects NOT generating electricity ($/kWh) ** $0.075 $0.075
Annual electricity purchase price escalation rate (%) 2.0% 1.0%** Based on initial year of operation
Disclaimer:
Initial Product Prices When Net Present Value is Optimized to Achieve Financial Goals:Landfill gas production ($/million Btu) ---Electricity generation ($/kWh) $0.0384High Btu gas production ($/million Btu) ---
0.04
Baishuitang - Combined Heat and Power Engine - GHG Credits + $4/MTCO2E
After completing the input fields above, select
this button to:
MM
0.18Method for entering waste acceptance data[CHOOSE ONLY ONE METHOD]:
The costs that are estimated by LFGcost are based on typical project designs and for typical landfill situations. The model attempts to include all equipment, site work, permits, operating activities, and maintenance that would normally be required for constructing and operating a typical project. However, individual landfills may require unique design modifications which would add to the cost estimated by LFGcost.
Analyses performed using LFGcost are considered preliminary and should be used for guidance only. A detailed final feasibility assessment should be conducted by qualified landfill gas professionals prior to preparing a system design, initiating construction, purchasing materials, or entering into agreements to provide or purchase energy from a landfill gas project.
LFG energy project type: (D)irect use, (T)urbine, (E)ngine, (H)igh Btu, microtu(R)bine,small en(G)ine, lea(C)hate evaporator, CHP engine (CE), CHP turbine (CT), or CHP microturbine (CM)?
CE
LFGcost is a landfill gas energy project cost estimating tool developed for EPA's LMOP. LFGcost estimates landfill gas generation rates using a first-order decay equation. This equation is used to estimate generation potential but can not be considered an absolute predictor of the rate of landfill gas generation. Variations in the rate and types of incoming waste, site operating conditions, and moisture and temperature conditions may provide substantial variations in the actual rates of generation.
For direct use, high Btu, and CHP projects only: Distance between landfill and end use, pipeline or CHP unit (miles)
Calculate Initial Product Price Needed to Achieve Financial Goals
INP-OUT - 1

LFGcost V2 (version 1) Open Program 7/9/2010
INPUTS / OUTPUTS Enter Landfill Name or Identifier:
Required User Inputs: Optional User Inputs (User inputs are currently set to suggested default data):
Type of Input Required Input Data Type of Optional InputSuggested
Default Data
User Input Data
Year landfill opened 1999 LFG energy project size: Gas rate = (M)inimum, (A)verage, ma(X)imum,Year of landfill closure 2026 or (D)efined by user (must enter design flow rate below)?Area of LFG wellfield to supply project (acres) [assumes 1 well/acre] 32 For user-defined project size only: Design flow rate (ft3/min) ---
Average annual waste acceptance rate (tons/yr) Methane generation rate constant, k (1/yr) Waste acceptance rate calculator (in WASTE worksheet) Go to WASTE [0.04 for typical climates, 0.02 for arid climates, 0.1 for bioreactors or wet landfills]Annual waste disposal history (in WASTE worksheet) Go to WASTE Potential methane generation capacity of waste, Lo (ft
3/ton) 3,204 1,792Methane content of landfill gas (%) 50% 50%Average depth of landfill waste (ft) 50 50Landfill gas collection efficiency (%) 85% 56%
Will LFG energy project cost include collection and flaring costs? (Y)es or (N)o y Utilization of CHP hot water/steam potential (%) 100% 100%For leachate evaporator projects only: Amount of leachate collected (gal/yr) Expected LFG energy project lifetime (years) 15 15
1.7Operating schedule: Hours per day 24 24
For CHP projects only: Distance between CHP unit and hot water/steam user (miles) 0.1 (does not apply to Days per week 7 7Year LFG energy project begins operation 2012 leachate evaporators) Weeks per year 52 52
Loan lifetime (years) 10 10Outputs: Interest rate (%) 8.0% 8.0%
Type of Output Output Data General inflation rate (% - applied to O&M costs) 2.5% 2.5%Economic Analysis: Equipment inflation rate (%) 1.0% 1.0%Average project size for projects NOT generating electricity: (million ft3/yr) 0.000 Marginal tax rate (%) 35.0% 35.0%[based on actual LFG use] (ft3/min) 0.000 Discount rate (%) 10.0% 10.0%Average project size for projects generating electricity (kWh/yr) 13,019,676 Down payment (%) 20.0% 20.0%Average project size for CHP projects producing hot water/steam (million Btu/yr) 49,475 Energy tax credits: Landfill gas utilization or high Btu production ($/million Btu) $0.000 $0.000Total installed capital cost for year of construction ($) $5,179,425 Electricity generation ($/kWh) $0.000 $0.000Annual costs for initial year of operation ($) $443,704 Direct credits: Global warming potential of methane 21.00 21.00Internal rate of return (%) 33% Greenhouse gas reduction credit ($/MTCO2E) $0.000 $8.000Net present value at year of construction ($) $3,043,250 Are direct methane reductions included in GHG credit? Y YNet present value payback* (years after operation begins) 5 Renewable electricity credit ($/kWh) $0.000 $0.000Environmental Benefits: Avoided leachate disposal ($/gal) ** $0.000 $0.000Total lifetime amount of methane collected and destroyed (million ft3) 3,190 Construction grant ($) $0 $0Average annual amount of methane collected and destroyed (million ft3/yr) 213 Royalty payment for landfill gas utilization ($/million Btu) $0.000 $0.000GHG value of total lifetime amount of methane utilized in energy project (MMTCO2E) 9.41E-01 Cost uncertainty factor (entered as % adjustment) 0.0% 0.0%GHG value of average annual amount of methane utilized in energy project (MMTCO2E/yr) 6.27E-02 Initial year product price: ** Landfill gas production ($/million Btu) $5.00 $5.00Total lifetime carbon dioxide from avoided energy generation: (MMTCO2E) 1.88E-01 Electricity generation ($/kWh) $0.0600 $0.0600
(MMTCE) 5.14E-02 CHP hot water/steam production ($/million Btu) $7.50 $7.50Average annual carbon dioxide from avoided energy generation: (MMTCO2E/yr) 1.26E-02 High Btu production ($/million Btu) $6.500 $6.500
(MMTCE/yr) 3.42E-03 Annual product price escalation rate (%) 2.0% 1.0%* "None" = no return on investment or no payback in LFG energy project lifetime Electricity purchase price for projects NOT generating electricity ($/kWh) ** $0.075 $0.075
Annual electricity purchase price escalation rate (%) 2.0% 1.0%** Based on initial year of operation
Disclaimer:
Initial Product Prices When Net Present Value is Optimized to Achieve Financial Goals:Landfill gas production ($/million Btu) ---Electricity generation ($/kWh) $0.0107High Btu gas production ($/million Btu) ---
0.04
Baishuitang - Combined Heat and Power Engine - GHG Credits + $8/MTCO2E
After completing the input fields above, select
this button to:
MM
0.18Method for entering waste acceptance data[CHOOSE ONLY ONE METHOD]:
The costs that are estimated by LFGcost are based on typical project designs and for typical landfill situations. The model attempts to include all equipment, site work, permits, operating activities, and maintenance that would normally be required for constructing and operating a typical project. However, individual landfills may require unique design modifications which would add to the cost estimated by LFGcost.
Analyses performed using LFGcost are considered preliminary and should be used for guidance only. A detailed final feasibility assessment should be conducted by qualified landfill gas professionals prior to preparing a system design, initiating construction, purchasing materials, or entering into agreements to provide or purchase energy from a landfill gas project.
LFG energy project type: (D)irect use, (T)urbine, (E)ngine, (H)igh Btu, microtu(R)bine,small en(G)ine, lea(C)hate evaporator, CHP engine (CE), CHP turbine (CT), or CHP microturbine (CM)?
CE
LFGcost is a landfill gas energy project cost estimating tool developed for EPA's LMOP. LFGcost estimates landfill gas generation rates using a first-order decay equation. This equation is used to estimate generation potential but can not be considered an absolute predictor of the rate of landfill gas generation. Variations in the rate and types of incoming waste, site operating conditions, and moisture and temperature conditions may provide substantial variations in the actual rates of generation.
For direct use, high Btu, and CHP projects only: Distance between landfill and end use, pipeline or CHP unit (miles)
Calculate Initial Product Price Needed to Achieve Financial Goals
INP-OUT - 1

ATTACHMENT 5
Small Engine Project Economics

LFGcost V2 (version 1) Open Program 7/9/2010
INPUTS / OUTPUTS Enter Landfill Name or Identifier:
Required User Inputs: Optional User Inputs (User inputs are currently set to suggested default data):
Type of Input Required Input Data Type of Optional InputSuggested
Default Data
User Input Data
Year landfill opened 1999 LFG energy project size: Gas rate = (M)inimum, (A)verage, ma(X)imum,Year of landfill closure 2026 or (D)efined by user (must enter design flow rate below)?Area of LFG wellfield to supply project (acres) [assumes 1 well/acre] 32 For user-defined project size only: Design flow rate (ft3/min) ---
Average annual waste acceptance rate (tons/yr) Methane generation rate constant, k (1/yr) Waste acceptance rate calculator (in WASTE worksheet) Go to WASTE [0.04 for typical climates, 0.02 for arid climates, 0.1 for bioreactors or wet landfills]Annual waste disposal history (in WASTE worksheet) Go to WASTE Potential methane generation capacity of waste, Lo (ft
3/ton) 3,204 1,792Methane content of landfill gas (%) 50% 50%Average depth of landfill waste (ft) 50 50Landfill gas collection efficiency (%) 85% 56%
Will LFG energy project cost include collection and flaring costs? (Y)es or (N)o y Utilization of CHP hot water/steam potential (%) 100% 100%For leachate evaporator projects only: Amount of leachate collected (gal/yr) Expected LFG energy project lifetime (years) 15 15
1.7Operating schedule: Hours per day 24 24
For CHP projects only: Distance between CHP unit and hot water/steam user (miles) 0.1 (does not apply to Days per week 7 7Year LFG energy project begins operation 2012 leachate evaporators) Weeks per year 52 52
Loan lifetime (years) 10 10Outputs: Interest rate (%) 8.0% 8.0%
Type of Output Output Data General inflation rate (% - applied to O&M costs) 2.5% 2.5%Economic Analysis: Equipment inflation rate (%) 1.0% 1.0%Average project size for projects NOT generating electricity: (million ft3/yr) 0.000 Marginal tax rate (%) 35.0% 35.0%[based on actual LFG use] (ft3/min) 0.000 Discount rate (%) 10.0% 10.0%Average project size for projects generating electricity (kWh/yr) 7,954,348 Down payment (%) 20.0% 20.0%Average project size for CHP projects producing hot water/steam (million Btu/yr) 0 Energy tax credits: Landfill gas utilization or high Btu production ($/million Btu) $0.000 $0.000Total installed capital cost for year of construction ($) $3,420,168 Electricity generation ($/kWh) $0.000 $0.000Annual costs for initial year of operation ($) $353,650 Direct credits: Global warming potential of methane 21.00 21.00Internal rate of return (%) -28% Greenhouse gas reduction credit ($/MTCO2E) $0.000 $0.000Net present value at year of construction ($) ($2,488,375) Are direct methane reductions included in GHG credit? Y YNet present value payback* (years after operation begins) None Renewable electricity credit ($/kWh) $0.000 $0.000Environmental Benefits: Avoided leachate disposal ($/gal) ** $0.000 $0.000Total lifetime amount of methane collected and destroyed (million ft3) 3,190 Construction grant ($) $0 $0Average annual amount of methane collected and destroyed (million ft3/yr) 213 Royalty payment for landfill gas utilization ($/million Btu) $0.000 $0.000GHG value of total lifetime amount of methane utilized in energy project (MMTCO2E) 9.41E-01 Cost uncertainty factor (entered as % adjustment) 0.0% 0.0%GHG value of average annual amount of methane utilized in energy project (MMTCO2E/yr) 6.27E-02 Initial year product price: ** Landfill gas production ($/million Btu) $5.00 $5.00Total lifetime carbon dioxide from avoided energy generation: (MMTCO2E) 8.55E-02 Electricity generation ($/kWh) $0.0600 $0.0600
(MMTCE) 2.33E-02 CHP hot water/steam production ($/million Btu) $7.50 $7.50Average annual carbon dioxide from avoided energy generation: (MMTCO2E/yr) 5.70E-03 High Btu production ($/million Btu) $6.500 $6.500
(MMTCE/yr) 1.55E-03 Annual product price escalation rate (%) 2.0% 1.0%* "None" = no return on investment or no payback in LFG energy project lifetime Electricity purchase price for projects NOT generating electricity ($/kWh) ** $0.075 $0.075
Annual electricity purchase price escalation rate (%) 2.0% 1.0%** Based on initial year of operation
Disclaimer:
Initial Product Prices When Net Present Value is Optimized to Achieve Financial Goals:Landfill gas production ($/million Btu) ---Electricity generation ($/kWh) $0.1164High Btu gas production ($/million Btu) ---
Method for entering waste acceptance data[CHOOSE ONLY ONE METHOD]:
The costs that are estimated by LFGcost are based on typical project designs and for typical landfill situations. The model attempts to include all equipment, site work, permits, operating activities, and maintenance that would normally be required for constructing and operating a typical project. However, individual landfills may require unique design modifications which would add to the cost estimated by LFGcost.
Analyses performed using LFGcost are considered preliminary and should be used for guidance only. A detailed final feasibility assessment should be conducted by qualified landfill gas professionals prior to preparing a system design, initiating construction, purchasing materials, or entering into agreements to provide or purchase energy from a landfill gas project.
LFG energy project type: (D)irect use, (T)urbine, (E)ngine, (H)igh Btu, microtu(R)bine,small en(G)ine, lea(C)hate evaporator, CHP engine (CE), CHP turbine (CT), or CHP microturbine (CM)?
G
LFGcost is a landfill gas energy project cost estimating tool developed for EPA's LMOP. LFGcost estimates landfill gas generation rates using a first-order decay equation. This equation is used to estimate generation potential but can not be considered an absolute predictor of the rate of landfill gas generation. Variations in the rate and types of incoming waste, site operating conditions, and moisture and temperature conditions may provide substantial variations in the actual rates of generation.
For direct use, high Btu, and CHP projects only: Distance between landfill and end use, pipeline or CHP unit (miles)
After completing the input fields above, select
this button to:
MM
0.180.04
Baishuitang - Small Engine - GHG Credits + $0/MTCO2E
Calculate Initial Product Price Needed to Achieve Financial Goals
INP-OUT - 1

LFGcost V2 (version 1) Open Program 7/9/2010
INPUTS / OUTPUTS Enter Landfill Name or Identifier:
Required User Inputs: Optional User Inputs (User inputs are currently set to suggested default data):
Type of Input Required Input Data Type of Optional InputSuggested
Default Data
User Input Data
Year landfill opened 1999 LFG energy project size: Gas rate = (M)inimum, (A)verage, ma(X)imum,Year of landfill closure 2026 or (D)efined by user (must enter design flow rate below)?Area of LFG wellfield to supply project (acres) [assumes 1 well/acre] 32 For user-defined project size only: Design flow rate (ft3/min) ---
Average annual waste acceptance rate (tons/yr) Methane generation rate constant, k (1/yr) Waste acceptance rate calculator (in WASTE worksheet) Go to WASTE [0.04 for typical climates, 0.02 for arid climates, 0.1 for bioreactors or wet landfills]Annual waste disposal history (in WASTE worksheet) Go to WASTE Potential methane generation capacity of waste, Lo (ft
3/ton) 3,204 1,792Methane content of landfill gas (%) 50% 50%Average depth of landfill waste (ft) 50 50Landfill gas collection efficiency (%) 85% 56%
Will LFG energy project cost include collection and flaring costs? (Y)es or (N)o y Utilization of CHP hot water/steam potential (%) 100% 100%For leachate evaporator projects only: Amount of leachate collected (gal/yr) Expected LFG energy project lifetime (years) 15 15
1.7Operating schedule: Hours per day 24 24
For CHP projects only: Distance between CHP unit and hot water/steam user (miles) 0.1 (does not apply to Days per week 7 7Year LFG energy project begins operation 2012 leachate evaporators) Weeks per year 52 52
Loan lifetime (years) 10 10Outputs: Interest rate (%) 8.0% 8.0%
Type of Output Output Data General inflation rate (% - applied to O&M costs) 2.5% 2.5%Economic Analysis: Equipment inflation rate (%) 1.0% 1.0%Average project size for projects NOT generating electricity: (million ft3/yr) 0.000 Marginal tax rate (%) 35.0% 35.0%[based on actual LFG use] (ft3/min) 0.000 Discount rate (%) 10.0% 10.0%Average project size for projects generating electricity (kWh/yr) 7,954,348 Down payment (%) 20.0% 20.0%Average project size for CHP projects producing hot water/steam (million Btu/yr) 0 Energy tax credits: Landfill gas utilization or high Btu production ($/million Btu) $0.000 $0.000Total installed capital cost for year of construction ($) $3,420,168 Electricity generation ($/kWh) $0.000 $0.000Annual costs for initial year of operation ($) $353,650 Direct credits: Global warming potential of methane 21.00 21.00Internal rate of return (%) 6% Greenhouse gas reduction credit ($/MTCO2E) $0.000 $4.000Net present value at year of construction ($) ($327,182) Are direct methane reductions included in GHG credit? Y YNet present value payback* (years after operation begins) None Renewable electricity credit ($/kWh) $0.000 $0.000Environmental Benefits: Avoided leachate disposal ($/gal) ** $0.000 $0.000Total lifetime amount of methane collected and destroyed (million ft3) 3,190 Construction grant ($) $0 $0Average annual amount of methane collected and destroyed (million ft3/yr) 213 Royalty payment for landfill gas utilization ($/million Btu) $0.000 $0.000GHG value of total lifetime amount of methane utilized in energy project (MMTCO2E) 9.41E-01 Cost uncertainty factor (entered as % adjustment) 0.0% 0.0%GHG value of average annual amount of methane utilized in energy project (MMTCO2E/yr) 6.27E-02 Initial year product price: ** Landfill gas production ($/million Btu) $5.00 $5.00Total lifetime carbon dioxide from avoided energy generation: (MMTCO2E) 8.55E-02 Electricity generation ($/kWh) $0.0600 $0.0600
(MMTCE) 2.33E-02 CHP hot water/steam production ($/million Btu) $7.50 $7.50Average annual carbon dioxide from avoided energy generation: (MMTCO2E/yr) 5.70E-03 High Btu production ($/million Btu) $6.500 $6.500
(MMTCE/yr) 1.55E-03 Annual product price escalation rate (%) 2.0% 1.0%* "None" = no return on investment or no payback in LFG energy project lifetime Electricity purchase price for projects NOT generating electricity ($/kWh) ** $0.075 $0.075
Annual electricity purchase price escalation rate (%) 2.0% 1.0%** Based on initial year of operation
Disclaimer:
Initial Product Prices When Net Present Value is Optimized to Achieve Financial Goals:Landfill gas production ($/million Btu) ---Electricity generation ($/kWh) $0.0695High Btu gas production ($/million Btu) ---
Method for entering waste acceptance data[CHOOSE ONLY ONE METHOD]:
The costs that are estimated by LFGcost are based on typical project designs and for typical landfill situations. The model attempts to include all equipment, site work, permits, operating activities, and maintenance that would normally be required for constructing and operating a typical project. However, individual landfills may require unique design modifications which would add to the cost estimated by LFGcost.
Analyses performed using LFGcost are considered preliminary and should be used for guidance only. A detailed final feasibility assessment should be conducted by qualified landfill gas professionals prior to preparing a system design, initiating construction, purchasing materials, or entering into agreements to provide or purchase energy from a landfill gas project.
LFG energy project type: (D)irect use, (T)urbine, (E)ngine, (H)igh Btu, microtu(R)bine,small en(G)ine, lea(C)hate evaporator, CHP engine (CE), CHP turbine (CT), or CHP microturbine (CM)?
G
LFGcost is a landfill gas energy project cost estimating tool developed for EPA's LMOP. LFGcost estimates landfill gas generation rates using a first-order decay equation. This equation is used to estimate generation potential but can not be considered an absolute predictor of the rate of landfill gas generation. Variations in the rate and types of incoming waste, site operating conditions, and moisture and temperature conditions may provide substantial variations in the actual rates of generation.
For direct use, high Btu, and CHP projects only: Distance between landfill and end use, pipeline or CHP unit (miles)
After completing the input fields above, select
this button to:
MM
0.180.04
Baishuitang - Small Engine - GHG Credits + $4/MTCO2E
Calculate Initial Product Price Needed to Achieve Financial Goals
INP-OUT - 1

LFGcost V2 (version 1) Open Program 7/9/2010
INPUTS / OUTPUTS Enter Landfill Name or Identifier:
Required User Inputs: Optional User Inputs (User inputs are currently set to suggested default data):
Type of Input Required Input Data Type of Optional InputSuggested
Default Data
User Input Data
Year landfill opened 1999 LFG energy project size: Gas rate = (M)inimum, (A)verage, ma(X)imum,Year of landfill closure 2026 or (D)efined by user (must enter design flow rate below)?Area of LFG wellfield to supply project (acres) [assumes 1 well/acre] 32 For user-defined project size only: Design flow rate (ft3/min) ---
Average annual waste acceptance rate (tons/yr) Methane generation rate constant, k (1/yr) Waste acceptance rate calculator (in WASTE worksheet) Go to WASTE [0.04 for typical climates, 0.02 for arid climates, 0.1 for bioreactors or wet landfills]Annual waste disposal history (in WASTE worksheet) Go to WASTE Potential methane generation capacity of waste, Lo (ft
3/ton) 3,204 1,792Methane content of landfill gas (%) 50% 50%Average depth of landfill waste (ft) 50 50Landfill gas collection efficiency (%) 85% 56%
Will LFG energy project cost include collection and flaring costs? (Y)es or (N)o y Utilization of CHP hot water/steam potential (%) 100% 100%For leachate evaporator projects only: Amount of leachate collected (gal/yr) Expected LFG energy project lifetime (years) 15 15
1.7Operating schedule: Hours per day 24 24
For CHP projects only: Distance between CHP unit and hot water/steam user (miles) 0.1 (does not apply to Days per week 7 7Year LFG energy project begins operation 2012 leachate evaporators) Weeks per year 52 52
Loan lifetime (years) 10 10Outputs: Interest rate (%) 8.0% 8.0%
Type of Output Output Data General inflation rate (% - applied to O&M costs) 2.5% 2.5%Economic Analysis: Equipment inflation rate (%) 1.0% 1.0%Average project size for projects NOT generating electricity: (million ft3/yr) 0.000 Marginal tax rate (%) 35.0% 35.0%[based on actual LFG use] (ft3/min) 0.000 Discount rate (%) 10.0% 10.0%Average project size for projects generating electricity (kWh/yr) 7,954,348 Down payment (%) 20.0% 20.0%Average project size for CHP projects producing hot water/steam (million Btu/yr) 0 Energy tax credits: Landfill gas utilization or high Btu production ($/million Btu) $0.000 $0.000Total installed capital cost for year of construction ($) $3,420,168 Electricity generation ($/kWh) $0.000 $0.000Annual costs for initial year of operation ($) $353,650 Direct credits: Global warming potential of methane 21.00 21.00Internal rate of return (%) 24% Greenhouse gas reduction credit ($/MTCO2E) $0.000 $8.000Net present value at year of construction ($) $1,261,727 Are direct methane reductions included in GHG credit? Y YNet present value payback* (years after operation begins) 7 Renewable electricity credit ($/kWh) $0.000 $0.000Environmental Benefits: Avoided leachate disposal ($/gal) ** $0.000 $0.000Total lifetime amount of methane collected and destroyed (million ft3) 3,190 Construction grant ($) $0 $0Average annual amount of methane collected and destroyed (million ft3/yr) 213 Royalty payment for landfill gas utilization ($/million Btu) $0.000 $0.000GHG value of total lifetime amount of methane utilized in energy project (MMTCO2E) 9.41E-01 Cost uncertainty factor (entered as % adjustment) 0.0% 0.0%GHG value of average annual amount of methane utilized in energy project (MMTCO2E/yr) 6.27E-02 Initial year product price: ** Landfill gas production ($/million Btu) $5.00 $5.00Total lifetime carbon dioxide from avoided energy generation: (MMTCO2E) 8.55E-02 Electricity generation ($/kWh) $0.0600 $0.0600
(MMTCE) 2.33E-02 CHP hot water/steam production ($/million Btu) $7.50 $7.50Average annual carbon dioxide from avoided energy generation: (MMTCO2E/yr) 5.70E-03 High Btu production ($/million Btu) $6.500 $6.500
(MMTCE/yr) 1.55E-03 Annual product price escalation rate (%) 2.0% 1.0%* "None" = no return on investment or no payback in LFG energy project lifetime Electricity purchase price for projects NOT generating electricity ($/kWh) ** $0.075 $0.075
Annual electricity purchase price escalation rate (%) 2.0% 1.0%** Based on initial year of operation
Disclaimer:
Initial Product Prices When Net Present Value is Optimized to Achieve Financial Goals:Landfill gas production ($/million Btu) ---Electricity generation ($/kWh) $0.0227High Btu gas production ($/million Btu) ---
Method for entering waste acceptance data[CHOOSE ONLY ONE METHOD]:
The costs that are estimated by LFGcost are based on typical project designs and for typical landfill situations. The model attempts to include all equipment, site work, permits, operating activities, and maintenance that would normally be required for constructing and operating a typical project. However, individual landfills may require unique design modifications which would add to the cost estimated by LFGcost.
Analyses performed using LFGcost are considered preliminary and should be used for guidance only. A detailed final feasibility assessment should be conducted by qualified landfill gas professionals prior to preparing a system design, initiating construction, purchasing materials, or entering into agreements to provide or purchase energy from a landfill gas project.
LFG energy project type: (D)irect use, (T)urbine, (E)ngine, (H)igh Btu, microtu(R)bine,small en(G)ine, lea(C)hate evaporator, CHP engine (CE), CHP turbine (CT), or CHP microturbine (CM)?
G
LFGcost is a landfill gas energy project cost estimating tool developed for EPA's LMOP. LFGcost estimates landfill gas generation rates using a first-order decay equation. This equation is used to estimate generation potential but can not be considered an absolute predictor of the rate of landfill gas generation. Variations in the rate and types of incoming waste, site operating conditions, and moisture and temperature conditions may provide substantial variations in the actual rates of generation.
For direct use, high Btu, and CHP projects only: Distance between landfill and end use, pipeline or CHP unit (miles)
After completing the input fields above, select
this button to:
MM
0.180.04
Baishuitang - Small Engine - GHG Credits + $8/MTCO2E
Calculate Initial Product Price Needed to Achieve Financial Goals
INP-OUT - 1
ATTACHMENT 6
Microturbine / Combined Heat and Power
Project Economics

LFGcost V2 (version 1) Open Program 7/9/2010
INPUTS / OUTPUTS Enter Landfill Name or Identifier:
Required User Inputs: Optional User Inputs (User inputs are currently set to suggested default data):
Type of Input Required Input Data Type of Optional InputSuggested
Default Data
User Input Data
Year landfill opened 1999 LFG energy project size: Gas rate = (M)inimum, (A)verage, ma(X)imum,Year of landfill closure 2026 or (D)efined by user (must enter design flow rate below)?Area of LFG wellfield to supply project (acres) [assumes 1 well/acre] 32 For user-defined project size only: Design flow rate (ft3/min) ---
Average annual waste acceptance rate (tons/yr) Methane generation rate constant, k (1/yr) Waste acceptance rate calculator (in WASTE worksheet) Go to WASTE [0.04 for typical climates, 0.02 for arid climates, 0.1 for bioreactors or wet landfills]Annual waste disposal history (in WASTE worksheet) Go to WASTE Potential methane generation capacity of waste, Lo (ft
3/ton) 3,204 1,792Methane content of landfill gas (%) 50% 50%Average depth of landfill waste (ft) 50 50Landfill gas collection efficiency (%) 85% 56%
Will LFG energy project cost include collection and flaring costs? (Y)es or (N)o y Utilization of CHP hot water/steam potential (%) 100% 100%For leachate evaporator projects only: Amount of leachate collected (gal/yr) Expected LFG energy project lifetime (years) 15 15
1.7Operating schedule: Hours per day 24 24
For CHP projects only: Distance between CHP unit and hot water/steam user (miles) 0.1 (does not apply to Days per week 7 7Year LFG energy project begins operation 2012 leachate evaporators) Weeks per year 52 52
Loan lifetime (years) 10 10Outputs: Interest rate (%) 8.0% 8.0%
Type of Output Output Data General inflation rate (% - applied to O&M costs) 2.5% 2.5%Economic Analysis: Equipment inflation rate (%) 1.0% 1.0%Average project size for projects NOT generating electricity: (million ft3/yr) 0.000 Marginal tax rate (%) 35.0% 35.0%[based on actual LFG use] (ft3/min) 0.000 Discount rate (%) 10.0% 10.0%Average project size for projects generating electricity (kWh/yr) 9,337,268 Down payment (%) 20.0% 20.0%Average project size for CHP projects producing hot water/steam (million Btu/yr) 54,156 Energy tax credits: Landfill gas utilization or high Btu production ($/million Btu) $0.000 $0.000Total installed capital cost for year of construction ($) $3,506,097 Electricity generation ($/kWh) $0.000 $0.000Annual costs for initial year of operation ($) $208,346 Direct credits: Global warming potential of methane 21.00 21.00Internal rate of return (%) 22% Greenhouse gas reduction credit ($/MTCO2E) $0.000 $0.000Net present value at year of construction ($) $1,094,763 Are direct methane reductions included in GHG credit? Y YNet present value payback* (years after operation begins) 8 Renewable electricity credit ($/kWh) $0.000 $0.000Environmental Benefits: Avoided leachate disposal ($/gal) ** $0.000 $0.000Total lifetime amount of methane collected and destroyed (million ft3) 3,190 Construction grant ($) $0 $0Average annual amount of methane collected and destroyed (million ft3/yr) 213 Royalty payment for landfill gas utilization ($/million Btu) $0.000 $0.000GHG value of total lifetime amount of methane utilized in energy project (MMTCO2E) 9.41E-01 Cost uncertainty factor (entered as % adjustment) 0.0% 0.0%GHG value of average annual amount of methane utilized in energy project (MMTCO2E/yr) 6.27E-02 Initial year product price: ** Landfill gas production ($/million Btu) $5.00 $5.00Total lifetime carbon dioxide from avoided energy generation: (MMTCO2E) 1.53E-01 Electricity generation ($/kWh) $0.0600 $0.0600
(MMTCE) 4.18E-02 CHP hot water/steam production ($/million Btu) $7.50 $7.50Average annual carbon dioxide from avoided energy generation: (MMTCO2E/yr) 1.02E-02 High Btu production ($/million Btu) $6.500 $6.500
(MMTCE/yr) 2.79E-03 Annual product price escalation rate (%) 2.0% 1.0%* "None" = no return on investment or no payback in LFG energy project lifetime Electricity purchase price for projects NOT generating electricity ($/kWh) ** $0.075 $0.075
Annual electricity purchase price escalation rate (%) 2.0% 1.0%** Based on initial year of operation
Disclaimer:
Initial Product Prices When Net Present Value is Optimized to Achieve Financial Goals:Landfill gas production ($/million Btu) ---Electricity generation ($/kWh) $0.0353High Btu gas production ($/million Btu) ---
0.04
Baishuitang - Combined Heat and Power Microturbine - GHG Credits + $0/MTCO2E
After completing the input fields above, select
this button to:
MM
0.18Method for entering waste acceptance data[CHOOSE ONLY ONE METHOD]:
The costs that are estimated by LFGcost are based on typical project designs and for typical landfill situations. The model attempts to include all equipment, site work, permits, operating activities, and maintenance that would normally be required for constructing and operating a typical project. However, individual landfills may require unique design modifications which would add to the cost estimated by LFGcost.
Analyses performed using LFGcost are considered preliminary and should be used for guidance only. A detailed final feasibility assessment should be conducted by qualified landfill gas professionals prior to preparing a system design, initiating construction, purchasing materials, or entering into agreements to provide or purchase energy from a landfill gas project.
LFG energy project type: (D)irect use, (T)urbine, (E)ngine, (H)igh Btu, microtu(R)bine,small en(G)ine, lea(C)hate evaporator, CHP engine (CE), CHP turbine (CT), or CHP microturbine (CM)?
CM
LFGcost is a landfill gas energy project cost estimating tool developed for EPA's LMOP. LFGcost estimates landfill gas generation rates using a first-order decay equation. This equation is used to estimate generation potential but can not be considered an absolute predictor of the rate of landfill gas generation. Variations in the rate and types of incoming waste, site operating conditions, and moisture and temperature conditions may provide substantial variations in the actual rates of generation.
For direct use, high Btu, and CHP projects only: Distance between landfill and end use, pipeline or CHP unit (miles)
Calculate Initial Product Price Needed to Achieve Financial Goals
INP-OUT - 1

LFGcost V2 (version 1) Open Program 7/9/2010
INPUTS / OUTPUTS Enter Landfill Name or Identifier:
Required User Inputs: Optional User Inputs (User inputs are currently set to suggested default data):
Type of Input Required Input Data Type of Optional InputSuggested
Default Data
User Input Data
Year landfill opened 1999 LFG energy project size: Gas rate = (M)inimum, (A)verage, ma(X)imum,Year of landfill closure 2026 or (D)efined by user (must enter design flow rate below)?Area of LFG wellfield to supply project (acres) [assumes 1 well/acre] 32 For user-defined project size only: Design flow rate (ft3/min) ---
Average annual waste acceptance rate (tons/yr) Methane generation rate constant, k (1/yr) Waste acceptance rate calculator (in WASTE worksheet) Go to WASTE [0.04 for typical climates, 0.02 for arid climates, 0.1 for bioreactors or wet landfills]Annual waste disposal history (in WASTE worksheet) Go to WASTE Potential methane generation capacity of waste, Lo (ft
3/ton) 3,204 1,792Methane content of landfill gas (%) 50% 50%Average depth of landfill waste (ft) 50 50Landfill gas collection efficiency (%) 85% 56%
Will LFG energy project cost include collection and flaring costs? (Y)es or (N)o y Utilization of CHP hot water/steam potential (%) 100% 100%For leachate evaporator projects only: Amount of leachate collected (gal/yr) Expected LFG energy project lifetime (years) 15 15
1.7Operating schedule: Hours per day 24 24
For CHP projects only: Distance between CHP unit and hot water/steam user (miles) 0.1 (does not apply to Days per week 7 7Year LFG energy project begins operation 2012 leachate evaporators) Weeks per year 52 52
Loan lifetime (years) 10 10Outputs: Interest rate (%) 8.0% 8.0%
Type of Output Output Data General inflation rate (% - applied to O&M costs) 2.5% 2.5%Economic Analysis: Equipment inflation rate (%) 1.0% 1.0%Average project size for projects NOT generating electricity: (million ft3/yr) 0.000 Marginal tax rate (%) 35.0% 35.0%[based on actual LFG use] (ft3/min) 0.000 Discount rate (%) 10.0% 10.0%Average project size for projects generating electricity (kWh/yr) 9,337,268 Down payment (%) 20.0% 20.0%Average project size for CHP projects producing hot water/steam (million Btu/yr) 54,156 Energy tax credits: Landfill gas utilization or high Btu production ($/million Btu) $0.000 $0.000Total installed capital cost for year of construction ($) $3,506,097 Electricity generation ($/kWh) $0.000 $0.000Annual costs for initial year of operation ($) $208,346 Direct credits: Global warming potential of methane 21.00 21.00Internal rate of return (%) 41% Greenhouse gas reduction credit ($/MTCO2E) $0.000 $4.000Net present value at year of construction ($) $2,760,359 Are direct methane reductions included in GHG credit? Y YNet present value payback* (years after operation begins) 4 Renewable electricity credit ($/kWh) $0.000 $0.000Environmental Benefits: Avoided leachate disposal ($/gal) ** $0.000 $0.000Total lifetime amount of methane collected and destroyed (million ft3) 3,190 Construction grant ($) $0 $0Average annual amount of methane collected and destroyed (million ft3/yr) 213 Royalty payment for landfill gas utilization ($/million Btu) $0.000 $0.000GHG value of total lifetime amount of methane utilized in energy project (MMTCO2E) 9.41E-01 Cost uncertainty factor (entered as % adjustment) 0.0% 0.0%GHG value of average annual amount of methane utilized in energy project (MMTCO2E/yr) 6.27E-02 Initial year product price: ** Landfill gas production ($/million Btu) $5.00 $5.00Total lifetime carbon dioxide from avoided energy generation: (MMTCO2E) 1.53E-01 Electricity generation ($/kWh) $0.0600 $0.0600
(MMTCE) 4.18E-02 CHP hot water/steam production ($/million Btu) $7.50 $7.50Average annual carbon dioxide from avoided energy generation: (MMTCO2E/yr) 1.02E-02 High Btu production ($/million Btu) $6.500 $6.500
(MMTCE/yr) 2.79E-03 Annual product price escalation rate (%) 2.0% 1.0%* "None" = no return on investment or no payback in LFG energy project lifetime Electricity purchase price for projects NOT generating electricity ($/kWh) ** $0.075 $0.075
Annual electricity purchase price escalation rate (%) 2.0% 1.0%** Based on initial year of operation
Disclaimer:
Initial Product Prices When Net Present Value is Optimized to Achieve Financial Goals:Landfill gas production ($/million Btu) ---Electricity generation ($/kWh) -$0.0024High Btu gas production ($/million Btu) ---
0.04
Baishuitang - Combined Heat and Power Microturbine - GHG Credits + $4/MTCO2E
After completing the input fields above, select
this button to:
MM
0.18Method for entering waste acceptance data[CHOOSE ONLY ONE METHOD]:
The costs that are estimated by LFGcost are based on typical project designs and for typical landfill situations. The model attempts to include all equipment, site work, permits, operating activities, and maintenance that would normally be required for constructing and operating a typical project. However, individual landfills may require unique design modifications which would add to the cost estimated by LFGcost.
Analyses performed using LFGcost are considered preliminary and should be used for guidance only. A detailed final feasibility assessment should be conducted by qualified landfill gas professionals prior to preparing a system design, initiating construction, purchasing materials, or entering into agreements to provide or purchase energy from a landfill gas project.
LFG energy project type: (D)irect use, (T)urbine, (E)ngine, (H)igh Btu, microtu(R)bine,small en(G)ine, lea(C)hate evaporator, CHP engine (CE), CHP turbine (CT), or CHP microturbine (CM)?
CM
LFGcost is a landfill gas energy project cost estimating tool developed for EPA's LMOP. LFGcost estimates landfill gas generation rates using a first-order decay equation. This equation is used to estimate generation potential but can not be considered an absolute predictor of the rate of landfill gas generation. Variations in the rate and types of incoming waste, site operating conditions, and moisture and temperature conditions may provide substantial variations in the actual rates of generation.
For direct use, high Btu, and CHP projects only: Distance between landfill and end use, pipeline or CHP unit (miles)
Calculate Initial Product Price Needed to Achieve Financial Goals
INP-OUT - 1

LFGcost V2 (version 1) Open Program 7/9/2010
INPUTS / OUTPUTS Enter Landfill Name or Identifier:
Required User Inputs: Optional User Inputs (User inputs are currently set to suggested default data):
Type of Input Required Input Data Type of Optional InputSuggested
Default Data
User Input Data
Year landfill opened 1999 LFG energy project size: Gas rate = (M)inimum, (A)verage, ma(X)imum,Year of landfill closure 2026 or (D)efined by user (must enter design flow rate below)?Area of LFG wellfield to supply project (acres) [assumes 1 well/acre] 32 For user-defined project size only: Design flow rate (ft3/min) ---
Average annual waste acceptance rate (tons/yr) Methane generation rate constant, k (1/yr) Waste acceptance rate calculator (in WASTE worksheet) Go to WASTE [0.04 for typical climates, 0.02 for arid climates, 0.1 for bioreactors or wet landfills]Annual waste disposal history (in WASTE worksheet) Go to WASTE Potential methane generation capacity of waste, Lo (ft
3/ton) 3,204 1,792Methane content of landfill gas (%) 50% 50%Average depth of landfill waste (ft) 50 50Landfill gas collection efficiency (%) 85% 56%
Will LFG energy project cost include collection and flaring costs? (Y)es or (N)o y Utilization of CHP hot water/steam potential (%) 100% 100%For leachate evaporator projects only: Amount of leachate collected (gal/yr) Expected LFG energy project lifetime (years) 15 15
1.7Operating schedule: Hours per day 24 24
For CHP projects only: Distance between CHP unit and hot water/steam user (miles) 0.1 (does not apply to Days per week 7 7Year LFG energy project begins operation 2012 leachate evaporators) Weeks per year 52 52
Loan lifetime (years) 10 10Outputs: Interest rate (%) 8.0% 8.0%
Type of Output Output Data General inflation rate (% - applied to O&M costs) 2.5% 2.5%Economic Analysis: Equipment inflation rate (%) 1.0% 1.0%Average project size for projects NOT generating electricity: (million ft3/yr) 0.000 Marginal tax rate (%) 35.0% 35.0%[based on actual LFG use] (ft3/min) 0.000 Discount rate (%) 10.0% 10.0%Average project size for projects generating electricity (kWh/yr) 9,337,268 Down payment (%) 20.0% 20.0%Average project size for CHP projects producing hot water/steam (million Btu/yr) 54,156 Energy tax credits: Landfill gas utilization or high Btu production ($/million Btu) $0.000 $0.000Total installed capital cost for year of construction ($) $3,506,097 Electricity generation ($/kWh) $0.000 $0.000Annual costs for initial year of operation ($) $208,346 Direct credits: Global warming potential of methane 21.00 21.00Internal rate of return (%) 59% Greenhouse gas reduction credit ($/MTCO2E) $0.000 $8.000Net present value at year of construction ($) $4,425,955 Are direct methane reductions included in GHG credit? Y YNet present value payback* (years after operation begins) 3 Renewable electricity credit ($/kWh) $0.000 $0.000Environmental Benefits: Avoided leachate disposal ($/gal) ** $0.000 $0.000Total lifetime amount of methane collected and destroyed (million ft3) 3,190 Construction grant ($) $0 $0Average annual amount of methane collected and destroyed (million ft3/yr) 213 Royalty payment for landfill gas utilization ($/million Btu) $0.000 $0.000GHG value of total lifetime amount of methane utilized in energy project (MMTCO2E) 9.41E-01 Cost uncertainty factor (entered as % adjustment) 0.0% 0.0%GHG value of average annual amount of methane utilized in energy project (MMTCO2E/yr) 6.27E-02 Initial year product price: ** Landfill gas production ($/million Btu) $5.00 $5.00Total lifetime carbon dioxide from avoided energy generation: (MMTCO2E) 1.53E-01 Electricity generation ($/kWh) $0.0600 $0.0600
(MMTCE) 4.18E-02 CHP hot water/steam production ($/million Btu) $7.50 $7.50Average annual carbon dioxide from avoided energy generation: (MMTCO2E/yr) 1.02E-02 High Btu production ($/million Btu) $6.500 $6.500
(MMTCE/yr) 2.79E-03 Annual product price escalation rate (%) 2.0% 1.0%* "None" = no return on investment or no payback in LFG energy project lifetime Electricity purchase price for projects NOT generating electricity ($/kWh) ** $0.075 $0.075
Annual electricity purchase price escalation rate (%) 2.0% 1.0%** Based on initial year of operation
Disclaimer:
Initial Product Prices When Net Present Value is Optimized to Achieve Financial Goals:Landfill gas production ($/million Btu) ---Electricity generation ($/kWh) -$0.0400High Btu gas production ($/million Btu) ---
Method for entering waste acceptance data[CHOOSE ONLY ONE METHOD]:
The costs that are estimated by LFGcost are based on typical project designs and for typical landfill situations. The model attempts to include all equipment, site work, permits, operating activities, and maintenance that would normally be required for constructing and operating a typical project. However, individual landfills may require unique design modifications which would add to the cost estimated by LFGcost.
Analyses performed using LFGcost are considered preliminary and should be used for guidance only. A detailed final feasibility assessment should be conducted by qualified landfill gas professionals prior to preparing a system design, initiating construction, purchasing materials, or entering into agreements to provide or purchase energy from a landfill gas project.
LFG energy project type: (D)irect use, (T)urbine, (E)ngine, (H)igh Btu, microtu(R)bine,small en(G)ine, lea(C)hate evaporator, CHP engine (CE), CHP turbine (CT), or CHP microturbine (CM)?
CM
LFGcost is a landfill gas energy project cost estimating tool developed for EPA's LMOP. LFGcost estimates landfill gas generation rates using a first-order decay equation. This equation is used to estimate generation potential but can not be considered an absolute predictor of the rate of landfill gas generation. Variations in the rate and types of incoming waste, site operating conditions, and moisture and temperature conditions may provide substantial variations in the actual rates of generation.
For direct use, high Btu, and CHP projects only: Distance between landfill and end use, pipeline or CHP unit (miles)
After completing the input fields above, select
this button to:
MM
0.180.04
Baishuitang - Combined Heat and Power Microturbine - GHG Credits + $8/MTCO2E
Calculate Initial Product Price Needed to Achieve Financial Goals
INP-OUT - 1