Embed Size (px)
Citation preview
Pulsed power performance of the Z machine: ten years after the upgrade §
M.E. Savage, K.N. Austin, B.T. Hutsel, R.J. Kamm, G.R. McKee, W.A. Stygar, P.E. Wakeland, N.R. Wemple, W.M. White
Sandia National Laboratories, Albuquerque NM 87185 Abstract
he Z machine is a 36-module, multi-megavolt, low impedance magnetic pressure driver for high-energy-
density physics experiments. In 2007, a major re-build doubled the stored energy and increased the peak current capability of Z. The upgraded system routinely drives 27 MA through low inductance dynamic loads with 110 nanosecond time to peak current. The Z pulsed power system is expected to be prepared for a full-energy experiment every day, with a small (<2%) chance of pulsed power system failure, and ±2 ns timing precision. To maintain that schedule with 20 MJ stored, it becomes essential to minimize failures that can damage hardware. We will show the results of several improvements made to the system that reduce spurious breakdowns and improve precision. In most cases, controlling electric fields is key, both to reliable insulation and to precision switching. The upgraded Z pulsed power system was originally intended to operate with 5 MV peak voltage in the pulse-forming section. Recent operation has been above 6 MV. Critical items in the pulsed power system are the DC-charged Marx generators, oil-water barriers, laser-triggered gas switches, and the vacuum insulator. We will show major improvements to the laser-triggered gas switches, and the water-insulated pulse forming lines, as well as delivered current reproducibility results from user experiments on the machine.
I. Reliability The Z machine has many highly-stressed components; at
the same time, reliability is vital for a predictable shot schedule.
One major Z subsystem that can impact the availability of the machine is the Marx generators. The Marx generators are charged from utility power with a regulated charging system capable of 800 kW peak power output and reaching ±85kV in 60 seconds. In practice, however, the Marx generators are charged at a slower rate because of charge-separation stress in the electrolytic resistors, which causes non-uniform heating and bubbles. [1] Resistor damage and bubbles increase required maintenance. Furthermore, it is observed that the probability of spurious breakdowns in this system does not significantly increase with charging time. Because the Z Marx generators are
§ Sandia National Laboratories is a multimission laboratory managed and operated by National Technology and Engineering Solutions of Sandia, LLC., a wholly owned subsidiary of Honeywell International, Inc., for the U.S. Department of Energy’s National Nuclear Security Administration under contract DE-NA-0003525.
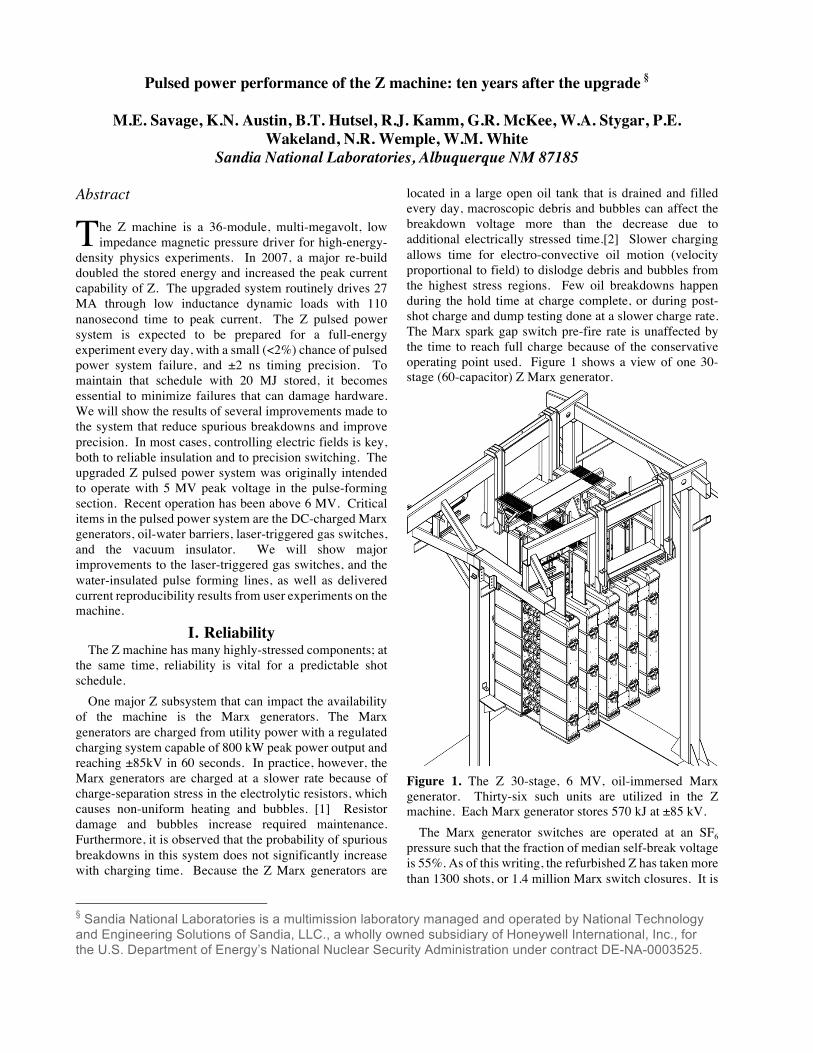
located in a large open oil tank that is drained and filled every day, macroscopic debris and bubbles can affect the breakdown voltage more than the decrease due to additional electrically stressed time.[2] Slower charging allows time for electro-convective oil motion (velocity proportional to field) to dislodge debris and bubbles from the highest stress regions. Few oil breakdowns happen during the hold time at charge complete, or during post-shot charge and dump testing done at a slower charge rate. The Marx spark gap switch pre-fire rate is unaffected by the time to reach full charge because of the conservative operating point used. Figure 1 shows a view of one 30-stage (60-capacitor) Z Marx generator.
Figure 1. The Z 30-stage, 6 MV, oil-immersed Marx generator. Thirty-six such units are utilized in the Z machine. Each Marx generator stores 570 kJ at ±85 kV.
The Marx generator switches are operated at an SF6 pressure such that the fraction of median self-break voltage is 55%. As of this writing, the refurbished Z has taken more than 1300 shots, or 1.4 million Marx switch closures. It is
T
not always possible to identify definitively the initiating cause of a given failure, but total Marx switch spontaneous gas breakdown events number between zero and ten out of those 1.4 million switch closures.
The one-sigma jitter of the 36 Marx generator ensemble is 13 nanoseconds at ±85 kV; this is less than 1% of the Marx energy transfer time to the next stage. The Marx trigger pulse is 500 kV regardless of Marx charge voltage; Marx jitter is consequently less at lower Marx charge voltages.
Reliability of the 2.6 µF 100kV-rated Scyllac-case Marx capacitors is a critical issue for Z, even beyond the inconvenience of replacing capacitors. Because the machine is charged from a single power supply, if any one of the 2160 capacitors fails (short-circuits) during a charge sequence, considerable energy (megajoules in some cases) can be deposited in charge isolation resistors near the failed capacitor. This exceeds the resistors’ energy-handling ability. At the highest energies, resistor electrolyte liquid can be boiled, resulting in a small steam explosion under oil and possible damage to nearby components. Diode isolation between Marxes is not practical because of the megavolt transients on the charge bus when the Marxes erect. For these reasons, capacitor reliability is an important factor in energy storage system availability for experiments.
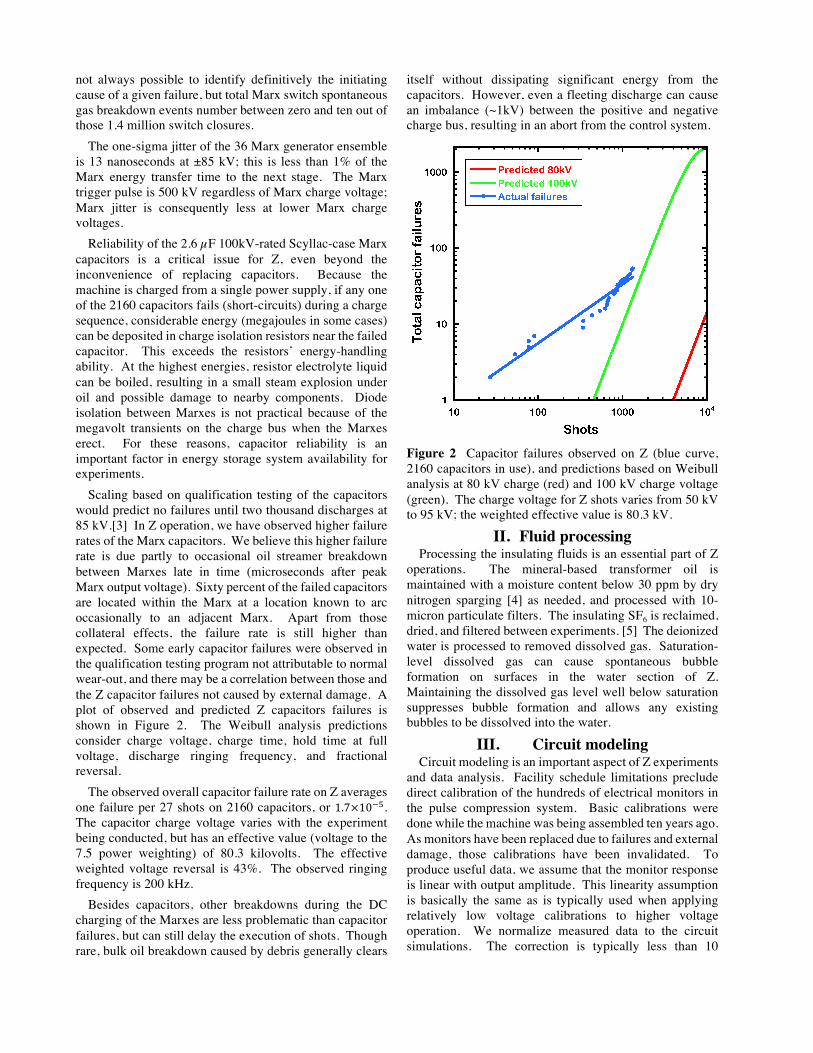
Scaling based on qualification testing of the capacitors would predict no failures until two thousand discharges at 85 kV.[3] In Z operation, we have observed higher failure rates of the Marx capacitors. We believe this higher failure rate is due partly to occasional oil streamer breakdown between Marxes late in time (microseconds after peak Marx output voltage). Sixty percent of the failed capacitors are located within the Marx at a location known to arc occasionally to an adjacent Marx. Apart from those collateral effects, the failure rate is still higher than expected. Some early capacitor failures were observed in the qualification testing program not attributable to normal wear-out, and there may be a correlation between those and the Z capacitor failures not caused by external damage. A plot of observed and predicted Z capacitors failures is shown in Figure 2. The Weibull analysis predictions consider charge voltage, charge time, hold time at full voltage, discharge ringing frequency, and fractional reversal.
The observed overall capacitor failure rate on Z averages one failure per 27 shots on 2160 capacitors, or 1.7×10&'. The capacitor charge voltage varies with the experiment being conducted, but has an effective value (voltage to the 7.5 power weighting) of 80.3 kilovolts. The effective weighted voltage reversal is 43%. The observed ringing frequency is 200 kHz.
Besides capacitors, other breakdowns during the DC charging of the Marxes are less problematic than capacitor failures, but can still delay the execution of shots. Though rare, bulk oil breakdown caused by debris generally clears
itself without dissipating significant energy from the capacitors. However, even a fleeting discharge can cause an imbalance (~1kV) between the positive and negative charge bus, resulting in an abort from the control system.
Figure 2 Capacitor failures observed on Z (blue curve, 2160 capacitors in use), and predictions based on Weibull analysis at 80 kV charge (red) and 100 kV charge voltage (green). The charge voltage for Z shots varies from 50 kV to 95 kV; the weighted effective value is 80.3 kV.
II. Fluid processing Processing the insulating fluids is an essential part of Z
operations. The mineral-based transformer oil is maintained with a moisture content below 30 ppm by dry nitrogen sparging [4] as needed, and processed with 10-micron particulate filters. The insulating SF6 is reclaimed, dried, and filtered between experiments. [5] The deionized water is processed to removed dissolved gas. Saturation-level dissolved gas can cause spontaneous bubble formation on surfaces in the water section of Z. Maintaining the dissolved gas level well below saturation suppresses bubble formation and allows any existing bubbles to be dissolved into the water.
III. Circuit modeling Circuit modeling is an important aspect of Z experiments
and data analysis. Facility schedule limitations preclude direct calibration of the hundreds of electrical monitors in the pulse compression system. Basic calibrations were done while the machine was being assembled ten years ago. As monitors have been replaced due to failures and external damage, those calibrations have been invalidated. To produce useful data, we assume that the monitor response is linear with output amplitude. This linearity assumption is basically the same as is typically used when applying relatively low voltage calibrations to higher voltage operation. We normalize measured data to the circuit simulations. The correction is typically less than 10
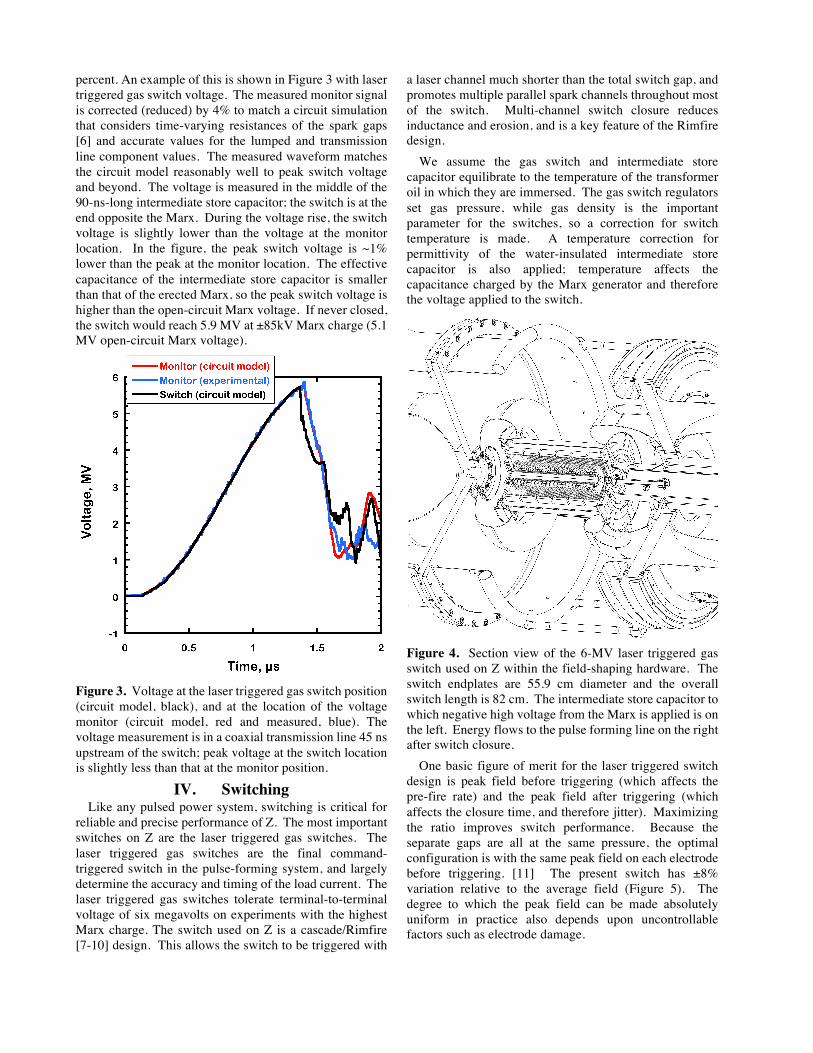
percent. An example of this is shown in Figure 3 with laser triggered gas switch voltage. The measured monitor signal is corrected (reduced) by 4% to match a circuit simulation that considers time-varying resistances of the spark gaps [6] and accurate values for the lumped and transmission line component values. The measured waveform matches the circuit model reasonably well to peak switch voltage and beyond. The voltage is measured in the middle of the 90-ns-long intermediate store capacitor; the switch is at the end opposite the Marx. During the voltage rise, the switch voltage is slightly lower than the voltage at the monitor location. In the figure, the peak switch voltage is ~1% lower than the peak at the monitor location. The effective capacitance of the intermediate store capacitor is smaller than that of the erected Marx, so the peak switch voltage is higher than the open-circuit Marx voltage. If never closed, the switch would reach 5.9 MV at ±85kV Marx charge (5.1 MV open-circuit Marx voltage).
Figure 3. Voltage at the laser triggered gas switch position (circuit model, black), and at the location of the voltage monitor (circuit model, red and measured, blue). The voltage measurement is in a coaxial transmission line 45 ns upstream of the switch; peak voltage at the switch location is slightly less than that at the monitor position.
IV. Switching Like any pulsed power system, switching is critical for
reliable and precise performance of Z. The most important switches on Z are the laser triggered gas switches. The laser triggered gas switches are the final command-triggered switch in the pulse-forming system, and largely determine the accuracy and timing of the load current. The laser triggered gas switches tolerate terminal-to-terminal voltage of six megavolts on experiments with the highest Marx charge. The switch used on Z is a cascade/Rimfire [7-10] design. This allows the switch to be triggered with
a laser channel much shorter than the total switch gap, and promotes multiple parallel spark channels throughout most of the switch. Multi-channel switch closure reduces inductance and erosion, and is a key feature of the Rimfire design.
We assume the gas switch and intermediate store capacitor equilibrate to the temperature of the transformer oil in which they are immersed. The gas switch regulators set gas pressure, while gas density is the important parameter for the switches, so a correction for switch temperature is made. A temperature correction for permittivity of the water-insulated intermediate store capacitor is also applied; temperature affects the capacitance charged by the Marx generator and therefore the voltage applied to the switch.
Figure 4. Section view of the 6-MV laser triggered gas switch used on Z within the field-shaping hardware. The switch endplates are 55.9 cm diameter and the overall switch length is 82 cm. The intermediate store capacitor to which negative high voltage from the Marx is applied is on the left. Energy flows to the pulse forming line on the right after switch closure.
One basic figure of merit for the laser triggered switch design is peak field before triggering (which affects the pre-fire rate) and the peak field after triggering (which affects the closure time, and therefore jitter). Maximizing the ratio improves switch performance. Because the separate gaps are all at the same pressure, the optimal configuration is with the same peak field on each electrode before triggering. [11] The present switch has ±8% variation relative to the average field (Figure 5). The degree to which the peak field can be made absolutely uniform in practice also depends upon uncontrollable factors such as electrode damage.
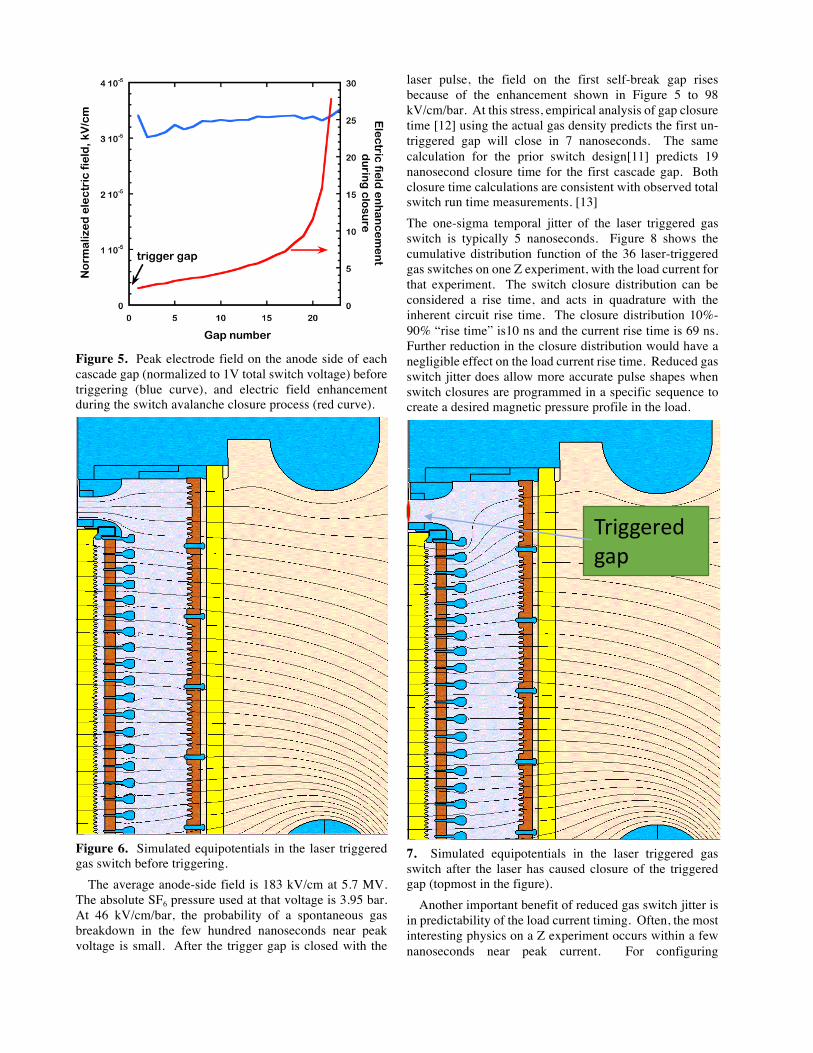
Figure 5. Peak electrode field on the anode side of each cascade gap (normalized to 1V total switch voltage) before triggering (blue curve), and electric field enhancement during the switch avalanche closure process (red curve).
Figure 6. Simulated equipotentials in the laser triggered gas switch before triggering.
The average anode-side field is 183 kV/cm at 5.7 MV. The absolute SF6 pressure used at that voltage is 3.95 bar. At 46 kV/cm/bar, the probability of a spontaneous gas breakdown in the few hundred nanoseconds near peak voltage is small. After the trigger gap is closed with the
laser pulse, the field on the first self-break gap rises because of the enhancement shown in Figure 5 to 98 kV/cm/bar. At this stress, empirical analysis of gap closure time [12] using the actual gas density predicts the first un-triggered gap will close in 7 nanoseconds. The same calculation for the prior switch design[11] predicts 19 nanosecond closure time for the first cascade gap. Both closure time calculations are consistent with observed total switch run time measurements. [13] The one-sigma temporal jitter of the laser triggered gas switch is typically 5 nanoseconds. Figure 8 shows the cumulative distribution function of the 36 laser-triggered gas switches on one Z experiment, with the load current for that experiment. The switch closure distribution can be considered a rise time, and acts in quadrature with the inherent circuit rise time. The closure distribution 10%-90% “rise time” is10 ns and the current rise time is 69 ns. Further reduction in the closure distribution would have a negligible effect on the load current rise time. Reduced gas switch jitter does allow more accurate pulse shapes when switch closures are programmed in a specific sequence to create a desired magnetic pressure profile in the load.
7. Simulated equipotentials in the laser triggered gas switch after the laser has caused closure of the triggered gap (topmost in the figure).
Another important benefit of reduced gas switch jitter is in predictability of the load current timing. Often, the most interesting physics on a Z experiment occurs within a few nanoseconds near peak current. For configuring
Triggeredgap
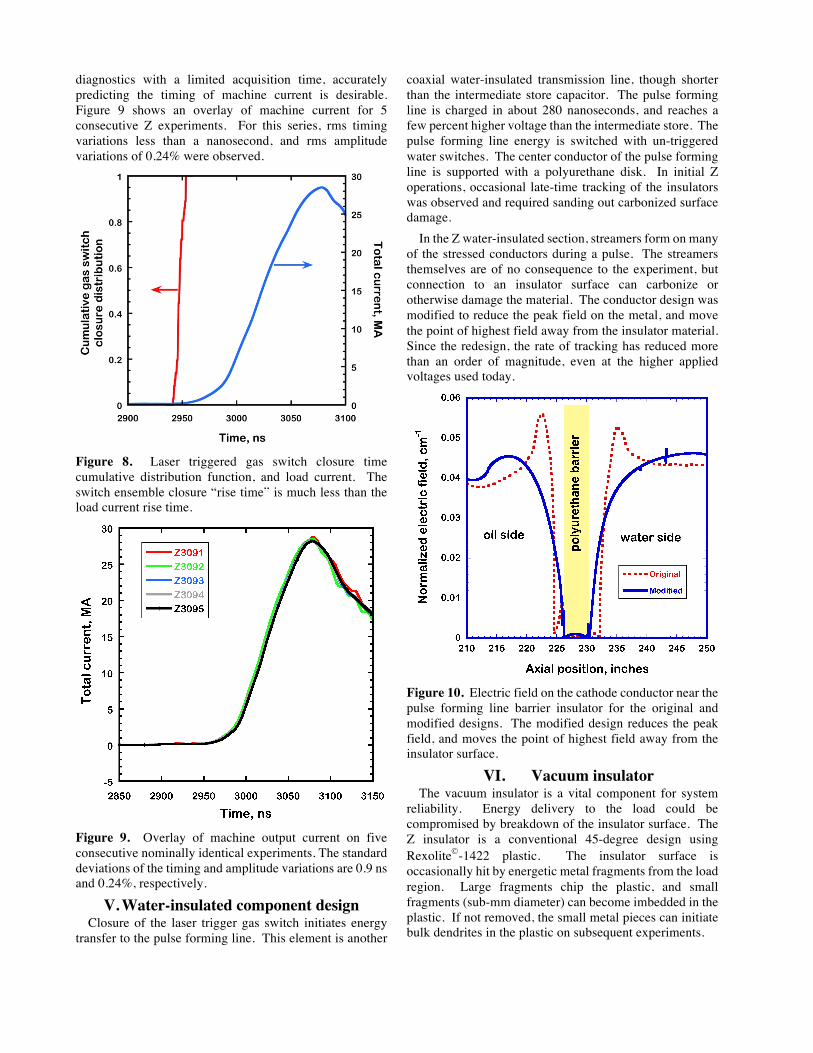
diagnostics with a limited acquisition time, accurately predicting the timing of machine current is desirable. Figure 9 shows an overlay of machine current for 5 consecutive Z experiments. For this series, rms timing variations less than a nanosecond, and rms amplitude variations of 0.24% were observed.
Figure 8. Laser triggered gas switch closure time cumulative distribution function, and load current. The switch ensemble closure “rise time” is much less than the load current rise time.
Figure 9. Overlay of machine output current on five consecutive nominally identical experiments. The standard deviations of the timing and amplitude variations are 0.9 ns and 0.24%, respectively.
V. Water-insulated component design Closure of the laser trigger gas switch initiates energy
transfer to the pulse forming line. This element is another
coaxial water-insulated transmission line, though shorter than the intermediate store capacitor. The pulse forming line is charged in about 280 nanoseconds, and reaches a few percent higher voltage than the intermediate store. The pulse forming line energy is switched with un-triggered water switches. The center conductor of the pulse forming line is supported with a polyurethane disk. In initial Z operations, occasional late-time tracking of the insulators was observed and required sanding out carbonized surface damage.
In the Z water-insulated section, streamers form on many of the stressed conductors during a pulse. The streamers themselves are of no consequence to the experiment, but connection to an insulator surface can carbonize or otherwise damage the material. The conductor design was modified to reduce the peak field on the metal, and move the point of highest field away from the insulator material. Since the redesign, the rate of tracking has reduced more than an order of magnitude, even at the higher applied voltages used today.
Figure 10. Electric field on the cathode conductor near the pulse forming line barrier insulator for the original and modified designs. The modified design reduces the peak field, and moves the point of highest field away from the insulator surface.
VI. Vacuum insulator The vacuum insulator is a vital component for system
reliability. Energy delivery to the load could be compromised by breakdown of the insulator surface. The Z insulator is a conventional 45-degree design using RexoliteÓ-1422 plastic. The insulator surface is occasionally hit by energetic metal fragments from the load region. Large fragments chip the plastic, and small fragments (sub-mm diameter) can become imbedded in the plastic. If not removed, the small metal pieces can initiate bulk dendrites in the plastic on subsequent experiments.
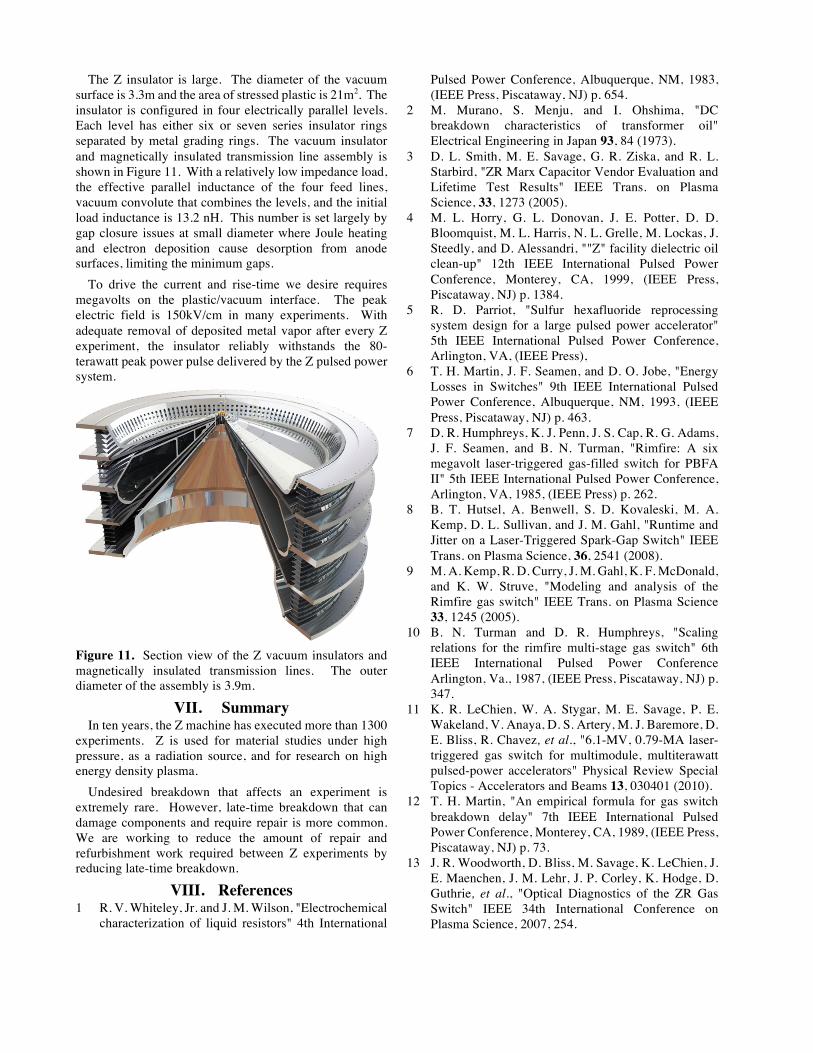
The Z insulator is large. The diameter of the vacuum surface is 3.3m and the area of stressed plastic is 21m2. The insulator is configured in four electrically parallel levels. Each level has either six or seven series insulator rings separated by metal grading rings. The vacuum insulator and magnetically insulated transmission line assembly is shown in Figure 11. With a relatively low impedance load, the effective parallel inductance of the four feed lines, vacuum convolute that combines the levels, and the initial load inductance is 13.2 nH. This number is set largely by gap closure issues at small diameter where Joule heating and electron deposition cause desorption from anode surfaces, limiting the minimum gaps.
To drive the current and rise-time we desire requires megavolts on the plastic/vacuum interface. The peak electric field is 150kV/cm in many experiments. With adequate removal of deposited metal vapor after every Z experiment, the insulator reliably withstands the 80-terawatt peak power pulse delivered by the Z pulsed power system.
Figure 11. Section view of the Z vacuum insulators and magnetically insulated transmission lines. The outer diameter of the assembly is 3.9m.
VII. Summary In ten years, the Z machine has executed more than 1300
experiments. Z is used for material studies under high pressure, as a radiation source, and for research on high energy density plasma.
Undesired breakdown that affects an experiment is extremely rare. However, late-time breakdown that can damage components and require repair is more common. We are working to reduce the amount of repair and refurbishment work required between Z experiments by reducing late-time breakdown.
VIII. References 1 R. V. Whiteley, Jr. and J. M. Wilson, "Electrochemical
characterization of liquid resistors" 4th International
Pulsed Power Conference, Albuquerque, NM, 1983, (IEEE Press, Piscataway, NJ) p. 654.
2 M. Murano, S. Menju, and I. Ohshima, "DC breakdown characteristics of transformer oil" Electrical Engineering in Japan 93, 84 (1973).
3 D. L. Smith, M. E. Savage, G. R. Ziska, and R. L. Starbird, "ZR Marx Capacitor Vendor Evaluation and Lifetime Test Results" IEEE Trans. on Plasma Science, 33, 1273 (2005).
4 M. L. Horry, G. L. Donovan, J. E. Potter, D. D. Bloomquist, M. L. Harris, N. L. Grelle, M. Lockas, J. Steedly, and D. Alessandri, ""Z" facility dielectric oil clean-up" 12th IEEE International Pulsed Power Conference, Monterey, CA, 1999, (IEEE Press, Piscataway, NJ) p. 1384.
5 R. D. Parriot, "Sulfur hexafluoride reprocessing system design for a large pulsed power accelerator" 5th IEEE International Pulsed Power Conference, Arlington, VA, (IEEE Press),
6 T. H. Martin, J. F. Seamen, and D. O. Jobe, "Energy Losses in Switches" 9th IEEE International Pulsed Power Conference, Albuquerque, NM, 1993, (IEEE Press, Piscataway, NJ) p. 463.
7 D. R. Humphreys, K. J. Penn, J. S. Cap, R. G. Adams, J. F. Seamen, and B. N. Turman, "Rimfire: A six megavolt laser-triggered gas-filled switch for PBFA II" 5th IEEE International Pulsed Power Conference, Arlington, VA, 1985, (IEEE Press) p. 262.
8 B. T. Hutsel, A. Benwell, S. D. Kovaleski, M. A. Kemp, D. L. Sullivan, and J. M. Gahl, "Runtime and Jitter on a Laser-Triggered Spark-Gap Switch" IEEE Trans. on Plasma Science, 36, 2541 (2008).
9 M. A. Kemp, R. D. Curry, J. M. Gahl, K. F. McDonald, and K. W. Struve, "Modeling and analysis of the Rimfire gas switch" IEEE Trans. on Plasma Science 33, 1245 (2005).
10 B. N. Turman and D. R. Humphreys, "Scaling relations for the rimfire multi-stage gas switch" 6th IEEE International Pulsed Power Conference Arlington, Va., 1987, (IEEE Press, Piscataway, NJ) p. 347.
11 K. R. LeChien, W. A. Stygar, M. E. Savage, P. E. Wakeland, V. Anaya, D. S. Artery, M. J. Baremore, D. E. Bliss, R. Chavez, et al., "6.1-MV, 0.79-MA laser-triggered gas switch for multimodule, multiterawatt pulsed-power accelerators" Physical Review Special Topics - Accelerators and Beams 13, 030401 (2010).
12 T. H. Martin, "An empirical formula for gas switch breakdown delay" 7th IEEE International Pulsed Power Conference, Monterey, CA, 1989, (IEEE Press, Piscataway, NJ) p. 73.
13 J. R. Woodworth, D. Bliss, M. Savage, K. LeChien, J. E. Maenchen, J. M. Lehr, J. P. Corley, K. Hodge, D. Guthrie, et al., "Optical Diagnostics of the ZR Gas Switch" IEEE 34th International Conference on Plasma Science, 2007, 254.