Embed Size (px)
Citation preview

Pulse survey on continuity of
essential health services
during the COVID-19 pandemic
Key informant findings from 135 countries, territories and areas
Quarter 1 2021
Reporting period: 3 months preceding date of survey submission
Global results – as of 16 April 2021

Round 2: National pulse survey on continuity of EHS during the COVID-19 pandemicQ1 2021: January – March
Use:
Gain rapid snapshot of
changes and challenges in
service delivery/utilization
Modular approach:
integrates all WHO pulse surveys
into comprehensive approach
targeting different key informants
in Ministry of Health
Timeline:
Q1 2021 (Jan- March 2021).
Results reflect situation
3 months preceding submission.
Contributes to quarterly
WHO SPRP monitoring 2021:
indicators for Pillar 9: Maintaining essential health services and systems (Proportion of countries reporting disruption to essential health services during COVID-19 pandemic) and Pillar 2: Risk communication, community engagement and infodemic management (Proportion of countries with capacities to track and address infodemic and health misinformation)
Results should be used
at country level to
support policy and planning
dialogue to identify critical
bottlenecks and priorities,
recommend mitigation
approaches/solutions, and
guide resource investments as
pandemic progresses.

Round 2: National pulse survey on continuity of EHS during the COVID-19 pandemicQ1 2021: January – March
Limitations:
• Reporting bias (self-reported key informant data)
• Type/mix of key informants across multiple survey sections
• Process of completion (individual survey section submissions vs. coordinated and validated
responses across survey sections)
• National level data does not reflect subnational variability within countries
• Response rates varied across regions, limiting extent of possible regional comparisons
• Different quantity and combination of participating countries introduces potential bias into survey
round 1 and round 2 global comparisons

Key questions the national pulse survey helps to answer
Policies and planning
• Have countries identified a core set
of EHS to be maintained during the
pandemic?
• Have countries designated a
national focal point for maintaining
EHS?
• Have countries allocated additional
funding for maintaining EHS?
Strategic changes to service delivery and public health activities
• Have countries limited or suspended access to service delivery platforms (e.g. outpatient, inpatient, emergency, community-based, etc.)?
• Have countries limited or suspended essential public health functions/activities (e.g. surveillance, emergency preparedness, research, etc.)?
Disruptions to tracer services
• Have countries limited or suspended access to service delivery platforms (e.g. outpatient, inpatient, emergency, community-based, etc.)?
• Have countries limited or suspended essential public health functions/activities (e.g. surveillance, emergency preparedness, research, etc.)?
Reasons for disruptions
• What are the main supply-side reasons for service disruptions?
• What are the main demand-side reasons for service disruptions?
Mitigation strategies
• What approaches are being used by countries to overcome service disruptions?
• What approaches are being used to ensure access to care for vulnerable groups?
• How are digital technologies being used to mitigate service disruptions?
Information tracking
• Are countries regularly monitoring and tracking continuity of EHS and the implementation of mitigation strategies?
• Are countries tracking the infodemic and misinformation?
Country priorities and needs
• What are countries’ most urgent priority needs and TA requirements for maintaining EHS?

National pulse survey on disruptions to essential health services: 2nd round response rates
Key informant responses from 135 countries/territories between January-March 2021
Note: The survey was sent to 216 countries, territories and areas. Response rates are calculated based on contexts where services are relevant.
Malaria section is considered relevant in 92 contexts and NTDs section is considered relevant in 104 contexts. Responses were tracked only in these settings.
Overall response rates Survey section response rates
Complete survey
submission
(submission of all
relevant sections)
N (%)
Complete + partial
survey
submissions
(submission of at
least 1 section)
N (%)
Section 1.
Health system
functions and
cross-cutting
services
N (%)
Section 2.
Reproductive,
maternal,
newborn, child
and adolescent
health and
nutrition
N (%)
Section 3.
Immunization
N (%)
Section 4.
HIV and
hepatitis
N (%)
Section 5.
TB
N (%)
Section 6.
Malaria
N (%)
Section 7.
Neglected
tropical
diseases
N (%)
Section 8.
Non-
communicable
diseases
N (%)
Section 9.
Mental,
neurological,
and substance
use disorders
N (%)
AFR 30 (65%) 40 (85%) 36 (77%) 38 (81%) 33 (70%) 35 (74%) 35 (74%) 32 (74%) 33 (75%) 38 (81%) 37 (79%)
AMR 16 (30%) 29 (54%) 25 (46%) 29 (54%) 23 (43%) 22 (41%) 23 (43%) 11 (65%) 11 (52%) 28 (50%) 27 (50%)
EMR 15 (68%) 21 (95%) 17 (77%) 19 (86%) 19 (86%) 17 (77%) 16 (73%) 8 (100%) 10 (83%) 19 (86%) 20 (91%)
EUR 12 (23%) 23 (43%) 16 (30%) 18 (34%) 21 (40%) 19 (36%) 19 (36%) 1 (20%) 1 (25%) 18 (34%) 18 (34%)
SEAR 8 (73%) 9 (82%) 9 (82%) 8 (73%) 9 (82%) 9 (82%) 8 (73%) 7 (78%) 6 (75%) 9 (82%) 8 (73%)
WPR 7 (24%) 13 (45%) 9 (31%) 9 (31%) 7 (24%) 10 (34%) 11 (38%) 8 (80%) 9 (60%) 9 (31%) 11 (38%)
Global 88 (41%) 135 (63%) 112 (52%) 121 (56%) 112 (52%) 112 (52%) 112 (52%) 67 (73%) 70 (67%) 121 (56%) 121 (56%)

Despite some evidence of service
restoration, over one year into the
COVID-19 pandemic, substantial
disruptions to essential health
services persist across the globe.
Disruptions to essential health services are still geographically widespread across the globe
Denominator: represents responses from countries/territories that responded to at least one survey section and consented to data sharing agreement. Percentage of countries reporting disruptions may not add up to exactly 100% due to rounding. Services include: primary care, emergency and critical
care, surgical care, rehabilitation, palliative care, long-term care, auxiliary services, and tracer services for reproductive, maternal, newborn, child and adolescent health and nutrition, immunization, communicable diseases, noncommunicable diseases, neglected tropical diseases, and mental,
neurological and substance use disorders
9% of countries reported disruptions
in 75-100% of services
25% of countries reported disruptions
in 50-74% of services
29% of countries reported disruptions
in 25-49% of services
32% of countries reported disruptions
in less than 25% of services
Only 6% of countries reported
no disruptions
94% of responding countries (n= 135)
experienced a disruption to some extent
94%

t
On average, countries reported disruptions to more than one third of services
1/3
0%
10%
20%
30%
40%
50%
60%
70%
80%
90%
100%
GNB PHL PER TLS IDN UGA PNG MEX SDN SWZ TCD ITA BOL AGO ALB SSD DOMBRA LBN HND SLB BLZ SLV UKR CMR PAN BHS ARG GBRMDG PRY MOZ PRT LCA IRQ HTI CIV LSO MRT WLS JOR SUR COM SEN MWI CHL MYS KEN STP THA TGO COG YEM GHAMAR ZAF ZMB GTM LKA PYF SYC BWAGEO IRN GIN BGR PAK ERI GMB CZE SCT GRD VCT AUT NER GAB ECU FRA DMA PSE LAO SYR TUN CRI LBR CPV JAM ETH VUT MDA URY BGDOMN BEN BMU FIN QAT VGB EGY AUS NAM LVA MDV BRN FJI NPL SOM HRV ARE AFG KAZ CYM HUN ARM BTN SAU KWT COD BDI EST RWADNK CAF DJI NIC BHR KOR MUS TKM CUB CHN BFA PRK
Per
cen
tag
e o
f se
rvic
es
Country/territory
Percentage of services disrupted per country (number of tracer services = 63)
50% or more disrupted 26-50% disrupted 5-25% disrupted
Global average: 38%
Denominator: represents responses from countries/territories that responded to at least one survey section and consented to data sharing agreement. Percentage of countries reporting disruptions may not add up to exactly 100% due to rounding. Services include: primary care, emergency and critical care,
surgical care, rehabilitation, palliative care, long-term care, auxiliary services, and tracer services for reproductive, maternal, newborn, child and adolescent health and nutrition, immunization, communicable diseases, noncommunicable diseases, neglected tropical diseases, and mental, neurological and
substance use disorders

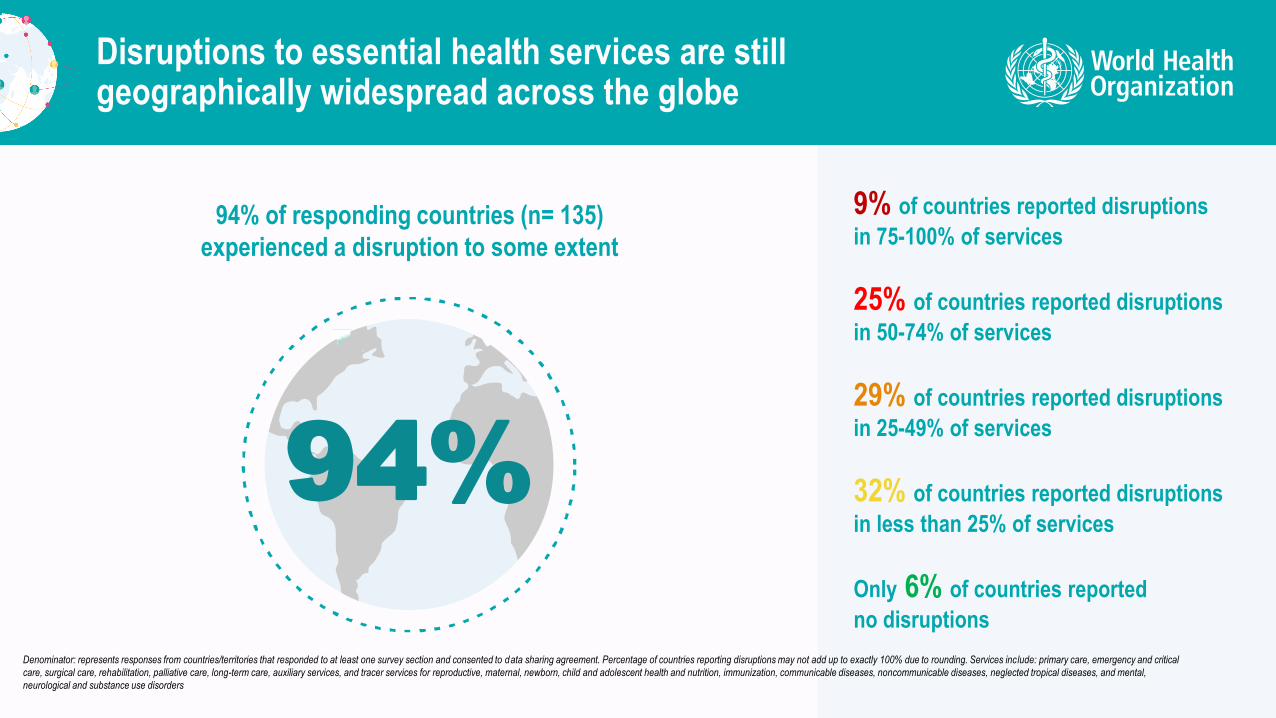
Overall, primary care and rehabilitative, palliative and long-term care are more predominantly affected
t
of countries reported
disruptions to essential
primary care services
t
of countries reported disruptions to rehabilitative, palliative and long-term care
41%48%…with likely implications for the most vulnerable
populations, such as older persons and people living with chronic conditions
and disabilities
Overall, primary care and rehabilitative, palliative and long-term care are more predominantly affected
Denominator: excludes “Not applicable” or “Do not know” responses.
19%
24%
14%
29%
22%
6%
9%
4%
13%
9%
3%
8%
3%
6%
5%
27%
41%
22%
48%
35%
0% 10% 20% 30% 40% 50% 60% 70% 80% 90% 100%
Auxiliary services
Rehabilitative, palliative and long-term care
Emergency, critical, and operative care
Primary care
AVERAGE DISRUPTION
Percentage of countries
Average percentage of disruptions across integrated service delivery channels (n=112)
5-25% disrupted 26-50% disrupted More than 50% disrupted

Potentially life-saving emergency, critical and operative care interventions disrupted in about 20% of countries, likely resulting in substantial near-term impact on health outcomes
Denominator: excludes “Not applicable” or “Do not know” responses.
29%
32%
30%
35%
24%
26%
14%
27%
21%
12%
15%
14%
15%
11%
8%
7%
24%
29%
22%
22%
19%
20%
18%
13%
16%
15%
9%
17%
8%
4%
13%
4%
5%
2%
3%
2%
1%
4%
2%
9%
13%
8%
5%
6%
5%
6%
6%
6%
8%
4%
7%
2%
3%
25%
2%
2%
1%
0%
1%
0%
0%
0%
8%
10%
7%
8%
3%
3%
3%
48%
54%
53%
48%
48%
36%
22%
65%
27%
19%
18%
18%
19%
13%
12%
9%
41%
53%
36%
35%
27%
28%
27%
0% 10% 20% 30% 40% 50% 60% 70% 80% 90% 100%
AVERAGE DISRUPTION OF PRIMARY CARE
Routine scheduled visits (n=98)
Health promotion services (n=96)
Referrals to specialty care (n=91)
Visits for undifferentiated symptoms (n=90)
Prescription renewals for chronic medications (n=97)
AVERAGE DISRUPTION OF EMERGENCY, CRITICAL, AND OPERATIVE CARE
Elective surgeries (n=100)
Emergency referrals for time-sensitive conditions (n=95)
Inpatient critical care services (n=94)
Emergency surgeries (excluding obstetric) (n=93)
Acuity-based triage in emergency units (n=95)
Ambulance services at the scene (n=100)
Emergency obstetric surgeries (n=96)
24-hour emergency room/unit services (n=94)
Urgent blood transfusion services (n=93)
AVERAGE DISRUPTION OF REHABILITATIVE, PALLIATIVE, AND LONG-TERM CARE
Rehabilitation services (n=89)
Palliative services (n=74)
Long-term care services (n=74)
AVERAGE DISRUPTION OF AUXILIARY SERVICES
Radiology services (n=97)
Laboratory services (n=97)
Pri
mar
y ca
reE
mer
gen
cy, c
riti
cal,
and
op
erat
ive
care
Reh
abili
tati
ve,
pal
liati
ve a
nd
lon
g-t
erm
car
eA
uxi
liary
serv
ices
Percentage of countries
Service disruptions across integrated service delivery channels (n=112)
5-25% disrupted
26-50% disrupted
More than 50% disrupted
65% also reporting disruptions in elective surgeries, with accumulating consequences as the pandemic is prolonged

Substantial disruptions span across all major health areas
Most frequently disrupted servicesare for mental, neurological, and
substance use disorders and neglected tropical diseases
(reported in more than 40% of countries)
Services across other health areas are also
disrupted in more than 1/3 of countries
>1/3>40%

Substantial disruptions span across all major health areas
Denominator: excludes “Not applicable” or “Do not know” responses.
24%
22%
23%
19%
15%
23%
21%
9%
7%
8%
8%
11%
13%
9%
3%
8%
5%
9%
19%
10%
9%
35%
36%
37%
37%
44%
45%
39%
0% 10% 20% 30% 40% 50% 60% 70% 80% 90% 100%
Reproductive, maternal, newborn, child and adolescent health and nutrition (n=121)
Communicable diseases (n=128)
Immunization (n=112)
Noncommunicable diseases (n=121)
Neglected tropical diseases (n=109)
Mental, neurological and substance use disorders (n=121)
AVERAGE DISRUPTION OF PROGRAMME SPECIFIC AREAS
Percentage of countries
Ess
enti
al h
ealt
h s
ervi
ce
Percentage of countries reporting disruptions across tracer service areas
5-25% disrupted 26-50% disrupted More than 50% disrupted

Countries in high income group reported fewer service disruptions compared to countries in other income groups
Denominator: excludes “Not applicable” or “Do not know” responses.
24%
11%
18%
36%
27%
9%
3%
13%
7%
13%
3%
3%
5%
3%
0%
35%
17%
36%
46%
40%
0% 10% 20% 30% 40% 50% 60%
Global (n=121)
High income (n=30)
Upper middle income (n=34)
Lower middle income (n=32)
Low income (n=25)
Percent of countries
Average percentage of countries reporting disruptions to reproductive, maternal, newborn, child and
adolescent health and nutrition services by income group
5-25% disrupted 26-50% disrupted More than 50% disrupted
23%
11%
35%
23%
20%
8%
7%
14%
6%
8%
5%
5%
8%
2%
8%
37%
23%
56%
31%
35%
0% 10% 20% 30% 40% 50% 60%
Global (n=112)
High income (n=32)
Upper middle income (n=30)
Lower middle income (n=28)
Low income (n=22)
Percent of countries
Average percentage of countries reporting disruptions to immunization services by income
group
5-25% disrupted 26-50% disrupted More than 50% disrupted
19%
5%
24%
21%
28%
8%
6%
8%
14%
3%
9%
8%
13%
10%
3%
37%
20%
45%
45%
33%
0% 10% 20% 30% 40% 50% 60%
Global (n=121)
High income (n=35)
Upper middle income (n=35)
Lower middle income (n=33)
Low income (n=25)
Percent of countries
Average percentage of countries reporting disruptions to noncommunicable disease services by income group
5-25% disrupted 26-50% disrupted More than 50% disrupted
15%
3%
9%
22%
20%
11%
14%
10%
14%
1%
19%
5%
25%
17%
25%
44%
22%
44%
54%
46%
0% 20% 40% 60% 80% 100% 120%
Global (n=109)
High income (n=27)
Upper middle income (n=32)
Lower middle income (n=29)
Low income (n=21)
Percent of countries
Average percentage of countries reporting disruptions to neglected tropical disease services by
income group
5-25% disrupted 26-50% disrupted More than 50% disrupted
22%
15%
28%
24%
23%
9%
5%
11%
11%
8%
7%
6%
9%
8%
5%
38%
26%
48%
42%
36%
0% 50% 100%
Global (n=135)
High income (n=35)
Upper middle income(n=37)
Lower middle income(n=37)
Low income (n=26)
Percent of countries
Percentage of countries reporting disruptions across
tracer service areas by income group
5-25% disrupted 26-50% disrupted
More than 50% disrupted
23%
18%
36%
18%
17%
13%
6%
12%
22%
13%
10%
7%
11%
10%
10%
45%
31%
59%
50%
39%
0% 10% 20% 30% 40% 50% 60%
Global (n=121)
High income (n=29)
Upper middle income (n=34)
Lower middle income (n=34)
Low income (n=24)
Percent of countries
Average percentage of countries reporting disruptions to mental, neurological, and substance
use disorder services by income group
5-25% disrupted 26-50% disrupted More than 50% disrupted
21%
29%
27%
20%
22%
7%
5%
9%
6%
5%
8%
6%
7%
12%
4%
36%
40%
44%
37%
31%
0% 10% 20% 30% 40% 50% 60%
Global (n=129)
High income (n=35)
Upper middle income (n=36)
Lower middle income (n=35)
Low income (n=23)
Percent of countries
Average percentage of countries reporting disruptions to communicable disease services by
income group
5-25% disrupted 26-50% disrupted More than 50% disrupted

Disruptions to mental, neurological and substance use disorders (MNS) span the full continuum of care
From prevention and promotion: school mental health programmes and
suicide prevention programmes
To diagnostics and treatments neuroimaging
and neurophysiology, psychotherapy, counselling
and psychosocial interventions, and
prescriptions
For life-saving emergency care: management of emergency MNS
manifestations, critical harm reduction services, overdose prevention and
management programmes
For the most vulnerable populations: older adults, children, and adolescents
with mental health conditions or disabilities

Denominator: excludes “Not applicable” or “Do not know” responses.
Disruptions to mental, neurological and substance use disorders (MNS) span the full continuum of care
School mental health programmes (66%) and psychotherapy, counselling and psychosocial
intervention (54%) are among the most predominantly disrupted services across all service areas
23%
23%
16%
21%
20%
31%
22%
26%
15%
29%
7%
11%
13%
16%
15%
14%
15%
13%
11%
17%
5%
5%
2%
7%
4%
9%
8%
9%
40%
7%
34%
39%
32%
44%
39%
53%
45%
48%
66%
54%
0% 10% 20% 30% 40% 50% 60% 70% 80% 90% 100%
Overdose prevention and management programmes (n=44)
Critical harm reduction services (n=44)
Prescriptions for MNS disorder medicines (n=91)
Suicide prevention programmes (n=57)
Management of emergency MNS manifestations (n=94)
Neuroimaging and neurophysiology (n=58)
Services for children/adolescents with mental health conditions or disabilities (n=86)
Services for older adults with mental health conditions or disabilities (n=85)
School mental health programmes (n=53)
Psychotherapy interventions for MNS disorders (n=95)
Percentage of countries
Ess
enti
al h
ealt
h s
ervi
ce
Percentage of countries reporting disruptions in services for mental, neurological and substance use disorders
5% to 25% disrupted 26% to 50% disrupted More than 50% disrupted

Nearly half of countries reported disruptions to one of more services for noncommunicable diseases
Cancer screening
and treatment services are
among the most disrupted
services
t
1/3 of more countries
also reporting disruptions to
hypertension management,
diabetes management, and
asthma services
Time-sensitive services for urgent dental care and
cardiovascular emergencies are also affected
1/3

Nearly half of countries reported disruptions to one of more services for noncommunicable diseases
Denominator: excludes “Not applicable” or “Do not know” responses.
11%
15%
18%
21%
24%
27%
20%
19%
7%
8%
6%
7%
11%
9%
10%
8%
2%
7%
9%
14%
7%
8%
19%
9%
20%
30%
32%
42%
42%
45%
49%
37%
0% 10% 20% 30% 40% 50% 60% 70% 80% 90% 100%
Cardiovascular emergencies (n=91)
Asthma services (n=87)
Cancer Treatment (n=90)
Urgent dental care (n=85)
Diabetes and Diabetic Complications Management (n=97)
Hypertension Management (n=95)
Cancer screening (n=86)
AVERAGE DISRUPTION IN SERVICE GROUP
Percentage of countries
Ess
enti
al h
ealt
h s
ervi
ce
Percentage of countries reporting disruptions in noncommunicable disease services
5% to 25% disrupted 26% to 50% disrupted More than 50% disrupted

Disruptions in immunization services
Denominator: excludes “Not applicable” or “Do not know” responses.
24%
21%
23%
7%
10%
8%
3%
8%
5%
34%
39%
37%
0% 10% 20% 30% 40% 50% 60% 70% 80% 90% 100%
Routine facility-based immunization services (n=103)
Routine outreach immunization services (n=89)
AVERAGE DISRUPTION IN SERVICE GROUP
Percentage of countries
Ess
enti
al h
ealt
h s
ervi
ce
Percentage of countries reporting disruptions inimmunization services
5% to 25% disrupted 26% to 50% disrupted More than 50% disrupted
t
More than one third of countries reported disruptions to both routine facility-based
and outreach immunization services
1/3

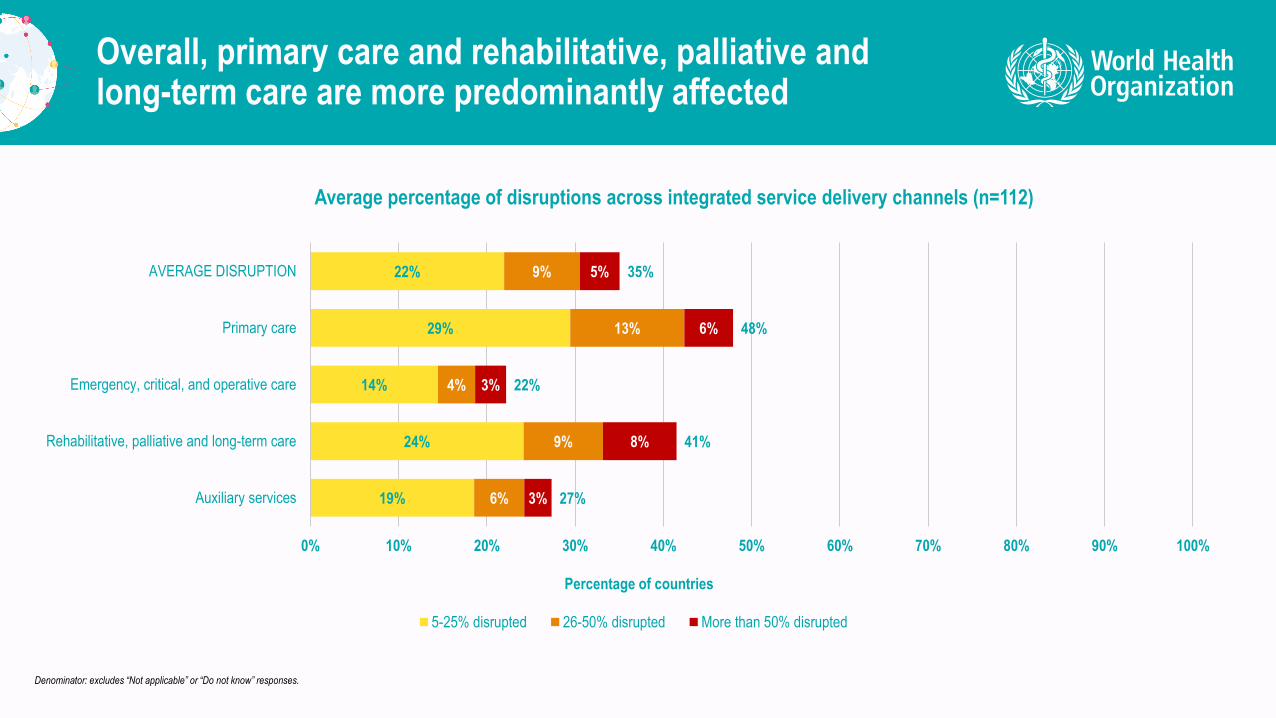
Disruptions in services for reproductive, maternal, newborn, child and adolescent health and nutrition
Over 40% of countries report
disruptions to family planning
and contraception and
malnutrition services
t
Over a third report disruptions to
antenatal care and postnatal care,
critical health services to ensure that
pregnant women and newborns
survive and remain healthy
Although a third of countries report reductions in sick child visits, further information is needed
to understand if this reflects actual disruptions or if children are less likely
to become ill due to measures put in place to prevent the spread of COVID-19
?>1/3>40%
Denominator: excludes “Not applicable” or “Do not know” responses.
Disruptions in services for reproductive, maternal, newborn, child and adolescent health and nutrition
18%
17%
24%
23%
32%
26%
24%
25%
24%
6%
9%
7%
7%
5%
10%
13%
14%
9%
1%
1%
2%
4%
2%
3%
4%
5%
3%
25%
28%
33%
34%
39%
39%
41%
44%
35%
0% 10% 20% 30% 40% 50% 60% 70% 80% 90% 100%
Facility-based births (n = 104)
Safe abortion and post-abortion care (n=75)
Postnatal care for women and newborns (n=101)
Sick child services (n=101)
Antenatal care (n=110)
Intimate partner and sexual violence prevention and response (n=61)
Management of moderate and severe malnutrition (n=92)
Family planning and contraception (n=104)
AVERAGE DISRUPTION IN SERVICE GROUP
Percentage of countries
Ess
enti
al h
ealt
h s
ervi
ce
Percentage of countries reporting disruptions in reproductive, maternal, newborn, child and adolescent health and nutrition services
5% to 25% disrupted 26% to 50% disrupted More than 50% disrupted

Disruptions in services for communicable disease services
Over half of countries report disruptions to
TB diagnosis and treatment.
HIV testing and prevention services also
disrupted in nearly half of countries
40%
Nearly 40% of countries are reporting
disruptions to one or more malaria services
(including diagnosis and treatment services
and prevention campaigns)
1/2

Disruptions in services for communicable disease services
Denominator: excludes “Not applicable” or “Do not know” responses.
13%
18%
13%
10%
19%
27%
22%
25%
29%
30%
29%
21%
1%
2%
10%
10%
7%
2%
4%
4%
9%
12%
16%
7%
3%
4%
2%
10%
7%
10%
12%
13%
9%
7%
6%
8%
17%
25%
25%
30%
33%
39%
39%
43%
46%
49%
51%
36%
0% 10% 20% 30% 40% 50% 60% 70% 80% 90% 100%
Continuation of established ARV treatment (n=98)
Initiation of new ARV treatment (n=93)
Outbreak detection and control (for non-COVID diseases) (n=91)
Seasonal malaria chemoprevention (n=10)
Indoor residual spraying (n=43)
Malaria diagnosis and treatment (n=59)
Insecticide-treated-mosquito nets (n=49)
Hepatitis B and C diagnosis and treatment (n=75)
HIV prevention services (n=93)
HIV testing services (n=99)
TB diagnosis and treatment (n=98)
AVERAGE DISRUPTION IN SERVICE GROUP
Percentage of countries
Ess
enti
al h
ealt
h s
ervi
ce
Percentage of countries reporting disruptions in communicable disease services
5% to 25% disrupted 26% to 50% disrupted More than 50% disrupted

Disruptions in services for neglected tropical diseases (NTDs)
Denominator: excludes “Not applicable” or “Do not know” responses.
tThe most predominant disruptions
were to large scale preventive chemotherapy campaigns, community
awareness/health education campaigns, and support for self-care,
rehabilitation and psychosocial services for patients with chronic NTDs
14%
13%
15%
19%
16%
13%
15%
6%
8%
15%
13%
13%
10%
11%
8%
10%
12%
21%
23%
37%
19%
28%
30%
42%
52%
52%
60%
44%
0% 20% 40% 60% 80% 100%
Prescriptions for NTD medicines (n=64)
Surgical procedures for NTDs (n=40)
Diagnosis, treatment and care for NTDs (n=74)
Support for self-care, rehabilitation and psychosocial services forpatients with chronic NTDs (n=48)
Community awareness and health education campaigns for NTDs(n=69)
Large scale preventive chemotherapy campaigns for NTDs (n=62)
AVERAGE DISRUPTION IN SERVICE GROUP
Percentage of countries
Ess
enti
al h
ealt
h s
ervi
ce
Percentage of countries reporting disruptions in neglected tropical disease services
5% to 25% disrupted 26% to 50% disrupted More than 50% disrupted

Service disruptions are perceived to be caused by a mix of supply and demand side factors
Health workforce-related issues are among the most commonly reported supply-side reasons linked to staff deployment to COVID-19 relief and insufficient staff availability. Cancellation of elective care and changes to treatment policies are also reported as reasons for disruptions.
Most common demand-side reasons included: community fear/mistrust, decreases in OPD volume due to patients not presenting, travel restrictions and financial difficulties during the pandemic.
In some countries, measures for COVID-19 control may be contributing to increased barriers to accessing care (e.g. fear of getting infected, limited personal protective equipment or access, limitations in movement, loss of income, increased financial burden).
Supply chain systems are also disrupted in nearly 1/3 of countries.
1/3

Denominator: excludes “Not applicable” or “Do not know” responses.
Service disruptions are perceived to be caused by a mix of supply and demand side factors
12%
14%
16%
19%
22%
26%
35%
47%
66%
36%
43%
57%
57%
0% 10% 20% 30% 40% 50% 60% 70%
Closure of outpatient services as per government directive (n=112)
Closure of population level screening programmes (n=111)
Closure of outpatient clinics (n=112)
Inpatient services/hospital beds not available (n=111)
Unavailability/Stock out of essential medicines (n=111)
Insufficient Personal Protective Equipment (PPE) available (n=111)
Changes in treatment policies for care seeking behaviour (n=111)
Travel restrictions hindering access to the health facilities (n=112)
Financial difficulties during outbreak/lock down (n=112)
Decrease in inpatient volume due to cancellation of elective care (n=112)
Decrease in outpatient volume due to patients not presenting (n=111)
Community fear/mistrust in seeking health care (n=112)
Insufficient staff availability (due to deployment to provide COVID-19 relief or other) (n=112)
Percent of countries
Reasons for service disruptions (n=112)
Demand side factor Supply side factor

To some extent, disruptions may be attributed to intentional scaling back or modifications to service delivery in the context of COVID-19
One-third or more countries have limited or suspended community-based, mobile care, outpatient, inpatient and delivery platforms
15%>1/3Emergency and pre-emergency platforms
also limited in 15% of countries

To some extent, disruptions may be attributed to intentional scaling back or modifications to service delivery in the context of COVID-19
Denominator: excludes “Not applicable” or “Do not know” responses.
38% 41% 38% 35%
15% 16%
7% 4%
0%1%
1% 0%
45% 45%
38%36%
16% 16%
0%
10%
20%
30%
40%
50%
60%
70%
Mobile clinics (n=86) Community based care(n=103)
Outpatient services (n=108) Inpatient services (n=107) Prehospital emergency careservices (n=105)
Emergency unit services(n=106)
Per
cen
tag
e o
f co
un
trie
s
Service delivery platform
Government policies in relation to service delivery platforms (n=112)
Limited access Suspended

In high income countries, disruptions are more frequently the result of strategic suspensions or modifications as compared to countries in other income groups
51%62%
55%47% 43%
43% 26% 41%46% 52%
6%12%
4% 7% 4%
0%
10%
20%
30%
40%
50%
60%
70%
80%
90%
100%
Global (n=132) High income (n=32) Upper middle income (n=38) Lower middle income (n=36) Low income (n=26)
Per
cen
tag
e o
f d
isru
pte
d s
ervi
ces
Percent of disruptions to tracer services due to intentional modifications by income group
Disruptions due to intentional service modifications Disruptions due to other causes Unknown cause
Services included for: emergency and critical care, rehabilitative and palliative care, reproductive, maternal, newborn, child and adolescent health and nutrition, immunization, communicable diseases, noncommunicable diseases, neglected tropical diseases, and mental,
neurological and substance use disorders

Nearly half of countries have scaled back at least one essential public health function or activity, including population-based services
of countries have scaled back population-based disease
prevention, health promotion and health protection activities
t
of countries have scaled back research activities
of countries have scaled back communications and social
mobilization activities
>40% 43% 27%

Denominator: excludes “Not applicable” or “Do not know” responses.
Nearly half of countries have scaled back at least one essential public health function or activity, including population-based services
45%39% 41% 38%
25%
14% 12%
2%
4% 2%2%
2%
0%0%
47%43% 43%
40%
27%
14%12%
0%
10%
20%
30%
40%
50%
60%
70%
Disease preventionpopulation-based activities
(n=109)
Health promotion-basedactivities (n=109)
Public health research(n=96)
Health protection (n=100) Communications and socialmobilization activities for
health (n=105)
Surveillance and response(n=105)
Emergency preparednessand response (n=106)
Per
cen
tag
e o
f co
un
trie
s
Essential public health function
Government policies in relation to essential public health functions and activities
Limited Suspended

Notwithstanding the sustained
global disruptions, the
magnitude and extent of
disruptions within countries
has decreased

Note: represents global findings from all countries that responded to either round 1 or 2 of survey. Round 1 data sourced from 2020 WHO surveys on disruptions to Essential health services, Noncommunicable diseases, and Mental, neurological and substance use disorder during the COVID-19 pandemic.
Denominator: excludes “Not applicable” or “Do not know” responses. 35 tracer services included in both survey rounds include services for: emergency and critical care, rehabilitative and palliative care, reproductive, maternal, newborn, child and adolescent health and nutrition, immunization, communicable
diseases, noncommunicable diseases, neglected tropical diseases, and mental, neurological and substance use disorders.
Decrease in reported disruptions in countries participating in either survey round: just over a third of services are currently affected, compared to half in 2020Moreover, fewer countries are reporting complete disruptions to 75-100% of services
95% of countries reported some level of disruption to services
• 24% of countries reported disruptions in 75–100% of services
• 27% of countries reported disruptions in 50–74% of services
• 28% of countries reported disruptions in 25–49% of services
• 16% of countries reported disruptions in less than 25% of services
5% of countries reported no service disruptions
89% of countries reported some level of disruption to services
• 8% of countries reported disruptions in 75–100% of services
• 21% of countries reported disruptions in 50–74% of services
• 32% of countries reported disruptions in 25–49% of services
• 27% of countries reported disruptions in less than 25% of services
11% of countries reported no service disruptions
0%
20%
40%
60%
80%
100%
ITA GNB TLS PER IDN UGA PHL TCD SWZ MEX BOL SDN MRT LBN BRA BLZ ARG PNG IRQ AGO SLB UKR DOM SLV HND ALB SSD COM CMR MOZ MDG BHS CIV LCA HTI SEN PAN ZMB CHL BWA PYF GT M STP LAO WLS LSO ECU PRY MWI JOR GMB THA KEN GIN ZAF BGR TGO YEM MAR SYC GAB NER MYS CZE SCT JAM FRA PSE GHA ERI IRN LKA SYR GRD GBR TUN COG VCT AUT PAK GEO VUT NAM SUR OMN FIN AFG CRI VGB SOM MDA AUS LBR EGY CPV ETH QAT FJI HRV NPL COD URY BMU SAU BGD BRN KAZ HUN BEN KWT DMA CYM ARM LVA CAF ARE BTN NIC BDI MDV PRT KOR DJI BFA CHN MUS EST PRK RWA DNK BHR TKM CUB
Per
cen
tag
e o
f se
rvic
es d
isru
pte
d
Country/territory
Round 2 (Q1 2021) Percentage of 35 tracer services disrupted per country (n=135)
Global: 36%
0%
20%
40%
60%
80%
100%
IND LBY USA GNB UGA COM MDG LSO GMB TUN GEO GIN NPL DJI CMR ZWE GNQ SEN PAK SWZ STP MLI HTI BLZ SLE PHL TCD TGO KAZ POL BGD SDN JAM ETH YEM PER IRL MNE NAM MKD NGA GUY PLW FRA MMR CIV CHN BRB KGZ UKR THA COG BFA HND IRQ IDN EGY KEN MDA MAR HUN NLD ITA GAB OMN MUS ROU NER HRV BRA ARE JOR MCO LTU BGR DMA EST BEN VEN ZAF MEX ECU GRD BOL SVK LBR NZL LBN DOM SSD AGO PNG ALB CZE TUR GRC GT M JPN QAT SUR MRT LKA TLS MOZ SLB SWE CHL KWT NOR MLT CPV FIN FJI ARM SGP UZB MWI RUS SVN BLR PSE BIH LAO IRN AUT WSM MHL SOM PRK ZMB VUT KHM TZA CYP DZA BHS COK LCA BRN LVA MNG SYC GHA NRU AUS PAN ESP TON KIR COL SAU NIU VNM TTO VCT RWA ARG ISL MYS KNA PRY URY ATG DEU DNK FSM BEL CRI AND SYR BWA SMR ERI MDV ISR TUV AZE CHE COD BTN NIC BHR TKM CUBPer
cen
tag
e o
f se
rvic
es d
isru
pte
d
Country/territory
Round 1 (Q2-Q3 2020) Percentage of 35 tracer services disrupted per country (n=187)
Global: 50%

Note: represents findings from all countries that responded to both rounds 1 and 2 of survey. Round 1 data sourced from 2020 WHO surveys on disruptions to Essential health services, Noncommunicable diseases, and Mental, neurological and substance use disorder during the COVID-19 pandemic.
Denominator: excludes “Not applicable” or “Do not know” responses. 35 tracer services included in both survey rounds include services for: emergency and critical care, rehabilitative and palliative care, reproductive, maternal, newborn, child and adolescent health and nutrition, immunization, communicable
diseases, noncommunicable diseases, neglected tropical diseases, and mental, neurological and substance use disorders.
Comparing service disruptions in countries that participated in both survey rounds, a drop in disrupted services is still seen from 54% in 2020 to 37% in 2021Quantity of disruptions reported in countries has also decreased.
96% of countries reported some level of disruption to services
• 25% of countries reported disruptions in 75–100% of services
• 33% of countries reported disruptions in 50–74% of services
• 27% of countries reported disruptions in 25–49% of services
• 11% of countries reported disruptions in less than 25% of services
4% of countries reported no service disruptions
89% of countries reported some level of disruption to services
• 9% of countries reported disruptions in 75–100% of services
• 22% of countries reported disruptions in 50–74% of services
• 32% of countries reported disruptions in 25–49% of services
• 25% of countries reported disruptions in less than 25% of services
11% of countries reported no service disruptions
0%
20%
40%
60%
80%
100%
KOR GNB UGA COM MDG LSO GMB TUN GEO GIN NPL DJI CMR SEN PAK SWZ STP HTI BLZ PHL TCD TGO KAZ BGD SDN JAM ETH YEM PER NAM FRA CIV CHN UKR THA COG BFA HND IRQ IDN EGY KEN MDA MAR HUN ITA GAB OMN MUS NER HRV BRA ARE JOR BGR DMA EST BEN ZAF MEX ECU GRD BOL LBR LBN DOM SSD AGO PNG ALB CZE GT M JPN QAT SUR MRT LKA TLS MOZ SLB SWE CHL KWT CPV FIN FJI ARM MWI BDI PSE LAO IRN AUT SOM PRK ZMB VUT BHS LCA BRN LVA SYC GHA AUS PAN SAU VCT RWA ARG MYS PRY URY DNK CRI SYR BWA ERI MDV COD BTN NIC BHR CUB TKM
Per
cen
tag
e o
f se
rvic
es d
isru
pte
d
Country/territory
Round 1 (Q2-Q3 2020)Percentage of 35 tracer services disrupted per country (n=125)
Global: 54%
0%
20%
40%
60%
80%
100%
ITA GNB TLS PER IDN UGA PHL TCD SWZ MEX BOL SDN MRT LBN BRA BLZ ARG PNG IRQ AGO SLB UKR DOM HND ALB SSD COM CMR MOZ MDG BHS CIV LCA HTI SEN PAN ZMB CHL BWA GT M STP LAO LSO ECU PRY MWI JOR GMB THA KEN GIN ZAF BGR TGO YEM MAR SYC GAB NER MYS CZE JAM FRA PSE GHA ERI IRN LKA SYR GRD TUN COG VCT AUT PAK GEO VUT NAM SUR OMN FIN CRI SOM MDA AUS LBR EGY CPV ETH QAT FJI HRV NPL COD URY SAU BGD BRN KAZ HUN BEN KWT DMA ARM LVA ARE BTN NIC KOR BDI MDV DJI BFA CHN MUS EST PRK RWA DNK BHR CUB TKMPer
cen
tag
e o
f se
rvic
es d
isru
pte
d
Country/territory
Round 2 (Q1 2021)Percentage of 35 tracer services at least partially disrupted
per country (n=125)
Global: 37%

Note: represents global findings from all countries that responded to either round 1 or 2 of survey. Round 1 data sourced from 2020 WHO surveys on disruptions to Essential health services, Noncommunicable diseases, and Mental, neurological and substance use disorder during the COVID-19 pandemic.
Denominator: excludes “Not applicable” or “Do not know” responses.
Emergency and critical care services include: 24-hour emergency room/unit services; urgent blood transfusion services; inpatient critical care services; and emergency surgery.
Reproductive, maternal, newborn, child and adolescent health and nutrition services include: family planning and contraception; antenatal care; facility-based births; sick child services; and management of malnutrition.
Immunization services include: facility-based routine immunization; and outreach routine immunization.
Communicable disease services include: Outbreak detection and control (non-COVID); continuation of established antiretroviral treatment; malaria diagnosis and treatment; ITN malaria prevention campaigns; IRS malaria prevention campaigns; and SMC malaria prevention campaigns.
Noncommunicable disease services include: cancer diagnosis and treatment; hypertension management; diabetes management; and asthma services.
mental, neurological, and substance use disorders (MNS) services include: MNS emergency services; counselling for MNS disorders; medicines for MNS disorders; services for children and adolescents; services for older adults; school mental health programmes; suicide prevention programmes; overdose
prevention programmes; and critical harm reduction services.
Rehabilitative and palliative care services include: rehabilitation services; palliative services.
Average percentage of countries reporting disruptions dropped across all tracer service areasCountries participating in either survey round
*view report to see changes in disruptions to individual tracer services.
17% 14%
47%
33%
50%
31%
46%
26%
45%
27%39% 35%
54%
36%3%1%
3%
3%
12%
5%
9%
7%
3%
8%
20%
10%
12%
8%
20%15%
51%
37%
62%
37%
55%
33%
48%
35%
59%
45%
65%
45%
0%
10%
20%
30%
40%
50%
60%
70%
Round 1(n=129)
Round 2(n=112)
Round 1(n=129)
Round 2(n=121)
Round 1(n=129)
Round 2(n=112)
Round 1(n=129)
Round 2(n=124)
Round 1(n=164)
Round 2(n=121)
Round 1(n=130)
Round 2(n=121)
Round 1(n=164)
Round 2(n=121)
Emergency, criticaland operative care
RMNCAH andnutrition
Immunization Communicablediseases
Noncommunicablediseases
Mental,neurological andsubstance use
disorders
Rehabilitative andpalliative care
Pe
rce
nta
ge
of
co
un
trie
s
Round 1 vs. Round 2 comparison: Service disruptions by tracer service area
5-50% disrupted More than 50% disrupted

Note: represents findings from all countries that responded to both rounds 1 and 2 of survey. Round 1 data sourced from 2020 WHO surveys on disruptions to Essential health services, Noncommunicable diseases, and Mental, neurological and substance use disorder during the COVID-19 pandemic.
Denominator: excludes “Not applicable” or “Do not know” responses.
Emergency and critical care services include: 24-hour emergency room/unit services; urgent blood transfusion services; inpatient critical care services; and emergency surgery.
Reproductive, maternal, newborn, child and adolescent health and nutrition services include: family planning and contraception; antenatal care; facility-based births; sick child services; and management of malnutrition.
Immunization services include: facility-based routine immunization; and outreach routine immunization.
Communicable disease services include: Outbreak detection and control (non-COVID); continuation of established antiretroviral treatment; malaria diagnosis and treatment; ITN malaria prevention campaigns; IRS malaria prevention campaigns; and SMC malaria prevention campaigns.
Noncommunicable disease services include: cancer diagnosis and treatment; hypertension management; diabetes management; and asthma services.
mental, neurological, and substance use disorders (MNS) services include: MNS emergency services; counselling for MNS disorders; medicines for MNS disorders; services for children and adolescents; services for older adults; school mental health programmes; suicide prevention programmes; overdose
prevention programmes; and critical harm reduction services.
Rehabilitative and palliative care services include: rehabilitation services; palliative services.
Average percentage of countries reporting disruptions dropped across all tracer service areasCountries participating in both survey rounds
*view report to see changes in disruptions to individual tracer services.
19%11%
49%36%
46%
30%43%
30%
48%
29%38% 36%
50%37%4%
1%
3%
2%
11%
5%
9%
7%
3%
7%
23%
8%
15%
7%
23%
13%
53%
38%
57%
35%
52%
38%
51%
36%
61%
44%
66%
44%
0%
10%
20%
30%
40%
50%
60%
70%
Round 1(n=75)
Round 2(n=75)
Round 1(n=79)
Round 2(n=79)
Round 1(n=75)
Round 2(n=75)
Round 1(n=75)
Round 2(n=75)
Round 1(n=101)
Round 2(n=101)
Round 1(n=82)
Round 2(n=82)
Round 1(n=101)
Round 2(n=101)
Emergency, criticaland operative care
RMNCAH andnutrition
Immunization Communicablediseases
Noncommunicablediseases
Mental,neurological andsubstance use
disorders
Rehabilitative andpalliative care
Pe
rce
nta
ge
of
co
un
trie
s
Round 1 vs. Round 2 comparison: Service disruptions by tracer service area
5-50% disrupted More than 50% disrupted

t
Disruptions due to insufficient PPE and other health products availability have decreased since 2020
Note: represents findings from all countries that responded to either round 1 or 2 of survey.
Denominator: excludes “Not applicable” or “Do not know” responses.
78%
69%
61%
53%
43%
40%
36%
36%
34%
31%
30%
14%
57%
47%
66%
36%
26%
14%
35%
16%
43%
12%
22%
19%
0% 20% 40% 60% 80% 100%
Decrease in outpatient volume due to patients not presenting
Decrease in inpatient volume due to cancellation of elective care
Insufficient staff availability (due to staff deployment to provide COVID-19 relief or other)
Government or public transport lockdowns hindering access
Insufficient PPE available for health care providers
Closure of population level screening programs
Changes in treatment policies
Closure of outpatient disease specific consultation clinics
Financial difficulties during outbreak/lock down
Closure of outpatient services as per government directive
Unavailability/Stock out of health products at health facilities
Inpatient services/hospital beds not available
Percentage of countries
Round 1 vs. Round 2 comparison: Reasons for service disruptions
Round 1 (n=129) Round 2 (n=112)
Insufficient PPE availability has decreased from 43% to 26% of countries compared to Q3 2020
Unavailability and stock outs of health products have decreased from 30% to 22% of countries compared to Q3 2020
Countries participating in either survey round

t
Disruptions due to insufficient PPE and other health products availability have decreased since 2020
Note: represents findings from all countries that responded to either round 1 or 2 of survey.
Denominator: excludes “Not applicable” or “Do not know” responses.
Insufficient PPE availability has decreased from 52% to 28% of countries compared to Q3 2020
Unavailability and stock outs of health products have decreased from 36% to 19% of countries compared to Q3 2020
Countries participating in both survey rounds
73%
68%
62%
52%
38%
33%
39%
45%
24%
36%
21%
57%
48%
61%
36%
28%
11%
33%
17%
40%
12%
19%
16%
0% 20% 40% 60% 80%
Decrease in outpatient volume due to patients not presenting
Decrease in inpatient volume due to cancellation of elective care
Insufficient staff availability (due to staff deployment to provide COVID-19 relief or other)
Government or public transport lockdowns hindering access
Insufficient PPE available for health care providers
Closure of population level screening programs
Changes in treatment policies
Closure of outpatient disease specific consultation clinics
Financial difficulties during outbreak/lock down
Closure of outpatient services as per government directive
Unavailability/Stock out of health products at health facilities
Inpatient services/hospital beds not available
Percentage of countries
Round 1 vs. Round 2 comparison: Reasons for service disruptions
Round 1 (n=75) Round 2 (n=75)

Gains and partial rebound in
service provision likely due to
implementation of
recommended policies and
strategies for maintaining
essential health services.
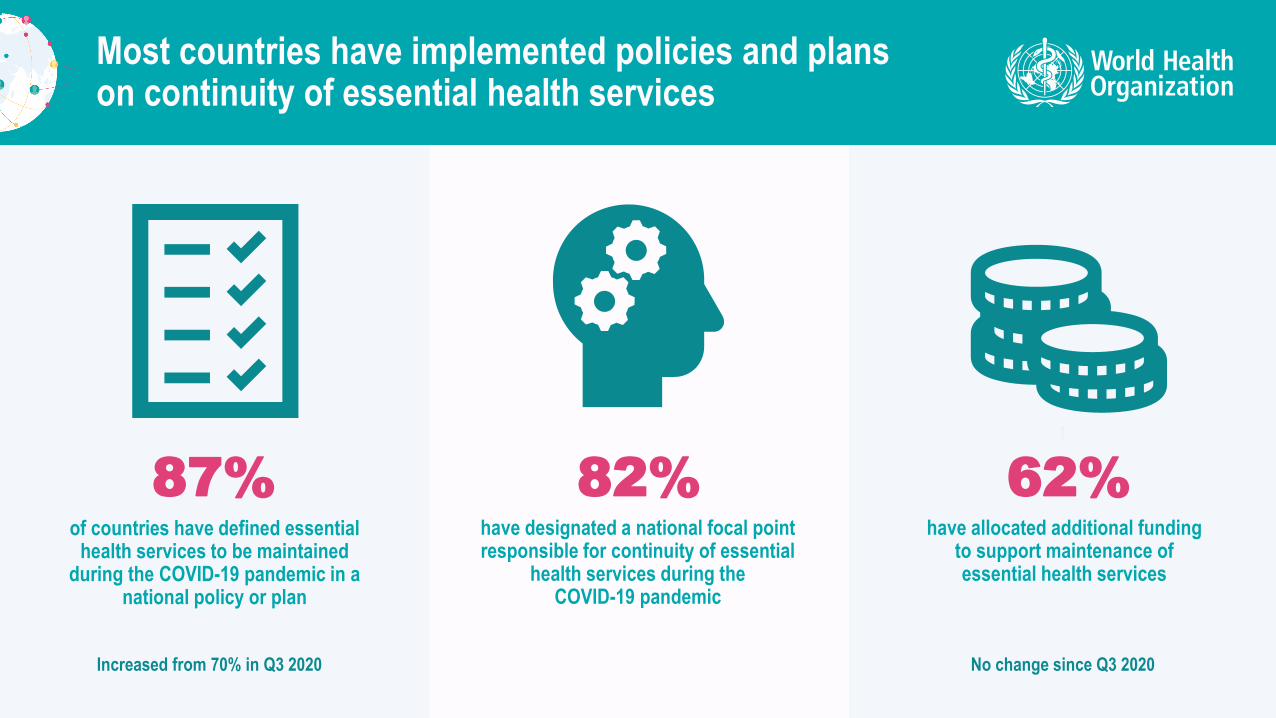
Most countries have implemented policies and plans on continuity of essential health services
of countries have defined essential health services to be maintained
during the COVID-19 pandemic in a national policy or plan
t
have designated a national focal point responsible for continuity of essential
health services during the COVID-19 pandemic
have allocated additional funding to support maintenance of essential health services
87% 82% 62%
Increased from 70% in Q3 2020 No change since Q3 2020
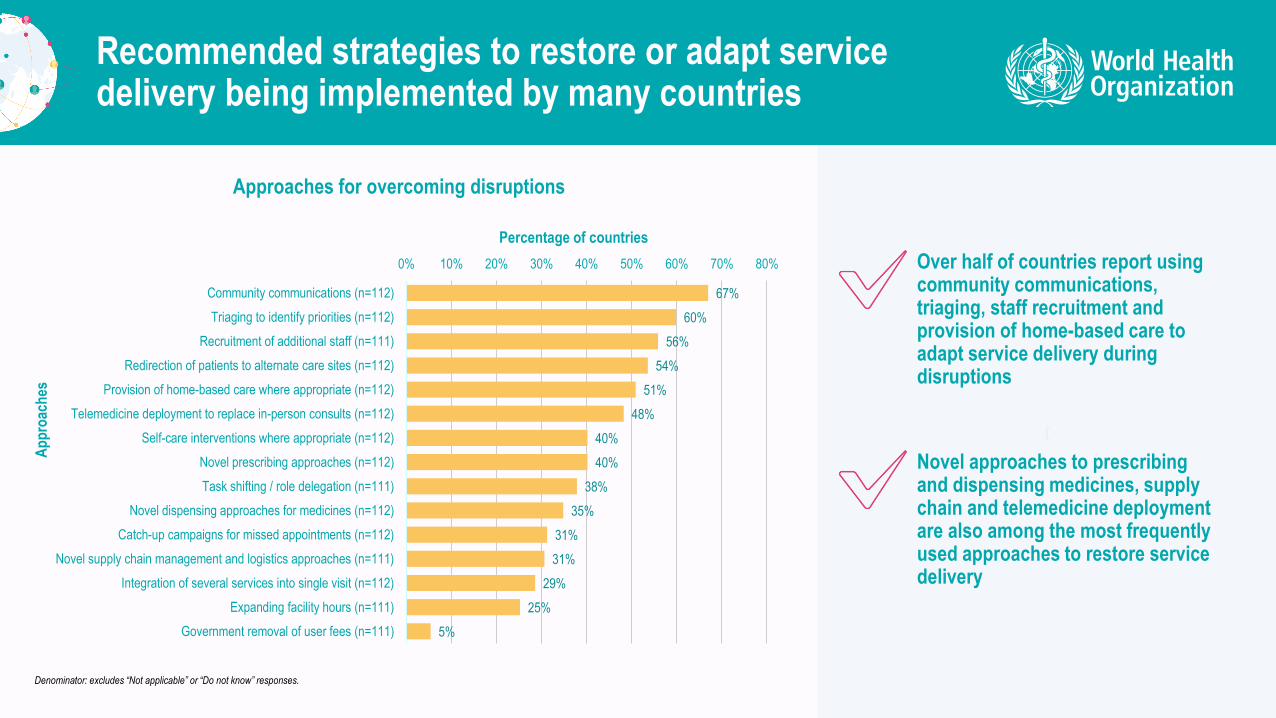
Recommended strategies to restore or adapt service delivery being implemented by many countries
Denominator: excludes “Not applicable” or “Do not know” responses.
t
Over half of countries report using community communications, triaging, staff recruitment and provision of home-based care to adapt service delivery during disruptions
Novel approaches to prescribing and dispensing medicines, supply chain and telemedicine deployment are also among the most frequently used approaches to restore service delivery
67%
60%
56%
54%
51%
48%
40%
40%
38%
35%
31%
31%
29%
25%
5%
0% 10% 20% 30% 40% 50% 60% 70% 80%
Community communications (n=112)
Triaging to identify priorities (n=112)
Recruitment of additional staff (n=111)
Redirection of patients to alternate care sites (n=112)
Provision of home-based care where appropriate (n=112)
Telemedicine deployment to replace in-person consults (n=112)
Self-care interventions where appropriate (n=112)
Novel prescribing approaches (n=112)
Task shifting / role delegation (n=111)
Novel dispensing approaches for medicines (n=112)
Catch-up campaigns for missed appointments (n=112)
Novel supply chain management and logistics approaches (n=111)
Integration of several services into single visit (n=112)
Expanding facility hours (n=111)
Government removal of user fees (n=111)
Percentage of countries
Ap
pro
ach
es
Approaches for overcoming disruptions

Many countries are using telehealth technologies to mitigate disruptionsHigh income countries more frequently report use of telehealth technologies to support service delivery
Denominator: excludes “Not applicable” or “Do not know” responses.
17%
22%
28%
28%
30%
32%
37%
40%
43%
49%
49%
0% 20% 40% 60%
Eye care consultations (n=111)
Family planning counselling (n=112)
Imaging diagnostics (n=111)
Prenatal care consultations (n=112)
Emergency care consultations (n=112)
Child health consultations (n=112)
Mental health consultations (n=112)
Chronic care consultations (n=111)
Pharmacy and medication refills (n=112)
Primary care consultations (n=112)
Scheduling appointments (n=112)
Percent of countries
Percentage of countries reporting use of telehealth technologies to support service delivery
64%
96%
66% 65%
29%
0%
10%
20%
30%
40%
50%
60%
70%
80%
90%
100%
% of countries reporting use of any telehealth
Per
cen
tag
e o
f co
un
trie
s
Percentage of countries reporting use of telehealth technologies to support service delivery
Global (n=112) High income (n=25) Upper middle income (n=32)
Lower middle income (n=31) Low income (n=24)

Limited access and technical capacities to use telehealth technologies are the most commonly reported barriers to use in countries
Denominator: excludes “Not applicable” or “Do not know” responses.
19%
21%
43%
54%
58%
68%
0% 10% 20% 30% 40% 50% 60% 70% 80%
Legal or regulatory barriers (n=111)
Security and privacy concerns (n=111)
Lack of funding to set up and implement programmes (n=111)
Limited awareness/knowledge of patients and/or providers regarding telehealthtechnologies (n=112)
Limited organizational or technical capacities to transition to use (n=112)
Limited access to telehealth technologies for patients and/or providers (n=111)
Percentage of countries
Percentage of countries reporting barriers to use of telehealth technologies

t
Two-thirds of countries are implementing approaches to ensure access to care for vulnerable groups
Denominator: excludes “Not applicable” or “Do not know” responses.
Many countries are implementing approaches to target specific
vulnerable groups
High- and middle-income countries are implementing these approaches
slightly more frequently
64% 64%
78%
58%54%
60%
76%69%
45%50%
58%
48%
56%
65% 63%
0%
10%
20%
30%
40%
50%
60%
70%
80%
90%
100%
Global (n=112) High income (n=25) Upper middle income(n=32)
Lower middle income(n=31)
Low income (n=24)
Countries using approaches to ensure access to care for vulnerable groups
Identifying vulnerable groups of primary concern
Proactive governmental strategies to reach out to vulnerable groups
Use of existing networks or organizations to reach out to vulnerable groups

Most countries are actively tracking and monitoring information to support continuity of essential health services
are regularly monitoring continuity of essential health services
t
85% 86%are collecting data on comorbidities
in COVID-19 patients
65%have designated a team to track and address the infodemic and
health misinformation
56%
9%4%
18%
8%5%
(n=112)
Yes, within Ministry of Health or equivalent
Yes, within government but in another ministry
Not yet, but planning on setting up a unit
No unit, but we have staff completing these tasks
No
Don't know
75%
10%
12%
3%
(n=112)
Regularly monitoring continuation of EHS including mitigationstrategies
Monitoring continuation of EHS but not mitigation strategies
No monitoring
Don't know
86%
9%
5%
(n=110)
Yes No Don’t know

Denominator: excludes “Not applicable” or “Do not know” responses.
The most commonly reported country priority needs and technical assistance requirements relate to maintaining essential health services during the COVID-19 pandemic
4027
2619
1312
9888
75555
444
31111
0 5 10 15 20 25 30 35 40 45
Maintaining EHS during COVID-19
Monitoring and evaluation capacities
Health workforce strengthening
Essential health products and equipment
Telehealth technologies
Policy guidance
Service organization and models of care
COVID-19 vaccination capacities
Essential PPE supplies
Information management
COVID-19 case management capacities
Health systems strengthening and resilience
Peer learning
Risk communications and community engagement
Surveillance, case detection and containment
COVID-19 diagnostic capacities
Implementation research and learning
Screening, triage and isolation
Infection prevention and Control
Health worker safety
Immunization activities
Infrastructure
Quality improvement and safety
Number of requests made
Country priorities and technical needs (216 requests from 78 countries)

Implications for action
Despite the limitations of a key informant survey, it is reasonable to expect that even moderate interruptions to health service delivery and utilization can lead to worsened health outcomes.
t
Further information, including from subnational, health facility, and community levels should supplement findings to better quantify potential impact of disruptions over the short, medium and long term.
Urgent need for responsive health policy planning and action to orient health strategies according to rapidly evolving priorities and needs.
Further documentation and learning on which mitigation strategies and approaches work best and benefits and risks of pursuing different strategies towards recovery.
COVID-19 control strategies must be in balance with other health priorities (e.g. ensuring adequate staff are available and infection prevention and control measures are in place to protect health worker and patient safety throughout the delivery of both COVID-19 and other essential care).
WHO’s response must continue to support countries to respond to the increased strains on health systems to ensure continued access to comprehensive care for all individuals

Annex:
Participating countries,
territories and areas

WHO expresses its gratitude to all authorities and WHO country offices that supported participation in this survey
t
African region
• Angola
• Benin• Botswana• Burkina Faso• Burundi• Cabo Verde• Cameroon• Central African
Republic• Chad• Comoros• Congo• Cote d'Ivoire• Democratic
Republic of the Congo
• Eritrea• Eswatini• Ethiopia• Gabon• Gambia• Ghana• Guinea
• Guinea-Bissau• Kenya• Lesotho• Liberia• Madagascar• Malawi• Mauritania• Mauritius• Mozambique• Namibia• Niger• Rwanda• Sao Tome and
Principe• Senegal• Seychelles• South Africa• South Sudan• Togo• Uganda• Zambia
Region of the Americas
• Argentina• Bahamas• Belize• Bermuda• Bolivia (Plurinational
State of)• Brazil• British Virgin Islands• Cayman Islands• Chile• Costa Rica• Cuba• Dominica• Dominican Republic• Ecuador• El Salvador
Eastern Mediterranean region
• Afghanistan• Bahrain• Djibouti• Egypt• Iran (Islamic
Republic of)• Iraq• Jordan• Kuwait• Lebanon• Morocco• Oman
• occupied Palestinian territory, including east Jerusalem
• Pakistan• Qatar• Saudi Arabia• Somalia• Sudan• Syrian Arab Republic• Tunisia• United Arab Emirates• Yemen
• Grenada• Guatemala• Haiti• Honduras• Jamaica• Mexico• Nicaragua• Panama• Paraguay• Peru• Saint Lucia• Saint Vincent and
the Grenadines• Suriname• Uruguay

t
European region
• Albania• Armenia• Austria• Bulgaria• Croatia• Czechia• Denmark• Estonia• Finland• France• Georgia
• Hungary• Italy• Kazakhstan• Latvia• Portugal• Republic of Moldova• Sweden• Turkmenistan• Ukraine• United Kingdom of
Great Britain and Northern Ireland
South-East Asian region
• Bangladesh• Bhutan• Democratic People's Republic of Korea• Indonesia• Maldives• Nepal• Sri Lanka• Thailand• Timor-Leste
Western Pacific region
• Australia• Brunei Darussalam• China• Fiji• French Polynesia• Japan• Lao People's Democratic Republic• Malaysia• Papua New Guinea• Philippines• Republic of Korea• Solomon Islands• Vanuatu
WHO expresses its gratitude to all authorities and WHO country offices that supported participation in this survey (cont.)