Embed Size (px)
DESCRIPTION
• This household report is one of ten super category reports designed to show high-level comparison and analysis for retail markets across major countries in Europe.• This report contains data gathered from around Europe. This market was split into the following categories: air fresheners, dishwashing, household cleaners, shoe cleaners,cleaning supplies, insecticides, fabric detergents, fabric enhancers and paper disposables.• The report highlights key metrics such as total sales figures, market trends, categoryshares, winners and losers for Europe and for individual countries.• The data has been sourced from IRI retail databases and Eurostat, the statistical branch of administration for the European Commission.• The countries included in the report are: France, Germany, Italy, the Netherlands, Spain and the United Kingdom (U.K.).
Citation preview

PULSE REPORT
IRI Pulse Report Household
Welcome to the Pulse Q3 2013 edition for household. We hope you
find it useful. Please do not hesitate to contact us if you have any
questions or comments at [email protected].
Q3 2013
IRIworldwide.eu

PULSE REPORT
About the Report
2
• This household report is one of ten super category reports designed to show high-level
comparison and analysis for retail markets across major countries in Europe.
• This report contains data gathered from around Europe. This market was split into the
following categories: air fresheners, dishwashing, household cleaners, shoe cleaners,
cleaning supplies, insecticides, fabric detergents, fabric enhancers and paper disposables.
• The report highlights key metrics such as total sales figures, market trends, category
shares, winners and losers for Europe and for individual countries.
• The data has been sourced from IRI retail databases and Eurostat, the statistical branch of
administration for the European Commission.
• The countries included in the report are: France, Germany, Italy, the Netherlands, Spain
and the United Kingdom (U.K.).
• The market channels used for each country in this report are as follows:
Country Channels used
UK Hypermarkets, supermarkets, drug stores and impulse outlets
ESHypermarkets, supermarkets, hard discounters, and drug stores, including the Canary Islands
DE Hypermarkets, supermarkets, hard discounters and drug stores
NL Hypermarkets, supermarkets, hard discounters and drug stores
ITHypermarkets, supermarkets, small self service, hard discounters and drug stores
FR Hypermarkets and supermarkets
• For analytical purposes, the data sourced from available retail databases has been
consolidated to provide consistent results. However, for some countries it was not possible
to source data pertaining to certain categories. When this occurred, it has been documented
in the notes section found at the end of the report.
PULSE REPORT
On the Radar
3
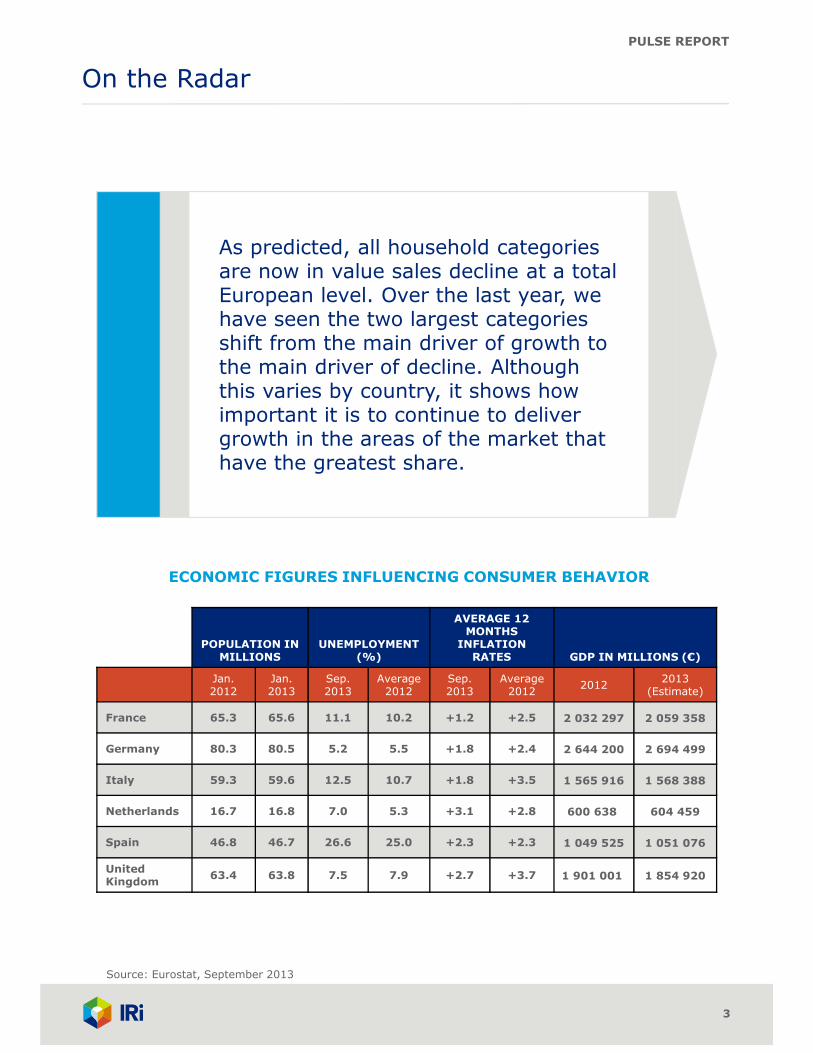
ECONOMIC FIGURES INFLUENCING CONSUMER BEHAVIOR
Source: Eurostat, September 2013
As predicted, all household categories are now in value sales decline at a total European level. Over the last year, we have seen the two largest categories shift from the main driver of growth to the main driver of decline. Although this varies by country, it shows how important it is to continue to deliver growth in the areas of the market that have the greatest share.
POPULATION IN MILLIONS
UNEMPLOYMENT (%)
AVERAGE 12 MONTHS
INFLATION RATES GDP IN MILLIONS (€)
Jan. 2012
Jan.2013
Sep. 2013
Average 2012
Sep. 2013
Average 2012
20122013
(Estimate)
France 65.3 65.6 11.1 10.2 +1.2 +2.5 2 032 297 2 059 358
Germany 80.3 80.5 5.2 5.5 +1.8 +2.4 2 644 200 2 694 499
Italy 59.3 59.6 12.5 10.7 +1.8 +3.5 1 565 916 1 568 388
Netherlands 16.7 16.8 7.0 5.3 +3.1 +2.8 600 638 604 459
Spain 46.8 46.7 26.6 25.0 +2.3 +2.3 1 049 525 1 051 076
United Kingdom
63.4 63.8 7.5 7.9 +2.7 +3.7 1 901 001 1 854 920
PULSE REPORT
1 230 1 250 1 232 1 245 1 209 1 224
1 008 1 037 966 951 995 1 020
274 274 261 271 264 265
1 483 1 5191 405 1 398 1 433 1 451
1 630 1 6571 636 1 668 1 611 1 660
1 385 1 4711 388 1 401 1 381
1 496
0
1 000
2 000
3 000
4 000
5 000
6 000
7 000
8 000
01-juil.-12 01-oct.-12 30-déc.-12 31-mars-13 30-juin-13 29-sept.-13
Mil
lio
ns
Period Ending
France
Germany
Italy
Netherlands
Spain
UK
Global Trends
4
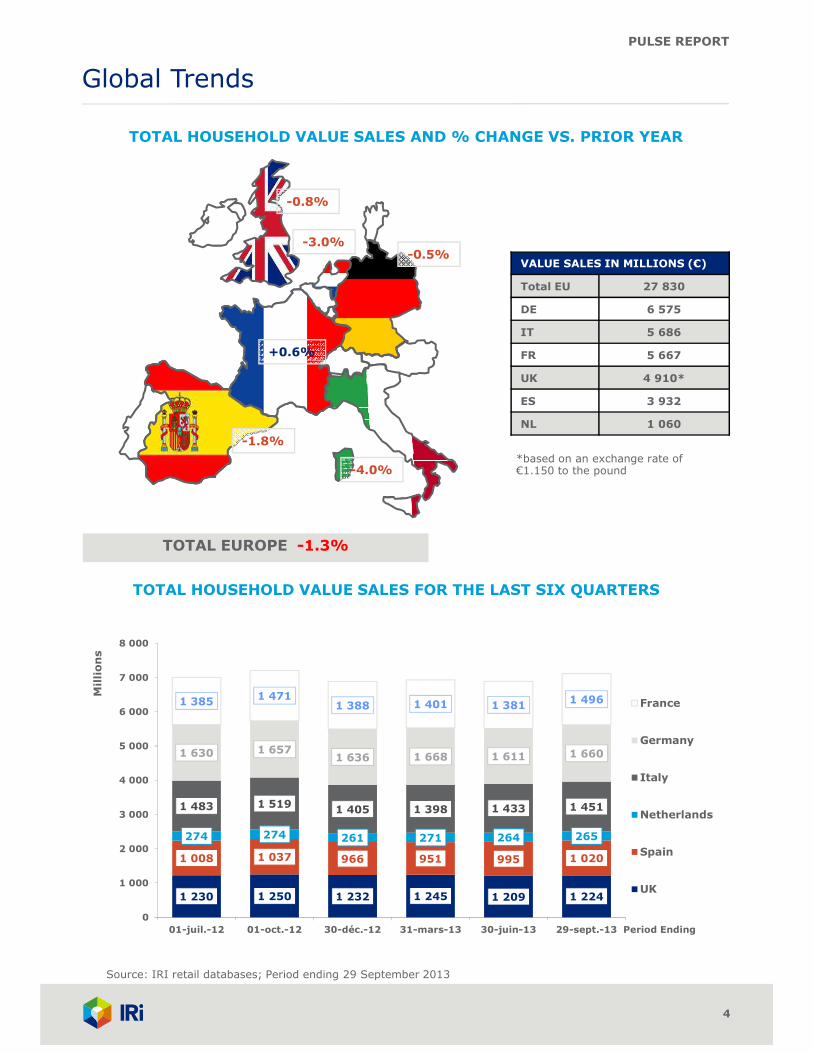
TOTAL EUROPE -1.3%
-4.0%
-0.5%
-0.8%
VALUE SALES IN MILLIONS (€)
Total EU 27 830
DE 6 575
IT 5 686
FR 5 667
UK 4 910*
ES 3 932
NL 1 060
TOTAL HOUSEHOLD VALUE SALES AND % CHANGE VS. PRIOR YEAR
*based on an exchange rate of €1.150 to the pound
-1.8%
+0.6%
-3.0%
TOTAL HOUSEHOLD VALUE SALES FOR THE LAST SIX QUARTERS
Source: IRI retail databases; Period ending 29 September 2013

PULSE REPORT
2 674
8 483
4 167
5 875
2 836
-1.6 -0.6 -1.3 -0.9 -0.7
Paper
Dis
posable
s
Fabri
c
Dete
rgents
Household
Cle
aners
Dis
hw
ash
Fabri
c
Enhancers
Mil
lio
ns
Total € Sales % € vs. YA
15.0%
9.6%
5.9%
30.5%
0.5%
1.8%
5.3%
21.1%
10.2%
Paper Disposables Fabric Detergents Household Cleaners
Dishwash Fabric Enhancers Air Fresheners
Cleaning Supplies Insecticides Shoe Cleaners
Europe
5
5 875
4 167
2 836
1 6531 478
514 150
8 483
2 674
Eu
ros,
in M
illi
on
s
CATEGORY VALUE SALES IN THE LAST YEAR
CATEGORY SHARE OF VALUE IN THE LAST YEAR
Europe includes: France, Germany, Italy, Netherlands, Spain and United Kingdom
TOP 5 CATEGORIES: EVOLUTION
Value sales (€) and % change vs. year ago
Source: IRI retail databases; Period ending 29 September 2013
KEY TRENDS
• France is now the only country in Europe
to grow household sales, although
Germany and the U.K. declined at a slower
rate than the European total. However, all
countries have grown versus the previous
quarter.
• Sales are down -1.3% versus the prior
year with none of the household categories
in growth at a total European level. Fabric
detergents was previously one of the main
growth areas, but this has had a dramatic
turnaround and is now the category with
the largest decline. This is followed by
paper disposables, again a category which
has historically driven the growth of the
household market.
• These two categories should act as a
warning to any category – within the space
of a few months, the largest area of
growth can become the largest area of
decline.

PULSE REPORT
Europe
6
CATEGORY INSIGHTS
• Fabric detergents is now the largest area of decline at a European level. Although France,
Germany and the U.K. have growth, there are significant declines in Italy and Spain which
have driven this trend. Powder, which is in significant decline in Spain and the U.K., seems to
drive this. Other formats are unable to achieve the levels of growth needed to offset this
decline.
• Paper disposables continues to decline as France and Spain are unable to cover for the losses
seen in the U.K. and Italy. The U.K. decline is driven by private label in the soft sector, whilst
Italy declines across all sectors except napkins and wipes.
• Household cleaners are in decline in all countries with the exception of Germany. The
majority of the decline is seen in Italy, where all sectors are now in decline.
• Air fresheners are in decline across every European country. Although this is not the top five
in terms of share of household, this wide decline brings it into the bottom 5 performing
categories.
Europe includes: France, Germany, Italy, Netherlands, Spain and the United Kingdom
Source: IRI retail databases; Period ending 29 September 2013
TOP LOSERS: VALUE SALES CHANGE VS. YR. AGO (€)
TOP WINNERS: VALUE SALES CHANGE VS. YR. AGO (€)
0 0 0 0 0 0 0
Millions
- 38,7
- 42,7
- 54,7
- 96,1
- 78,9
-120 -100 -80 -60 -40 -20 0
AirFresheners
CleaningSupplies
HouseholdCleaners
PaperDisposables
FabricDetergents
.
Millions

PULSE REPORT
542
1 492
813
1 280
607
0.6 2.2-0.8 1.5 1.5
Paper
Dis
posable
s
Fabri
c
Dete
rgents
Household
Cle
aners
Dis
hw
ash
Fabri
c
Enhancers
Mil
lio
ns
Total € Sales % € vs. YA
France
7
KEY TRENDS
• France is the only country in Europe to
register growth on household products,
growing 0.6% in value sales versus a
decline of 1.3% for Europe.
• But, France’s growth rate is slowing down
quarter by quarter.
• Also, FMCG as a whole is now far more
dynamic than household products , with
1.7% growth in Q3 2013.
• Household growth mainly comes from
“essential” categories, which include paper
disposables, fabric detergents and
dishwashing.
Eu
ros,
in M
illi
on
s
CATEGORY VALUE SALES IN THE LAST YEAR
CATEGORY SHARE OF VALUE IN THE LAST YEAR
Source: IRI retail databases; Period ending 29 September 2013
TOP 5 CATEGORIES: EVOLUTION
Value sales (€) and % change vs. year ago
14.3%
9.6%
7.8%
26.3%
0.6%
2.3%
5.8%
22.6%
10.7%
Paper Disposables Fabric Detergents Household Cleaners
Dishwash Fabric Enhancers Cleaning Supplies
Air Fresheners Insecticides Shoe Cleaners
1 280
813
607
441
329
130
34
1 492
542

PULSE REPORT
France
8
TOP LOSERS: VALUE SALES CHANGE VS. YR. AGO (€)
TOP WINNERS: VALUE SALES CHANGE VS. YR. AGO (€)
Source: IRI retail databases; Period ending 29 September 2013
Millions
CATEGORY INSIGHTS
• Fabric detergents, the second largest category on household products, is now only the fourth
contributor to growth. Value sales only grew by 0.6% versus around 5% in 2012. The strong
increase of the capsules segment is not sufficient to offset regression of all other product
forms.
The economic context now seems to be weighing on the category’s health. Moreover, during
the last two or three years, fabric was benefiting from liquid compaction, but it seems that
now consumers are using the correct dose.
• Paper disposables and dishwashing grew mainly through promotional sales increases.
• Household cleaners still suffer from the structural decline of categories such as floor care and
bleach.
22,7
13,2
7,8
7,8
0,9
0 5 10 15 20 25
PaperDisposables
Dishwash
FabricEnhancers
FabricDetergents
ShoeCleaners
- 1,7
- 3,1
- 6,4
- 4,9
-8 -6 -4 -2 0
Insecticides
AirFresheners
CleaningSupplies
HouseholdCleaners
.
Millions

PULSE REPORT
589
2 221
990
1 380
698
0.4 -0.7 0.6-0.7 0.1
Paper
Dis
posable
s
Fabri
c
Dete
rgents
Household
Cle
aners
Dis
hw
ash
Fabri
c
Enhancers
Mil
lio
ns
Total € Sales % € vs. YA
Germany
9
KEY TRENDS
• The household market experienced a slight
decline, driven by losses in the paper
disposable and air freshener categories.
• Although promotions contributed to more
than 21% of total sales, there has been a
dip in promotional sales growth which is a
reason for the category decline.
• Hypermarkets remain the major channel
with positive growth. The major sub-
channels are 1500-2499 square meter
(sqm) and 2500-4999 sqm with significant
growth.
• Although other drug stores contributed to
more than 50% of the sales of drug stores
and show an overall positive development,
they are unable to compensate for the
bankruptcy of Schlecker.
• Discounters have shown positive
development with growth from both hard
and soft discounters. Growth in household
cleaners and fabric detergent categories led
to the sales boost.
Eu
ros,
in M
illi
on
s
CATEGORY VALUE SALES IN THE LAST YEAR
CATEGORY SHARE OF VALUE IN THE LAST YEAR
TOP 5 CATEGORIES: EVOLUTIONValue sales (€) and % change vs. year ago
Source: IRI retail databases; Period ending 29 September 2013
15.1%
9.0%
5.6%
33.8%
0.4%
1.1%3.5%
21.0%
10.6%
Paper Disposables Fabric Detergents Household Cleaners
Dishwash Fabric Enhancers Air Fresheners
Cleaning Supplies Insecticides Shoe Cleaners
1 380
990
698
367 229
27
2 221
589
75

PULSE REPORT
Germany
10
CATEGORY INSIGHTS
• Household cleaners lead the category driven by value growth of toilet bowl cleaner/stones in
all channels except for drug stores. Major channels with positive development are
discounters and hypermarkets, together contributing to approximately 62% of market share
fueled by higher promotions. The overall volume decline of the category is majorly due to
losses in drug stores. Private label holds around 30% of share with a flat growth rate, but
faced losses in drug stores.
• Fabric detergents continue to grow, mainly driven by the value growth in all purpose
washing detergents. Hypermarket is the major channel with over 40% of market share,
showing a stable growth rate with a promotion sales boost. Hard discounters also play a
major role in pumping up sales growth and masking the losses from drug stores. Private
label holds around 22% of market share, but shows a slight decline, mainly driven by losses
in drug stores.
• Fabric enhancers show stable development driven by positive growth in the fabric softeners
category. Hypermarket is the major channel. Private label has an 18% share, but showed a
dip in sales with losses in both drug stores and hypermarkets.
• Due to heavy losses in the major categories toilet paper and paper napkins, paper
disposables showed a huge decline. Losses in drug stores pulled down the overall sales
growth. Hard discounters also declined, adding to the losses.
• Cleaning supplies also showed decline driven by losses in drugstores and discounters.
Although hypermarkets showed slight positive growth, they were unable to offset the losses.
Private label is the major manufacturer with approximately 64% of market share, but is also
declining.
TOP LOSERS: VALUE SALES CHANGE VS. YR. AGO (€)
TOP WINNERS: VALUE SALES CHANGE VS. YR. AGO (€)
Source: IRI retail databases; Period ending 29 September 2013
Millions
5.6
5.6
0.4
0 1 2 3 4 5 6
HouseholdCleaners
FabricDetergents
FabricEnhancers
- 2,4
- 5,0
- 9,9
- 16,0
- 10,5
-20 -15 -10 -5 0
Insecticides
Dishwash
AirFresheners
CleaningSupplies
PaperDisposables
.Millions

PULSE REPORT
556
1 609
9791 071
568
-5.3 -4.9 -3.3 -2.9 -2.7
Paper
Dis
posable
s
Fabri
c
Dete
rgents
Household
Cle
aners
Fabri
c
Enhancers
Dis
hw
ash
Mil
lio
ns
Total € Sales % € vs. YA
Italy
11
KEY TRENDS
• The Italian macro-economical scenario is
more and more in recession. Consumption
still decreased in value and in volume as
well, unemployment increased and the GDP
forecast for 2014 is weakly positive.
• Inflation is quite stable compared to
previous levels, but there will be higher
prices due to increasing taxes. Both retailers
and manufacturers are competing more and
more on a price and promotional basis.
• The general downturn is affecting both
private labels and branded products in every
segment of FMCG.
Eu
ros,
in M
illi
on
s
CATEGORY VALUE SALES IN THE LAST YEAR
CATEGORY SHARE OF VALUE IN THE LAST YEAR
Source: IRI retail databases; Period ending 29 September 2013
TOP 5 CATEGORIES: EVOLUTIONValue sales (€) and % change vs. year ago
17.2%
9.8%
8.2%
28.3%
0.7%3.1%
3.8%
18.8%
10.0%
Paper Disposables Fabric Detergents Household Cleaners
Fabric Enhancers Dishwash Cleaning Supplies
Air Fresheners Insecticides Shoe Cleaners
1 071 979
568 467
217 178
42
1 609
556

PULSE REPORT
Italy
12
CATEGORY INSIGHTS
• Compared to food and beverage, household categories are even more negative in volume
and value in the year 2012, but there was a weak recovery in the first 9 months of 2013.
Drug stores and discounters are still positive.
• Every important market for household cleaning was very negative and for the first time there
were no positive categories.
• Among the top 5 household categories, every one is deeply decreasing. Only dishwashing
had a decrease lower than 3.0%. Auto dish washing was not as negative as hand dish
washing.
• In fabric detergents, only machine washing decreased less than average in value and
increased in volume, thanks to high promotions in terms of price reduction and special
packaging with special offers.
• Paper disposable, the biggest market of household, is still negative and every segment is
strongly decreasing. Only napkins and wipes were positive in volume.
• Fabric enhancers were one of the top negative markets. Softeners, the biggest market of the
segment, decreased less, as there was heavy investment by top companies in terms of
assortment and promotions, while the second biggest market, laundry additives, decreased
over 7%.
• Among other households categories, only continuous air fresheners increased.
• Private labels confirmed their growth in every grocery market, even if the economic
downturn is affecting private label as well.
TOP LOSERS: VALUE SALES CHANGE VS. YR. AGO (€)
TOP WINNERS: VALUE SALES CHANGE VS. YR. AGO (€)
Source: IRI retail databases; Period ending 29 September 2013
Millions
0 0 0 0 0 0 0
- 21,0
- 29,5
- 33,2
- 59,4
- 47,5
-80 -60 -40 -20 0
CleaningSupplies
FabricEnhancers
HouseholdCleaners
PaperDisposables
FabricDetergents
.Millions
PULSE REPORT
Netherlands
13
Eu
ros,
in M
illi
on
s
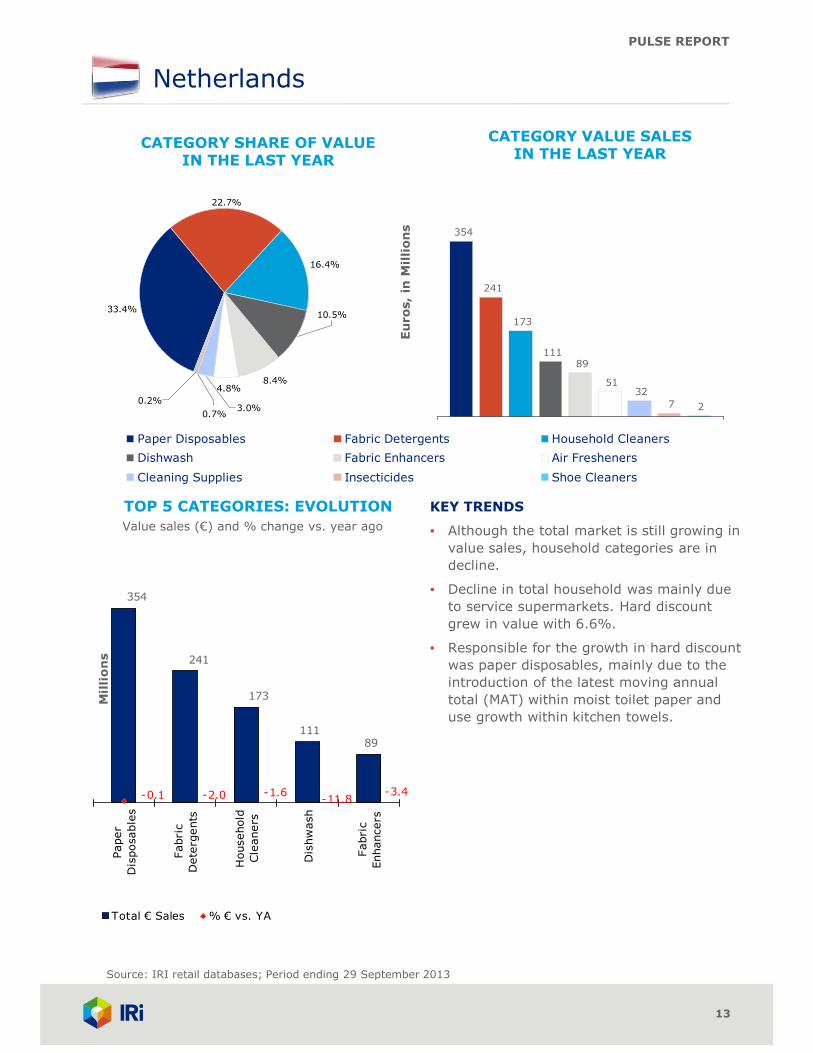
CATEGORY VALUE SALES IN THE LAST YEAR
CATEGORY SHARE OF VALUE IN THE LAST YEAR
TOP 5 CATEGORIES: EVOLUTION
Value sales (€) and % change vs. year ago
Source: IRI retail databases; Period ending 29 September 2013
16.4%
8.4%4.8%
33.4%
0.2%
0.7%3.0%
22.7%
10.5%
Paper Disposables Fabric Detergents Household Cleaners
Dishwash Fabric Enhancers Air Fresheners
Cleaning Supplies Insecticides Shoe Cleaners
241
173
111
51 32
7 2
354
89
89
354
173
241
111
-2.0 -11.8 -1.6 -0.1 -3.4
Paper
Dis
posable
s
Fabri
c
Dete
rgents
Household
Cle
aners
Dis
hw
ash
Fabri
c
Enhancers
Mil
lio
ns
Total € Sales % € vs. YA
KEY TRENDS
• Although the total market is still growing in
value sales, household categories are in
decline.
• Decline in total household was mainly due
to service supermarkets. Hard discount
grew in value with 6.6%.
• Responsible for the growth in hard discount
was paper disposables, mainly due to the
introduction of the latest moving annual
total (MAT) within moist toilet paper and
use growth within kitchen towels.

PULSE REPORT
Netherlands
14
TOP LOSERS: VALUE SALES CHANGE VS. YR. AGO (€)
TOP WINNERS: VALUE SALES CHANGE VS. YR. AGO (€)
Source: IRI retail databases; Period ending 29 September 2013
Millions
0 0 0 0 0 0 0
- 2,9
- 3,1
- 3,5
- 14,9
- 5,0
-20 -15 -10 -5 0
HouseholdCleaners
FabricEnhancers
AirFresheners
FabricDetergents
Dishwash
.
Millions
CATEGORY INSIGHTS
• Paper disposables had slight growth in Euro sales within both drug stores and hard discount.
Service supermarkets are trying to get share back with a high promotional pressure. Until
now, this has not been successful. Service supermarkets were the only group in decline. Only
volume growth for paper disposables for hard discount, mainly due to the introduction of the
latest MAT within moist toilet paper and moist tissues.
• Total detergents are under pressure, but showed a high increase within drug stores both in
value and volume. Promotional sales are driving the positive drug stores’ sales. The growth in
drug stores has had a negative impact on the sales in supermarkets.
• Dishwashing products declined in growth again. After a long period of high promotional sales,
promotional pressure is declining within both drug stores and supermarkets. Also, hard
discount gained territory from supermarkets and drug stores.
• Air freshener volume declined within supermarkets, drug stores and hard discount. Although
hard discount showed an increase in value, this is by far not enough for total market growth.

PULSE REPORT
355
1 189
594
785
374
-5.5 -1.2 -2.3 0.9 0.3
Paper
Dis
posable
s
Fabri
c
Dete
rgents
Household
Cle
aners
Fabri
c
Enhancers
Dis
hw
ash
Mil
lio
ns
Total € Sales % € vs. YA
Spain
15
KEY TRENDS
• The FMCG market had a positive trend in
2013 with 0.5% growth, but demand was
still negative. Only fresh products had a
flat demand. The rest of the sectors,
including food, beverages, household,
perfumeries and baby, declined, with
household declining at the fastest rate.
• Even though the household sector is falling
in demand and value in total this year,
there are still channels where the trend is
positive. Not only big supermarkets, but
small supermarkets saw a flat trend.
Proximity stores are over performing.
• In an unusual trend, private label
performed worse than the household
market and only grew in medium
supermarkets. Manufacturer brands are
decreasing too, but less so than private
label.
Eu
ros,
in M
illi
on
s
CATEGORY VALUE SALES IN THE LAST YEAR
CATEGORY SHARE OF VALUE IN THE LAST YEAR
TOP 5 CATEGORIES: EVOLUTION
Value sales (€) and % change vs. year ago
Source: IRI retail databases; Period ending 29 September 2013
15.1%
9.0%
6.6%
30.2%
0.4%
2.6%
6.6%
20.0%
9.5%
Paper Disposables Fabric Detergents Household Cleaners
Fabric Enhancers Dishwash Cleaning Supplies
Air Fresheners Insecticides Shoe Cleaners
785
594
374
258 258
102
16
1 189
355

PULSE REPORT
Spain
16
CATEGORY INSIGHTS
• All segments are growing in paper disposable. However, the tendency in volume is negative,
so the price increase would explain the value growth. In the toilet paper sector, the growth of
big packs is driving up the category.
• Dishwashing is growing because of hand dishwashing products. Within this sector, the
concentrated products are growing ahead of the category, particularly for private label in big
supermarkets.
• Powder decreased in the detergent category and hand detergents and delicate detergents
pulled down the category as well. Also, promotional levels have decreased slightly.
• Air fresheners are decreasing due to lost sales in all of the segments, except automatic air
fresheners. This is one of the most injured categories in household. Even private label is
decreasing and only the new launches in automatic air fresheners contributed to growth.
• Household cleaners decreased in specific cleaners and private label. Manufacturer brands
decreased, but less. No segment saw a positive trend, only a few small segments remained
flat.
TOP LOSERS: VALUE SALES CHANGE VS. YR. AGO (€)
TOP WINNERS: VALUE SALES CHANGE VS. YR. AGO (€)
Source: IRI retail databases; Period ending 29 September 2013
Millions
10,4
1,1
0 2 4 6 8 10 12
PaperDisposables
Dishwash
- 4,7
- 5,0
- 8,2
- 46,1
- 14,0
-50 -40 -30 -20 -10 0
FabricEnhancers
CleaningSupplies
AirFresheners
HouseholdCleaners
FabricDetergents
.Millions

PULSE REPORT
508
1 619
618
1 118
513
0.11.9-0.6 -2.9 0.6
Paper
Dis
posable
s
Fabri
c
Dete
rgents
Household
Cle
aners
Fabri
c
Enhancers
Dis
hw
ash
Mil
lio
ns
Total € Sales % € vs. YA
United Kingdom
17
KEY TRENDS
• The U.K. is ahead of the European market
growth rate, but in decline (-0.8% versus
-1.3%) with the sales growth rate falling
behind Germany as well as France. Value
sales were up versus last quarter.
• Paper disposables drove the decline whilst
household cleaners and air fresheners are
now in decline. Of the five largest
categories, fabric enhancers grew at the
fastest rate and delivered the most
absolute growth.
• We have started to see more new product
development in household categories this
quarter, which may enable some
categories to remain in growth. Many of
these come at a premium, so it will be
interesting to see how volume performs
over the next quarter.
Eu
ros,
in M
illi
on
s
CATEGORY VALUE SALES IN THE LAST YEAR
CATEGORY SHARE OF VALUE IN THE LAST YEAR
TOP 5 CATEGORIES: EVOLUTION
Value sales (€) and % change vs. year ago
Source: IRI retail databases; Period ending 29 September 2013
12.6%
10.3%
8.8%
33.0%
0.4%
0.6% 1.0%
22.8%
10.4%
Paper Disposables Fabric Detergents Household Cleaners
Fabric Enhancers Dishwash Air Fresheners
Cleaning Supplies Shoe Cleaners Insecticides
1 118
618 513
432
51 31 20
1 619
508

PULSE REPORT
United Kingdom
18
CATEGORY INSIGHTS
• Fabric enhancers drove growth this quarter more than the other categories combined.
Concentrated conditioners are the largest part of the market and the source of growth with
Unilever and P&G driving this at the expense of private label.
• Dishwashing product growth was driven by the machine sector, with hand now in decline
after a long period of growth. Machine growth came from private label, which was also the
area of decline for the hand sector. Overall, category growth came from more effective
promotions and at higher promoted prices.
• Fabric detergents are still positive, but no longer driving household growth. Main wash is
now in decline, driven by P&G powder, but there was some growth in liquid formats following
new product development. Growth came from the wash treatment sector, where, again,
powder was the source of decline whilst capsules grew.
• Household cleaners are now in decline after a lengthy period of growth. This was driven by
toilet rim blocks across most manufacturers, whilst bleach has seen value growth from price
increases.
• Paper disposables are now in heavy decline and are the key reason for the overall household
decline in the U.K. This is driven by price declines in the soft sector, as this has not driven
sufficient volume to cover for the loss in value. The soft sector decline is driven by private
label and Kimberly Clark.
Source: IRI retail databases; Period ending 29 September 2013
TOP LOSERS: VALUE SALES CHANGE VS. YR. AGO (€)
TOP WINNERS: VALUE SALES CHANGE VS. YR. AGO (€)
Millions
9,8
3,3
1,2
1,2
0,1
0 2 4 6 8 10 12
FabricEnhancers
Dishwash
CleaningSupplies
FabricDetergents
Insecticides
- 3.3
- 0.1
- 48.0
- 3.7
-60 -50 -40 -30 -20 -10 0
Shoe Cleaners
AirFresheners
HouseholdCleaners
PaperDisposables
.Millions

PULSE REPORT
Final Notes
19
Notes on Category Definitions for Countries
Due to the diverse products found in individual countries across this market, it was necessary
to consolidate the available data into the categories in this report. In some cases, it wasn’t
always possible to align products across all 6 countries, hence the need to highlight any
anomalies in the report. Those exceptions are listed below:
Shoe cleaners
• The Germany and France data in this report includes leather cleaning products.
Tools
• The U.K. data in this report only contains rubber gloves for this category.
• The Germany data in this report does not include mops, brushes or rubber gloves.
Fabric enhancers
• The U.K. data in this report does not include stain remover or fabric bleach products.
• The Italy data in this report does not include tumble dry enhancers.
• The Spain data in this report does not include anti-lime scale for laundry, tumble dry
enhancer or fabric storage products.
Paper disposables
• The France data in this report does not include wet wipes.
• The U.K. data in this report does not include paper napkins.

PULSE REPORT
Resources
20
About IRI. IRI is a leader in delivering powerful market and shopper information, predictive analysis and the foresight
that leads to action. We go beyond the data to ignite extraordinary growth for our clients in the CPG, retail and over-
the-counter healthcare industries by pinpointing what matters and illuminating how it can impact their businesses
across sales and marketing. Move your business forward at IRIworldwide.eu
Arlington Square, Downshire Way, Bracknell, Berkshire RG12 1WA, Tel +44 (0) 1344 746000
Copyright © 2013 Information Resources, Inc. (IRI). All rights reserved. IRI, the IRI logo and the names of IRI products and services
referenced herein are either trademarks or registered trademarks of IRI. All other trademarks are the property of their respective owners.
FOR MORE INFORMATION
Please contact Sam Cialis, Senior Insight Manager,
IRI at [email protected] or
+44 1344 747910 with questions or comments about this report.
To gain insight into opportunities across specific categories, segments, channels or retailers,
contact your IRI client service representative regarding custom analyses leveraging the
following resources:
• IRI InfoScan Census® is a syndicated retail tracking service that enables manufacturers
and retailers to acquire industry insights used to make better business decisions. IRI
InfoScan Census utilizes the data that IRI collects from grocery, drug, and mass
merchandise retailers to provide the most comprehensive and accurate syndicated data
offering in the FMCG sector. With access to accurate, granular detail by category, geography,
measure, and time period, clients have the tools needed to develop marketing and sales
strategies based on product performance, distribution, and promotion responsiveness. All
data about household comes from IRI InfoScan Census®.
• IRI Consulting provides strategic insights and advice, leveraging a variety of data sources,
predictive analytics, enabling technologies, and business analyses to help FMCG
manufacturers and retailers address significant sales and marketing issues effectively.