Embed Size (px)
Citation preview
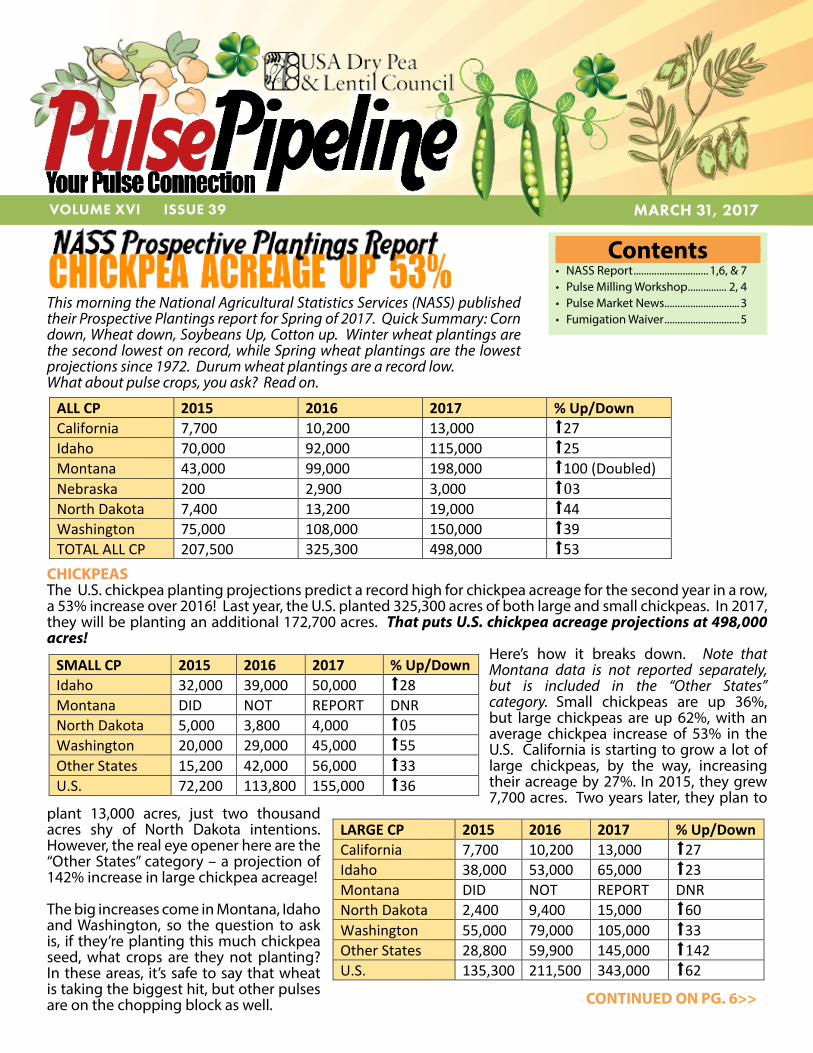
CHICKPEASThe U.S. chickpea planting projections predict a record high for chickpea acreage for the second year in a row, a 53% increase over 2016! Last year, the U.S. planted 325,300 acres of both large and small chickpeas. In 2017, they will be planting an additional 172,700 acres. That puts U.S. chickpea acreage projections at 498,000 acres!
Here’s how it breaks down. Note that Montana data is not reported separately, but is included in the “Other States” category. Small chickpeas are up 36%, but large chickpeas are up 62%, with an average chickpea increase of 53% in the U.S. California is starting to grow a lot of large chickpeas, by the way, increasing their acreage by 27%. In 2015, they grew 7,700 acres. Two years later, they plan to
plant 13,000 acres, just two thousand acres shy of North Dakota intentions. However, the real eye opener here are the “Other States” category – a projection of 142% increase in large chickpea acreage!
The big increases come in Montana, Idaho and Washington, so the question to ask is, if they’re planting this much chickpea seed, what crops are they not planting? In these areas, it’s safe to say that wheat is taking the biggest hit, but other pulses are on the chopping block as well.
ThismorningtheNationalAgriculturalStatisticsServices(NASS)publishedtheirProspectivePlantingsreportforSpringof2017.QuickSummary:Corndown,Wheatdown,SoybeansUp,Cottonup.Winterwheatprojectionsarethesecondlowestonrecord,whileSpringwheatprojectsarethelowestprojectionssince1972.Durumwheatprojectsarearecordlow.Whataboutpulsecrops,youask?Readon.CHICKPEASTheseU.S.chickpeaplantingprojectionsrepresentarecordhighforchickpeaacreage.OverallintheU.S.,plantingintentionsforbothlargeandsmallchickpeashaveincreasedgreatlyfromlastyear.Smallchickpeasareup36%,butlargechickpeasareup62%,withanaveragechickpeaincreaseof53%intheU.S.Californiaisstartingtogrowalotoflargechickpeas,bytheway,increasingtheiracreageby2%.In2015,theygrew7,700acres.Twoyearslater,theyplantoplant13,000acres,justtwothousandacresshyofNorthDakotaintentions.However,therealeyeopenerherearethe“OtherStates”category–aprojectionof142%increaseinlargechickpeaacreage!Clearlyafewstatesgotthememothatpulsesaretrending(anyofyoureadingtheweeklyPulseMarketNewsinthePipelineknowthatlargeandsmallchickpeapriceshavebeenvery,verysolid).Thetablebelowtellsthestoryofhowthisincreaseinacreageplaysoutamongthemajorpulsegrowingstates.ThebigincreasescomeinIdahoandWashington,sothequestiontoaskis,ifthey’replantingthismuchchickpeaseed,whatcropsaretheynotplanting?Intheseareas,it’ssafetosaythatwheatistakingthebiggesthit,butotherpulsesareonthechoppingblockaswell.Thenumberstellthestory.SMALLCP 2015 2016 2017 %Up/DownIdaho 32,000 39,000 50,000 ⬆28Montana DID NOT REPORT DNRNorthDakota 5,000 3,800 4,000 ⬆05Washington 20,000 29,000 45,000 ⬆55OtherStates 15,200 42,000 56,000 ⬆33U.S. 72,200 113,800 155,000 ⬆36
LARGECP 2015 2016 2017 %Up/DownCalifornia 7,700 10,200 13,000 ⬆27Idaho 38,000 53,000 65,000 ⬆23Montana DID NOT REPORT DNRNorthDakota 2,400 9,400 15,000 ⬆60Washington 55,000 79,000 105,000 ⬆33OtherStates 28,800 59,900 145,000 ⬆142U.S. 135,300 211,500 343,000 ⬆62
CONTINUED ON PG. 6>>
VOLUME XVI ISSUE 39 MARCH 31, 2017
Contents• NASS Report ............................. 1,6, & 7• Pulse Milling Workshop ............... 2, 4• Pulse Market News .............................3• Fumigation Waiver .............................5
This morning the National Agricultural Statistics Services (NASS) published their Prospective Plantings report for Spring of 2017. Quick Summary: Corn down, Wheat down, Soybeans Up, Cotton up. Winter wheat plantings are the second lowest on record, while Spring wheat plantings are the lowest projections since 1972. Durum wheat plantings are a record low. What about pulse crops, you ask? Read on.
ThismorningtheNationalAgriculturalStatisticsServices(NASS)publishedtheirProspectivePlantingsreportforSpringof2017.QuickSummary:Corndown,Wheatdown,SoybeansUp,Cottonup.Winterwheatprojectionsarethesecondlowestonrecord,whileSpringwheatprojectsarethelowestprojectionssince1972.Durumwheatprojectsarearecordlow.Whataboutpulsecrops,youask?Readon.CHICKPEASTheseU.S.chickpeaplantingprojectionsrepresentarecordhighforchickpeaacreage.OverallintheU.S.,plantingintentionsforbothlargeandsmallchickpeashaveincreasedgreatlyfromlastyear.Smallchickpeasareup36%,butlargechickpeasareup62%,withanaveragechickpeaincreaseof53%intheU.S.Californiaisstartingtogrowalotoflargechickpeas,bytheway,increasingtheiracreageby2%.In2015,theygrew7,700acres.Twoyearslater,theyplantoplant13,000acres,justtwothousandacresshyofNorthDakotaintentions.However,therealeyeopenerherearethe“OtherStates”category–aprojectionof142%increaseinlargechickpeaacreage!Clearlyafewstatesgotthememothatpulsesaretrending(anyofyoureadingtheweeklyPulseMarketNewsinthePipelineknowthatlargeandsmallchickpeapriceshavebeenvery,verysolid).Thetablebelowtellsthestoryofhowthisincreaseinacreageplaysoutamongthemajorpulsegrowingstates.ThebigincreasescomeinIdahoandWashington,sothequestiontoaskis,ifthey’replantingthismuchchickpeaseed,whatcropsaretheynotplanting?Intheseareas,it’ssafetosaythatwheatistakingthebiggesthit,butotherpulsesareonthechoppingblockaswell.Thenumberstellthestory.SMALLCP 2015 2016 2017 %Up/DownIdaho 32,000 39,000 50,000 ⬆28Montana DID NOT REPORT DNRNorthDakota 5,000 3,800 4,000 ⬆05Washington 20,000 29,000 45,000 ⬆55OtherStates 15,200 42,000 56,000 ⬆33U.S. 72,200 113,800 155,000 ⬆36
LARGECP 2015 2016 2017 %Up/DownCalifornia 7,700 10,200 13,000 ⬆27Idaho 38,000 53,000 65,000 ⬆23Montana DID NOT REPORT DNRNorthDakota 2,400 9,400 15,000 ⬆60Washington 55,000 79,000 105,000 ⬆33OtherStates 28,800 59,900 145,000 ⬆142U.S. 135,300 211,500 343,000 ⬆62
ALLCP 2015 2016 2017 %Up/DownCalifornia 7,700 10,200 13,000 ⬆27Idaho 70,000 92,000 115,000 ⬆25Montana 43,000 99,000 198,000 ⬆100(Doubled)Nebraska 200 2,900 3,000 ⬆03NorthDakota 7,400 13,200 19,000 ⬆44Washington 75,000 108,000 150,000 ⬆39TOTALALLCP 207,500 325,300 498,000 ⬆53
Copyright2017 22780 W. Pullman Road, Moscow, ID 83843 • www.usapulses.org • Ph: 208.882.3023 • Fax: 208.882.6406
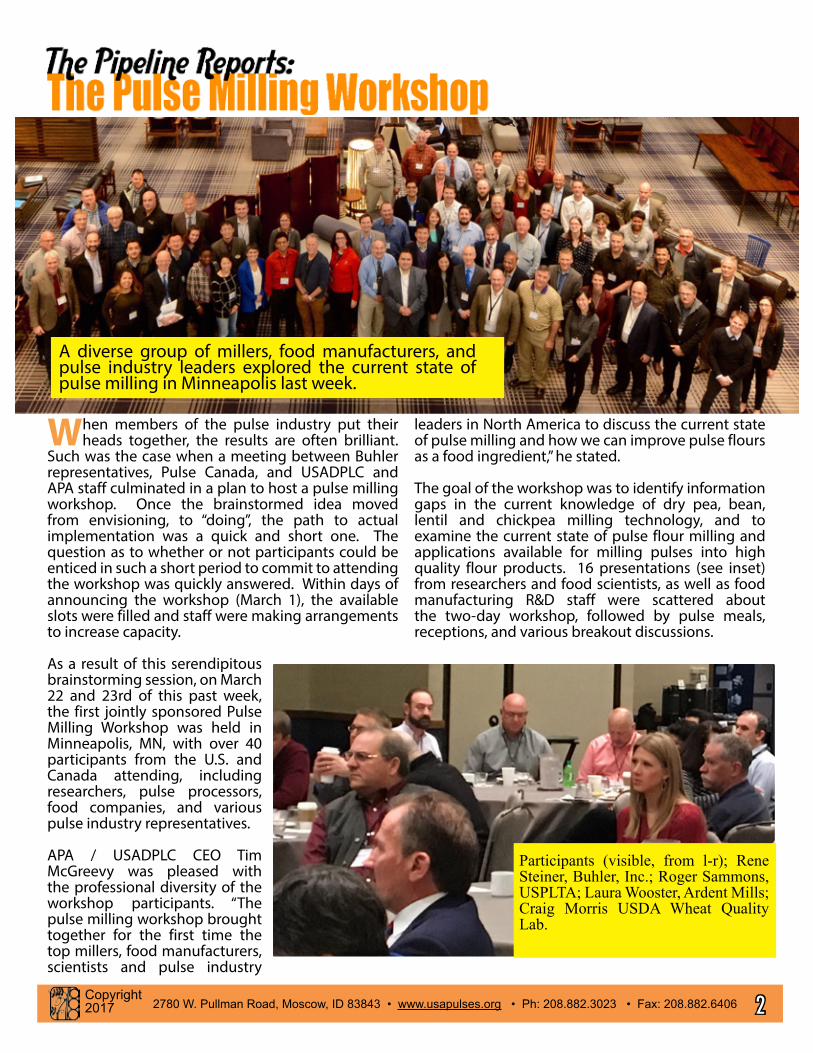
A diverse group of millers, food manufacturers, and pulse industry leaders explored the current state of pulse milling in Minneapolis last week.
Participants (visible, from l-r); Rene Steiner, Buhler, Inc.; Roger Sammons, USPLTA; Laura Wooster, Ardent Mills; Craig Morris USDA Wheat Quality Lab.
When members of the pulse industry put their heads together, the results are often brilliant.
Such was the case when a meeting between Buhler representatives, Pulse Canada, and USADPLC and APA staff culminated in a plan to host a pulse milling workshop. Once the brainstormed idea moved from envisioning, to “doing”, the path to actual implementation was a quick and short one. The question as to whether or not participants could be enticed in such a short period to commit to attending the workshop was quickly answered. Within days of announcing the workshop (March 1), the available slots were filled and staff were making arrangements to increase capacity.
As a result of this serendipitous brainstorming session, on March 22 and 23rd of this past week, the first jointly sponsored Pulse Milling Workshop was held in Minneapolis, MN, with over 40 participants from the U.S. and Canada attending, including researchers, pulse processors, food companies, and various pulse industry representatives.
APA / USADPLC CEO Tim McGreevy was pleased with the professional diversity of the workshop participants. “The pulse milling workshop brought together for the first time the top millers, food manufacturers, scientists and pulse industry
leaders in North America to discuss the current state of pulse milling and how we can improve pulse flours as a food ingredient,” he stated.
The goal of the workshop was to identify information gaps in the current knowledge of dry pea, bean, lentil and chickpea milling technology, and to examine the current state of pulse flour milling and applications available for milling pulses into high quality flour products. 16 presentations (see inset) from researchers and food scientists, as well as food manufacturing R&D staff were scattered about the two-day workshop, followed by pulse meals, receptions, and various breakout discussions.
Copyright2017 2780 W. Pullman Road, Moscow, ID 83843 • www.usapulses.org • Ph: 208.882.3023 • Fax: 208.882.6406 32780 W. Pullman Road, Moscow, ID 83843 • www.usapulses.org • Ph: 208.882.3023 • Fax: 208.882.6406
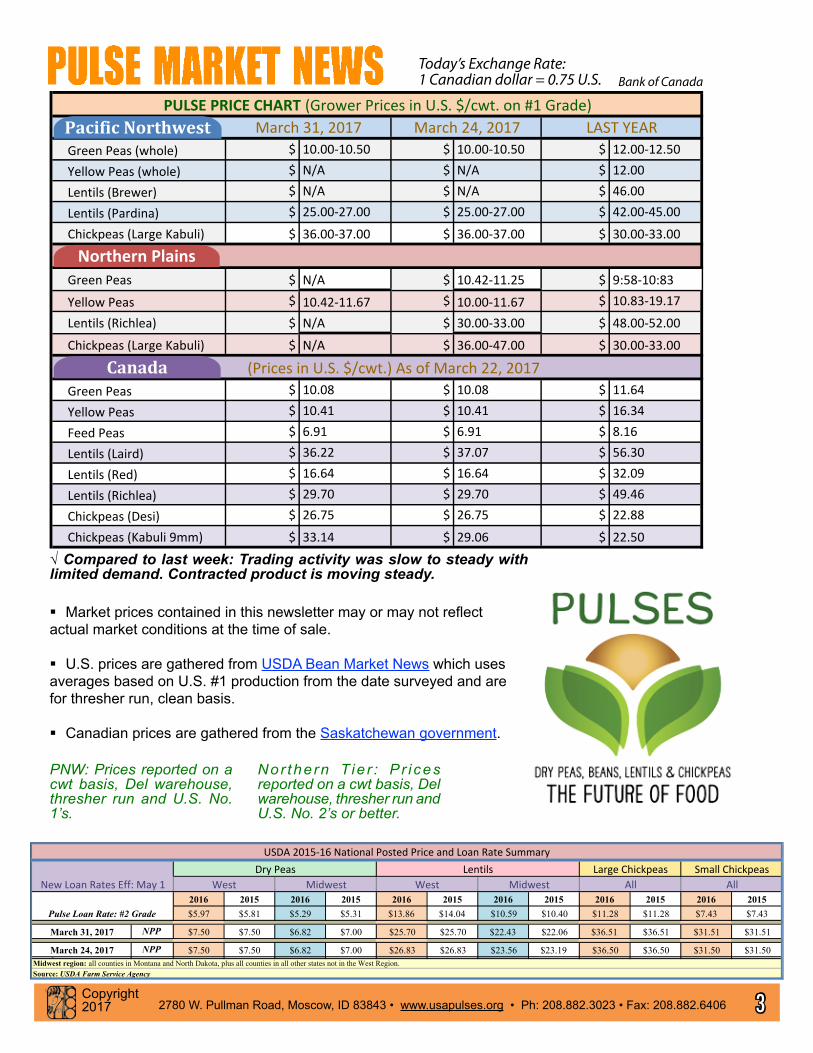
Today’s Exchange Rate: 1 Canadian dollar = 0.75 U.S.
� Market prices contained in this newsletter may or may not reflect actual market conditions at the time of sale.
� U.S. prices are gathered from USDA Bean Market News which uses averages based on U.S. #1 production from the date surveyed and are for thresher run, clean basis.
� Canadian prices are gathered from the Saskatchewan government.
√ Compared to last week: Trading activity was slow to steady with limited demand. Contracted product is moving steady.
Nor thern T ie r : P r i ces reported on a cwt basis, Del warehouse, thresher run and U.S. No. 2’s or better.
2016 2015 2016 2015 2016 2015 2016 2015 2016 2015 2016 2015$5.97 $5.81 $5.29 $5.31 $13.86 $14.04 $10.59 $10.40 $11.28 $11.28 $7.43 $7.43
March 31, 2017 NPP $7.50 $7.50 $6.82 $7.00 $25.70 $25.70 $22.43 $22.06 $36.51 $36.51 $31.51 $31.51
March 24, 2017 NPP $7.50 $7.50 $6.82 $7.00 $26.83 $26.83 $23.56 $23.19 $36.50 $36.50 $31.50 $31.50September 11, 2015 NPP $11.06 $11.06 $11.06 $11.06 $30.85 $30.85 $27.58 $27.21 $26.00 $26.00 $21.00 $21.00
All All
Pulse Loan Rate: #2 Grade
Midwest region: all counties in Montana and North Dakota, plus all counties in all other states not in the West Region.Source: USDA Farm Service Agency
USDA2015-16NationalPostedPriceandLoanRateSummary
NewLoanRatesEff:May1DryPeas Lentils LargeChickpeas SmallChickpeas
West Midwest West Midwest
PNW: Prices reported on a cwt basis, Del warehouse, thresher run and U.S. No. 1’s.
GreenPeas(whole) $ 10.00-10.50 $ 10.00-10.50 $ 12.00-12.50YellowPeas(whole) $ N/A $ N/A $ 12.00Lentils(Brewer) $ N/A $ N/A $ 46.00Lentils(Pardina) $ 25.00-27.00 $ 25.00-27.00 $ 42.00-45.00Chickpeas(LargeKabuli) $ 36.00-37.00 $ 36.00-37.00 $ 30.00-33.00
GreenPeas $ N/A $ 10.42-11.25 $ 9:58-10:83YellowPeas $ 10.42-11.67 $ 10.00-11.67 $ 10.83-19.17Lentils(Richlea) $ N/A $ 30.00-33.00 $ 48.00-52.00Chickpeas(LargeKabuli) $ N/A $ 36.00-47.00 $ 30.00-33.00
GreenPeas $ 10.08 $ 10.08 $ 11.64YellowPeas $ 10.41 $ 10.41 $ 16.34FeedPeas $ 6.91 $ 6.91 $ 8.16Lentils(Laird) $ 36.22 $ 37.07 $ 56.30Lentils(Red) $ 16.64 $ 16.64 $ 32.09Lentils(Richlea) $ 29.70 $ 29.70 $ 49.46Chickpeas(Desi) $ 26.75 $ 26.75 $ 22.88Chickpeas(Kabuli9mm) $ 33.14 $ 29.06 $ 22.50
(PricesinU.S.$/cwt.)AsofMarch22,2017
NorthernPlains
PULSEPRICECHART(GrowerPricesinU.S.$/cwt.on#1Grade)March31,2017 March24,2017 LASTYEARPacificNorthwest
NorthernPlains
Canada
Bank of Canada
Copyright2017 42780 W. Pullman Road, Moscow, ID 83843 • www.usapulses.org • Ph: 208.882.3023 • Fax: 208.882.6406
Ultimately, participants were tasked with discovering the areas of pulse milling that offer the greatest challenges and opportunities to bring pulses to the market. The following 7 challenges were identified:
1. Understanding and evaluating structure and function of pulse flours.
2. Flavor.3. Evaluating milling technology
links to product function.4. Breeding for enhanced
function.5. Develop standards and
specifications for whole pulse, flours etc.
6. Proof of Concepts for product applications.
7. Consumer awareness of the benefits of pulses.
Although consumer awareness is not necessarily a pulse milling research topic, it is a theme that drives many of the pulse milling endeavors. Will consumers accept the product? This was ranked as the greatest concern for the success of pulse product innovation. APA and USADPLC CEO Tim McGreevy followed this discussion by discussing the successes of the North American Marketing Campaign in the wake of the International Year of Pulses and discussed the work yet to be done in this area of pulse crop
awareness.
McGreevy stated, “The workshop interaction between participants was terrific and provided guidance on the next steps we need to take as an industry to grow the ingredient market in North America.”
In the next edition of The Pulse Pipeline, Director of Research Jeff Rumney will provide an overview of the presentations delivered at the inaugural Pulse Milling Workshop.
The Pulse Milling Workshop Presentations• Extrusion Processing of Pulse Ingredients - Chongjun Li, Ryan Kowalski,
Girish Ganjyal WSU School of Food Science• The Good and Challenge - Shannon Hood-Neifer – SK Food Centre-
Saskatchawan Extruded Snacks• Yellow Pea Inclusion in Breakfast Cereals - Shona Fraser Acting Project
Manager Pulse Flour Milling and Food Applications• Pulse Flavour and Functionality in Baked Goods - Shona Fraser Acting
Project Manager Pulse Flour Milling and Food Applications• Why Bakeries don’t use Pulses - Adam Dyck Warburtons• Pulse Flour in Pasta Applications - Michael Ehr - Buhler• Pulses in Pasta:Where are we now? - Shona Fraser Acting Project Manager
Pulse Flour Milling and Food Applications• Pulses and Instant Noodles: A Sticky Situation - Shona Fraser Acting Project
Manager Pulse Flour Milling and Food Applications• Hammer Milling of Yellow Peas - Clifford Hall III, Ph.D. Professor Director,
Pulse Quality & End Use Lab North Dakota State University• Results of Pulse Flour Milling Trials Roller milling technology & product
diversification Ashok Sarkar CIGI, Winnipeg, Canada• Rethinking Pulse Flour Development - Brennan Smith - University of Idaho • Evolution of Wheat Flour Processing Industry - Dr. Craig Morris USDA-ARS
Western Wheat Quality Lab, Pullman, WA• Flavor: Compounds of Interest and Methods to Deodorize Pulse Flours
- Clifford Hall III, Ph.D. Professor Director, Pulse Quality & End Use Lab North Dakota State University
• The Importance of Varietal Selection in the Utilization of Dry Beans as a Milled Flour - Karen A Cichy Research Plant Geneticist USDA-ARS
• Industrial Pulse Processing Systems Bühler Aidin Milani• Aspects of Pulse Structure, Composition, Milling and Functionality Bob Tyler,
Department of Food and Bioproduct Sciences University of Saskatchewan
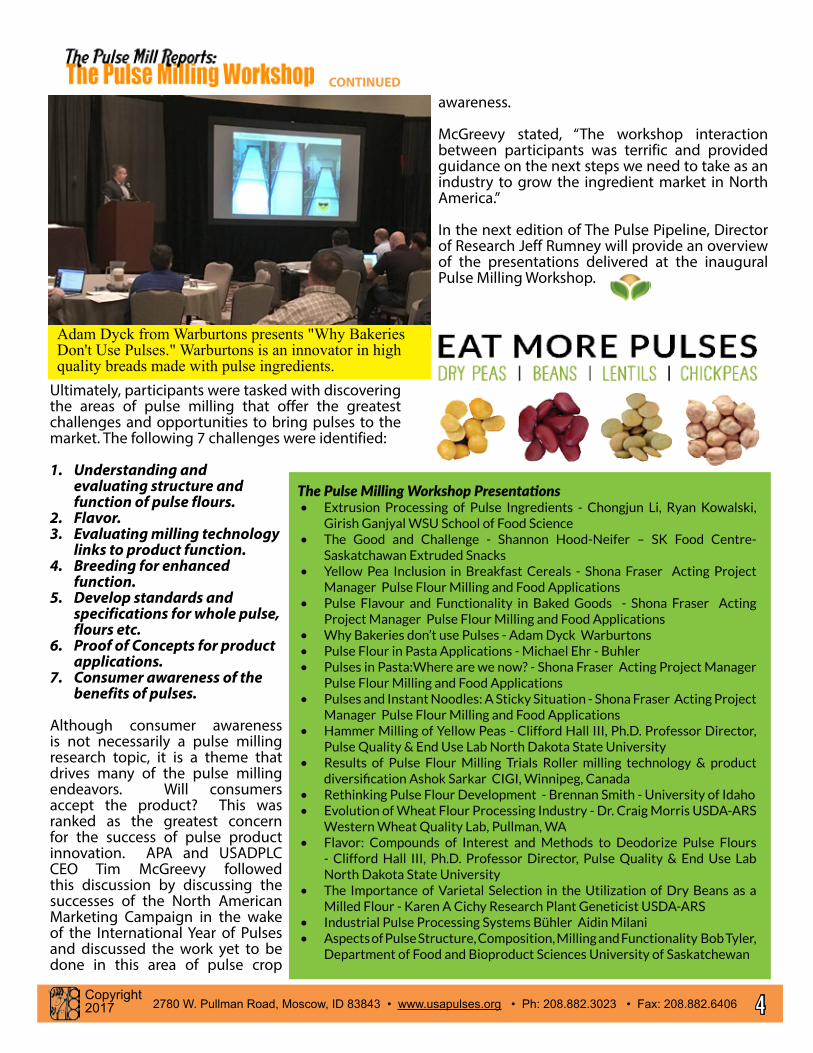
Adam Dyck from Warburtons presents "Why Bakeries Don't Use Pulses." Warburtons is an innovator in high quality breads made with pulse ingredients.
CONTINUED
Copyright2017 2780 W. Pullman Road, Moscow, ID 83843 • www.usapulses.org • Ph: 208.882.3023 • Fax: 208.882.6406 52780 W. Pullman Road, Moscow, ID 83843 • www.usapulses.org • Ph: 208.882.3023 • Fax: 208.882.6406
WWW.USAPULSES.ORG/PULSED
The Pulse Milling Workshop Presentations• Extrusion Processing of Pulse Ingredients - Chongjun Li, Ryan Kowalski,
Girish Ganjyal WSU School of Food Science• The Good and Challenge - Shannon Hood-Neifer – SK Food Centre-
Saskatchawan Extruded Snacks• Yellow Pea Inclusion in Breakfast Cereals - Shona Fraser Acting Project
Manager Pulse Flour Milling and Food Applications• Pulse Flavour and Functionality in Baked Goods - Shona Fraser Acting
Project Manager Pulse Flour Milling and Food Applications• Why Bakeries don’t use Pulses - Adam Dyck Warburtons• Pulse Flour in Pasta Applications - Michael Ehr - Buhler• Pulses in Pasta:Where are we now? - Shona Fraser Acting Project Manager
Pulse Flour Milling and Food Applications• Pulses and Instant Noodles: A Sticky Situation - Shona Fraser Acting Project
Manager Pulse Flour Milling and Food Applications• Hammer Milling of Yellow Peas - Clifford Hall III, Ph.D. Professor Director,
Pulse Quality & End Use Lab North Dakota State University• Results of Pulse Flour Milling Trials Roller milling technology & product
diversification Ashok Sarkar CIGI, Winnipeg, Canada• Rethinking Pulse Flour Development - Brennan Smith - University of Idaho • Evolution of Wheat Flour Processing Industry - Dr. Craig Morris USDA-ARS
Western Wheat Quality Lab, Pullman, WA• Flavor: Compounds of Interest and Methods to Deodorize Pulse Flours
- Clifford Hall III, Ph.D. Professor Director, Pulse Quality & End Use Lab North Dakota State University
• The Importance of Varietal Selection in the Utilization of Dry Beans as a Milled Flour - Karen A Cichy Research Plant Geneticist USDA-ARS
• Industrial Pulse Processing Systems Bühler Aidin Milani• Aspects of Pulse Structure, Composition, Milling and Functionality Bob Tyler,
Department of Food and Bioproduct Sciences University of Saskatchewan
They made it dramatically close, but India Plant Protection and
Quarantine (PPQ) announced yesterday they will extend the waiver that allows pulses imported from the US to be fumigated with methyl bromide after arrival in India.
The new waiver is for three months, and will expire on June 30, 2017.
This means that shipments now on the water will not be rejected under the fumigation rules when they arrive in India. The extension also specifies that the waiver will apply to U.S. shipments that have a ‘bill of lading’ date on or before June 30, 2017, which will help eliminate the uncertainty caused by the language of previous waivers, which set ‘arrival date’ as the standard for enforcement.
According to Pete Klaiber, Vice President of Marketing for the USADPLC, the rationale for granting an extension at this time is to provide a ‘window’ to find a permanent solution.
“We will continue to work with USDA APHIS in order to maintain market access in India. We are now in the process of working with USDA APHIS to bring India PPQ officials to the U.S. in July 2017,” stated Klaiber in a memo to the US Pea & Lentil Trade Association. “The PPQ team will review our pulse industry practices to determine if the risk of pest infestation is so low that fumigation is unnecessary.”
The visit will take place over two days in the Spokane area, and will include visits to a farm, a processing plant, and a grading facility.
“Our goal will be to demonstrate to the India PPQ visitors that fumigation is unnecessary because we have the systems, industry practices and safeguards that minimize the risk of pest infestation to the point that there is no need for fumigation – whether prior to export or upon arrival,” said Klaiber. On the upside, if the USADPLC succeeds in showing PPQ that U.S. pulse shipments are safe even
without fumigation, the waiver could become permanent.
On the downside, if the U.S. pulse industry fails to convince them that our shipments are safe, fumigation prior to export could become the rule. Because the PPQ visit will take place after the current waiver expires, APHIS has already opened discussions with PPQ on the need for an additional short-term waiver at the end of June to allow the PPQ team to complete its review of US pulse industry practices and report the results to the Minister of Agriculture.
Copyright2017 62780 W. Pullman Road, Moscow, ID 83843 • www.usapulses.org • Ph: 208.882.3023 • Fax: 208.882.6406
Using the harvested acres/planted acres ratio and 10 year average yields, we can make an early prediction on 2017 chickpea production:
SMALLCHICKPEAS 2016 2017 %ChangeU.S.Production(MT) 74,556 99,066 +33
LARGECHICKPEAS 2016 2017 %ChangeU.S.Production(MT) 151,941 223,204 +47
LENTILS Frankly, lentil acreage isn’t bad either. In fact, if realized, these numbers represent a record high for lentil plantings in the U.S., The U.S. is projected to pass the 1-million-acre mark with a 13% increase in lentil acreage. Montana and Washington are both increasing lentil acreage, and if you look at the last two years, Montana has become a rock star when it comes to planting lentils. 2017 represents a record high for Montana as well. Idaho and North Dakota have cooled on lentils a bit, but acreage still remains strong in all of the pulse growing states.
LENTILS 2015 2016 2017 % Change Idaho 33,000 38,000 35,000 -8 Montana 235,000 520,000 640,000 +23 North Dakota 165,000 305,000 300,000 -2 Washington 60,000 70,000 80,000 +14 U.S. 493,000 933,000 1,055,000 +13
Using the harvested acres/planted acres ratio and 10 year average yields, we can make an early prediction on 2017 lentil production:
LENTILS 2016 2017 % Change
U.S. Production (MT) 575,387 571,454 -0.5
DRY PEAS With chickpea acreage shooting to the stars, and lentil acreage on the rise as well, it is no surprise that at least one pulse crop is projected to take a hit in acreage. With dry pea prices lower than normal this year, dry pea acreage is likely to decline in Montana, North Dakota and Washington. Idaho and newcomers South Dakota are holding the torch, however, by increasing their acreage slightly. South Dakota increases slightly as well, and Oregon holds steady. If you look at the 2015 column, you’ll see that dry peas have a bit of catching up to do. It really comes down to price. Lentils and Chickpeas have been very solid in the Pulse Market News for the last three years. Will this mean rising prices for dry peas as production volumes decrease? Time will tell.
LENTILSFrankly, lentil acreage isn’t bad either. In fact, if realized, these numbers represent a record high for lentil plantings in the U.S., The U.S. is projected to pass the 1-million-acre mark with a 13% increase in lentil acreage.
Montana and Washington are both increasing lentil acreage, and if you look at the last two years, Montana has become a rock star when it comes to planting lentils. 2017 represents a record high for Montana as well. Idaho and North Dakota have cooled on lentils a bit, but acreage still remains strong in all of the pulse growing states.
CONTINUED
DRY PEASWith chickpea acreage shooting to the stars, and lentil acreage on the rise as well, it is no surprise that at least one pulse crop is projected to take a hit in acreage. With dry pea prices lower than normal this year, dry pea acreage is likely to decline in Montana, North Dakota and Washington. Idaho and newcomers South Dakota are holding the torch, however, by increasing their acreage slightly.
If you look at the 2015 column, you’ll see that dry peas have a bit of catching up to do. It really comes down to price. Lentils and Chickpeas have been very solid in the Pulse Market News for the last three years. Will this mean rising prices for dry peas as production volumes decrease? Time will tell.
AUSTRIAN WINTER PEASIdaho was the largest grower of AWP in the U.S. in 2016. However, Idaho acre-age for AWP has declined quite a bit. Since Montana’s AWP has stayed the same, it is the largest AWP producer for 2017 if these numbers hold. This winter pulse variety, grown primarily for their rotational benefits and for feed has de-clined by 32% in the U.S. overall.
LENTILSFrankly,lentilacreageisn’tbadeither.Infact,ifrealized,thesenumbersrepresentarecordhighforlentilplantingsintheU.S.TheU.S.hasbroachedthe1-million-acremarkandoverallisseeinga13%increaseinlentilacreage.MontanaandWashingtonarebothincreasinglentilacreage,andifyoulookatthelastthreeyears,Montanaisarockstarwhenitcomestoplantinglentils.2017representsarecordhighforMontanaaswell.IdahoandNorthDakotahavecooledonlentilsabit,butacreagestillremainsstronginallofthepulsegrowingstates.LENTILS 2015 2016 2017 %Up/DownIdaho 33,000 38,000 35,000 -8⬇Montana 235,000 520,000 640,000 ⬆23NorthDakota 165,000 305,000 300,000 -2⬇Washington 60,000 70,000 80,000 ⬆14U.S. 493,000 933,000 1,055,000 ⬆13
DRYPEASWithchickpeaacreageshootingtothestars,andlentilacreageontheriseaswell,itisexpectedthatatleastonepulsecropisgoingtotakeahitinacreage.Withdrypeapriceslowerthannormalthisyear,itisnosurprisethatdrypeaacreagehasdeclinedinMontana,NorthDakotaandWashington.IdahoandnewcomersSouthDakotaareholdingthetorch,however,increasingtheiracreageslightly.Oregonhasheldsteady,andSouthDakotaisincreasingslightlyaswell.Ifyoulookatthe2015column,you’llseethatdrypeashaveabitofcatchinguptodo.Itreallycomesdowntoprice.LentilsandChickpeashavebeenverysolidinthePulseMarketNewsforthelastthreeyears.WillthismeanpricesfordrypeaswillincreaseasSOHdecrease?Timewilltell.DRYPEAS 2015 2016 2017 %Up/DownIdaho 51,000 29,000 30,000 ⬆03Montana 595,000 610,000 460,000 -25⬇NorthDakota 385,000 560,000 500,000 -11⬇SouthDakota N/A 32,000 35,000 ⬆09Washington 105,000 90,000 65,000 -28⬇U.S. 1,143,000 1,382,000 1,141,000 -17⬇
AUSTRIANWINTERPEASIdahowasthelargestgrowerofAWPintheU.S.in2016.However,IdahoacreageforAWPhavedeclinedquiteabit.SinceMontana’sAWPhasstayedthesame,itisthelargestAWPproducerfor2017ifthesenumbershold.Thiswinterpulsevariety,grownprimarilyfortheirrotationalbenefitsandforfeedhasdeclinedby32%intheU.S.overall.
Using the harvested acres/planted acres ratio and 10 year average yields, we can make an early prediction on 2017 lentil production:
Using the harvested acres/planted acres ratio and 10 year average yields, we can make an early prediction on 2017 chickpea production:
SMALLCHICKPEAS 2016 2017 %ChangeU.S.Production(MT) 74,556 99,066 +33
LARGECHICKPEAS 2016 2017 %ChangeU.S.Production(MT) 151,941 223,204 +47
LENTILS Frankly, lentil acreage isn’t bad either. In fact, if realized, these numbers represent a record high for lentil plantings in the U.S., The U.S. is projected to pass the 1-million-acre mark with a 13% increase in lentil acreage. Montana and Washington are both increasing lentil acreage, and if you look at the last two years, Montana has become a rock star when it comes to planting lentils. 2017 represents a record high for Montana as well. Idaho and North Dakota have cooled on lentils a bit, but acreage still remains strong in all of the pulse growing states.
LENTILS 2015 2016 2017 % Change Idaho 33,000 38,000 35,000 -8 Montana 235,000 520,000 640,000 +23 North Dakota 165,000 305,000 300,000 -2 Washington 60,000 70,000 80,000 +14 U.S. 493,000 933,000 1,055,000 +13
Using the harvested acres/planted acres ratio and 10 year average yields, we can make an early prediction on 2017 lentil production:
LENTILS 2016 2017 %ChangeU.S.Production(MT) 575,387 571,454 -0.5
DRY PEAS With chickpea acreage shooting to the stars, and lentil acreage on the rise as well, it is no surprise that at least one pulse crop is projected to take a hit in acreage. With dry pea prices lower than normal this year, dry pea acreage is likely to decline in Montana, North Dakota and Washington. Idaho and newcomers South Dakota are holding the torch, however, by increasing their acreage slightly. South Dakota increases slightly as well, and Oregon holds steady. If you look at the 2015 column, you’ll see that dry peas have a bit of catching up to do. It really comes down to price. Lentils and Chickpeas have been very solid in the Pulse Market News for the last three years. Will this mean rising prices for dry peas as production volumes decrease? Time will tell.
Using the harvested acres/planted acres ratio and 10 year average yields, we can make an early prediction on 2017 dry pea production:
DRY PEAS 2015 2016 2017 % Change Idaho 51,000 29,000 30,000 +3 Montana 595,000 610,000 460,000 -25 North Dakota 385,000 560,000 500,000 -11 South Dakota N/A 32,000 35,000 +9 Washington 105,000 90,000 65,000 -28 U.S. 1,143,000 1,382,000 1,141,000 -17
Using the harvested acres/planted acres ratio and 10 year average yields, we can make an early prediction on 2017 dry pea production:
DRYPEAS 2016 2017 %ChangeU.S.Production(MT) 1,255,911 912,060 -27
AUSTRIAN WINTER PEAS Idaho was the largest grower of AWP in the U.S. in 2016. However, Idaho acreage for AWP have declined quite a bit. Since Montana’s AWP has stayed the same, it is the largest AWP producer for 2017 if these numbers hold. This winter pulse variety, grown primarily for their rotational benefits and for feed has declined by 32% in the U.S. overall.
AWP 2015 2016 2017 % Change Idaho 13,000 18,000 6,000 -67 Montana 15,000 15,000 15,000 -0- Oregon 6,000 5,000 5,000 -0- U.S. 34,000 38,000 26,000 -32
CONCLUSION If these acreage projections hold, total pulse acreage will increase in the United States in 2017 by about 2%. Chickpeas and lentils will see large increases overall (respectively), while dry pea plantings will decline. Could this projection change? Since these NASS figures are based solely on reports of pulse farmer’s intentions, and expect a sampling error of 1-3 percent, they certainly can. And, people change their minds. It is possible that reading these NASS projections alone has a few farmers on the fence. The USA Dry Pea and Lentil Council is currently conducting their own industry-wide survey and will publish the results in a future edition of the Pulse Pipeline. 2017 U.S. Dry Pea, Lentil and Chickpea Acreage
U.S. Pulses 2015 2016 2017 % Change Chickpeas 207,500 325,300 498,000 +53 Lentils 493,000 933,000 1,055,00 +13
CONTINUED ON PG. 7>>
Using the harvested acres/planted acres ratio and 10 year average yields, we can make an early prediction on 2017 chickpea production:
AWP 2015 2016 2017 %Up/DownIdaho 13,000 18,000 6,000 -66⬇Montana 15,000 15,000 15,000 --Oregon 6,000 5,000 5,000 --U.S. 34,000 38,000 26,000 -32⬇
CONCLUSIONIftheseacreageprojectionshold,totalpulseacreagewillincreaseintheUnitedStatesin2017byalittlelessthan2%.Chickpeasandlentilswillseelargeincreasesoverall(respectively),whiledrypeaplantingswilldecline.Couldthisprojectionchange?SincetheseNASSfiguresarebasedsolelyonreportsofpulsefarmer’sintentions,andexpectasamplingerrorof1-3percent,theycertainlycan.And,peoplechangetheirminds.ItispossiblethatreadingtheseNASSprojectionsalonehasafewfarmersonthefence.TheUSADryPeaandLentilCounciliscurrentlyconductingtheirownindustry-widesurveyandwillpublishtheresultsinafutureeditionofthePulsePipeline.2017U.S.DryPea,LentilandChickpeaAcreageU.S.Pulses 2015 2016 2017 %Up/DownChickpeas 207,500 325,300 498,000 ⬆53Lentils 493,000 933,000 1,055,00 ⬆13DryPeas 1,143,000 1,382,000 1,141,000 -17⬇AWP 34,000 38,000 26,000 -32⬇TOTAL 1,877,500 2,678,300 2,720,000 ⬆2
Copyright2017 2780 W. Pullman Road, Moscow, ID 83843 • www.usapulses.org • Ph: 208.882.3023 • Fax: 208.882.6406 72780 W. Pullman Road, Moscow, ID 83843 • www.usapulses.org • Ph: 208.882.3023 • Fax: 208.882.6406
CONCLUSIONIf these acreage projections hold, total pulse acreage will increase in the United States in 2017 by a little less than 2%. Chickpeas and lentils will see large increases overall (respectively), while dry pea plantings will de-cline. Could this projection change? Since these NASS figures are based solely on reports of pulse farmer’s intentions, and expect a sampling error of 1-3 percent, they certainly can. And, people change their minds. It is possible that reading these NASS projections alone has a few farmers on the fence. The USA Dry Pea and Lentil Council is currently conducting their own industry-wide survey and will publish the results in a future edition of the Pulse Pipeline.
APRIL4 USPLTA Meeting4-5 USADPLC Brd. Meeting12 APA Board Meeting24-29 Codex Committee Meeting on Pesticide Regulations (CODEX CPR)
Tim, McGreevy, CEO [email protected] Rhoades, Editor [email protected]
USA Dry Pea and Lentil Council2780 W Pullman RoadMoscow, Idaho 83843208-882-3023 www.usapulses.orgAll rights reserved. 2017.
THE USADPLC IS AN EQUALOPPORTUNITY EMPLOYER AND PROVIDER.
AWP 2015 2016 2017 %Up/DownIdaho 13,000 18,000 6,000 -66⬇Montana 15,000 15,000 15,000 --Oregon 6,000 5,000 5,000 --U.S. 34,000 38,000 26,000 -32⬇
CONCLUSIONIftheseacreageprojectionshold,totalpulseacreagewillincreaseintheUnitedStatesin2017byalittlelessthan2%.Chickpeasandlentilswillseelargeincreasesoverall(respectively),whiledrypeaplantingswilldecline.Couldthisprojectionchange?SincetheseNASSfiguresarebasedsolelyonreportsofpulsefarmer’sintentions,andexpectasamplingerrorof1-3percent,theycertainlycan.And,peoplechangetheirminds.ItispossiblethatreadingtheseNASSprojectionsalonehasafewfarmersonthefence.TheUSADryPeaandLentilCounciliscurrentlyconductingtheirownindustry-widesurveyandwillpublishtheresultsinafutureeditionofthePulsePipeline.2017U.S.DryPea,LentilandChickpeaAcreageU.S.Pulses 2015 2016 2017 %Up/DownChickpeas 207,500 325,300 498,000 ⬆53Lentils 493,000 933,000 1,055,00 ⬆13DryPeas 1,143,000 1,382,000 1,141,000 -17⬇AWP 34,000 38,000 26,000 -32⬇TOTAL 1,877,500 2,678,300 2,720,000 ⬆2
CONTINUED