Embed Size (px)
Citation preview

Pulp, Paper and Paperboard Markets
Gradual Upturn Underwayafter Recent Downturn
UNECE Market Discussion, September 2002
A steep downturn in industrial production (and GDP growth) in North America and Europe resulted in receding demands for paper & paperboard in packaging and print advertising media in 2001
An upturn appears underway in 2002 for pulp, paper and paperboard markets, but recovery is likely to be gradual

North American paperboard output in the first half of 2002 is up by about 1% relative to first half 2001
The upturn in paperboard output follows the upturn in overall industrial production
3,300
3,500
3,700
3,900
1997 1998 1999 2000 2001 2002
Mo
nth
ly P
rod
uc
tio
n (
'00
0 m
.t.)
-10
-5
0
5
10
Ye
ar-
ove
r-ye
ar
cha
ng
e (
%)
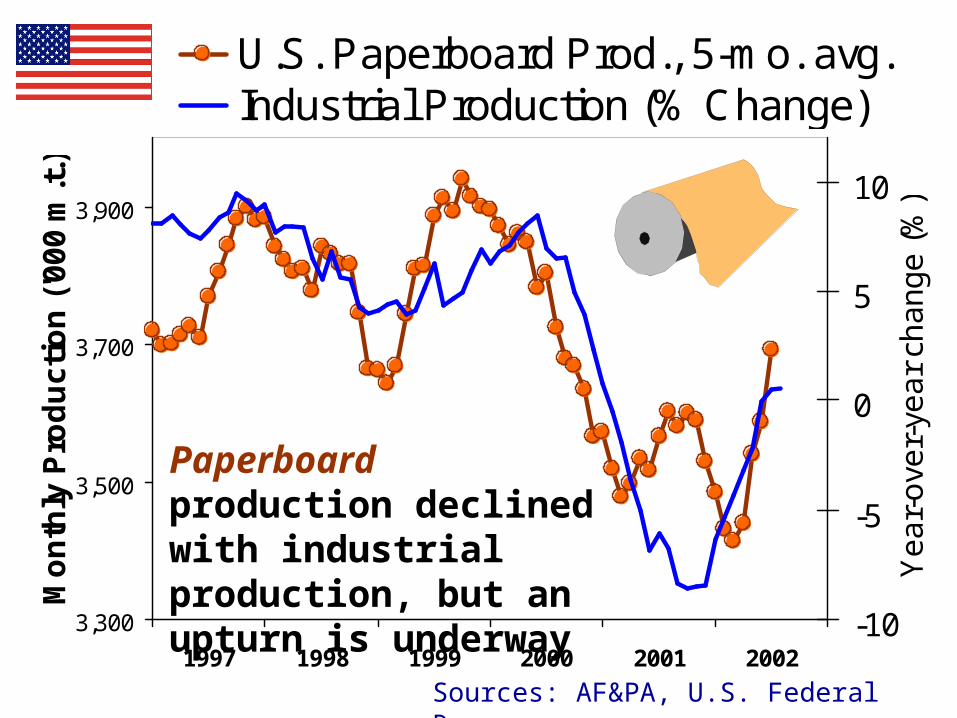
U.S. Paperboard Prod., 5-mo. avg.Industrial Production (% Change)
Sources: AF&PA, U.S. Federal Reserve
Paperboard production declined with industrial production, but an upturn is underway
North American paper output in the first half of 2002 was down by about - 6% relative to first half 2001
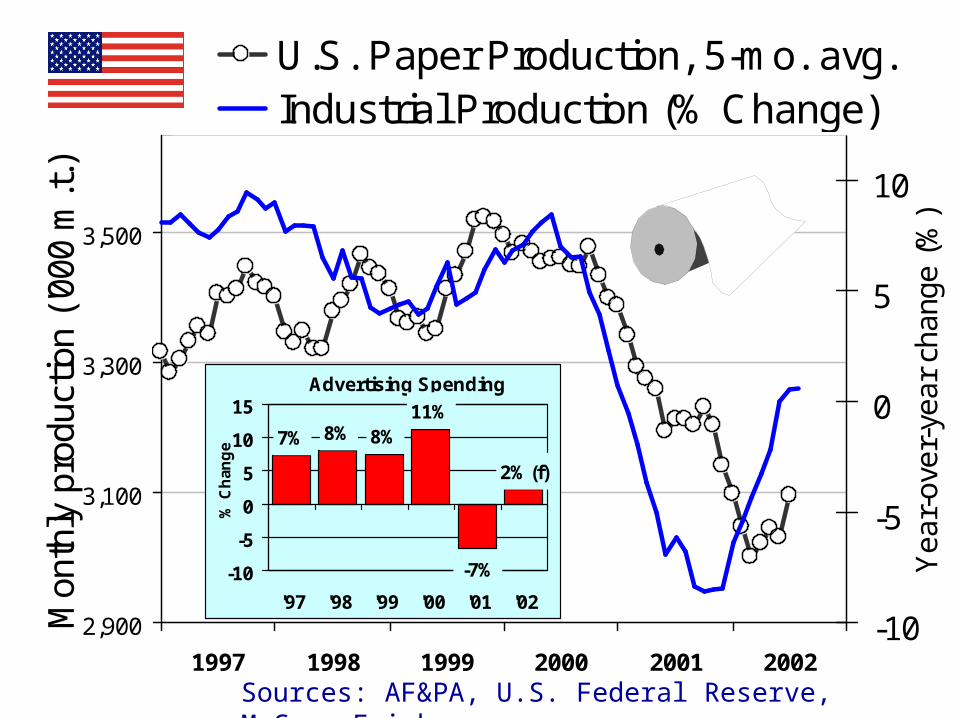
An upturn in paper production is underway but lagging, mainly due to steep declines in advertising expenditures in 2001
2,900
3,100
3,300
3,500
1997 1998 1999 2000 2001 2002
Mon
thly
pro
duct
ion
('000
m.t
.)
-10
-5
0
5
10
Yea
r-ov
er-y
ear
chan
ge (
%)
U.S. Paper Production, 5-mo. avg.Industrial Production (% Change)
Sources: AF&PA, U.S. Federal Reserve, McCann Erickson
Advertising Spending
-7%
11%8%8%7%
2%(f)
-10
-5
0
5
10
15
'97 '98 '99 '00 '01 '02
% C
han
ge
The recent downturn follows a period of consolidation and structural change within the pulp & paper sector.
With higher capacity concentration in paper & paperboard, price impacts of the downturn were offset by strategic adjustments (mill closures, etc.), and price volatility was passed down along the supply chain . . .
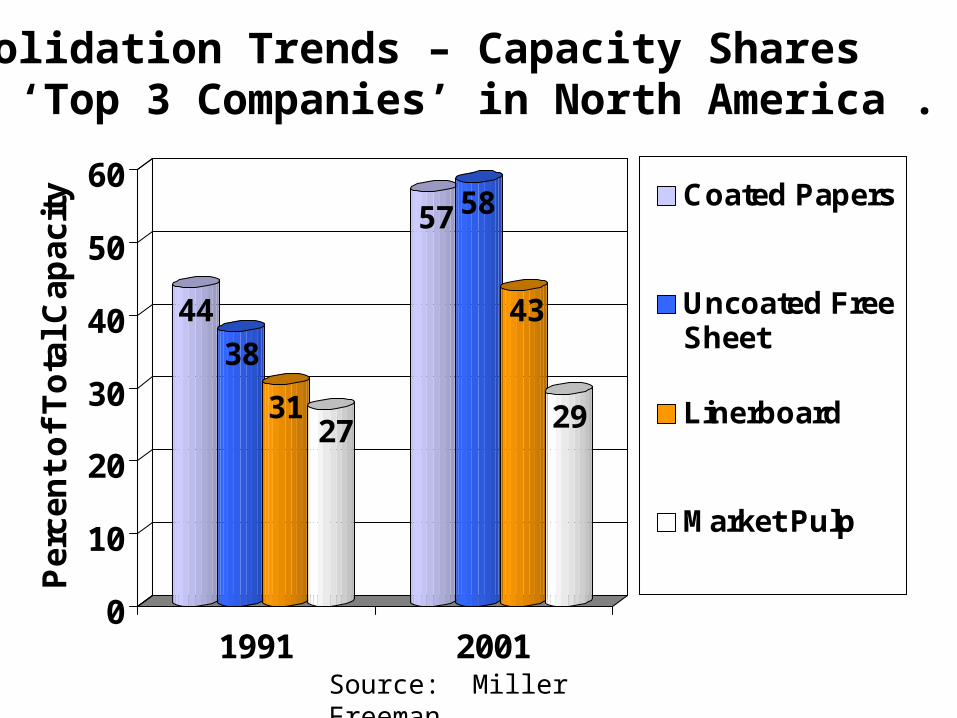
Consolidation Trends – Capacity Shares of ‘Top 3 Companies’ in North America . . .
Source: Miller Freeman
44
38
3127
57 58
43
29
0
10
20
30
40
50
60
Pe
rce
nt
of
To
tal
Ca
pa
cit
y
1991 2001
Coated Papers
Uncoated FreeSheet
Linerboard
Market Pulp
100
150
2000 2001 2002
Pri
ce I
nd
ex,
mo
nth
ly (
1982
= 1
00)
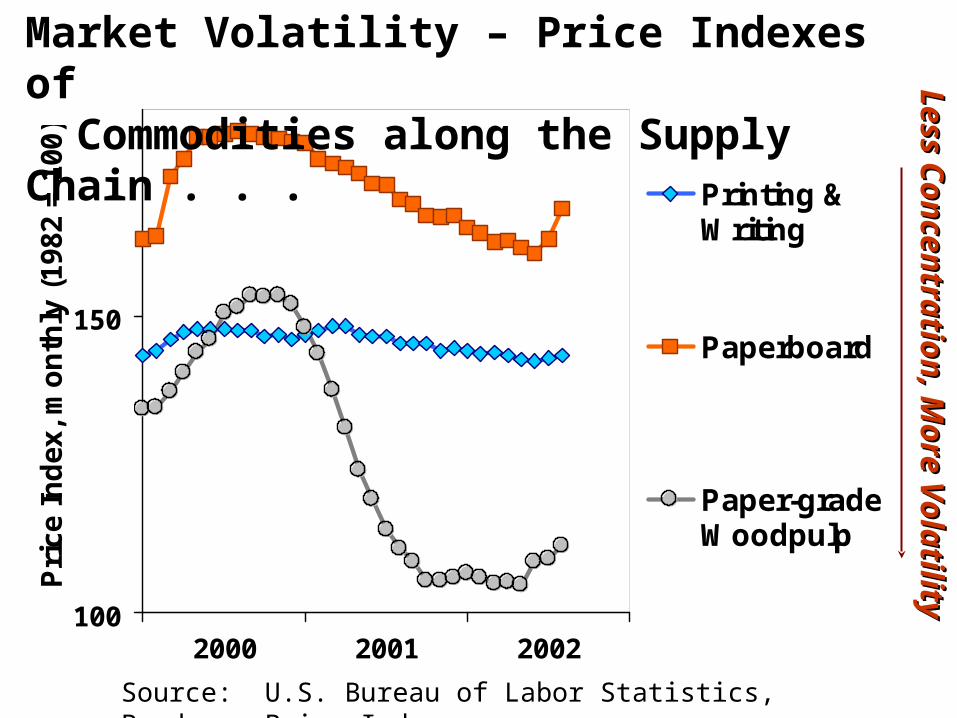
Printing &Writing
Paperboard
Paper-gradeWoodpulp
Market Volatility – Price Indexes of Commodities along the Supply Chain . . .
Source: U.S. Bureau of Labor Statistics, Producer Price Indexes
Less C
on
centratio
n, M
ore V
olatility
Less C
on
centratio
n, M
ore V
olatility
The global pulp market collapsed from mid-year 2000 through 2001, but turned upward in the first half of 2002
In the past several months, pulp prices have subsided with another short-term buildup of pulp inventory, but the longer term (futures) outlook remains positive with a declining inventory trend
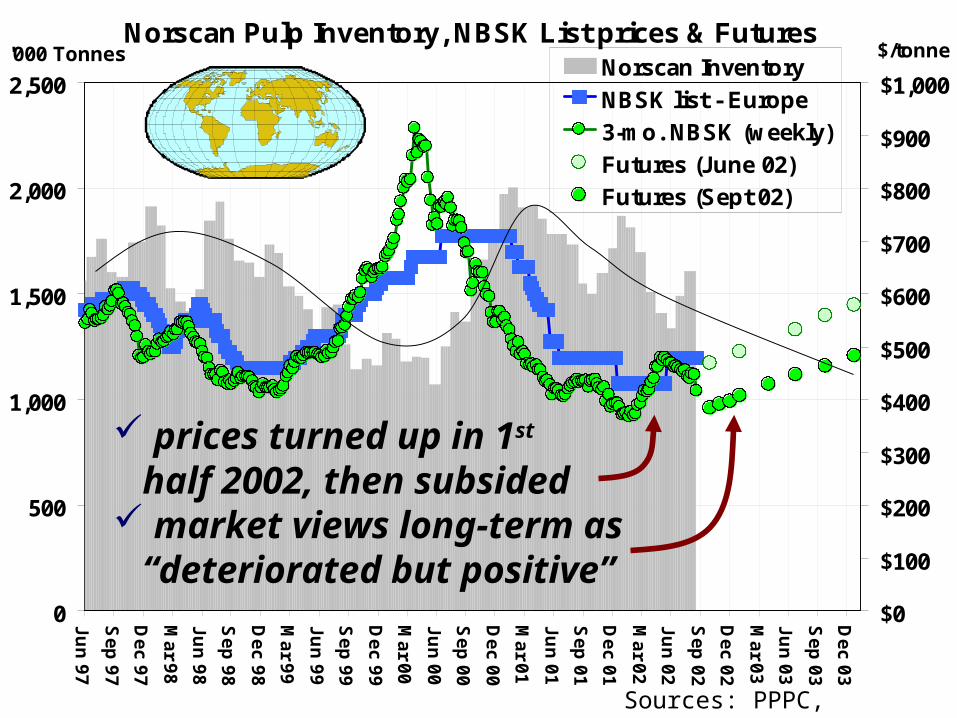
Norscan Pulp Inventory, NBSK List prices & Futures
0
500
1,000
1,500
2,000
2,500
Ju
n 9
7
Se
p 9
7
De
c 9
7
Ma
r 98
Ju
n 9
8
Se
p 9
8
De
c 9
8
Ma
r 99
Ju
n 9
9
Se
p 9
9
De
c 9
9
Ma
r 00
Ju
n 0
0
Se
p 0
0
De
c 0
0
Ma
r 01
Ju
n 0
1
Se
p 0
1
De
c 0
1
Ma
r 02
Ju
n 0
2
Se
p 0
2
De
c 0
2
Ma
r 03
Ju
n 0
3
Se
p 0
3
De
c 0
3
'000 Tonnes
$0
$100
$200
$300
$400
$500
$600
$700
$800
$900
$1,000
$/tonneNorscan Inventory
NBSK list - Europe
3-mo. NBSK (weekly)
Futures (June 02)
Futures (Sept 02)
prices turned up in 1st half 2002, then subsided market views long-term as “deteriorated but positive”
Sources: PPPC, PULPEX
Other Aspects of the Downturn:
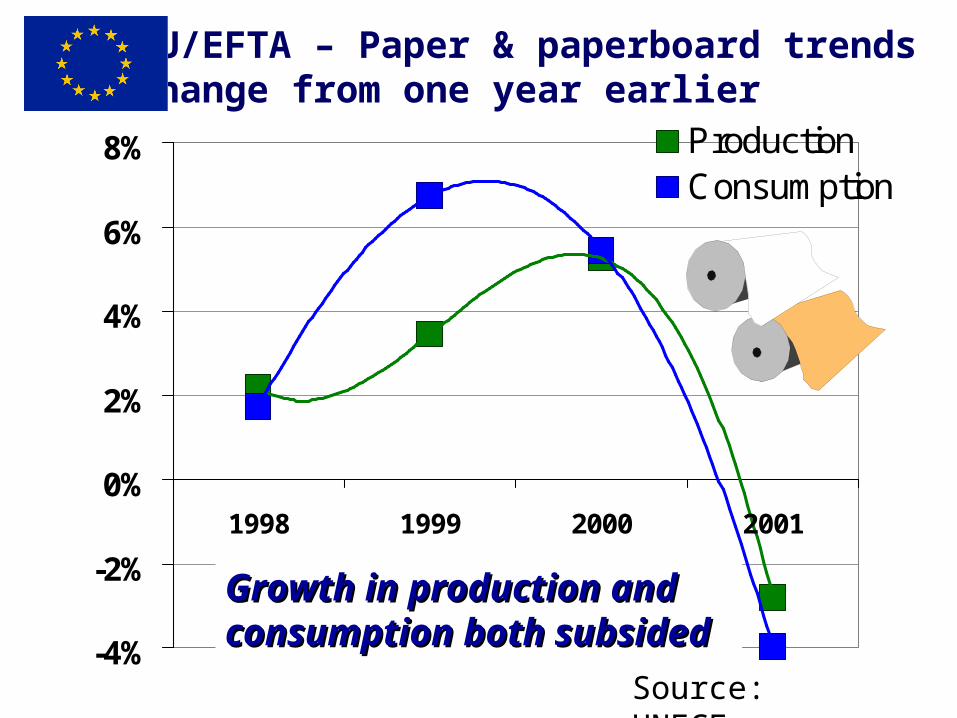
EU/EFTA production dropped -3% as consumption fell by -4% in 2001
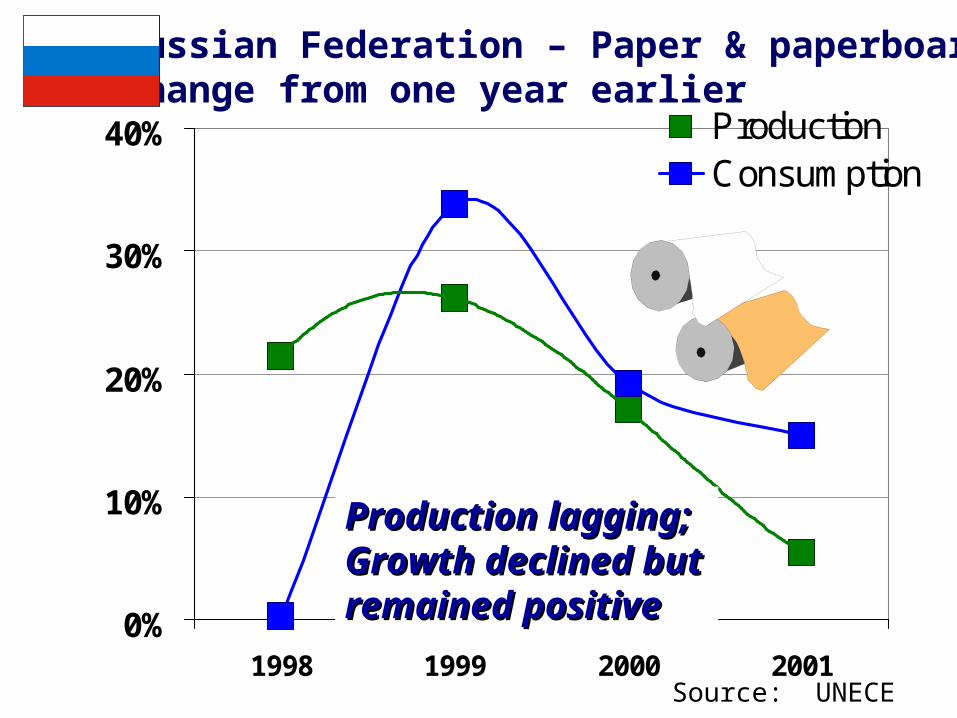
Growth rates for the Russian Federation also dropped, although growth remained positive; the trade balance drifted into a deficit
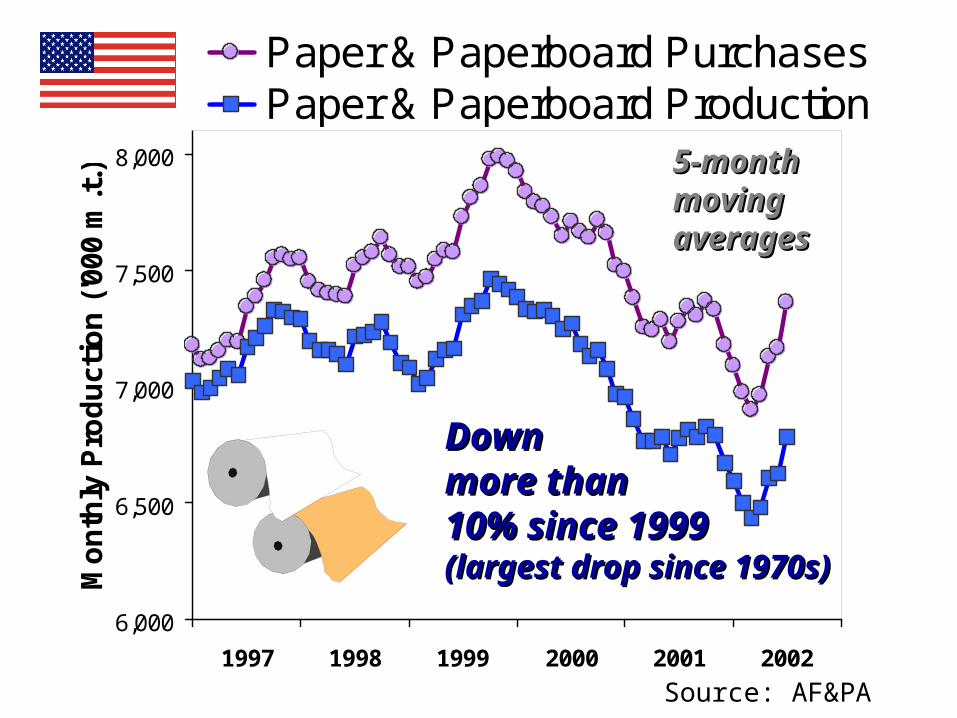
U.S. purchases and production of paper & paperboard dropped by >10% since 1999
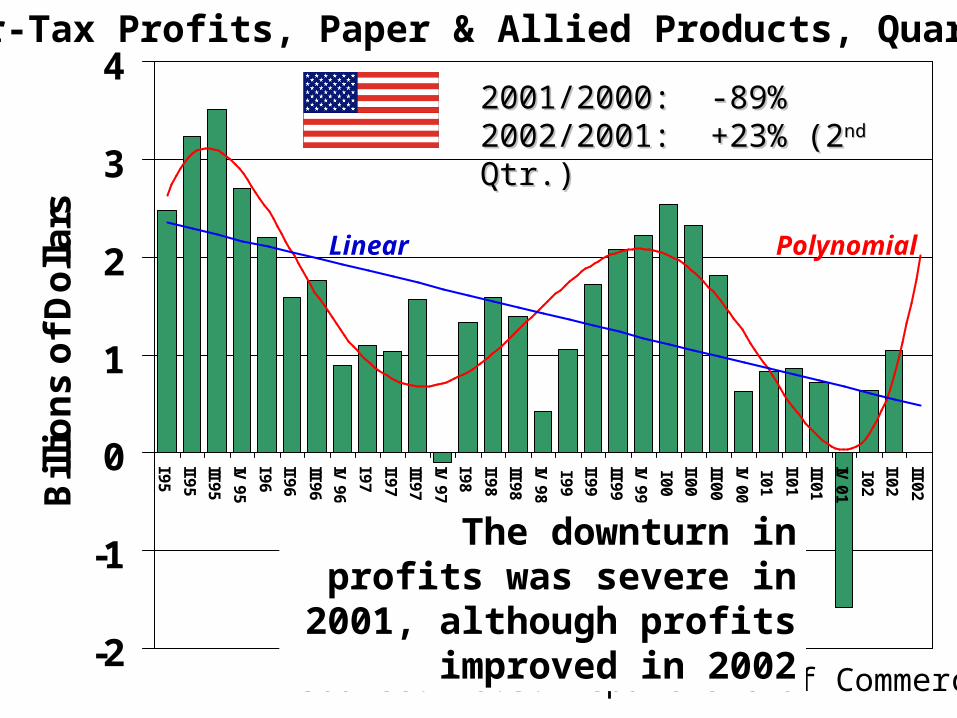
Industry profits were severely impacted (as were capacity growth and investment) although profits turned upward in 2002
Long-term sustainability of pulpwood demand becomes an issue for the United States
-4%
-2%
0%
2%
4%
6%
8%
1998 1999 2000 2001
ProductionConsumption
EU/EFTA – Paper & paperboard trendsChange from one year earlier
Source: UNECE
Growth in production and Growth in production and consumption both subsidedconsumption both subsided
0%
10%
20%
30%
40%
1998 1999 2000 2001
ProductionConsumption
Russian Federation – Paper & paperboardChange from one year earlier
Source: UNECE
Production lagging; Production lagging; Growth declined but Growth declined but remained positiveremained positive
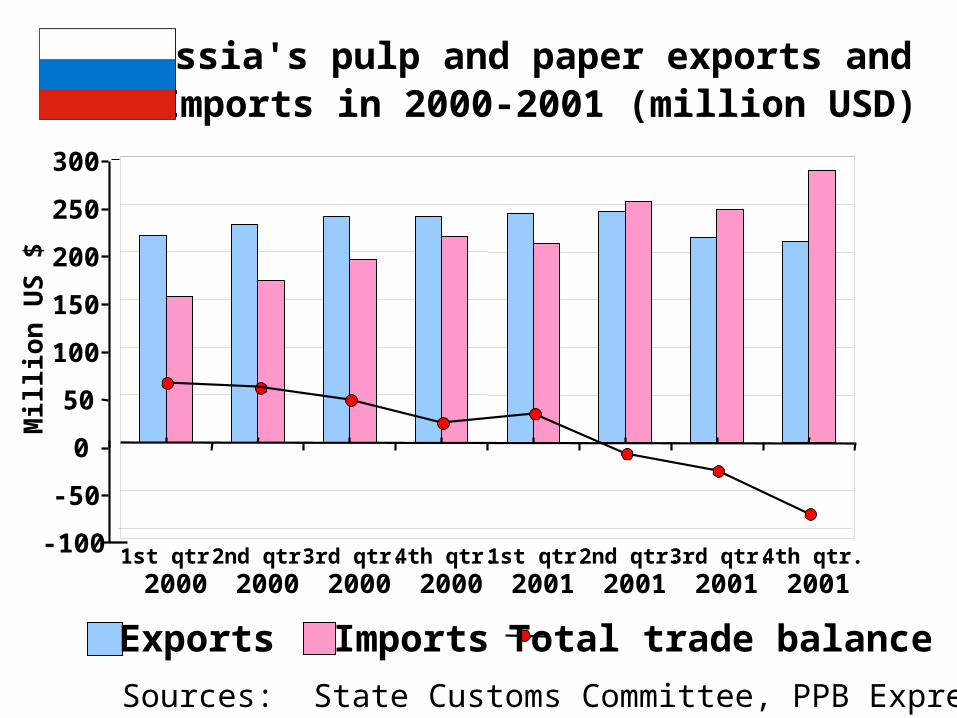
Russia's pulp and paper exports and Imports in 2000-2001 (million USD)
-100
-50
0
50
100
150
200
250
300
1st qtr.2000
2nd qtr.2000
3rd qtr.2000
4th qtr.2000
1st qtr.2001
2nd qtr.2001
3rd qtr.2001
4th qtr.2001
Mill
ion
US
$
Exports Imports Total trade balance
Sources: State Customs Committee, PPB Express
6,000
6,500
7,000
7,500
8,000
1997 1998 1999 2000 2001 2002
Mo
nth
ly P
rod
uct
ion
('0
00 m
.t.)
Paper & Paperboard PurchasesPaper & Paperboard Production
Source: AF&PA
Down Down more than more than 10% since 199910% since 1999(largest drop since 1970s)(largest drop since 1970s)
5-month 5-month movingmovingaveragesaverages
-2
-1
0
1
2
3
4
I 95
II 95
III 95
IV 9
5
I 96
II 96
III 96
IV 9
6
I 97
II 97
III 97
IV 9
7
I 98
II 98
III 98
IV 9
8
I 99
II 99
III 99
IV 9
9
I 00
II 00
III 00
IV 0
0
I 01
II 01
III 01
IV 0
1
I 02
II 02
III 02B
illio
ns
of
Do
llars
After-Tax Profits, Paper & Allied Products, Quarterly
Source: U.S. Department of Commerce
The downturn in profits was severe in 2001, although profits improved in 2002
2001/2000: -89%2001/2000: -89%2002/2001: +23% (22002/2001: +23% (2ndnd Qtr.) Qtr.)
Linear Polynomial
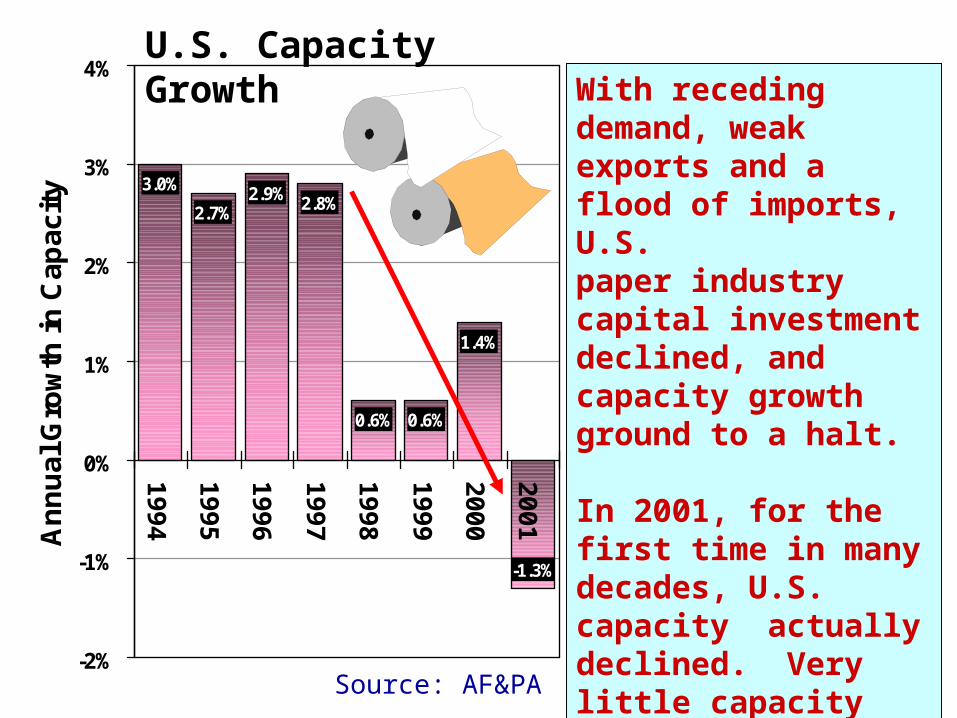
3.0%
2.7%2.9% 2.8%
0.6% 0.6%
1.4%
-1.3%
-2%
-1%
0%
1%
2%
3%
4%
19
94
19
95
19
96
19
97
19
98
19
99
20
00
20
01
An
nu
al G
row
th in
Cap
acit
y
With receding demand, weak exports and a flood of imports, U.S.paper industry capital investment declined, and capacity growthground to a halt.
In 2001, for the first time in many decades, U.S. capacity actually declined. Very little capacity growth is anticipated in the next several years.
U.S. Capacity Growth
Source: AF&PA
0
5
10
15
20
25
1984 1987 1990 1993 1996 1999 2002
$/cu
bic
met
er
ALA FLA
GA LA
N.C. VA
S.C. AVG.
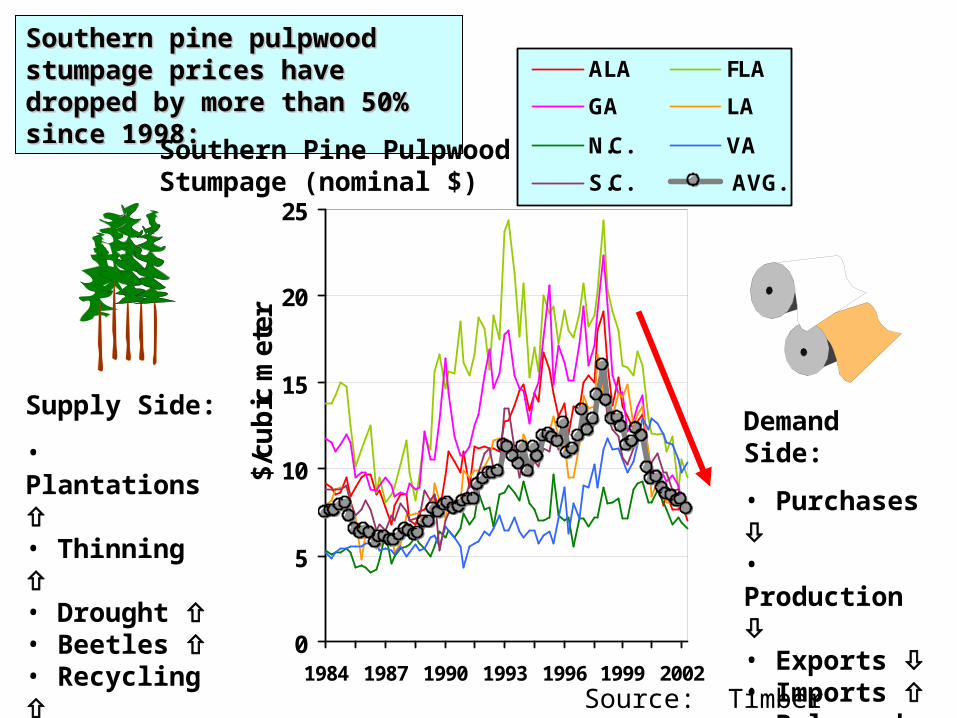
Southern pine pulpwood Southern pine pulpwood stumpage prices have dropped stumpage prices have dropped by more than 50% since 1998:by more than 50% since 1998:
Southern Pine PulpwoodStumpage (nominal $)
Supply Side:
• Plantations • Thinning • Drought • Beetles • Recycling • Sawmill Residues
Demand Side:
• Purchases • Production • Exports • Imports • Pulpwood Exports
Source: Timber Mart-South
0
60
120
180
240
1970 1980 1990 2000 2010 2020
Pu
lpw
oo
d, M
illio
ns
of
cu
bic
me
ters
0
20
40
60
80
Wo
od
Pu
lp, M
illio
ns
of
m.t
.
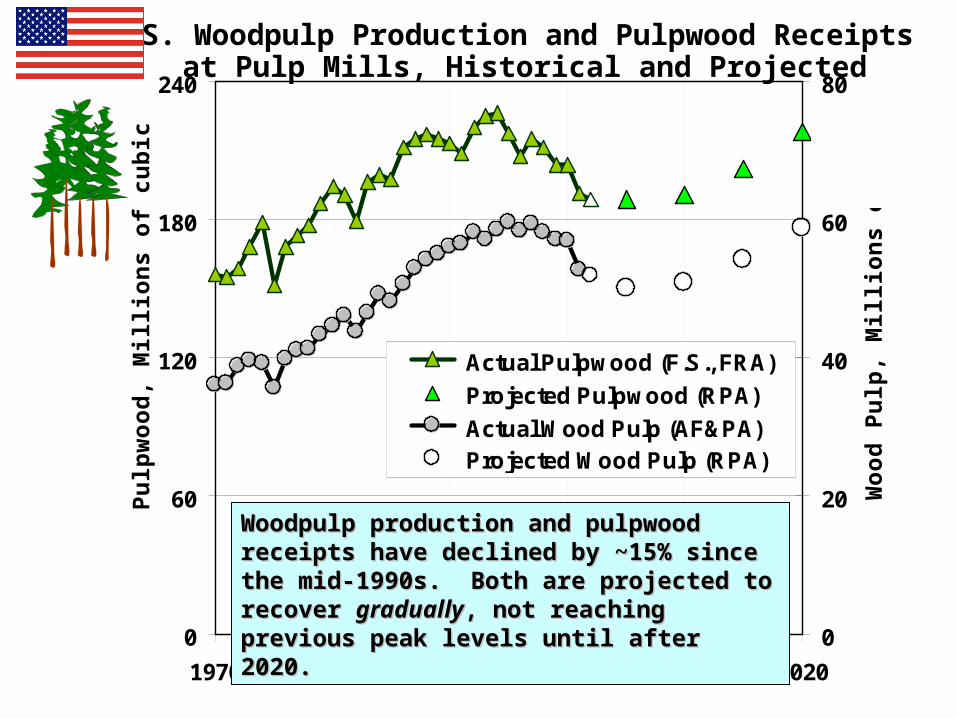
Actual Pulpwood (F.S., FRA)
Projected Pulpwood (RPA)
Actual Wood Pulp (AF&PA) Projected Wood Pulp (RPA)
U.S. Woodpulp Production and Pulpwood Receipts at Pulp Mills, Historical and Projected
Woodpulp production and pulpwood receipts Woodpulp production and pulpwood receipts have declined by ~15% since the mid-1990s. have declined by ~15% since the mid-1990s. Both are projected to recover Both are projected to recover graduallygradually, not , not reaching previous peak levels until after 2020.reaching previous peak levels until after 2020.
Macro Perspectives:
An upturn in GDP & industrial output is clearly underway, but a secondary slowdown or “double-dip” is still viewed as a concern. There is still a long climb ahead to full recovery of growth in GDP and industrial output
-1%
0%
1%
2%
3%
4%
5%
III98
IV98
I99
II99
III99
IV99
I00
II00
III00
IV00
I01
II01
III01
IV01
I02
II02
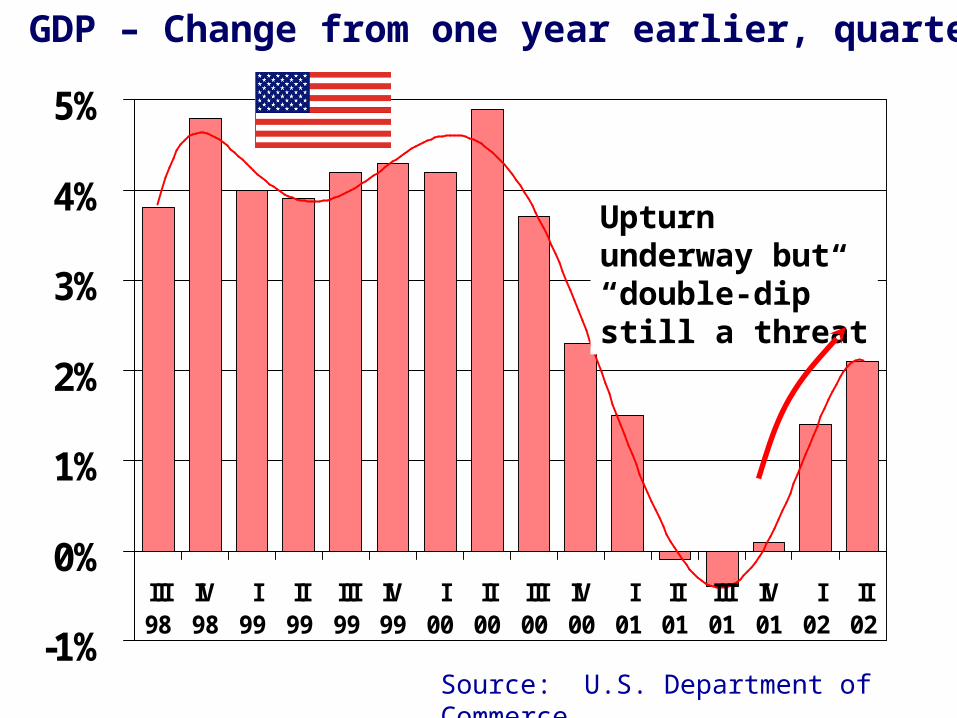
U.S. GDP – Change from one year earlier, quarterly
Source: U.S. Department of Commerce
Upturn underway but “double-dip” still a threat
0%
1%
2%
3%
4%
III98
IV98
I99
II99
III99
IV99
I00
II00
III00
IV00
I01
II01
III01
IV01
I02
II02
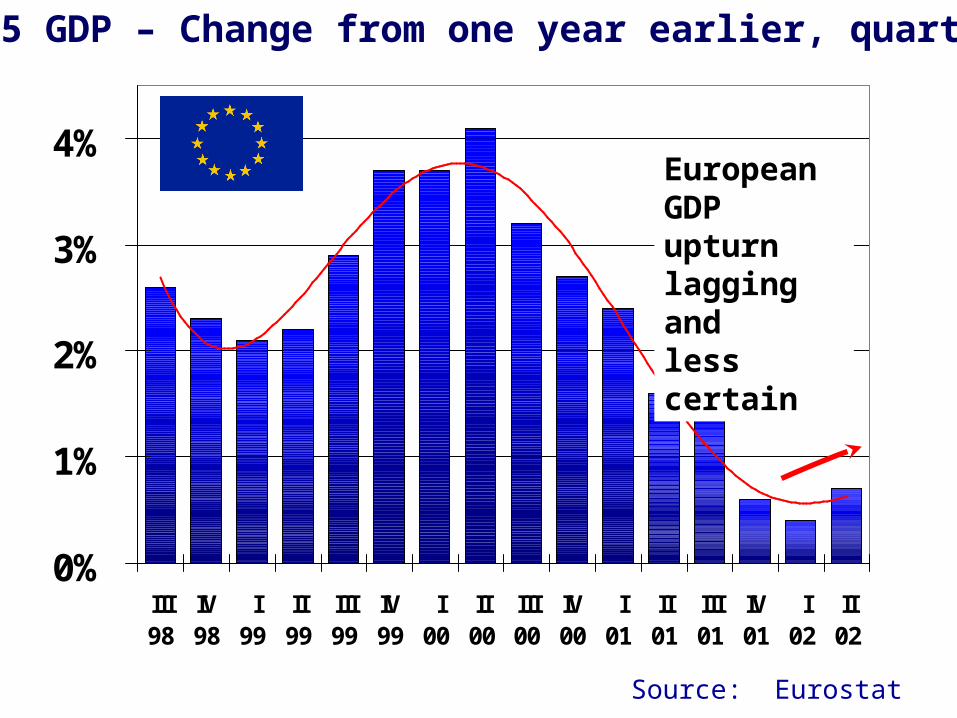
EU-15 GDP – Change from one year earlier, quarterly
Source: Eurostat
European GDP upturn lagging and less certain
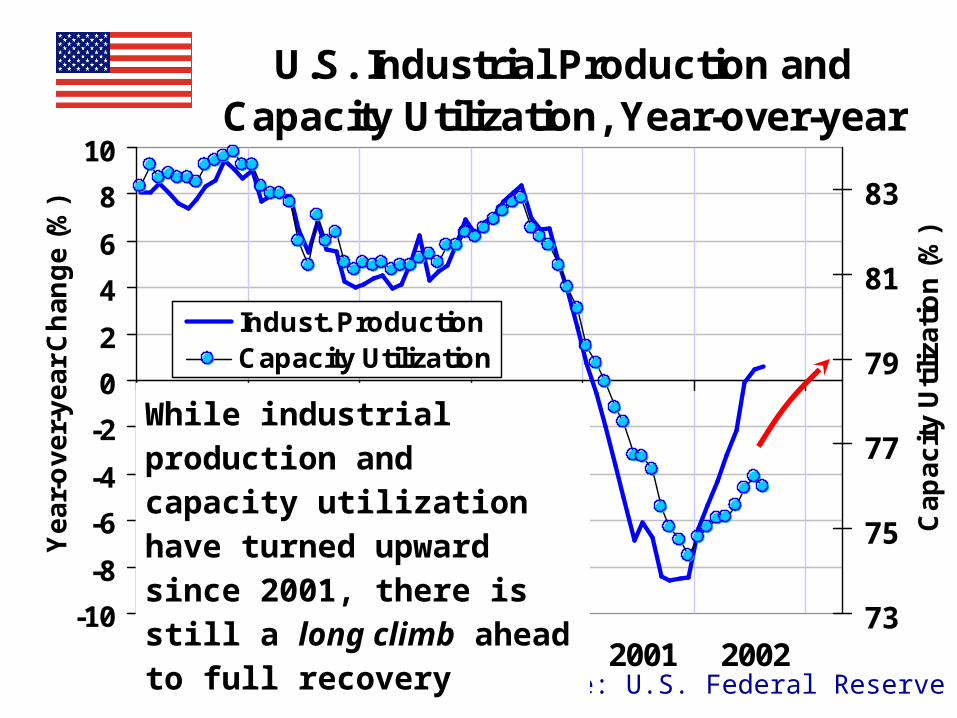
U.S. Industrial Production and Capacity Utilization, Year-over-year
-10
-8
-6
-4
-2
0
2
4
6
8
10
1997 1998 1999 2000 2001 2002
Ye
ar-
ov
er-
ye
ar
Ch
an
ge
(%
)
73
75
77
79
81
83
Ca
pa
cit
y U
tiliz
ati
on
(%
)
Indust. ProductionCapacity Utilization
Source: U.S. Federal Reserve
While industrial production and capacity utilization have turned upward since 2001, there is still a long climb ahead to full recovery
-10
-8
-6
-4
-2
0
2
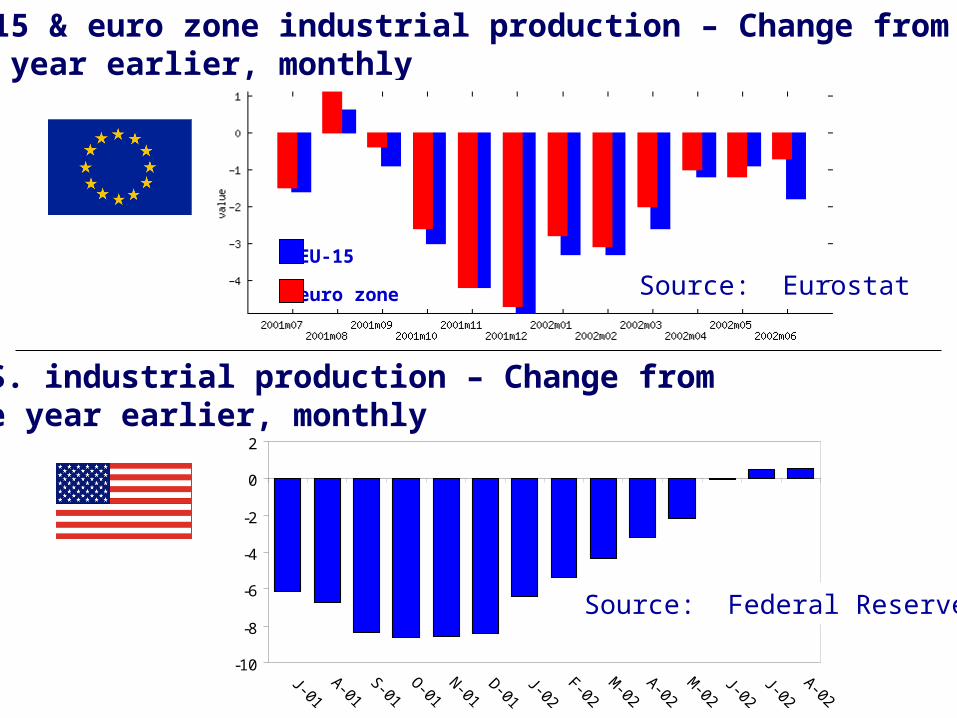
EU-15 & euro zone industrial production – Change from one year earlier, monthly
U.S. industrial production – Change from one year earlier, monthly
Source: Eurostat
Source: Federal Reserve
EU-15
euro zone

80
85
90
95
100
105
110
115
1995 1996 1997 1998 1999 2000 2001 2002
Do
llar
Ind
ex
0
5
10
15
20
25
30
35
Mo
nth
ly D
efi
cit
(B
illi
on
s,
'82 $
)
.
Real Broad Dollar Index
Real Trade Deficit in Goods
Federal Funds Rate (%)
01234567
1995 1996 1997 1998 1999 2000 2001 2002
Despite dramatic reductionsDespite dramatic reductionsin interest rates by thein interest rates by theFederal Reserve, theFederal Reserve, theU.S. Dollar andU.S. Dollar andTrade DeficitTrade Deficitremain veryremain veryhighhigh

Summary:
Economic outlook is positive but said to be . . .
“slow and uneven” (Federal Reserve)
or
“deteriorated but positive” (IFO World Survey)
gradual recovery appears most likely for pulp & paper markets markets
9
12
15
18
21
1996 1997 1998 1999 2000 2001
Mil
lio
ns
of
To
ns
Exports Imports
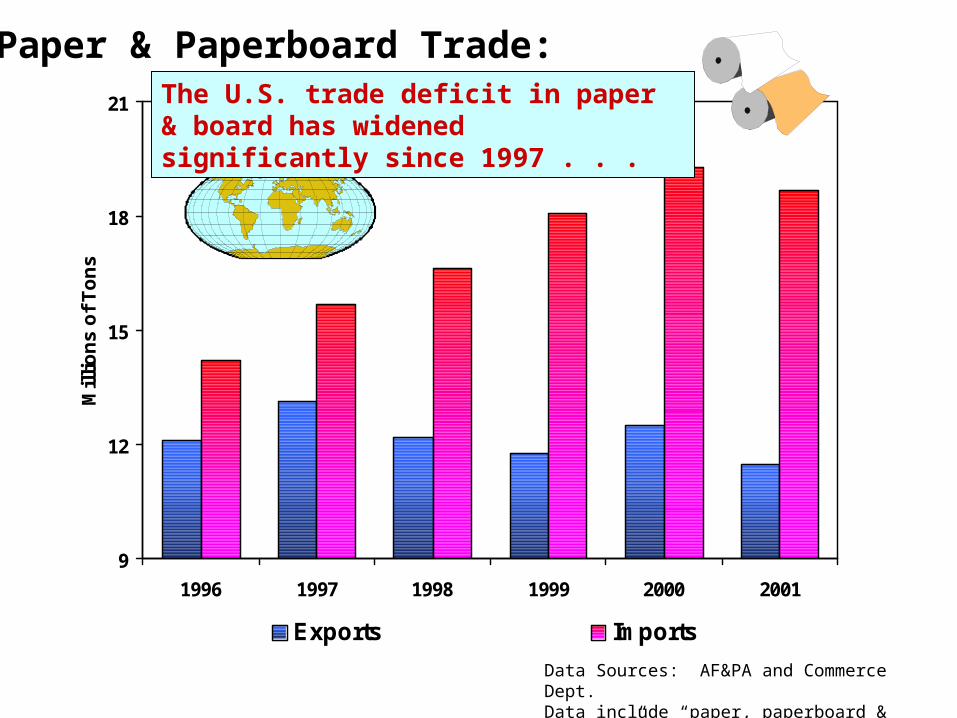
Paper & Paperboard Trade:
Data Sources: AF&PA and Commerce Dept.Data include “paper, paperboard & products”
The U.S. trade deficit in paper & board has widened significantly since 1997 . . .
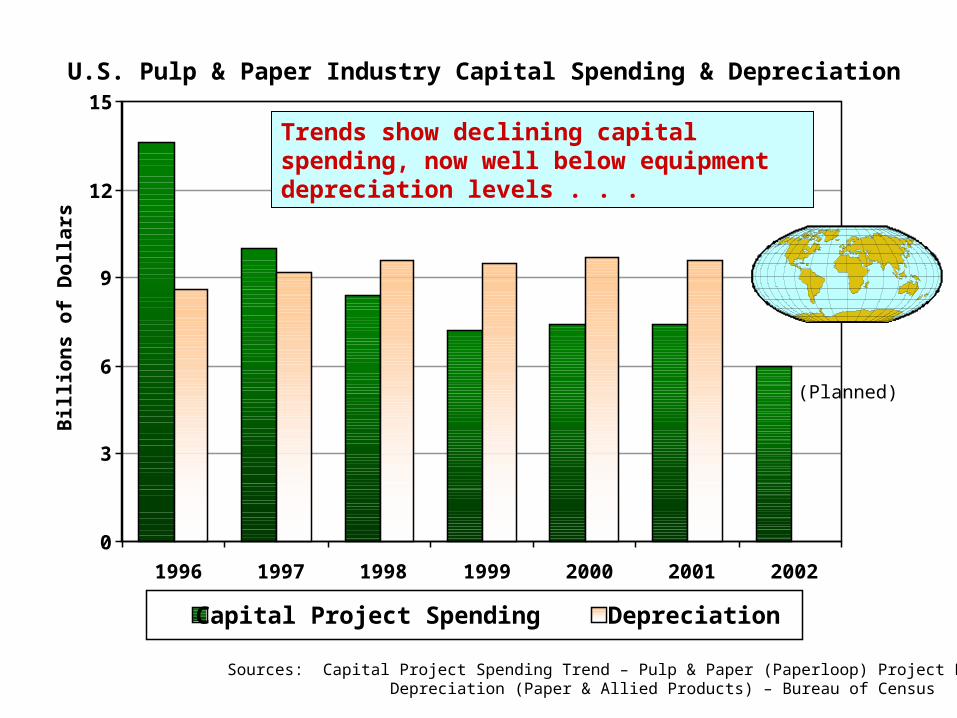
Sources: Capital Project Spending Trend – Pulp & Paper (Paperloop) Project Report Depreciation (Paper & Allied Products) – Bureau of Census
U.S. Pulp & Paper Industry Capital Spending & Depreciation
0
3
6
9
12
15
1996 1997 1998 1999 2000 2001 2002
Bil
lio
ns
of
Do
lla
rs
Capital Project Spending Depreciation
Trends show declining capital spending, now well below equipment depreciation levels . . .
(Planned)
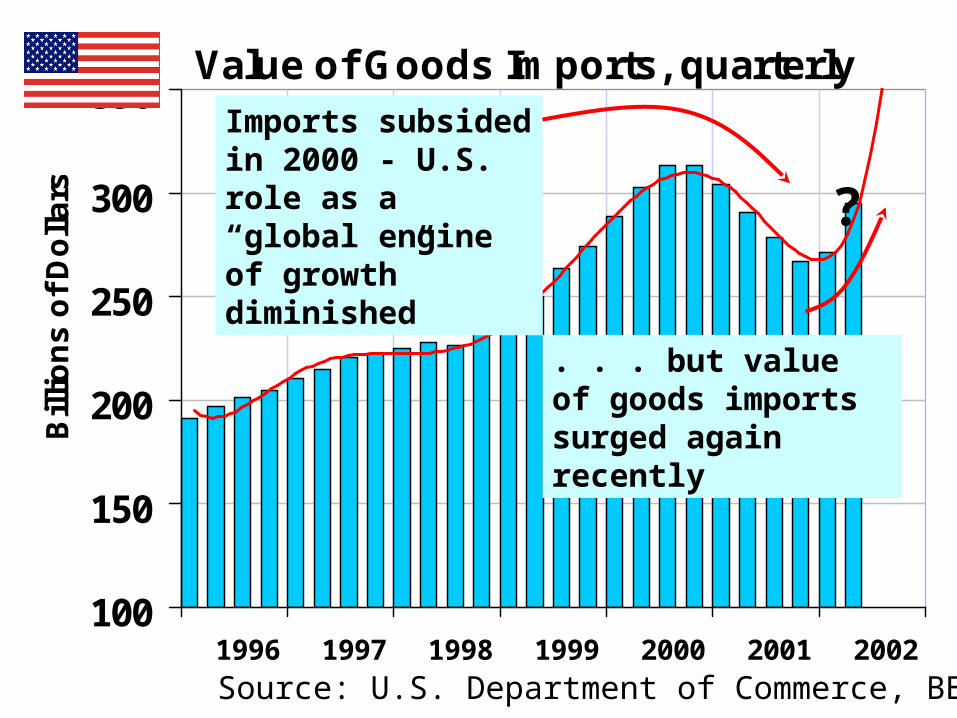
Value of Goods Imports, quarterly
100
150
200
250
300
350
1996 1997 1998 1999 2000 2001 2002
Bil
lio
ns
of
Do
lla
rs
Source: U.S. Department of Commerce, BEA
?Imports subsided in 2000 - U.S. role as a “global engine of growth” diminished
. . . but value of goods imports surged again recently