Embed Size (px)
Citation preview
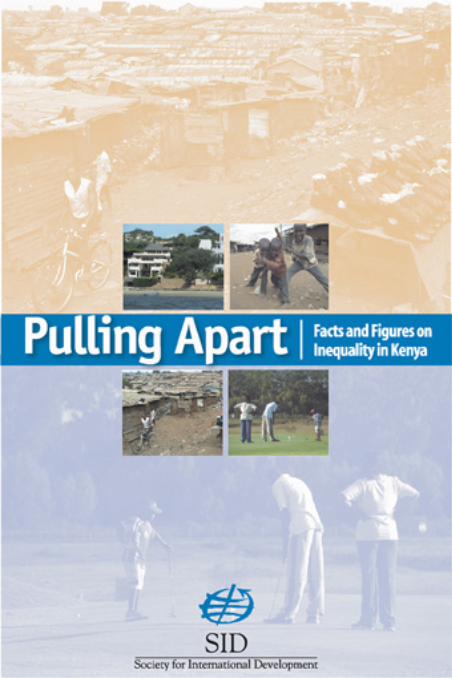
Pulling ApartFacts and Figures onInequality in Kenya
Popular Version
SIDSociety for International Development
Published by:Society for International DevelopmentEastern Africa Regional OfficePO Box 2404—00100Nairobi Kenya
Telephone: (+254 020) 2737991 or 2737992Email:[email protected]: http://www.sidint.org
© Society for International Development (SID) 2004
ISBN: 9966-7026-1-X
All rights reserved. No part of this book may be reproduced, stored in a retrievalsystem, or transmitted, in any form or by any means, electronic mechanical,photocopying, recording or otherwise, without the prior permission of thepublishers.
This publication is part of the SID’s contribution to the project Rich and Poor:National Discourses on Poverty, Inequality, and Growth Project (RAPP) thatis being implemented jointly with the Ministry of Planning and NationalDevelopment and the Swedish International Development Cooperation Agency(Sida). The publication, however, remains the responsibility of the SID.
Design and layout by:Sunburst CommunicationsPO Box 43193—00100 GPONairobi, KenyaEmail:[email protected]
Pul
ling
Apar
t: Fa
cts a
nd Fi
gure
s on
Ineq
ualit
y in
Keny
aii
Society forInternationalDevelopment
Ministry of Planningand NationalDevelopment
Swedish InternationalDevelopment Cooperation
Agency (Sida)
Pulling Apart: Facts and Figures on Inequality in Kenyaiii
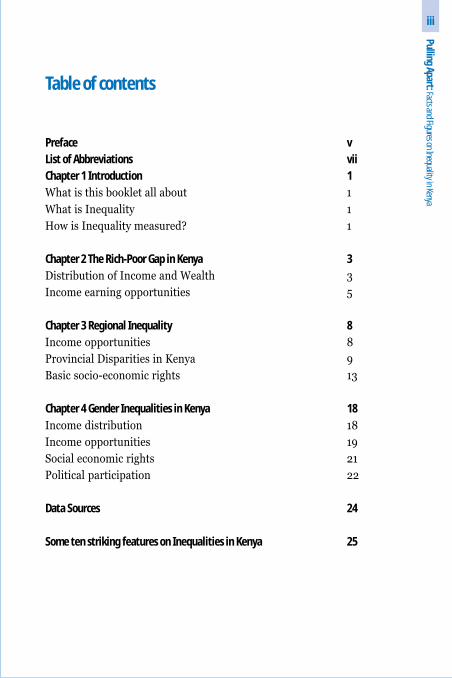
Table of contents
Preface v
List of Abbreviations vii
Chapter 1 Introduction 1
What is this booklet all about 1
What is Inequality 1
How is Inequality measured? 1
Chapter 2 The Rich-Poor Gap in Kenya 3
Distribution of Income and Wealth 3
Income earning opportunities 5
Chapter 3 Regional Inequality 8
Income opportunities 8
Provincial Disparities in Kenya 9
Basic socio-economic rights 13
Chapter 4 Gender Inequalities in Kenya 18
Income distribution 18
Income opportunities 19
Social economic rights 21
Political participation 22
Data Sources 24
Some ten striking features on Inequalities in Kenya 25

Pul
ling
Apar
t: Fa
cts a
nd Fi
gure
s on
Ineq
ualit
y in
Keny
aiv
Pulling Apart: Facts and Figures on Inequality in Kenyav
Preface
This publication is a short version of a more extensive report titled Pulling
Apart: Facts and Figures on inequality in Kenya. It is part of the Society for
International Development’s contribution to a project on Rich and Poor:
National Discourses on Poverty, Inequality, and Growth that is being imple-
mented jointly with the Ministry of Planning and National Development, the
Swedish Embassy in Nairobi and the SID. The publication, however, remains
the responsibility of the SID.
Inequalities in Kenya are manifested in different forms. Differences in share
of income and social services are observed across regions, genders and even
specific segments of the population. For instance, this publication shows that
the country’s top 10% households control 42% of total income while the bot-
tom 10% control less than 1% and that the difference in life expectancy be-
tween the Central and Nyanza provinces is a staggering 16 years. The report
you are about to read further shows that the doctor-patient ratio is about
1:20,700 in Central but 1:120,000 in North Eastern. Last but not least, the
publication also shows that about 93% of women in North Eastern province
have no education at all, compared with only about 3% in Central province.
Inequality and poverty are not just a result of the lack of economic growth.
This is because while economic growth is necessary for poverty reduction it is
not sufficient for uplifting the poor. Increased equality can create faster growth
but without an equitable distribution of benefits from growth, its effects on
poverty reduction will be marginal. In addition, inequality is also a matter of
human rights, as inequalities can give rise to exclusion and the failure of peo-
ple’s voice being heard.
Inequality evokes strong passion and stirs controversy. Despite this, or maybe
because of this, there is a deafening silence in the public debate in Kenya on
the subject. With this booklet we hope to help break the silence and lay the
foundation for this debate. It is our hope that those in politics and policy
making, politicians and legislators alike, will begin to confront this problem
Pul
ling
Apar
t: Fa
cts a
nd Fi
gure
s on
Ineq
ualit
y in
Keny
avi
in a more direct, honest and bold manner. For the civil society, research
organisations and the public we hope that inequality will start to be a topic of
discussion and enquiry, and that this report will provide useful information
in this regard. Ultimately, this document shall have achieved its objective if it
gives rise to a debate about the nature and causes of inequality in Kenya but,more importantly, what we can call do about it.
Duncan OkelloRegional Director
SID, Eastern Africa Office
Pulling Apart: Facts and Figures on Inequality in Kenyavii
List of Abbreviations
AIDs Acquired Immune Deficiency Syndrome
CBS Central Bureau of Statistics
FAO Food and Agriculture Organisation
GDI Gender Development Index
GEM Gender Empowerment Measures
GER Gross Enrolment Ratio
GRI Gender Related Development Index
HDI Human Development Index
HDR Human Development Report
HIV Human Immun0 Virus
HPI Human Poverty Index
IDS Institute of Development Studies, University of Nairobi
KDHS Kenya Demographic and Health Survey
MDGs Millennium Development Goals
MICS Multiple Indicator Cluster Survey
MP Member of Parliament
PRSP Poverty Reduction Strategy Paper
RAPP Rich and Poor: National Discourses on Poverty,
Inequality and Growth Project
SD Standard Deviation
Sida Swedish International Development Agency
UNDP United Nations Development Programme
UNESCO United Nations Educational, Scientific and
Cultural Organisation
WMS Welfare Monitoring Survey

Pul
ling
Apar
t: Fa
cts a
nd Fi
gure
s on
Ineq
ualit
y in
Keny
aviii
Pulling ApartFacts and Figures on Inequality in Kenya
Pulling Apart: Facts and Figures on Inequality in Kenyaix

Pul
ling
Apar
t: Fa
cts a
nd Fi
gure
s on
Ineq
ualit
y in
Keny
ax
Chapter 1Introduction
1.1 What is this booklet about
This publication presents facts and figures on inequality in Kenya. It reliedSolely on secondary data and official publications. It summarises the strikingaspects of inequality in Kenya and is based on a much larger report titledPulling Apart: Facts and Figures on Inequality in Kenya. This report focuseson three broad and key dimensions of inequality: income, regional and genderinequalities. It presents facts and figures on inequality in both opportunitiesand outcomes across regions, genders and populations groups.
1.2 What is inequality
Inequality is the degree to which distribution of economic welfare generatedin an economy differs from that of equal shares among its inhabitants. Itmay also entail comparison of certain attributes or well-being between twopersons or a group of people to assess the differences in share of theseattributes. Inequality is observed not only in incomes but also in terms ofsocial exclusion and the inability to access social services and socio-politicalrights by different population groups, genders and even races.
Though related, inequality and poverty are different. Inequality concernsvariations in living standards across a whole population. By contrast, povertyfocuses only on those whose standards of living fall below a given threshold,commonly referred to as the poverty line.
1.3 How is inequality measured
Since inequality is multi-dimensional its measurement entails makingchoices as to the form and dimension to focus on. When the focus is on overallwell-being, the analysis goes beyond income and expenditure to focus onnon-income variables such as education, health and participation in the
political process. Measurement of inequality will depend to a great degree
on availability of information on incomes, expenditure and other dimensions
of well being. The gini coefficient is the most widely used measure of
Pulling Apart: Facts and Figures on Inequality in Kenya1
inequality that utilizes the division of populations into equal groups and
assessing how much of a variable each group controls relative to other groups.
The gini index is based on the famous Lorenz curve.
Pul
ling
Apar
t: Fa
cts a
nd Fi
gure
s on
Ineq
ualit
y in
Keny
a2
Chapter 2The Rich-Poor Gap in Kenya
The rich-poor gap is characterised by a situation where one segment of thepopulation has a disproportionately large share of income than othersegments of that population. This often gives rise to very visible differencesin the lifestyles and standards of living in a society. This chapter presentssome facts and figures that characterise the gap between the rich and thepoor in Kenya.
2.1 Distribution of Income and Wealth
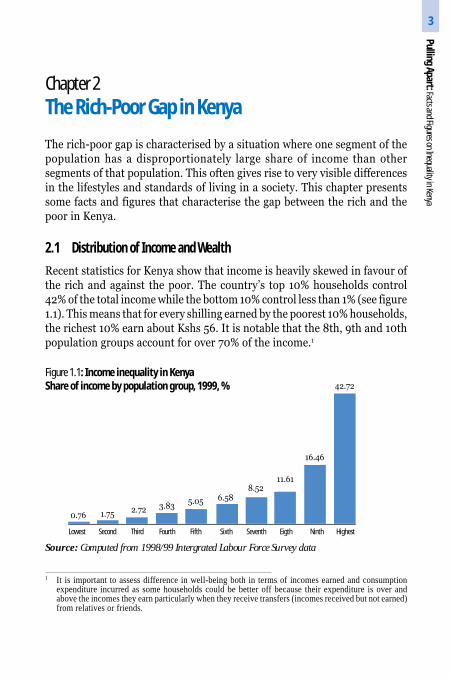
Recent statistics for Kenya show that income is heavily skewed in favour ofthe rich and against the poor. The country’s top 10% households control42% of the total income while the bottom 10% control less than 1% (see figure1.1). This means that for every shilling earned by the poorest 10% households,the richest 10% earn about Kshs 56. It is notable that the 8th, 9th and 10thpopulation groups account for over 70% of the income.1
Figure 1.1: Income inequality in KenyaShare of income by population group, 1999, %
Source: Computed from 1998/99 Intergrated Labour Force Survey data
1.75 2.720.76
3.835.05 6.58
42.72
16.46
8.5211.61
Lowest Second Third Fourth Fifth Sixth Seventh Eigth Ninth Highest
1 It is important to assess difference in well-being both in terms of incomes earned and consumptionexpenditure incurred as some households could be better off because their expenditure is over andabove the incomes they earn particularly when they receive transfers (incomes received but not earned)from relatives or friends.
Pulling Apart: Facts and Figures on Inequality in Kenya3
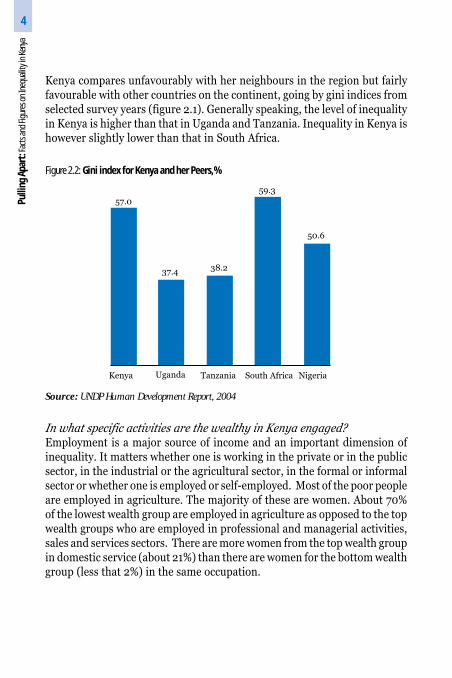
Kenya compares unfavourably with her neighbours in the region but fairlyfavourable with other countries on the continent, going by gini indices fromselected survey years (figure 2.1). Generally speaking, the level of inequalityin Kenya is higher than that in Uganda and Tanzania. Inequality in Kenya ishowever slightly lower than that in South Africa.
Figure 2.2: Gini index for Kenya and her Peers,%
Source: UNDP Human Development Report, 2004
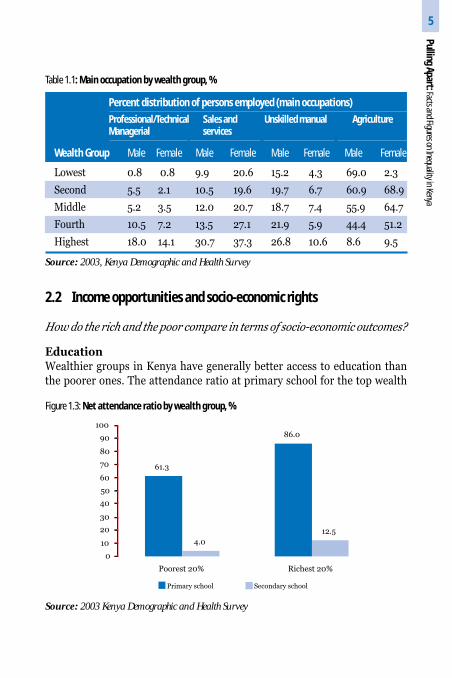
In what specific activities are the wealthy in Kenya engaged?Employment is a major source of income and an important dimension ofinequality. It matters whether one is working in the private or in the publicsector, in the industrial or the agricultural sector, in the formal or informalsector or whether one is employed or self-employed. Most of the poor peopleare employed in agriculture. The majority of these are women. About 70%of the lowest wealth group are employed in agriculture as opposed to the topwealth groups who are employed in professional and managerial activities,sales and services sectors. There are more women from the top wealth groupin domestic service (about 21%) than there are women for the bottom wealthgroup (less that 2%) in the same occupation.
Pul
ling
Apar
t: Fa
cts a
nd Fi
gure
s on
Ineq
ualit
y in
Keny
a4
57.0
37.4
59.3
50.6
38.2
Kenya Uganda Tanzania South Africa Nigeria
2.2 Income opportunities and socio-economic rights
How do the rich and the poor compare in terms of socio-economic outcomes?
EducationWealthier groups in Kenya have generally better access to education thanthe poorer ones. The attendance ratio at primary school for the top wealth
Table 1.1: Main occupation by wealth group, %
Source: 2003, Kenya Demographic and Health Survey
Wealth Group Male Female Male Female Male Female Male Female
Lowest 0.8 0.8 9.9 20.6 15.2 4.3 69.0 2.3
Second 5.5 2.1 10.5 19.6 19.7 6.7 60.9 68.9
Middle 5.2 3.5 12.0 20.7 18.7 7.4 55.9 64.7
Fourth 10.5 7.2 13.5 27.1 21.9 5.9 44.4 51.2
Highest 18.0 14.1 30.7 37.3 26.8 10.6 8.6 9.5
Percent distribution of persons employed (main occupations)
Professional/Technical Sales and Unskilled manual AgricultureManagerial services
61.3
86.0
4.0
12.5
0
10
20
30
40
50
60
70
80
90
100
Poorest 20% Richest 20%
Primary school Secondary school
Source: 2003 Kenya Demographic and Health Survey
Figure 1.3: Net attendance ratio by wealth group, %
Pulling Apart: Facts and Figures on Inequality in Kenya5
96
62
149
91
0
20
40
60
80
100
120
140
160
Poorest 20% Richest 20%
Infant Mortality Under-five mortality
Source: 2003 Kenya Demographic and Health Survey
Figure 1.4: Infant mortality by wealth group, deaths per 1,000 live births
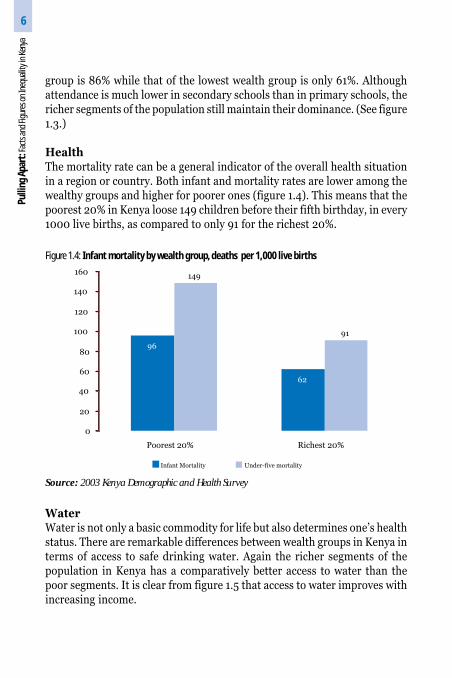
group is 86% while that of the lowest wealth group is only 61%. Althoughattendance is much lower in secondary schools than in primary schools, thericher segments of the population still maintain their dominance. (See figure1.3.)
HealthThe mortality rate can be a general indicator of the overall health situationin a region or country. Both infant and mortality rates are lower among thewealthy groups and higher for poorer ones (figure 1.4). This means that thepoorest 20% in Kenya loose 149 children before their fifth birthday, in every1000 live births, as compared to only 91 for the richest 20%.
WaterWater is not only a basic commodity for life but also determines one’s healthstatus. There are remarkable differences between wealth groups in Kenya interms of access to safe drinking water. Again the richer segments of thepopulation in Kenya has a comparatively better access to water than thepoor segments. It is clear from figure 1.5 that access to water improves withincreasing income.
Pul
ling
Apar
t: Fa
cts a
nd Fi
gure
s on
Ineq
ualit
y in
Keny
a6
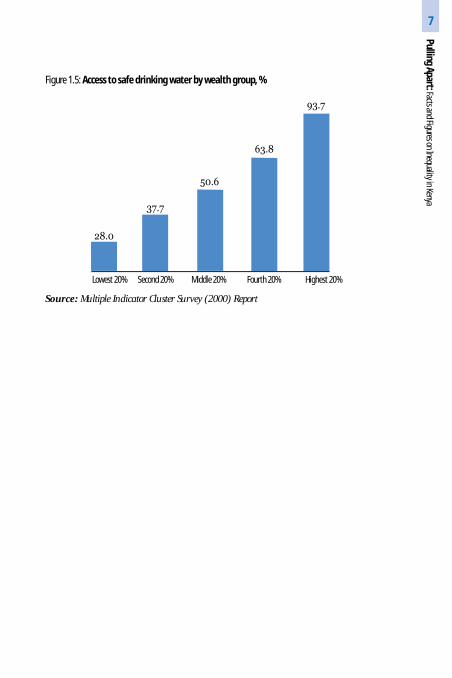
28.0
37.7
50.6
93.7
63.8
Lowest 20% Second 20% Middle 20% Fourth 20% Highest 20%
Source: Multiple Indicator Cluster Survey (2000) Report
Figure 1.5: Access to safe drinking water by wealth group, %
Pulling Apart: Facts and Figures on Inequality in Kenya7
Chapter 3Regional Inequality
Inequalities in well-being often take a regional dimension. In Kenya regionalor geographic differences in well-being may mean ethnic differences in well-being as ethnic groups often reside in given geographical regions. There arestark differences in development opportunities and outcomes across Kenya’srural-urban divide, and other regions too.
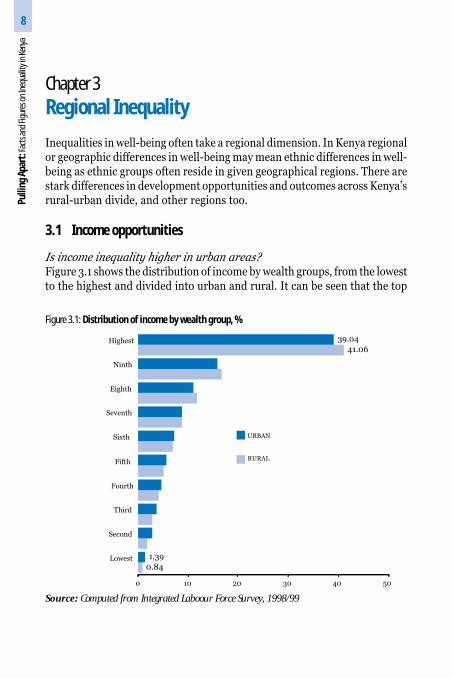
3.1 Income opportunities
Is income inequality higher in urban areas?Figure 3.1 shows the distribution of income by wealth groups, from the lowestto the highest and divided into urban and rural. It can be seen that the top
0.84
41.06
1.39
39.04
0 10 20 30 40 50
Lowest
Second
Third
Fourth
Fifth
Sixth
Seventh
Eighth
Ninth
Highest
URBAN
RURAL
Source: Computed from Integrated Laboour Force Survey, 1998/99
Figure 3.1: Distribution of income by wealth group, %
Pul
ling
Apar
t: Fa
cts a
nd Fi
gure
s on
Ineq
ualit
y in
Keny
a8
10% of households in urban areas account for about 39% of income whilethose in rural areas account for 41%. The bottom 10% of households in bothurban and rural areas account for about 1% of income.
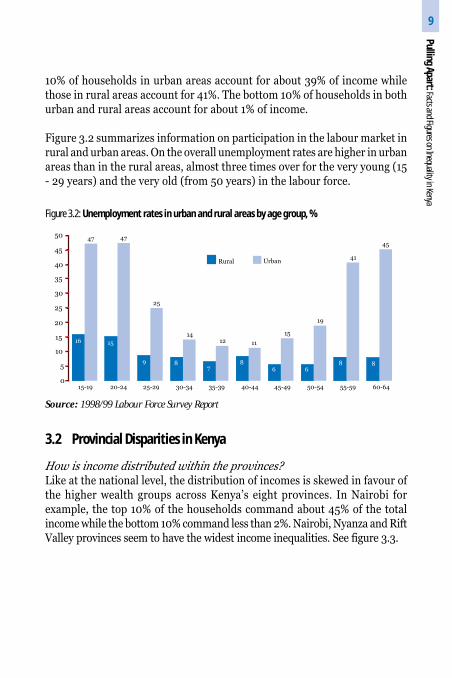
Figure 3.2 summarizes information on participation in the labour market inrural and urban areas. On the overall unemployment rates are higher in urbanareas than in the rural areas, almost three times over for the very young (15- 29 years) and the very old (from 50 years) in the labour force.
16 15
9 87
86 6
8 8
47 47
25
1412 11
15
19
41
45
0
5
10
15
20
25
30
35
40
45
50
15-19 20-24 25-29 30-34 35-39 40-44 45-49 50-54 55-59 60-64
Rural Urban
Source: 1998/99 Labour Force Survey Report
Figure 3.2: Unemployment rates in urban and rural areas by age group, %
3.2 Provincial Disparities in Kenya
How is income distributed within the provinces?Like at the national level, the distribution of incomes is skewed in favour ofthe higher wealth groups across Kenya’s eight provinces. In Nairobi forexample, the top 10% of the households command about 45% of the totalincome while the bottom 10% command less than 2%. Nairobi, Nyanza and RiftValley provinces seem to have the widest income inequalities. See figure 3.3.
Pulling Apart: Facts and Figures on Inequality in Kenya9
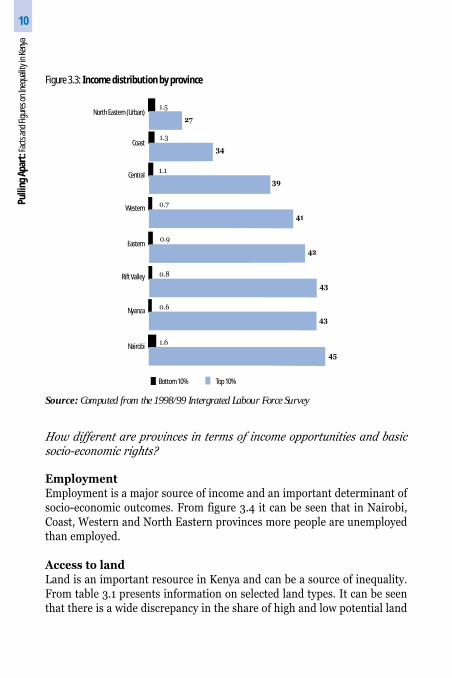
Figure 3.3: Income distribution by province
Source: Computed from the 1998/99 Intergrated Labour Force Survey
How different are provinces in terms of income opportunities and basicsocio-economic rights?
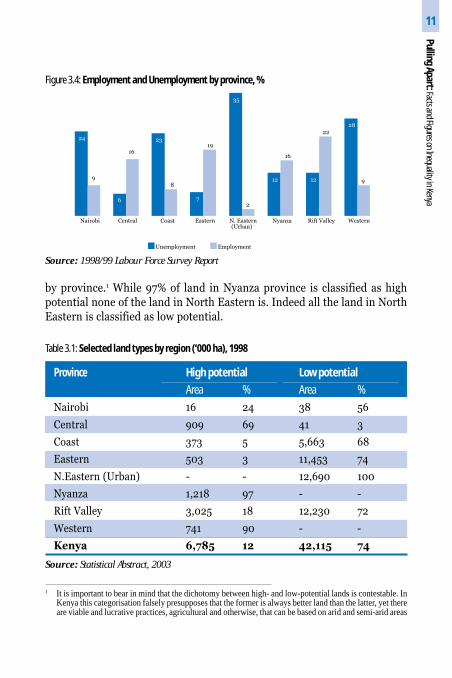
EmploymentEmployment is a major source of income and an important determinant ofsocio-economic outcomes. From figure 3.4 it can be seen that in Nairobi,Coast, Western and North Eastern provinces more people are unemployedthan employed.
Access to landLand is an important resource in Kenya and can be a source of inequality.From table 3.1 presents information on selected land types. It can be seenthat there is a wide discrepancy in the share of high and low potential land
North Eastern (Urban)
Coast
Central
Western
Eastern
Rift Valley
Nyanza
Nairobi45
43
43
42
27
34
41
39
Top 10%Bottom 10%
0.9
1.5
1.3
0.8
0.7
1.1
1.6
0.6
Pul
ling
Apar
t: Fa
cts a
nd Fi
gure
s on
Ineq
ualit
y in
Keny
a10
Source: Statistical Abstract, 2003
Province High potential Low potential
Area % Area %
Nairobi 16 24 38 56
Central 909 69 41 3
Coast 373 5 5,663 68
Eastern 503 3 11,453 74
N.Eastern (Urban) - - 12,690 100
Nyanza 1,218 97 - -
Rift Valley 3,025 18 12,230 72
Western 741 90 - -
Kenya 6,785 12 42,115 74
Table 3.1: Selected land types by region (‘000 ha), 1998
24
6
23
7
35
12 12
28
9
16
8
19
2
16
22
9
Nairobi Central Coast Eastern N. Eastern(Urban)
Nyanza Rift Valley Western
Unemployment Employment
Figure 3.4: Employment and Unemployment by province, %
Source: 1998/99 Labour Force Survey Report
by province.1 While 97% of land in Nyanza province is classified as highpotential none of the land in North Eastern is. Indeed all the land in NorthEastern is classified as low potential.
1 It is important to bear in mind that the dichotomy between high- and low-potential lands is contestable. InKenya this categorisation falsely presupposes that the former is always better land than the latter, yet thereare viable and lucrative practices, agricultural and otherwise, that can be based on arid and semi-arid areas
Pulling Apart: Facts and Figures on Inequality in Kenya11
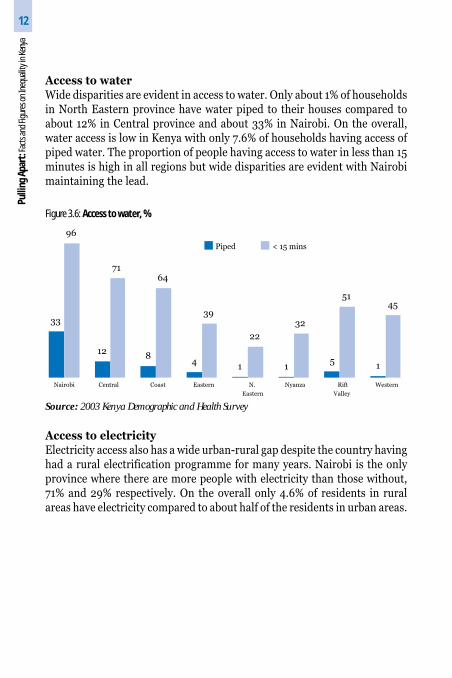
Access to waterWide disparities are evident in access to water. Only about 1% of householdsin North Eastern province have water piped to their houses compared toabout 12% in Central province and about 33% in Nairobi. On the overall,water access is low in Kenya with only 7.6% of households having access ofpiped water. The proportion of people having access to water in less than 15minutes is high in all regions but wide disparities are evident with Nairobimaintaining the lead.
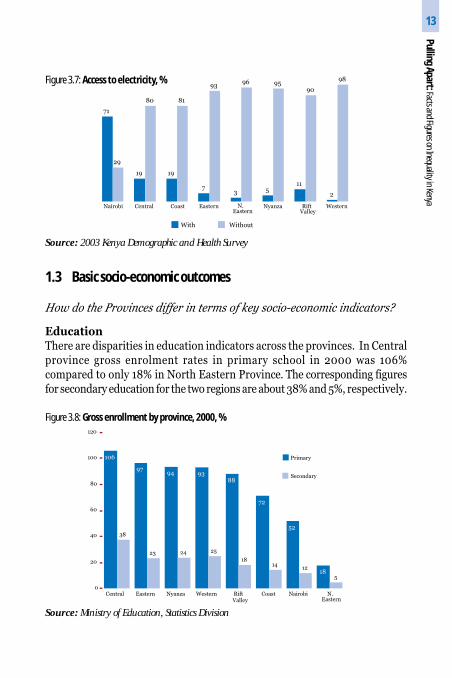
Access to electricityElectricity access also has a wide urban-rural gap despite the country havinghad a rural electrification programme for many years. Nairobi is the onlyprovince where there are more people with electricity than those without,71% and 29% respectively. On the overall only 4.6% of residents in ruralareas have electricity compared to about half of the residents in urban areas.
33
128
41 1
51
96
7164
39
22
32
5145
Nairobi Central Coast Eastern N.
Eastern
Nyanza Rift
Valley
Western
Piped < 15 mins
Figure 3.6: Access to water, %
Source: 2003 Kenya Demographic and Health Survey
Pul
ling
Apar
t: Fa
cts a
nd Fi
gure
s on
Ineq
ualit
y in
Keny
a12
71
19 19
73 5
11
2
29
80 81
9396 95
90
98
Nairobi Central Coast Eastern N.Eastern
Nyanza RiftValley
Western
Figure 3.7: Access to electricity, %
Source: 2003 Kenya Demographic and Health Survey
1.3 Basic socio-economic outcomes
How do the Provinces differ in terms of key socio-economic indicators?
EducationThere are disparities in education indicators across the provinces. In Centralprovince gross enrolment rates in primary school in 2000 was 106%compared to only 18% in North Eastern Province. The corresponding figuresfor secondary education for the two regions are about 38% and 5%, respectively.
With Without
Figure 3.8: Gross enrollment by province, 2000, %
Source: Ministry of Education, Statistics Division
9794 93
88
72
52
18
38
23 24 25
1814
12
5
106
0
20
40
60
80
100
120
Central Eastern Nyanza Western RiftValley
Coast Nairobi N.Eastern
Primary
Secondary
Pulling Apart: Facts and Figures on Inequality in Kenya13
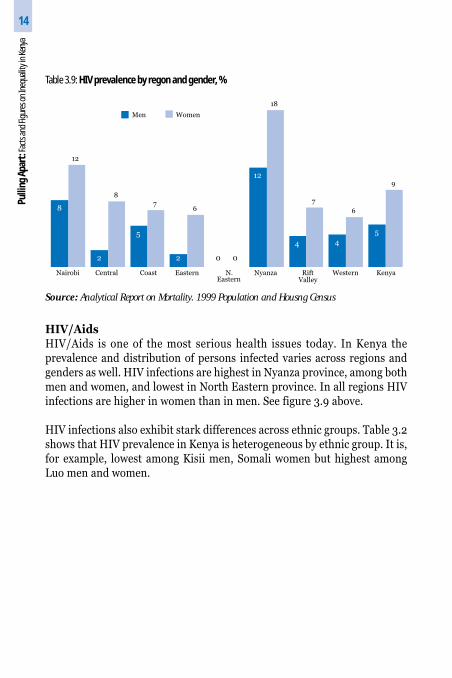
HIV/AidsHIV/Aids is one of the most serious health issues today. In Kenya theprevalence and distribution of persons infected varies across regions andgenders as well. HIV infections are highest in Nyanza province, among bothmen and women, and lowest in North Eastern province. In all regions HIVinfections are higher in women than in men. See figure 3.9 above.
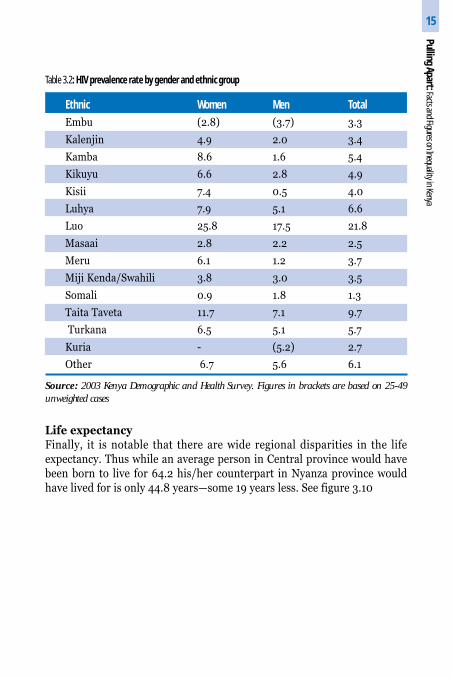
HIV infections also exhibit stark differences across ethnic groups. Table 3.2shows that HIV prevalence in Kenya is heterogeneous by ethnic group. It is,for example, lowest among Kisii men, Somali women but highest amongLuo men and women.
8
2
5
2 0
12
4 4
5
12
8
76
0
18
7
6
9
Nairobi Central Coast Eastern N.Eastern
Nyanza RiftValley
Western Kenya
Men Women
Table 3.9: HIV prevalence by regon and gender, %
Source: Analytical Report on Mortality. 1999 Population and Housng Census
Pul
ling
Apar
t: Fa
cts a
nd Fi
gure
s on
Ineq
ualit
y in
Keny
a14
Life expectancyFinally, it is notable that there are wide regional disparities in the lifeexpectancy. Thus while an average person in Central province would havebeen born to live for 64.2 his/her counterpart in Nyanza province wouldhave lived for is only 44.8 years—some 19 years less. See figure 3.10
Table 3.2: HIV prevalence rate by gender and ethnic group
Source: 2003 Kenya Demographic and Health Survey. Figures in brackets are based on 25-49unweighted cases
Ethnic Women Men Total
Embu (2.8) (3.7) 3.3
Kalenjin 4.9 2.0 3.4
Kamba 8.6 1.6 5.4
Kikuyu 6.6 2.8 4.9
Kisii 7.4 0.5 4.0
Luhya 7.9 5.1 6.6
Luo 25.8 17.5 21.8
Masaai 2.8 2.2 2.5
Meru 6.1 1.2 3.7
Miji Kenda/Swahili 3.8 3.0 3.5
Somali 0.9 1.8 1.3
Taita Taveta 11.7 7.1 9.7
Turkana 6.5 5.1 5.7
Kuria - (5.2) 2.7
Other 6.7 5.6 6.1
Pulling Apart: Facts and Figures on Inequality in Kenya15
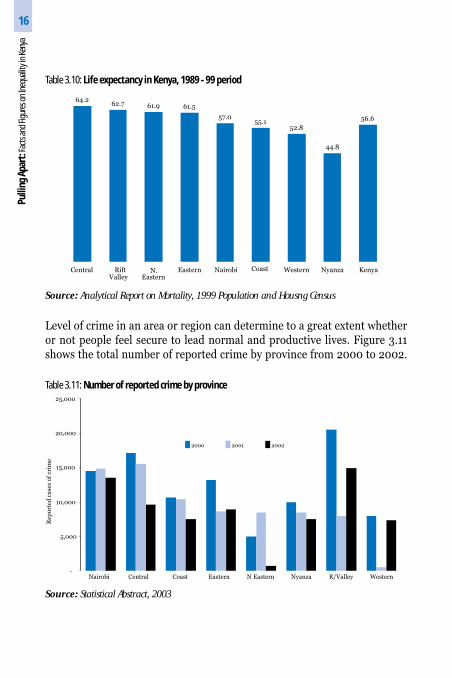
Level of crime in an area or region can determine to a great extent whetheror not people feel secure to lead normal and productive lives. Figure 3.11shows the total number of reported crime by province from 2000 to 2002.
64.262.7 61.9 61.5
57.055.1
52.8
44.8
56.6
Central RiftValley
N.Eastern
Eastern Nairobi Coast Western Nyanza Kenya
Table 3.10: Life expectancy in Kenya, 1989 - 99 period
Source: Analytical Report on Mortality, 1999 Population and Housng Census
-
5,000
10,000
15,000
20,000
25,000
Nairobi Central Coast Eastern N Eastern Nyanza R/Valley Western
Rep
ort
ed c
ase
s o
f cr
ime
2000 2001 2002
Table 3.11: Number of reported crime by province
Source: Statistical Abstract, 2003
Pul
ling
Apar
t: Fa
cts a
nd Fi
gure
s on
Ineq
ualit
y in
Keny
a16
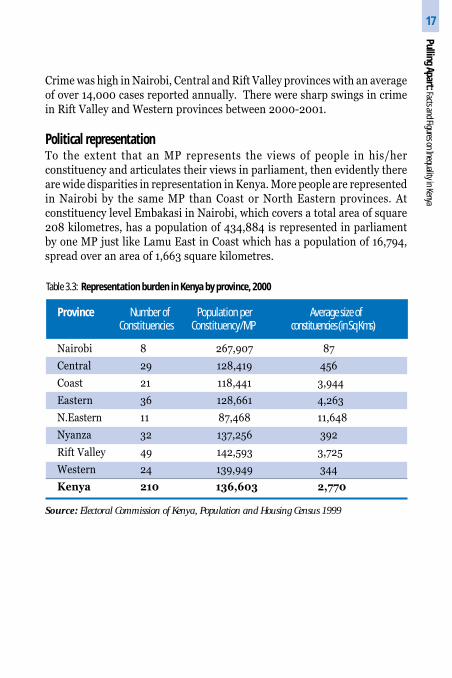
Province Number of Population per Average size of Constituencies Constituency/MP constituencies (in Sq Kms)
Nairobi 8 267,907 87
Central 29 128,419 456
Coast 21 118,441 3,944
Eastern 36 128,661 4,263
N.Eastern 11 87,468 11,648
Nyanza 32 137,256 392
Rift Valley 49 142,593 3,725
Western 24 139,949 344
Kenya 210 136,603 2,770
Source: Electoral Commission of Kenya, Population and Housing Census 1999
Table 3.3: Representation burden in Kenya by province, 2000
Crime was high in Nairobi, Central and Rift Valley provinces with an averageof over 14,000 cases reported annually. There were sharp swings in crimein Rift Valley and Western provinces between 2000-2001.
Political representationTo the extent that an MP represents the views of people in his/herconstituency and articulates their views in parliament, then evidently thereare wide disparities in representation in Kenya. More people are representedin Nairobi by the same MP than Coast or North Eastern provinces. Atconstituency level Embakasi in Nairobi, which covers a total area of square208 kilometres, has a population of 434,884 is represented in parliamentby one MP just like Lamu East in Coast which has a population of 16,794,spread over an area of 1,663 square kilometres.
Pulling Apart: Facts and Figures on Inequality in Kenya17
Chapter 4Gender Inequalities in Kenya
There is increasing recognition of the significant role women play in thesocio-economic and political development of a society. However, the fullparticipation of women in development continues to be hampered by anumber of obstacles. These challenges essentially put them at a disadvantagedposition (relative to men) in so far as realising their full potential and freedomsis concerned. This chapter presents some information on the various aspects ofinequality from a gender perspective.
4.1 Income distribution
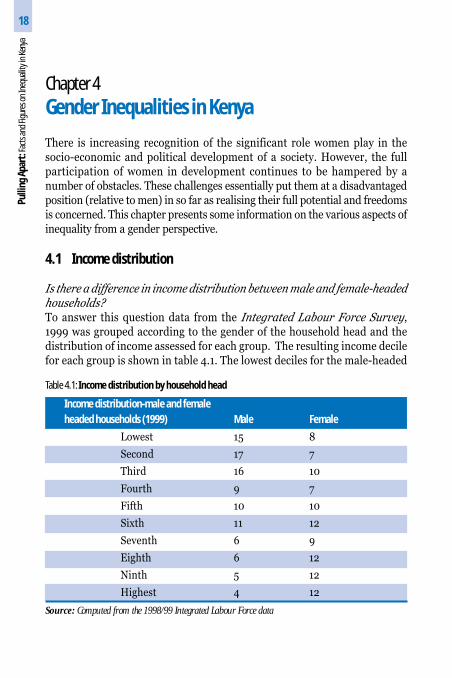
Is there a difference in income distribution between male and female-headedhouseholds?To answer this question data from the Integrated Labour Force Survey,1999 was grouped according to the gender of the household head and thedistribution of income assessed for each group. The resulting income decilefor each group is shown in table 4.1. The lowest deciles for the male-headed
Income distribution-male and female
headed households (1999) Male Female
Lowest 15 8
Second 17 7
Third 16 10
Fourth 9 7
Fifth 10 10
Sixth 11 12
Seventh 6 9
Eighth 6 12
Ninth 5 12
Highest 4 12
Table 4.1: Income distribution by household head
Source: Computed from the 1998/99 Integrated Labour Force data
Pul
ling
Apar
t: Fa
cts a
nd Fi
gure
s on
Ineq
ualit
y in
Keny
a18
household accounted for 15% of total income while that of the female headedaccounted for only 8%. The corresponding figures for the highest deciles are4% for the male-headed household and 12% for the female-headedhouseholds. It is significant that among the male headed households, incometends to be concentrated in the lower deciles than is the case with femaleheaded households.
4.2 Income opportunities
How do men and women compare in terms of income earning opportunities?
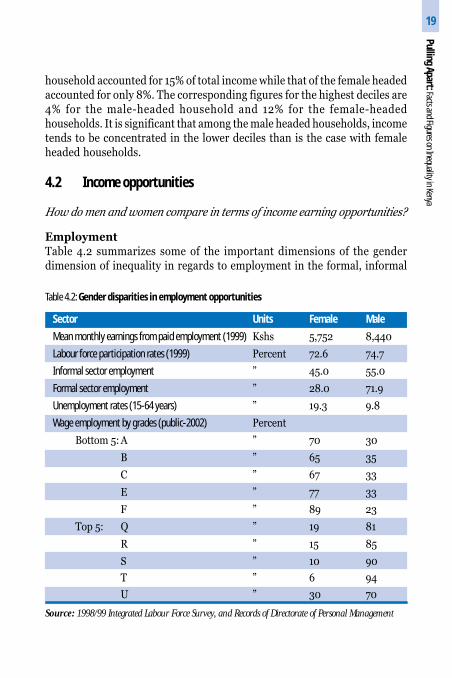
EmploymentTable 4.2 summarizes some of the important dimensions of the genderdimension of inequality in regards to employment in the formal, informal
Table 4.2: Gender disparities in employment opportunities
Sector Units Female Male
Mean monthly earnings from paid employment (1999) Kshs 5,752 8,440
Labour force participation rates (1999) Percent 72.6 74.7
Informal sector employment ” 45.0 55.0
Formal sector employment ” 28.0 71.9
Unemployment rates (15-64 years) ” 19.3 9.8
Wage employment by grades (public-2002) Percent
Bottom 5: A ” 70 30
B ” 65 35
C ” 67 33
E ” 77 33
F ” 89 23
Top 5: Q ” 19 81
R ” 15 85
S ” 10 90
T ” 6 94
U ” 30 70
Source: 1998/99 Integrated Labour Force Survey, and Records of Directorate of Personal Management
Pulling Apart: Facts and Figures on Inequality in Kenya19
and public sectors. Men not only have higher monthly incomes, but theyalso have higher participation rates. They account for over 70% of formalemployment and occupy the high posts in the public service. For instancefor the job group “U” there are 70% men and only 30% women.Unemployment levels are higher among women than in men, about 20%and 10% respectively.
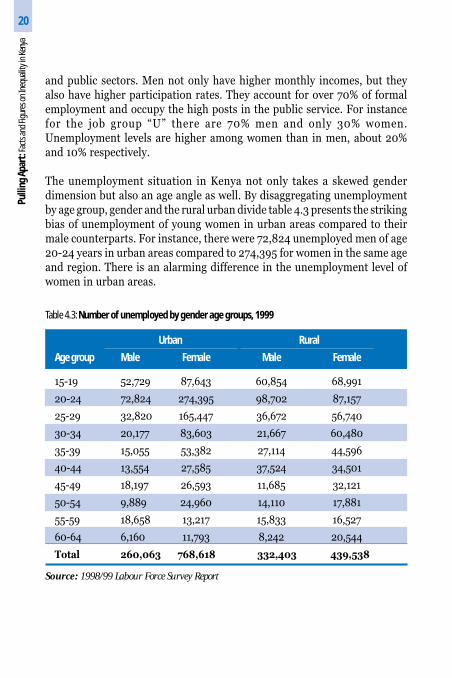
The unemployment situation in Kenya not only takes a skewed genderdimension but also an age angle as well. By disaggregating unemploymentby age group, gender and the rural urban divide table 4.3 presents the strikingbias of unemployment of young women in urban areas compared to theirmale counterparts. For instance, there were 72,824 unemployed men of age20-24 years in urban areas compared to 274,395 for women in the same ageand region. There is an alarming difference in the unemployment level ofwomen in urban areas.
Urban Rural
Age group Male Female Male Female
15-19 52,729 87,643 60,854 68,991
20-24 72,824 274,395 98,702 87,157
25-29 32,820 165,447 36,672 56,740
30-34 20,177 83,603 21,667 60,480
35-39 15,055 53,382 27,114 44,596
40-44 13,554 27,585 37,524 34,501
45-49 18,197 26,593 11,685 32,121
50-54 9,889 24,960 14,110 17,881
55-59 18,658 13,217 15,833 16,527
60-64 6,160 11,793 8,242 20,544
Total 260,063 768,618 332,403 439,538
Table 4.3: Number of unemployed by gender age groups, 1999
Source: 1998/99 Labour Force Survey Report
Pul
ling
Apar
t: Fa
cts a
nd Fi
gure
s on
Ineq
ualit
y in
Keny
a20
4.3 Socio-economic outcomes
Is there are gender gap in basic socio-economic rights?
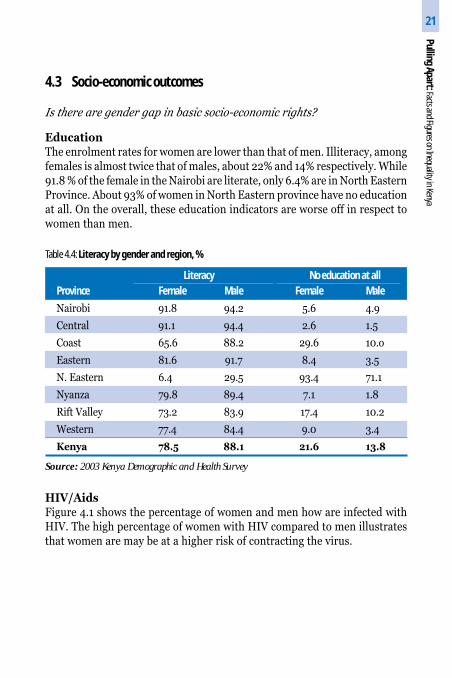
EducationThe enrolment rates for women are lower than that of men. Illiteracy, amongfemales is almost twice that of males, about 22% and 14% respectively. While91.8 % of the female in the Nairobi are literate, only 6.4% are in North EasternProvince. About 93% of women in North Eastern province have no educationat all. On the overall, these education indicators are worse off in respect towomen than men.
Literacy No education at all
Province Female Male Female Male
Nairobi 91.8 94.2 5.6 4.9
Central 91.1 94.4 2.6 1.5
Coast 65.6 88.2 29.6 10.o
Eastern 81.6 91.7 8.4 3.5
N. Eastern 6.4 29.5 93.4 71.1
Nyanza 79.8 89.4 7.1 1.8
Rift Valley 73.2 83.9 17.4 10.2
Western 77.4 84.4 9.0 3.4
Kenya 78.5 88.1 21.6 13.8
Table 4.4: Literacy by gender and region, %
Source: 2003 Kenya Demographic and Health Survey
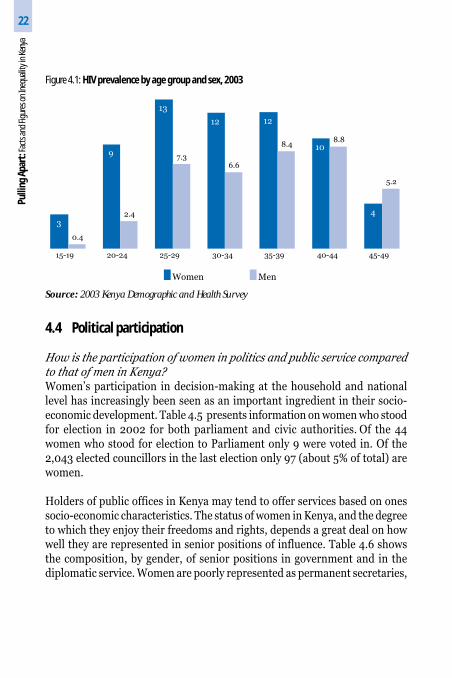
HIV/AidsFigure 4.1 shows the percentage of women and men how are infected withHIV. The high percentage of women with HIV compared to men illustratesthat women are may be at a higher risk of contracting the virus.
Pulling Apart: Facts and Figures on Inequality in Kenya21
3
9
13
12 12
10
4
0.4
2.4
7.36.6
8.48.8
5.2
15-19 20-24 25-29 30-34 35-39 40-44 45-49
Women Men
Source: 2003 Kenya Demographic and Health Survey
Figure 4.1: HIV prevalence by age group and sex, 2003
4.4 Political participation
How is the participation of women in politics and public service comparedto that of men in Kenya?Women’s participation in decision-making at the household and nationallevel has increasingly been seen as an important ingredient in their socio-economic development. Table 4.5 presents information on women who stoodfor election in 2002 for both parliament and civic authorities. Of the 44women who stood for election to Parliament only 9 were voted in. Of the2,043 elected councillors in the last election only 97 (about 5% of total) arewomen.
Holders of public offices in Kenya may tend to offer services based on onessocio-economic characteristics. The status of women in Kenya, and the degreeto which they enjoy their freedoms and rights, depends a great deal on howwell they are represented in senior positions of influence. Table 4.6 showsthe composition, by gender, of senior positions in government and in thediplomatic service. Women are poorly represented as permanent secretaries,
Pul
ling
Apar
t: Fa
cts a
nd Fi
gure
s on
Ineq
ualit
y in
Keny
a22
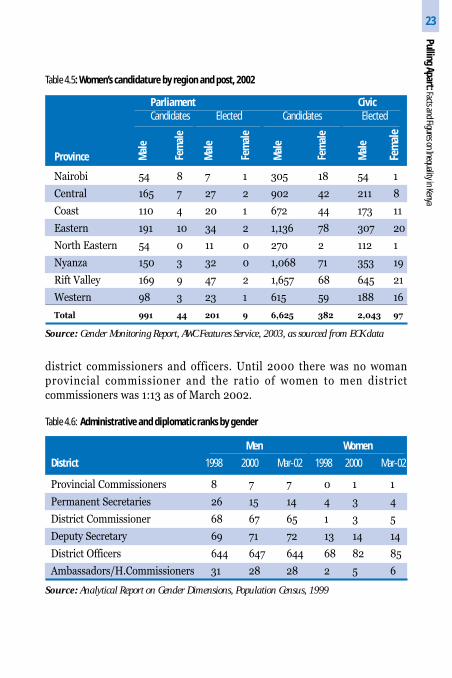
district commissioners and officers. Until 2000 there was no womanprovincial commissioner and the ratio of women to men districtcommissioners was 1:13 as of March 2002.
Table 4.6: Administrative and diplomatic ranks by gender
Men Women
District 1998 2000 Mar-02 1998 2000 Mar-02
Provincial Commissioners 8 7 7 0 1 1
Permanent Secretaries 26 15 14 4 3 4
District Commissioner 68 67 65 1 3 5
Deputy Secretary 69 71 72 13 14 14
District Officers 644 647 644 68 82 85
Ambassadors/H.Commissioners 31 28 28 2 5 6
Source: Analytical Report on Gender Dimensions, Population Census, 1999
Mal
e
Fem
ale
Mal
e
Fem
ale
Mal
e
Fem
ale
Mal
e
Fem
ale
Table 4.5: Women’s candidature by region and post, 2002
Source: Gender Monitoring Report, AWC Features Service, 2003, as sourced from ECK data
Province
Nairobi 54 8 7 1 305 18 54 1
Central 165 7 27 2 902 42 211 8
Coast 110 4 20 1 672 44 173 11
Eastern 191 10 34 2 1,136 78 307 20
North Eastern 54 0 11 0 270 2 112 1
Nyanza 150 3 32 0 1,068 71 353 19
Rift Valley 169 9 47 2 1,657 68 645 21
Western 98 3 23 1 615 59 188 16
Total 991 44 201 9 6,625 382 2,043 97
Parliament CivicCandidates Elected Candidates Elected
Pulling Apart: Facts and Figures on Inequality in Kenya23
Data Sources
The data used in this booklet is from different sources and of varying quality.It is therefore important to explain the sources, the quality and the underlyingconcepts. This is important to facilitate understanding and interpretation ofthe data. The data used is from three main sources: the 1999 population andhousing census; household surveys; and administrative records.
The 1999 population and Housing Census:This is mainly demographic data and covers population sizes, its distributionand the socio-economic characteristics of the population. The data wascollected by the Central Bureau of Statistics (CBS). This data iscomprehensive and covers all the districts, locations and divisions in thecountry. Information was also obtained from the various census analyticalreports that take a particular aspect of the population (e.g. housing, gender)and analyse separately.
Household surveys by the Central Bureau of StatisticsMost of the data used in the booklet are from socio-economic surveysconducted by the CBS. The main ones are:· The welfare monitoring surveys of 1992, 1994 and 1997· The Kenya Demographic and Health Survey of 1998 and 2003· The Integrated Labour Force Survey of 1998/99· The Multiple Indicators Cluster Survey (MICs) of 2000
The data from CBS are based on samples and therefore suffer from limitationassociated with use of samples and sampling techniques. The data is also inmost cases not comprehensive as they do not cover all the current districts.In certain areas particularly in North Eastern province, the data only coversurban areas leaving out the rural. A second problem with the data is theaggregation level. The survey results are reasonable at the national and theprovincial levels. The precision of the aggregation however declines as the
results are disaggregated at the district level.
Pul
ling
Apar
t: Fa
cts a
nd Fi
gure
s on
Ineq
ualit
y in
Keny
a24
Epilogue
Some ten striking features on inequality in Kenya
1. Differences in income. The 10% richest households in Kenya controlmore than 42% of all incomes while the poorest 0.76% of income. Thismeans that while the top rich Kenyan earns 56 shillings, the bottompoor earns 1 shilling.
2. Differences in life expectancy. A person being born in Nyanzaprovince can expect to live 19 years less than his fellow citizen in Centralprovince. At the district level, life expectancy in Meru is double that inMombasa, 68.6 and 33.1 years respectively.
3. Differences in unemployment between men and women. Forthe age group 20-24 years, there are about 274,000 unemployed womenin urban areas compared to about 73,000 in the case of men of thesame age group.
4. Differences in HIV/AIDs prevalence. In Nyanza province 15% ofthe population are infected with the HIV/AIDs virus while the infectionrate in North Eastern province is negligible, estimated at about 0%.
5. Differences in school enrolment. Going by the enrolment rates,practically every child in Central province attends primary schoolcompared to about one out of three children in North Eastern go toschool. For secondary school the difference is even bigger.
6. Differences in access to water. The proportion of households withpiped water in their houses in urban areas is five times that in ruralareas, about 19.2% and 3.8% respectively.
7. Differences in health reach. In Central province 20,000 peopleshare one doctor while in North Eastern province one doctor is sharedby 120,000 people.
Pulling Apart: Facts and Figures on Inequality in Kenya25
8. Difference in immunisation and mortality. The coverage of childimmunization in Nyanza province is less than half that in Central, thatis, 38% compared to 79% respectively. There are about twice as manyinfants dying before their first birthday in Nyanza province comparedto Rift Valley, that is, 133 and 61 deaths per 1000 live births,respectively.
9. Differences in gender outcomes. About 93% of women in NorthEastern province have no education at all, compared to 3% in Centralprovince. Of the 2,140 elected councillors in 2002, only 97 were women.Of the 210 elected Members of Parliament in 2002 only 9 are women.
10. Differences in Poverty levels . Poverty levels can vary within andwithout regions. For instance, although the proportion of people livingbelow the poverty line in Nairobi is 44%, poverty levels range from 8%in Nairobi West, Kibera Division to 77% in Makongeni, MakadaraDivision.
Pul
ling
Apar
t: Fa
cts a
nd Fi
gure
s on
Ineq
ualit
y in
Keny
a26