Embed Size (px)
Citation preview

CBRE RESEARCH
PUGET SOUND
FLEXIBLE OFFICE SPACE GUIDE
2 © 2020 CBRE, INC.US FLEX | CBRE RESEARCH
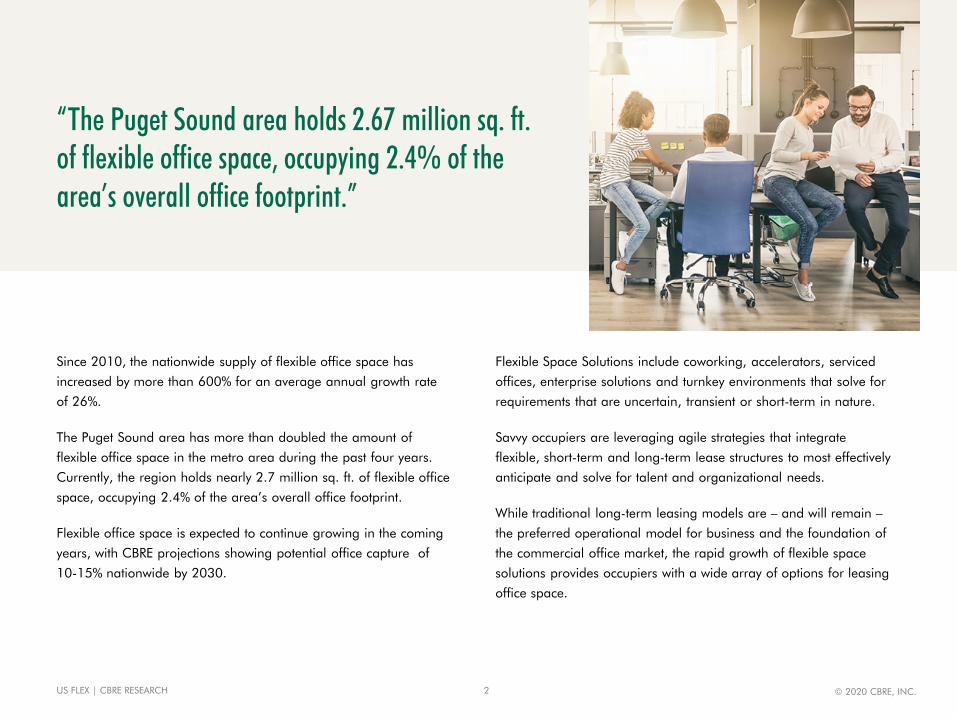
Since 2010, the nationwide supply of flexible office space has
increased by more than 600% for an average annual growth rate
of 26%.
The Puget Sound area has more than doubled the amount of
flexible office space in the metro area during the past four years.
Currently, the region holds nearly 2.7 million sq. ft. of flexible office
space, occupying 2.4% of the area’s overall office footprint.
Flexible office space is expected to continue growing in the coming
years, with CBRE projections showing potential office capture of
10-15% nationwide by 2030.
Flexible Space Solutions include coworking, accelerators, serviced
offices, enterprise solutions and turnkey environments that solve for
requirements that are uncertain, transient or short-term in nature.
Savvy occupiers are leveraging agile strategies that integrate
flexible, short-term and long-term lease structures to most effectively
anticipate and solve for talent and organizational needs.
While traditional long-term leasing models are – and will remain –
the preferred operational model for business and the foundation of
the commercial office market, the rapid growth of flexible space
solutions provides occupiers with a wide array of options for leasing
office space.
“The Puget Sound area holds 2.67 million sq. ft. of flexible office space, occupying 2.4% of the area’s overall office footprint.”

3 © 2020 CBRE, INC.US FLEX | CBRE RESEARCH
0.43
0.720.89 0.98
1.20
1.92
2.67
0.0
0.5
1.0
1.5
2.0
2.5
3.0
2013 2014 2015 2016 2017 2018 2019
Milli
ons (
Sq. F
t.)
Flexible office occupancy in the Puget Sound has increased in velocity
dramatically in the last few years, with the amount of space more than
tripling between 2015 and 2019, to 2.67 million sq. ft. Thirty-nine
different flexible office providers operate in the region, and come in a
wide variety, including both local and national, as well as niche providers
that focus on a specific industry or group of people.
Source: CBRE Research, Q1 2020.
FIGURE 1: SEATTLE METRO ANNUAL FLEXIBLE OFFICE OCCUPANCY
27Local
providers 12National or international
providers
6Providers with
a niche purpose 6
Accelerator/ Incubator1
Non-profit

4 © 2020 CBRE, INC.US FLEX | CBRE RESEARCH
0.0 0.4 0.8 1.2 1.6 2.0
Downtown
Eastside
Close-In
Tacoma
Southend
Northend
2019 2018
0.0 0.5 1.0 1.5 2.0
WeWork
Regus
Spaces
Industrious
Galvanize
Novel
Impact Hub
All Others
2019 2018
PROVIDER SHARE SUBMARKET SHARE
Downtown 39%
FLEXIBLE OFFICE SPACE AS %
OF CURRENT TOTAL OFPUGET SOUND OFFICE
MARKET
2.4%
FIGURE 2: PROVIDER AND SUBMARKET SHARE OF TOTAL PUGET SOUND FLEXIBLE OFFICE SPACE
12.9%FLEXIBLE OFFICE
SPACE AS %OF 2019 PUGET SOUND
NEW OFFICE LEASES
Sq. Ft. Leased (Millions)Sq. Ft. Leased (Millions)
+76%
0%
+265%
+22%
0%
+38%
+31%
+70%
+373%
+70%
0%
Source: CBRE Research, Q1 2020.

5 © 2020 CBRE, INC.US FLEX | CBRE RESEARCH

6 © 2020 CBRE, INC.US FLEX | CBRE RESEARCH
$25
$30
$35
$40
$45
$50
$55
$60
0100200300400500600700800
Avg.
Class
A As
king R
ent (
Dot)
Thou
sand
s Sq.
Ft. (
Bar)
Source: CBRE Research, Q1 2020.
67%27%
6%
Class A Class B Class C
Flexible space in the Puget Sound has clustered in
dense submarkets with premium office space as
operators have increasingly shifted towards large,
Class A buildings in downtown submarkets.
Class A buildings have accounted for 85% of new
flexible space leased since 2018, up from 57% in
2016.
Seattle CBD, Denny Regrade and Bellevue CBD
combine for almost 60% of the Puget Sound’s
flexible space inventory with 1.56 million sq. ft.
FIGURE 3: FLEXIBLE DISTRICT BREAKDOWN
FIGURE 4: FLEXIBLE OFFICE BY BUILDING CLASS
2.7 MSF
Source: CBRE Research, Q1 2020.

7 © 2020 CBRE, INC.US FLEX | CBRE RESEARCH
0.00.10.20.30.40.50.60.70.80.91.01.11.21.31.4
2013 2014 2015 2016 2017 2018 2019
Milli
ons (
Sq. F
t.)
Under 25% 25%-50% 50%-75% 75%-100%
0.00.10.20.30.40.50.60.70.80.91.0
2013 2014 2015 2016 2017 2018 2019
Milli
ons (
Sq. F
t.)
Under 25K Sq. Ft. 25K-50K Sq. Ft. 50K-75K Sq. Ft. 75K+ Sq. Ft.
FIGURE 5: FLEXIBLE OFFICE SPACE BY SIZE
National flexible space providers have been a major
force in the Puget Sound office market since 2015.
These companies have contributed to large-block
vacancy compression, accounting for 87% of flex leases
of 75,000 sq. ft. or larger.
Large-scale leases were non-existent in 2015 but have
flooded the market in recent years. Leases 75,000 sq. ft.
and larger now account for over 33% of the leased flex
space.
The appetite for large buildings in urban centers has
kept pace with the increase in block size. The
percentage of space leased on a building-to-building
bases has notably contracted, even as the average lease
size has grown almost 50% since 2016.
FIGURE 6: FLEXIBLE OFFICE SPACE SHARE OF BUILDING (Sq. Ft.)
Source: CBRE Research, Q1 2020.

8 © 2020 CBRE, INC.US FLEX | CBRE RESEARCH
0.0
0.5
1.0
1.5
2.0
2.5
3.0
2013 2014 2015 2016 2017 2018 2019
Millio
n (S
q. Ft.
)
Enterprise Tenants All Other Tenants
Tech-savvy entrepreneurs and startups still buoy
demand for flexible space. Large corporations—also
known as enterprise tenants—have increased their
flexible space footprint in recent years.
Flex space occupied by enterprise tenants has grown
to nearly one quarter of total flex leases in the area.
The growth of these tenants will continue to be a
driver of Puget Sound flex trends going forward.
Enterprise tenants have a particularly sizeable
footprint in the Bellevue CBD and Denny Regrade,
representing over 50% of flex space occupancy in
each of those submarkets.
FIGURE 7: ENTERPRISE TENANT SHARE OF FLEXIBLE OFFICE SPACE
0 200,000 400,000 600,000 800,000 1,000,000
Under 25K Sq. Ft.
25K-50K Sq. Ft.
50K-75K Sq. Ft.
75K+ Sq. Ft.
Enterprise Tenants All Other Tenants
FIGURE 8: ENTERPRISE TENANT SHARE OF FLEXIBLE OFFICE SPACE BY SIZE RANGE OF LOCATION
Note: “Enterprise Tenants” defined as established users occupying over 100,000 sq. ft. of traditional office space in the Puget Sound Area.Source: CBRE Research, Q1 2020.
9 © 2020 CBRE, INC.US FLEX | CBRE RESEARCH
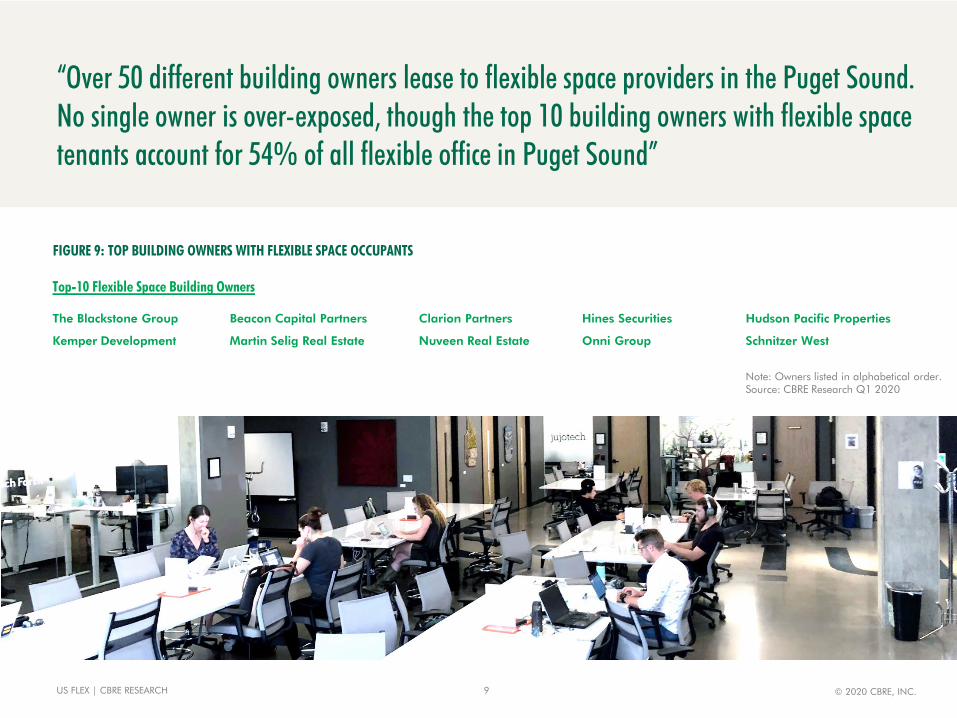
Hines Securities
Onni Group
Clarion Partners
Nuveen Real Estate
Beacon Capital Partners
Martin Selig Real Estate
The Blackstone Group
Kemper Development
Hudson Pacific Properties
Schnitzer West
Top-10 Flexible Space Building Owners
FIGURE 9: TOP BUILDING OWNERS WITH FLEXIBLE SPACE OCCUPANTS
Note: Owners listed in alphabetical order. Source: CBRE Research Q1 2020
“Over 50 different building owners lease to flexible space providers in the Puget Sound. No single owner is over-exposed, though the top 10 building owners with flexible space tenants account for 54% of all flexible office in Puget Sound”

10 © 2020 CBRE, INC.US FLEX | CBRE RESEARCH
Though CBRE projects flexible office to grow at a slower pace nationally, the fundamentals of the Puget Sound’s economic environment make a strong case for this sector’s continued viability.
Limited office supply and pent-up demand has tilted the market to be more landlord favorable. Vacancy is at 20-year low and asking rents continue to rise sparking competition for urban office space and leaving very little room in the direct lease market for the optionality that flexible space provides.
Venture capital investment in Puget Sound tech startups broke $1 billion dollars in 2019, more than double the level three years prior. These new, rapidly growing companies are key tenants for flexible office providers that can uniquely accommodate their changing needs.
Large enterprise tenants have begun to appreciate the shorter terms that flexible space providers offer in recent years. Whether this trend continues will likely depend on the ability of these providers to manage and amenitize office space in ways that continue to anticipate organizational needs and add value.
Despite WeWork’s command of the current market, the region continues to diversify. Seven new flexible space operators entered the market in 2019, with at least two more confirmed for 2020. New flexible office provider requirements have already topped 525,000 sq. ft. going into 2020.
“Though CBRE projects flexible office to grow at a slower pace nationally, the fundamentals of the Puget Sound’s economic environment make a strong case for this sector’s continued viability.”
11 © 2020 CBRE, INC.US FLEX | CBRE RESEARCH
John Miller
Senior Managing Director
Pacific Northwest Region
+1 206 292 6102
Nolan Watson
Senior Research Analyst
Pacific Northwest Region
+1 206 292 6121
Carolyn Davis
Research Manager
Seattle Area Research
+1 206 292 6098
Julie Whelan
Senior Director of Research
Head of Americas Occupier Thought Leadership
+1 617 912 5229
Anne Marie Fall
Sales Director
Seattle Area
+1 303 628 1743
Lexi Russell
Research Director
Mountain-Northwest Region
+1 415 772 0272
CONTACTS
To learn more about CBRE Research or to download our reports, visit cbre.com/research.
Additional U.S. research produced by CBRE Research can be found at www.cbre.us/research.
CBRE’S AGILE REAL ESTATE KNOWLEDGE HUB
A one-stop shop to help you better understand what agility—from coworking to flexible space to shared workplaces to optimized portfolios—means for real estate strategies and the opportunities to leverage new models and ideas.
Visit cbre.com/agile
Disclaimer: Information contained herein, including projections, has been obtained from sources believed to be reliable. While we do not doubt its accuracy, we have not verified it and make no guarantee, warranty or representation about it. It is your responsibility to confirm independently its accuracy and completeness. This information is presented exclusively for use by CBRE clients and professionals and all rights to the material are reserved and cannot be reproduced without prior written permission of CBRE.