Embed Size (px)
Citation preview

PUBLISHED VERSION
Citation: Lari, Martina; Rizzi, Ermanno; Mona, Stefano; Corti, Giorgio; Catalano, Giulio; Chen, Kefei; Vernesi, Cristiano; Larson, Greger; Boscato, Paolo; De Bellis, Gianluca; Cooper, Alan; Caramelli, David; Bertorelle, Giorgio. The Complete mitochondrial genome of an 11,450-year-old Aurochsen (Bos primigenius) from Central Italy BMC Evolutionary Biology, 2011; 11(32):1-10.
Rights statement: © 2011 Lari et al; licensee BioMed Central Ltd. This is an Open Access article distributed under the terms of the Creative Commons Attribution License (http://creativecommons.org/licenses/by/2.0), which permits unrestricted use, distribution, and reproduction in any medium, provided the original work is properly cited.
http://hdl.handle.net/2440/65543
PERMISSIONS
http://www.biomedcentral.com/info/about/license
BioMed Central Open Access license agreement
Brief summary of the agreement
Anyone is free:
• to copy, distribute, and display the work; • to make derivative works; • to make commercial use of the work;
Under the following conditions: Attribution
• the original author must be given credit; • for any reuse or distribution, it must be made clear to others what the license
terms of this work are; • any of these conditions can be waived if the authors gives permission.
Statutory fair use and other rights are in no way affected by the above.
23 August 2011
RESEARCH ARTICLE Open Access
The Complete Mitochondrial Genome of an11,450-year-old Aurochsen (Bos primigenius)from Central ItalyMartina Lari1, Ermanno Rizzi2, Stefano Mona3,8, Giorgio Corti2, Giulio Catalano1, Kefei Chen4, Cristiano Vernesi5,Greger Larson6, Paolo Boscato7, Gianluca De Bellis2, Alan Cooper4, David Caramelli1, Giorgio Bertorelle3*
Abstract
Background: Bos primigenius, the aurochs, is the wild ancestor of modern cattle breeds and was formerlywidespread across Eurasia and northern Africa. After a progressive decline, the species became extinct in 1627. Theorigin of modern taurine breeds in Europe is debated. Archaeological and early genetic evidence point to a singleNear Eastern origin and a subsequent spread during the diffusion of herding and farming. More recent geneticdata are instead compatible with local domestication events or at least some level of local introgression from theaurochs. Here we present the analysis of the complete mitochondrial genome of a pre-Neolithic Italian aurochs.
Results: In this study, we applied a combined strategy employing both multiplex PCR amplifications and 454pyrosequencing technology to sequence the complete mitochondrial genome of an 11,450-year-old aurochsspecimen from Central Italy. Phylogenetic analysis of the aurochs mtDNA genome supports the conclusions fromprevious studies of short mtDNA fragments - namely that Italian aurochsen were genetically very similar to moderncattle breeds, but highly divergent from the North-Central European aurochsen.
Conclusions: Complete mitochondrial genome sequences are now available for several modern cattle and twopre-Neolithic mtDNA genomes from very different geographic areas. These data suggest that previously identifiedsub-groups within the widespread modern cattle mitochondrial T clade are polyphyletic, and they support thehypothesis that modern European breeds have multiple geographic origins.
BackgroundGenomic analyses of ancient samples are limited princi-pally by DNA preservation. Standard ancient DNA meth-ods that consist of amplification, followed by cloning andsequencing of multiple clones, have been used to obtainmitochondrial genomes from the bones of mammoths andother permafrost-embedded animals, where up to 400-500base pair DNA fragments can be retrieved [1-4]. However,these methods are not as useful for less well-preservedsamples [5] where the preference is for differentapproaches based on the development of metagenomiclibraries or direct large-scale genome sequencing throughNext Generation massively-parallel sequencing. For exam-ple, the mitochondrial genome and several million base
pairs of nuclear DNA from Neanderthal bone fragmentswere sequenced with a Next Generation approach [6-8]and 80% of the diploid genome from an extinct Paleo-Eskimo was recovered with a similar procedure [9]. Thesepowerful technologies are extremely well suited for theanalysis of bulk genomic DNA extracted from ancientremains [6,10,11] but their use for characterization of themitochondrial genome is less effective outside of mtDNA-enriched tissues such as hair shafts [12-15]. Recently,selective target enrichment prior to Next Generationultra-deep sequencing has also been shown to be anappropriate method for the characterization of mitochon-drial genomes from ancient tissues [16-20].In this study, we applied a combined strategy that
made use of multiplex PCR amplifications and 454 pyro-sequencing technology to sequence the complete mito-chondrial genome of a Bos primigenius sampleexcavated from Vado all’Arancio rockshelter in Central
* Correspondence: [email protected] di Biologia ed Evoluzione, Università di Ferrara, Ferrara, ItalyFull list of author information is available at the end of the article
Lari et al. BMC Evolutionary Biology 2011, 11:32http://www.biomedcentral.com/1471-2148/11/32
© 2011 Lari et al; licensee BioMed Central Ltd. This is an Open Access article distributed under the terms of the Creative CommonsAttribution License (http://creativecommons.org/licenses/by/2.0), which permits unrestricted use, distribution, and reproduction inany medium, provided the original work is properly cited.
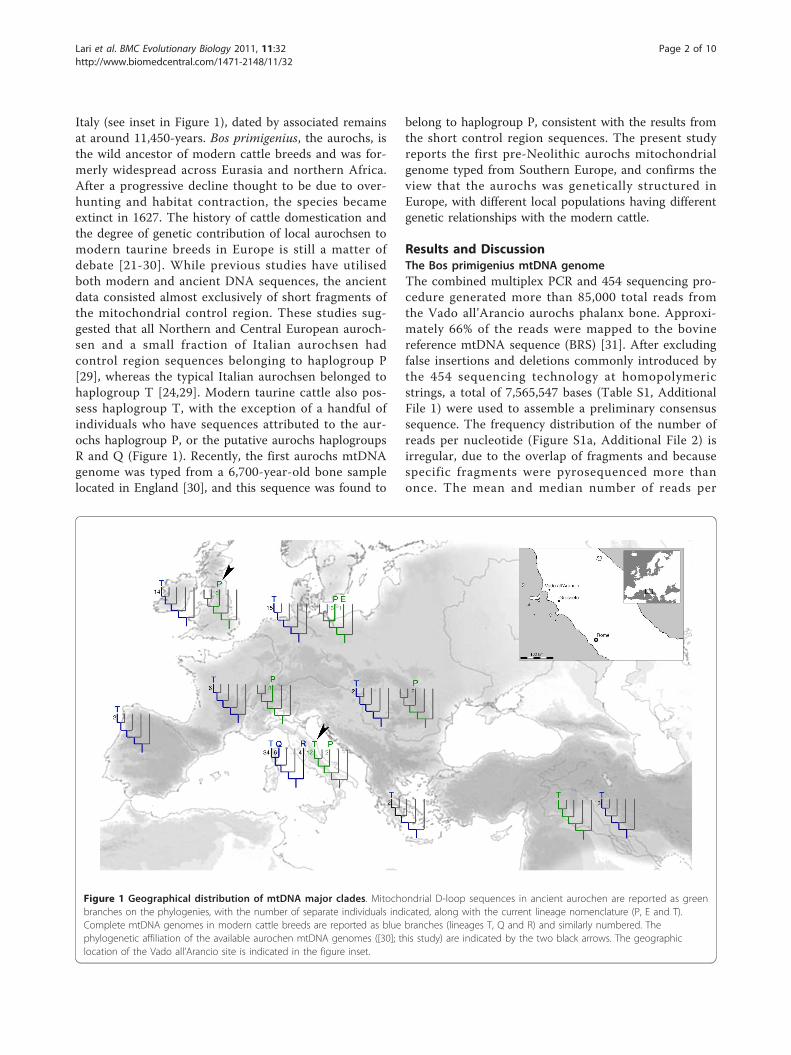
Italy (see inset in Figure 1), dated by associated remainsat around 11,450-years. Bos primigenius, the aurochs, isthe wild ancestor of modern cattle breeds and was for-merly widespread across Eurasia and northern Africa.After a progressive decline thought to be due to over-hunting and habitat contraction, the species becameextinct in 1627. The history of cattle domestication andthe degree of genetic contribution of local aurochsen tomodern taurine breeds in Europe is still a matter ofdebate [21-30]. While previous studies have utilisedboth modern and ancient DNA sequences, the ancientdata consisted almost exclusively of short fragments ofthe mitochondrial control region. These studies sug-gested that all Northern and Central European auroch-sen and a small fraction of Italian aurochsen hadcontrol region sequences belonging to haplogroup P[29], whereas the typical Italian aurochsen belonged tohaplogroup T [24,29]. Modern taurine cattle also pos-sess haplogroup T, with the exception of a handful ofindividuals who have sequences attributed to the aur-ochs haplogroup P, or the putative aurochs haplogroupsR and Q (Figure 1). Recently, the first aurochs mtDNAgenome was typed from a 6,700-year-old bone samplelocated in England [30], and this sequence was found to
belong to haplogroup P, consistent with the results fromthe short control region sequences. The present studyreports the first pre-Neolithic aurochs mitochondrialgenome typed from Southern Europe, and confirms theview that the aurochs was genetically structured inEurope, with different local populations having differentgenetic relationships with the modern cattle.
Results and DiscussionThe Bos primigenius mtDNA genomeThe combined multiplex PCR and 454 sequencing pro-cedure generated more than 85,000 total reads fromthe Vado all’Arancio aurochs phalanx bone. Approxi-mately 66% of the reads were mapped to the bovinereference mtDNA sequence (BRS) [31]. After excludingfalse insertions and deletions commonly introduced bythe 454 sequencing technology at homopolymericstrings, a total of 7,565,547 bases (Table S1, AdditionalFile 1) were used to assemble a preliminary consensussequence. The frequency distribution of the number ofreads per nucleotide (Figure S1a, Additional File 2) isirregular, due to the overlap of fragments and becausespecific fragments were pyrosequenced more thanonce. The mean and median number of reads per
Figure 1 Geographical distribution of mtDNA major clades. Mitochondrial D-loop sequences in ancient aurochen are reported as greenbranches on the phylogenies, with the number of separate individuals indicated, along with the current lineage nomenclature (P, E and T).Complete mtDNA genomes in modern cattle breeds are reported as blue branches (lineages T, Q and R) and similarly numbered. Thephylogenetic affiliation of the available aurochen mtDNA genomes ([30]; this study) are indicated by the two black arrows. The geographiclocation of the Vado all’Arancio site is indicated in the figure inset.
Lari et al. BMC Evolutionary Biology 2011, 11:32http://www.biomedcentral.com/1471-2148/11/32
Page 2 of 10
nucleotide were 463 and 93 respectively. Overall, thenumber of reads for each specific fragment analysedwith the 454 approach was between one and twoorders of magnitude higher than the number of clonescommonly sequenced using traditional aDNAapproaches. At each site, the most frequent nucleotidewas observed in 99.4% of the reads on average (FigureS1b, Additional File 2).Among the 4113 sites where amplicons overlap, we
analysed if different error patterns were observed atsites which are either monomorphic or polymorphic inmodern breeds, or at homologous sites typed in differ-ent amplicons. Different patterns are expected in caseof contamination with modern DNA. Very similarallele frequencies spectra were observed consideringseparately monomorphic and polymorphic sites inmodern breeds, and only 6 out of 176 sites which arepolymorphic in the cattle had a rare allele at a fre-quency > 2% among the reads (and never larger than10%). In addition, the frequency of nucleotide misin-corporation among reads shows a pattern typical ofancient templates, with an excess of type II over type Itransitions (ratio typeII/typeI = 1.58; see Table S2,Additional File 3).The Vado all’Arancio aurochs sequence showed eight
indels and nine mutations compared to the Bos taurusreference sequence [31]. However we noted that all butone of the indels involved an insertion/deletion of thelast base in a homopolymeric string of > 5 bases, whichis likely to result from an artefact of the 454 pyrose-quencing technology [32]. In two other positions, C- >T substitutions were present in only 54% and 58%respectively of the total reads, a strong signal of nucleo-tide misincorporations due to degradation of the originaltemplates rather than real substitutions. For this reasonwe carefully checked these ambiguous positions by sin-gleplex PCRs, cloning and Sanger sequencing (Figure S2,Additional File 4) before assembling the definitive con-sensus sequence for the specimen of 16,339 bp.The consensus Vado all’Arancio aurochs sequence
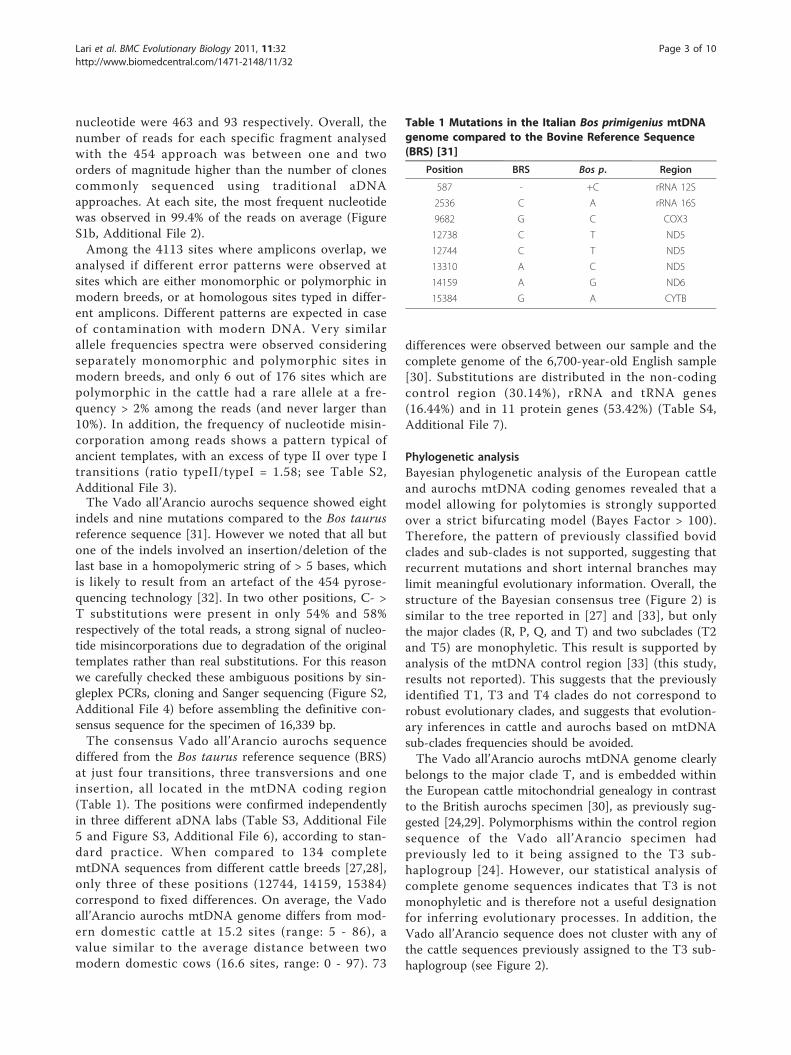
differed from the Bos taurus reference sequence (BRS)at just four transitions, three transversions and oneinsertion, all located in the mtDNA coding region(Table 1). The positions were confirmed independentlyin three different aDNA labs (Table S3, Additional File5 and Figure S3, Additional File 6), according to stan-dard practice. When compared to 134 completemtDNA sequences from different cattle breeds [27,28],only three of these positions (12744, 14159, 15384)correspond to fixed differences. On average, the Vadoall’Arancio aurochs mtDNA genome differs from mod-ern domestic cattle at 15.2 sites (range: 5 - 86), avalue similar to the average distance between twomodern domestic cows (16.6 sites, range: 0 - 97). 73
differences were observed between our sample and thecomplete genome of the 6,700-year-old English sample[30]. Substitutions are distributed in the non-codingcontrol region (30.14%), rRNA and tRNA genes(16.44%) and in 11 protein genes (53.42%) (Table S4,Additional File 7).
Phylogenetic analysisBayesian phylogenetic analysis of the European cattleand aurochs mtDNA coding genomes revealed that amodel allowing for polytomies is strongly supportedover a strict bifurcating model (Bayes Factor > 100).Therefore, the pattern of previously classified bovidclades and sub-clades is not supported, suggesting thatrecurrent mutations and short internal branches maylimit meaningful evolutionary information. Overall, thestructure of the Bayesian consensus tree (Figure 2) issimilar to the tree reported in [27] and [33], but onlythe major clades (R, P, Q, and T) and two subclades (T2and T5) are monophyletic. This result is supported byanalysis of the mtDNA control region [33] (this study,results not reported). This suggests that the previouslyidentified T1, T3 and T4 clades do not correspond torobust evolutionary clades, and suggests that evolution-ary inferences in cattle and aurochs based on mtDNAsub-clades frequencies should be avoided.The Vado all’Arancio aurochs mtDNA genome clearly
belongs to the major clade T, and is embedded withinthe European cattle mitochondrial genealogy in contrastto the British aurochs specimen [30], as previously sug-gested [24,29]. Polymorphisms within the control regionsequence of the Vado all’Arancio specimen hadpreviously led to it being assigned to the T3 sub-haplogroup [24]. However, our statistical analysis ofcomplete genome sequences indicates that T3 is notmonophyletic and is therefore not a useful designationfor inferring evolutionary processes. In addition, theVado all’Arancio sequence does not cluster with any ofthe cattle sequences previously assigned to the T3 sub-haplogroup (see Figure 2).
Table 1 Mutations in the Italian Bos primigenius mtDNAgenome compared to the Bovine Reference Sequence(BRS) [31]
Position BRS Bos p. Region
587 - +C rRNA 12S
2536 C A rRNA 16S
9682 G C COX3
12738 C T ND5
12744 C T ND5
13310 A C ND5
14159 A G ND6
15384 G A CYTB
Lari et al. BMC Evolutionary Biology 2011, 11:32http://www.biomedcentral.com/1471-2148/11/32
Page 3 of 10
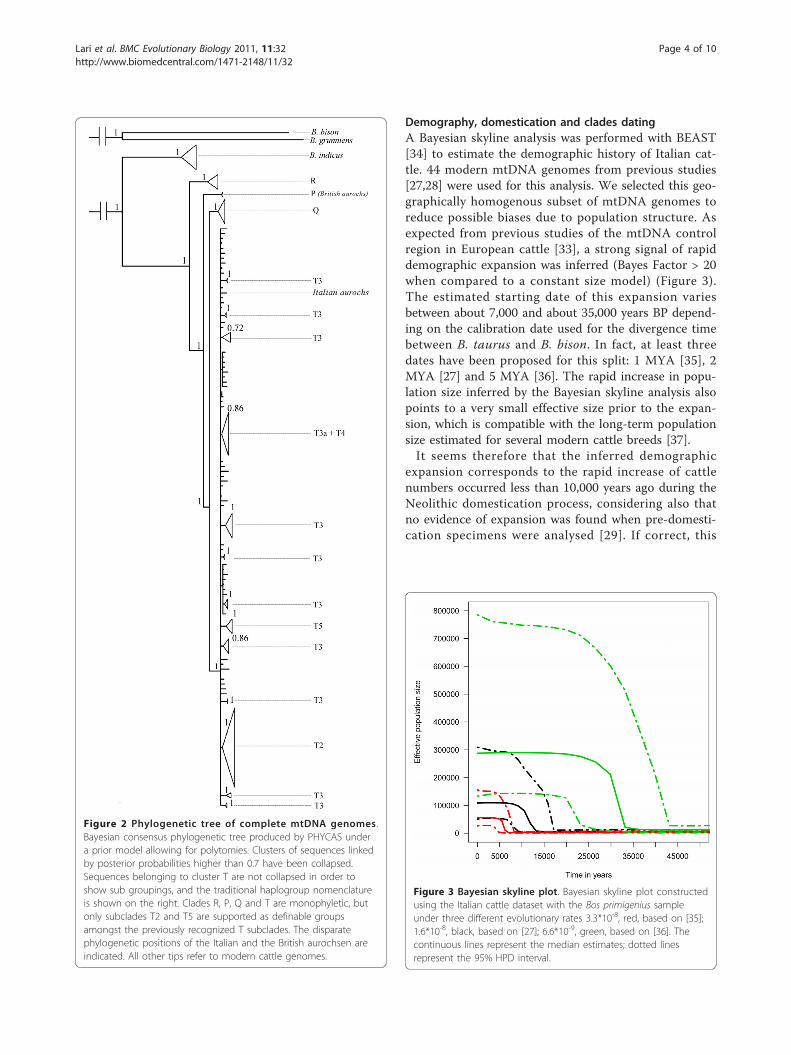
Demography, domestication and clades datingA Bayesian skyline analysis was performed with BEAST[34] to estimate the demographic history of Italian cat-tle. 44 modern mtDNA genomes from previous studies[27,28] were used for this analysis. We selected this geo-graphically homogenous subset of mtDNA genomes toreduce possible biases due to population structure. Asexpected from previous studies of the mtDNA controlregion in European cattle [33], a strong signal of rapiddemographic expansion was inferred (Bayes Factor > 20when compared to a constant size model) (Figure 3).The estimated starting date of this expansion variesbetween about 7,000 and about 35,000 years BP depend-ing on the calibration date used for the divergence timebetween B. taurus and B. bison. In fact, at least threedates have been proposed for this split: 1 MYA [35], 2MYA [27] and 5 MYA [36]. The rapid increase in popu-lation size inferred by the Bayesian skyline analysis alsopoints to a very small effective size prior to the expan-sion, which is compatible with the long-term populationsize estimated for several modern cattle breeds [37].It seems therefore that the inferred demographic
expansion corresponds to the rapid increase of cattlenumbers occurred less than 10,000 years ago during theNeolithic domestication process, considering also thatno evidence of expansion was found when pre-domesti-cation specimens were analysed [29]. If correct, this
Figure 3 Bayesian skyline plot. Bayesian skyline plot constructedusing the Italian cattle dataset with the Bos primigenius sampleunder three different evolutionary rates 3.3*10-8, red, based on [35];1.6*10-8, black, based on [27]; 6.6*10-9, green, based on [36]. Thecontinuous lines represent the median estimates; dotted linesrepresent the 95% HPD interval.
Figure 2 Phylogenetic tree of complete mtDNA genomes .Bayesian consensus phylogenetic tree produced by PHYCAS undera prior model allowing for polytomies. Clusters of sequences linkedby posterior probabilities higher than 0.7 have been collapsed.Sequences belonging to cluster T are not collapsed in order toshow sub groupings, and the traditional haplogroup nomenclatureis shown on the right. Clades R, P, Q and T are monophyletic, butonly subclades T2 and T5 are supported as definable groupsamongst the previously recognized T subclades. The disparatephylogenetic positions of the Italian and the British aurochsen areindicated. All other tips refer to modern cattle genomes.
Lari et al. BMC Evolutionary Biology 2011, 11:32http://www.biomedcentral.com/1471-2148/11/32
Page 4 of 10
would suggest that the most likely divergence timebetween B. taurus and B. bison is older than 1 MYA butmuch younger than 2 MYA.We used the 1 MYA calibration date to estimate the
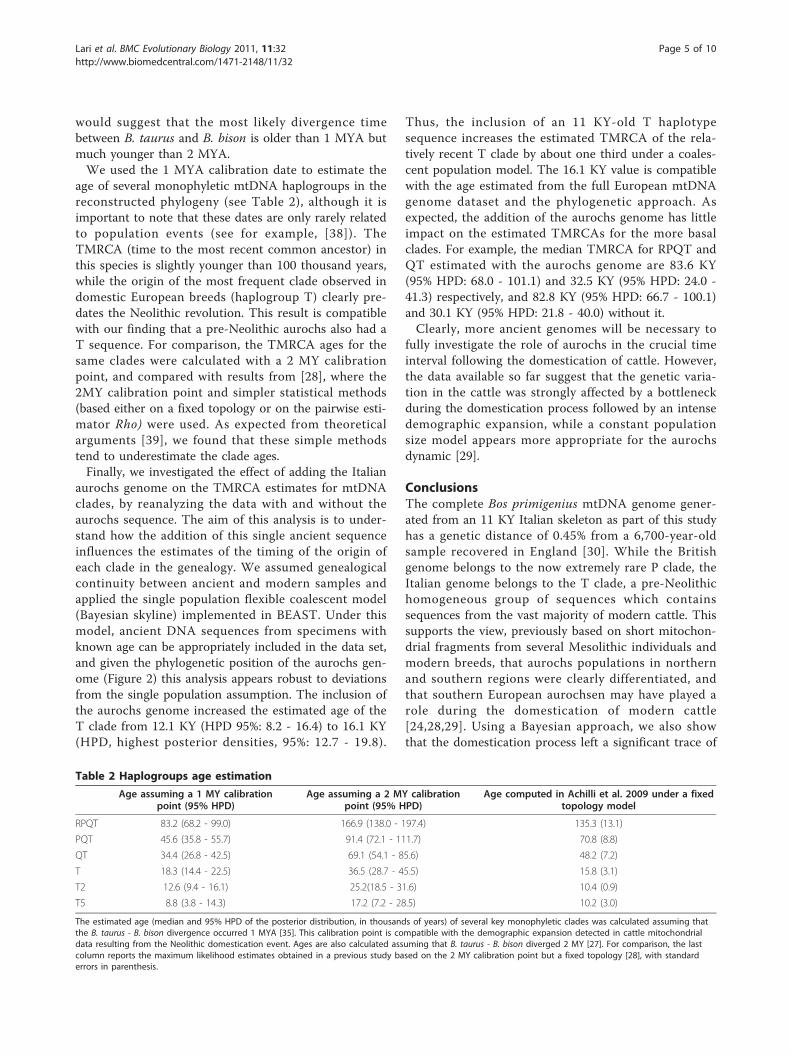
age of several monophyletic mtDNA haplogroups in thereconstructed phylogeny (see Table 2), although it isimportant to note that these dates are only rarely relatedto population events (see for example, [38]). TheTMRCA (time to the most recent common ancestor) inthis species is slightly younger than 100 thousand years,while the origin of the most frequent clade observed indomestic European breeds (haplogroup T) clearly pre-dates the Neolithic revolution. This result is compatiblewith our finding that a pre-Neolithic aurochs also had aT sequence. For comparison, the TMRCA ages for thesame clades were calculated with a 2 MY calibrationpoint, and compared with results from [28], where the2MY calibration point and simpler statistical methods(based either on a fixed topology or on the pairwise esti-mator Rho) were used. As expected from theoreticalarguments [39], we found that these simple methodstend to underestimate the clade ages.Finally, we investigated the effect of adding the Italian
aurochs genome on the TMRCA estimates for mtDNAclades, by reanalyzing the data with and without theaurochs sequence. The aim of this analysis is to under-stand how the addition of this single ancient sequenceinfluences the estimates of the timing of the origin ofeach clade in the genealogy. We assumed genealogicalcontinuity between ancient and modern samples andapplied the single population flexible coalescent model(Bayesian skyline) implemented in BEAST. Under thismodel, ancient DNA sequences from specimens withknown age can be appropriately included in the data set,and given the phylogenetic position of the aurochs gen-ome (Figure 2) this analysis appears robust to deviationsfrom the single population assumption. The inclusion ofthe aurochs genome increased the estimated age of theT clade from 12.1 KY (HPD 95%: 8.2 - 16.4) to 16.1 KY(HPD, highest posterior densities, 95%: 12.7 - 19.8).
Thus, the inclusion of an 11 KY-old T haplotypesequence increases the estimated TMRCA of the rela-tively recent T clade by about one third under a coales-cent population model. The 16.1 KY value is compatiblewith the age estimated from the full European mtDNAgenome dataset and the phylogenetic approach. Asexpected, the addition of the aurochs genome has littleimpact on the estimated TMRCAs for the more basalclades. For example, the median TMRCA for RPQT andQT estimated with the aurochs genome are 83.6 KY(95% HPD: 68.0 - 101.1) and 32.5 KY (95% HPD: 24.0 -41.3) respectively, and 82.8 KY (95% HPD: 66.7 - 100.1)and 30.1 KY (95% HPD: 21.8 - 40.0) without it.Clearly, more ancient genomes will be necessary to
fully investigate the role of aurochs in the crucial timeinterval following the domestication of cattle. However,the data available so far suggest that the genetic varia-tion in the cattle was strongly affected by a bottleneckduring the domestication process followed by an intensedemographic expansion, while a constant populationsize model appears more appropriate for the aurochsdynamic [29].
ConclusionsThe complete Bos primigenius mtDNA genome gener-ated from an 11 KY Italian skeleton as part of this studyhas a genetic distance of 0.45% from a 6,700-year-oldsample recovered in England [30]. While the Britishgenome belongs to the now extremely rare P clade, theItalian genome belongs to the T clade, a pre-Neolithichomogeneous group of sequences which containssequences from the vast majority of modern cattle. Thissupports the view, previously based on short mitochon-drial fragments from several Mesolithic individuals andmodern breeds, that aurochs populations in northernand southern regions were clearly differentiated, andthat southern European aurochsen may have played arole during the domestication of modern cattle[24,28,29]. Using a Bayesian approach, we also showthat the domestication process left a significant trace of
Table 2 Haplogroups age estimation
Age assuming a 1 MY calibrationpoint (95% HPD)
Age assuming a 2 MY calibrationpoint (95% HPD)
Age computed in Achilli et al. 2009 under a fixedtopology model
RPQT 83.2 (68.2 - 99.0) 166.9 (138.0 - 197.4) 135.3 (13.1)
PQT 45.6 (35.8 - 55.7) 91.4 (72.1 - 111.7) 70.8 (8.8)
QT 34.4 (26.8 - 42.5) 69.1 (54.1 - 85.6) 48.2 (7.2)
T 18.3 (14.4 - 22.5) 36.5 (28.7 - 45.5) 15.8 (3.1)
T2 12.6 (9.4 - 16.1) 25.2(18.5 - 31.6) 10.4 (0.9)
T5 8.8 (3.8 - 14.3) 17.2 (7.2 - 28.5) 10.2 (3.0)
The estimated age (median and 95% HPD of the posterior distribution, in thousands of years) of several key monophyletic clades was calculated assuming thatthe B. taurus - B. bison divergence occurred 1 MYA [35]. This calibration point is compatible with the demographic expansion detected in cattle mitochondrialdata resulting from the Neolithic domestication event. Ages are also calculated assuming that B. taurus - B. bison diverged 2 MY [27]. For comparison, the lastcolumn reports the maximum likelihood estimates obtained in a previous study based on the 2 MY calibration point but a fixed topology [28], with standarderrors in parenthesis.
Lari et al. BMC Evolutionary Biology 2011, 11:32http://www.biomedcentral.com/1471-2148/11/32
Page 5 of 10
rapid demographic expansion in cattle mtDNA genomicvariation. Finally, our phylogenetic analyses suggest thatefforts to assign aurochs mitochondrial genomes withinspecific cattle sub-clades of the T clade may be irrele-vant, since the branching pattern within this cladeappears to contain several polytomies. This suggests thatstudies of the domestication process, which essentiallyinvolved individuals bearing T mtDNA genomes, maybe particularly complicated, and are likely to requireadditional information from nuclear markers.
MethodsMitochondrial genome sequencing in the aurochsVarious preliminary biochemical tests indicated that aphalanx bone sample excavated in Vado all’Arancio rockshelter (Massa Marittima, Grosseto, Italy, Figure 1) andascribed to Bos primigenius sp. by morphological andmorphometrical analysis [40], was well-preserved formolecular analysis (Table S5, Additional File 8 and FigureS4, Additional File 9). Three lines of evidence suggestedthat endogenous biomolecules were likely to be well-preserved [41,42]. Firstly, the degree of racemization forthree amino acids (aspartic acid, alanine and glutamine)was low (Table S5, Additional file 8), and this has beensuggested to be compatible with DNA survival [42,43],though concerns have been raised about the utility of thisapproach [44,45]. Second, we calculated that, under ourreaction conditions, the estimated copy number of a 180bp mtDNA target was greater than 5000 copies per reac-tion (5127 ± 912; standard curve fit values: Slope =-3.391, Y-intercept = 45.34, R2 = 0.977, Efficiency = 0.97).This value is much larger than the threshold underwhich consensus sequence determination is thought tobe seriously affected by nucleotide modifications presentin the ancient DNA molecules [46]. Third, using a systemof three overlapping primer pairs we obtained the samesequence for the hypervariable segment of the mtDNAcontrol region from different bone fragments and in mul-tiple PCRs (Figure S4, Additional File 9).The Vado all’Arancio rock shelter is a well known
Italian site with a clear stratigraphy, and was occupiedonly for a short period of time during the Late Palaeo-lithic. The presence of specific artifacts and the radiocar-bon dating of associated faunal remains (11,300 ± 150BPobtained in Rome for R1333, and 11,600 ± 130 obtainedin Lyon for Ly3415; average of 11,450 years BP) unequi-vocally date Vado all’Arancio rockshelter to a pre-Neolithic context preceding the spread of domestication[40]. This further confirms that the specimen belongs toan aurochs, rather than an early Holocene Bos taurus.We applied a combined typing strategy for mtDNA
genome sequencing. Multiplex PCR amplifications ofshort overlapping fragments covering the whole mtDNAgenome were used to enrich the total extracted DNA,
prior to 454 pyrosequencing of the pooled enrichedmaterial. A multiplex PCR approach has previously beenused for the reconstruction of ancient mithocondrial gen-omes [1,47,48,17]. Compared with a singleplex PCR strat-egy, multiplex PCR has two advantages: first, a smallquantity of starting material can be used to retrieve mul-tiple DNA fragments simultaneously, and second, limitedmanipulation of the original template reduces the risk ofsporadic contamination by exogenous DNA.We designed 130 overlapping primer pairs on the
basis of Bos taurus reference sequence (BRS) [31]. Pri-mer pairs (designed to produce 155 to 230-bp longDNA sequences) were arranged into four sets (A,B,C,D)with overlapping pairs in different sets (see AdditionalFile 10). Each multiplex PCR set was performed on eachdifferent extract following stringent criteria for ancientDNA analysis and sequence authentication [41]. Theamplification success for each primer pair was checkedwith secondary singleplex PCRs. All the amplificationproducts were then diluted to equal concentration,pooled, and used as a substrate for the FLX library pre-paration and pyrosequencing reaction using the RocheFLX/454 technology. After identifying sequence readswith the PCR primers at their termini, the primers weremasked and the resulting portion mapped against thereference sequence [NCBI accession: V00654] using theAmplicon Variant Analyzer application (AVA, Roche)with default parameters. Finally, starting from the AVAmulti-alignments, we generated consensus sequencesusing a home-made Python script, which assigned themost frequent base at each position. A large number ofmtDNA amplicons were sequenced to allow the consen-sus sequence to be determined accurately, withoutlaborious cloning and sequencing of PCR products.Amplicons with no or low coverage (< 10 reads) afterthe first round of sequencing were pooled again andpyrosequenced separately.Standard ancient DNA singleplex PCRs, cloning and
Sanger sequencing approaches were used to fill remain-ing gaps and resolve ambiguous sequences after the firstassembly of the total reads generated with the 454 tech-nology. Particular attention was paid to insertions ordeletions in homopolymer regions that are problematicfor the 454 pyrosequencing technology [32], and topotential misincorporations due to degradation in theoriginal template (see Additional File 10).Finally, to check the reproducibility of the results, we
replicated 16 selected amplicons in three differentlaboratories in Italy, Sweden and Australia (see TableS3, Additional File 5, and the Additional File 10).Amplicons that showed polymorphic positions withrespect to the BRS sequence, or with critical phyloge-netic markers, were replicated at Uppsala University(Sweden) and at the Innovation and Research Centre
Lari et al. BMC Evolutionary Biology 2011, 11:32http://www.biomedcentral.com/1471-2148/11/32
Page 6 of 10
(San Michele all’Adige, Trento, Italy). Control regionfragments and a small portion of the 12S gene weresequenced at Adelaide University (Australia).Additional details regarding the sample and the mole-
cular procedures are reported in the Additional File 10.
Phylogenetic analysis and demographyPhylogenetic inferences were performed on the codingregion (15440 bp) of the mtDNA alignment. Themodel of nucleotide substitution was selected bymeans of the MODELTEST software [49], according tothe Akaike information criterion (AIC). The modelresulting with the lowest AIC score was the GTR+g+I(general time reversible model with heterogeneity insubstitution rates plus a proportion of invariable sites).We performed Bayesian phylogenetic inference undertwo prior models: a) an unrooted, strictly bifurcatingmodel, and b) an unrooted model allowing for poly-tomies (following the algorithm proposed in [50]).Both analyses were performed using the software PHY-CAS [51], and the input file for this analysis is pro-vided as Additional File 11.The first model is similar to the standard unrooted
model implemented in MRBAYES 3.1.2 [52] with thedifference that a hyperprior parameter is used to modelthe rate of the exponential prior distribution on branchlengths (while in MRBAYES such parameter is fixed andset by the user). We used as hyperprior distribution aninverse gamma with mean 1.0 and variance 10.0, follow-ing [53]. In the second model, a polytomy prior [50]needs to be set. This value indicates the relative strengthof a less resolved topology compared to a more resolvedone: a value equal to 1 gives same prior to polytomic orstrictly bifurcating topologies, while values greater than1 places more weight on polytomic topologies. We setthe polytomy prior to e (Nepero’s number), following[50]. PHYCAS uses slice sampling to update continuousparameters and the LOCAL move of Larget and Simon[54] to update topology and branch lengths. In the sec-ond model that allowed for polytomies, a RJ-MCMCscheme was used because each iteration the number ofparameters can change (as the number of branches varydue to the presence of polytomies).PHYCAS was run twice for 200,000 cycles for both
models. A cycle on PHYCAS roughly corresponds to100 iterations in MRBAYES. We sampled one cycleevery 100, after discarding the first 100,000 cycles asburn-in. We compared the traces of the two runs tocheck for convergence. After the burn-in was removed,we compared both models using Bayes Factors. TheBayes Factor was computed as twice the differencebetween the log of the marginal likelihoods, which wereapproximated using the harmonic mean as suggested in[55]. To check if the heating procedure could produce
different results (which would in turn implies that a sin-gle MCMC chain could not converge properly to thecorrect posterior distribution), we ran the first modelusing MRBAYES. The analysis was run twice using fourincrementally heated chains with the default tempera-ture, over 2*108 generations long with a 20% burnin.Convergence was checked by examining the generationplot visualized with TRACER [56] and we computed thepotential scale reduction factor [57] with the sump func-tion in MRBAYES. The resulting tree topology as well asthe posterior probabilities of the various nodes werealmost identical to the results obtained with PHYCAS,suggesting that the posterior distribution was correctlyexplored using PHYCAS even without the heatingprocedure.Molecular dating is subject to many sources of errors.
Indeed, usually topology and branch lengths are notknown a priori and they need to be estimated from datawith the associated uncertainty in the estimation proce-dure. In addition, the calibration of molecular clockrelies on a known divergence time which is oftenassumed as a fixed value. The importance of a correctcalibration point (usually a fossil divergence) has beenwell acknowledged in the phylogenetic literature, thoughit is difficult to obtain a reliable estimate that can bereadily translated into an accurate molecular clock rate.The Bos spp. phylogeny is no exception to this rule, andseveral different paleontological data have been used tocalibrate the bovid mitochondrial clock. For this reason,we employed three divergent, though widely used cali-bration points and performed the following analyses forall of them. The three points were: a split betweenB. taurus and B. bison at 1 MYA [35], at 2 MYA [27]and at 5 MYA [36].We first performed phylogenetic dating on all our
dataset employing a bayesian algorithm implemented inBEAST [58]. The input file for BEAST is provided asAdditional File 12. We choose a Yule prior [59] ontopology and branch lengths and constrained the root ofour phylogeny (which coincides with the split B. taurus-B.bison) to one of the three calibration points above (i.e.,1MY, 2MY, and 5MY). Since the new B. primigenius spe-cimen is dated at more than 11,000 years B.P., weexcluded it from this analysis as the Yule prior has notbeen adapted to handle serial data. We ran each of theseanalyses twice for 20,000,000 MCMC, with a thinningvalue of 1,000. Since these models differ only in the age ofone node, we could have just estimated the scaled branchlengths and used the three calibration points to translatethem into years. The three analyses can be however con-sidered as an additional check for convergence. Weremoved the first 10% MCMC iterations as burnin. Underthis phylogenetic dating approach, we computed theTMRCA of several nodes of interest and, at the same
Lari et al. BMC Evolutionary Biology 2011, 11:32http://www.biomedcentral.com/1471-2148/11/32
Page 7 of 10
time, estimated the posterior distribution of the molecularclock rate.We then selected only Italian cattle and performed
bayesian based population genetic inference and mole-cular dating under two coalescent priors: constantpopulation size and the Bayesian skyline plot [58], withgene genealogies divided into three internode groupsand effective population size function fitted with a pie-cewise constant function of population size change.Both analyses were run using BEAST software for20,000,000 MCMC iterations with a 10% burn-in and athinning interval of 1,000. The input file for BEAST isprovided as Additional File 13. As local domesticationand/or introgression from aurochs into domesticbreeds in Italy cannot be excluded [24,27-29], theseanalyses were perfomed both without the new Bos pri-migenius sequence and including it (i.e., assuming thatItalian aurochs were direct ancestor of modern Italianbreeds). The constant population size model and theBayesian skyline were compared by means of BayesFactor, computed as described above. In these analyses,the mutation rate was fixed as the median values esti-mated from the previous BEAST phylogenetic analyses.These values, corresponding respectively to 1, 2, and 5million years of divergence between B. taurus and B.bison, are 3.3*10-8, 1.6*10-8, and 6.6*10-9. Populationsizes were estimated assuming a generation time of 7years [60].
Additional material
Additional File 1: Table S1. 454 sequencing results: variants in thereads mapped on bovine mitochondrial genome.
Additional File 2: Figure S1. Description of sequencing results.
Additional File 3: Table S2. Nucleotide misincorporations among reads.
Additional File 4: Figure S2. Results of singleplex PCRs, cloning andsequencing of ambiguous positions.
Additional File 5: Table S3. Amplification results of independentreplications of selected fragments.
Additional File 6: Figure S3. Sequence Results of independentreplications of selected fragments.
Additional File 7: Table S4. Location of substitutions between the Bosprimigenius from Italy (BVA2) the and Bos primigenius from England(CPC98) mtDNA genome sequences.
Additional File 8: Table S5. Preliminary test: aminoacids D/L ratio valuesfor the BVA2 sample.
Additional File 9: Figure S4. Preliminary test: results of amplification,cloning and sequencing of mtDNA control region fragments.
Additional File 10: Supplementary Materials and Methods. Additionaldetails regarding the samples and the molecular procedures
Additional File 11: Input file for PHYCAS. Input file with theparameters used for the PHYCAS analysis. The DNA sequences are notincluded (see Additional File 11).
Additional File 12: Input file for BEAST, phylogeny. Input file used forthe phylogenetic analysis in BEAST. In this file the clock is calibratedusing a 1 MY divergence between B.taurus and B. bison.
Additional File 13: Input file for BEAST, demography. Input file usedfor the demographic analysis in BEAST. The mutation rate in this file ismedian value estimated in BEAST using the Additional File 12.
List of abbreviationsHPD: highest posterior density; mtDNA: mitochondrial DNA; MYA: millions ofyears Ago; MY: millons of years; TMRCA: time to most recent commonancestor
AcknowledgementsThis study was supported by the University of Ferrara and the University ofFlorence. Grant FIRB n° RBLA03ER38 funds ER, GDB and GCo. “Futuro inRicerca” grant n° RBFR08U07M funds ML, ER, GCo, GDB, and DC.
Author details1Dipartimento di Biologia Evoluzionistica, Università di Firenze, Firenze, Italy.2Istituto di Tecnologie Biomediche, CNR, Segrate (MI), Italy. 3Dipartimento diBiologia ed Evoluzione, Università di Ferrara, Ferrara, Italy. 4Australian Centrefor Ancient DNA, University of Adelaide, Adelaide, Australia. 5IASMA Researchand Innovation Centre, Fondazione Edmund Mach, Trento, Italy.6Department of Archaeology, Durham University, Durham, UK. 7Dipartimentodi Scienze Ambientali, Università di Siena, Siena, Italy. 8EPHE (Ecole Pratiquedes Hautes Etudes), Muséum National d’Histoire Naturelle, Paris, France.
Authors’ contributionsML, GC, ER, GCa, CV, KC and GL performed aDNA laboratory analyses. PB,provided samples and radiocarbon/stratigraphic information. SM and GBperformed the statistical analyses. GCo, GDB, ER and ML performedbioinformatics analyses, GB and DC conceived the project. GB, DC, SM, ML, GLand AC wrote the paper. All authors read and approved the final manuscript.
Received: 21 July 2010 Accepted: 31 January 2011Published: 31 January 2011
References1. Krause J, Dear PH, Pollack JL, Slatkin M, Spriggs H, Barnes I, Lister AM,
Ebersberger I, Pääbo S, Hofreiter M: Multiplex amplification of themammoth mitochondrial genome and the evolution of Elephantidae.Nature 2006, 439:724-727.
2. Rogaev EI, Moliaka YK, Malyarchuk BA, Kondrashov FA, Derenko MV,Chumakov I, Grigorenko AP: Complete mitochondrial genome andphylogeny of Pleistocene mammoth Mammuthus primigenius. PLoS Biol2006, 4:e73.
3. Miller W, Drautz DI, Ratan A, Pusey B, Qi J, Lesk AM, Tomsho LP,Packard MD, Zhao F, Sher A, et al: Sequencing the nuclear genome of theextinct woolly mammoth. Nature 2008, 456:387-390.
4. Rohland N, Malaspinas AS, Pollack JL, Slatkin M, Matheus P, Hofreiter M:Proboscidean mitogenomics: Chronology and mode of elephantevolution using mastodon as outgroup. PLoS Biol 2007, 5:e207.
5. Bon C, Caudy N, de Dieuleveult M, Fosse P, Philippe M, Maksud F, Beraud-Colomb E, Bouzaid E, Kefi R, Laugier C, et al: Deciphering the completemitochondrial genome and phylogeny of the extinct cave bear in thePaleolithic painted cave of Chauvet. Proc Natl Acad Sci USA 2008,105:17447-17452.
6. Green RE, Krause J, Ptak SE, Briggs AW, Ronan MT, Simons JF, Du L,Egholm M, Rothberg JM, Paunovic M, et al: Analysis of one million basepairs of Neanderthal DNA. Nature 2006, 444:330-336.
7. Green RE, Malaspinas AS, Krause J, Briggs AW, Johnson PL, Uhler C,Meyer M, Good JM, Maricic T, Stenzel U, et al: A complete Neandertalmitochondrial genome sequence determined by high-throughputsequencing. Cell 2008, 134:416-426.
8. Green RE, Krause J, Briggs AW, Maricic T, Stenzel U, Kircher M, Patterson N,Heng L, Weiwei Z, Fritz MHY, et al: A Draft Sequence of NeanderthalGenome. Science 2010, 328:710-22.
9. Rasmussen M, Li Y, Lindgreen S, Pedersen JS, Albrechtsen A, Moltke I,Metspalu M, Metspalu E, Kivisild T, Gupta R, et al: Ancient human genomesequence of an extinct Palaeo-Eskimo. Nature 2010, 463:757-762.
Lari et al. BMC Evolutionary Biology 2011, 11:32http://www.biomedcentral.com/1471-2148/11/32
Page 8 of 10
10. Noonan JP, Coop G, Kudaravalli S, Smith D, Krause J, Alessi J, Chen F,Platt D, Pääbo S, Pritchard JK, et al: Sequencing and analysis ofNeanderthal genomic DNA. Science 2006, 314:1113-1118.
11. Poinar HN, Schwarz C, Qi J, Shapiro B, Macphee RD, Buigues B, Tikhonov A,Huson DH, Tomsho LP, Auch A, et al: Metagenomics to paleogenomics:large-scale sequencing of mammoth DNA. Science 2006, 311:392-394.
12. Gilbert MT, Drautz DI, Lesk AM, Ho SY, Qi J, Ratan A, Hsu CH, Sher A,Dalén L, Götherström A, et al: Intraspecific phylogenetic analysis ofSiberian woolly mammoths using complete mitochondrial genomes.Proc Natl Acad Sci USA 2008, 105:8327-8332.
13. Gilbert MT, Kivisild T, Grønnow B, Andersen PK, Metspalu E, Reidla M,Tamm E, Axelsson E, Götherström A, Campos PF, et al: Paleo-EskimomtDNA genome reveals matrilineal discontinuity in Greenland. Science2008, 320:1787-1789.
14. Miller W, Drautz DI, Janecka JE, Lesk AM, Ratan A, Tomsho LP, Packard M,Zhang Y, McClellan LR, Qi J, et al: The mitochondrial genome sequence ofthe Tasmanian tiger (Thylacinus cynocephalus). Genome Res 2009,19:213-220.
15. Willerslev E, Gilbert MTP, Binladen J, Ho SYW, Campos PF, Ratan A,Tomsho LP, da Fonseca RR, Sher A, Kuznetsova TV, et al: Analysis ofcomplete mitochondrial genomes from extinct and extant rhinocerosesreveals lack of phylogenetic resolution. BMC Evol Biol 2009, 9:95.
16. Ermini L, Olivieri C, Rizzi E, Corti G, Bonnal R, Soares P, Luciani S, Marota I,De Bellis G, Richards MB, et al: Complete Mitochondrial GenomeSequence of the Tyrolean Iceman. Curr Biol 2008, 18:1687-1693.
17. Stiller M, Knapp M, Stenzel U, Hofreiter M, Meyer M: Direct multiplexsequencing (DMPS) - a novel method for targeted high-throughputsequencing of ancient and highly degraded DNA. Genome Res 2009,19:1843-1848.
18. Briggs AW, Good JM, Green RE, Krause J, Maricic T, Stenzel U, Lalueza-Fox C,Rudan P, Brajkovic D, Kucan Z, et al: Targeted retrieval and analysis of fiveNeandertal mtDNA genomes. Science 2009, 325:318-321.
19. Krause J, Briggs AW, Kircher M, Maricic T, Zwyns N, Derevianko A, Pääbo S:A complete mtDNA Genome of an Early Modern Human from Kostenki,Russia. Curr Biol 2010, 20:231-236.
20. Krause J, Fu Q, Good JM, Viola B, Shunkov MV, Derevianko AP, Pääbo S: Thecomplete mtDNA Genome of unknown hominin from southern Siberia.Nature 2010, 464:894-897.
21. Troy CS, MacHugh DE, Bailey JF, Magee DA, Loftus RT, Cunningham P,Chamberlain AT, Sykes BC, Bradley DG: Genetic evidence for Near-Easternorigins of European cattle. Nature 2001, 410:1088-1091.
22. Anderung C, Bouwman A, Persson P, Carretero JM, Ortega AI, Elburg R,Smith C, Arsuaga JL, Ellegren H, Götherström A: Prehistoric contacts overthe Straits of Gibraltar indicated by genetic analysis of Iberian BronzeAge cattle. Proc Natl Acad Sci USA 2005, 102:8431-8435.
23. Gotherstrom A, Anderung C, Hellborg L, Elburg R, Smith C, Bradley DG,Ellegren H: Cattle domestication in the Near East was followed byhybridization with aurochs bulls in Europe. Proc Biol Sci 2005,272:2345-2350.
24. Beja-Pereira A, Caramelli D, Lalueza-Fox C, Vernesi C, Ferrand N, Casoli A,Goyache F, Royo LJ, Conti S, Lari M, et al: The origin of European cattle:evidence from modern and ancient DNA. Proc Natl Acad Sci USA 2006,103:8113-8118.
25. Edwards CJ, Bollongino R, Scheu A, Chamberlain A, Tresset A, Vigne JD,Baird JF, Larson G, Ho SY, Heupink TH, et al: Mitochondrial DNA analysisshows a Near Eastern Neolithic origin for domestic cattle and noindication of domestication of European aurochs. Proc Biol Sci 2007,274:1377-1385.
26. Bollongino R, Elsner J, Vigne JD, Burger J: Y-SNPs do not indicatehybridisation between European aurochs and domestic cattle. PLoS ONE2008, 3:e3418.
27. Achilli A, Olivieri A, Pellecchia M, Uboldi C, Colli L, Al-Zahery N, Accetturo M,Pala M, Kashani BH, Perego UA, et al: Mitochondrial genomes of extinctaurochs survive in domestic cattle. Curr Biol 2008, 18:R157-8.
28. Achilli A, Bonfiglio S, Olivieri A, Malusà A, Pala M, Kashani BH, Perego UA,Ajmone-Marsan P, Lotta L, Semino O, et al: The multifaceted origin oftaurine cattle reflected by the mitochondrial genome. PLoS ONE 2009, 4:e5753.
29. Mona S, Catalano G, Lari M, Larson G, Boscato P, Casoli A, Sineo L, DiPatti C, Pecchioli E, Caramelli D, et al: Population dynamic of the extinctEuropean aurochs: genetic evidence of a north-south divergence
pattern and no evidence of post-glacial expansion. BMC Evol Biol 2010,10:83.
30. Edwards CJ, Magee DA, Park SD, McGettigan PA, Lohan AJ, Murphy A,Finlay EK, Shapiro B, Chamberlain AT, Richards MB, et al: A CompleteMitochondrial Genome Sequence from a Mesolithic Wild Aurochs (Bosprimigenius). PLoS One 2010, 5:e9255.
31. Anderson S, de Bruijn MH, Coulson AR, Eperon IC, Sanger F, Young IG:Complete sequence of bovine mitochondrial DNA. Conserved featuresof the mammalian mitochondrial genome. J Mol Biol 1982, 156:683-717.
32. Meyer M, Stenzel U, Myles S, Prufer K, Hofreiter M: Targeted high-throughput sequencing of tagged nucleic acid samples. Nucleic Acids Res2007, 35:e97.
33. Ho SY, Larson G, Edwards CJ, Heupink TH, Lakin KE, Holland PW, Shapiro B:Correlating Bayesian date estimates with climatic events anddomestication using a bovine case study. Biol Lett 2008, 4:370-374.
34. Drummond AJ, Rambaut A: BEAST: Bayesian evolutionary analysis bysampling trees. BMC Evol Biol 2007, 7:214.
35. Loftus RT, MacHugh DE, Bradley DG, Sharp PM, Cunningham P: Evidencefor two independent domestications of cattle. Proc Natl Acad Sci USA1994, 91:2757-2761.
36. Hassanin A, Ropiquet A: Molecular phylogeny of the tribe Bovini(Bovidae, Bovinae) and the taxonomic status of the Kouprey, Bos sauveliUrbain 1937. Mol Phylogenet Evol 2004, 33:896-907.
37. Taberlet P, Valentini A, Rezaei HR, Naderi S, Pompanon F, Negrini R,Ajmone-Marsan P: Are cattle, sheep, and goats endangered species? MolEcol 2008, 17:275-284.
38. Edwards SV, Beerli P: Perspective: gene divergence, populationdivergence, and the variance in coalescence time in phylogeographicstudies. Evolution 2000, 54:1839-1854.
39. Rosenberg NA, Hirsh AE: On the use of star-shaped genealogies ininference of coalescence times. Genetics 2003, 164:1677-82.
40. Boscato P: Vado all’Arancio (Massa Marittima, GR), studio delle faune.Rassegna di Archeologia 1996, 13:159-176.
41. Cooper A, Poinar HN: Ancient DNA: do it right or not at all. Science 2000,289:1139.
42. Pääbo S, Poinar H, Serre D, Jaenicke-Despres V, Hebler J, Rohland N,Kuch M, Krause J, Vigilant L, Hofreiter M: Genetic analyses from ancientDNA. Annu Rev Genet 2004, 38:645-679.
43. Poinar HN, Höss M, Bada JL, Pääbo S: Amino acid racemization and thepreservation of ancient DNA. Science 1996, 272:864-866.
44. Collins MJ, Penkman KE, Rohland N, Shapiro B, Dobberstein RC, Ritz-Timme S, Hofreiter M: Is amino acid racemization a useful tool forscreening for ancient DNA in bone? Proc Biol Sci 2009, 276:2971-2977.
45. Schwarz C, Debruyne R, Kuch M, McNally E, Schwarcz H, Aubrey AD, Bada J,Poinar H: New insights from old bones: DNA preservation anddegradation in permafrost preserved mammoth remains. Nucleic AcidsRes 2009, 37:3215-3229.
46. Hofreiter M, Jaenicke V, Serre D, Haeseler AvA, Pääbo S: DNA sequencesfrom multiple amplifications reveal artifacts induced by cytosinedeamination in ancient DNA. Nucleic Acids Res 2001, 29:4793-4799.
47. Römpler H, Dear PH, Krause J, Meyer M, Rohland N, Schöneberg T,Spriggs H, Stiller M, Hofreiter M: Multiplex amplification of ancient DNA.Nature Protocols 2006, 1:720-728.
48. Krause J, Unger T, Noçon A, Malaspinas AS, Kolokotronis SO, Stiller M,Soibelzon L, Spriggs H, Dear PH, Briggs AW, et al: Mitochondrial genomesreveal an explosive radiation of extinct and extant bears near theMiocene-Pliocene boundary. BMC Evol Biol 2008, 8:220.
49. Posada D, Crandall KA: MODELTEST: testing the model of DNAsubstitution. Bioinformatics 1998, 14:817-818.
50. Lewis PO, Holder MT, Holsinger KE: Polytomies and Bayesian phylogeneticinference. Syst Biol 2005, 54:241-253.
51. Lewis PO, Holder MT, Swofford DL: PHYCAS 1.2. [http://www.phycas.org].52. Ronquist F, Huelsenbeck JP: MrBayes 3: Bayesian phylogenetic inference
under mixed models. Bioinformatics 2003, 19:1572-1574.53. Suchard MA, Weiss RE, Sinsheimer JS: Bayesian selection of continuous-
time Markov chain evolutionary models. Mol Biol Evol 2001, 18:1001-1013.54. Larget B, Simon D: Markov chain Monte Carlo algorithms for the
Bayesian analysis of phylogenetic trees. Mol Biol Evol 1999, 16:750-759.55. Kass R, Raftery A: Bayes factors. J Am Stat Assoc 1995, 90:773-795.56. Rambaut A, Drummond AJ: TRACER. Version 1.3. 2004 [http://beast.bio.ed.
ac.uk/Tracer].
Lari et al. BMC Evolutionary Biology 2011, 11:32http://www.biomedcentral.com/1471-2148/11/32
Page 9 of 10
57. Gelman A, Rubin DB: Inference from iterative simulation using multiplesequences. Statistical Science 1992, 7:457-511.
58. Drummond AJ, Rambaut A, Shapiro B, Pybus OG: Bayesian coalescentinference of past population dynamics from molecular sequences. MolBiol Evol 2005, 22:1185-1192.
59. Rannala B, Yang Z: Probability distribution of molecular evolutionarytrees: a new method of phylogenetic inference. J Mol Evol 1996,43:304-311.
60. Gautier M, Faraut T, Moazami-Goudarzi K, Navratil V, Foglio M, Grohs C,Boland A, Garnier JG, Boichard D, Lathrop GM, et al: Genetic andhaplotypic structure in 14 European and African cattle breeds. Genetics2007, 177:1059-1070.
doi:10.1186/1471-2148-11-32Cite this article as: Lari et al.: The Complete Mitochondrial Genome ofan 11,450-year-old Aurochsen (Bos primigenius) from Central Italy. BMCEvolutionary Biology 2011 11:32.
Submit your next manuscript to BioMed Centraland take full advantage of:
• Convenient online submission
• Thorough peer review
• No space constraints or color figure charges
• Immediate publication on acceptance
• Inclusion in PubMed, CAS, Scopus and Google Scholar
• Research which is freely available for redistribution
Submit your manuscript at www.biomedcentral.com/submit
Lari et al. BMC Evolutionary Biology 2011, 11:32http://www.biomedcentral.com/1471-2148/11/32
Page 10 of 10