Embed Size (px)
Citation preview

PUBLISHED PROJECT REPORT PPR861
Skid resistance benchmark surveys 2017
Stuart Brittain
1 PPR861
Report details
Report prepared for: Highways England, SES
Project/customer reference: SPaTS: 1-275
Copyright: © TRL Limited
Report date: 21/06/2018
Report status/version: 1
Quality approval:
Stuart McRobbie
(Project Manager) S McRobbie
Martin Greene
(Technical Reviewer) M Greene
Disclaimer
This report has been produced by TRL Limited (TRL) under a contract with Highways England. Any views expressed in this report are not necessarily those of Highways England.
The information contained herein is the property of TRL Limited and does not necessarily reflect the views or policies of the customer for whom this report was prepared. Whilst every effort has been made to ensure that the matter presented in this report is relevant, accurate and up-to-date, TRL Limited cannot accept any liability for any error or omission, or reliance on part or all of the content in another context.
When purchased in hard copy, this publication is printed on paper that is FSC (Forest Stewardship Council) and TCF (Totally Chlorine Free) registered.
Contents amendment record
This report has been amended and issued as follows:
Version Date Description Editor Technical Reviewer
0.1 20/03/2018 Draft for comment S Brittain M Greene
1.0 21/06/2018 Published version S Brittain M Greene
Document last saved on: 21/06/2018 10:37
Document last saved by: Brittain, Stuart
Benchmark surveys 2017
1 i PPR861
Table of Contents
1 Introduction 2
1.1 Background 2
1.2 Directory of benchmark sites 3
1.3 Analysis process 3
2 Survey issues 5
2.1 Alignment of data 5
2.2 Issues and observations from surveys 5
3 Results from the 2017 surveys 8
3.1 Average SR and between survey variation 8
3.2 Expected distribution of SC for asphalt sites 10
3.3 Expected distribution of SC for concrete sites 11
4 Conclusions and recommendations 13
4.1 Data coverage 13
4.2 Results 13
Appendix A Benchmark site locations 15
Appendix B Benchmark site data processed using the old analysis procedure (asphalt sites only) 17
Appendix C Historic data processed using the current defined site lengths 20
Benchmark surveys 2017
1 1 PPR861
Executive summary
As part of its process for managing skid resistance on the Strategic Road network (SRN),
Highways England undertakes single annual skid resistance surveys (SASS). These surveys
are carried out over the course of the summer and are split over three survey periods (early,
middle and late). It is known that skid resistance varies during the year and between years
and the survey data is corrected by the application of correction factors called the “Local
Equilibrium Correction Factors” (LECF). To monitor the ongoing trends in skid resistance
levels, Highways England established a series of benchmark sites. These sites are surveyed in
all three of the survey periods during the survey season. The data collected is then
examined for within year and between year trends in the skid resistance levels. This report
discusses the analysis of the survey data collected in 2017, and compares the results of the
analysis to those from earlier years.
Initially, in 2002, 39 sites were selected as benchmark sites, with two additional sites added
in 2008 and a further two in 2009. The initial 39 sites contain mainly asphalt surfaces and
the additional four contain mainly concrete surfaces.
One site (site 6) was removed from the long term reference benchmark site list (sites which
have a full survey history and have had no treatment since 2002) during the 2017 analysis.
Currently 16 of the original 39 sites are suitable for use in the investigation of trends since
2002. An approach proposed in the analysis of the 2011 data to increase the amount of data
used, resulted in 427 individual 100m lengths being suitable for use in the investigation of
skid resistance trends since 2010.
Comparison of the mean summer skid coefficient (MSSC) values suggests that 2017 was an
“average skid resistance” year in comparison to the average of the previous three years but
an “average to low skid resistance” year when considering all of the years in the analysis. In
addition the within year variation was high in comparison to previous years.
For the 2017 survey, the between run variation of the data from the concrete sites (3.87 SR)
was slightly higher than the expected variation of repeat skid resistance measurements on a
given day under the same weather conditions (3 SR). However this variation is seen to be
different to the variation of the asphalt sites, and therefore the practice of applying an LECF
of 1 to the concrete lengths should continue (as there is not sufficient length to calculate
robust stand-alone LECFs for concrete surfaces).
Benchmark surveys 2017
1 2 PPR861
1 Introduction
1.1 Background
In order to investigate long term trends in skid resistance values, Highways England established a series of benchmark sites. These benchmark sites have three surveys in each survey season (one in each survey period) in addition to the routine annual skid resistance survey. These additional surveys allow for the investigation of trends in skid resistance within and between years.
The first of the benchmark site surveys occurred in 2002 and they have been carried out in each year since. Initially there were 39 benchmark sites selected using the following criteria:
1. The site should be well defined (i.e. easily locatable) 2. Safe to test at 50km/h 3. Traffic delays or parked vehicles unlikely 4. Straight and level 5. Typical road surfacings (excluding concrete) 6. Surfacing in good condition
As part of the investigation into the seasonal correction values generated for the network (Donbavand & Brittain, 2007), it was found that concrete did not appear to behave in the same way as asphalt surfaces with regards to seasonal variation. Highways England therefore decided that some concrete sites should be added to the benchmark site investigations. Two sites were added in 2008 (labelled 40 and 41) and a further two were added in 2009 (labelled 42 and 43).
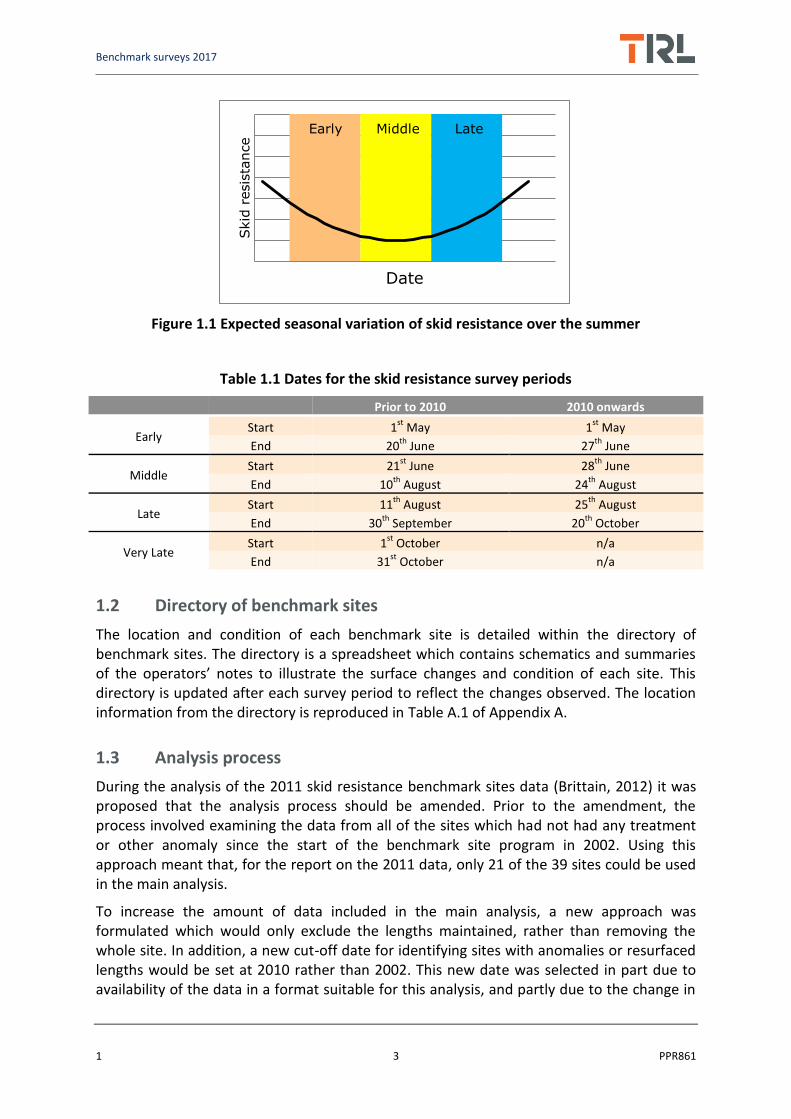
The expected distribution of skid resistance (shown diagrammatically in Figure 1.1) means that skid resistance should be at similar levels in the early and late period surveys with the middle period producing slightly lower results. However, during the analysis of the 2005 benchmark site data it was found that the late surveys did not appear to return to levels similar to the early surveys. It was decided that an additional very late survey (i.e. after the late period survey) would be conducted in 2006 to see if the skid resistance values returned to the levels seen in the early period. This additional survey was also conducted in 2007, 2008 and 2009. A review of the data from the additional very late surveys suggested that the skid resistance was returning to levels seen in the early period during the very late period. Based on these findings, Highways England decided that the survey season should be modified so that the late surveys would produce similar results to the early surveys. The modified survey periods were first used for the 2010 surveys and the survey periods are shown in Table 1.1. Analyses undertaken since 2010 have shown that the revised dates for the survey periods continue to remain suitable.
Benchmark surveys 2017
1 3 PPR861
Figure 1.1 Expected seasonal variation of skid resistance over the summer
Table 1.1 Dates for the skid resistance survey periods
Prior to 2010 2010 onwards
Early Start 1
st May 1
st May
End 20th
June 27th
June
Middle Start 21
st June 28
th June
End 10th
August 24th
August
Late Start 11
th August 25
th August
End 30th
September 20th
October
Very Late Start 1
st October n/a
End 31st
October n/a
1.2 Directory of benchmark sites
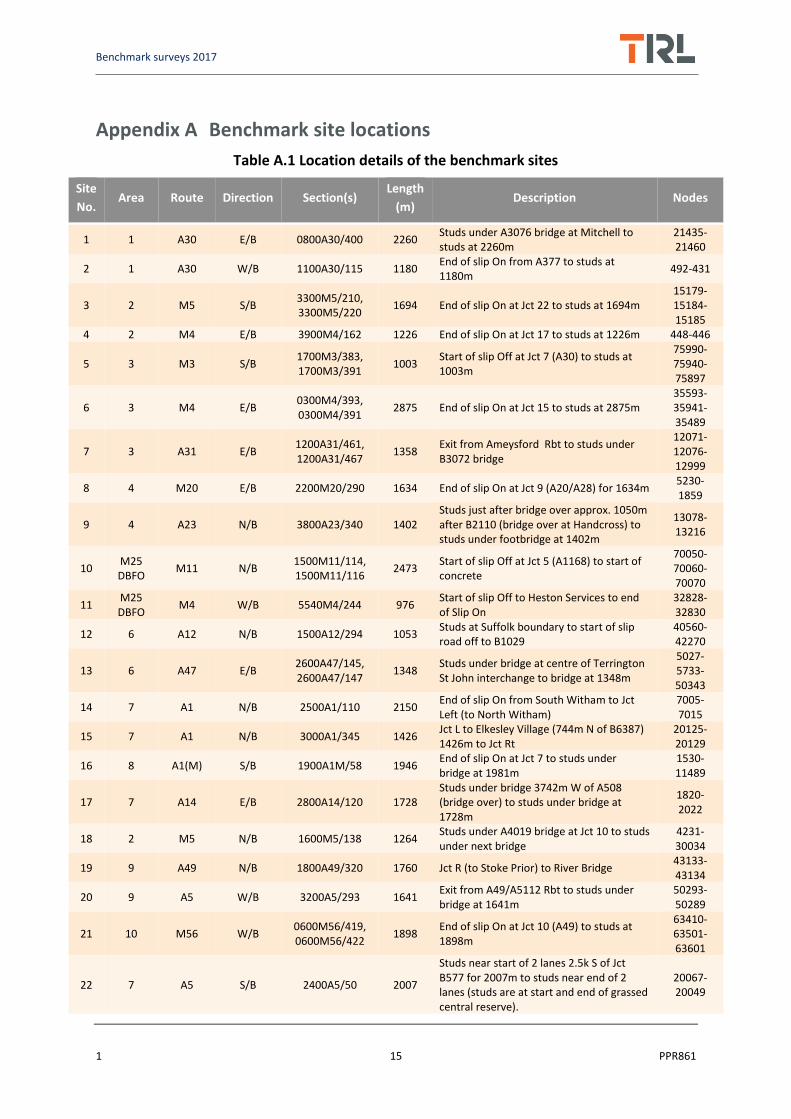
The location and condition of each benchmark site is detailed within the directory of benchmark sites. The directory is a spreadsheet which contains schematics and summaries of the operators’ notes to illustrate the surface changes and condition of each site. This directory is updated after each survey period to reflect the changes observed. The location information from the directory is reproduced in Table A.1 of Appendix A.
1.3 Analysis process
During the analysis of the 2011 skid resistance benchmark sites data (Brittain, 2012) it was proposed that the analysis process should be amended. Prior to the amendment, the process involved examining the data from all of the sites which had not had any treatment or other anomaly since the start of the benchmark site program in 2002. Using this approach meant that, for the report on the 2011 data, only 21 of the 39 sites could be used in the main analysis.
To increase the amount of data included in the main analysis, a new approach was formulated which would only exclude the lengths maintained, rather than removing the whole site. In addition, a new cut-off date for identifying sites with anomalies or resurfaced lengths would be set at 2010 rather than 2002. This new date was selected in part due to availability of the data in a format suitable for this analysis, and partly due to the change in
Skid
resis
tance
Date
Early Middle Late

Benchmark surveys 2017
1 4 PPR861
the survey periods which occurred in 2010. The results from this analysis are given in section 3.
So that it is still possible to examine trends going back to 2002, an analysis based on the original approach was also undertaken and is reported in Appendix B.
Benchmark surveys 2017
1 5 PPR861
2 Survey issues
2.1 Alignment of data
Markers are entered into the survey data using push button entry. When using these markers to align the data, the resulting alignments are, in general, good. It is, however, sometimes necessary to shift the locations of the markers by up to 50m (based on a visual analysis of the patterns in the data).
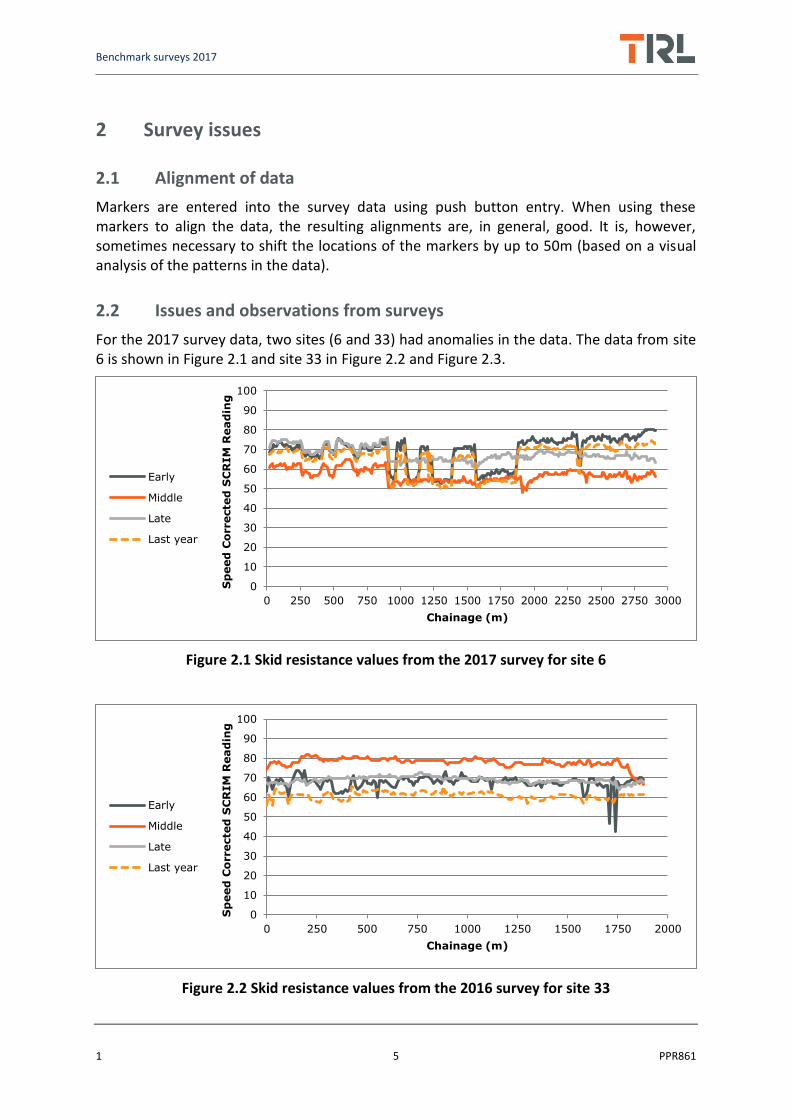
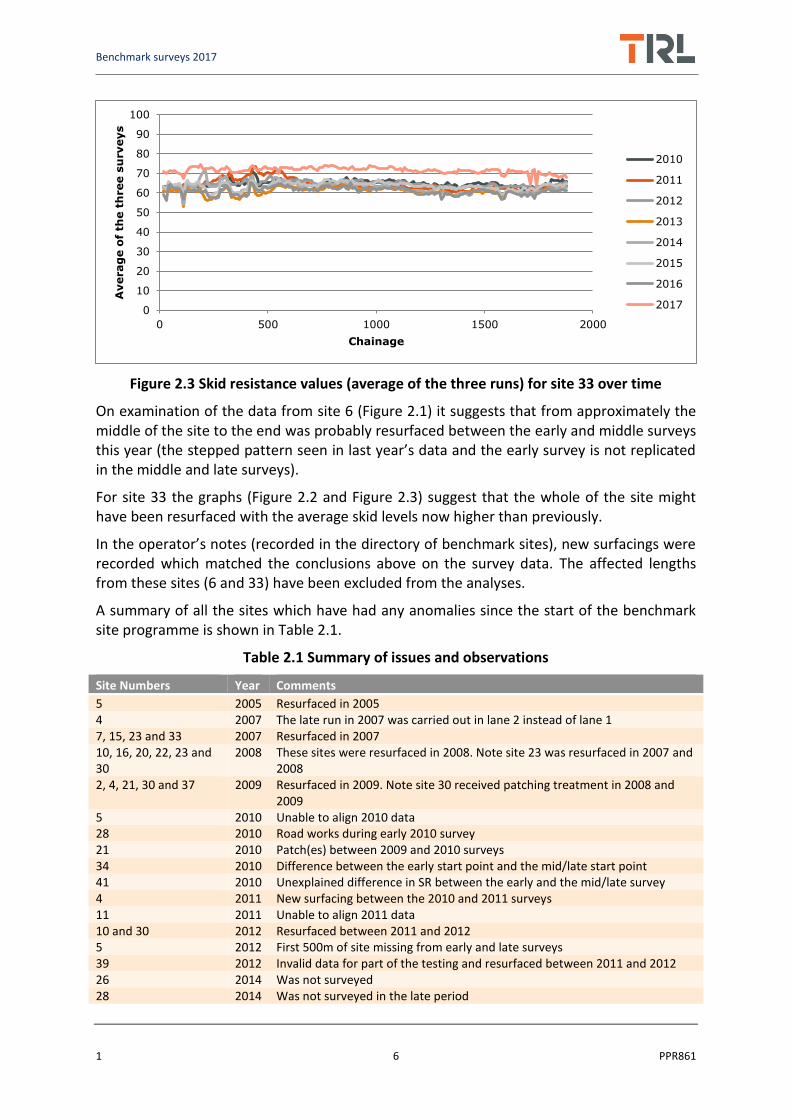
2.2 Issues and observations from surveys
For the 2017 survey data, two sites (6 and 33) had anomalies in the data. The data from site 6 is shown in Figure 2.1 and site 33 in Figure 2.2 and Figure 2.3.
Figure 2.1 Skid resistance values from the 2017 survey for site 6
Figure 2.2 Skid resistance values from the 2016 survey for site 33
0
10
20
30
40
50
60
70
80
90
100
0 250 500 750 1000 1250 1500 1750 2000 2250 2500 2750 3000
Sp
eed
Co
rrecte
d S
CR
IM
Read
ing
Chainage (m)
Early
Middle
Late
Last year
0
10
20
30
40
50
60
70
80
90
100
0 250 500 750 1000 1250 1500 1750 2000
Sp
eed
Co
rrecte
d S
CR
IM
Read
ing
Chainage (m)
Early
Middle
Late
Last year
Benchmark surveys 2017
1 6 PPR861
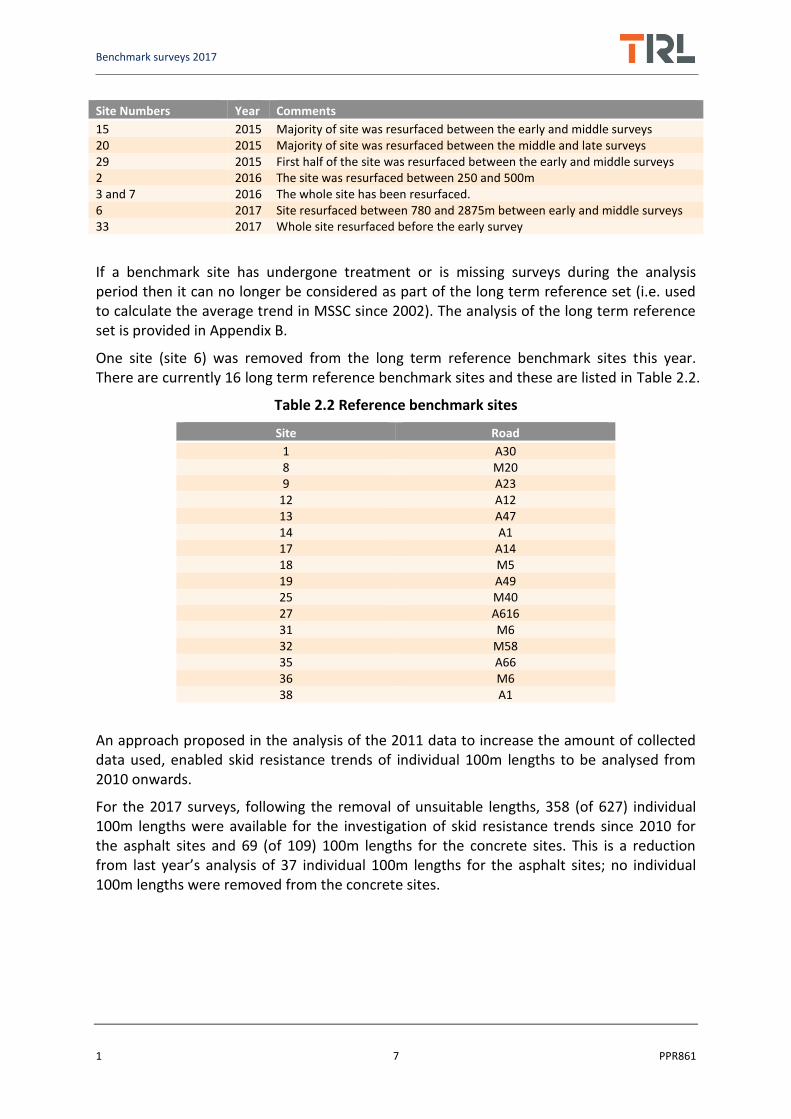
Figure 2.3 Skid resistance values (average of the three runs) for site 33 over time
On examination of the data from site 6 (Figure 2.1) it suggests that from approximately the middle of the site to the end was probably resurfaced between the early and middle surveys this year (the stepped pattern seen in last year’s data and the early survey is not replicated in the middle and late surveys).
For site 33 the graphs (Figure 2.2 and Figure 2.3) suggest that the whole of the site might have been resurfaced with the average skid levels now higher than previously.
In the operator’s notes (recorded in the directory of benchmark sites), new surfacings were recorded which matched the conclusions above on the survey data. The affected lengths from these sites (6 and 33) have been excluded from the analyses.
A summary of all the sites which have had any anomalies since the start of the benchmark site programme is shown in Table 2.1.
Table 2.1 Summary of issues and observations
Site Numbers Year Comments
5 2005 Resurfaced in 2005 4 2007 The late run in 2007 was carried out in lane 2 instead of lane 1 7, 15, 23 and 33 2007 Resurfaced in 2007 10, 16, 20, 22, 23 and 30
2008 These sites were resurfaced in 2008. Note site 23 was resurfaced in 2007 and 2008
2, 4, 21, 30 and 37 2009 Resurfaced in 2009. Note site 30 received patching treatment in 2008 and 2009
5 2010 Unable to align 2010 data 28 2010 Road works during early 2010 survey 21 2010 Patch(es) between 2009 and 2010 surveys 34 2010 Difference between the early start point and the mid/late start point 41 2010 Unexplained difference in SR between the early and the mid/late survey 4 2011 New surfacing between the 2010 and 2011 surveys 11 2011 Unable to align 2011 data 10 and 30 2012 Resurfaced between 2011 and 2012 5 2012 First 500m of site missing from early and late surveys 39 2012 Invalid data for part of the testing and resurfaced between 2011 and 2012 26 2014 Was not surveyed 28 2014 Was not surveyed in the late period
0
10
20
30
40
50
60
70
80
90
100
0 500 1000 1500 2000
Averag
e o
f th
e t
hree s
urveys
Chainage
2010
2011
2012
2013
2014
2015
2016
2017
Benchmark surveys 2017
1 7 PPR861
Site Numbers Year Comments
15 2015 Majority of site was resurfaced between the early and middle surveys 20 2015 Majority of site was resurfaced between the middle and late surveys 29 2015 First half of the site was resurfaced between the early and middle surveys 2 2016 The site was resurfaced between 250 and 500m 3 and 7 2016 The whole site has been resurfaced. 6 2017 Site resurfaced between 780 and 2875m between early and middle surveys 33 2017 Whole site resurfaced before the early survey
If a benchmark site has undergone treatment or is missing surveys during the analysis period then it can no longer be considered as part of the long term reference set (i.e. used to calculate the average trend in MSSC since 2002). The analysis of the long term reference set is provided in Appendix B.
One site (site 6) was removed from the long term reference benchmark sites this year. There are currently 16 long term reference benchmark sites and these are listed in Table 2.2.
Table 2.2 Reference benchmark sites
Site Road
1 A30 8 M20 9 A23
12 A12 13 A47 14 A1 17 A14 18 M5 19 A49 25 M40 27 A616 31 M6 32 M58 35 A66 36 M6 38 A1
An approach proposed in the analysis of the 2011 data to increase the amount of collected data used, enabled skid resistance trends of individual 100m lengths to be analysed from 2010 onwards.
For the 2017 surveys, following the removal of unsuitable lengths, 358 (of 627) individual 100m lengths were available for the investigation of skid resistance trends since 2010 for the asphalt sites and 69 (of 109) 100m lengths for the concrete sites. This is a reduction from last year’s analysis of 37 individual 100m lengths for the asphalt sites; no individual 100m lengths were removed from the concrete sites.
Benchmark surveys 2017
1 8 PPR861
3 Results from the 2017 surveys
3.1 Average SR and between survey variation
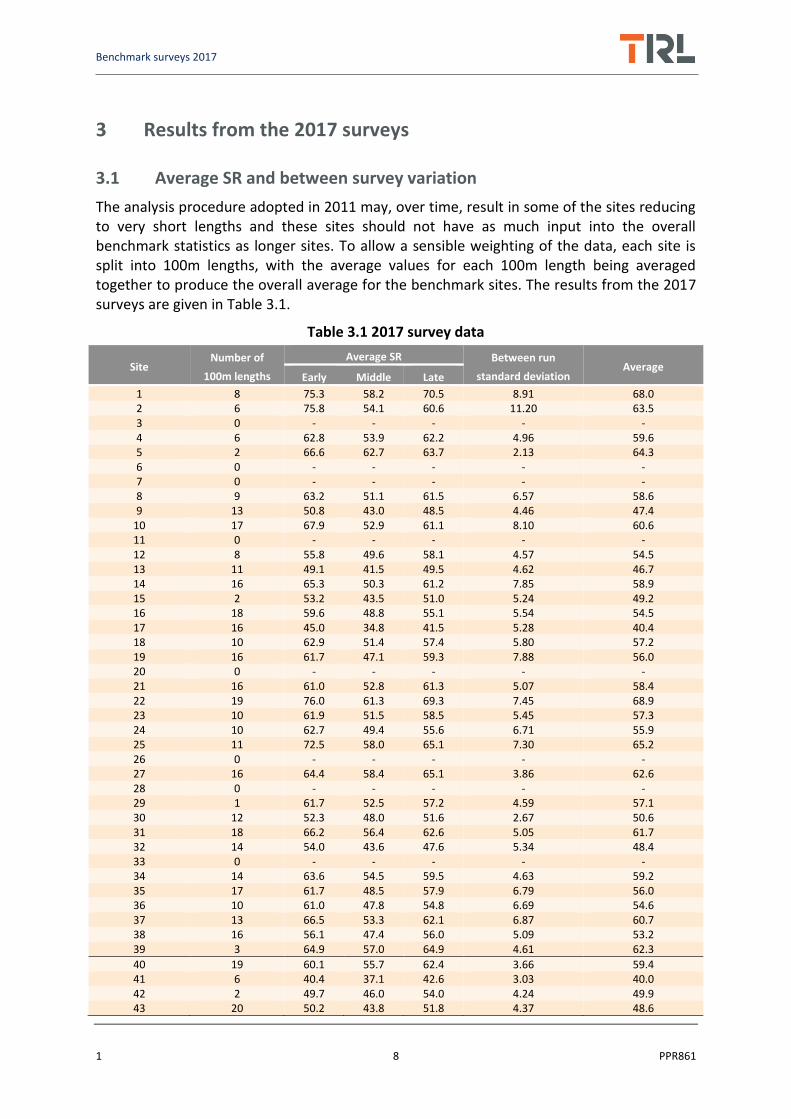
The analysis procedure adopted in 2011 may, over time, result in some of the sites reducing to very short lengths and these sites should not have as much input into the overall benchmark statistics as longer sites. To allow a sensible weighting of the data, each site is split into 100m lengths, with the average values for each 100m length being averaged together to produce the overall average for the benchmark sites. The results from the 2017 surveys are given in Table 3.1.
Table 3.1 2017 survey data
Site Number of
100m lengths
Average SR Between run
standard deviation Average
Early Middle Late
1 8 75.3 58.2 70.5 8.91 68.0 2 6 75.8 54.1 60.6 11.20 63.5 3 0 - - - - - 4 6 62.8 53.9 62.2 4.96 59.6 5 2 66.6 62.7 63.7 2.13 64.3 6 0 - - - - - 7 0 - - - - - 8 9 63.2 51.1 61.5 6.57 58.6 9 13 50.8 43.0 48.5 4.46 47.4
10 17 67.9 52.9 61.1 8.10 60.6 11 0 - - - - - 12 8 55.8 49.6 58.1 4.57 54.5 13 11 49.1 41.5 49.5 4.62 46.7 14 16 65.3 50.3 61.2 7.85 58.9 15 2 53.2 43.5 51.0 5.24 49.2 16 18 59.6 48.8 55.1 5.54 54.5 17 16 45.0 34.8 41.5 5.28 40.4 18 10 62.9 51.4 57.4 5.80 57.2 19 16 61.7 47.1 59.3 7.88 56.0 20 0 - - - - - 21 16 61.0 52.8 61.3 5.07 58.4 22 19 76.0 61.3 69.3 7.45 68.9 23 10 61.9 51.5 58.5 5.45 57.3 24 10 62.7 49.4 55.6 6.71 55.9 25 11 72.5 58.0 65.1 7.30 65.2 26 0 - - - - - 27 16 64.4 58.4 65.1 3.86 62.6 28 0 - - - - - 29 1 61.7 52.5 57.2 4.59 57.1 30 12 52.3 48.0 51.6 2.67 50.6 31 18 66.2 56.4 62.6 5.05 61.7 32 14 54.0 43.6 47.6 5.34 48.4 33 0 - - - - - 34 14 63.6 54.5 59.5 4.63 59.2 35 17 61.7 48.5 57.9 6.79 56.0 36 10 61.0 47.8 54.8 6.69 54.6 37 13 66.5 53.3 62.1 6.87 60.7 38 16 56.1 47.4 56.0 5.09 53.2 39 3 64.9 57.0 64.9 4.61 62.3
40 19 60.1 55.7 62.4 3.66 59.4 41 6 40.4 37.1 42.6 3.03 40.0 42 2 49.7 46.0 54.0 4.24 49.9 43 20 50.2 43.8 51.8 4.37 48.6
Benchmark surveys 2017
1 9 PPR861
Site Number of
100m lengths
Average SR Between run
standard deviation Average
Early Middle Late
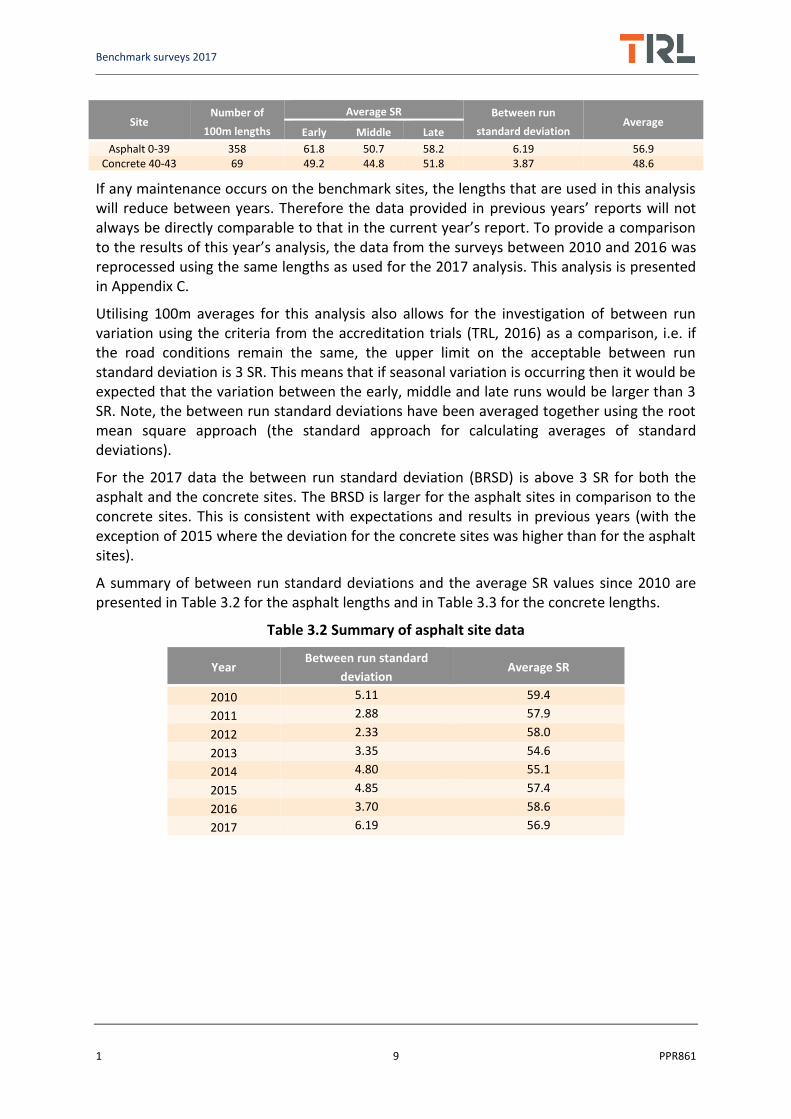
Asphalt 0-39 358 61.8 50.7 58.2 6.19 56.9 Concrete 40-43 69 49.2 44.8 51.8 3.87 48.6
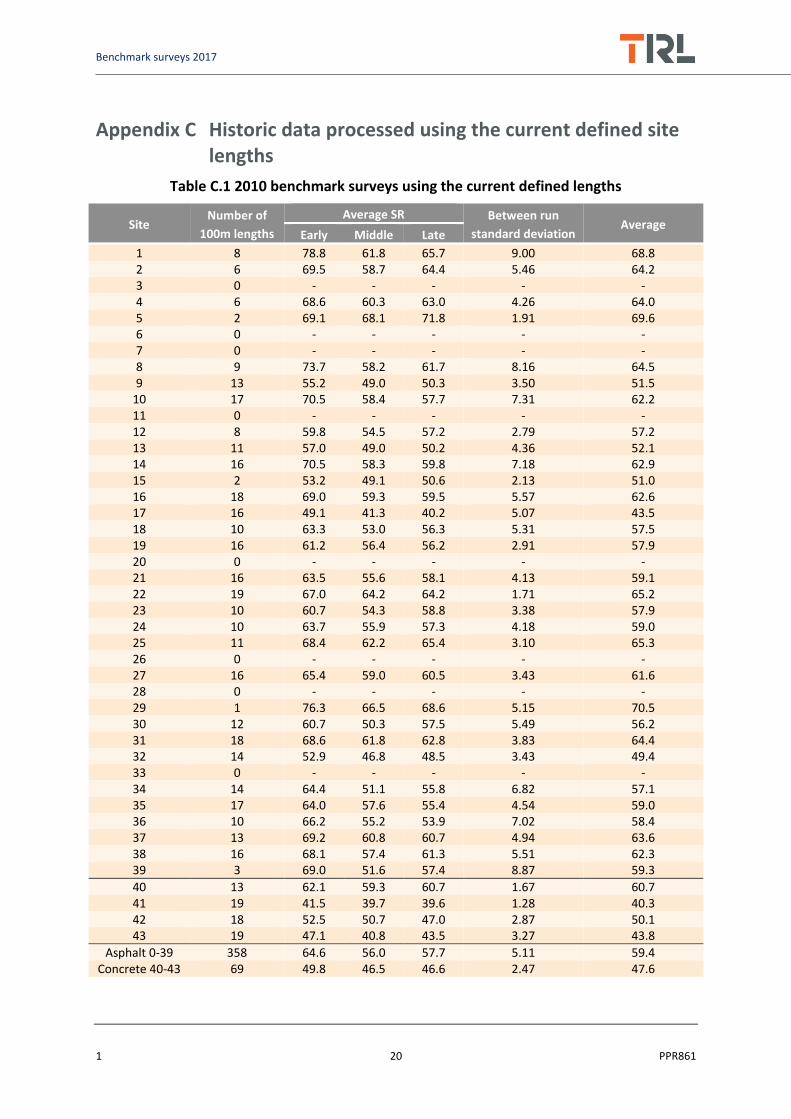
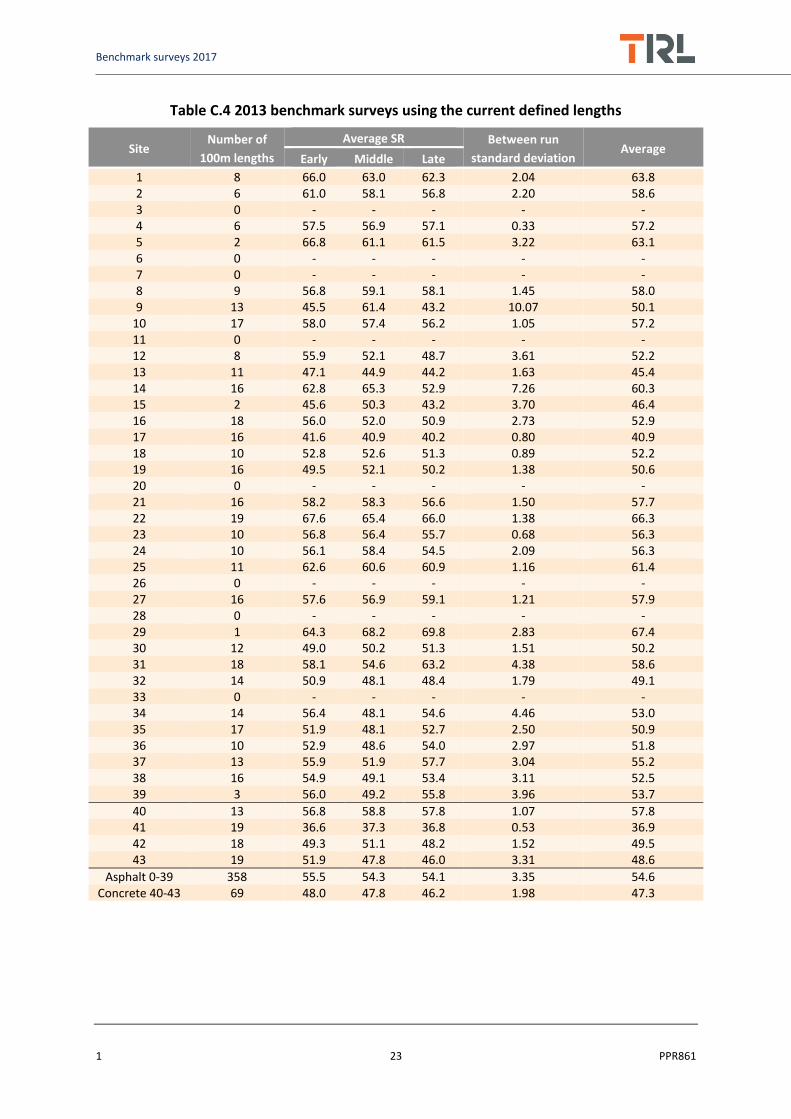
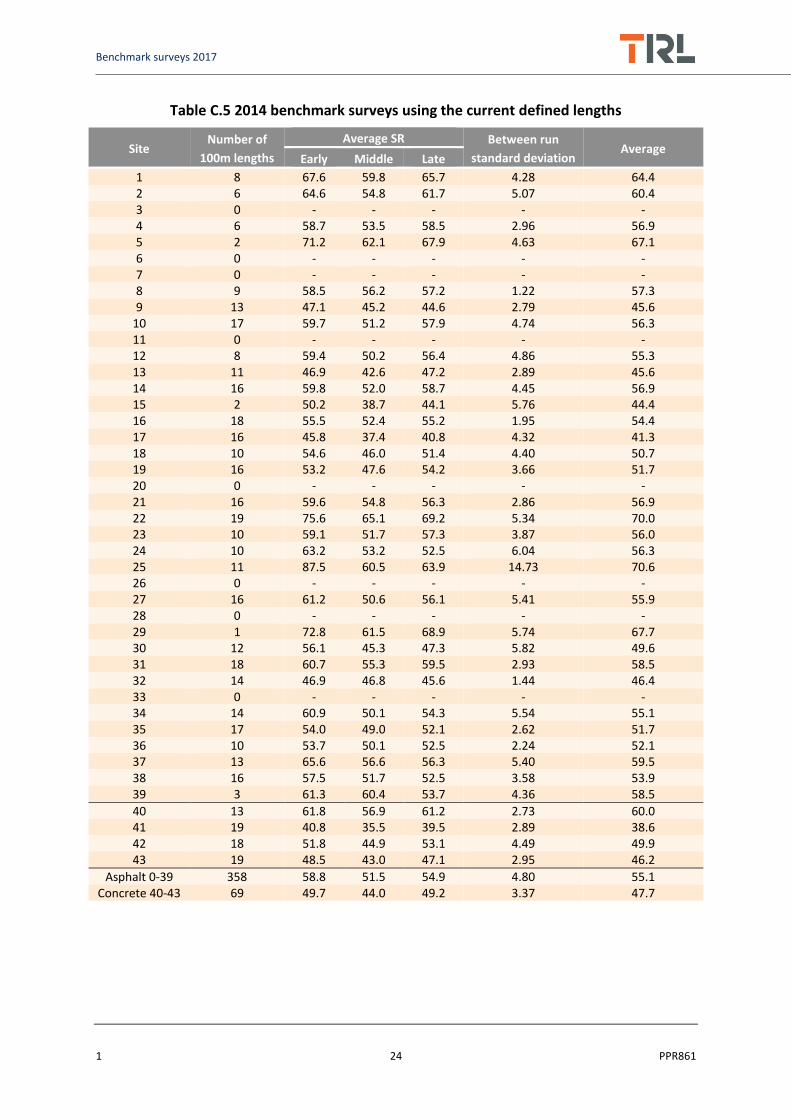
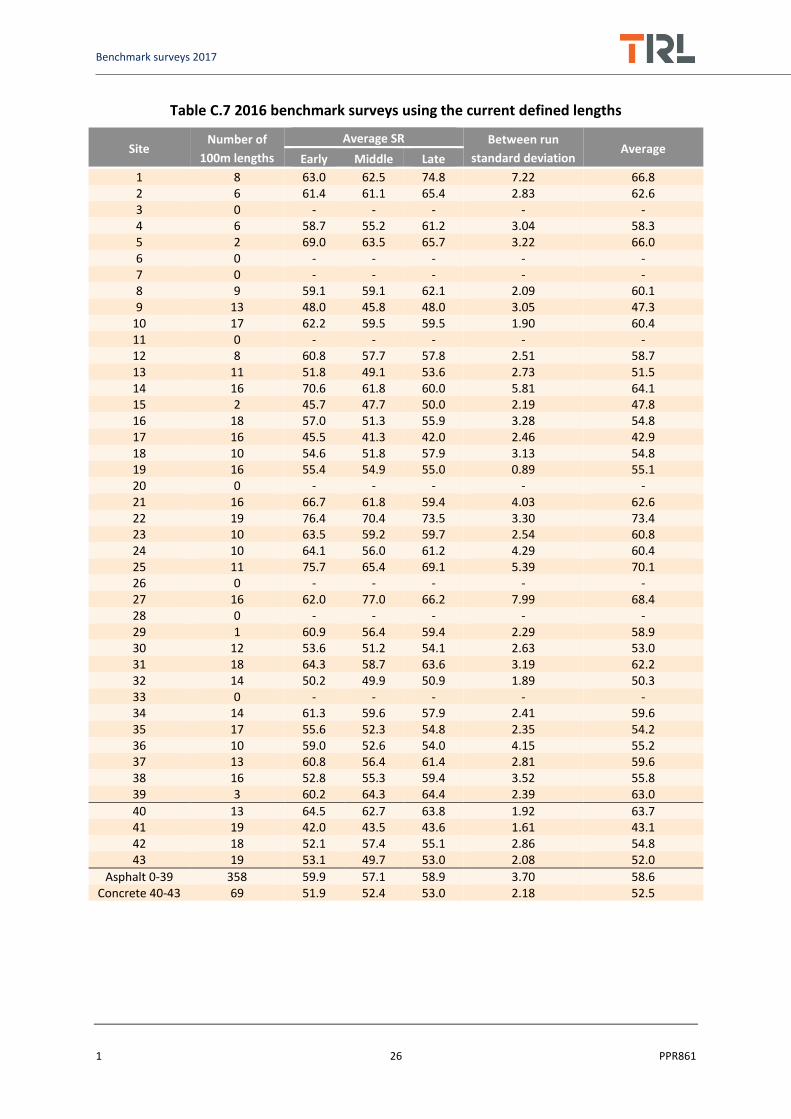
If any maintenance occurs on the benchmark sites, the lengths that are used in this analysis will reduce between years. Therefore the data provided in previous years’ reports will not always be directly comparable to that in the current year’s report. To provide a comparison to the results of this year’s analysis, the data from the surveys between 2010 and 2016 was reprocessed using the same lengths as used for the 2017 analysis. This analysis is presented in Appendix C.
Utilising 100m averages for this analysis also allows for the investigation of between run variation using the criteria from the accreditation trials (TRL, 2016) as a comparison, i.e. if the road conditions remain the same, the upper limit on the acceptable between run standard deviation is 3 SR. This means that if seasonal variation is occurring then it would be expected that the variation between the early, middle and late runs would be larger than 3 SR. Note, the between run standard deviations have been averaged together using the root mean square approach (the standard approach for calculating averages of standard deviations).
For the 2017 data the between run standard deviation (BRSD) is above 3 SR for both the asphalt and the concrete sites. The BRSD is larger for the asphalt sites in comparison to the concrete sites. This is consistent with expectations and results in previous years (with the exception of 2015 where the deviation for the concrete sites was higher than for the asphalt sites).
A summary of between run standard deviations and the average SR values since 2010 are presented in Table 3.2 for the asphalt lengths and in Table 3.3 for the concrete lengths.
Table 3.2 Summary of asphalt site data
Year Between run standard
deviation Average SR
2010 5.11 59.4
2011 2.88 57.9
2012 2.33 58.0
2013 3.35 54.6
2014 4.80 55.1
2015 4.85 57.4
2016 3.70 58.6
2017 6.19 56.9
Benchmark surveys 2017
1 10 PPR861
Table 3.3 Summary of concrete site data
Year Between run standard
deviation Average SR
2010 2.47 47.6
2011 1.56 49.3
2012 2.34 50.2
2013 1.98 47.3
2014 3.37 47.7
2015 5.06 49.3
2016 2.18 52.5
2017 3.87 48.6
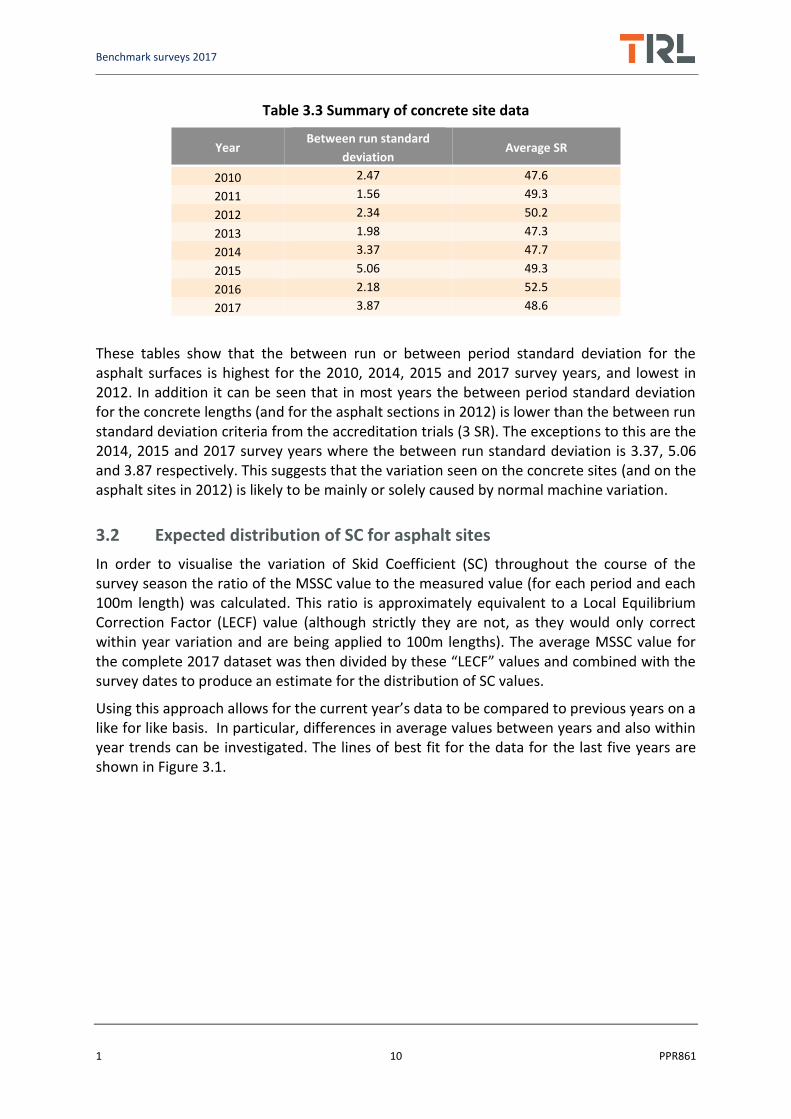
These tables show that the between run or between period standard deviation for the asphalt surfaces is highest for the 2010, 2014, 2015 and 2017 survey years, and lowest in 2012. In addition it can be seen that in most years the between period standard deviation for the concrete lengths (and for the asphalt sections in 2012) is lower than the between run standard deviation criteria from the accreditation trials (3 SR). The exceptions to this are the 2014, 2015 and 2017 survey years where the between run standard deviation is 3.37, 5.06 and 3.87 respectively. This suggests that the variation seen on the concrete sites (and on the asphalt sites in 2012) is likely to be mainly or solely caused by normal machine variation.
3.2 Expected distribution of SC for asphalt sites
In order to visualise the variation of Skid Coefficient (SC) throughout the course of the survey season the ratio of the MSSC value to the measured value (for each period and each 100m length) was calculated. This ratio is approximately equivalent to a Local Equilibrium Correction Factor (LECF) value (although strictly they are not, as they would only correct within year variation and are being applied to 100m lengths). The average MSSC value for the complete 2017 dataset was then divided by these “LECF” values and combined with the survey dates to produce an estimate for the distribution of SC values.
Using this approach allows for the current year’s data to be compared to previous years on a like for like basis. In particular, differences in average values between years and also within year trends can be investigated. The lines of best fit for the data for the last five years are shown in Figure 3.1.
Benchmark surveys 2017
1 11 PPR861
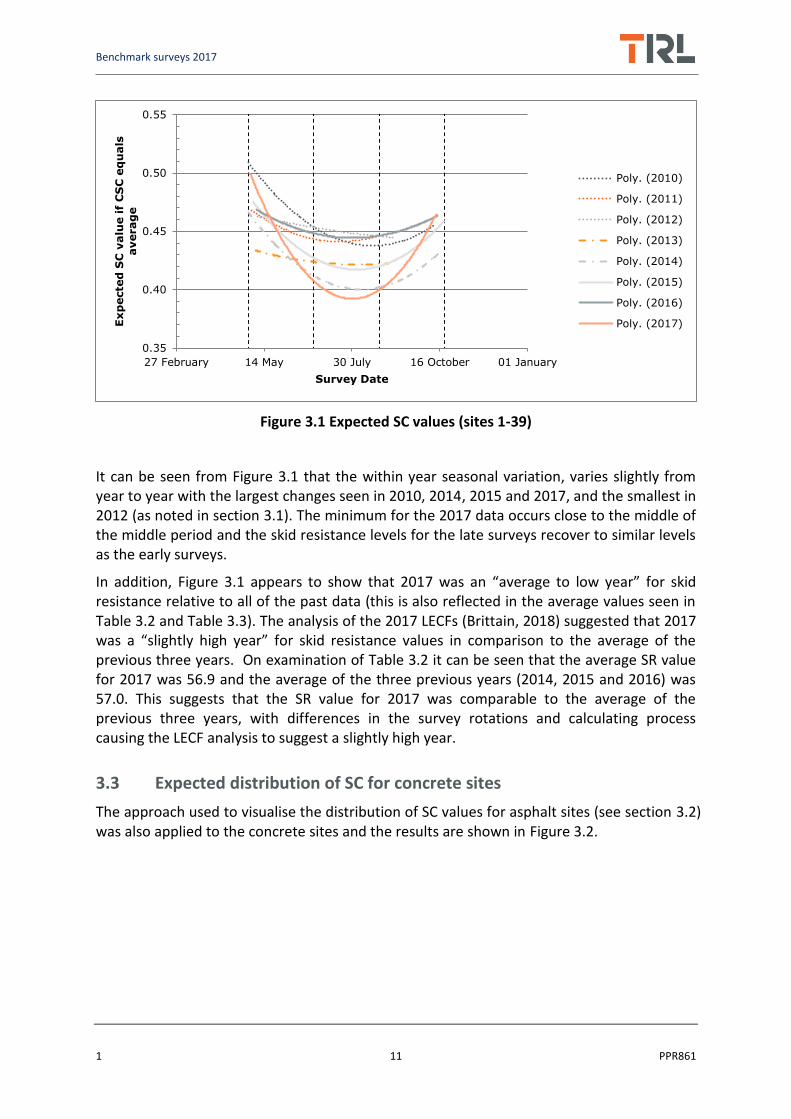
Figure 3.1 Expected SC values (sites 1-39)
It can be seen from Figure 3.1 that the within year seasonal variation, varies slightly from year to year with the largest changes seen in 2010, 2014, 2015 and 2017, and the smallest in 2012 (as noted in section 3.1). The minimum for the 2017 data occurs close to the middle of the middle period and the skid resistance levels for the late surveys recover to similar levels as the early surveys.
In addition, Figure 3.1 appears to show that 2017 was an “average to low year” for skid resistance relative to all of the past data (this is also reflected in the average values seen in Table 3.2 and Table 3.3). The analysis of the 2017 LECFs (Brittain, 2018) suggested that 2017 was a “slightly high year” for skid resistance values in comparison to the average of the previous three years. On examination of Table 3.2 it can be seen that the average SR value for 2017 was 56.9 and the average of the three previous years (2014, 2015 and 2016) was 57.0. This suggests that the SR value for 2017 was comparable to the average of the previous three years, with differences in the survey rotations and calculating process causing the LECF analysis to suggest a slightly high year.
3.3 Expected distribution of SC for concrete sites
The approach used to visualise the distribution of SC values for asphalt sites (see section 3.2) was also applied to the concrete sites and the results are shown in Figure 3.2.
0.35
0.40
0.45
0.50
0.55
27 February 14 May 30 July 16 October 01 January
Exp
ecte
d S
C v
alu
e if
CS
C e
qu
als
averag
e
Survey Date
Poly. (2010)
Poly. (2011)
Poly. (2012)
Poly. (2013)
Poly. (2014)
Poly. (2015)
Poly. (2016)
Poly. (2017)
Benchmark surveys 2017
1 12 PPR861
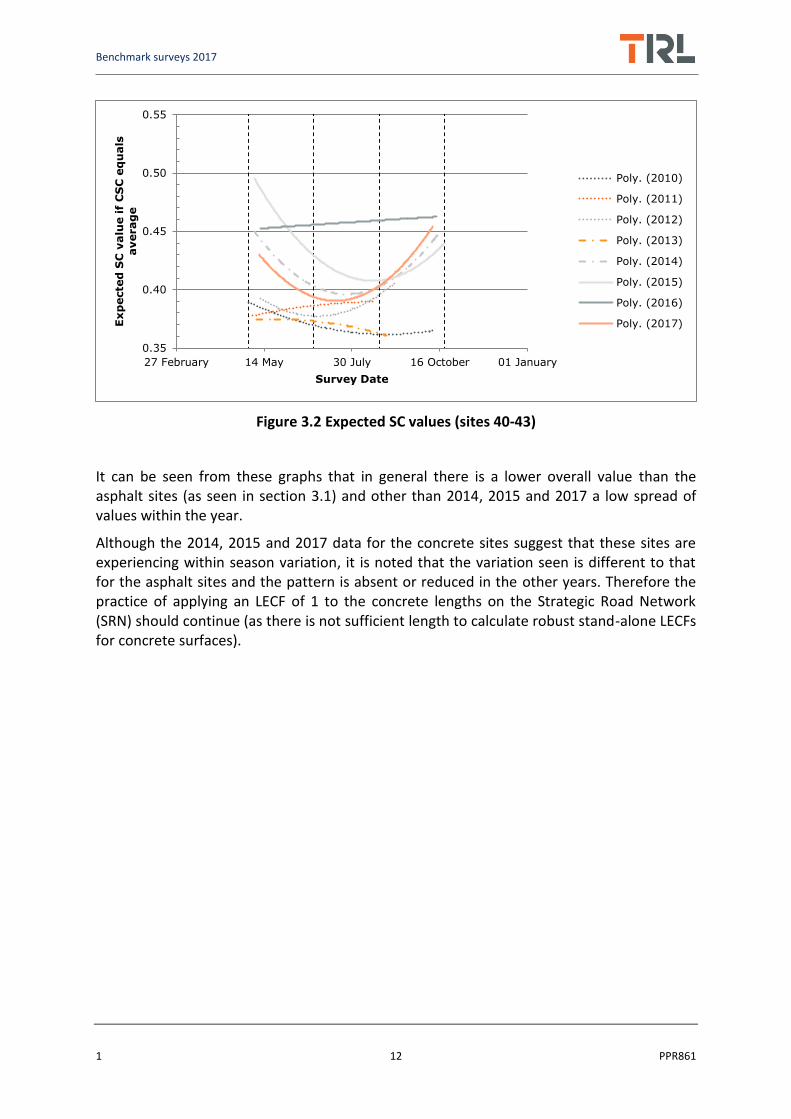
Figure 3.2 Expected SC values (sites 40-43)
It can be seen from these graphs that in general there is a lower overall value than the asphalt sites (as seen in section 3.1) and other than 2014, 2015 and 2017 a low spread of values within the year.
Although the 2014, 2015 and 2017 data for the concrete sites suggest that these sites are experiencing within season variation, it is noted that the variation seen is different to that for the asphalt sites and the pattern is absent or reduced in the other years. Therefore the practice of applying an LECF of 1 to the concrete lengths on the Strategic Road Network (SRN) should continue (as there is not sufficient length to calculate robust stand-alone LECFs for concrete surfaces).
0.35
0.40
0.45
0.50
0.55
27 February 14 May 30 July 16 October 01 January
Exp
ecte
d S
C v
alu
e if
CS
C e
qu
als
averag
e
Survey Date
Poly. (2010)
Poly. (2011)
Poly. (2012)
Poly. (2013)
Poly. (2014)
Poly. (2015)
Poly. (2016)
Poly. (2017)
Benchmark surveys 2017
1 13 PPR861
4 Conclusions and recommendations
4.1 Data coverage
One site (site 6) was removed from the long term reference benchmark site list (sites which have a full survey history and have had no treatment since 2002) in the analysis of the 2017 data. Currently 16 of the original 39 sites are suitable for use in the investigation of trends since 2002 (given in Appendix B) and 427 individual 100m lengths (358 asphalt lengths and 69 concrete lengths) are suitable for use in the investigation of trends since 2010.
4.2 Results
Investigation into the average SR values suggests that 2017 was an “average to low skid resistance year” for the asphalt lengths when compared to the average of the previous years and an “average skid resistance year” when compared to the average of the previous three years. The within year variation for 2017 was high in comparison to other years since 2010.
For the 2017 data the between period standard deviation for the concrete sites was above 3 SR suggesting that this variation is likely to be in part caused by seasonal variation. However this variation is seen to be different to the variation on the asphalt sites, and therefore the practice of applying an LECF of 1 to the concrete lengths should continue (as there is not sufficient length to calculate robust stand-alone LECFs for concrete surfaces).
Benchmark surveys 2017
1 14 PPR861
References
Brittain, S. (2012). SCRIM Benchmark surveys 2011 (CPR 1298). Wokingham: TRL.
Brittain, S. (2018). Calculation of Local Equilibrium Correction Factors for the 2017 Skid
resistance surveys. Wokingham: TRL.
Donbavand, J., & Brittain, S. (2007). Task 3: Review of Correction Factors (UPR/IE/213/06).
Wokingham: TRL.
TRL. (2016). Accreditation and Quality Assurance of Sideways Force Skid Resistance Survey
Devices. http://www.ukroadsliaisongroup.org/en/asset-condition/road-condition-
information/data-collection/skid-resistance.cfm.
Benchmark surveys 2017
1 15 PPR861
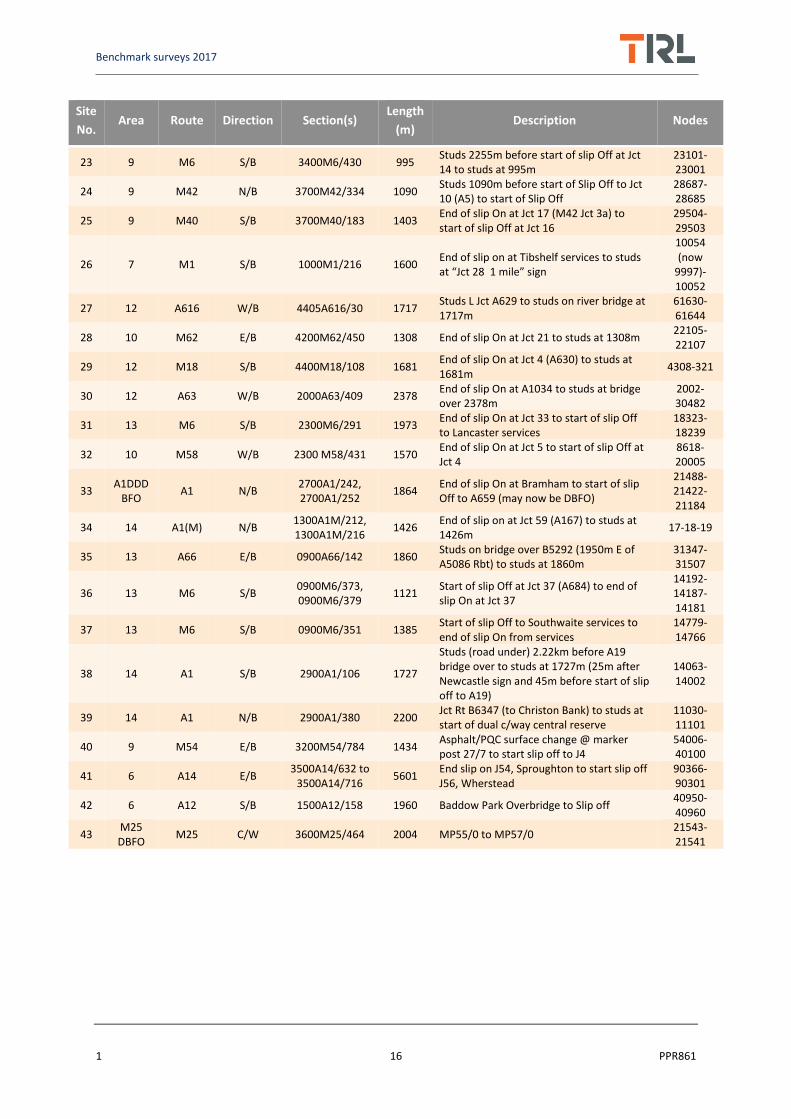
Appendix A Benchmark site locations
Table A.1 Location details of the benchmark sites
Site
No. Area Route Direction Section(s)
Length
(m) Description Nodes
1 1 A30 E/B 0800A30/400 2260 Studs under A3076 bridge at Mitchell to studs at 2260m
21435-21460
2 1 A30 W/B 1100A30/115 1180 End of slip On from A377 to studs at 1180m
492-431
3 2 M5 S/B 3300M5/210, 3300M5/220
1694 End of slip On at Jct 22 to studs at 1694m 15179-15184-15185
4 2 M4 E/B 3900M4/162 1226 End of slip On at Jct 17 to studs at 1226m 448-446
5 3 M3 S/B 1700M3/383, 1700M3/391
1003 Start of slip Off at Jct 7 (A30) to studs at 1003m
75990-75940-75897
6 3 M4 E/B 0300M4/393, 0300M4/391
2875 End of slip On at Jct 15 to studs at 2875m 35593-35941-35489
7 3 A31 E/B 1200A31/461, 1200A31/467
1358 Exit from Ameysford Rbt to studs under B3072 bridge
12071-12076-12999
8 4 M20 E/B 2200M20/290 1634 End of slip On at Jct 9 (A20/A28) for 1634m 5230-1859
9 4 A23 N/B 3800A23/340 1402 Studs just after bridge over approx. 1050m after B2110 (bridge over at Handcross) to studs under footbridge at 1402m
13078-13216
10 M25 DBFO
M11 N/B 1500M11/114, 1500M11/116
2473 Start of slip Off at Jct 5 (A1168) to start of concrete
70050-70060-70070
11 M25 DBFO
M4 W/B 5540M4/244 976 Start of slip Off to Heston Services to end of Slip On
32828-32830
12 6 A12 N/B 1500A12/294 1053 Studs at Suffolk boundary to start of slip road off to B1029
40560-42270
13 6 A47 E/B 2600A47/145, 2600A47/147
1348 Studs under bridge at centre of Terrington St John interchange to bridge at 1348m
5027-5733-50343
14 7 A1 N/B 2500A1/110 2150 End of slip On from South Witham to Jct Left (to North Witham)
7005-7015
15 7 A1 N/B 3000A1/345 1426 Jct L to Elkesley Village (744m N of B6387) 1426m to Jct Rt
20125-20129
16 8 A1(M) S/B 1900A1M/58 1946 End of slip On at Jct 7 to studs under bridge at 1981m
1530-11489
17 7 A14 E/B 2800A14/120 1728 Studs under bridge 3742m W of A508 (bridge over) to studs under bridge at 1728m
1820-2022
18 2 M5 N/B 1600M5/138 1264 Studs under A4019 bridge at Jct 10 to studs under next bridge
4231-30034
19 9 A49 N/B 1800A49/320 1760 Jct R (to Stoke Prior) to River Bridge 43133-43134
20 9 A5 W/B 3200A5/293 1641 Exit from A49/A5112 Rbt to studs under bridge at 1641m
50293-50289
21 10 M56 W/B 0600M56/419, 0600M56/422
1898 End of slip On at Jct 10 (A49) to studs at 1898m
63410-63501-63601
22 7 A5 S/B 2400A5/50 2007
Studs near start of 2 lanes 2.5k S of Jct B577 for 2007m to studs near end of 2 lanes (studs are at start and end of grassed central reserve).
20067-20049
Benchmark surveys 2017
1 16 PPR861
Site
No. Area Route Direction Section(s)
Length
(m) Description Nodes
23 9 M6 S/B 3400M6/430 995 Studs 2255m before start of slip Off at Jct 14 to studs at 995m
23101-23001
24 9 M42 N/B 3700M42/334 1090 Studs 1090m before start of Slip Off to Jct 10 (A5) to start of Slip Off
28687-28685
25 9 M40 S/B 3700M40/183 1403 End of slip On at Jct 17 (M42 Jct 3a) to start of slip Off at Jct 16
29504-29503
26 7 M1 S/B 1000M1/216 1600 End of slip on at Tibshelf services to studs at “Jct 28 1 mile” sign
10054 (now
9997)- 10052
27 12 A616 W/B 4405A616/30 1717 Studs L Jct A629 to studs on river bridge at 1717m
61630-61644
28 10 M62 E/B 4200M62/450 1308 End of slip On at Jct 21 to studs at 1308m 22105-22107
29 12 M18 S/B 4400M18/108 1681 End of slip On at Jct 4 (A630) to studs at 1681m
4308-321
30 12 A63 W/B 2000A63/409 2378 End of slip On at A1034 to studs at bridge over 2378m
2002-30482
31 13 M6 S/B 2300M6/291 1973 End of slip On at Jct 33 to start of slip Off to Lancaster services
18323-18239
32 10 M58 W/B 2300 M58/431 1570 End of slip On at Jct 5 to start of slip Off at Jct 4
8618-20005
33 A1DDD
BFO A1 N/B
2700A1/242, 2700A1/252
1864 End of slip On at Bramham to start of slip Off to A659 (may now be DBFO)
21488-21422-21184
34 14 A1(M) N/B 1300A1M/212, 1300A1M/216
1426 End of slip on at Jct 59 (A167) to studs at 1426m
17-18-19
35 13 A66 E/B 0900A66/142 1860 Studs on bridge over B5292 (1950m E of A5086 Rbt) to studs at 1860m
31347-31507
36 13 M6 S/B 0900M6/373, 0900M6/379
1121 Start of slip Off at Jct 37 (A684) to end of slip On at Jct 37
14192-14187-14181
37 13 M6 S/B 0900M6/351 1385 Start of slip Off to Southwaite services to end of slip On from services
14779-14766
38 14 A1 S/B 2900A1/106 1727
Studs (road under) 2.22km before A19 bridge over to studs at 1727m (25m after Newcastle sign and 45m before start of slip off to A19)
14063-14002
39 14 A1 N/B 2900A1/380 2200 Jct Rt B6347 (to Christon Bank) to studs at start of dual c/way central reserve
11030-11101
40 9 M54 E/B 3200M54/784 1434 Asphalt/PQC surface change @ marker post 27/7 to start slip off to J4
54006-40100
41 6 A14 E/B 3500A14/632 to
3500A14/716 5601
End slip on J54, Sproughton to start slip off J56, Wherstead
90366-90301
42 6 A12 S/B 1500A12/158 1960 Baddow Park Overbridge to Slip off 40950-40960
43 M25 DBFO
M25 C/W 3600M25/464 2004 MP55/0 to MP57/0 21543-21541
Benchmark surveys 2017
1 17 PPR861
Appendix B Benchmark site data processed using the old analysis procedure (asphalt sites only)
B.1 2017 survey results
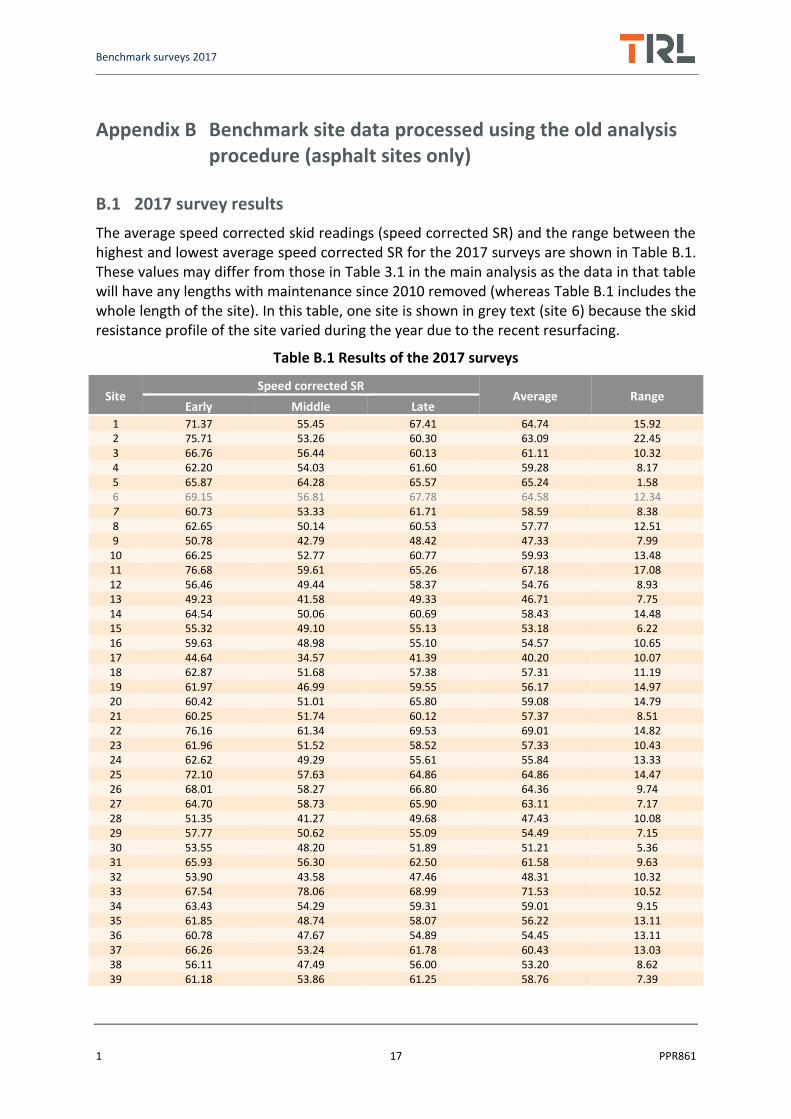
The average speed corrected skid readings (speed corrected SR) and the range between the highest and lowest average speed corrected SR for the 2017 surveys are shown in Table B.1. These values may differ from those in Table 3.1 in the main analysis as the data in that table will have any lengths with maintenance since 2010 removed (whereas Table B.1 includes the whole length of the site). In this table, one site is shown in grey text (site 6) because the skid resistance profile of the site varied during the year due to the recent resurfacing.
Table B.1 Results of the 2017 surveys
Site Speed corrected SR
Average Range Early Middle Late
1 71.37 55.45 67.41 64.74 15.92 2 75.71 53.26 60.30 63.09 22.45 3 66.76 56.44 60.13 61.11 10.32 4 62.20 54.03 61.60 59.28 8.17 5 65.87 64.28 65.57 65.24 1.58 6 69.15 56.81 67.78 64.58 12.34 7 60.73 53.33 61.71 58.59 8.38 8 62.65 50.14 60.53 57.77 12.51 9 50.78 42.79 48.42 47.33 7.99
10 66.25 52.77 60.77 59.93 13.48 11 76.68 59.61 65.26 67.18 17.08 12 56.46 49.44 58.37 54.76 8.93 13 49.23 41.58 49.33 46.71 7.75 14 64.54 50.06 60.69 58.43 14.48 15 55.32 49.10 55.13 53.18 6.22 16 59.63 48.98 55.10 54.57 10.65 17 44.64 34.57 41.39 40.20 10.07 18 62.87 51.68 57.38 57.31 11.19 19 61.97 46.99 59.55 56.17 14.97 20 60.42 51.01 65.80 59.08 14.79 21 60.25 51.74 60.12 57.37 8.51 22 76.16 61.34 69.53 69.01 14.82 23 61.96 51.52 58.52 57.33 10.43 24 62.62 49.29 55.61 55.84 13.33 25 72.10 57.63 64.86 64.86 14.47 26 68.01 58.27 66.80 64.36 9.74 27 64.70 58.73 65.90 63.11 7.17 28 51.35 41.27 49.68 47.43 10.08 29 57.77 50.62 55.09 54.49 7.15 30 53.55 48.20 51.89 51.21 5.36 31 65.93 56.30 62.50 61.58 9.63 32 53.90 43.58 47.46 48.31 10.32 33 67.54 78.06 68.99 71.53 10.52 34 63.43 54.29 59.31 59.01 9.15 35 61.85 48.74 58.07 56.22 13.11 36 60.78 47.67 54.89 54.45 13.11 37 66.26 53.24 61.78 60.43 13.03 38 56.11 47.49 56.00 53.20 8.62 39 61.18 53.86 61.25 58.76 7.39
Benchmark surveys 2017
1 18 PPR861
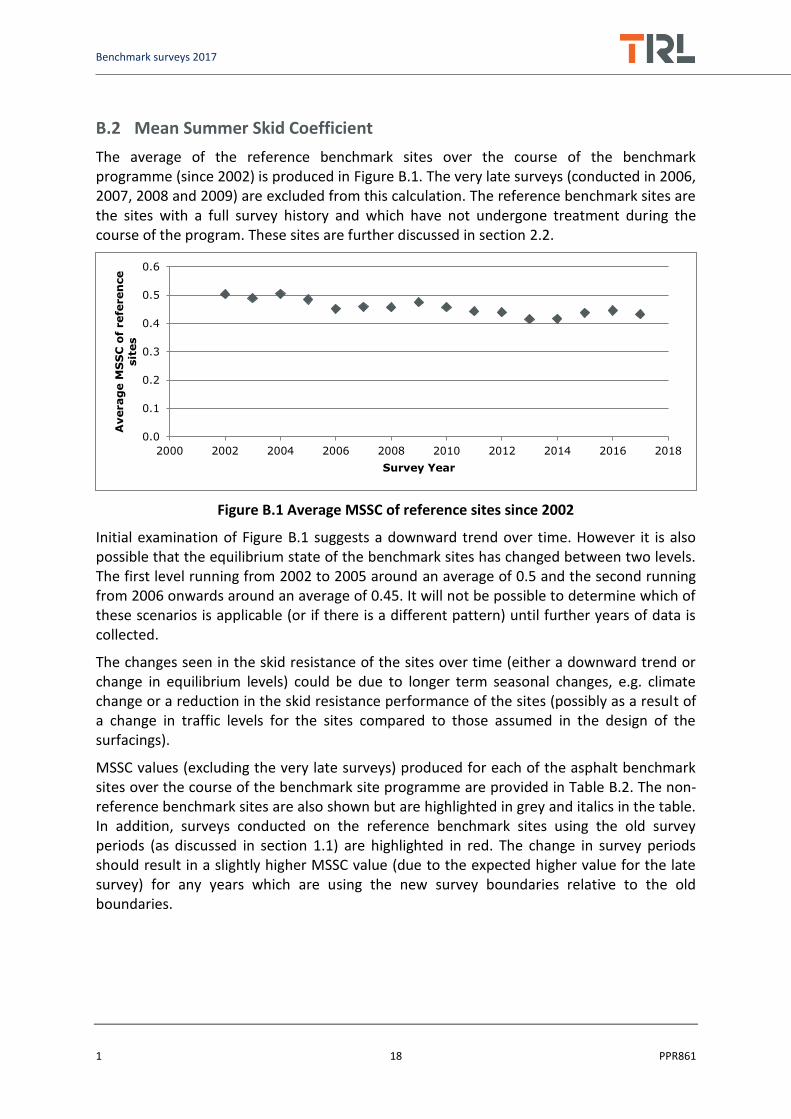
B.2 Mean Summer Skid Coefficient
The average of the reference benchmark sites over the course of the benchmark programme (since 2002) is produced in Figure B.1. The very late surveys (conducted in 2006, 2007, 2008 and 2009) are excluded from this calculation. The reference benchmark sites are the sites with a full survey history and which have not undergone treatment during the course of the program. These sites are further discussed in section 2.2.
Figure B.1 Average MSSC of reference sites since 2002
Initial examination of Figure B.1 suggests a downward trend over time. However it is also possible that the equilibrium state of the benchmark sites has changed between two levels. The first level running from 2002 to 2005 around an average of 0.5 and the second running from 2006 onwards around an average of 0.45. It will not be possible to determine which of these scenarios is applicable (or if there is a different pattern) until further years of data is collected.
The changes seen in the skid resistance of the sites over time (either a downward trend or change in equilibrium levels) could be due to longer term seasonal changes, e.g. climate change or a reduction in the skid resistance performance of the sites (possibly as a result of a change in traffic levels for the sites compared to those assumed in the design of the surfacings).
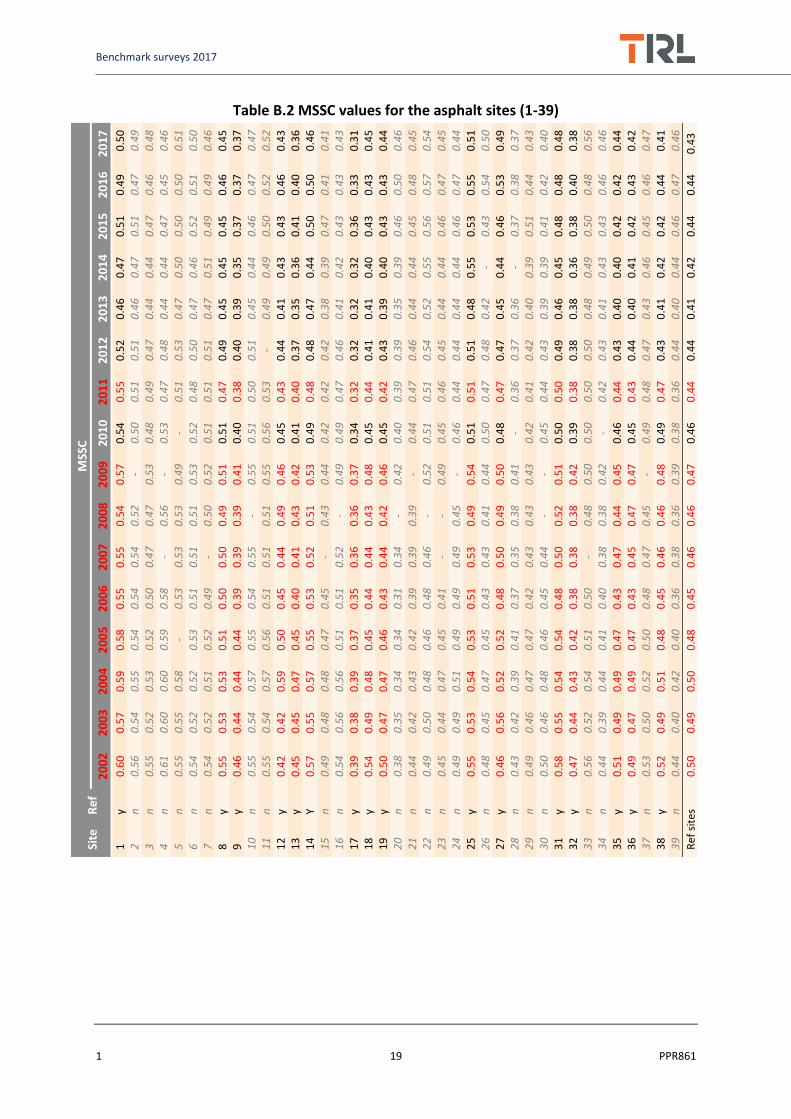
MSSC values (excluding the very late surveys) produced for each of the asphalt benchmark sites over the course of the benchmark site programme are provided in Table B.2. The non-reference benchmark sites are also shown but are highlighted in grey and italics in the table. In addition, surveys conducted on the reference benchmark sites using the old survey periods (as discussed in section 1.1) are highlighted in red. The change in survey periods should result in a slightly higher MSSC value (due to the expected higher value for the late survey) for any years which are using the new survey boundaries relative to the old boundaries.
0.0
0.1
0.2
0.3
0.4
0.5
0.6
2000 2002 2004 2006 2008 2010 2012 2014 2016 2018
Averag
e M
SS
C o
f refe
ren
ce
sit
es
Survey Year
Benchmark surveys 2017
1 19 PPR861
Table B.2 MSSC values for the asphalt sites (1-39)
Site
R
ef
MSS
C
20
02
2
00
3
20
04
2
00
5
20
06
2
00
7
20
08
2
00
9
20
10
2
01
1
20
12
2
01
3
20
14
2
01
5
20
16
2
01
7
1
y 0
.60
0
.57
0
.59
0
.58
0
.55
0
.55
0
.54
0
.57
0
.54
0
.55
0
.52
0
.46
0
.47
0
.51
0
.49
0
.50
2
n
0
.56
0
.54
0
.55
0
.54
0
.54
0
.54
0
.52
-
0.5
0
0.5
1
0.5
1
0.4
6
0.4
7
0.5
1
0.4
7
0.4
9
3
n
0.5
5
0.5
2
0.5
3
0.5
2
0.5
0
0.4
7
0.4
7
0.5
3
0.4
8
0.4
9
0.4
7
0.4
4
0.4
4
0.4
7
0.4
6
0.4
8
4
n
0.6
1
0.6
0
0.6
0
0.5
9
0.5
8
- 0
.56
-
0.5
3
0.4
7
0.4
8
0.4
4
0.4
4
0.4
7
0.4
5
0.4
6
5
n
0.5
5
0.5
5
0.5
8
- 0
.53
0
.53
0
.53
0
.49
-
0.5
1
0.5
3
0.4
7
0.5
0
0.5
0
0.5
0
0.5
1
6
n
0.5
4
0.5
2
0.5
2
0.5
3
0.5
1
0.5
1
0.5
1
0.5
3
0.5
2
0.4
8
0.5
0
0.4
7
0.4
6
0.5
2
0.5
1
0.5
0
7
n
0.5
4
0.5
2
0.5
1
0.5
2
0.4
9
- 0
.50
0
.52
0
.51
0
.51
0
.51
0
.47
0
.51
0
.49
0
.49
0
.46
8
y
0.5
5
0.5
3
0.5
3
0.5
1
0.5
0
0.5
0
0.4
9
0.5
1
0.5
1
0.4
7
0.4
9
0.4
5
0.4
5
0.4
5
0.4
6
0.4
5
9
y 0
.46
0
.44
0
.44
0
.44
0
.39
0
.39
0
.39
0
.41
0
.40
0
.38
0
.40
0
.39
0
.35
0
.37
0
.37
0
.37
1
0
n
0.5
5
0.5
4
0.5
7
0.5
5
0.5
4
0.5
5
- 0
.55
0
.51
0
.50
0
.51
0
.45
0
.44
0
.46
0
.47
0
.47
1
1
n
0.5
5
0.5
4
0.5
7
0.5
6
0.5
1
0.5
1
0.5
1
0.5
5
0.5
6
0.5
3
- 0
.49
0
.49
0
.50
0
.52
0
.52
1
2
y 0
.42
0
.42
0
.59
0
.50
0
.45
0
.44
0
.49
0
.46
0
.45
0
.43
0
.44
0
.41
0
.43
0
.43
0
.46
0
.43
1
3
y 0
.45
0
.45
0
.47
0
.45
0
.40
0
.41
0
.43
0
.42
0
.41
0
.40
0
.37
0
.35
0
.36
0
.41
0
.40
0
.36
1
4
Y 0
.57
0
.55
0
.57
0
.55
0
.53
0
.52
0
.51
0
.53
0
.49
0
.48
0
.48
0
.47
0
.44
0
.50
0
.50
0
.46
1
5
n
0.4
9
0.4
8
0.4
8
0.4
7
0.4
5
- 0
.43
0
.44
0
.42
0
.42
0
.42
0
.38
0
.39
0
.47
0
.41
0
.41
1
6
n
0.5
4
0.5
6
0.5
6
0.5
1
0.5
1
0.5
2
- 0
.49
0
.49
0
.47
0
.46
0
.41
0
.42
0
.43
0
.43
0
.43
1
7
y 0
.39
0
.38
0
.39
0
.37
0
.35
0
.36
0
.36
0
.37
0
.34
0
.32
0
.32
0
.32
0
.32
0
.36
0
.33
0
.31
1
8
y 0
.54
0
.49
0
.48
0
.45
0
.44
0
.44
0
.43
0
.48
0
.45
0
.44
0
.41
0
.41
0
.40
0
.43
0
.43
0
.45
1
9
y 0
.50
0
.47
0
.47
0
.46
0
.43
0
.44
0
.42
0
.46
0
.45
0
.42
0
.43
0
.39
0
.40
0
.43
0
.43
0
.44
2
0
n
0.3
8
0.3
5
0.3
4
0.3
4
0.3
1
0.3
4
- 0
.42
0
.40
0
.39
0
.39
0
.35
0
.39
0
.46
0
.50
0
.46
2
1
n
0.4
4
0.4
2
0.4
3
0.4
2
0.3
9
0.3
9
0.3
9
- 0
.44
0
.47
0
.46
0
.44
0
.44
0
.45
0
.48
0
.45
2
2
n
0.4
9
0.5
0
0.4
8
0.4
6
0.4
8
0.4
6
- 0
.52
0
.51
0
.51
0
.54
0
.52
0
.55
0
.56
0
.57
0
.54
2
3
n
0.4
5
0.4
4
0.4
7
0.4
5
0.4
1
- -
0.4
9
0.4
5
0.4
6
0.4
5
0.4
4
0.4
4
0.4
6
0.4
7
0.4
5
24
n
0
.49
0
.49
0
.51
0
.49
0
.49
0
.49
0
.45
-
0.4
6
0.4
4
0.4
4
0.4
4
0.4
4
0.4
6
0.4
7
0.4
4
25
y
0.5
5
0.5
3
0.5
4
0.5
3
0.5
1
0.5
3
0.4
9
0.5
4
0.5
1
0.5
1
0.5
1
0.4
8
0.5
5
0.5
3
0.5
5
0.5
1
26
n
0
.48
0
.45
0
.47
0
.45
0
.43
0
.43
0
.41
0
.44
0
.50
0
.47
0
.48
0
.42
-
0.4
3
0.5
4
0.5
0
27
y
0.4
6
0.5
6
0.5
2
0.5
2
0.4
8
0.5
0
0.4
9
0.5
0
0.4
8
0.4
7
0.4
7
0.4
5
0.4
4
0.4
6
0.5
3
0.4
9
28
n
0
.43
0
.42
0
.39
0
.41
0
.37
0
.35
0
.38
0
.41
-
0.3
6
0.3
7
0.3
6
- 0
.37
0
.38
0
.37
2
9
n
0.4
9
0.4
6
0.4
7
0.4
7
0.4
2
0.4
3
0.4
3
0.4
3
0.4
2
0.4
1
0.4
2
0.4
0
0.3
9
0.5
1
0.4
4
0.4
3
30
n
0
.50
0
.46
0
.48
0
.46
0
.45
0
.44
-
- 0
.45
0
.44
0
.43
0
.39
0
.39
0
.41
0
.42
0
.40
3
1
y 0
.58
0
.55
0
.54
0
.54
0
.48
0
.50
0
.52
0
.51
0
.50
0
.50
0
.49
0
.46
0
.45
0
.48
0
.48
0
.48
3
2
y 0
.47
0
.44
0
.43
0
.42
0
.38
0
.38
0
.38
0
.42
0
.39
0
.38
0
.38
0
.38
0
.36
0
.38
0
.40
0
.38
3
3
n
0.5
6
0.5
2
0.5
4
0.5
1
0.5
0
- 0
.48
0
.50
0
.50
0
.50
0
.50
0
.48
0
.49
0
.50
0
.48
0
.56
3
4
n
0.4
4
0.3
9
0.4
4
0.4
1
0.4
0
0.3
8
0.3
8
0.4
2
- 0
.42
0
.43
0
.41
0
.43
0
.43
0
.46
0
.46
3
5
y 0
.51
0
.49
0
.49
0
.47
0
.43
0
.47
0
.44
0
.45
0
.46
0
.44
0
.43
0
.40
0
.40
0
.42
0
.42
0
.44
3
6
y 0
.49
0
.47
0
.49
0
.47
0
.43
0
.45
0
.47
0
.47
0
.45
0
.43
0
.44
0
.40
0
.41
0
.42
0
.43
0
.42
3
7
n
0.5
3
0.5
0
0.5
2
0.5
0
0.4
8
0.4
7
0.4
5
- 0
.49
0
.48
0
.47
0
.43
0
.46
0
.45
0
.46
0
.47
3
8
y 0
.52
0
.49
0
.51
0
.48
0
.45
0
.46
0
.46
0
.48
0
.49
0
.47
0
.43
0
.41
0
.42
0
.42
0
.44
0
.41
3
9
n
0.4
4
0.4
0
0.4
2
0.4
0
0.3
6
0.3
8
0.3
6
0.3
9
0.3
8
0.3
6
0.4
4
0.4
0
0.4
4
0.4
6
0.4
7
0.4
6
Ref
sit
es
0.5
0
0.4
9
0.5
0
0.4
8
0.4
5
0.4
6
0.4
6
0.4
7
0.4
6
0.4
4
0.4
4
0.4
1
0.4
2
0.4
4
0.4
4
0.4
3
Benchmark surveys 2017
1 20 PPR861
Appendix C Historic data processed using the current defined site lengths
Table C.1 2010 benchmark surveys using the current defined lengths
Site Number of
100m lengths
Average SR Between run
standard deviation Average
Early Middle Late
1 8 78.8 61.8 65.7 9.00 68.8 2 6 69.5 58.7 64.4 5.46 64.2 3 0 - - - - - 4 6 68.6 60.3 63.0 4.26 64.0 5 2 69.1 68.1 71.8 1.91 69.6 6 0 - - - - - 7 0 - - - - - 8 9 73.7 58.2 61.7 8.16 64.5 9 13 55.2 49.0 50.3 3.50 51.5
10 17 70.5 58.4 57.7 7.31 62.2 11 0 - - - - - 12 8 59.8 54.5 57.2 2.79 57.2 13 11 57.0 49.0 50.2 4.36 52.1 14 16 70.5 58.3 59.8 7.18 62.9 15 2 53.2 49.1 50.6 2.13 51.0 16 18 69.0 59.3 59.5 5.57 62.6 17 16 49.1 41.3 40.2 5.07 43.5 18 10 63.3 53.0 56.3 5.31 57.5 19 16 61.2 56.4 56.2 2.91 57.9 20 0 - - - - - 21 16 63.5 55.6 58.1 4.13 59.1 22 19 67.0 64.2 64.2 1.71 65.2 23 10 60.7 54.3 58.8 3.38 57.9 24 10 63.7 55.9 57.3 4.18 59.0 25 11 68.4 62.2 65.4 3.10 65.3 26 0 - - - - - 27 16 65.4 59.0 60.5 3.43 61.6 28 0 - - - - - 29 1 76.3 66.5 68.6 5.15 70.5 30 12 60.7 50.3 57.5 5.49 56.2 31 18 68.6 61.8 62.8 3.83 64.4 32 14 52.9 46.8 48.5 3.43 49.4 33 0 - - - - - 34 14 64.4 51.1 55.8 6.82 57.1 35 17 64.0 57.6 55.4 4.54 59.0 36 10 66.2 55.2 53.9 7.02 58.4 37 13 69.2 60.8 60.7 4.94 63.6 38 16 68.1 57.4 61.3 5.51 62.3 39 3 69.0 51.6 57.4 8.87 59.3
40 13 62.1 59.3 60.7 1.67 60.7 41 19 41.5 39.7 39.6 1.28 40.3 42 18 52.5 50.7 47.0 2.87 50.1 43 19 47.1 40.8 43.5 3.27 43.8
Asphalt 0-39 358 64.6 56.0 57.7 5.11 59.4 Concrete 40-43 69 49.8 46.5 46.6 2.47 47.6

Benchmark surveys 2017
1 21 PPR861
Table C.2 2011 benchmark surveys using the current defined lengths
Site Number of
100m lengths
Average SR Between run
standard deviation Average
Early Middle Late
1 8 68.5 70.2 74.7 3.28 71.1 2 6 63.2 66.4 67.1 2.09 65.6 3 0 - - - - - 4 6 62.7 59.7 56.9 2.96 59.8 5 2 70.7 66.6 71.6 2.64 69.6 6 0 - - - - - 7 0 - - - - - 8 9 57.5 60.3 61.0 2.02 59.6 9 13 48.0 51.0 48.4 2.30 49.1
10 17 59.6 62.3 62.8 1.87 61.5 11 0 - - - - - 12 8 52.9 55.7 53.7 1.57 54.1 13 11 52.6 46.8 53.4 3.62 51.0 14 16 62.7 58.3 60.5 2.29 60.5 15 2 53.3 49.7 51.3 1.84 51.4 16 18 59.7 60.4 59.4 0.76 59.8 17 16 42.9 40.4 39.1 2.01 40.8 18 10 63.9 51.9 52.4 6.85 56.1 19 16 58.1 51.5 52.5 3.60 54.0 20 0 - - - - - 21 16 63.7 57.6 60.1 3.76 60.5 22 19 66.0 64.8 64.8 0.99 65.2 23 10 60.9 60.3 56.3 2.55 59.1 24 10 58.7 57.9 52.9 3.19 56.5 25 11 66.8 65.6 64.1 1.34 65.5 26 0 - - - - - 27 16 64.1 58.4 57.5 3.66 60.0 28 0 - - - - - 29 1 69.8 68.0 65.7 2.05 67.8 30 12 58.1 51.5 54.3 3.67 54.7 31 18 67.2 61.6 62.8 2.95 63.9 32 14 50.0 46.5 49.5 2.25 48.7 33 0 - - - - - 34 14 56.3 55.3 53.2 1.75 54.9 35 17 59.7 54.8 56.0 2.63 56.9 36 10 57.1 52.1 54.2 2.60 54.5 37 13 64.3 61.2 61.0 1.91 62.2 38 16 65.0 58.3 58.2 4.06 60.5 39 3 62.1 56.4 55.5 3.64 58.0
40 13 60.9 63.0 59.1 2.08 61.0 41 19 40.3 41.3 42.8 1.51 41.5 42 18 52.7 52.9 55.6 1.74 53.7 43 19 44.3 45.2 45.2 0.82 44.9
Asphalt 0-39 358 59.7 56.8 57.1 2.88 57.9 Concrete 40-43 69 48.5 49.5 49.9 1.56 49.3

Benchmark surveys 2017
1 22 PPR861
Table C.3 2012 benchmark surveys using the current defined lengths
Site Number of
100m lengths
Average SR Between run
standard deviation Average
Early Middle Late
1 8 67.5 68.8 69.5 2.14 68.6 2 6 65.4 66.1 64.5 1.02 65.3 3 0 - - - - - 4 6 62.3 63.4 59.3 2.17 61.7 5 2 72.0 68.2 70.2 1.95 70.1 6 0 - - - - - 7 0 - - - - - 8 9 63.7 58.8 63.3 3.04 61.9 9 13 53.8 49.3 50.8 2.82 51.3
10 17 64.7 63.0 63.9 1.78 63.9 11 0 - - - - - 12 8 56.8 53.9 55.6 1.55 55.4 13 11 49.0 47.2 46.3 1.47 47.5 14 16 62.9 58.3 64.6 3.94 61.9 15 2 52.5 49.9 51.5 1.30 51.3 16 18 63.5 57.0 57.7 3.66 59.4 17 16 40.8 42.9 39.9 1.57 41.2 18 10 55.0 52.7 52.0 1.64 53.2 19 16 56.6 55.1 52.1 2.43 54.6 20 0 - - - - - 21 16 61.2 61.5 57.9 2.32 60.2 22 19 69.1 68.5 70.9 1.36 69.5 23 10 60.2 56.3 56.9 2.14 57.8 24 10 56.9 56.2 57.4 0.80 56.8 25 11 65.7 65.5 67.1 0.96 66.1 26 0 - - - - - 27 16 62.5 59.2 60.2 1.75 60.6 28 0 - - - - - 29 1 71.0 68.9 72.5 1.79 70.8 30 12 55.9 54.7 53.5 1.57 54.7 31 18 62.9 64.9 62.6 1.48 63.5 32 14 49.7 48.5 48.7 1.05 49.0 33 0 - - - - - 34 14 59.2 54.0 53.7 3.20 55.6 35 17 56.5 56.2 51.6 2.77 54.7 36 10 57.8 57.3 55.9 1.50 57.0 37 13 62.4 63.2 56.3 3.78 60.6 38 16 57.3 55.3 52.6 2.48 55.1 39 3 58.4 55.7 53.4 2.55 55.8
40 13 63.3 60.9 60.2 1.78 61.5 41 19 39.1 40.0 44.1 2.71 41.0 42 18 57.2 54.4 57.0 1.81 56.2 43 19 46.8 42.9 48.0 2.71 45.9
Asphalt 0-39 358 59.2 57.6 57.1 2.33 58.0 Concrete 40-43 69 50.5 48.5 51.6 2.34 50.2
Benchmark surveys 2017
1 23 PPR861
Table C.4 2013 benchmark surveys using the current defined lengths
Site Number of
100m lengths
Average SR Between run
standard deviation Average
Early Middle Late
1 8 66.0 63.0 62.3 2.04 63.8 2 6 61.0 58.1 56.8 2.20 58.6 3 0 - - - - - 4 6 57.5 56.9 57.1 0.33 57.2 5 2 66.8 61.1 61.5 3.22 63.1 6 0 - - - - - 7 0 - - - - - 8 9 56.8 59.1 58.1 1.45 58.0 9 13 45.5 61.4 43.2 10.07 50.1
10 17 58.0 57.4 56.2 1.05 57.2 11 0 - - - - - 12 8 55.9 52.1 48.7 3.61 52.2 13 11 47.1 44.9 44.2 1.63 45.4 14 16 62.8 65.3 52.9 7.26 60.3 15 2 45.6 50.3 43.2 3.70 46.4 16 18 56.0 52.0 50.9 2.73 52.9 17 16 41.6 40.9 40.2 0.80 40.9 18 10 52.8 52.6 51.3 0.89 52.2 19 16 49.5 52.1 50.2 1.38 50.6 20 0 - - - - - 21 16 58.2 58.3 56.6 1.50 57.7 22 19 67.6 65.4 66.0 1.38 66.3 23 10 56.8 56.4 55.7 0.68 56.3 24 10 56.1 58.4 54.5 2.09 56.3 25 11 62.6 60.6 60.9 1.16 61.4 26 0 - - - - - 27 16 57.6 56.9 59.1 1.21 57.9 28 0 - - - - - 29 1 64.3 68.2 69.8 2.83 67.4 30 12 49.0 50.2 51.3 1.51 50.2 31 18 58.1 54.6 63.2 4.38 58.6 32 14 50.9 48.1 48.4 1.79 49.1 33 0 - - - - - 34 14 56.4 48.1 54.6 4.46 53.0 35 17 51.9 48.1 52.7 2.50 50.9 36 10 52.9 48.6 54.0 2.97 51.8 37 13 55.9 51.9 57.7 3.04 55.2 38 16 54.9 49.1 53.4 3.11 52.5 39 3 56.0 49.2 55.8 3.96 53.7
40 13 56.8 58.8 57.8 1.07 57.8 41 19 36.6 37.3 36.8 0.53 36.9 42 18 49.3 51.1 48.2 1.52 49.5 43 19 51.9 47.8 46.0 3.31 48.6
Asphalt 0-39 358 55.5 54.3 54.1 3.35 54.6 Concrete 40-43 69 48.0 47.8 46.2 1.98 47.3
Benchmark surveys 2017
1 24 PPR861
Table C.5 2014 benchmark surveys using the current defined lengths
Site Number of
100m lengths
Average SR Between run
standard deviation Average
Early Middle Late
1 8 67.6 59.8 65.7 4.28 64.4 2 6 64.6 54.8 61.7 5.07 60.4 3 0 - - - - - 4 6 58.7 53.5 58.5 2.96 56.9 5 2 71.2 62.1 67.9 4.63 67.1 6 0 - - - - - 7 0 - - - - - 8 9 58.5 56.2 57.2 1.22 57.3 9 13 47.1 45.2 44.6 2.79 45.6
10 17 59.7 51.2 57.9 4.74 56.3 11 0 - - - - - 12 8 59.4 50.2 56.4 4.86 55.3 13 11 46.9 42.6 47.2 2.89 45.6 14 16 59.8 52.0 58.7 4.45 56.9 15 2 50.2 38.7 44.1 5.76 44.4 16 18 55.5 52.4 55.2 1.95 54.4 17 16 45.8 37.4 40.8 4.32 41.3 18 10 54.6 46.0 51.4 4.40 50.7 19 16 53.2 47.6 54.2 3.66 51.7 20 0 - - - - - 21 16 59.6 54.8 56.3 2.86 56.9 22 19 75.6 65.1 69.2 5.34 70.0 23 10 59.1 51.7 57.3 3.87 56.0 24 10 63.2 53.2 52.5 6.04 56.3 25 11 87.5 60.5 63.9 14.73 70.6 26 0 - - - - - 27 16 61.2 50.6 56.1 5.41 55.9 28 0 - - - - - 29 1 72.8 61.5 68.9 5.74 67.7 30 12 56.1 45.3 47.3 5.82 49.6 31 18 60.7 55.3 59.5 2.93 58.5 32 14 46.9 46.8 45.6 1.44 46.4 33 0 - - - - - 34 14 60.9 50.1 54.3 5.54 55.1 35 17 54.0 49.0 52.1 2.62 51.7 36 10 53.7 50.1 52.5 2.24 52.1 37 13 65.6 56.6 56.3 5.40 59.5 38 16 57.5 51.7 52.5 3.58 53.9 39 3 61.3 60.4 53.7 4.36 58.5
40 13 61.8 56.9 61.2 2.73 60.0 41 19 40.8 35.5 39.5 2.89 38.6 42 18 51.8 44.9 53.1 4.49 49.9 43 19 48.5 43.0 47.1 2.95 46.2
Asphalt 0-39 358 58.8 51.5 54.9 4.80 55.1 Concrete 40-43 69 49.7 44.0 49.2 3.37 47.7

Benchmark surveys 2017
1 25 PPR861
Table C.6 2015 benchmark surveys using the current defined lengths
Site Number of
100m lengths
Average SR Between run
standard deviation Average
Early Middle Late
1 8 73.2 64.4 71.5 4.98 69.7 2 6 70.3 58.5 66.6 6.25 65.1 3 0 - - - - - 4 6 60.3 60.5 61.5 0.96 60.8 5 2 67.0 59.8 68.6 5.02 65.1 6 0 - - - - - 7 0 - - - - - 8 9 62.5 53.5 59.5 4.75 58.5 9 13 53.2 41.8 47.9 6.69 47.6
10 17 66.4 53.2 56.7 6.90 58.8 11 0 - - - - - 12 8 62.4 48.3 53.7 7.18 54.8 13 11 53.1 45.0 58.7 6.95 52.3 14 16 67.3 55.9 70.9 7.91 64.7 15 2 50.4 42.2 56.4 7.20 49.7 16 18 60.2 50.9 52.7 5.04 54.6 17 16 45.4 41.0 51.7 5.60 46.0 18 10 57.6 49.6 57.2 4.56 54.8 19 16 56.2 51.5 58.7 3.74 55.5 20 0 - - - - - 21 16 62.3 56.9 55.8 3.97 58.3 22 19 73.4 67.5 73.6 3.53 71.5 23 10 57.5 57.9 61.6 2.31 59.0 24 10 63.8 55.3 59.6 4.37 59.6 25 11 73.4 59.3 71.6 7.74 68.1 26 0 - - - - - 27 16 63.6 56.9 57.4 3.83 59.3 28 0 - - - - - 29 1 66.5 80.6 74.9 7.08 74.0 30 12 53.2 51.2 55.4 2.44 53.3 31 18 61.3 60.9 61.4 1.58 61.2 32 14 50.8 46.3 48.1 2.84 48.4 33 0 - - - - - 34 14 57.3 51.1 56.8 3.91 55.1 35 17 57.9 50.8 51.6 4.05 53.5 36 10 53.2 51.9 55.6 2.45 53.6 37 13 61.7 55.1 57.1 3.70 57.9 38 16 58.0 51.7 51.0 4.02 53.6 39 3 61.3 58.4 58.5 1.86 59.4
40 13 71.1 57.8 68.3 7.07 65.7 41 19 42.7 36.2 38.0 3.41 39.0 42 18 57.1 48.8 49.1 4.81 51.7 43 19 51.4 42.1 44.5 5.01 46.0
Asphalt 0-39 358 60.4 53.5 58.4 4.85 57.4 Concrete 40-43 69 54.2 45.2 48.4 5.06 49.3
Benchmark surveys 2017
1 26 PPR861
Table C.7 2016 benchmark surveys using the current defined lengths
Site Number of
100m lengths
Average SR Between run
standard deviation Average
Early Middle Late
1 8 63.0 62.5 74.8 7.22 66.8 2 6 61.4 61.1 65.4 2.83 62.6 3 0 - - - - - 4 6 58.7 55.2 61.2 3.04 58.3 5 2 69.0 63.5 65.7 3.22 66.0 6 0 - - - - - 7 0 - - - - - 8 9 59.1 59.1 62.1 2.09 60.1 9 13 48.0 45.8 48.0 3.05 47.3
10 17 62.2 59.5 59.5 1.90 60.4 11 0 - - - - - 12 8 60.8 57.7 57.8 2.51 58.7 13 11 51.8 49.1 53.6 2.73 51.5 14 16 70.6 61.8 60.0 5.81 64.1 15 2 45.7 47.7 50.0 2.19 47.8 16 18 57.0 51.3 55.9 3.28 54.8 17 16 45.5 41.3 42.0 2.46 42.9 18 10 54.6 51.8 57.9 3.13 54.8 19 16 55.4 54.9 55.0 0.89 55.1 20 0 - - - - - 21 16 66.7 61.8 59.4 4.03 62.6 22 19 76.4 70.4 73.5 3.30 73.4 23 10 63.5 59.2 59.7 2.54 60.8 24 10 64.1 56.0 61.2 4.29 60.4 25 11 75.7 65.4 69.1 5.39 70.1 26 0 - - - - - 27 16 62.0 77.0 66.2 7.99 68.4 28 0 - - - - - 29 1 60.9 56.4 59.4 2.29 58.9 30 12 53.6 51.2 54.1 2.63 53.0 31 18 64.3 58.7 63.6 3.19 62.2 32 14 50.2 49.9 50.9 1.89 50.3 33 0 - - - - - 34 14 61.3 59.6 57.9 2.41 59.6 35 17 55.6 52.3 54.8 2.35 54.2 36 10 59.0 52.6 54.0 4.15 55.2 37 13 60.8 56.4 61.4 2.81 59.6 38 16 52.8 55.3 59.4 3.52 55.8 39 3 60.2 64.3 64.4 2.39 63.0
40 13 64.5 62.7 63.8 1.92 63.7 41 19 42.0 43.5 43.6 1.61 43.1 42 18 52.1 57.4 55.1 2.86 54.8 43 19 53.1 49.7 53.0 2.08 52.0
Asphalt 0-39 358 59.9 57.1 58.9 3.70 58.6 Concrete 40-43 69 51.9 52.4 53.0 2.18 52.5
Skid resistance benchmark surveys 2017
Highways England manages levels of skid resistance on their network (the Strategic Road Network or SRN) by carrying out single annual skid resistance surveys (SASS). These surveys are carried out over the course of the summer and are split over three survey periods (early, middle and late). It is known that skid resistance varies during the year and between years and the survey data is corrected by the application of correction factors called the “Local Equilibrium Correction Factors” (LECF). To monitor the ongoing trends in skid resistance levels, Highways England established a series of benchmark sites. These sites are surveyed in all three of the survey periods during the survey season. The data collected is then examined for within year and between year trends in the skid resistance levels. This report discusses the analysis of the survey data collected in 2016, and compares the results of the analysis to those from earlier years.
Other titles from this subject area
PPR 827 Skid resistance benchmark surveys 2016. S Brittain. 2017
PPR 803 Skid resistance benchmark surveys 2015. S Brittain. 2016
CPR 2028 Skid resistance benchmark surveys 2014. S Brittain. 2015
CPR 1822 Skid resistance benchmark surveys 2013. S Brittain. 2014
TRL
Crowthorne House, Nine Mile Ride, Wokingham, Berkshire, RG40 3GA, United Kingdom T: +44 (0) 1344 773131 F: +44 (0) 1344 770356 E: [email protected] W: www.trl.co.uk
ISSN 2514-9652
ISBN 978-1-912433-42-1
PPR861