Embed Size (px)
Citation preview

PUBLISHED PROJECT REPORT PPR828
Transforming the practical driving test Final report
Helman S, Wallbank C, Chowdhury S, Hammond J, Kinnear N, Buttress S, Jenkins R, Grayson G

Final PPR828
Report details
Report prepared for: Driver and Vehicle Standards Agency
Project/customer reference: 11113233
Copyright: © Transport Research Laboratory
Report date: 18 July 2017
Report status/version: Final
Quality approval:
Su Buttress
(Project Manager)
Graham Grayson
(Technical Reviewer)
Disclaimer
This report has been produced by the Transport Research Laboratory under a contract with Driver and Vehicle Standards Agency. Any views expressed in this report are not necessarily those of Driver and Vehicle Standards Agency.
The information contained herein is the property of TRL Limited and does not necessarily reflect the views or policies of the customer for whom this report was prepared. Whilst every effort has been made to ensure that the matter presented in this report is relevant, accurate and up-to-date, TRL Limited cannot accept any liability for any error or omission, or reliance on part or all of the content in another context.
When purchased in hard copy, this publication is printed on paper that is FSC (Forest Stewardship Council) and TCF (Totally Chlorine Free) registered.

1
Contents
Abstract 4
Executive summary 5
1 Introduction 9
1.1 Background 9
1.2 The ‘Transforming the Practical Driving Test’ project 9
1.3 This summary report 10
2 Overview of the study method and design 11
2.1 Objectives of study 11
2.2 Design and procedure 11
2.3 The proposed new practical driving test 13
2.4 Survey measures 13
2.4.1 ADIs 13
2.4.2 Drivers 14
2.5 Qualitative data 14
2.6 Test performance data 14
2.7 Statistical testing 14
3 Characteristics of the samples 16
3.1 ADIs 16
3.1.1 Age and gender 16
3.1.2 Test centres used 16
3.1.3 Number of years of experience, grade, and full/part time status 16
3.1.4 Summary of ADI sample 17
3.2 Drivers (main trial sample) 17
3.2.1 Gender 17
3.2.2 Age 17
3.2.3 Access to a vehicle 18
3.2.4 Sensation-seeking 19
3.2.5 Summary of main trial driver sample 19
3.3 Drivers (national comparison group samples) 19

2
3.4 Samples for focus groups and interviews 19
4 Findings – views and opinions of the revised test 21
4.1 Making the test relevant to today’s driving 21
4.2 The revised test gives learners a firm basis in independent driving 21
4.3 Private practice is seen as generally positive 22
4.4 The revised test is viewed as easier than the current test 22
4.5 The preparation for the revised test doesn’t teach new drivers all they need to know 23
4.6 Views and opinions of the new test – summary of findings 23
5 Findings – learning to drive 24
5.1 Time spent learning 24
5.2 Conditions under which learning took place 24
5.2.1 Main trial groups 24
5.2.2 National comparison group 27
5.3 Attitudes, confidence, and driving style 27
5.3.1 Improvement needed in specific skills 27
5.3.2 Confidence in driving ability 28
5.3.3 Driving style 29
5.3.4 Attitudes to risky driving 29
5.4 Learning to drive – summary of findings 29
6 Findings – test performance 31
6.1 Self-report data on number of attempts 31
6.2 DL25 data for those completing the learning to drive survey 31
6.3 Summary of test performance findings 32
7 Findings – post-test driving 33
7.1 Driving experience 33
7.2 Attitudes, confidence and driving style 34
7.3 Near-collisions 34
7.4 Collisions 35
7.4.1 Collisions by age, gender and frequency of driving 35
7.4.2 Collisions by test type 36
7.5 Collision modelling 38
7.5.1 Modelling method 38

3
7.5.2 The base model 38
7.5.3 The impact of other variables on collisions 39
7.6 Comparison with previous models 43
7.7 Post-test driving – summary of findings 43
8 Discussion 44
8.1 Effects of the revised test on preparation and learning 44
8.2 Effects of the revised test on test performance 44
8.3 Effects of the revised test on post-test driving and collisions 44
8.4 Findings from collision modelling 45
8.5 Summary of findings related to the revised test 47
References 48

4
Abstract
This study evaluated the impact of a proposed new practical driving test on learning to drive, test performance, and on post-test driving in GB. The new test was designed to promote a wider range of learning when learning to drive, and through this was designed to improve safety post-test. Learner drivers were recruited to the study through their driving instructors, and were pseudo-randomised to take either the existing test or the new test for licence acquisition. They then completed surveys when they passed their test, and again at six months post-test. The data also showed that being younger at test pass, and driving more, increased crash risk, confirming previous work in the area. No gender difference was apparent. Driving for work, and being on a telematics insurance policy were associated with large increases in collision risk. Across the whole sample of over 2,500 test passers, around one in eleven reported a collision of some kind in their first six months of driving. The new test was well-received by driving instructors, test passers, and those providing private supervised practice. In terms of post-test driving, the new test was not associated with any change in collision risk, even when compared with a national comparison sample to control for possible training bias in the main trial groups. Performance was not noticeably different between the two tests. The new test prompted some modest changes in the training people undertook when learning to drive, and new test passers did show higher confidence and more insight into their limitations at test pass.

5
Executive summary
Background
Newly qualified drivers (especially those who are young) have a much higher collision risk that is the case for drivers who have greater experience (Wells, Tong, Sexton, Grayson & Jones, 2008; Forsyth, Maycock & Sexton, 1995; Maycock, Lockwood & Lester, 1991).
The importance of driving experience presents an opportunity for driver testing; if testing can be undertaken in such a way as to increase and improve pre-licence on-road experience, it may improve safety for drivers when they begin driving unsupervised. Evidence from Sweden and Australia (Gregersen, Berg, Engström, Nolén, Nyberg & Rimmö, 2000; Scott-Parker, Watson, King, Hyde & Bates, 2012) has suggested that increasing the amount of pre-licence supervised practice undertaken by learner drivers can reduce collision risk in early driving. Research in GB has suggested that the type of pre-licence experience can also have safety implications; Sexton and Grayson (2010) showed that drivers who had experience of driving in busy town centres and in the rain for at least two hours when learning were safer in post-test driving than those who lacked such experience.
Proposed new practical driving test
The DVSA proposed a new practical driving test for trialling in late 2014. The main changes introduced by the proposed test are a longer independent driving section (20 minutes, versus the current 10 minutes) supported by a satnav, and changes to the manoeuvres undertaken. The intention is that these changes will make it easier for the test to encompass a wider range of busier and faster roads. This is because the modified manoeuvres can be done in a wider range of locations than the old ones, and the use of a satnav will enable greater route variability. Since the contents of the test are known to have an influence on the training people undertake to prepare for it, it is hoped that the changes will promote a wider pre-test learning experience, and that this will have an impact on safety outcomes.
The project reported here examined the impact of the proposed new driving test on the preparation learner drivers undertake for the test, and on their post-test driving. The project also sought to understand how learners, approved driving instructors (ADIs) and supervising drivers such as parents respond to the revised test, in terms of their opinions, and in terms of learners’ test performance.
Method
Learner drivers who were training for their first driving test were recruited to the study through their ADIs from 32 test centres across GB. They were pseudo-randomised to take either the existing test, or the revised test, for licence acquisition. The first learner recruited by each ADI was randomly allocated to one of the two tests, and each subsequent learner from each ADI was allocated to alternating test types. ADIs were informed the test type to which each of their learners in the trial was assigned, and were asked to instruct them accordingly.
When learners passed their test, they were sent a survey (through an online link) which asked about their experiences in learning to drive (the types of roads they had driven on, amount of training and so on). They were then sent another survey, six months from their

6
test pass date, which asked about their first six months of driving (again road types, types of driving, and also any collisions or near-collisions). Some learners and ADIs, and also some supervising drivers (e.g. family members providing private practice) were interviewed or attended focus groups.
Some test passers were also sampled from non-trial test centres (so-called national comparison group learners) in an attempt to control for potential training bias of which the project team became aware during the project; feedback had suggested that some ADIs were training all their candidates according to the requirements of the revised test.
Findings
Views and opinions of the revised test
Views and opinions on the revised test were almost all positive from those ADIs, test passers, and supervising drivers interviewed. It was perceived as relevant to ‘real world driving’ and while interviewees accepted that it could not teach everything required to keep newly qualified drivers safe, it was perceived as providing a good basis for independent driving and decision making.
Impact of the revised test on learning to drive
When compared directly with drivers who took the existing test, those who took the revised test showed only very modest changes in terms of their learning experience. There were no differences in the amount of driving undertaken, or in the types of roads driven on. The only clear statistically significant difference was that test passers in the revised test group undertook more training with their ADIs while using a satnav, and slightly more private practice using a satnav.
When the two main trial groups were compared with those in the national comparison sample, some other differences were found. Specifically, those in both the trial groups undertook more training on country road and dual carriageways. If we assume that this is the result of some training bias bought about through the revised test ‘spilling over’ into the existing test group, then we might conclude that the revised test has the potential to alter the types of roads on which people learn to drive.
When compared with existing test passers, those who passed the revised test also showed some differences in their insight and confidence. Specifically, those in the revised test group felt they needed more improvement on a range of driving skills, but were more confident that they would be a safe driver. This finding can be interpreted as showing that the revised test seems to confer some insight in test passers as to their relative inexperience, potentially leading to some slight increase in confidence that they are going to drive well, and safely, post-test.
Finally, revised test passers were more confident that they could drive safely using a satnav post-test, but not that they could drive safely using mobile devices for any other reason.
Impact of the revised test on test performance
The revised test appears to have had no noticeable impact on test difficulty, whether measured by self-reported number of attempts before passing, or DL25 minor faults.

7
Impact of the revised test on post-test driving
There were no differences between the revised and existing test participants in attitudes, confidence and driving style at six months post-test. The only driving variable that remained at six months post-test between the groups was that revised test passers had undertaken slightly more driving while using a satnav. Thus their confidence at test pass seems to have translated into their behaviour.
Given the potential for training bias, the national comparison sample was included in all the analyses looking at post-test collisions (and near-collisions). This analysis showed that there were no differences between any of the groups on the proportion of test passers reporting at least one collision in their first six months of driving, or the number of collisions per 1,000 miles driven. There was a slight difference in reported near-collisions in the first six months of driving, with participants in both of the trial groups having slight fewer of these than participants in the national comparison sample.
Other findings of note
As with previous work of this type, when all test passers who reporting driving post-test were considered, having a lower age at test pass, and greater exposure to driving (driving more miles and driving more frequently), were both found to be associated with higher collision risk. Several other variables also had an impact on collision risk, namely:
Having access to a vehicle owned by parents, relatives or friends (during the post-testperiod), higher confidence, reported likelihood of avoiding risky driving situations, andtime spent with a driving instructor on country roads or driving independently whilelearning were all associated with lower collision risk post-test.
Time spent driving in busy town centres, frequency of driving for work, and being namedon a ‘telematics’ insurance policy were all associated with higher collision risk post-test.
Note that only single variables were included in the collision modelling, and therefore there is no way of knowing why some of these variables were associated with changes in collision risk. For example it is possible that those driving for work also drive more in town centres (where there are more opportunities for collisions to occur) and that this is what underlies the increased risk in both cases.
On the measure of collision involvement used (self-reported and predominantly damage only collisions) there was no statistically significant difference between male and female test passers. Finally, it is worth noting that the proportion of test passers reporting a collision of some kind within their first six months of driving has fallen considerably since the findings of the Cohort II study (Wells, Tong, Sexton, Grayson & Jones, 2008). Approximately one in five drivers reported a collision in the Cohort II dataset, while the corresponding proportion in this survey was around one in eleven.
Future research should focus on understanding the reasons for this apparent increase in safety, as well as on understanding the reasons for the other variables associated with collision risk in this dataset.

8
Summary of findings related to the revised test
The revised practical driving test shows promise. It is well received by test takers, ADIs and supervising drivers. Although there is no evidence of a direct change on collisions in the first six months of driving post-test, its positive effects on insight and confidence, and its potential impact on the types of training undertaken when learning to drive are encouraging.

9
1 Introduction
1.1 Background
The UK driving test is administered by the Driver and Vehicle Standards Agency (DVSA). Since its introduction in 1935 various adaptations have been made to the test. Relatively recent examples include the introduction of a separate theory test in 1996, a test of hazard perception skill as part of the theory test in 2002, and the introduction of the independent driving section in the practical driving test in 2010.
Newly qualified drivers (especially young newly qualified drivers) have a much higher collision1 risk than is the case for drivers with greater experience. Research has shown that youthfulness and inexperience are the two key risk factors for road accidents in this group (Wells, Tong, Sexton, Grayson & Jones, 2008; Maycock, 2002; Forsyth, Maycock & Sexton, 1995; Maycock, Lockwood & Lester, 1991).
Baughan and Vissers (2007) point out that the importance of driving experience as a protective factor against collisions presents an opportunity for driver testing; if testing can be undertaken in such a way as to increase and improve pre-licence on-road experience, it may improve safety for drivers when they begin driving unsupervised. Evidence from Sweden and Australia (Gregersen, Berg, Engström, Nolén, Nyberg & Rimmö, 2000; Scott-Parker, Watson, King, Hyde & Bates, 2012) has suggested that increasing the amount of pre-licence supervised practice undertaken by learner drivers can reduce collision risk in early driving. Research in Great Britain (GB) has suggested that the type of pre-licence experience can also have safety implications; Sexton and Grayson (2010) showed that drivers who had experience of driving in busy town centres and in the rain for at least two hours when learning were safer in post-test driving than those who lacked such experience.
A common perception held by learner drivers in GB is that one ‘learns how to drive properly’ after passing the test and gaining access to a full licence (Baughan & Vissers, 2007; Christmas, 2007). The recent introduction of ‘independent driving’ to the practical test (Helman, Vandrevala & Hutchins, 2010a,b) has attempted to counter this perception. It aims to increase the extent to which the training and testing learner drivers experience is similar to the ‘real’ driving that they will encounter after passing their test. Such a philosophy is to be encouraged; given the research findings of Gregersen et al. (2000), Scott-Parker et al. (2012), and especially Sexton and Grayson (2010). Subsequent changes to the test might be expected to have an influence on post-test safety if they lead to changes in the amounts or types of pre-test preparation undertaken by those learning to drive.
1.2 The ‘Transforming the Practical Driving Test’ project
The DVSA proposed additional changes to the practical driving test in late 2014. Building on the introduction of independent driving in 2010, these changes are intended to further increase the responsibility for decision-making that candidates have during the test, testing
1 There are strongly held views for and against the use of terms such as ‘accident’, ‘collision’ and ‘crash’. For
those interested in this debate we refer you to McKenna, (2007). For the present purpose we have chosen to
use all these terms interchangeably.
10
their skills under more realistic traffic and road conditions. In short, the revised test being proposed introduces three main changes:
1. A longer independent driving section (20 minutes, versus the current 10 minutes), withprovision for the use of a satellite navigation device (with pre-programmed waypoints)to support this.
2. Modification of the existing ‘turn in the road’ and ‘reverse around a corner’ manoeuvresby use of ‘parking bay’ and ‘side of road’ reversing manoeuvres.
3. ‘Show me’ questions answered while driving, rather than while stationary.
The intention is that these changes will make it easier for the test to encompass a wider range of busier and faster roads. This is because the modified manoeuvres can be done in a wider range of locations than the old ones, and the use of satellite navigation will enable greater route variability, as route sections for independent driving will not need to contain suitable road signs. Since the contents of the test are known to have an influence on the training people undertake to prepare for it, it is hoped that the changes will promote a wider pre-test learning experience, and that this will have an impact on safety outcomes.
The project reported here examined the impact of the proposed new driving test on the preparation learner drivers undertake for the test, and on their post-test driving. The project also sought to understand how learners, approved driving instructors (ADIs) and supervising drivers, such as parents, respond to the revised test in terms of their opinions, and in terms of learners’ test performance.
1.3 This summary report
This report summarises the activities that have taken place in the project, and the main findings. It is structured as follows:
Section 2 gives an overview of the study design.
Section 3 provides an overview of the participants used in the study (Approved DrivingInstructors (ADIs), supervising drivers, and learner/newly qualified drivers).
Section 4 reports the findings from the qualitative research, which explored the viewsand opinions people had towards the revised test.
Section 5 reports findings on the impact of the revised test on learning to drive.
Section 6 reports findings on the impact of the revised test on test performance.
Section 7 reports findings on the impact of the revised test on post-test driving,including collisions measured at six months post-test.
Section 8 presents a discussion of the findings, and makes recommendations for therevised test, and for future work related to driver testing, on the basis of the results.
The focus of the report is to provide the main findings in an accessible format. Another report delivered as part of the project (Wallbank, Chowdhury, Hammond, Durrell, Kinnear, Buttress & Helman, 2017) serves as a main technical report, and includes detailed information on the measures used, the analysis undertaken, and the detailed findings for all outcome measures.

11
2 Overview of the study method and design
2.1 Objectives of study
The first objective of the study was to assess the impact of the revised practical driving test on three broad outcomes:
1. Drivers’ experience learning to drive – for example the kinds of roads and situationson which they train, how much training they undertake with their ADIs, and anydriving they undertake while supervised by friends and family.
2. Drivers’ performance on the test.
3. Drivers’ safety in terms of attitudes towards various safety-relevant behaviours andtheir driving style (at test pass and at six months post-test), and their crashinvolvement in their first six months of post-test driving.
The second objective was to gain information on the views and opinions of ADIs, supervising drivers and learners regarding the revised practical test.
2.2 Design and procedure
An experimental study design was used (Figure 1).
Figure 1. Study design
ADIs from 32 driving test centres registered for the trial using an online registration survey and then invited their learners into the study. Only learners who were ‘first-time takers’ with no or very little previous training were invited; this was to minimise the influence of

12
previous training or test taking. Those learners who registered (again using an online registration survey) were then pseudo-randomised2 to take either the existing test (control group) or the revised test (treatment group). ADIs were informed the test type to which each of their learners in the trial was assigned, and were asked to instruct them accordingly. No attempt was made to match the learners in the trial to the national population of learners.
A total of 4,699 people registered to take part in the survey. When drivers who were registered for the study passed their test (3,181 in the lifetime of the project) they were invited to complete another online survey (the ‘learning to drive survey’). 2,315 of learners who passed their test completed this survey. A further survey link was sent six months after the test pass date (the ‘novice driver survey’); 2,066 people completed this survey. These attrition rates are very low, and are believed to be due to the incentive structure used. The survey measures (along with test performance data provided by DVSA) were then used to compare the two groups (see Sections 5, 6 and 7). In addition, a number of ADIs and supervising drivers, and drivers who passed the revised test were invited to take part in focus groups and interviews (see Section 4).
At later stages in the project, concern arose regarding potential sources of bias in the design. Specifically, a small number of ADIs suggested in communications with TRL that they had been instructing some of their control group learners according to the requirements for the revised test. If true of the wider trial sample, this spill-over of the treatment into the control group would mean that any impact of the new test was underestimated (because control group participants would also be experiencing any impact). To help account for this potential training bias, drivers were also surveyed from two ‘national comparison group’ cohorts from test centres that were not included in the trial of the revised test. These respondents were sourced through an email sent by DVSA to:
All GB test passers (except those at trial test centres) from July 2016
All GB test passers (except those at trial test centres) from January 2016
The first of these two groups was surveyed with the learning to drive survey in August 2016, and those who completed this were sent a link to the novice driver survey in January 2017. The main purpose of the data from this group was to check the baseline level of the outcome measures (especially collision involvement in the first six months of driving).
The second group was sent the link to the novice driver survey in January 2017, and were asked to answer it (retrospectively) about their first six months of driving (January-June 2016). The main purpose of data from this group was to provide a second set of baseline data from people who undertook their first six months of driving in the winter/spring to help with checking for seasonality effects, especially on collision involvement.
Drivers in the ‘revised test’ and ‘existing test’ trial groups were all entered into a prize draw as an incentive, and were given £10 for completing the learning to drive survey, and £30 for
2 The first learner recruited by each ADI was randomised according to a random function in Microsoft Excel,
and subsequent learners from the same ADI were alternated between test types. This was done to try to
balance the test type variable for each individual ADI.

13
completing the novice driver survey. Those completing the novice driver survey in the first national comparison group were given £10.
The national comparison group data are referred to in Sections 5, 6 and 7 where relevant.
2.3 The proposed new practical driving test
The existing practical driving test is described at this link (https://www.gov.uk/driving-test/what-happens-during-test). The revised test was designed for the trial by DVSA, in consultation with several road safety experts, and since it was compliant with Driving Licence Directive 2006/126/EU3 those learner drivers allocated to take the revised test were able to do so and still acquire their driving licence (assuming they passed). This was done to ensure that there were no differences in motivation levels between the learners in the two groups; since everyone who was taking a test was doing so in order to acquire their driving licence, any differences (particularly in performance on the test) could be attributed to test difficulty, rather than to motivational differences. Table 1 shows the differences between the revised and existing tests.
Table 1. Revised and existing practical driving tests
Existing test Revised test
‘Show me’ and ‘tell me’ question at the beginning of the test
‘Tell me’ question at the beginning of the test and a ‘show me’ question while driving
10 minutes independent driving using traffic signs or verbal directions
20 minutes independent driving using a satnav or traffic signs
One of the following manoeuvres: turn in the road; reverse around a corner; reverse parking (either into a parking bay, or parallel parking at the side of the road)
One of the following manoeuvres: drive in to and reverse out of a parking bay; pull up on the right, reverse, and re-join the traffic; reverse parking (either into a parking bay, or parallel parking at the side of the road)
2.4 Survey measures
In the sections below, the measures collected from ADIs and drivers are listed.
2.4.1 ADIs
The following details of ADIs were recorded at registration:
Age and gender
Contact details
Number of suitable learners ‘on their books’ (used for planning number of ADIs needed for recruitment purposes)
Test centre(s) used
3 http://eur-lex.europa.eu/legal-content/EN/TXT/?uri=uriserv%3Al24141

14
Number of years of experience and ADI level
Full-/Part-time status
2.4.2 Drivers
The following details of learner/novice drivers were recorded across the three online surveys undertaken (‘registration’, ‘learning to drive’ at test pass, and ‘novice driver’ at six months post-test). Some of these items are taken from (or minimally adapted from) the surveys used in the Cohort II study reported in Wells et al. (2008).
Driver number and name (for data matching)
Contact details
Age and Gender
A scale measuring sensation-seeking (Arnett, 1994)
Self-reported driving exposure during learning to drive, and during the first sixmonths of post-test driving, including frequency of driving, mileage driven, roadtypes, times of day and weather conditions, and whether or not any satellitenavigation devices were used (‘learning to drive’ and ‘novice driver’ surveys)
Scales regarding driving attitudes and driving style and measures of driverconfidence (‘learning to drive’ and ‘novice driver’ surveys)
Self-reported collisions and ‘near-accidents’ in the first six months of post-testdriving (‘novice driver’ survey only)
2.5 Qualitative data
The interviews and focus groups were facilitated using three separate topic guides tailored to ask the most appropriate questions for each participant group. The semi-structured approach allowed some consistency, but also allowed the interviewer to pursue relevant topics and themes that emerged throughout the discussions. The three topic guides can be found in the final technical report that is published as part of the project (Wallbank et al., 2016).
The focus group and interview data were analysed using thematic content analysis (Braun & Clarke, 2013). This approach involved identifying themes and patterns that emerged from the transcripts.
2.6 Test performance data
Data from DL25 forms for test passers were sourced from DVSA. In addition, self-reported data on the number of test attempts required to pass the test were collected in the learning to drive survey. Both of these data sources were used to compare the test types.
2.7 Statistical testing
In all cases where statistical tests were used to compare data in the trial, we adopted the convention from the behavioural sciences of reporting p-values, and referring to any p-values below 0.05 as ‘statistically significant’. This means that we only accept results as

15
statistically significant if they have a 5% chance or less of occurring purely due to random variability in the data. Tests used are reported here for completeness, although greater detail is found in Wallbank et al. (2017).

16
3 Characteristics of the samples
3.1 ADIs
3.1.1 Age and gender
A total of 859 ADIs registered to take part in the study between February 2015 and January 2016. Three-quarters of these ADIs (646) were male, which matches national data on ADIs from DVSA (Table DRT07214). The majority of ADIs were aged between 41 and 60 years.
3.1.2 Test centres used
Table 2 shows the number of ADIs who indicated that they used each of the listed test centres. Note that some ADIs indicated more than one test centre hence the total number of ADIs in the table is greater than the number of registered ADIs.
Table 2. Number of registered ADIs using each test centre
Test Centre No. of
ADIs
Test Centre No. of
ADIs
Test Centre No. of
ADIs
Basildon 16 Farnborough 44 Oxford (Cowley) 18
Bedford 24 Folkestone 13 Plymouth 20
Birmingham (Kings Heath) 36 Glasgow (Springburn Park) 12 Sheffield (Handsworth) 29
Blackpool 23 Goodmayes 39 Southampton Maybush 42
Bournemouth 55 Herne Bay 29 St Helens (Liverpool) 26
Bristol Southmead 41 Ipswich 23 Sunderland 14
Burgess Hill 42 Lincoln 21 Swansea 13
Cardiff 36 Lower Gornal 38 West Didsbury 16
Cheetham Hill (Manchester) 28 Mitcham (London) 27 Weston-super-Mare 25
Edinburgh (Musselburgh) 20 Northampton 38 York 27
Enfield (London) 18 Norwich 30
3.1.3 Number of years of experience, grade, and full/part time status
ADIs with a wide range of experience registered to take part in the trial. The majority had between one and 15 years’ experience. Some had been an ADI for less than one year, and some for longer than 25 years. The majority of ADIs who provided this information were full time driving instructors (716) and were either grade 4 (298) or grade 5 (281). Fifty-one (6%) had obtained a grade 6 qualification.5
4 Available from https://www.gov.uk/government/statistical-data-sets/drt07-approved-driving-instructor-test-
pass-rates
5 These grades correspond to ‘satisfactory’, ‘good’ and ‘very high’ levels of performance under the ‘ADI check
test’ approach which was being gradually replaced by the new ‘ADI standards check’ system as the trial began.

17
3.1.4 Summary of ADI sample
Although there is no expectation that trial ADIs would be entirely representative of the national population of ADIs the sample comprised ADIs with a wide range of age, experience and ability levels, and included those working full and part-time. The proportion of males and female approximately matched national data from DVSA.
3.2 Drivers (main trial sample)
3.2.1 Gender
Table 3 shows the number of drivers by test type and gender, based on the sample that completed the learning to drive survey. Table 4 shows the same information for the novice driver survey. A Chi-squared test showed that there was no statistically significant difference in the proportion of male and female drivers between the test types, for either survey (p = 0.52 and 0.25 for ‘learning to drive’ and ‘novice driver’ surveys respectively). Comparison with data provided by DVSA on the practical test pass rates by age and gender (Table DRT02036) suggests that the trial sample slightly over-represents females.
Table 3. Number of learners by test type and gender – learning to drive survey respondents
Test Type
Existing Revised Total
Gender
Female 612 (55%) 678 (56%) 1,290 (55%)
Male 500 (45%) 525 (44%) 1,025 (45%)
Total 1,112 (100%) 1,203 (100%) 2,315 (100%)
Table 4. Number of learners by test type and gender – novice driver survey respondents
Test Type
Existing Revised Total
Gender
Female 532 (54%) 610 (56%) 1,142 (55%)
Male 454 (46%) 470 (44%) 924 (45%)
Total 986 (100%) 1,080 (100%) 2,066 (100%)
3.2.2 Age
Table 5 shows the mean age and age range of drivers at the time that they passed their test. A Mann-Whitney test confirmed there was no statistically significant difference in the distribution of ages between groups (p = 0.17). As was the case with gender, a comparison
6 Available from https://www.gov.uk/government/statistical-data-sets/drt02-practical-car-test-pass-rates

18
with national passer data from DVSA showed that the trial sample was not representative; the trial sample was biased towards sampling in the 17-19 year age range (60% of the trial sample, versus only 45% of all test passers). This was probably a result of the requirement that those in the trial groups were first-time takers of the test.
Table 5. Mean age and age range of drivers by test type7
Test Type
Existing Revised
Age (years)
Mean (SD)1 21.9 (6.5) 21.6 (6.0)
Minimum 17.0 17.1
Maximum 61.0 54.2
1 SD=Standard Deviation
3.2.3 Access to a vehicle
As can be seen in Table 6, roughly half of each test group reported owning their own vehicle (this question was asked in the novice driver survey). The corresponding figure for vehicle ownership in the national comparison group was around 63%, which is much higher than the main trial groups. There is no known national data on vehicle ownership, although National Travel Survey data for the period 2011-2015 show that the percentage of people who report being the ‘main driver’ in households with a car for the age group 17-34 is 43%. If we assume that this is a reasonable proxy (probably an overestimate) for vehicle ownership, this means that our trial sample may contain a slightly higher rate of vehicle ownership than the national average.
In addition, just over a quarter of each group reported having access to a vehicle owned by someone else. Around one-fifth of participants reported having no regular access to a vehicle. No statistically significant differences were apparent between the groups on any of these measures.
Table 6. Proportion of each test group that have access to a vehicle
Vehicle access Existing
test (N=1112)
Revised test
(N=1203)
I own my own vehicle 49.4% 50.9%
I can drive a vehicle owned by parents/ relative/ friends 26.3% 25.4%
I can drive a work vehicle 1.1% 0.5%
I have no regular access to a vehicle 18.9% 19.3%
Other (including those who plan to buy a vehicle in the near future) 4.3% 3.9%
Total 100% 100%
7 In each section, tables and figures report findings from the entire relevant sample unless noted.

19
3.2.4 Sensation-seeking
Sensation-seeking is a personality trait that has been previously related to crash involvement, and should not be amenable to change through training. A sub-set of questions from an established sensation-seeking scale (Arnett, 1994) was included in the learning to drive survey. Statistical analyses of these items confirmed that there was no statistically significant difference between the two test groups on the sensation-seeking measure.
3.2.5 Summary of main trial driver sample
In short, the two groups in the main trial do not differ in age and gender distributions, or in terms of sensation-seeking. This suggests that the pseudo-randomisation used to allocate people to groups was successful in ensuring that the groups are comparable on existing measures that might impact on the outcome measures being used in the study. Thus we can have some confidence that any group differences found in the study are as a result of the test type received (or other variables such as exposure) rather than any pre-existing differences related to variables such as age, gender and personality.
3.3 Drivers (national comparison group samples)
As noted in Section 2.2 there were two additional groups of participants surveyed, in order to test for potential training bias effects in the main trial sample. National comparison group 1 all passed their test in July 2016 and were sent both the learning to drive survey when they passed their test and the novice driver survey six months later. The group comprised 1,202 people who completed the learning to drive survey, 593 of whom also completed the novice driver survey.
National comparison group 2 all passed their test in January 2016. Participants in this group (N = 1,521) completed the novice driver survey one year after passing their test, but based on their experiences in the six months of driving immediately after their test.
Wallbank et al. (2017) describe the process that was used to match the national comparison group participants to the main trial groups in terms of age and gender mix. It should be noted that this matching, because it was only able to use age and gender (and exposure to driving), was not as robust as it could have been. Therefore the comparisons between the national comparison group participants and the main trial samples should be interpreted with some caution.
3.4 Samples for focus groups and interviews
Face to face focus groups were conducted with newly qualified drivers and ADIs, near the beginning of the project, at the Farnborough and Northampton test centres. Drivers were drawn from the main trial sample (revised test group only).
Two focus groups were undertaken with 12 revised test passers8 in total. The sample had between 20 and 50 hours of instruction with ADIs before passing the test, and took between
8 A decision was made to talk only to test passers of the new test. This means our results cannot be used to
draw formal comparisons between test types, or to assess the views of those who only failed the new test.

20
one and six months to pass. Thus the sample is not representative of the wider sample in terms of time to pass the test, although it is in terms of amount of instruction.
Thirteen ADIs who had trained their learners for the trial test took part in focus groups. They were typically Grade 5 with two to ten years’ experience. ADIs reported instructing up to 25 different learners each week, and had taught between two and 20 learners who had gone on to take the revised test.
Eighteen telephone interviews with supervising drivers were also conducted. Supervising drivers were recruited via test passers who had reported having over 10 hours of private practice. Most were parents, but grandparents and partners were also interviewed.

21
4 Findings – views and opinions of the revised test
This section reports the findings from interviews and focus groups with ADIs, test passers, and supervising drivers. The main themes extracted from the data are summarised, each in its own section. Illustrative quotes are given (in italics) where relevant.
4.1 Making the test relevant to today’s driving
All three groups described the changes to the test as making it more ‘relevant’, ‘current’ and better preparing novice drivers for post-test driving, with the satnav component being seen as particularly positive introduction:
“It sounds as if they’re trying to make it relevant to how the roads are today. It sounds as if they are trying to update some of the manoeuvres and techniques to make it more relevant and safe for today, which is a good thing.” Supervising driver
“I think the other test is a bit outdated, the new one would be a more relevant way for people to learn…it’s just a bit more streetwise really.” Revised test passer
“I certainly think the satnav is the biggest thing of all that’s going to make an improvement to people’s driving...” ADI, Northampton
The potential for distraction caused by the satnav was seen as positive factor by ADIs – one ADI reported that his pupils’ driving standards tended to initially drop when the satnav was introduced into their training sessions.
“The satnav’s been brilliant and you really notice a difference with the pupils when they start doing it, because you’re thinking, they’re coming on nicely, then suddenly you’re putting that distraction in, which is what it’s all about, and you see their standard drop a little bit, because they’re not seeing everything.” ADI, Northampton
Others pointed out that the satnav should be seen as a support for the skill of independent driving, and not as a skill in itself (especially to avoid over-reliance post-test).
“To me it’s an aid, not a replacement for the independent driving. To me, you’ve got to look at those signs, because that’s why we introduced independent driving, so they’d look at the signs… the signs are really important. So, to me, satnav’s good, but it’s not the be all and end all.” ADI, Northampton
4.2 The revised test gives learners a firm basis in independent driving
In this small sample, ADIs were unanimous in their view that the revised test better equipped their learners for post-test, independent driving. Some felt so strongly about this that they reported feeling a moral obligation to train all of their pupils in the same way (i.e. teaching control pupils the elements of the revised test). Some ADIs acknowledged that by adopting this approach to training their learners, they may ‘skew’ the results of the trial. The treatment of this training bias is covered in the analysis of the quantitative data in Sections 5, 6 and 7 where relevant.

22
“I prepare mine for both the current test and the revised test anyway; just chuck all the manoeuvres in. It makes them a better driver at the end of the day.” ADI, Farnborough
There was consensus that the revised test elements should be rolled out to all learner drivers, but there was also the perception that the changes to the test may not have a substantial impact on killed or seriously injured statistics.
In one of the test passer groups, one participant suggested that she had felt that her preparation for the test was done in such a way that she was being taught how to drive, not how to pass the test. This view was supported by others in the group who suggested that they felt that their ADIs were teaching them how to be safe and responsible.
“There’s learning to drive and there’s learning to pass your test. I think they’re two different things, personally. I had three driving instructors. The first two were by the book, “This is what you do to pass your test.” Whereas, the one I [had for the trial] was more like, “this is how you drive safely.” So I think he taught me more how to drive safely than to pass the test.” Test passer, Northampton
4.3 Private practice is seen as generally positive
Supervising drivers reported that they felt that the private practice with their learners was helpful in giving them additional on-road experience to that gained through lessons and related increased experience to increased confidence.
“There were many advantages [of private practice] for [learner], in that, when the time came that she took her test, she was confident on the roads; she’d met a lot of hazards or potential hazards… So, I think for [learners] to have had hours and hours of practice, I think was very invaluable, and a major advantage.” Supervising Driver
The views on private practice from ADIs and test passers were more balanced. Most ADis agreed it was a good thing, but that it was important that it was ‘done correctly’. Test passers felt the same, not wanting to ‘pick up bad habits’.
“The more miles they get under their belt before they pass their test, the more confident or competent they’re going to be… We work on 1000 miles, that’s what you want to achieve before you get out there on your own, at least. So we reckon we do about 500 miles in our program roughly. We want your parents to go out and do 500 as well please.” ADI, Farnborough
“I think it might have been useful to have more time on the road, because I think sometimes it is just getting used to it and building up confidence by just driving and probably you’d save money as well, but I preferred being with a driving instructor, just because everything is structured and I’d rather I learnt everything properly.” Test passer, Northampton
4.4 The revised test is viewed as easier than the current test
Test passers felt that the revised test was easier than the existing test (note that the test performance data do not support this perception – see Section 6). Specifically, test passers suggested that the manoeuvres in the revised test were easier than those in the current test.

23
They specifically referenced the existing test ‘reverse around a corner’ manoeuvre as being the manoeuvre that elicited most concern among friends of theirs who took that test. The inclusion of the satnav appears to reduce some of the anxiety that test participants felt when interacting with examiner during the test. Some learners suggested that examiners were quite intimidating and receiving instructions via the satnav (rather than the examiner) helped them to relax.
4.5 The preparation for the revised test doesn’t teach new drivers all they need to know
While the changes to the revised test were seen as being positive by all three participant groups, respondents acknowledged that it was not possible for even the revised test to prepare them for every eventuality associated with independent, post-test driving. Supervising drivers tended to share the view that learning to drive is an ongoing process which develops through experience and time.
“You don’t really learn to drive, until actually after you’ve passed your test, and doing it when you’re out on your own. What you can do in X amount of hours learning, it’s fine, it might get you through a test, even with this new one, but you can’t beat…where you’re driving by yourself, that’s when you really start – well, certainly in my experience, you learn.” Supervising Driver
For those who passed the revised test, there were a number of manoeuvres and driving experiences that they had been exposed to in their post-test driving that they felt under-prepared for. While they acknowledged that it would not be possible for all of these components to be incorporated into the testing process, they did feel that several following additions may be beneficial to the training process. These included being taught how to use multi-story car parks, how to change a tyre, how to re-fuel the vehicle, what to do if the vehicle breaks down, and what to do if the vehicle is involved in an accident.
4.6 Views and opinions of the new test – summary of findings
In general, the revised test was well-received by ADIs, learner drivers, and supervising drivers. While respondents accepted that it could not teach everything required to keep newly qualified drivers safe, it was perceived as being relevant to ‘real driving’ and as providing a good basis in independent driving and decision making. There were some differences in perception between the three main respondent groups regarding the role of private practice; it was generally perceived positively, but some respondents noted the importance of it being undertaken ‘properly’ and without ‘teaching bad habits’.
24
5 Findings – learning to drive
This section reports the findings concerned with test passers’ experiences when learning to drive, such as time spent learning and the conditions under which learning and practice were undertaken, as well as their self-reported attitudes, confidence and driving style at the point of passing their test.
5.1 Time spent learning
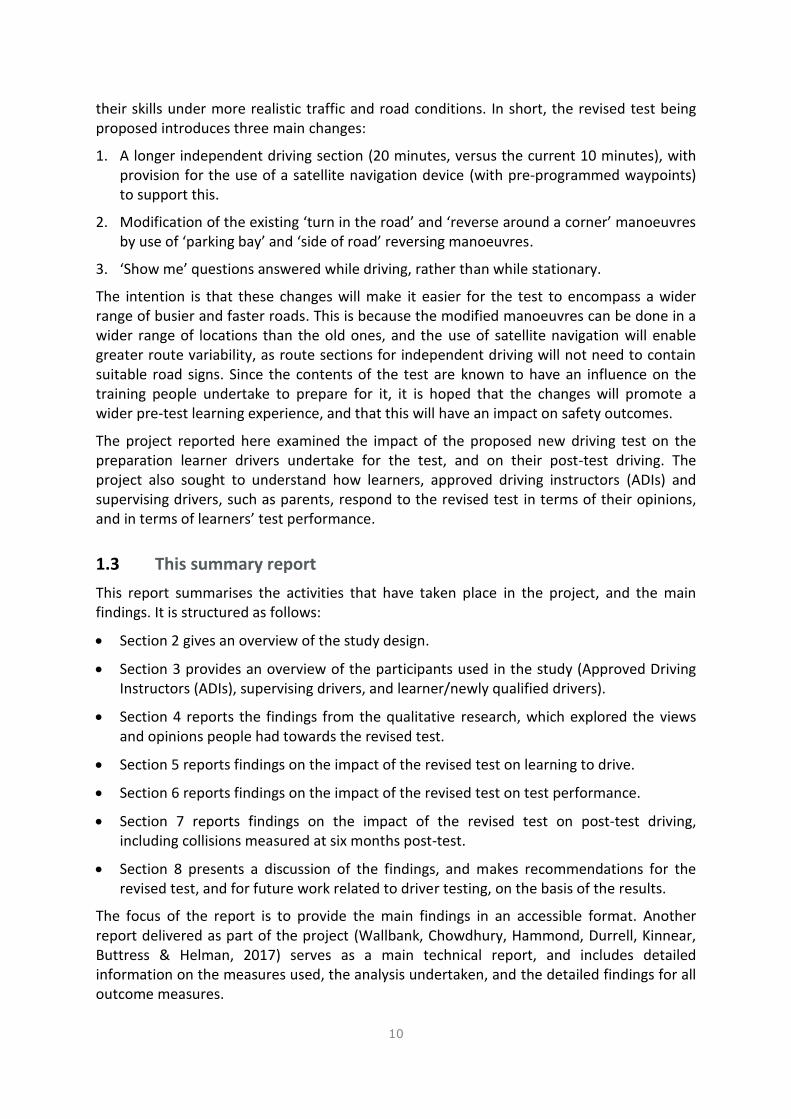
Table 7 shows the median time (months) spent learning to drive, and the mean hours spent with an ADI while learning, and with a supervising driver. Mann-Whitney U tests showed that the two groups did not differ significantly on any of these measures (p = 0.2, 0.59, 0.82 respectively).
Table 7. Time spent learning, hours with an instructor and with a supervising driver, by test type
Test Type
Existing Revised
Months spent learning Median 7.4 7.0
Hours spent learning with an ADI Mean (SD)1 39.2 (27.9) 40.1 (38.6)
Hours spent learning with supervising driver Mean (SD) 19.6 (33.7) 18.8 (30.4)
1 SD=Standard Deviation
5.2 Conditions under which learning took place
5.2.1 Main trial groups
Test passers were asked about the amount of time they spent learning with their ADI, and with any other supervising drivers, under the specific conditions shown in Table 8.
Table 8. Road types, environmental conditions, and tasks during learning
Road types Environmental conditions Tasks
Busy town centres Country roads Busy roads outside of town centres Fast dual carriageways Other quiet areas (e.g. industrial estates) Quiet residential areas
On snow or ice In the rain In the dark
Following instructions from a satnav Driving independently (i.e. without continuous direction or instruction) Following road signs
Analysis showed that there were no statistically significant differences between the trial groups on any of these measures, with the exception of following instructions on a satnav

25
and driving independently. Figure 2 and Figure 3 show the data for time spent following a satnav by test type. Chi-squared tests showed that there was a statistically significant association between test type and time spent following a satnav while learning, with ADIs or with supervising drivers (p < 0.001 in both cases). Revised test passers were more likely to have spent some time learning with a satnav, especially when training with their ADI.
Figure 2. Amount of time following a satnav with an ADI – proportion of sample by test type
Figure 3. Amount of time following a satnav with supervising driver – proportion of sample by test type

26
Figure 4 and Figure 5 show the time spent engaged in independent driving by test type. Chi-squared tests showed that there was a statistically significant association between test type and this measure (p < 0.01 and p = 0.009 for learning with ADIs and supervising drivers respectively). For learning with ADIs, the revised test group were more likely than their existing test counterparts to spend more than eight hours engaged in independent driving, or none at all. With supervising drivers, the revised test group learners were more likely than those in the existing test group to spend 4-8 hours, and less likely to spend none.
Figure 4. Amount of time driving independently with an ADI – proportion of sample by test type
Figure 5. Amount of time driving independently with a supervising driver – proportion of sample by test type

27
5.2.2 National comparison group
One concern in the study was that learners in the main trial control group (those taking the existing test) might have experienced some training bias, whereby their ADI taught them using methods appropriate for the revised test even though they were later going to go on and take the existing test. When the age matched national comparison group sample were compared with the main trial groups, there was some evidence that this was the case, for two specific areas.
First, as shown in Table 9, the national comparison group learners spent more time learning with an ADI. This was most likely because there was no requirement for those in the national comparison group to be first time takers of the test.
Table 9. Mean number of hours spent learning with ADI, including national comparison group data
National
comparison
group learners
Trial group
Existing test Revised test
Time with
ADI (hours) Mean (SD) 48.0 (58.6) 39.2 (27.9) 40.1 (38.6)
Second, when compared with the main trial groups a higher proportion of test passers in the national comparison group reported spending more than eight hours driving in residential and quiet areas, and driving whilst following road signs; additionally, a higher proportion of test passers in the national comparison group reported never driving on country roads or dual carriageways, or while following a satnav.
These data show that to some extent the learning experience of both trial groups was different to what learners had if they were learning at test centres and with ADIs outside of the trial. If we assume that this is the result of some training bias bought about through the revised test ‘spilling over’ into the existing test group, then we might conclude that the revised test has the potential to alter the learning to drive process to a greater extent than just those findings reported in Section 5.2.1 above. As noted above, the fact that the trial groups comprised first-time takers (while the national comparison group participants were not required to be) also needs to be taken into consideration.
For these reasons, the national comparison group data are included in the main analysis of the six month collision data, and specifically in the collision modelling reported in Sections 7.3 and 7.5.
5.3 Attitudes, confidence, and driving style
5.3.1 Improvement needed in specific skills
Test passers were asked how much improvement they felt they needed across a range of driving skills. Table 10 shows these data.

28
Table 10. Driving skills*
Manoeuvres/vehicle skills Traffic-related skills Road-related or context-related skills
Reversing
Parking
Use of car controls
Overtaking
Judging the speed of other traffic
Anticipating what other drivers are going to do
Driving in heavy traffic
Spotting hazards
Joining with moving traffic on a motorway or a fast dual carriageway
Driving in the dark
Using roundabouts
Pulling out of junctions
Finding your way by following directions on road signs
Finding you way by following directions from a satnav
Driving on your own
Driving on country roads
Driving on high-speed roads
* this taxonomy is subjective and is used purely for ease of presentation – some skills might be considered asfalling in multiple categories (for example overtaking and pulling out of junctions both require an appraisal of traffic)
To aid interpretation, the survey responses to these questions were subjected to a statistical technique called factor analysis. The method looks for items that are highly correlated and assumes that they are measuring the same underlying construct. It then combines highly correlated items to form factors which can then be analysed as single variables.
When this analysis was undertaken, all questionnaire items loaded positively onto a single factor. This factor was interpreted as ‘level of improvement needed’, and the data suggest that the level of improvement people think they need in one area tends to match that in other areas.
A Mann-Whitney U test was used to investigate differences between the revised and existing test groups on the measure. A statistically significant difference was identified between the two groups (p = 0.04) with the drivers who took the existing test tending to think they need less improvement in these skills than the drivers who took the revised test.
5.3.2 Confidence in driving ability
Test passers were asked to rate how confident they were that they would be a skilful driver, would be a good driver, would be a safe driver, would not be involved in an accident in their first 12 months of driving, are a good driver now, are able to safely drive using a satnav, and are able to drive safely using a mobile phone for anything other than satnav functions.
A factor analysis suggested that all items except ‘able to drive safely using a mobile phone…’ loaded onto a general confidence factor. A Mann-Whitney U test showed that the groups differed significantly on the general confidence factor (p = 0.002), with the revised test passers being slightly more confident overall. There was no significant difference in confidence at being able to drive safely using a mobile phone for anything other than satnav functions, suggesting that the satnav training had not resulted in an undesirable increase in confidence in using mobile devices more generally when driving.

29
5.3.3 Driving style
Driving style was measured using the ‘Guppy scales’, which comprise 12 bipolar scales on which participants are asked to rate themselves. For example a participant might place a mark on the following continuum which has the anchors ‘attentive’ and ‘inattentive’ at the ends:
How attentive or inattentive are you as a driver?
Attentive Inattentive
A tick near the left of the scale would indicate that someone considered their driving style to be ‘attentive’ while a tick near the right would indicate that someone considered their driving style to be ‘inattentive’. These scales have been used in a number of previous TRL studies of drivers, most recently Wells et al. (2008). The 12 scales (using the 12 anchor pairs in the table below in 12 separate scales like the one above) typically reduce to three factors characterising particular driving styles. For example a driving style that is rated as ‘attentive’ also tends to be rated as ‘careful’, ‘responsible’ and ‘safe’, so these scales group together under one factor. The data were suitable for factor analysis and a three factor solution was identified. These factors match those identified in previous research.
Factor 1 Factor 2 Factor 3
attentive/inattentive
careful/careless
responsible/irresponsible
safe/risky
placid/irritable
patient/impatient
considerate/selfish
tolerant/intolerant
decisive/indecisive
experience/inexperienced
confident/nervous
fast/slow
Mann-Whitney U tests were used to investigate the differences between the existing and revised test groups for each factor. There were no statistically significant differences between the two test groups for any of the three factors.
5.3.4 Attitudes to risky driving
Drivers were asked to rate their agreement with a series of questions relating to their attitudes to speed limits, speeding, reckless driving, antisocial driving and penalties for driving. Analysis indicated that there were no statistically significant differences between the two test groups on these measures.
5.4 Learning to drive – summary of findings
Test passers in the two groups are largely comparable in terms of their preparation for their respective test. The only statistically significant impact of the revised test on preparation appears to be the increased likelihood of using a satnav when learning, either with an ADI (an especially large effect) or with another supervising driver. There was also a suggestion that the revised group differed in terms of learning while driving ‘independently’, although
30
the pattern of data was not completely consistent for this variable. Importantly, when the national comparison group data were included in the analysis to check for any training bias, there was evidence that the main trial groups had experienced a slightly different learning to drive process. Specifically, when compared with the main trial groups the national comparison group participants had a greater amount of hours with their ADI (possibly due to there being no need for them to be first-time takers – see also Section 6.1) and were more likely to drive on residential and quiet areas, and following road signs; they were also more likely to never learn on country roads and dual carriageways, or when following a satnav.
In terms of self-awareness, the revised test group thought they needed slightly greater improvement in a range of driving skills than those passing the existing test. They were however more confident than their existing test counterparts in their driving ability. The only way in which this was not true was that the groups did not differ in their level of confidence that they would be able to safely use a mobile phone while driving for things other than satnav functionality, indicating that any increase in confidence brought about by taking the satnav test did not confer undesirable increases in confidence related to other uses of mobile devices. No group differences were evident in self-rated driving style or attitudes to risk taking.
In short the revised test (relative to the existing test) seems to have had only a modest impact on the learning to drive process, but does at least seem to confer some insight in test passers as to their relative inexperience, potentially leading to some slight increase in confidence that they are going to drive well, and safely, post-test. The training bias evident from the national comparison group analysis suggests that both main trial groups may have had a slightly different learning experience to what is the norm outside of the trial, making it important that national comparison group participants are included in the collision modelling.
31
6 Findings – test performance
6.1 Self-report data on number of attempts
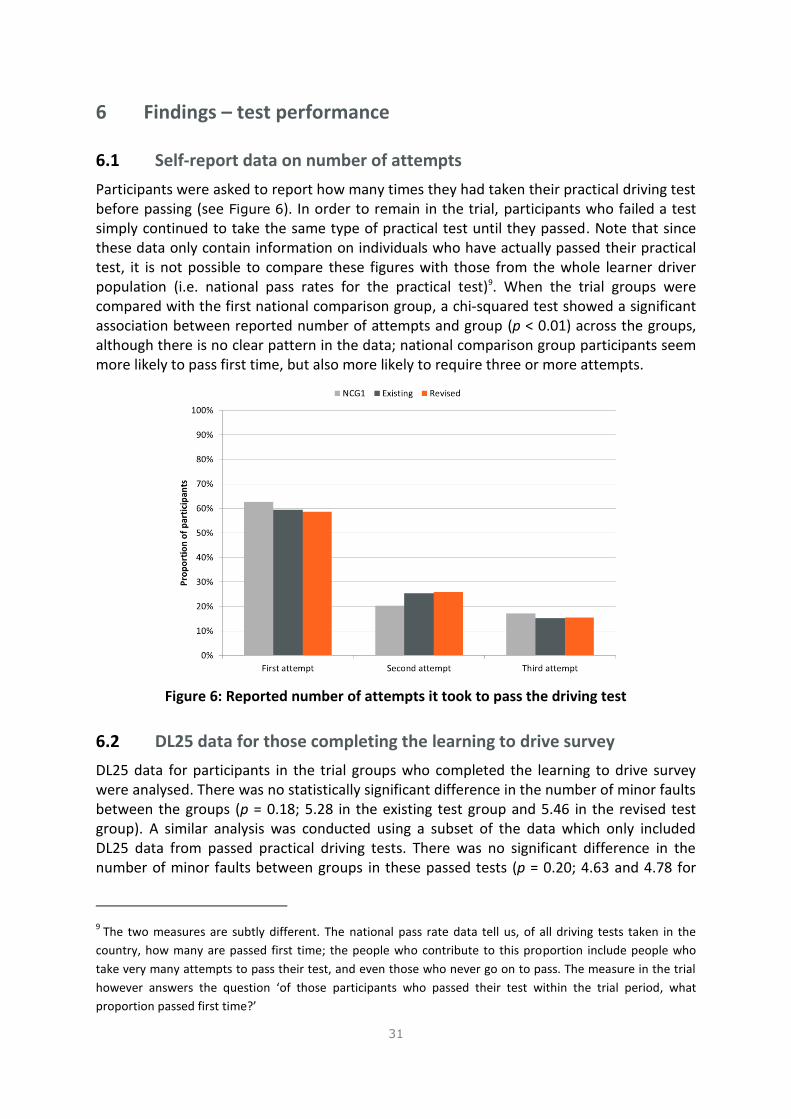
Participants were asked to report how many times they had taken their practical driving test before passing (see Figure 6). In order to remain in the trial, participants who failed a test simply continued to take the same type of practical test until they passed. Note that since these data only contain information on individuals who have actually passed their practical test, it is not possible to compare these figures with those from the whole learner driver population (i.e. national pass rates for the practical test)9. When the trial groups were compared with the first national comparison group, a chi-squared test showed a significant association between reported number of attempts and group (p < 0.01) across the groups, although there is no clear pattern in the data; national comparison group participants seem more likely to pass first time, but also more likely to require three or more attempts.
Figure 6: Reported number of attempts it took to pass the driving test
6.2 DL25 data for those completing the learning to drive survey
DL25 data for participants in the trial groups who completed the learning to drive survey were analysed. There was no statistically significant difference in the number of minor faults between the groups (p = 0.18; 5.28 in the existing test group and 5.46 in the revised test group). A similar analysis was conducted using a subset of the data which only included DL25 data from passed practical driving tests. There was no significant difference in the number of minor faults between groups in these passed tests (p = 0.20; 4.63 and 4.78 for
9 The two measures are subtly different. The national pass rate data tell us, of all driving tests taken in the
country, how many are passed first time; the people who contribute to this proportion include people who
take very many attempts to pass their test, and even those who never go on to pass. The measure in the trial
however answers the question ‘of those participants who passed their test within the trial period, what
proportion passed first time?’

32
the existing and revised tests respectively). The distribution of major faults between the groups was also the same (p = 0.59).
6.3 Summary of test performance findings
The revised test appears to have had no noticeable impact on test difficulty, whether measured by self-reported number of attempts before passing, or DL25 faults.

33
7 Findings – post-test driving
This section reports the findings concerned with test passers’ experiences (amount and types of driving, collisions and near misses) as well as their self-reported attitudes, confidence and driving style, after their first six months of post-test driving.
7.1 Driving experience
Figure 7 shows the frequency of driving since test pass, by test type. Chi-squared tests showed that there was no significant difference between the test groups on this variable (p = 0.47).
Figure 7. Frequency of driving since test pass by test type
The mean (and SD) miles driven since the test was 2,773 (2,871) and 2,699 (2,817) for the existing and revised test groups respectively. The medians were 2,050 and 2,000. A Mann-Whitney test showed that the groups did not differ significantly on this measure. The same was also true of the number of times they had driven over 100 miles in a single day, and the types of road and weather conditions in which people drove. In short, the types and amounts of driving in the first six months post-test did not differ between the two test groups.
The one variable related to post-test driving exposure that did differ between the groups was the frequency of driving while using a satnav. Figure 8 shows these data. A Chi-squared test showed that there was a significant association between test type and frequency of driving with a satnav, with those in the revised test group being slightly more likely than those in the existing test group to use a satnav occasionally, fairly often, very often, or always.

34
Figure 8. Frequency of driving while using a satnav by test type
7.2 Attitudes, confidence and driving style
At test pass, some differences existed between the two trial groups in some confidence and skill variables. All of these differences had disappeared at the six-month post-test time point.
At six months post-test the groups did not differ in terms of how much improvement they felt they needed in a range of driving skills. Thus the difference seen at test pass between the groups (see Section 5.3.1 – the same factor structure was apparent) disappeared between this time and six months post-test.
At six months post-test, the general confidence factors reported in Section 5.3.2 did not differ significantly between the groups, meaning that the difference reported at test pass did not last. The ‘confidence in using a mobile phone…’ item also did not differ between the groups.
As was the case at test pass there was no difference between the revised and existing test groups on self-reported driving style, or on self-reported attitudes to risky driving.
7.3 Near-collisions
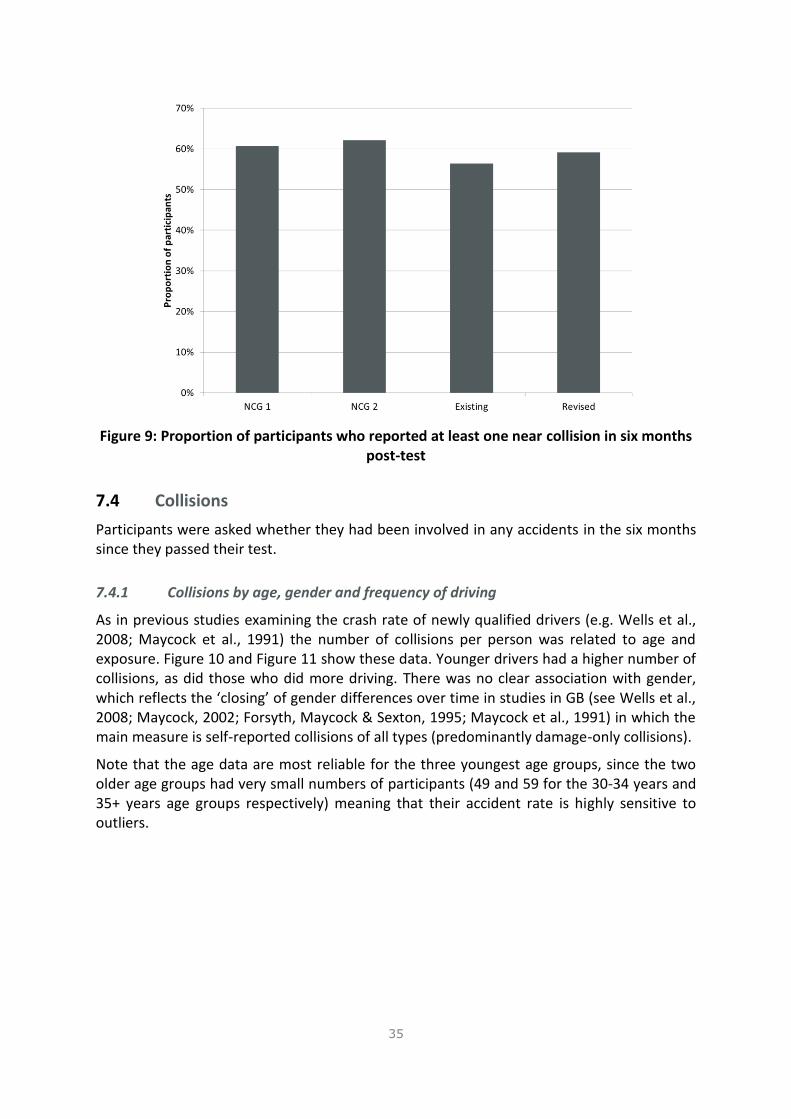
Participants were asked if they had been involved in any ‘near collisions’ (defined in the question as ‘having the impression of only just avoiding an accident’) in their first six months of driving. This measure is of course subject to interpretation, although the fact that near-collisions tend to correlate with collisions (see Table 13) lends some credibility to the validity of the measure. Figure 9 shows the number of participants who reported at least one near collision. Over half of participants in all four groups reported that they had been involved in at least one. There was a significant difference in this measure (p = 0.047) with a slightly lower proportion reported in the trial groups (there was no significant difference between the two trial groups).
35
Figure 9: Proportion of participants who reported at least one near collision in six months post-test
7.4 Collisions
Participants were asked whether they had been involved in any accidents in the six months since they passed their test.
7.4.1 Collisions by age, gender and frequency of driving
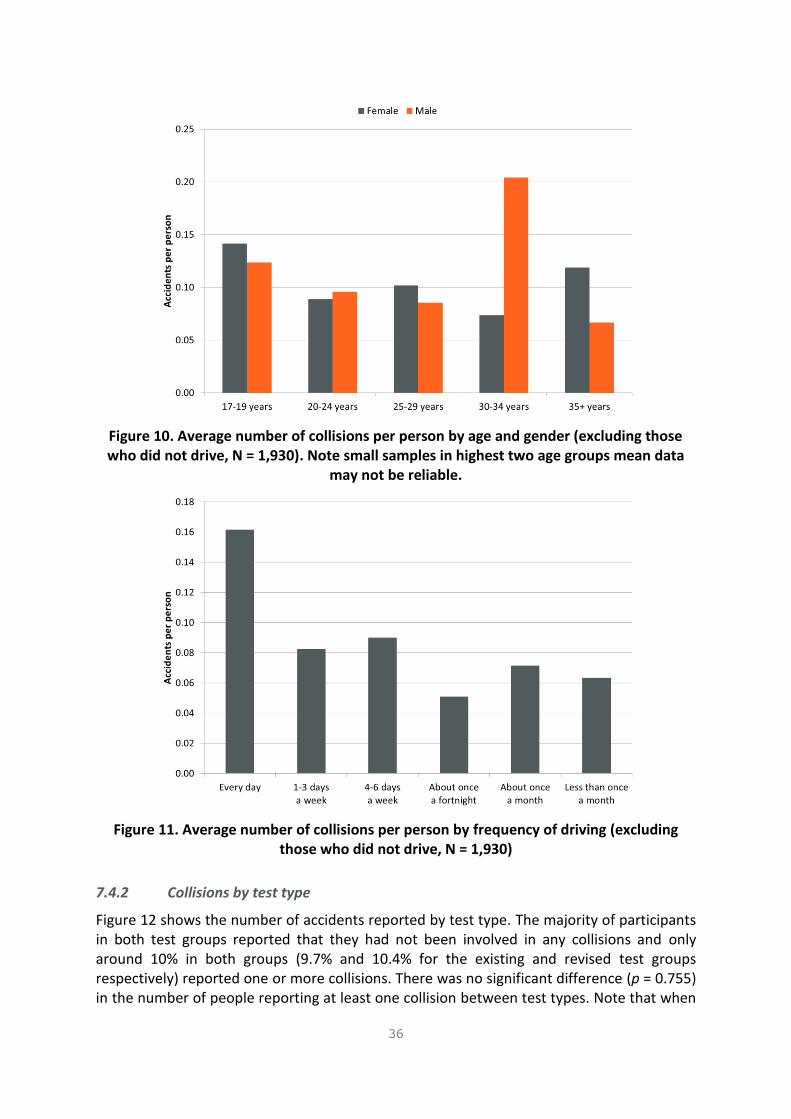
As in previous studies examining the crash rate of newly qualified drivers (e.g. Wells et al., 2008; Maycock et al., 1991) the number of collisions per person was related to age and exposure. Figure 10 and Figure 11 show these data. Younger drivers had a higher number of collisions, as did those who did more driving. There was no clear association with gender, which reflects the ‘closing’ of gender differences over time in studies in GB (see Wells et al., 2008; Maycock, 2002; Forsyth, Maycock & Sexton, 1995; Maycock et al., 1991) in which the main measure is self-reported collisions of all types (predominantly damage-only collisions).
Note that the age data are most reliable for the three youngest age groups, since the two older age groups had very small numbers of participants (49 and 59 for the 30-34 years and 35+ years age groups respectively) meaning that their accident rate is highly sensitive to outliers.
36
Figure 10. Average number of collisions per person by age and gender (excluding those who did not drive, N = 1,930). Note small samples in highest two age groups mean data
may not be reliable.
Figure 11. Average number of collisions per person by frequency of driving (excluding those who did not drive, N = 1,930)
7.4.2 Collisions by test type
Figure 12 shows the number of accidents reported by test type. The majority of participants in both test groups reported that they had not been involved in any collisions and only around 10% in both groups (9.7% and 10.4% for the existing and revised test groups respectively) reported one or more collisions. There was no significant difference (p = 0.755) in the number of people reporting at least one collision between test types. Note that when

37
the national comparison group participants were included as a third group in the test (8.4% of participants reporting at least one collision), again there was no statistically significant difference between any of the groups (p = 0.345). This lends further support to the finding that the test type that people passed had no impact on collisions in the first six months of post-test driving.
Figure 12. Number of collisions by test type
When taking into account the amount of driving people in each group had undertaken there was again no apparent difference between the groups. Table 11 shows these data.
Table 11. Collision rate (collisions per thousand miles of driving) by test type
Test type Total
Existing test Revised test
Number of participants 874 948 1,822
Total number of accidents reported 103 115 218
Total miles 2,729,000 2,912,600 5,641,600
Average mileage per person 3,122 3,072 3,096
Accident rate per thousand miles 0.038 0.039 0.039
The accident rate per thousand miles for the national comparison group was 0.035, again showing that the groups did not differ. Analyses by accident severity and location also revealed no obvious differences (although note that the study did not possess sufficient statistical power to undertake detailed analysis on sub-categories of accidents).

38
7.5 Collision modelling
The modelling of collisions reported in this section examines the relationship between accident numbers and exposure, age and gender in more detail, to estimate the effect of test type (and other variables) on collisions, having controlled for these other variables. In order to increase the sample size included in the modelling, data from the national comparison group were included in the analysis.
7.5.1 Modelling method
The modelling reported in this section uses a multivariate regression technique known as Generalised Linear Modelling (GLM). Regression techniques are designed to explore the relationship between a response variable (in this case, the number of reported collisions at six months) and a number of explanatory variables (driving style, test type etc.) on which the response variable is assumed to depend. For the purposes of the modelling, the number of collisions has been assumed to follow a negative binomial distribution; this distribution is frequently used for modelling count data such as collisions in studies such as this.
The first step is to develop the base model which includes variables which influence a respondent’s collision risk but which are not the main modelling variables of interest. Based on previous statistical models developed for novice drivers as part of the Cohort I and II projects (Forsyth et al., 1995; Wells et al., 2008), age, gender and exposure are all known to influence collision risk where:
Age is taken as the age at which the respondent passed the practical driving test.
Exposure is a composite measure which includes annualised mileage driven withinthe reporting period plus a factor to allow for frequency of driving (this is the samemethod as in the Cohort II study and was found to be the best fit for these data).
The base model is described in Section 7.5.2. The second step adds each explanatory variable individually to the base model to establish whether the unexplained variation in collision risk was reduced by a statistically significant amount. By adding each variable on its own, problems with interpreting the coefficients of multiple correlated explanatory variables which have been jointly added, can be avoided; this is also a limitation of the approach however (see Section 8.3).
7.5.2 The base model
The base model for the number of reported collisions in the first six months of driving was of the form:
log(𝐴𝑐𝑐𝑖𝑑𝑒𝑛𝑡𝑠) = 𝛽0 + 𝛽1 log(𝑒𝑥𝑝𝑜𝑠𝑢𝑟𝑒) + 𝛽2𝐴𝑔𝑒 𝐺𝑟𝑜𝑢𝑝
where the β’s are the coefficients to be estimated. This model is equivalent to:
𝐴𝑐𝑐𝑖𝑑𝑒𝑛𝑡𝑠 = 𝑒𝑥𝑝𝑜𝑠𝑢𝑟𝑒𝛽1 exp (𝛽0 + 𝛽2𝐴𝑔𝑒𝐺𝑟𝑜𝑢𝑝)
Exposure is the number of miles driven in the six month period plus 10 times thenumber of days on which the driver has driven. This composite measure of exposurewas found to fit the data better than using either mileage or driving frequencyindependently. The natural logarithm of this term is used in the model which

39
suggests that accident liability increases as mileage increases and more frequent driving is undertaken, but not in a simple linear fashion.
Various different transformations of age were trialled, but the categorical variable (where age is classified into five groups: 17-19 years, 20-24 years, 25-29 years, 30-34 years and 35+ years) was found to be the best fit for the data.
Unlike in previous studies, gender was not shown to be a significant predictor of collisions, suggesting that the difference in collision risk between young males and females has narrowed.
No interaction terms (e.g. to allow differences in the effect of exposure on collision risk by age) were included since these did not significantly improve the model fit.
The coefficients for this base model are shown in Table 12.
Table 12: Coefficients for the base model
Variable Coefficient p-value
Intercept -5.568 < 0.01 (*) log(exposure) 0.420 < 0.01 (*) Age Group: 17-19 years 0 n/a Age Group: 20-24 years -0.486 < 0.01 (*) Age Group: 25-29 years -0.129 0.54 Age Group: 30-34 years 0.203 0.40 Age Group: 35+ years -0.154 0.58
(*) denotes a statistically significant coefficient.
This base model shows that:
The exposure coefficient is 0.420, which is comparable to previous studies. The coefficient is positive suggesting that as exposure (annual mileage and/or frequency of driving) increases, the likelihood of an accident increases.
The age at which participants passed their test had a nearly significant (p = 0.056) effect on the number of collisions. Comparisons relative to the reference level show that there is a significant difference between 17-19 year olds and 20-24 year olds (with 20-24 year olds involved in 0.61 times fewer collisions that 17-19 year olds), but no significant difference between 17-19 year olds and the other age groups10.
7.5.3 The impact of other variables on collisions
In order to assess the effect of test type and variables describing pre-test driving experience, driver attitudes, self-reported driving style and behaviour and post-test experience variables on the number of reported collisions, each variable was added in turn to the base model described above. The significance of the added variable was then assessed to determine if inclusion of this term significantly improved the model fit.
The results show that, having controlled for age and exposure, there is no significant difference (p = 0.572) in the number of reported collisions between the three groups
10 As noted previously, the two older age groups had very small numbers of participants, making comparisons
with these groups less reliable.

40
(national comparison group, existing test and revised test), confirming that the type of test taken has no impact on collision risk for novice drivers in the six months following the test.
However, a number of explanatory variables were found to be significant when added to the base model (for all groups combined) and some are reported here for interest. Full details and coefficients are included in Wallbank et al. (2017). Some of the list is given below in Table 13.
In addition to describing the nature of the relationship between the variables and collision risk, for those variables which were classified as statistically significant in the model, practical importance was assessed by using the model coefficients to estimate the change in the number of accidents which would be expected between the minimum and maximum values (or 25th and 75th percentile values for continuous explanatory variables).
All these practical importance estimates assume that the driver travels a total of 3,000 miles in the six months post-test, travels on average 4-6 days a week and is 18 years old.

41
Table 13. The association of factors with changes in collision risk with exposure and age controlled in the current study
Factor Nature of relationship Practical importance of effect
Test type (revised, existing, or existing in national comparison group)
No effect on collision risk was found based on test type
N/A
Regular access to a vehicle owned by parents, relatives or friends, post-test
Those with access to such a vehicle had fewer collisions
The model estimates that a driver with no regular use of such a vehicle will have 0.14 accidents in the six month period, whereas a driver with regular access would be involved in 0.10 accidents (i.e. a 30% reduction in collisions).
Frequency of post-test driving in a busy town or city centre
Those who drove more frequently in these areas had more collisions
Comparing the number of accidents estimated by the model for a driver who never drives in a busy town or city with the number for a driver who travels every day, shows that collisions increase by 65% (from 0.10 to 0.17 accidents).
Frequency of post-test driving on employer’s business
Those who drove more frequently for this reason had more collisions
Comparing the number of accidents estimated by the model for a driver who never drives for this reason with the number for one who travels every day, shows that collisions increase by 52% (from 0.12 to 0.18 accidents).
Reported frequency of near misses
As the number of reported near misses increases, the number of reported collisions increases
The model estimates that a driver with no near misses will have 0.05 accidents in the six month period, whereas a driver who reported six or more would be involved in 0.27 accidents (i.e. a five-fold increase).
Named driver on a telematics or ‘black box’ insurance policy
People on such policies have more collisions
The estimated number of collisions for a driver without this type of insurance policy was 0.10, while the estimate for drivers with such policies was 0.15 (a 50% increase).

42
Factor Nature of relationship Practical importance of effect
Confidence in driving ability (except in mobile phone use)
Those reporting more confidence had fewer collisions
Varying the confidence level factor score between the 25th percentile and 75th percentile shows that estimated collisions increase by 20% (from 0.12 to 0.14).
A rating of ‘very confident’ overall results in a collision estimate of 0.14, compared with 0.40 (185% increase) for a driver who rates themselves as ‘not at all confident’.
Reported likelihood of avoiding risky driving situations
Those reporting that they ‘more likely’ than others to do so have fewer collisions
Drivers who are ‘less likely’ to avoid risky situations are estimated to be involved in 0.16 collisions, compared with 0.11 for those who are ‘more likely’ (32% decrease).
A self-reported driving style that is inattentive, careless, irresponsible and risky
People reporting a driving style like this have more collisions
Varying the factor score between the 25th percentile and 75th percentile values shows that estimated collisions increase by 18% (from 0.12 to 0.14).
Time with a driving instructor on country roads or time with a driving instructor driving ‘independently’
People who reported doing this more had fewer collisions
In both cases, compared to someone who did no training in these situations, those who did more than eight hours training were estimated to reduce the number of accidents they were involved in in the six months post-test by approximately 40%.
43
7.6 Comparison with previous models
There are differences in the sample size and surveys used between the Cohort I study (in the 1990s), the Cohort II Study (in the 2000s) and this study. However, there are also some similarities in the surveys which allow comparisons to be made between the ‘base’ models developed, in order to draw some broad conclusions about how novice driver collision risk has changed over this period.
The coefficient for exposure presented in the base model (0.420) is very similar to that seen in the previous two studies, suggesting that the relationship between driving exposure and the number of accidents has remained relatively unchanged.
The findings for gender are also interesting. One of the main conclusions from the Cohort I study was that males had an accident liability 12.5% higher than females. The Cohort II study found that this finding was restricted to younger candidates and, for drivers who pass their test after their early 20s, females have a higher accident liability than males. In this study, differences by gender were not found to be significant, suggesting that over the 25 year period since the Cohort I study was conducted, the gender gap has narrowed such that there is now no substantial difference in accident risk between male and female novice drivers, for the types of accident (predominantly damage-only) measured in studies such as this one.
Another key difference between this study and the Cohort II study is that while in the earlier work around 1 in 5 drivers were reporting at least one collision within the first six months of driving, in the current study this is around 1 in 10. See Section 8.4 for discussion of some possible reasons for this change.
7.7 Post-test driving – summary of findings
The two test groups did not differ in their post-test driving exposure, except that those in the revised test group were more likely than those in the existing test group to have used a satnav.
In terms of attitudes to risk and confidence, the groups did not differ significantly at six months post-test.
There were no differences in collisions (number, or rate) between the revised and existing test groups. There were familiar patterns in the collision data, with younger age and greater exposure being linked to more collisions. Collision modelling, which held driving exposure and age constant and included the age-matched national comparison group participants directly, showed again that there was no effect of test type on collision risk post-test. A range of factors related to pre- and post-test experience were related to changes in collision risk, but these applied to all groups.

44
8 Discussion
The main purpose of the current study was to assess the impact of a revised practical driving test on drivers’ preparation and learning, on their performance, and on their safety at test pass and at six months post-test, using a design in which learner drivers were pseudo-randomised to receive either the revised or existing test.
The trial groups were comparable in terms of age and gender, sensation-seeking, and access to a vehicle post-test; this provides some assurance that any differences between the groups could be attributed to something other than existing differences on these measures.
8.1 Effects of the revised test on preparation and learning
The revised version of the test, when compared with the existing one, had a modest effect on how people prepared. The main difference associated with the revised test was more learning while using a satnav, which is unsurprising as this was something required in the revised test, but not the existing test. It is possible that the modest differences between the trial groups however were partly due to training bias, whereby ADIs (most of whom were training learners in both groups) may have delivered training to the existing test candidates (intentionally or unintentionally) that was somehow influenced by the training they were delivering to revised test candidates. A comparison of both trial groups with an age-matched group of participants from non-trial test centres showed that the national comparison group undertook more training with their ADIs than trial participants, were more likely to spend time learning in quiet residential areas and following road signs, and were more likely to spend no time learning on country roads, fast dual carriageways, or when using a satnav. If these differences were due to training bias (and not simply the particular ADIs or test centres in the trial) then it is possible that the revised test has the potential to alter the learning to drive process to a greater extent than shown through the comparisons between the main trial groups.
When looking at safety-related variables at test pass, driving style and attitudes to risk taking did not differ between the groups. The revised test group however reported needing greater improvement on a range of driving skills. They also reported slightly higher confidence in their driving ability. This finding is consistent with the interpretation that the revised test provided drivers with more insight into their own limitations, possibly leading to greater confidence through a cautious approach to driving.
8.2 Effects of the revised test on test performance
The revised test had no noticeable impact on test difficulty, whether measured by self-reported number of attempts before passing, or DL25 minor faults.
8.3 Effects of the revised test on post-test driving and collisions
Post-test, the revised test passers drove slightly more using a satnav than the existing test passers. There were no differences between the groups in any attitudinal, driving style or confidence variables.
Drivers were asked to report the number of collisions in which they had been involved after six months of post-test driving. As with previous work of this type (e.g. Wells et al., 2008;
45
Forsyth et al., 1995; Maycock et al., 1991) age was shown to be an important factor in collision risk, with younger drivers reporting a higher accident rate (per driver) than older ones. Exposure was also important, with more driving leading to more collisions.
Given the evidence of training bias in the study, the national comparison group participants were also included in the collision analyses. This showed that the trial groups did not differ from each other, or from the national comparison group, in terms of the proportion of drivers reporting one or more collisions, or collisions per thousand miles of driving.
8.4 Findings from collision modelling
The final analysis in the study modelled collisions using a base model which controlled both age and exposure, and then added other variables to establish which, if any, increased or decreased collision risk. The analysis confirmed that that test type had no statistically significant impact on collision risk. Several variables did have an impact however.
The following variables were associated with higher accident risk:
1. The frequency of post-test driving in a busy town centre
2. The frequency of driving on employer business
3. A self-reported driving style that is inattentive, careless, irresponsible and risky
4. Reported frequency of near misses
5. Being a driver with a telematics-based insurance policy
The following were associated with lower accident risk:
1. Regular access to a vehicle owned by parents, relatives or friends during the post-test period
2. Confidence in driving ability (except being able to use a mobile phone while driving)
3. Reported likelihood of avoiding risky driving situations
4. Time spent when learning with a driving instructor on country roads, or driving‘independently’
Some of these factors raise important questions for future work with young and novice drivers.
First, they suggest an important role for specific types of exposure in post-test driving. Both driving in busy town centres and on employers’ business would be expected to be high-risk activities based on previous literature (see e.g. Sexton & Grayson, 2010; Grayson & Helman, 2011).
Second, the findings that those drivers with a telematics-based insurance policy are reporting more accidents is certainly worthy of further investigation, especially given the claims for safety benefits often made by providers of these policies. While it is possible that collisions under such policies (and work-related collisions) are more likely to be recalled or

46
reported by participants11, the very large increase in risk (around 50% in both cases) seems larger than might be explained by memory effects alone in a six month period.
Third, the protective nature of confidence, access to a family vehicle during the post-test period, and avoiding risky situations, raise interesting questions about the role that wider support networks and a balanced appraisal of risk might play in safety.
Fourth, as in the findings from Sexton and Grayson (2010) there is evidence that the type of driving undertaken when learning is potentially protective, although given that the types of driving in this study were different to those found to be protective in the earlier work, there is clearly a need for more research into this topic. The role of self-selection in such cases cannot currently be ruled out.
It should be noted that a limitation of the accident modelling in the current study is that only single variables were tested for their impact on collisions above the base model; combinations of variables, or the potential correlations between such variables, were not tested. Further research will be needed to assess whether the impact of some of these variables is unique, or arises partly due to their correlation with other variables. For example, the increased risk of driving for work might be due to some exposure differences (separate from mileage, which is controlled) for those who do such driving, such as doing more driving in town centres. Similarly, the finding that having a telematics-based insurance policy is associated with a greater collision risk might be due factors of self-selection for people who take out such policies. The current study was focused on the impact of the revised test on outcomes, but the dataset will support further analysis to address some of these questions.
Two final points are worthy of note. The first is the fact that male and female drivers appear to have a similar accident risk in the current study. This might surprise some people, but actually this pattern has been developing over the course of the last 25 years, as the gap between males and females in this respect has been closing since the early work of Maycock et al. (1991), through the Cohort I study in the 1990s (Forsyth et al., 1995), and more recently with the Cohort II dataset (Wells et al., 2008). This raises an interesting question as to the relationship between damage-only collisions and collisions involving injury, since the pattern of risk related to gender in injury accidents (males over-represented12) suggests that quite different gender-specific mechanisms might be at play when using damage-only collisions and injury collisions as outcomes when studying newly qualified drivers.
Finally, the ‘baseline’ proportion of drivers involved in a collision in their first six months of post-test driving is, based on the sample of participants in this study (including the national comparison group) around 9-10%. The proportion reported in Wells et al. (2008), which relied on data collected from around 2002-2004, was 19%. There is probably some bias in both estimates, since they are both drawn from samples who have actively agreed to take part in a research study. Nonetheless, it is clear that over the last 13-15 years driving for
11 The authors would like to thank Dr Jill Weekley for this suggestion.
12 For example, data from all European countries shows that men are more likely to report being in an injury
road accident than women. http://ec.europa.eu/eurostat/statistics-
explained/index.php/File:Share_of_the_population_reporting_that_they_had_a_road_traffic_accident_resulti
ng_in_injury,_by_sex,_2014_or_nearest_year_(%25).png
47
newly qualified drivers in GB has become safer. The reasons for this are likely to be related to a range of factors which while formally unknown, probably include vehicle safety improvements, road improvements, and maybe even driver improvements. What is also clear is that the often-cited phrase ‘one in five drivers has a collision within six months of passing their tests’, as well as referring to datasets which predominantly contain damage-only accidents, may no longer be true.
Future research should focus on understanding the reasons for this apparent increase in safety, as well as on understanding the reasons for the other variables associated with collision risk in this dataset.
8.5 Summary of findings related to the revised test
The revised practical driving test shows promise. It is well received by test takers, ADIs and supervising drivers. Although there is no evidence of a direct change on collisions in the first six months of driving post-test, its positive effects on insight and confidence, and its potential impact on the types of training undertaken when learning to drive are encouraging.
48
References Arnett, J. (1994). Sensation seeking: A new conceptualization and a new scale. Personality and Individual
Differences, 16(2), 289-296.
Baughan, C. J. and Vissers, J. A. M. M. (2007). Review of the British driving test. Unpublished Project Report (UPR/SSI/134/07). Crowthorne: Transport Research Laboratory.
Braun, V., and Clarke, V. (2013). Successful qualitative research: A practical guide for beginners. Sage.
Christmas, S. (2007). The Good, the Bad and the Talented: Young Drivers’ Perspectives on Good Driving and Learning to Drive. Department for Transport Road Safety Research Report No.74. London: Department for Transport (DfT).
Forsyth, E., Maycock, G. and Sexton, B. (1995). Cohort study of learner and novice drivers. Part 3: Accidents, offences and driving experience in the first three years of driving. Crowthorne: Transport Research Laboratory (TRL).
Grayson, G. B. and Helman, S. (2011). Work related road safety: a systematic review of the literature on the effectiveness of interventions. Research report 11.3. Institute of Occupational Safety and Health.
Gregersen N P, Berg H, Engström I, Nolén S, Nyberg A and Rimmö P (2000). Sixteen years age limit for learner drivers in Sweden – an evaluation of safety effects. Accident Analysis & Prevention, 32, 25-35.
Helman, S., Vandrevala, T, and Hutchins, R. (2010a). Feasibility of introducing a situational judgement and independent driving test element into the driver training and on road assessment protocol: Phase 1 final report. Client Project Report (CPR465). Crowthorne: Transport Research Laboratory. Available at: https://www.gov.uk/government/uploads/system/uploads/attachment_data/file/4568/dsa-taking-direction-taking-control.pdf
Helman, S., Vandrevala, T, and Hutchins, R. (2010b). The feasibility of introducing independent driving into the GB driving test: Phase 2 final report. Client Project Report (CPR462). Crowthorne: Transport Research Laboratory. Available at: https://www.gov.uk/government/uploads/system/uploads/attachment_data/file/268580/dsa-on-the-road-to-independence.pdf
Maycock G. (2002). Novice driver accidents and the driving test. TRL Report (TRL527). Crowthorne: Transport Research Laboratory.
Maycock, G., Lockwood, C. R. and Lester, J. (1991). The accident liability of car drivers. TRRL Report RR315. Crowthorne: Transport and Road Research Laboratory.
McKenna, F. P. (2007) Road Traffic accidents: human factors. In S Ayers, A. Baum, C. McManus, S. Newman, K. Wallston, J. Weinman & R. West (Eds.) Cambridge Handbook of Psychology Health and Medicine. Cambridge University Press.
Scott-Parker, B., Watson, B. C., King, M. J., Hyde, M. K., and Bates, L. J. (2012). The experiences of novices in an enhanced graduated driver licensing program in Queensland, Australia. Paper presented at the 5th International Conference on Traffic and Trasnport Psychology. 29th-31st August 2012, Groningen, The Netherlands.
Sexton, B. and Grayson, G. (2010). Further analyses of accident data from the Cohort II Study: When do drivers have their first accident and does it have an impact on their subsequent driving? TRL Published Project Report (PPR426). Crowthorne: Transport Research Laboratory.
Wallbank, C., Chowdhury, S., Hammond, J., Durrell, L., Kinnear, N., Buttress. S. and Helman, S. (2017). Transforming the practical driving test: technical report. TRL Published Project Report (CPR2449). Crowthorne: Transport Research Laboratory.
Wells, P., Tong, S., Sexton, B., Grayson, G. and Jones, E. (2008). Cohort II: a study of learner and new drivers. Volume 1: main report. Road Safety Research Report No. 81. London: Department for Transport (DfT).
World Health Organization. Violence, Injury Prevention, & World Health Organization. (2013). Global status report on road safety 2013: supporting a decade of action. World Health Organization.
49
Transforming the practical driving test
TRL
Crowthorne House, Nine Mile Ride, Wokingham, Berkshire, RG40 3GA, United Kingdom T: +44 (0) 1344 773131 F: +44 (0) 1344 770356 E: [email protected] W: www.trl.co.uk
ISSN
ISBN 978-1-910377-82-6
PPR828