Embed Size (px)
Citation preview
Public Workshop on the Proposed California Communities Environmental Health Screening Tool (CalEnviroScreen) WEBINAR TO DISCUSS HOW THE SCREENING TOOL MAY BE USEFUL TO CALIFORNIA’S NATIVE AMERICAN COMMUNITIES
OFFICE OF ENVIRONMENTAL HEALTH HAZARD ASSESSMENT CALIFORNIA ENVIRONMENTAL PROTECTION AGENCY
October 9, 2012

Agenda
Welcome & Introductions How to submit public comments and questions to the
presenters
Proposed Method Public comment
Proposed Indicators Public comment
Use of the tool Public comment
Next Steps 2

Submitting comments & questions
At anytime during the presentation attendees may submit their public comment or ask a question using the Chat feature in the Chat Pane
Type your comment in the message entry field (b)
Select presenter only (c) to send your comment to the presenters
Send your message (d)
Comments and questions received will be read aloud (as time allows) throughout the presentation
3

Materials available online
Report available at: http://oehha.ca.gov/ej/cipa073012.html
Additional maps, now including the North Coast area: http://oehha.ca.gov/ej/cipa080612.html
4

CalEnviroScreen Methodology
You may begin submitting your comments or questions at this time using the chat pane

Working Definition of Cumulative Impacts
“Cumulative impacts means exposures, public health or environmental effects from the combined emissions and discharges in a geographic area, including environmental pollution from all sources, whether single or multi-media, routinely, accidentally, or otherwise released. Impacts will take into account sensitive populations and socioeconomic factors, where applicable and to the extent data are available.”
-- Cal/EPA Interagency Working Group on Environmental Justice
6

Primary Components
Pollution Burden
Exposures
Public health effects
Environmental effects
Population Characteristics
Sensitive populations
Socioeconomic factors
7

Interpretation of Major Terms
• Possible contact with pollution Exposures
• Disease and other health conditions influenced by exposure to pollutants Public Health Effects
• Adverse environmental conditions caused by pollutants
Environmental Effects
• Populations with biological traits that may magnify the effects of pollutant exposures Sensitive Populations
• Community characteristics that result in increased vulnerability to pollutants
Socioeconomic Factors
8

Project Objectives
Geography-based assessment Consider multiple media contributions air, water, soil
Use a suite of indicators to characterize components
Find data for each component Aggregate the information Keep it relatively simple
9

Criteria for Geographic Scale
Useful for decision support Not too large Lose power to discern differences
Not too small Lose relevant data (e.g., certain health data)
Publicly established Familiar scale
10

ZIP Codes1:Proposed Unit of Analysis Map of ZIPMap of ZIP
!(
Code Cov r geCode CoveeraageRedding
Legend 2
CA tribal lands
ZIP Code Boundaries Sacramento
!( California Topography
San Francisco !(
Northern Fresno CA !(
Bakersfield !(
Los Angeles !(
Southeast CA San Diego
!(
1 A representation of ZIP codes, called ZCTAs (ZIP Code Tabulation Areas) is available from the Census Bureau. These areas are referred to as ZIP codes in this presentation.
11 2 American Indian/Alaska Native/Native Hawaiian Area (2010): US Census Bureau

Criteria for indicator selection
Provide a good measure of the contribution to the component
Pollution burden indicators should relate to issues that may be actionable by Cal/EPA
Population characteristic indicators should relate to demographic factors that may influence vulnerability to disease
Publicly available Statewide and location-based information Complete, accurate, current
12

Proposed Indicators for Components
Exposures Public Health Effects
Environmental Effects
Sensitive Populations
Socio-economic Factors
Ozone concentrations
PM 2.5 concentrations
Traffic density
Pesticide use
Toxic releases from facilities
Drinking water quality
Low birth weight rate
Asthma ER visit rate
Heart disease mortality rate
Cancer mortality rate
Clean-up sites (brownfields)
Leaking under-ground storage tanks and cleanups
Solid waste sites and facilities and hazardous waste facilities
Impaired water bodies
Prevalence of Educational children attainment
Prevalence of Household elderly income
Poverty
Percent non-white
13

Scoring
For each indicator, ZIP codes are assigned percentile values based on where they fall in the statewide distribution
Within a component, indicator percentile values are averaged
Components are then scored from their defined ranges based on averages
14

Proposed Relationship
15

Range of Scores for Components
Component Range of Possible Scores
Exposures 1-10
Environmental effects 1-5
Public health effects 1-5
Sensitive populations 1-3
Socioeconomic factors 1-3
Cumulative impact 6-120
16

Examples of comments received on the methodology
17
Consider using census tracts instead of ZIP codes
Components should be weighted differently; provide justification for the weighting
Consider using additive method instead

Comments on methodology
Pollution Burden
Exposures
Public health effects
Environmental effects
Population Characteristics
Sensitive populations
Socioeconomic factors

Ozone concentrations
PM 2.5 concentrations
Pesticide use
Toxic releases from facilities
Traffic density
Drinking water quality (under development)
Exposures Indicators

Indicator: Ozone
Air Resources Board’s Air Monitoring Network
Indicator: Daily maximum 8-hour ozone concentrations for the summer season Estimates from nearest
monitors to center of the ZIP code
Three year (2007-2009) average
Southeastern California 20

Indicator: Particulate Matter (PM 2.5) 21
Air Resources Board’s Air Monitoring Network
Indicator: Annual mean concentrations of PM 2.5 Estimates from nearest
monitors to center of the ZIP code
Three year (2007-2009) average
North Coast Area

Indicator: Pesticide Use 22
California Department ofPesticide Regulation’sPesticide Use Reporting
Indicator: Total pounds ofselected active pesticide ingredient use per squaremile Agricultural use of pesticides
(derived from 1 sq. miledata) and non-agricultural use (derived from county data) were assigned to all ZIP codes
Two year (2009- 2010) average
Southeastern California

Indicator: Toxic Releases 23
US EPA’s Toxic Release Inventory
Indicator: Total hazard-weighted pounds ofchemicals released on-site to air or water from all facilities Includes the sum of
hazard-weighted pounds of facilities within the ZIP code, or within one kilometer of the ZIP code
Three year (2008-2010) average
North Coast Area

Indicator: Traffic Density 24
CalTrans Highway Performance Monitoring System (HPMS) & California Environmental Health Tracking Program
Indicator: Traffic density within a 2.5 kilometer buffer of the center of the ZIP code HPMS 2004 annual average
daily traffic counts are used Traffic density estimates are
vehicle counts per roadway length within the buffer
Southeastern California

Clean-up sites (brownfields)
Impaired water bodies
Leaking under-ground storage tanks and cleanups
Solid waste sites and facilities and hazardous waste facilities
Environmental Effects Indicators

26
Indicator: Cleanup Sites
Department of Toxic Substances Control’s EnviroStor database
Indicator: Sum of weighted sites within each ZIP Cleanup site type and
status were taken into account in assigning weights
North Coast Area
27
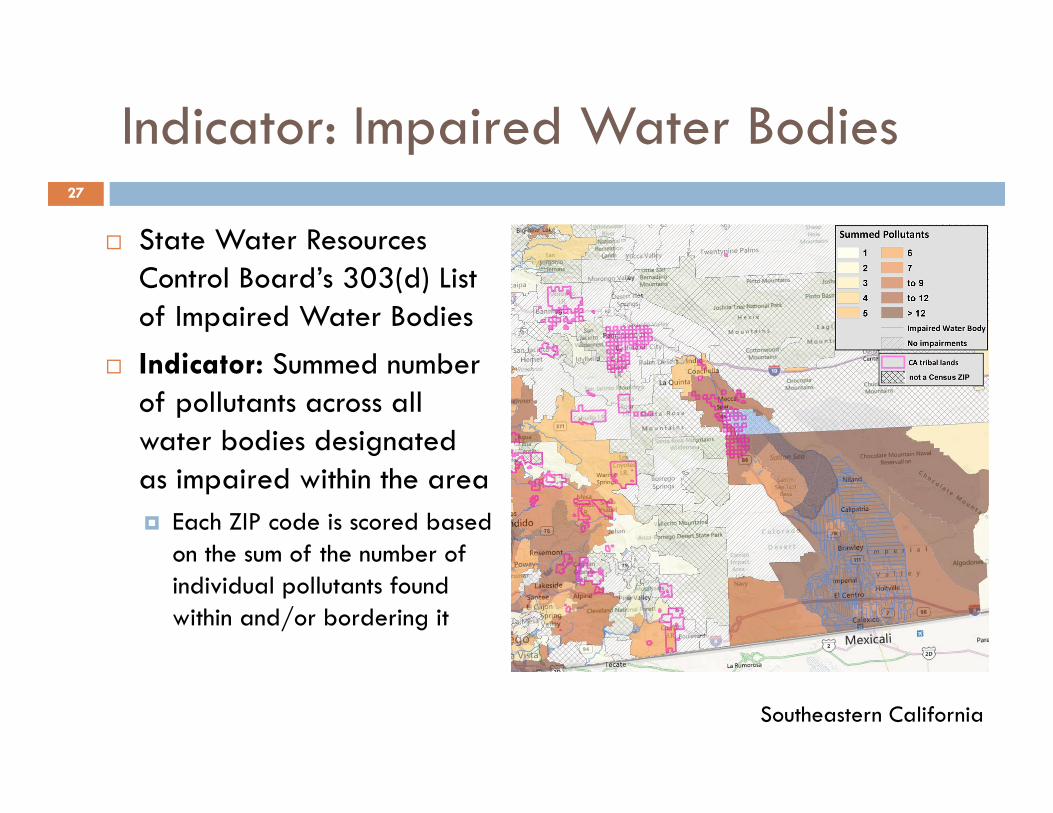
Indicator: Impaired Water Bodies
State Water Resources Control Board’s 303(d) List of Impaired Water Bodies
Indicator: Summed number of pollutants across all water bodies designated as impaired within the area Each ZIP code is scored based
on the sum of the number of individual pollutants found within and/or bordering it
Southeastern California

Indicator: Leaking Underground Storage Tanks and Cleanups
28
State Water Resources Control Board’s GeoTracker Database
Indicator: Sum of weighted sites within each ZIP Site type and status
were taken into account in assigning weights
North Coast Area

Indicator: Solid waste sites/facilities and hazardous waste facilities
29
CalRecycle’s Solid Waste Information System and Department of Toxic Substances Control’s EnviroStor database
Indicator: Sum of weighted sites or facilities within each ZIP Site or facility information
were taken into account in assigning weights
Southeastern California

Low birth weight rate
Asthma ER visit rate
Heart disease mortality rate (under development)
Cancer mortality rate (under development)
Public Health Effects Indicators

Indicator: Low Birth Weight 31
California Department of Public Health, Vital Statistics
Indicator: Low birth weight rate Low birth weight rate was
defined as the percent of live births weighing less than 2500 grams (about 5.5 pounds)
Five year average (2005-2009)
Southeastern California

Indicator: Asthma 32
Office of Statewide Health Planning and Development and Environmental Health Investigations Branch
Indicator: Age-adjusted rate of asthma emergency department visits (per 10,000) Three year average
(2007-2009)
North Coast Area

Indicator: Heart Disease (under development) 33
California Department of Public Health
Indicator: Age-adjusted heart disease mortality rates (per 100,000) County scale data were
assigned their respective ZIP code (ZIP code scale data are being analyzed)
Five year average (2004-2008)
Southeastern California
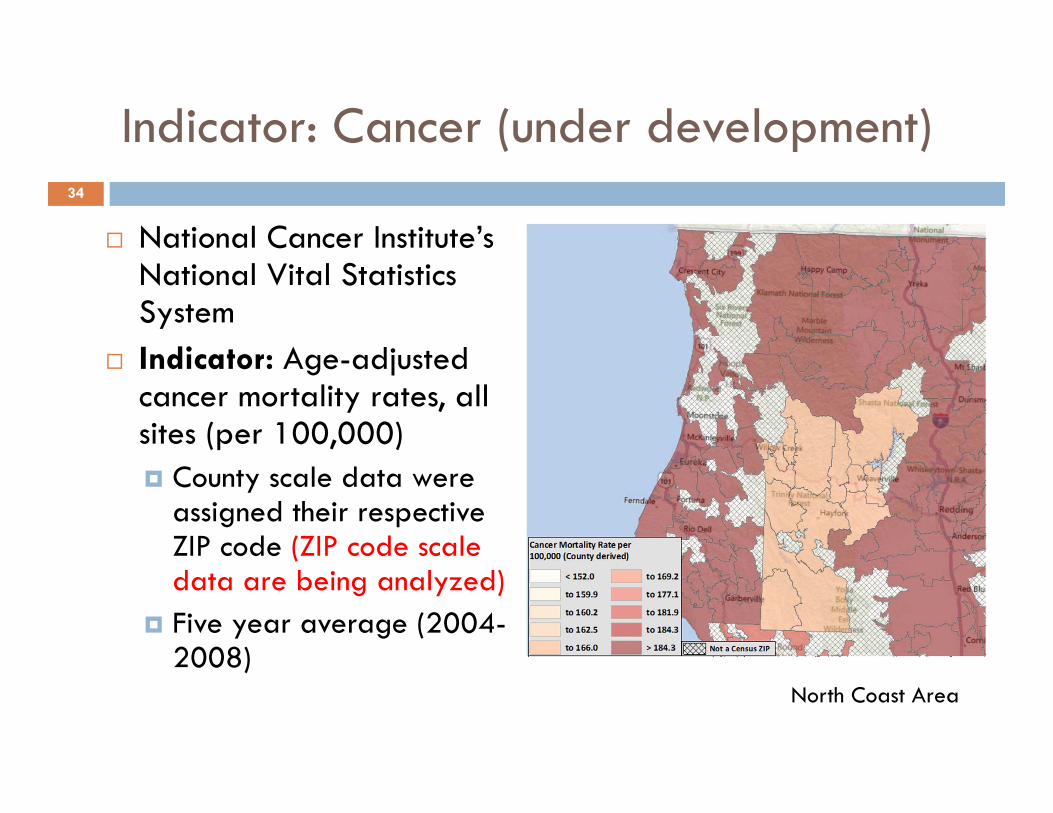
Indicator: Cancer (under development) 34
National Cancer Institute’s National Vital Statistics System
Indicator: Age-adjusted cancer mortality rates, all sites (per 100,000) County scale data were
assigned their respective ZIP code (ZIP code scale data are being analyzed)
Five year average (2004-2008)
North Coast Area

Prevalence of children Prevalence of elderly
Educational attainment Household income Poverty Race/ethnicity
Sensitive Populations and Socioeconomic Factors Indicators

Indicator: Children 36
U.S. Census Bureau Indicator: Percent of
the population under age 5 2010 Census
Southeastern California

Indicator: Elderly 37
U.S. Census Bureau Indicator: Percent of
the population over age 65 2010 Census
North Coast Area

Indicator: Educational Attainment 38
U.S. Census Bureau’s American Community Survey
Indicator: Percent of population over age 25 with less than a high school education Five year, 2006-2010,
estimates Missouri Census Data
Center’s estimates were used until available from Census in late-2012
Southeastern California
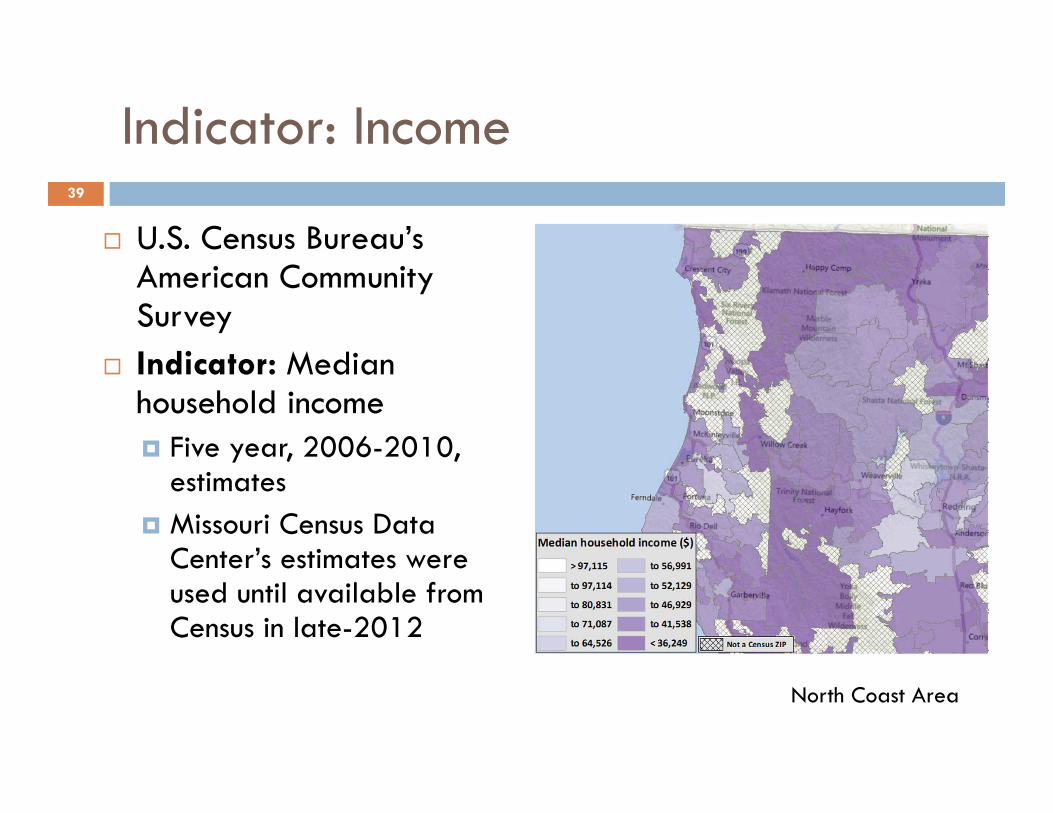
Indicator: Income 39
U.S. Census Bureau’s American Community Survey
Indicator: Median household income Five year, 2006-2010,
estimates Missouri Census Data
Center’s estimates were used until available from Census in late-2012
North Coast Area

Indicator: Poverty
U.S. Census Bureau’s American Community Survey
Indicator: Percent of the population living below two times the national poverty level Five year, 2006-2010,
estimates Missouri Census Data
Center’s estimates were used until available from Census in late-2012
Southeastern California 40

41
Indicator: Race/ethnicity
U.S. Census Bureau Indicator: Percent of
the population non-white and Hispanic/Latino 2010 Census
North Coast Area

42
Examples of comments received on the indicators
Incorporate an indicator of diesel emissions
The public health indicators are more vulnerability factors, consider moving to the sensitive populations component
Concern over using the pesticide and TRI indicators as exposure indicators
Include drinking water quality Include linguistic isolation

Comments on the indicators
Exposures Public Health Effects
Environmental Effects
Sensitive Populations
Socio-economic Factors
Ozone concentrations
PM 2.5 concentrations
Traffic density
Pesticide use
Toxic releases from facilities
Drinking water quality
Low birth weight rate
Asthma ER visit rate
Heart disease mortality rate
Cancer mortality rate
Clean-up sites (brownfields)
Leaking under-ground storage tanks and cleanups
Solid waste sites and facilities and hazardous waste facilities
Impaired water bodies
Prevalence of children
Prevalence of elderly
Educational attainment
Household income
Poverty
Percent non-white

Discussion on the use of the tool

Types of Decision-making
Prioritization Site Clean-up Enforcement Environmental Monitoring Financial Assistance Outreach
45

Next Steps
Take comments on proposed method and indicators Work Group members Public Cal/EPA boards and departments
Public regional workshops and academic workshop (August - October)
Revise indicators and complete analysis CIPA workgroup meeting Release CalEnviroScreen
46