Embed Size (px)
Citation preview

Sustainable public urban
transport systems:
The case of Curitiba
Author: Andrea Cinquina Lund University
International Masters Program in Environmental Studies and Sustainability Sciences
LUMES 2006/08 MESM01 Thesis Course
Supervisor: Prof. Bengt Holmberg Traffic Planning, LHT
Lund University
Andrea Cinquina Lumes Thesis 2008
2
Abstract This paper describes the present urban public transportation in the city of Curitiba, Brazil.
The city was chosen for this research because of its urban public transport system, which had a major role in
urban planning development; this consists of an integrated network of busses, developed in combination with
land use, population density and road hierarchy, as a consequence of the Master Plan implemented by the
city in the late 60s.
The sustainability of the system was analysed, using as the main framework, the United Nations Habitat
Agenda recommendations on sustainable transport and applying these criteria to the public transport system
of Curitiba, making use of available literature, interviews and observations.
From the analyses of the system, it was evident that it achieved positive indicators regarding its sustainability
in the criteria of accessibility, economical feasibility and coordination of land use and transport system.
However, negative indicators were also evident, that leads to the conclusion that it is not a sustainable
system. These aspects were in the criteria of intermodal transportation, disincentives for private motorization
traffic and the use of diesel fuel. Keywords: Curitiba; Sustainable public transport; Land use; Public urban transport system; Integrated Transport
Network; Urban Planning; Sustainable transport system.
Contents
List of tables and figures..................................................................................................................................................... 3 1 Introduction............................................................................................................................................................... 4
1.1 Purpose of the paper ........................................................................................................................................ 4 1.2 Thesis outline................................................................................................................................................... 5
2 Background ............................................................................................................................................................... 5 2.1 Brazil ............................................................................................................................................................... 5 2.2 Curitiba ............................................................................................................................................................ 5 2.3 History of the city ............................................................................................................................................ 6
2.3.1 General data about Curitiba .................................................................................................................. 7 3 Methodology ............................................................................................................................................................. 7
3.1 Limitation ........................................................................................................................................................ 9 3.2 Stakeholders .................................................................................................................................................... 9 The stakeholders of public transport system are represented by the municipality, URBS, IPPUC, users of the system, citizens, private bus companies, COMEC...................................................................................................................... 9
4 The planning of the public transport system ............................................................................................................. 9 4.1 Agencies .......................................................................................................................................................... 9
4.1.1 Metropolitan level agencies: COMEC ................................................................................................... 9 4.1.2 Urban level........................................................................................................................................... 10
4.2 City Planning ................................................................................................................................................. 11 4.2.1 The Agache plan .................................................................................................................................. 11 4.2.2 Plano director (Master Plan) ................................................................................................................ 11 4.2.3 Road hierarchy ..................................................................................................................................... 13
4.3 Urban public transport system ....................................................................................................................... 13 4.3.1 Historical development ........................................................................................................................ 14
4.4 The public transport system today ................................................................................................................. 18 5 Future plans of the city............................................................................................................................................ 21
5.1 Ligeirao.......................................................................................................................................................... 21 5.2 Green line ...................................................................................................................................................... 22 5.3 Metro ............................................................................................................................................................. 23

Andrea Cinquina Lumes Thesis 2008
3
6 Theoretical framework ............................................................................................................................................ 24 6.1 Defining sustainable transport ....................................................................................................................... 24 6.2 The case of Curitiba....................................................................................................................................... 26 6.3 Habitat II United Nations Conference ........................................................................................................... 26
7 Analysis and Discussion ......................................................................................................................................... 27 7.1 Habitat II United Nation Conference framework applied to Curitiba ................................................... 27
7.1.1 Support an integrated policy approach................................................................................................ 27 7.1.2 Coordinate land use and transport planning ....................................................................................... 29 7.1.3 Encourage the combination of modes of transport .............................................................................. 31 7.1.4 Promote disincentive measures that discourage private motorized traffic .......................................... 32 7.1.5 Promote public transport ..................................................................................................................... 35 7.1.6 Promote use of efficient and low polluting technologies...................................................................... 37 7.1.7 Promote electronic information services ............................................................................................. 41
7.2 Main features to move towards a sustainable public transport system .................................................. 41 7.2.1 Environment......................................................................................................................................... 41 7.2.2 Society.................................................................................................................................................. 42 7.2.3 Economy .............................................................................................................................................. 45 7.2.4 Institution ............................................................................................................................................. 46
8 Further research....................................................................................................................................................... 48 9 Conclusion .............................................................................................................................................................. 48 References......................................................................................................................................................................... 49
Acronyms and abbreviations
BRT – Bus Rapid Transit CIC – Curitiba’s Industrial City COMEC – Curitiba Metropolitan Region Coordination CWB – Curitiba IPPUC – Curitiba Institute of Research and Urban Planning LRT – Light Rail Transit PM10 – Particulate Matter 10 R$ – Brazilian Real RMC – Metropolitan region of Curitiba RIT – Integrated Transport Network URBS – Urbanization of Curitiba µg – microgram
List of tables and figures Picture 1. Map of Brazil......................................................................................................................................................5 Picture 2. City of Curitiba...................................................................................................................................................6 Picture 3. The five structural corridors...............................................................................................................................10 Picture 4. Organic growth of a city. .................................................................................................................................. 10 Picture 5. Zoning in 1965............................................................................................................................... ...................11 Picture 6. Zoning in 1966.................................................................................................... ..............................................11 Picture 7. Zoning in 1975.................................................................................................................... ..............................11 Picture 8. Zoning in 2000................................................................................................................... ...............................11 Picture 9. A structural corridor in Curitiba, with the middle lane reserved for bus only.................. ................................13 Picture 1. Example of structural corridor with its parallel high speed roads................................ ...................................14 Picture 2. Section of a structural corridor …………………………………………………...................……………….15 Picture 3. A structural corridor from above……………………………………………………………...…...................15 Picture 4. Population density in 2000…………………………………………………………...................……………17 Picture 5. RIT in 2003......................................................................................................................................................17 Picture 6. Boarding on a biarticulated bus in Curitiba......................................... ................... ........................................18 Picture 7. Elevator for people with disabilities at a tube bus stop....................................................................................19 Picture 8. Tube-stations. ......................................... ......................................... ............... ..............................................19 Picture 9. Biarticulated bus in Curitiba...........................................................................................................................19 Picture 10. Sector south of the green line. Past, future................................... ..................................................................22 Table 1: Growing rates of CWB, RMC with and without CWB, 1970-2008, with 2020 predictions from IPPUC................................... ................................... ................................... .................................................... ................ 9 Table 2: Population of CWB, RMC with and without CWB, 1970-2008, with 2020 predictions from IPPUC.. .............................................................................................................................................................................................9 Table 3. Curitiba’s system: Lines, busses, capacity, fleet................................... .............................................................20 Table 4. Fares in the most important Brazilians capitals. ................................... .............................................................32 Table 5. Accidents per cars. Data elaborated by the author. ................................... .........................................................34
Andrea Cinquina Lumes Thesis 2008
4
Table 6. General data from 2006, Rio´s data from 2005................................... ...............................................................36 Table 7. Index of deaths and cars per inhabitants..............................................................................................................39 Table 8. PM10 in some Brazilian cities, and attributable percentage in deaths and hospital admissions….………........39 Table 9. External Cost of transport……………………………………………………………………………….……...45 Figure 1. Urban transport passengers................................... ................................... ........................................................36
1 Introduction Today the cities are residence to half of the world’s population, and in 2030, 60% of the population will live
in a city (UNFPA , 2004). The urban areas have an increasing importance in our society as they are
continually growing, along with all the issues related to them. Therefore urban areas should be seen as the
answer to those issues, as Mr. Lerner (three times Mayor of Curitiba and twice Governor of the State of
Paranà) pointed out. Problems, as the ones related to urban transport, and their interrelated impacts on the
environment, economy and society, are always getting bigger as the cities are growing in their size and
population.
Nowadays the transport system worldwide relies heavily on non-renewable resources. In the EU25 gasoline
and gas account for 44 and 55 percent of final energy consumed by transportation (EEA, 2003), while it is a
major consumer of two exhaustible resources, oil and land (Greene et al, 1997). Road and rail respectively
are the first and second largest land consumers (EEA, 2002), and cause several negative consequences such
as pollution, subsequent health-related problems, traffic congestion or accidents.
Implementing more sustainable transport systems within human settlements is fundamental in order to limit
those issues related to transportation. This can also have positive impacts on the city itself, for example
alleviating many problems afflicting disadvantaged social classes – such as the poor, women or elderly
people – by providing accessibility to the transport system (OECD, 2002), to have an easier access to jobs,
goods or services (OECD, 2000).
The city of Curitiba is today used as a world reference for its integrated public transport system, as Mr.
Lerner himself used to point out (Phillips, 2008). This innovative system is the consequence of a switch in
planning and city’s government during the late60s/early 70s.
As will be exposed in this paper, Curitiba’s public transport system today transports the majority of its
population, while the costs of its implementation were relatively low; now the system is financing itself,
without recurring extra expenses from the municipality, and is pivotal in having brought a lower
consumption of oil per capita compared with the surrounding Brazilian cities.
1.1 Purpose of the paper
With this paper, the author intended to develop a better understanding of what a sustainable urban public
transport system is. Furthermore, the paper highlights what the main features and criteria are for a city in
order to move towards a sustainable urban public transport system. This is achieved through an analysis of
the city of Curitiba as a case-study. The main research question is:

Andrea Cinquina Lumes Thesis 2008
5
• Is Curitiba’s public transport system sustainable?
This paper will expose a specific example about what can be done to reach sustainability in an urban public
transport system, giving the reader the opportunity to gain knowledge from Curitiba’s experience. To answer
the main question, sub research questions have been developed to guide the research:
• What development occurred in Curitiba to get to the current system?
• What future developments are planned by the city?
• How does the Curitiba public transport system compare to the UN Habitat recommendations?
1.2 Thesis outline
In order to address the research questions proposed, City and State general background will be presented
(chapter two), the methodology used in this research (chapter three), the main agencies responsible for the
city and transport planning, the history of the city and public transport system planning, until the present time
(chapter four), as the basis to analyze the sustainability of the system. Plans for the future are presented
(chapter five) in order to know what the development of the city will be. The theoretical framework of the
paper is presented, and additional criteria of sustainable urban transport systems will be developed by the
author (chaper six). Then the seven reccomendations proposed by the UN Habitat Agenda document will be
presented the and the curitiba transport system will be analyzed against the criteria (chapter 7.1) and it will
be presented what, in the author’s opinion, resulted to be (after the analysis of the curitiba public transport
system) the main features in order to move towards a sustainable public transport system (chapter 7.2).
2 Background 2.1 Brazil
Brazil’s surface covers almost half of the entire South American continent. It is the fifth largest country in
the world, with a total population of around 190 million people, concentrated in costal areas, and a very low
population density with 22 inhabitants/km², almost the
same as the Sweden (UN, 2006).
It is a Federative Republic made up of 27 states (Pic.1),
which has most of its economic and financial activities
in the states of the south and the southeast region of
Brazil (Macedo, 2004).
2.2 Curitiba
Founded in 1693, Curitiba became the capital of the
south-eastern Brazilian State of Paranà in 1954; today it
has around 3.2 million inhabitants in its greater area
Picture 1. Map of Brazil. Source: www.destination360.com
Andrea Cinquina Lumes Thesis 2008
6
(IBGE, 2006) – with an estimated increase of one million in the next ten years. Curitiba itself has 1.8 million
citizens (IBGE, 2007), four times more than in the 60s, becoming one of the fastest growing cities in Brazil
during this period, and unlike most of the other South American cities, its rapid increase and development
were not left to its own organic growth (a natural sprawling). In fact, the current development of Curitiba is
the consequence of the adoption of a planning process that based most of its policies on the integration
between the development of public transportation, road system and land use (Rabinovitch et al., 1995).
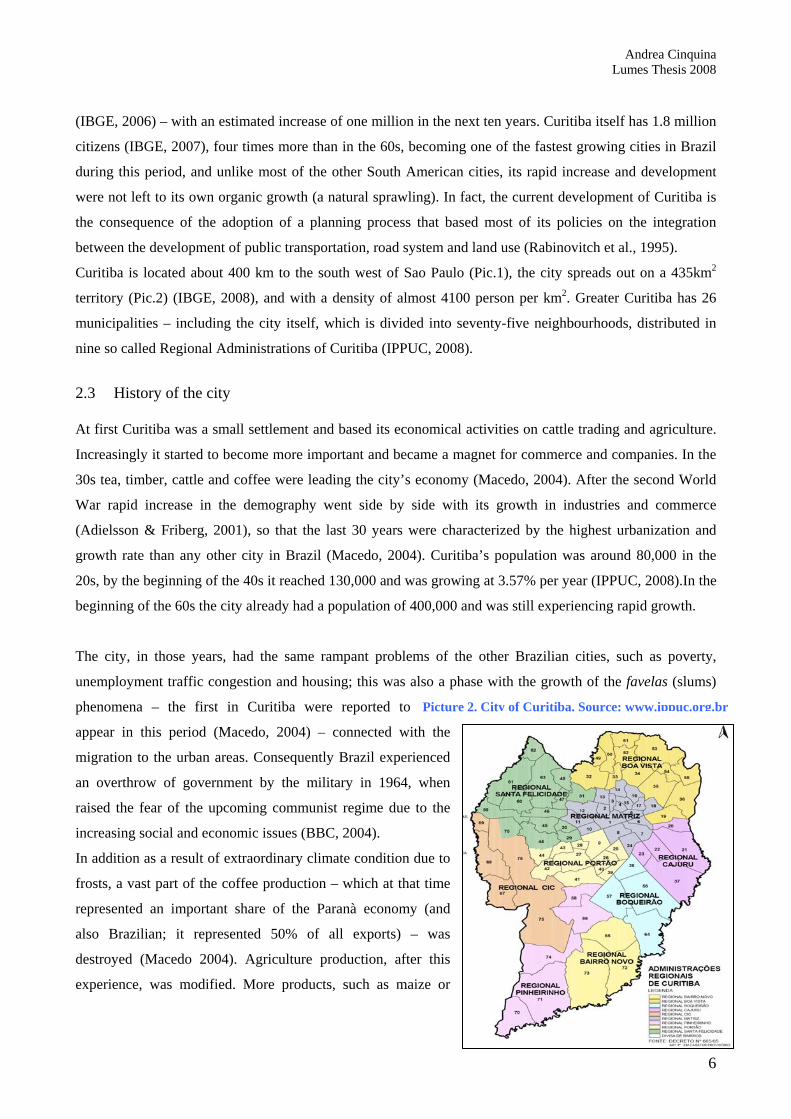
Curitiba is located about 400 km to the south west of Sao Paulo (Pic.1), the city spreads out on a 435km2
territory (Pic.2) (IBGE, 2008), and with a density of almost 4100 person per km2. Greater Curitiba has 26
municipalities – including the city itself, which is divided into seventy-five neighbourhoods, distributed in
nine so called Regional Administrations of Curitiba (IPPUC, 2008).
2.3 History of the city
At first Curitiba was a small settlement and based its economical activities on cattle trading and agriculture.
Increasingly it started to become more important and became a magnet for commerce and companies. In the
30s tea, timber, cattle and coffee were leading the city’s economy (Macedo, 2004). After the second World
War rapid increase in the demography went side by side with its growth in industries and commerce
(Adielsson & Friberg, 2001), so that the last 30 years were characterized by the highest urbanization and
growth rate than any other city in Brazil (Macedo, 2004). Curitiba’s population was around 80,000 in the
20s, by the beginning of the 40s it reached 130,000 and was growing at 3.57% per year (IPPUC, 2008).In the
beginning of the 60s the city already had a population of 400,000 and was still experiencing rapid growth.
The city, in those years, had the same rampant problems of the other Brazilian cities, such as poverty,
unemployment traffic congestion and housing; this was also a phase with the growth of the favelas (slums)
phenomena – the first in Curitiba were reported to
appear in this period (Macedo, 2004) – connected with the
migration to the urban areas. Consequently Brazil experienced
an overthrow of government by the military in 1964, when
raised the fear of the upcoming communist regime due to the
increasing social and economic issues (BBC, 2004).
In addition as a result of extraordinary climate condition due to
frosts, a vast part of the coffee production – which at that time
represented an important share of the Paranà economy (and
also Brazilian; it represented 50% of all exports) – was
destroyed (Macedo 2004). Agriculture production, after this
experience, was modified. More products, such as maize or
Picture 2. City of Curitiba. Source: www.ippuc.org.br

Andrea Cinquina Lumes Thesis 2008
7
soybean, that can be produced with the help of machinery reducing the number of employees
(Macedo,2004), were adopted; Ms. Daher also pointed out that the coffee industry, which normally requires
lots of workers and a small use of technology (similar to the grapes/wine industry), reduced itself, creating
huge immigration flows to the cities (although coffee still represents an important part of the Paranà
agriculture), where people were hoping to find employment in the local industries. The population
distribution of Paranà started to change radically: rural population decreased from 64% in 1970 to 19% in
2000 (Macedo, 2004).
As explained by Mr.Ficinski, unlike what happened a couple of centuries ago in Europe, the modern
factories did not need such a large amount of manpower anymore, creating a huge wave of unemployment,
with people that lost their job in the countryside but were not able to find one in the city; they were not able
to buy houses, pay rents and so on, and the phenomenon of the favelas, that was already present but in a
minor way, began to grow rapidly.
Therefore, in order to avoid organic growth and the issues related to it, the city implemented an urban plan; it
was thought by the city planners to create physical structures, such as main corridors, that guided the
development of the city (Wilheim, 1969). It was understood the necessity to implement an urban plan
constantly integrated in every administrative decisions; to this extent, the Agache Plan in 1943 – the first real
city plan of Curitiba – turned out to be a fundamental decision.
As a result of its planning and policies implemented in issues as housing, recycling, and especially its
transport system (Macedo, 2004), the city was describe as ‘‘a model of urban ecology planning’’ (Pedreira &
Goodstein, 1992), ‘‘the best city in the world’’ (Meadows, 1995) or ‘‘the ecological capital of the world’’
(Kroll, 1999).
2.3.1 General data about Curitiba The city is the capital which has the lowest index of illiteracy in the entire country (Curitiba.org, 2008), with
an index of only 3.4% illiterate inhabitants older than 15 years, against a national index of 13.6% (IPPUC,
2008a).
It has 51 m2 of green area per citizen (ibid.), with innovative waste management policies; amongst them the
“lixo que nao è lixo” (garbage that it is not garbage) and “cambio verde” (green trade), in which the city
gives to people food, bus tickets and books, in exchange for garbage. With the programme “garbage
purchase” Curitiba won an international award from the United Nations Environment Program (ibid.).
The state of Paranà and Curitiba have a GDP index per capita higher than the Brazilian average, R$12.339,
R$16.059 and R$11.658 respectively (IBGE, 2008).
3 Methodology This thesis is based on the review of quantitative and qualitative data collected from scientific articles,
reports, official documents from the municipality of Curitiba and its institutions, statistical data from the

Andrea Cinquina Lumes Thesis 2008
8
Brazilian governmental institutes, mass media and books concerning the subject; in addition interviews and
observations were conducted in the city of Curitiba itself.
In order to gain a deeper understanding of the system, interviews were conducted; semi-structured interviews
were used with the citizens (Appendix 2), so to be able to be more flexible during the interview (Bryman,
2004). In semi-structured interviews, the interviewer asked a series of questions so as to cover specific
topics, but the order may not have followed the pre-established questions, for instance if the interviewer
wants to focus more on some answers of the interviewee (ibid.). A combination of closed and open-ended
questions were used, sometimes probing for a more complete answer or better explanation of the question.
Non probability sampling methods were used (ibid.), as the author wanted to be aware of what the younger
generations (subjects of the interviews) feel about the system and its development in the future, because they
will be more involved in the future choices and developments. A convenience sample method was adopted
(ibid.), interviewing only citizens that were already known to the author as it was not feasible to stop the
users outside the bus stops, as the author did not have any particular formal identification and also because of
time related issues (the users would not have stopped for a long time). Users from different areas of the city
were chosen, so as to have different users of different lines, different economical situations between the
richer central areas and the poorer peripheral zones. Interviews were conducted always in an informal
environment, private houses or public spaces and in the last weeks of the author’s stay in Curitiba; thus
creating an even more informal atmosphere in order to reduce the possibilities of biased response (Powell et
al., 1997). The aim of these interviews were to understand what were the main positive and negative aspects
of the transport system perceived by the people, and if the public transport was seen as a good alternative to
private motorization. In addition other users of the system or simply citizens were subject of informal
conversations.
Prominent people were also interviewed in order to provide a better comprehension of the system, its history
and future implementation, always with semi-structured interviews (Appendix 1), which was used in order to
highlight the interviewees’ point of view, what they thought was more important to explain, leaving the
author the possibility of asking new questions while important ideas were coming out from the answers
(ibid.). Those interviewed: (a)Almeida Clever, Engineer, IPPUC (Curitiba Institute of Research and Urban
Planning); (b)Ceneviva Carlos Eduardo, former President of IPPUC and former president of URBS
(Urbanization of Curitiba); (c)Costa Daniel, Engineer, URBS (he was interviewed by email due to logistical
problems); (d)Daher Ariadne, Architect, Lerner Arquitetos Associados; (e)Ficinski Lubomir Dunin, former
president of IPPUC; (f)Lerner Jaime, former Mayor of Curitiba and Governor of Paraná, former President of
IPPUC; (g)Soares Anive, Architect, URBS; (h)Vallicelli Liana, Foreign Affairs Advisor, IPPUC.
In order to not cause intervening variables (ibid.) from having people answer questions in non-native
language, the author of this study decided that it was of paramount importance to learn Portuguese so as to
conduct research in the language of the interviewees; the author achieved a fluent level of Portuguese, being

Andrea Cinquina Lumes Thesis 2008
9
able to access large quantities of data available only in Portuguese. Unobtrusive methods were also adopted,
with simple observation of the situation inside busses, bus stops and terminals. The author did not want to let
the users and the employees of the system know that they were being studied, so as to observe normal
actions (ibid.); the author spent many days using the system trying to comprehend how the system really
worked and the users’ natural reactions to the daily issues when using the public transport system.
3.1 Limitation
This paper will not discuss in depth the issues regarding the use of alternative fuels to fossil fuels such as
biofuels or electricity, the use of alternative systems such as light rail or metro, and the future capacity of the
system, due to the broad scope of the paper. Though this cases could be addressed in further research about
the public transport of the city.
3.2 Stakeholders
The stakeholders of public transport system are represented by the municipality, URBS, IPPUC, users of the
system, citizens, private bus companies, COMEC.
4 The planning of the public transport system 4.1 Agencies
In order to give a description of the history of the public transport system in Curitiba and its planning, some
agencies that operate at a metropolitan or urban level need to be presented.
4.1.1 Metropolitan level agencies: COMEC The 26 municipalities that form the Metropolitan Area of Curitiba (RMC – from Região Metrolipolitana de
Curitiba) experienced a significant growth rate in the second half of the last century, especially during the
50s–70s (Table 1); together with Curitiba (CWB) (Table 3) – with a growth rate higher than 7% and 6%
respectively during the 50s and 60s (Schwartz, 2004) – saw its population become ten times greater in the
last 50 years (Hawken et al., 2004).
It was common belief among the policy makers of the end of the 60s / beginning of the 70s, that even if it
was impossible to stop the growth of the metropolitan and urban area, at least something could have be done
in order to guide this growth. POPULATION GROWTH RATE
1970 1980 1991 1996 2008 2020
CWB 5,34 2,29 2,34 1,83 1,24 1.08
RMC 5,38 2,90 3,32 2,87 2,8 -
RMC without CWB 5,45 4,04 4,88 4,37 - -
Table 10: Growing rates of CWB, RMC with and without CWB, 1970-2008, with 2020 predictions from IPPUC. Sourcees: (IPPUC,2008; Almeida,2008; IPPUC,2008b)

Andrea Cinquina Lumes Thesis 2008
10
Table 11: Population of CWB, RMC with and without CWB, 1970-2008, with 2020 predictions from IPPUC. POPULATION
1970 1980 1991 1996 2000 2008 2020
CWB 609.026 1.024.980 1.315.035 1.476.253 1.587.315 1.797.408 2.088.897
RMC 907.931 1.532.383 2.099.558 2.471.771 2.768.394 3.172.357 4.540.000
RMC without CWB 298.365 507.403 784.523 995.518 1.181.079 1.374.949 2.451.103
Making the municipalities better coordinated between themselves was seen as an important step to assure the
development of the area, so the creation of a coordination body in 1974, called COMEC – Curitiba
Metropolitan Region Coordination – became necessary, with the purpose to “integrate and organize the
planning and execution of the common interest public functions of the population and the municipalities that
compose the metropolitan region of Curitiba” (COMEC, 2008, translate by the author). The areas under
COMEC coordination today are land use and transportation.
4.1.2 Urban level
4.1.2.1 IPPUC Guiding the growth of Curitiba required a functioning urban plan, and in order to execute and develop this
plan there was the necessity to create a municipal agency; therefore the Curitiba Institute of Research and
Urban Planning (IPPUC) was created on December 1st, 1965, with the main purpose of putting into practice
measures that were aimed at increasing the living condition of the Curitibanos (citizens from Curitiba), and
include these measures in the planning of the city (IPPUC, 2008a). Created as a municipal autarchy –
autonomous and decentralized – the IPPUC has now the function of coordinating the process of urban
planning and monitoring of the city, making compatible the municipality and the metropolitan region in the
process of achieving sustainable development, conducting research, projects, programmes, developing plans
and collecting the necessary resources (ibid.). Its projects are presented to the municipality, and once
approved, are managed by IPPUC.
4.1.2.2 URBS Another fundamental organisation for the urban transportation in Curitiba is the URBS (Urbanization of
Curitiba); Ms. Soares, noticed that it was created in 1963 as a company specializing in paving and it gained
important functions to define all the operational parameters of the public transportation. The main objective
of URBS is to improve the capacity, quality and efficiency of the public transportation to reach economic
sustainability, which is seen as reaching an economic-financial equilibrium of the services performed
(URBS, 2008).
Ms. Soares, pointed out that the municipality owns 97% of its shares and the president of URBS is appointed
by the mayor of Curitiba, highlighted how for many critics, the fact that the company is not completely
public owned, effected the way the agency works, making it more efficient and so earning it more functions
from the municipality.

Andrea Cinquina Lumes Thesis 2008
11
4.2 City Planning
4.2.1 The Agache plan In 1943 the “Agache Plan” (after the name of the leading architect) was implemented, an urban plan with the
aim to guide the growth of the city, by dividing it in two main areas: the city centre and the residential
peripheral district. To avoid traffic issues, it was decided to create concentric ring-roads that encompassed
the central area, which were linked by radial avenues (Adielsson & Friberg,
2001).
The main component was the construction of huge road in order to move in
and out from the city center, giving in this way the priority to vehicular traffic
(Garrick et al., 2006) instead of a collective transport system. As claimed by
Mr. Arzua, former Mayor of Curitiba, it was not that the plan had defects, but
the problem was that it was not following the evolution of the city (IPPUC,
2008). The only part of the plan that was eventually put into action was the
construction of the radial avenues; and with the city facing an organic growth
(Pic.4), the concentration of all the services in the central area, created congestion (IPPUC, 2008). However,
even if the city did not implement the plan, the recognition that an urban plan was necessary to solve the
city’s issues was crucial.
4.2.2 Plano director (Master Plan) In 1964 a national contest was created to find a new urban plan due to
the rapid growth of the city. The contest was won by Jorge Wilheim;
his “Preliminary Urban Plan” was converted into the “Master Plan”,
and in order to follow and lead its execution the IPPUC was created,
which revised the plan on a three year basis. The new plan followed a
linear model of growth (Pic.3) implementing zoning laws and
integrating the road system with land use and public transport (IPPUC,
2008a).
The entire urban planning is based on the principle that land use could have been regulated by norms. Zoning
and land use are used as stimulators and organizers of the city development; they delineate the characteristics
of the different areas of the city, defining the parameters, public and private, of occupation of the land,
financial, economic, housing, etc. (IPPUC, 2008).
The growth of the central zone was limited by the law nº 2.828/66, which also established the development
of services and commerce along the structural axis following a linear development of the city; defined the
residential zones and areas predisposed to further development of the city. In time new laws were adopted,
defining and regulating new zones and their development (ibid.).
Picture 4. Organic growth of a city. Source: IPPUC, 2008
Picture 3. The five structural corridors. Source: IPPUC, 2008

Andrea Cinquina Lumes Thesis 2008
12
With the law nº 4.199 in 1972, it was established that along the structural corridors, equipped with
infrastructures for the development of a mass transit system, the housing density should increase (ibid.); also
some areas of the city center were converted into pedestrian areas, as the street “Rua XV de Novembro”
which became the first exclusively pedestrian street in Brazil – it previously was one of the most congested
roads in the city (ibid.).
The industrial area of the city was created (CIC) with the law nº 5.234, in 1975, and limited the occupation
of the peripheral areas of the city promoting the occupation of the areas next to the structural sectors (ibid.);
on the structural corridors the ground and first floors of buildings were left to commercial and financial
activities and services. To reduce the consequential issues of rapid growth, the city was developed along
main corridors instead of organic growth, decentralizing its commercial and industrial activities and its
residential areas (Goodman et al, 2007).
From the top left to the right, clockwise Picture 5. Zoning in 1965. Sources: www.ippuc.org.br Picture 6. Zoning in 1966. Sources: www.ippuc.org.br Picture 7. Zoning in 1975. Sources: www.ippuc.org.br Picture 8. Zoning in 2000. Sources: www.ippuc.org.br
Andrea Cinquina Lumes Thesis 2008
13
In the pictures 5, 6, 7 and 8 can be seen the evolution of the zoning in Curitiba, especially from 1965
onwards (Pic.5), when the city was left still to its organic growth and 1966 (Pic.6), when the linear
development starts to be seen discerned (purple lines).
4.2.3 Road hierarchy With the zoning laws and land use, a hierarchy was given to the road system; every street was classified,
with a fixed function, capacity or characteristic (IPPUC, 2007). The classification was the following:
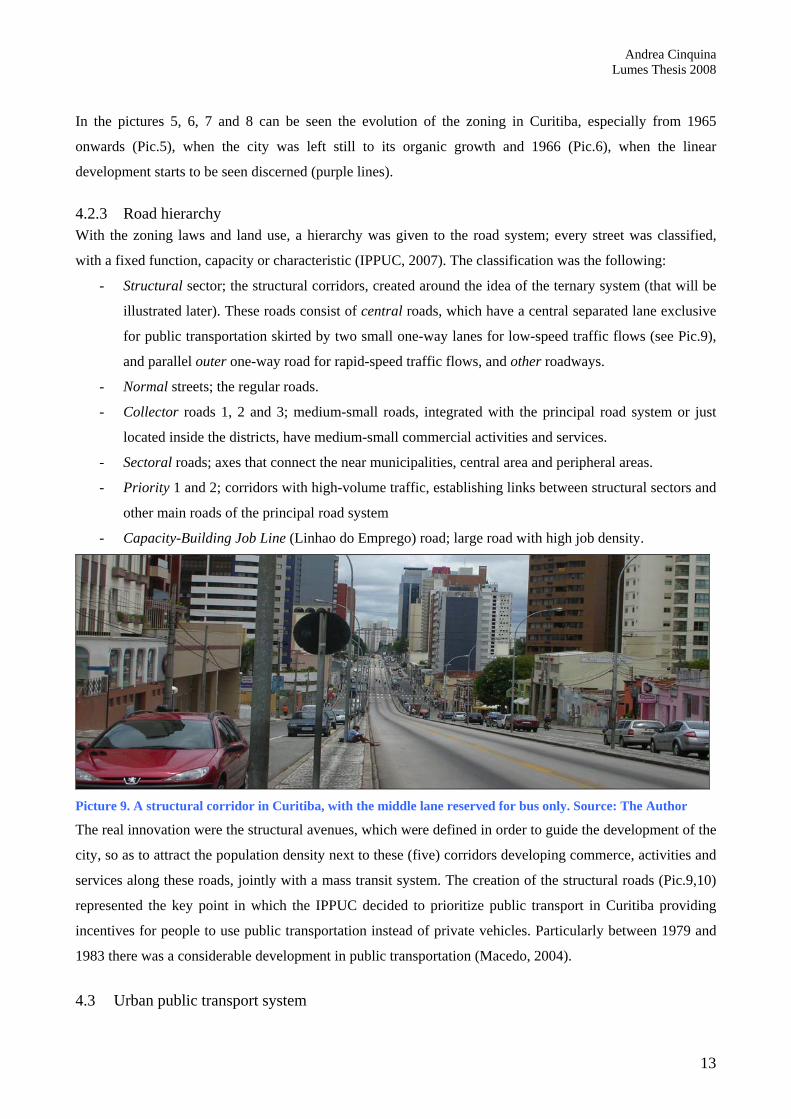
- Structural sector; the structural corridors, created around the idea of the ternary system (that will be
illustrated later). These roads consist of central roads, which have a central separated lane exclusive
for public transportation skirted by two small one-way lanes for low-speed traffic flows (see Pic.9),
and parallel outer one-way road for rapid-speed traffic flows, and other roadways.
- Normal streets; the regular roads.
- Collector roads 1, 2 and 3; medium-small roads, integrated with the principal road system or just
located inside the districts, have medium-small commercial activities and services.
- Sectoral roads; axes that connect the near municipalities, central area and peripheral areas.
- Priority 1 and 2; corridors with high-volume traffic, establishing links between structural sectors and
other main roads of the principal road system
- Capacity-Building Job Line (Linhao do Emprego) road; large road with high job density.
Picture 9. A structural corridor in Curitiba, with the middle lane reserved for bus only. Source: The Author
The real innovation were the structural avenues, which were defined in order to guide the development of the
city, so as to attract the population density next to these (five) corridors developing commerce, activities and
services along these roads, jointly with a mass transit system. The creation of the structural roads (Pic.9,10)
represented the key point in which the IPPUC decided to prioritize public transport in Curitiba providing
incentives for people to use public transportation instead of private vehicles. Particularly between 1979 and
1983 there was a considerable development in public transportation (Macedo, 2004).
4.3 Urban public transport system

Andrea Cinquina Lumes Thesis 2008
14
4.3.1 Historical development In this section the historical development of the public transport of the city is presented.
4.3.1.1 The beginning The implementation of an urban transportation system can produce desired developments or generate
unwanted situations in the cities (Rabinovitch et al., 1995) and Curitiba represented the prior.
In the beginning (1887) the public transport of the city was trolleys carried by mules and later substituted by
electric trolleys. The first bus circulated in 1928, but it wasn’t successful mainly due to higher fares in
comparison with the trolleys, ten years later the trolleys were still used by 11 million citizens annually and
bus only by 2.6 million (IPPUC,2000). However, in the 40s busses started to replace the trolleys and in 1952
the last trolley stopped operation in the city (ibid.).
Initially the public system did not cover some areas of the city, and also many areas of the city were not
directly connected, but most of the routes had the city center as their terminal, resulting in an obvious
congestion of the central area as dwellers were forced to reach the city center even if they did not want to
(Rabinovitch et al, 1995). Busses had truck chassis, and in order to avoid users eluding fares they had steep
stairs and small doors, reducing the timing for boarding/exiting the bus, and so creating delays in the system
(ibid.).
4.3.1.2 From Jaime Lerner era onwards Mr Lerner, appointed Mayor in 1971, had a fundamental impact on the public transportation system; in 1974
the new transit system was implemented, after a preliminary plan created in 1968 (Macedo, 2004).
With the implementation of the urban plan, which gave the priority to the public transportation along the
construction of the five main corridors, the situation started to change.
In 1972 begun the construction of
structural roads (Pic.9), formed
by a triple layout; the central
route consisting of a reserved
double-lane for busses, whilst on
its sides, two one-way roads
created for slow speed traffic,
which run in opposite ways. The
corridors are characterized by the
construction of large buildings in
their proximity, with decreasing
size as the distance to the
corridors increases. Parallel to
main roads, spaced out by the large buildings blocks, run two one-way roads created for high speed traffic,
Picture 11. Example of structural corridor with its parallel high speed roads. Source: IPPUC, 2008a

Andrea Cinquina Lumes Thesis 2008
15
thus generating the ternary system (Pic.10) – the construction of the South-North corridor was finished in
1974 (Demery,2004). It was called the ternary system because of the three main roads, the main corridor and
the two high speed roads, as it can be seen in Pic.10 highlighted by the arrows.
This system was adopted because the initial idea was to make the structural roads 60 meters wide, but due to
low economic returns in expropriating lands and also the unwillingness to create a huge highway through the
city, it was thought to utilize already existing parallel streets, thus creating the ternary system (Pic.10,11)
(Meurs,1994). For the construction of the corridors grants from the International Bank for Reconstruction
and Development of the World Bank was fundamental (IPPUC,2007)
Picture 121. Section of a structural corridor. Source: IPPUC, 2000 The central section, composed of the reserved lane for the busses (canaleta) and the low speed traffic road
(lenta), is characterized by the presence of higher buildings, to increase population density; moving further to
the right or the left it is possible to see the different level of zoning, from zoning level 4 –next to the main
axis, spaced out by the fast speed traffic lanes (rapida), to zoning level 1, corresponding to the population
densities requested by the city(Pic.12).
With the completion of the first structural
corridors in 1974 this implemented the
“express” lines together with “feeder” lines,
creating the basis of the new public system
that will see the implementation of new lines
as the “interdisctrics” in 1979.
As it was seen in the 40s, the fares influence
the choice of the citizens in Curitiba,
becoming a sensitive subject. A single ticket
price was implemented in 1980 (tarifa social,
social ticket), so that the people were paying the same price regardless of the distance traveled (IPPUC,
2000). In the same year the “Integrated Transport Network” (RIT, Rede Integrada de Transporte) was
implemented, which consists of integrated bus lines. The RIT gave to the users the possibility to ride
different bus lines, the feeder and express, paying only a single fare; this transfer occurs in special closed
terminals, and nowadays in the tube stations as well. The terminals, initially uncomfortable and too small for
the demand, evolved over time and, as in underground stations, now they offer flower shops, bars and other
Picture 13. A structural corridor from above. Source: Skyscrapercity.com
Andrea Cinquina Lumes Thesis 2008
16
facilities, and their entrances are regulated by turnstiles. Today there are 29 terminals in the RIT (URBS,
2008).
The municipality was continuously prioritizing its public transportation, due to the oil crisis, encouraging
people to not use private vehicles but instead using busses, and giving different working times for different
activities so as to spread them over the day in order to avoid congestion of the bus routes. For instance the
groceries and industries had to start working at 7 a.m., schools at 8 a.m., banks at 9 a.m., liberal professions
at 9 a.m. and public servants at 9.30 a.m. (IPPUC, 2008a).
In 1980 the articulated busses, whit 80% more capacity than the older ones, started to replace the previous
express busses. Fifteen years after the implementation of the urban plan, the 673 busses of Curitiba were
transporting 515,000 Curitibanos everyday (URBS, 2008). The mass transit fleet, which represented only 2%
of all the vehicles that were running in the city, was transporting 75% of the people that were commuting.
The RIT, which in 1990 transported only 54% of the total users of the system, in 1995, transported 84%
(ibid.).
In 1982 the physical integration of the RIT with the metropolitan area was initiated.
Demand was increasing continuously and infrastructures was increased; In 1986 URBS became manager of
the system (ibid.) and as Ms. Soares said URBS became the concessionaire of the service, while the private
bus companies the licensee.
It must be said that the public transport system in Curitiba is characterized by private participation; there are
different bus companies – today 10 for the urban line and 18 for the metropolitan – that are responsible for
the busses and their routes. It does not suffer from an uncoordinated system of private minibus or van, which
characterizes many cities in the developing world, including Rio de Janeiro.
Mr. Costa reminded how, in 1955, there were around 150 private bus operators – that joined in groups and
started to sign contracts with the municipality (ibid.) – and in 1960 every group formed a company. When
Curitiba started to give full priority to the public transport system, it won the trust of its users, who were then
not looking for alternatives. For Ms. Daher, the solution to avoid the issues regarding regulated private
companies consists in implementing a system that is comfortable, safe and effective. For Ms. Soares the
quality of the system in Curitiba, the integrated network and the single fare were fundamental because in
other cities where these qualities are not present the mini vans are the “answer of the market” for badly
attended areas. Also the main features of the transport in Curitiba are the tubes and terminals, which vans
cannot access.
As Ms Daher said about the public transport system: “it began with an “equation of co-responsibility” in
which the participants (public, private initiative and civil society) decided to achieve a project altogether for
the city. Political willingness, determination and a good financial equation for the privates companies was

Andrea Cinquina Lumes Thesis 2008
17
needed; but convincing the different private companies needed negotiations, presentation of a good project
and firm hand from the municipality”. There was necessary a discussion between all the stakeholders. She
also underlined how at that time there was the possibility of credit loans for the companies investing in
public transport in urban areas, that permitted the private sector to collect the financial resources needed to
buy the fleets; so the system was set up and the isolated operators were losing competition and thus quitting.
Until the 70s the municipality gave private companies the possibility to operate in non-overlapping areas of
the city and the companies were charging the users – the fare was negotiated with the municipality as well
(Rabinovitch et al., 1995). As Mr.Lerner said, “in the beginning, if I changed one stop, there was always a
fight between the bus companies and us”, because the companies were earning a percentage of the tickets
they sold while operating in the allotted area (Rabinovitch et al., 1995), so they were depending also on the
routes and the number of stops. Though with the creation of the RIT, the users were able to purchase the
ticket from one company and transfer to another route run by another company, therefore profit-sharing was
needed. To share the revenues, it was decided in 1987 to pay the companies per km traveled and not anymore
per person transported (ibid.). The URBS was setting the fares, giving to the companies scheduled routes
with given km and timetables; this was important, as Ms Soares stressed, because now the private companies
were put in a situation of not competing between themselves as they did not have to care about the number of
users transported, but just to respect the route and the timetable assigned to them.
Picture 14. Population density in 2000. Source: Ippuc, 2008 Picture 15. RIT in 2003. Source: Ippuc, 2008
In 1991 the first direct line (ligeirinho, which means fast) was created. The innovation of the direct line was
the introduction of the tube-stations (Pic.15, 17) bus stop (tube shaped, normally 10m. long and 3m. wide)
that became one of the symbols of Curitiba’s system – they will be described more in the next pages.
Andrea Cinquina Lumes Thesis 2008
18
In 1992 the first bi-articulated busses were introduced in the reserved lane way in the structural corridors.
The boarding-exiting parade consisted of the same tubes-stations successfully used in the direct line, but with
a stop every 500 meters (IPPUC, 2000). As mentioned before everything related to land use, hence
population density was integrated with the transport system planning, and so in 1992 almost 40% of the
population was living not farther than 3 blocks from the structural corridors (FTA, 1998).
Picture 12 shows the population density of Curitiba in 2000, with lighter colours indicating lower density; it
can be seen how the higher population density coincides with the express bi-articulated lines (Pic.13), which
run in the five main corridors.
4.4 The public transport system today
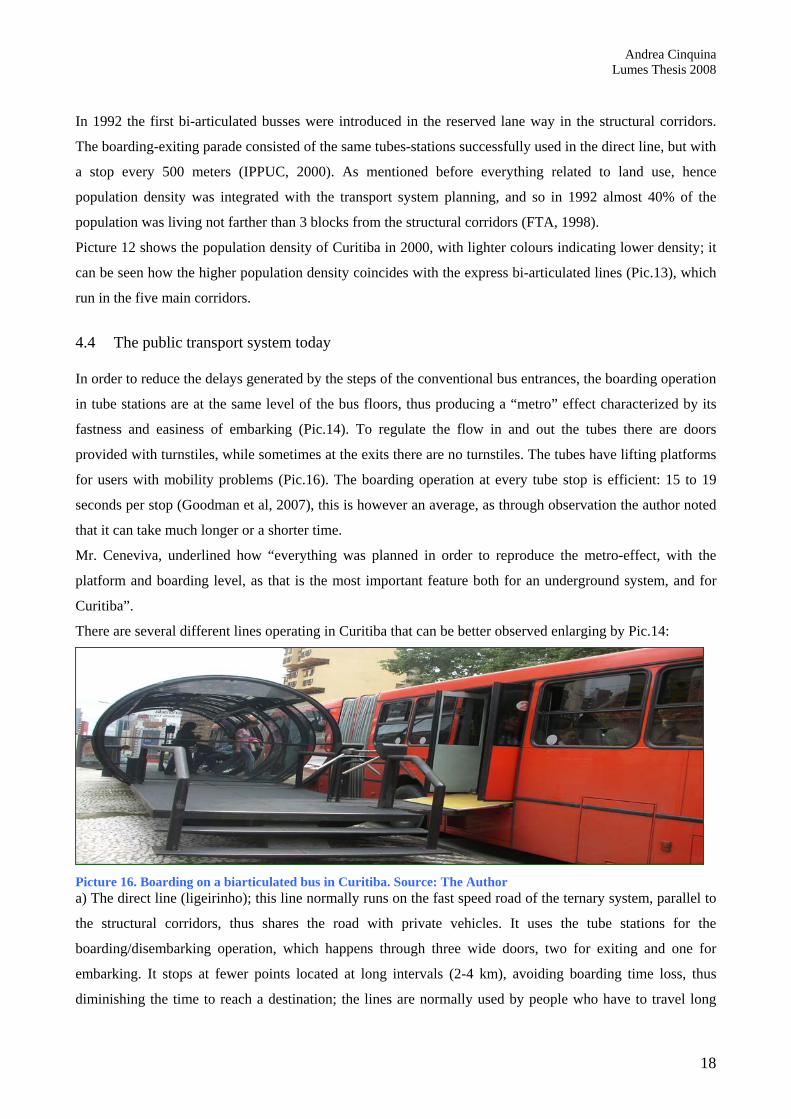
In order to reduce the delays generated by the steps of the conventional bus entrances, the boarding operation
in tube stations are at the same level of the bus floors, thus producing a “metro” effect characterized by its
fastness and easiness of embarking (Pic.14). To regulate the flow in and out the tubes there are doors
provided with turnstiles, while sometimes at the exits there are no turnstiles. The tubes have lifting platforms
for users with mobility problems (Pic.16). The boarding operation at every tube stop is efficient: 15 to 19
seconds per stop (Goodman et al, 2007), this is however an average, as through observation the author noted
that it can take much longer or a shorter time.
Mr. Ceneviva, underlined how “everything was planned in order to reproduce the metro-effect, with the
platform and boarding level, as that is the most important feature both for an underground system, and for
Curitiba”.
There are several different lines operating in Curitiba that can be better observed enlarging by Pic.14:
Picture 16. Boarding on a biarticulated bus in Curitiba. Source: The Author a) The direct line (ligeirinho); this line normally runs on the fast speed road of the ternary system, parallel to
the structural corridors, thus shares the road with private vehicles. It uses the tube stations for the
boarding/disembarking operation, which happens through three wide doors, two for exiting and one for
embarking. It stops at fewer points located at long intervals (2-4 km), avoiding boarding time loss, thus
diminishing the time to reach a destination; the lines are normally used by people who have to travel long

Andrea Cinquina Lumes Thesis 2008
19
distances inside the city. The direct routes, with an average speed of 30km/h, are represented by the grey-
coloured lines in Pic.14, as the color of its busses.
b) The express line (expressa) represents the main trunk of the system; today it consists of biarticulated
busses that operate in the reserved lanes of the structural corridors. These busses, which can transport a high
number of users (270), are characterized by five wide doors and three coaches connected between them
through a rotating system that allows the busses to turn without occupy more than one lane.
Picture 17. Elevator for people with disabilities at a tube stop. Sourcees: The author. Picture 18.Tube-stations. As the direct line, it uses tube stations for boarding operation (Pic.15). This line is the one that works more as
a metro system, because it has the same features of a metro system as already remarked by Mr. Ceneviva. Its
average speed is 20 km/h.
The line, that is perhaps the most distinctive element of the city transport system today, is connected by the
feeder lines and the inter-districts routes. In Pic.14 it is represented with the red lines, as the colour of its
busses.
Picture 19. Biarticulated bus in Curitiba. Source: The author c) The feeder (alimentador) line shares the road with the private vehicles; links the low-density zones with
the terminals where people can switch lines, without occurring any extra cost; therefore this line “feeds” the
transport system; in Pic.14 the color that distinguishes the feeder line is orange, as the colour of its busses.
There is also the metropolitan feeder line that, as suggested by the name itself, operates in the metropolitan-
peripheral area, and in the Pic.14 can be recognized by the yellow lines.
d) The inter-districts (interbairros) routes connect different areas of the city or different terminals without
driving through the city center, thus operating in a concentric way. There are six different inter-districts lines,
Andrea Cinquina Lumes Thesis 2008
20
some run both clockwise and counter clockwise. In Pic.14 the line is represented by green color, same as the
busses color.
Then there are other minor routes, such as:
e) Troncal lines that connect the terminals with the city center and are typified by yellow-coloured busses.
f) Yellow busses that are used also by the conventional line (convencionais), which links various districts to
the city center, but unlike the Troncal, they do not stop in the terminals.
g) The circular center line (Circular centro), which operates with micro-busses and connects only different
stops located exclusively in the city center, hence having a different ticketing system.
There are also special lines, like inter-hospital that connect the principal clinics and hospitals, the tourism
line that, as the name suggests, has a tourist function (and runs on alcohol), scholar line and “sites” line,
which is a line reserved for people with disabilities.
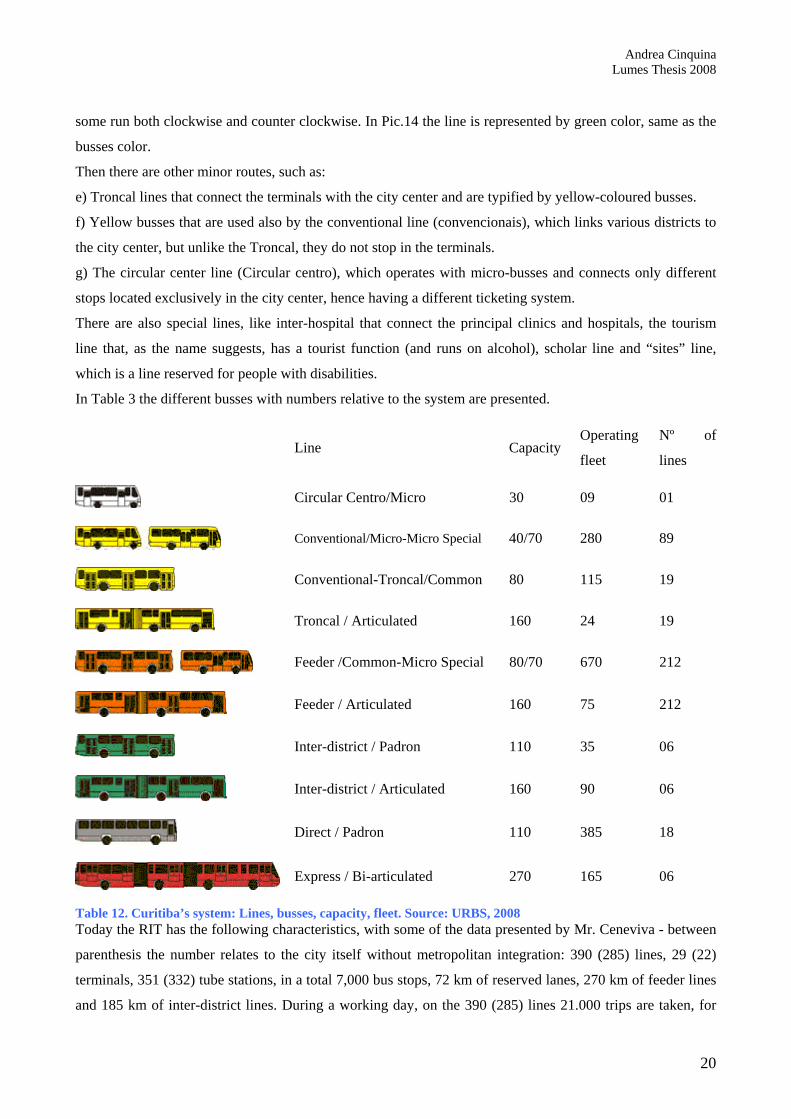
In Table 3 the different busses with numbers relative to the system are presented.
Table 12. Curitiba’s system: Lines, busses, capacity, fleet. Source: URBS, 2008 Today the RIT has the following characteristics, with some of the data presented by Mr. Ceneviva - between
parenthesis the number relates to the city itself without metropolitan integration: 390 (285) lines, 29 (22)
terminals, 351 (332) tube stations, in a total 7,000 bus stops, 72 km of reserved lanes, 270 km of feeder lines
and 185 km of inter-district lines. During a working day, on the 390 (285) lines 21.000 trips are taken, for
Line Capacity Operating
fleet
Nº of
lines
Circular Centro/Micro 30 09 01
Conventional/Micro-Micro Special 40/70 280 89
Conventional-Troncal/Common 80 115 19
Troncal / Articulated 160 24 19
Feeder /Common-Micro Special 80/70 670 212
Feeder / Articulated 160 75 212
Inter-district / Padron 110 35 06
Inter-district / Articulated 160 90 06
Direct / Padron 110 385 18
Express / Bi-articulated 270 165 06

Andrea Cinquina Lumes Thesis 2008
21
483.000 driven km; there are 2,260,000 (1,810,000) passengers transported, and 1,045,000 (850,000) paying
passengers daily – discrepancy between passengers transported and payers due to the opportunity to catch
two or more different rides with the same ticket (URBS, 2008).
5 Future plans of the city The municipality is moving forward so as to give better accessibility and service to its citizens. The City Hall
is investing more than R$300 millions in infrastructures regarding transport system (Curitiba in English,
2008) and in particular the maintenance, enlargement and upgrading of terminals and tube stations because
some of them have already reached their saturation and increasing the accessibility for persons with mobility
problems. The main projects for the “ligeirao” and “linha verde”- green line (URBS, 2007) and the
renovation of the fleet – use private capital, although under established conditions of URBS, but as Ms
Soares emphasized it is invoiced to the politicians as if they were paying the costs.
5.1 Ligeirao
The “ligeirao”, that is the augmentation of the “ligeirinho”(the direct line bus), will run on the same reserved
lanes of the express routes, but the “ligeirao” will be accessible only at the terminals thus serving people that
do not need to stop at intermediate stations; it will overtake the bi-articulated busses while they are boarding.
To solve the problem regarding overtaking the bi-articulated, some of the tube stations will be relocated a
few meters before or after, because the actual dislocation (one in front of the other) would not enable
overtaking if two biarticulated busses from opposite directions stop at the same time. This suggestion was
also proposed by Mr. Lerner during his interview, but with the idea of letting one bi-articulated bus which
should have a stop every four tubes (2,000 meters), overtakes the normal bi-articulated that stops every 500
meters, so as to solve problems regarding carrying capacity in the long term.
The work will start this year (2008) with the Boqueirao axes first - diminishing the travel time in the axes
from 33 to 18 minutes (URBS, 2008), and the axes North-South after.
While restructuring the reserved lanes a new 22 km cycling lane will be created, flowing in both directions; it
is not going to be an isolated case because along the Green line a 10 Km cycling lane will also be created
(ibid.). The perplexity regarding the real connection to jobs accessibility and bike lanes expressed before in
the paper finds the same scepticism here, as the two lanes will be structured on the same line as the biking
lanes constructed before – basically connecting parks (URBS, 2007); however the city will implement a 15
km bike lane at CIC, in a project negotiated with the Interamerican Bank for Development, thus starting to
give to workers the opportunity to use bikes as a real alternative mean of transport when commuting (ibid.).
The financial resources in order to implement those projects came from different sources; R$105 million
from the “French Development Agency”, R$67 million from the Interamerican Bank for Development and
the Municipality of Curitiba jointly, R$8 million from the Municipality by itself, R$8,5 million from the
Andrea Cinquina Lumes Thesis 2008
22
“Urban Mobility Program of Ministry of Cities” and R$ 14,5 million from the World Bank together with the
Municipality for the two bike lanes – the last is a grant to stimulate environmental preservation and non-
motorized transportation (ibid.).
5.2 Green line
Considered as the infrastructure with the higher impact on the social and economical development of the city
since the establishment of the CIC during the 70s (URBS, 2008), the Green Line created by the conversion
of highway BR116, became the sixth axis of Curitiba, allowing the running of new public lines.
This project is a consequence of the city growth, with a higher number of inhabitants moving east and south
of the BR116 due to the lower cost of land and houses; the highway, once built to unite, is now cutting the
city in half, having the opposite role it was built for (Linha Verde,2008).
The new axes, which as mentioned before will replace the BR116 that now has a transit of 45.000 vehicles
per day, will pass through 23 areas of the city with a total population of 287.000 inhabitants as Almeida said.
Ms. Daher remarked how this conversion was possible only after Mr. Lerner, while Governor of Paranà,
pushed for a transfer of the administrative concession of the highway from a federal level to a local level.
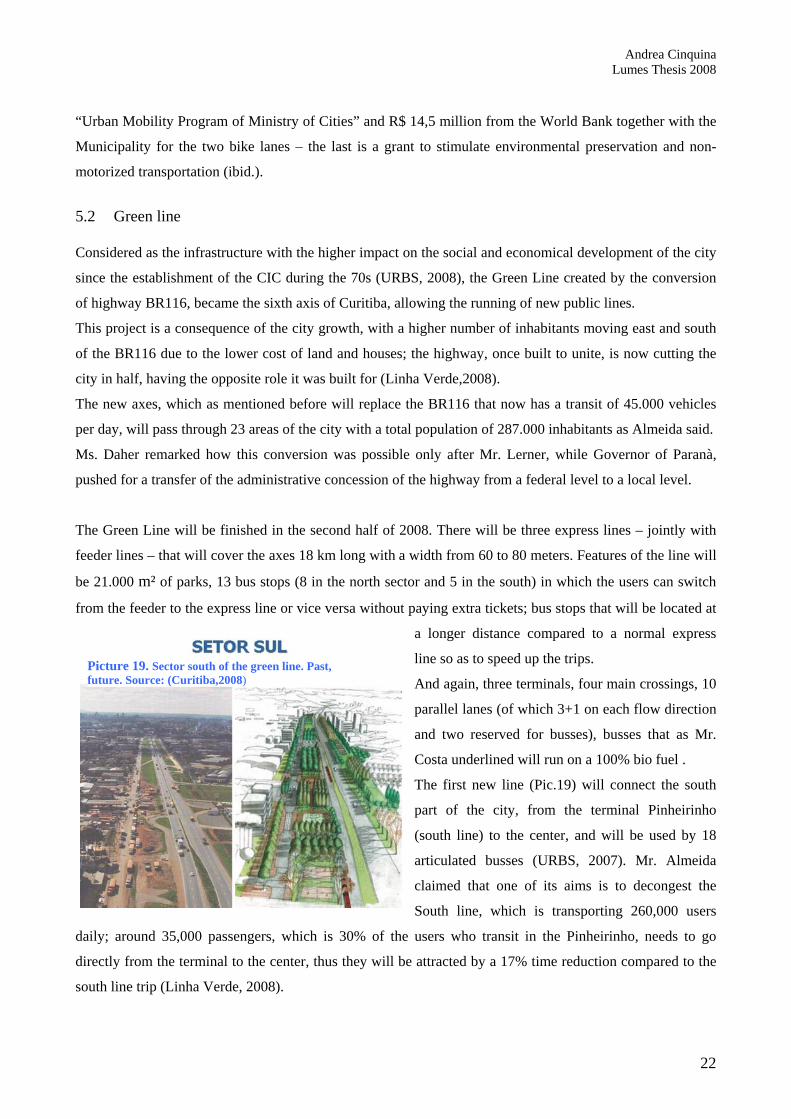
The Green Line will be finished in the second half of 2008. There will be three express lines – jointly with
feeder lines – that will cover the axes 18 km long with a width from 60 to 80 meters. Features of the line will
be 21.000 m² of parks, 13 bus stops (8 in the north sector and 5 in the south) in which the users can switch
from the feeder to the express line or vice versa without paying extra tickets; bus stops that will be located at
a longer distance compared to a normal express
line so as to speed up the trips.
And again, three terminals, four main crossings, 10
parallel lanes (of which 3+1 on each flow direction
and two reserved for busses), busses that as Mr.
Costa underlined will run on a 100% bio fuel .
The first new line (Pic.19) will connect the south
part of the city, from the terminal Pinheirinho
(south line) to the center, and will be used by 18
articulated busses (URBS, 2007). Mr. Almeida
claimed that one of its aims is to decongest the
South line, which is transporting 260,000 users
daily; around 35,000 passengers, which is 30% of the users who transit in the Pinheirinho, needs to go
directly from the terminal to the center, thus they will be attracted by a 17% time reduction compared to the
south line trip (Linha Verde, 2008).
Picture 19. Sector south of the green line. Past, future. Source: (Curitiba,2008)

Andrea Cinquina Lumes Thesis 2008
23
The articulated busses will be replaced over time by bi-articulated ones; also is matter of study how to let the
people switch from one direction flow to another, a transfer that is now possible only in the terminals. The
idea of implementing the green lines has three major reasons as noticed by Mr. Almeida; to decongest the
south axes, to increase the economy of the area so as it develops better, and the fact that since 2002 a ring
road has been under construction that will encircle the city so as to create a fast transport from the north to
the south that does not cross Curitiba, so the BR116 is no longer needed. Ms. Daher said that houses will be
constructed as well along the corridors, so as to subsidize the system that otherwise would be working only
for workers during the peak hours, but not with the same population density of the other axes; as stressed by
Mr. Almeida there will be bigger buildings next to the bus stops, and smaller ones along the line. For Ms.
Daher improving the south area will mean less need to travel for the people, who live there, and Ms. Soares
declared that to the south end of the line garages and workshops will be created for the transport system.
Beto Richa, Mayor of Curitiba, commented that the new structural corridor is called “green” not randomly,
but it is the outcome of the deep role the environment had in the planning of the axes (URBS, 2007).
The green line will cost R$121 million and is financed jointly by the Interamerican Bank for Development
and the municipality of the city.
5.3 Metro
The city is studying also the possibility of implementing a Metro line, and the study project is financed with
R$2 million by the “Companhia Brasileira de Trens Urbanos”(ibid.).
As stated by Mr. Almeida contrary to a real underground metro, the system that is being studied, called “cut
and cover”, will not necessitate a deeper digging in the soil, but a more superficial one (6,5 m depth; 8,5 m
width), thus an average dig will cost 10 times less than in a normal tunnel; when it is needed to
create/enlarge a metro system, in Curitiba it will cost only US$40-50 million instead of US$100-120 that
cities like Sao Paulo invested.
It will replace 22 km of North-South line, with 22 stops, and in the beginning it is expected a 20% increase in
users - more than 400,000 per day (URBS, 2008).
Mr. Almeida claimed that it is true that the costs are cheaper with busses, especially because they have less
structural costs as the infrastructure already exists, but the metro line will provide more supply for the users;
the municipality will get back some money with the elimination of the previous lines who served the area, in
fact bi-articulated or ligeirinhos will not run anymore on the surface, but biking lanes, parks and pedestrian
roads, a carfree zone that will give much more value to the area will be created. The metro system will be
also be 50% cheaper than it should cost, as it will be created under the already existing axes, will not need
land expropriation and it will use funding from Banco Federal and Interamerican Bank for Development
(IPPUC, 2008b). The total project is estimated to cost R$ 700 million (PSDB-PR, 2007)
As pointed out by Mr. Almeida, the prices of the busses are now three times less than that of trains, so if the
bi-articulated costs R$1 million and works for 12 years, trains that last three times longer have to be

Andrea Cinquina Lumes Thesis 2008
24
purchased, so to amortize the costs. Mr. Almeida remarked how today the bus system is financing itself with
the single ticket that allows the more costly lines covered by the cheaper ones, but in the new metro idea the
users will pay R$2.1 instead of R$1.9; users will not pay the physical cost of the new line, but the service,
because the structural costs are paid by the municipality.
Other advantages of the metro is that might attract many current drivers,, as emerged by the interviews, thus
a future smaller use of cars; less private vehicles on the streets will lead to an higher safety levels for the
citizens, both due to less accidents and for their health (URBS,2008).
Mr. Almeida asserted that Curitiba, as with the BRT, will be the first city in doing this, but not totally
exclusive because a similar system is already present in Madrid. However, for Mr.Ceneviva, this project is
not indispensable, but is more a dream; what is certain is that what is needed is an alternative to cars, but the
priority can still be given to busses.
6 Theoretical framework 6.1 Defining sustainable transport
There are many definitions of a sustainable transport system in the literature – as with the definition of
sustainability itself; between academics there is a vast disagreement resulting in several different ways to
indicate sustainable transport, therefore there is no complete agreement on the connotation of the expression
(Black, 2000).
For many researchers it has a predominant environmental nature, as for the OECD that defines it directly as
“environmentally sustainable transport”, but for others it is more about offering to next generations at least
the same choices as we have (ibid.). Black (2000:141) defined sustainable transport as “the satisfaction of
current transport needs without jeopardizing the ability of future generations to meet their needs”, definition
that is recalling the more famous Brundtland (1987) definition on sustainable development as “the
development that meets the needs of the present without compromising the ability of future generations to
meet their own needs”.
As a result, the features of a sustainable transport system according to Black are: running on a fuel that will
have sufficient stock for the future, emitting the least pollution possible from the usage of that fuel, cause the
lowesy number of accidents with fatalities and injuries, and lead to controllable congestion (Black, 2000).
Perman et al (1999) classified the various definitions into six main categories attributable to the different
point of view of sustainability they focus on, but here more confined definitions will be used.
In the opinion of Mr. Ceneviva – President of IPPUC when RIT was implemented, and former President of
URBS as well – when discussing the urban transport system in Curitiba, the sustainability of the system itself
was seen as “a transport system that can economically sustain itself, without recurring investments,
minimizing the environmental impact and to be accessible for everyone”. Actually he specified how the
concept of sustainability was not developed at that time as it is now, but the general idea was already
spreading around as it can be seen by the system’s principles.

Andrea Cinquina Lumes Thesis 2008
25
A common feature to almost all the range of definitions is that sustainable transport should integrate, through
planning, various aims such as long-term economic efficiency, equity, environmental and social development
(Litman, 1999); hence it can be said that a sustainable transport system should not only base itself on the
resources it uses, but the social and the economical aspects are also part of it.
As mentioned before, equity and accessibility are integral parts of a sustainable transportation system, so it
should focus on accessibility, serving at the same time different classes of the population, such as women,
men, children, people with disabilities, pregnant women, elderly, poor, etc.; to reach all the population of the
area, giving to the people who live in a district the same opportunities as the people living in other districts
for reaching jobs, homes and amenities, also promote integration of every area, as peripheral zones, in the
city, thus avoiding possible risks of marginalization (Vivier,1999).
A sustainable transport system should also consider intermodal transport, encouraging alternative ways of
transportation such as biking or walking, generating well-balanced systems that make use of each mode “for
what it does best” (Litman et al.: 335).
From the literature reviewed, this paper has developed its own definition for a sustainable transport system;
as one that, through the implementation of a plan that integrates land use and public transport, should be
physically and economically accessible to everyone giving to all the citizens the same opportunities,
guarantee an adequate carrying capacity, be self-sustaining, effective, reduce the number of accident,
encourage the use of intermodal non-motorized transport instead of private motorized vehicles, run on fuel
that will have sufficient stock for the future and emitting less pollutants in the entire phase of its usage.
The implementation of a sustainable transport system requires a well-planned process of policy making.
There are two considerable distinctions when developing a policy: it can be done by taking into
consideration the circumstances at the present time or considering future aims. In the first case are made
predictions from the current situation, so to know if the actual trend may be rectified; in the second, once the
goals to achieve are set, the policy makers start to work backwards from those aims to the present and start
developing policies in order to achieve the targets (OECD,2002). The main difference between the two
approaches is that with the first one what is necessary is done in order to avoid a “unwanted future”, and with
the second one what is needed is done in order to reach a ”wanted future” (ibid.). They can also be used
together, but often the transport policy-makers give more importance to the present situation than achieving
the long-term goals (ibid.), and basing their policies exclusively on short-term solutions. A clear example is
the building of wider roads in order to solve congestion issues: with the under pricing of car-driving, it is not
a solution as it induces the future car drivers to fill any additional space in time (Litman, 1999).
In order to move from an unsustainable to a more sustainable system changes in short (so to have immediate
results to show) medium and long-term policies are needed (Colvile et al.,2004), changes regarding the
energy used, the modes of transport used and other features that will be discuss after in the paper.

Andrea Cinquina Lumes Thesis 2008
26
6.2 The case of Curitiba
Curitiba is cited in many articles and books by several authors; its public transport has been abundantly
described, as well as its land use and recycling policies and so on. When it comes to its sustainability the data
available on its economic, social and environmental impacts are much more limited.
Garrick et al. (2006) assessed the sustainability through the five tenants of smart transportation: using
broadly defined goals; planning for desired outcomes; developing solutions for maximum accessibility;
giving priority to cleaner, cheaper, and efficient modes of travel; diversity of modes for different needs. But
the analysis takes place inside a bigger discourse about the total sustainability of the city.
Rabinovitch (1995) pointed out the innovative approach to transportation that the city had, giving particular
relevance to the policies adopted and suggesting some principles that come out from his analysis as possible
guidelines for reproducibility. Blaviss (2004) used Curitiba and Bogotà as perfect models of how to make a
transport system more sustainable, identifying the successful criteria of these two cities; thus she gave a set
of Latin American cities that are more and less prepared to adopt those guidelines in order to replicate their
success. Campbell (2006) discussed only its structure as a relevant feature in order to achieve sustainability
in the city. This paper analyzes the sustainability of the public system by reprocessing and extending the
Adielsson & Friberg (2001) case study about the sustainability of the Curitiba transport system, that was
referred to by the UN Habitat guidelines, as the author of the this paper thought it include a set of indicators
that best suited the data collected by him.
6.3 Habitat II United Nations Conference
This paper uses, as the main reference for a sustainable public transport system, the guidelines developed in
the UN Habitat Agenda, drafted during the Habitat II United Nation Conference in Istanbul, Turkey, June
1996; during the conference the city of Curitiba and its public transport system were represented with its bi-
articulated busses. In the 4th chapter of the Istanbul Declaration on Human Settlements, section c, 7th
paragraph, recommendations for sustainable transport and communications systems are considered. These
recommendations take a broader perspective on transport in general; this paper applied the relevant criteria
from the recommendations and applied it to public transport systems. As came out form the document, the
transport sector represents a major concern to the United Nation Human Settlements Program because it is
heavily based on fossil fuels, it makes a large use of a considerable amount of energy and land, creates
externalities such as traffic, accidents and pollution; nonetheless the increase in the accessibility, safety,
affordability and efficiency of a public transport system can reduce the problems of many unprivileged social
class as poor, elderly, disabled people, woman, children and youth (UN, 1996).
At subsection 151 of the 7th paragraph seven main principles were reported that the municipalities which
want to reach a sustainable public transportation should accomplish through working jointly with all
stakeholders.

Andrea Cinquina Lumes Thesis 2008
27
Those main features are considered in the following subsections; the text of the Habitat Agenda is presented
and analyzed against the extent to which the city of Curitiba applied the seven points in its policies.
7 Analysis and Discussion In this section will be analyzed the sustainability of the present public transport system in Curitiba: in order
to achieve the paper’s definition of sustainability, the UN Habitat Agenda’s recommendations will be used to
measure and discuss to what extent Curitiba matches the criteria. In the second subsection the author will
also discuss and highlight what he considers the main features in order to move toward a sustainable urban
public transport system.
7.1 Habitat II United Nation Conference framework applied to Curitiba
7.1.1 Support an integrated policy approach Support an integrated transport policy approach that explores the full array of technical and management options and pays due attention to the needs of all population groups, especially those whose mobility is constrained because of disability, age, poverty or any other factor. As described earlier, Curitiba since the second half of the 60s, integrated transport policy successfully in its
urban decisions; the execution of the master plan with the creation of the structural corridors, directly
connected with the implementation of a new mass transit system, clearly shows that the municipality
supported the integration of the transport policy in the decision-making process.
The poorer classes of the population, that normally in Curitiba live in the peripheral areas, are definitely
considered by the municipality with the implementation of the single fare in the entire metropolitan area,
(IPPUC, 2008b). The single fare allows to switch lines without buying extra tickets, thus the inhabitants,
regardless of where they live, can reach the same location with the same cost (Rabinovitch et al., 1995); it
can be said that they are indirectly subsidized by the system (IPPUC, 2008b) as they are paying the same
price for travelling longer distances than the wealthier classes that live in more central areas and presumably
travel shorter distances. This gives to all citizens the same accessibility opportunity to the entire city area.
Thus regarding same services and benefits; this is certainly a positive point regarding the sustainability of the
Curitiba public transport system.
There are several classes that are exempt from paying the bus tickets, such as people older than 65 years or
people with disabilities (ibid.). Also, the municipality gives the possibility to use public transportation even
to the low income classes that cannot afford it, as it can be seen by the implementation of several policies
regarding waste management; for example the city exchanged the recycled waste collected by people with
food, books and bus tickets (Garrick et al., 2006). The Curitiba bus system and the policies implemented by
the city stimulate a higher sense of community; during observations the author saw a person begging for
money on the bus, and when he was stepping out of the bus this person saw a screw in the upper part of the
door that was loose, and so he started screwing it in with a coin. This shows that even the poor feel a sense of
commitment and responsibility to help take care of the public transport system.
Andrea Cinquina Lumes Thesis 2008
28
The municipality really cares about paying attention to the entire population. In many tubes and busses there
is a recorded voice message which advises users that elderly, people with disabilities and pregnant women
must always be privileged while sitting on the busses or in the boarding/exiting procedures, and a great
majority of the users respect this requirement.
The tube stations make for more comfortable and much faster access for people in wheelchairs or with
mobility problems than other bus systems commonly in use all around the world, mainly because the
platform is on the same level, easily reached by elevators in the tubes (Pic.16); also Mr. Ceneviva
emphasized as 90% of routes in Curitiba use the tube stations, people with disabilities almost have total
accessibility to the system. There are also special busses serving people with disabilities, but for the normal
busses that do not board in tubes, the problems are those common to many busses worldwide; mainly the
high entrance stairs.
However a potential problem can be the narrow tube entrances and this can create some operational
problems and avoidable delays. When the tubes are crowded it is hard to see the people respecting the “right
of way” mentioned above. The very last day the author spent in Curitiba, on the way to the airport, he was in
a really crowded tube station with hand luggage and a regular suitcase and the boarding process resulted to
be really difficult; from entering the narrowed entrance of the tube with the luggage (the author had to enter
from the turnstiles while having to literally “push” the baggage amongst the crowd from the entrance
reserved for people with disabilities) to reach the boarding doors in order to take the bus. There were many
people waiting for other lines, because it was an ordinary (10x3meters tube) serving more lines, and some of
the services were late that morning. It is hard to imagine what a pregnant woman, elderly or people with
kinetic difficulties could have done in this case. This problem could be easily solved by enlarging the
entrances.
One thing that clearly emerges from riding a bus in Curitiba is the way of driving (actually in the same line
as other cities as Rio de Janeiro or Sao Paulo); slamming on the brakes and quick acceleration are, many
times, ordinary components of the ride.
More than once the author witnessed incredible scenes coming from these issues. Once a young man in a
wheelchair was riding in the reserved seat-free area of the bus (those areas sometimes featured by pull-out
seats) when a pregnant woman entered with another kid in her arms; in the meanwhile she was (already
struggling) pulling out the seat, the driver made an extremely rough acceleration, so that the pregnant girl
with her kid fell right over the man in the wheelchair.
In another occasion, due to violent braking, an old man that was standing on the corridor completely lost his
balance, and the author grabbed him before falling on the floor; for sure he would have been seriously hurt
from hitting the ground with such force on his back side.

Andrea Cinquina Lumes Thesis 2008
29
Normally the reactions of the users to these episodes are simple mumbles or just a laugh, because they are
seen as normal modus operandi of the busses and their bus drivers. For many of the interviewees and the
people which the author talked to, this did not represent an issue worth mentioning; many times the people
comments were, “Did you ever ride a bus in Rio? They are the crazy ones!”, not being aware that it is in their
rights to receive a better service. It is certainly an attitude that should be changed.
The author has been told by users that there are persons among them which complain to the drivers, but they
are frequently vigorously scolded by the drivers: the drivers blame URBS for the impossibility of matching
the timetables given to them, thus arising the necessity to speed. The URBS was questioned through Ms
Soares about this issue and the possibility of more flexible timetables for the companies, but she replied that
the timetables are feasible enough to not make them speed. Users should have the right to participate in these
decisions, to show their opinions as they are also stakeholders; this would increase the sustainability of the
system.
Conclusion
It can be said that the public transport system in Curitiba fits the first criterion proposed by the UN,
particularly paying attention to the needs of its citizens and its more disadvantaged class.
Although problems regarding the quality of drivers emerged, and this could be addressed with educational
seminars, better driving training and integrating the users in the achievement of an agreement on more
flexible timetables between the private bus companies and URBS.
7.1.2 Coordinate land use and transport planning Coordinate land use and transport planning in order to encourage spatial settlement patterns that facilitate access to such basic necessities as workplaces, schools, health care, places of worship, goods and services, and leisure, thereby reducing the need to travel; The city of Curitiba, since the 60s-70s has aimed at coordinating land-use, road system and transport
planning while developing its policies; the Curitiba Master Plan that addressed the city to a linear model of
growth (IPPUC, 2008), represented a key moment under this viewpoint (Rabinovitch et al., 1995). The city
center should not be the only area in which develop the main services; the conception of the five structural
corridors had as its main reason to lead the settlement patterns of the city, in order to concentrate the daily
activities, services and necessities of its population along the five main avenues – in this way houses, public
transportation, commerce, schools, hospitals, workplaces, gyms and various amenities are decentralized and
well spread all over the city, thus limiting the need of people to travel and giving them also better
accessibility to any service (ibid.). Citizens of Curitiba have increased their access to work, housing,
recreation and services thanking to the development of the transport system (ibid.) and almost 70% of
inhabitants go to work by bus (Goodman et al.,2007), remarking the sustainability of the public transport
under the accessibility aspect.
The idea of the structural corridors went side by side with the implementation of a zoning scheme. The
peculiarities of the zoning laws was to decrease the housing density as the distance from the main arteries

Andrea Cinquina Lumes Thesis 2008
30
was getting longer, and increase it next to the axes (Macedo, 2004). In between 1970 and 1978, Curitiba‘s
population grew by 73%, but by 120% in proximity of the structural corridors (Demery,2004); in 1992
around 40% of the citizens lived not farther than three blocks away from the five main corridors (FTA,1998).
In 1995, 75% of inhabitants were living on 41% of the city’s land (Rabinovitch, 2005).
As Mr. Almeida stated, today almost 10% (Pic.13, 14) of the city’s population is living in four of the five
structural corridors, in this way divided: 40,000 in the north corridor, 30,000 in the west, and 100,000 in the
southeast. In this data the 5th corridor “Boqueirao” is not considered; the data only takes into account the
people who actually live on the main corridors and not even one block away from them.
The series of laws on land use, that allows a defined proportion between ground space and plot size, and the
proportion must decrease with the decrease to accessibility to public transportation (Rabinovitch et al., 1995)
show clearly the willingness to achieve the coordination among land use and transport system. Also ground
and first floors of the buildings located on the corridors are reserved to services, economic and financial
activities (IPPUC, 2008). Combining high density with presence of services and accessibility to the public
transport system improves the sustainability of the Curitiba public transport.
When interviewing Mr.Lerner, he told me that one of the five points in order to achieve a sustainable city, is
to “live closer to your work, or bring your work closer to your home”, so as to reduce the necessity of
commuting. One of the guidelines his team was following while planning the city (and trying to make it
sustainable) was to make the people use their cars less and to let the city be an “integrated structure for
living and working” – uma structura de vida e trabalho junto: “as long as there are these two conditions
the transport system can go to infinity”.
Many of the people interviewed did not think that in order to have a higher quality life they needed to leave
their district, to go to the city center or other areas, because they have almost everything they need or want
next to where they live (many times nightlife activities were an exception).
One of the keywords of the IPPUC for the future, as declared by Ms. Vallicelli, is “re-adensamento”, which
does not have any direct translation but means to re-increase population density; municipalities such as
Colombo or San Jose Pinhais, situated respectively in the northeast and southeast conurbation of the city, are
increasingly getting bigger. Mr. Almeida commented that the growing rate of the metropolitan area is higher
than in the city, because the people who arrive in Curitiba live in the surrounding municipalities as the city
extension is already limited and there is not so much available space, so the prices in the city are higher; for
Ms Vallicelli if 20,000 new low-income families move to Curitiba every year, the municipality will have
serious trouble in finding them homes. Thus in the last decades people are commuting more in order to work;
living in peripheral areas and working in the CIC it is a very common situation among many families in
Curitiba – CIC generates one fifth of the jobs in the city (Rabinovitch, 1995) – and the outcome is that the
south axis (the one that goes to the CIC) is the axis which results to have the more crowded lines, sometimes

Andrea Cinquina Lumes Thesis 2008
31
overshooting its carrying capacity in the peak hours – by this it is meant that users cannot get on the bus
anymore and must wait for the next one.
Conclusion
The coordination of land use and transport system is the cornerstone of the cities good public transport and
the policy they implemented the best. The implementation of the Master Plan, with the development of the
five axis and the zoning laws gave its citizens the possibility to better access to their daily services and
needs, fitting entirely the criterion fixed by the UN Habitat. Although the metropolitan area is getting bigger
and it might encourage the need for travel creating a threat to the system for the long-term, it is in the
municipality’s agenda to increase services in the areas which need them the most. The green line represents
an example of re-increase population density in the city.
7.1.3 Encourage the combination of modes of transport Encourage the use of an optimal combination of modes of transport, including walking, cycling and private and public means of transportation, through appropriate pricing, spatial settlement policies and regulatory measures; The physical outline of the city with its corridors encourage naturally an intermodal transport system; above
all walking because of the high density next to the axis and the pedestrian area in the city center, sites which
almost all the main public lines are accessible. During the last years the municipality began to give people
better opportunities to ride bicycles inside the city, creating a net of 120 km of bike (bicycle) roads (IPPUC,
2008); however, no particular signs of the municipality encouraging the use of alternative modes of
transport, like bikes, were observed. The author actually saw very few people riding bikes in Curitiba; the
bike lanes connect principally the parks of the city (Adielsson & Friberg, 2001), while not many cycling
roads are placed along the major streets and routes covered by the people. The bike lanes hardly give people
the opportunity to use them to reach jobs, but just to use them for personal pleasure.
A negative impact on the spreading of cycling might depend also on the big distances in the city, but this
cannot explain the lack of biking; bicycles can always be used as integration to the bus system, seeing them
as “feeder” of the system (the same function as the busses), becoming a complementary part of the public
transport system. Very few bicycle-parking lots were observed next the bus stops or terminals to facilitate
this intermodal system. However, considering the way of driving of the Curitibanos, bicycling on roads can
be really dangerous; for those citizens who would like to bike more this might have a negative impact as well
as the long distances. The lack of reserved bike lanes along the main roads covered by work-commuters
bring to the use the bus reserved lanes by many bikers, with all the subsequent safety issues and with a
possible slow-down of the bus system. The encouragement of intermodal transport should really be improved
in order to achieve a sustainable system, especially promoting more environmentally friendly modes such as
walking and cycling.
After spending three months in Curitiba and talking to many people, the author has the opinion that it will
not be easy for the Curitibanos to understand bicycles as a normal, alternative mean of transportation instead
of a simple hobby for the weekend. It was also understood that the bus fare is considered fair enough for the

Andrea Cinquina Lumes Thesis 2008
32
services they received; people who live in the peripheral areas (in Brazil are normally the classes that should
have bigger economic concerns) are happy with it because they think that, at the end of the day, they are
advantaged by the single fare policy, having the opportunity to reach almost every part of the city and its
conurbation only paying once. Though they have some problems in comprehending that the single fare is
indirectly subsidizing them, they fully understand that they receive an advantage, and this is a strong point
for the sustainability of the system.
Mr. Almeida stressed that the population is growing; the users are both getting richer so as to buy and use a
car, and getting poorer so as not to afford the public system anymore; the municipality cannot and would not
lose the low-income users, so pays notable attention to the economical accessibility of the tickets.
In Table 4 are the prices of fares in R1$(Brazilian Reais) among the most important Brazilian cities. São Paulo Brasilia Rio de Janeiro Belo Horizonte Salvador 2.3 R$ - 1,88 € 2,00 R$ - 0,77 € 2,00 R$ - 0,77 € 2,00 R$ - 0,77 € 2,00 R$ - 0,77 € Porto Alegre Florianópolis Curitiba Fortaleza Recife 2,00 R$ - 0,77 € 1,90 R$ - 0.73 € 1,90 R$ - 0.73 € 1,60 R$ - 0.61 € 1,60 R$ - 0,61 €
Table 13. Fares in the most important Brazilians capitals. Source: URBS, 2008 The fare composition in Curitiba consists: 70% consisting in operational costs, mainly costs of personnel
(57%), fuel (28%), accessories and pieces (11%); 13% by capital costs (39% remuneration and 61%
depreciation of the capital invested); 8% for administration costs; 5% for the tributaries costs; 4% for the
costs of the managerial fund (URBS, 2008). The fares entirely sustain the system and match with its
economic sustainability.
There are no regulatory measures that normalize the use of private vehicles, and also no car parking was
observed next to the bus terminals, both in central and more peripheral areas, so as to promote an intermodal
transport. Lack of regulatory measures for private vehicles such as tolls for entering in determined areas of
the city or restrictions to the use of cars during certain hours of the day time, seems to be the weak aspect of
the transport policies of Curitiba. Also some people the author talked to resulted not to be particularly aware
or worried about the issues linked with the overuse of cars. For the long-term sustainability this lack of
regulatory measures and awareness definitely cannot be seen as a positive aspect.
Conclusions
The affordable fares appropriate to the service offered and the spatial settlement of the city naturally
encourages the presence of intermodal transport strengthening the sustainability of the system, but the
municipality is not doing enough to support it. Although bike lanes are increasing they are not planned so as
to encourage the combination of modes of transport; promotion of intermodal transport that is lacking thus
jeopardizing the long term sustainability.
7.1.4 Promote disincentive measures that discourage private motorized traffic Promote and implement disincentive measures that discourage the increasing growth of private motorized traffic and reduce congestion, which is damaging environmentally, economically and socially, and to human health and safety, through pricing, traffic regulation, parking and land-use planning and traffic abatement 1 R$ 1 = € 0,38 (exchange rate 2008, May 25th, http://finance.yahoo.com)

Andrea Cinquina Lumes Thesis 2008
33
methods, and by providing or encouraging effective alternative transport methods, particularly to the most congested areas; Integrating land use with transport system had as one of the main aims to guide the city development along
the five corridors, decentralizing all the services, thus avoiding congesting the central area (IPPUC, 2008); at
the same time it created both an attractive alternative mode of transport and avoided the formation of jam-
packed areas - the public transport system can be considered in all effects as an alternative transport method
to the private motorized traffic.
The average speed of the public transport is 20 km/h for the biarticulated, 30 km/h for direct lines and 18
km/h for conventional lines, that makes the system quite effective alternative mode of transport compared to
the Metropolitan Transportation Authority subway system of New York, which average speed is around 32
km/h, or other cities in Brazil which busses at peak hours have an average speed of 10 km/h (Friberg, 2000).
But, in order to discourage the increasing growth of the private motorized transport, alternative means of
transport are not encouraged as they should, and for the author it can not be considered a sustainable system
that promotes as the only alternative an option based on fossil fuels.
The high prices of the public parking spaces are a disincentive measure for the private motorization. It is not
common to see municipally owned parking lots in the central area (Goodman et al,2007); most of the time
the parking available is only found on streets next to the sidewalks, and is not located on every street – it has
to be said that structures as universities or shopping malls have their own parking lots. The municipal pay-
parking lots and spaces (they have a plate with “estar” wrote on it) cost R$1 per hour all over the city during
the day time (Bus ticket is R$1, 90), and for free during the night – but in the peripheral areas the number of
“estars” are lower than the central areas. The parking is cheaper than many other cities as Belo Horizonte
(R$ 2, 30) or São Paulo (R$ 1, 80) (URBS, 2008).
However, if the lack of municipal parking spaces in the city center can represent a disincentive for the people
who want to reach there with private cars, it is not really effective, because there is a high number of private
parking lots, which are also expensive: they can cost normally from R$2 to R$7 during the night.
The fact is that, due to the high level of criminality, it is always advisable to leave private vehicles in places
with surveillance, in particular during the night-time; even in free public lots, car drivers prudently pay
people that abusively do surveillance in the area, especially at night. For the author it cannot be said that the
rich presence of private car-parks diminish the municipality’s efforts because they can be regulated by the
municipality itself, so to let the disincentive measure be more effective, thus getting a better sustainability.
If in the past strong measures in order to discourage private traffic and congestion were implemented – as
closing down streets like Rua XV de Novembro – today it is not seen as a feasible solution by the current
policy makers. Apparently the city did not learn its own lesson regarding their previous strong policies
adopted. The economy is growing, there is going to be always more cars because the people today work to

Andrea Cinquina Lumes Thesis 2008
34
buy themselves a car, as Mr. Almeida claimed. There are many car industries in greater Curitiba [there is the
second biggest and more modern car industry centre of Brazil, with the presence of companies such as
Volvo, Audi, Fiat, Volkswagen, Nissan or Renault (Cidadesdobrasil, 2008)], and it actually can be thought
that the city, which is promoting its industrial area and always attracting more industries, might receive
lobbying in order not to disincentive the use of cars or simply do not have willingness to do it. To add more
value to this theory, also the city itself would have problems to face an increase of users in some of the lines;
there are routes during the peak hours that are already overshooting their carrying capacity, so will not able
to afford a further increase of passengers. Asked about the lack of strong disincentive measures regarding
private transportation Mr. Almeida said that today it is not possible anymore to shut a street down, to stop the
transit, because it will be a very strong attitude by the municipality. For Almeida, this is something that
cannot be stopped, the municipality cannot let the people not to buy or use cars: “those strong measures are
going to be a solution only when no other solutions are available”. So it is explained the reluctance to
implement private traffic regulations or traffic abatement methods. This situation is also worsened by the
general knowledge that almost all drivers will badly react to a congestion price, except if the revenues were
redistributed to them in some way (Greene et al., 1997).
However, due to the high use of public transport, the city results to be 25% less congested than other
comparable Brazilian cities (Garrick et al., 2006), although the general impression of the Curitibanos is that
the situation is getting worse. The transport system in the city attracts more than any other city in Brazil
(Rabinovitch et al., 1995); the presence of alternatives to private motorization made the people change their
travelling habits: 28% of the express bus users are former car drivers, thus saving around the 25% of oil
consumption in Curitiba (Roseland et al., 1998), estimated to be 27 million litres of fuel per year
(Rabinovitch et al., 1995). The consumption of oil per capita, due to the high use of public transport while
the car ownership is quite high compared with neighbouring cities, is lower; gasoline consumption per capita
in the city is 25% less than other 8 comparable cities in Brazil (WorldBank,2000).
Disincentive measures regarding the use of private motorization would also reduce the already low number
of accidents, having a positive impact on the health and safety of the citizens.
Table 5 shows how Curitiba has a lower number of fatal accidents for every 100,000 cars yearly between the
major Brazilian cities, and that it managed to be the third both in the total of accidents without fatalities and
in the accidents occurred without injuries reported – as mentioned before this table might not have scientific
validity, but can help to understand how, even with the highest number of cars per inhabitants, the numbers
of accidents are actually lower than many other cities, probably due to the public transport.
Inhabitants total cars/inh.
accidents with deaths/100,000 cars
accidents with no deaths/ 100,000 cars
accidents with no injuried/ 100,000 cars
CURITIBA 1 797 408 0,44 11,59 1049,12 839,40 FLORIANOPOLIS 396 723 0,39 Na na Na SAO PAULO 10 886 518 0,37 36,97 844,18 679,55 PORTO ALEGRE 1 420 667 0,32 35,42 1584,07 1247,36 BELO HORIZONTE 2 412 937 0,31 23,77 2260,47 1825,72 BRASILIA 2 455 903 0,31 58,11 1631,39 1230,51 RIO DE JANEIRO 6 093 472 0,23 57,92 1168,22 789,46

Andrea Cinquina Lumes Thesis 2008
35
RECIFE 1 533 580 0,18 31,37 899,13 684,65 FORTALEZA 2 431 415 0,15 97,54 1945,41 1711,20 SALVADOR 2 892 625 0,13 55,12 1647,34 1338,73
Table 14. Accidents per cars. Data elaborated by the author. Source: data from Denatran, 2008. Conclusion In Curitiba land use planning discourages private motorized traffic, thus adding strength to the public
transport sustainability. However it can be said that regulatory measures for private motorization are almost
absent; the main disincentive as high-priced/lack of parking is not really effective due to the presence of
private areas. The increase of the car market over time can bring an increase of private motorized traffic, and
the city is trying to disincentive their use, and this might compromise the sustainability of the system in the
future. Traffic regulation policies are simply missing. The only valid alternative to private motorization is
represented by busses, which are still a motorized mode of transport based on fossil fuels, so far from being
sustainable.
7.1.5 Promote public transport Provide or promote an effective, affordable, physically accessible and environmentally sound public transport and communication system, giving priority to collective means of transport with adequate carrying capacity and frequency that support basic needs and the main traffic flows; When the RIT was implemented in November 1980, the municipality published on every newspaper maps of
the new integrated network in order to promote the use of busses, saying to the citizens that the public
transport system was the right, more comfortable, cheap and fast mean of transportation in the city, and that
RIT was the opportunity to show to Brazil how to economize 230,000 liters of fuel per day in a period of
world oil crisis (IPPUC, 2000).
Campaigns were implemented such as “È com esse que eu vou” (“I’m going with the bus”), which had as its
main purpose to entice the use of busses leaving the car at home, cutting back the fuel consumption (ibid.).
The public transport system is well spread around the city. There is a law which imposes on the municipality
that everyone must live at a maximum distance of 500 meters from a bus stop, but as Ms Soares pointed out,
URBS was able to reduce this distance to a maximum of 400 meters; almost the entire area of the city is
reached by the RIT, that actually covers 92% of the passengers demand and 73% in the metropolitan area
(Demery, 2004). The system is undoubtedly physically accessible for people with mobility problems due to
the elevators in the tubes (Pic.16); considering that 90% of the demand in Curitiba uses the tubes, as stated
by Mr Ceneviva, it is possible to say that the system provides good accessibility. The busses serving the
tubes [padron (type of bus) and bi-articulate of the direct and express routes] normally have seat-free spaces
reserved for wheelchairs. Thus the system has a good physically accessibility, both in terms of coverage and
accessibility for disadvantaged classes. However, the entrances in the tubes are narrow, and as mentioned
before this can present problems, especially during peak hours. In other routes served by different busses
there are the same problems common to many other bus systems, such as high steps while boarding.

Andrea Cinquina Lumes Thesis 2008
36
Acquisition of new fleet with wider entrance and lower steps and floor, or the presence of an elevator would
solve this issue, as a re-styling of the interior. The system has busses that run on alcohol, but are used only for the tourist line, maybe in order to show the
tourists a more sustainable image of the system; all the other busses run on diesel, and it is definitely a major
negative aspect of the public system, compromising heavily its sustainability.
Fares are set by URBS, which takes into account both the cover of its costs and the economical accessibility
of the low income users, as normally transport costs only 10% of their average salary (Garrick et al., 2006).
The ticket is considered fair by the people, both for the low price and for the single fare policy. The price of
the ticket on Sunday is almost half price, R$1, so as to stimulate the use of public transport by families and
people when going for a walk or reaching the city’s mall structures (always including cinemas, shops,
restaurant, etc.) instead of using their private vehicles (IPPUC,2000). To implant the corridor “Boqueirao”,
US$20 million was needed, but the city had only US$4 million; the North-South axes needed US$40 million
for the new line construction (tubes, terminals, platforms, etc.), but the city had only US$10 from the public
money (IPPUC, 2000.). How was the city able to develop such ambitious infrastructures then? The bigger
share of the investment was done by the private bus companies that were operating in the city (ibid.).
Considering Table 6 below, the RIT has the highest average of rides per person/yearly(r/p/y) among the
Brazilian cities – it has to be considered that the RIT consists of metropolitan journeys as well (29% of the
total). In 1991, Curitiba had 230 rides per person yearly (not considering the transfers that are estimated by
URBS to be 1.4 times the tickets paid) thus making it (in proportion) the most used transport system in
Brazil at that time (Demery, 2004). The level of users’ satisfaction is 89% (Curitiba, 2008).
Population Tot.Rides/year R/p/y Population Tot.Rides/year R/p/y CURITIBA 1.797.408 490.000.000 273 SALVADOR 2.892.625 451.019.839 156 SAO PAULO 10.886.518 2.661.110.194 244 RIO DE JANEIRO 6.093.472 755.260.476 124 PORTO ALEGRE 1.420.667 315.387.657 222 FORTALEZA 2.431.415 286.481.946 118 BELO HORIZONTE 2.412.937 422.301.637 175 BRASILIA 2.455.903 189.206.076 77 FLORIANOPOLIS 396.723 64.923.817 164 RECIFE 1.533.580 n.a. n.a.
Table 15. General data from 2006, Rio´s data from 2005. Source: Ministry of Cities, 2008 The system was extremely flexible and thus always prepared to face the increasing number of users over
time assuring an adequate carrying capacity as claimed by Ms. Soares, adopting constantly new solutions,
while proceeding side by side with the revisions of the Master Plan of the city that had the same flexibility.
An example is the implementation on the express route of “padron” busses first, articulated busses and now
bi-articulated, as the number of people riding along the structural corridors were increasing.
The graph below (Pic.19) shows the total number of paying users; in the last 10 years the total number of
users decreased and, as highlighted by Mr. Almeida only a cut in the fare in January 2004 (from R$1,90 to
R$1,65, but now back to R$1,90) reversed the downward trend.
In the last decade, some busses started becoming packed, especially during the peak hours; the situation did
not collapse because of the absence of increase in users in the last years, as it is showed by Fig.1.
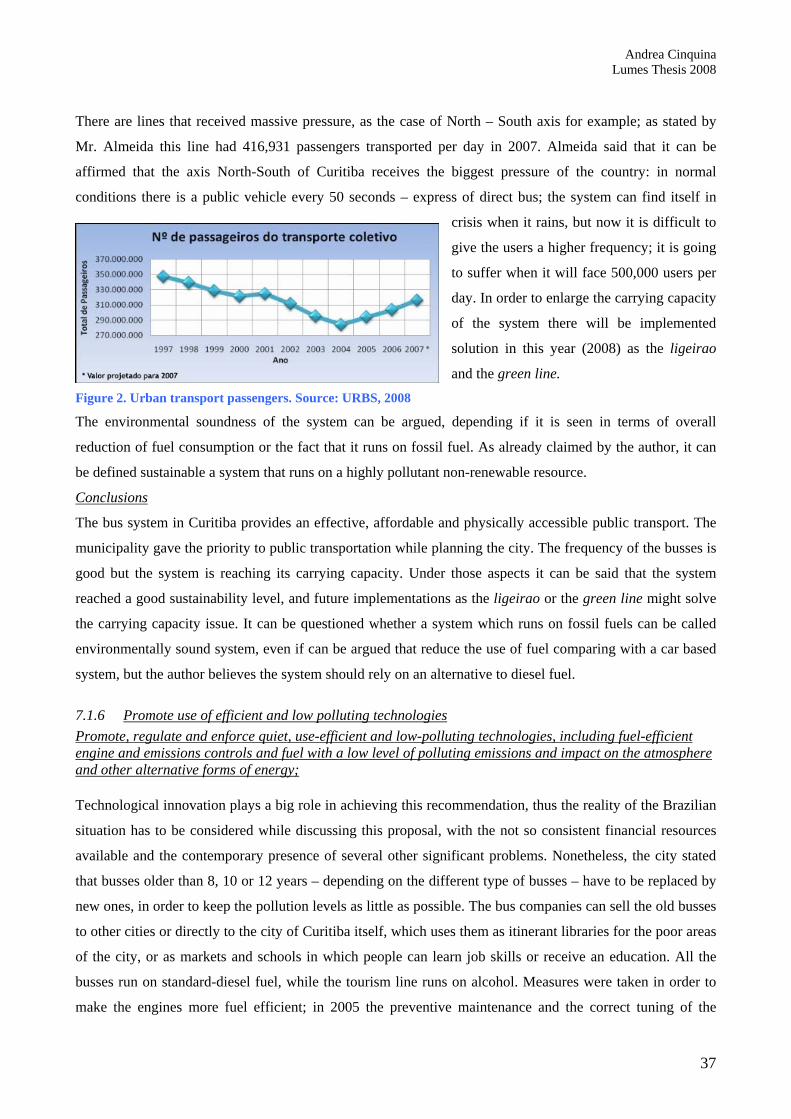
Andrea Cinquina Lumes Thesis 2008
37
There are lines that received massive pressure, as the case of North – South axis for example; as stated by
Mr. Almeida this line had 416,931 passengers transported per day in 2007. Almeida said that it can be
affirmed that the axis North-South of Curitiba receives the biggest pressure of the country: in normal
conditions there is a public vehicle every 50 seconds – express of direct bus; the system can find itself in
crisis when it rains, but now it is difficult to
give the users a higher frequency; it is going
to suffer when it will face 500,000 users per
day. In order to enlarge the carrying capacity
of the system there will be implemented
solution in this year (2008) as the ligeirao
and the green line.
Figure 2. Urban transport passengers. Source: URBS, 2008
The environmental soundness of the system can be argued, depending if it is seen in terms of overall
reduction of fuel consumption or the fact that it runs on fossil fuel. As already claimed by the author, it can
be defined sustainable a system that runs on a highly pollutant non-renewable resource.
Conclusions
The bus system in Curitiba provides an effective, affordable and physically accessible public transport. The
municipality gave the priority to public transportation while planning the city. The frequency of the busses is
good but the system is reaching its carrying capacity. Under those aspects it can be said that the system
reached a good sustainability level, and future implementations as the ligeirao or the green line might solve
the carrying capacity issue. It can be questioned whether a system which runs on fossil fuels can be called
environmentally sound system, even if can be argued that reduce the use of fuel comparing with a car based
system, but the author believes the system should rely on an alternative to diesel fuel.
7.1.6 Promote use of efficient and low polluting technologies Promote, regulate and enforce quiet, use-efficient and low-polluting technologies, including fuel-efficient engine and emissions controls and fuel with a low level of polluting emissions and impact on the atmosphere and other alternative forms of energy;
Technological innovation plays a big role in achieving this recommendation, thus the reality of the Brazilian
situation has to be considered while discussing this proposal, with the not so consistent financial resources
available and the contemporary presence of several other significant problems. Nonetheless, the city stated
that busses older than 8, 10 or 12 years – depending on the different type of busses – have to be replaced by
new ones, in order to keep the pollution levels as little as possible. The bus companies can sell the old busses
to other cities or directly to the city of Curitiba itself, which uses them as itinerant libraries for the poor areas
of the city, or as markets and schools in which people can learn job skills or receive an education. All the
busses run on standard-diesel fuel, while the tourism line runs on alcohol. Measures were taken in order to
make the engines more fuel efficient; in 2005 the preventive maintenance and the correct tuning of the
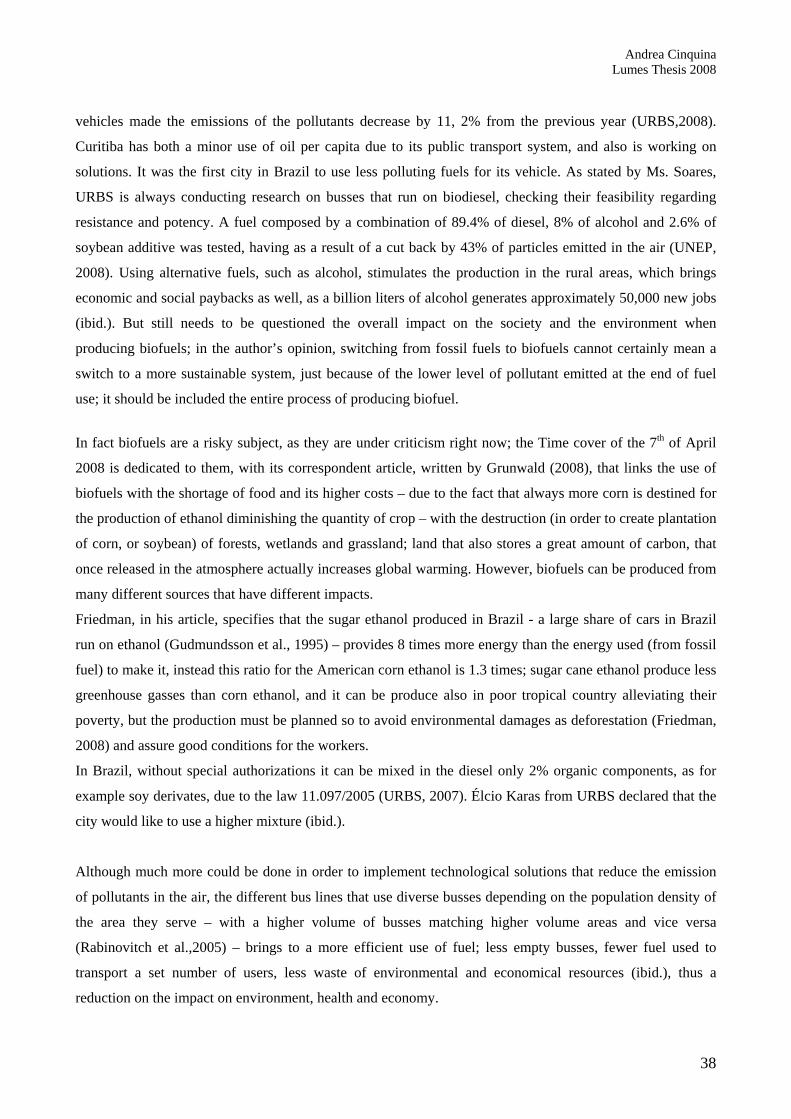
Andrea Cinquina Lumes Thesis 2008
38
vehicles made the emissions of the pollutants decrease by 11, 2% from the previous year (URBS,2008).
Curitiba has both a minor use of oil per capita due to its public transport system, and also is working on
solutions. It was the first city in Brazil to use less polluting fuels for its vehicle. As stated by Ms. Soares,
URBS is always conducting research on busses that run on biodiesel, checking their feasibility regarding
resistance and potency. A fuel composed by a combination of 89.4% of diesel, 8% of alcohol and 2.6% of
soybean additive was tested, having as a result of a cut back by 43% of particles emitted in the air (UNEP,
2008). Using alternative fuels, such as alcohol, stimulates the production in the rural areas, which brings
economic and social paybacks as well, as a billion liters of alcohol generates approximately 50,000 new jobs
(ibid.). But still needs to be questioned the overall impact on the society and the environment when
producing biofuels; in the author’s opinion, switching from fossil fuels to biofuels cannot certainly mean a
switch to a more sustainable system, just because of the lower level of pollutant emitted at the end of fuel
use; it should be included the entire process of producing biofuel.
In fact biofuels are a risky subject, as they are under criticism right now; the Time cover of the 7th of April
2008 is dedicated to them, with its correspondent article, written by Grunwald (2008), that links the use of
biofuels with the shortage of food and its higher costs – due to the fact that always more corn is destined for
the production of ethanol diminishing the quantity of crop – with the destruction (in order to create plantation
of corn, or soybean) of forests, wetlands and grassland; land that also stores a great amount of carbon, that
once released in the atmosphere actually increases global warming. However, biofuels can be produced from
many different sources that have different impacts.
Friedman, in his article, specifies that the sugar ethanol produced in Brazil - a large share of cars in Brazil
run on ethanol (Gudmundsson et al., 1995) – provides 8 times more energy than the energy used (from fossil
fuel) to make it, instead this ratio for the American corn ethanol is 1.3 times; sugar cane ethanol produce less
greenhouse gasses than corn ethanol, and it can be produce also in poor tropical country alleviating their
poverty, but the production must be planned so to avoid environmental damages as deforestation (Friedman,
2008) and assure good conditions for the workers.
In Brazil, without special authorizations it can be mixed in the diesel only 2% organic components, as for
example soy derivates, due to the law 11.097/2005 (URBS, 2007). Élcio Karas from URBS declared that the
city would like to use a higher mixture (ibid.).
Although much more could be done in order to implement technological solutions that reduce the emission
of pollutants in the air, the different bus lines that use diverse busses depending on the population density of
the area they serve – with a higher volume of busses matching higher volume areas and vice versa
(Rabinovitch et al.,2005) – brings to a more efficient use of fuel; less empty busses, fewer fuel used to
transport a set number of users, less waste of environmental and economical resources (ibid.), thus a
reduction on the impact on environment, health and economy.

Andrea Cinquina Lumes Thesis 2008
39
In 1979 Volvo and the municipality showed data regarding the implementation of articulated busses in the
north axis; there was a cut back in oil consumption by 46% per passenger transported and a probability of
reduction in the fleet by 43% (IPPUC, 2000). Impacts on the atmosphere are actually being reduced. Due to
the low use of cars, Curitiba achieved one of the lowest rates of air pollution in Brazil (FTA, 1998).
In the table below (Tab.6) there are data relative to vehicles and cars per inhabitants in some of the major
Brazilian cities and data relative to deaths for every 100,000 inhabitants due to diseases that can be
connected somehow to the use of motor vehicles.
Even if the following data might not have scientific relevance due to missing information regarding the
pathologies and to what extent they are connected to the use of private vehicles, it is interesting to see how
Curitiba, with the highest number of total vehicles and cars per inhabitant, has a low number of deaths; these
might depend on the high usage of public transportation despite the total number of cars.
City
Total vehicles/ inh.
Total cars/inh.
Deaths due to cancer /100,000 inh.
Deaths due to circulatory system pathologies/100,000 inh.
Deaths due to respiratory system pathologies/100,000 inh.
CURITIBA 0,60 0,44 39,22 34,10 30,66 FLORIANOPOLIS 0,54 0,39 48,40 43,10 33,78 SAO PAULO 0,50 0,37 27,06 56,41 48,68 PORTO ALEGRE 0,43 0,32 46,39 69,54 78,48 BELO HORIZONTE 0,43 0,31 37,05 48,28 37,75 BRASILIA 0,41 0,31 22,07 36,44 30,05 RIO DE JANEIRO 0,29 0,23 42,29 47,36 42,52 RECIFE 0,26 0,18 26,15 64,42 57,12 FORTALEZA 0,23 0,15 22,46 39,57 31,92 SALVADOR 0,18 0,13 23,78 32,88 23,68
Table 16. Index of deaths and cars per inhabitants. Data elaborated by the author. Source: data from IPPUC, 2008 A study conducted by Marcilio and Gouveia (2007) on the impact of air pollution on the Brazilian population
showed that among Belo Horizonte, Fortaleza, Porto Alegre, Rio de Janeiro, Sao Paulo, Curitiba and Vitoria,
Curitiba has a low index of PM10 in the atmosphere, with 23.3 µg/m3 on annual mean. It was also shown that
Curitiba always resulted in below average levels of air pollution and the city with the second lowest indices
in relation to how many children less than 5 years of age and elderly over 65 were admitted to hospital or
died due to respiratory causes attributable to PM10 (ibid.). City PM10 (µg/m3) index % deaths >65 % deaths <5 % admissions >65 % admissions <5 Belo Horizonte 20,7 2,2 2,5 2,6 4,1 Curitiba 23,3 2,5 2,8 2,9 4,7 Fortaleza 49,5 5,3 6,0 6,3 10,2 Porto Alegre 27,8 2,9 3,3 3,5 5,6 Rio de Janiero 55,5 5,9 6,8 7,0 11,5 Sao Paulo 49,8 5,3 6,1 6,3 10,3 Vitoria 27,3 2,9 3,3 3,4 5,5 average 36,3 4,9 5,5 5,2 8,3
Table 17. PM10 in some Brazilian cities, and attributable percentage in deaths and hospital admissions. Source: (Marcilio & Gouveia,2007). Particulate matter is a good indicator of sources of air pollution (Kunzli et al.,2000) – source as burning of
fossil fuel, thus use of vehicular motorization as for example in the US the 95% of the energy used for
transportation are fuels derived from oil (Greene et al.,1997).
It can come into mind why it was not implemented a different system as light rail or metro that run on
electricity –but here we have the same problem regarding how electricity is produced. If for Mr. Lerner and
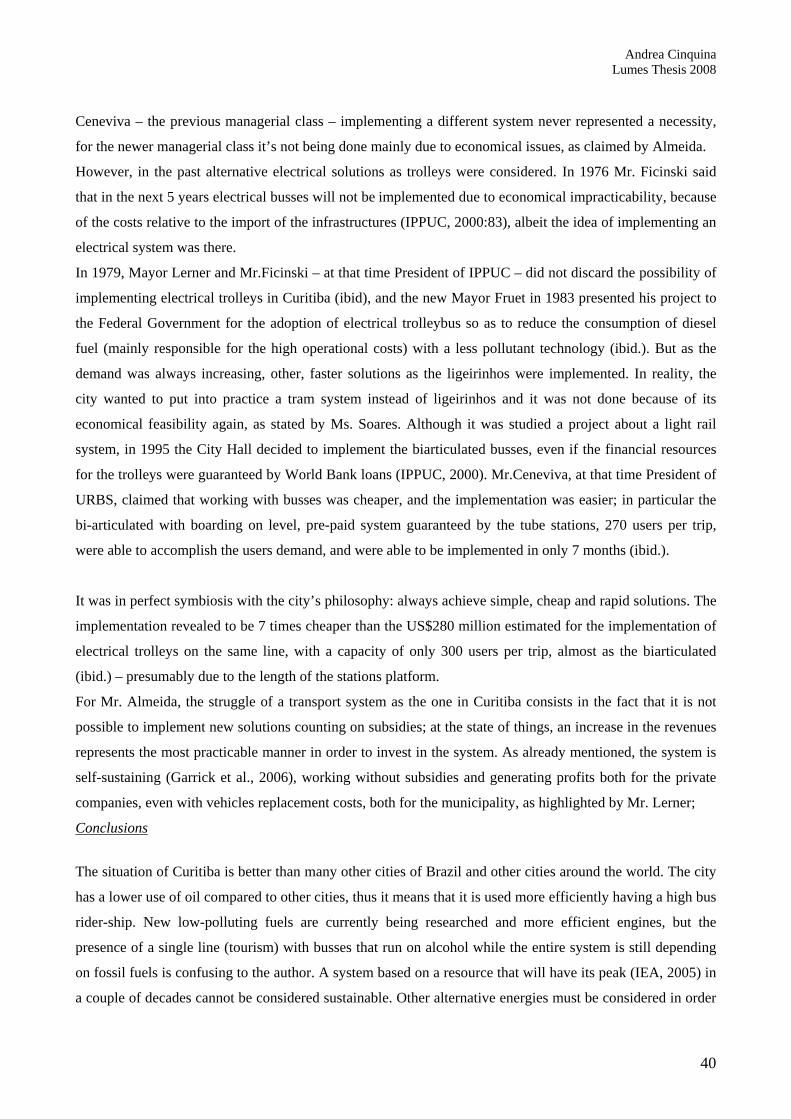
Andrea Cinquina Lumes Thesis 2008
40
Ceneviva – the previous managerial class – implementing a different system never represented a necessity,
for the newer managerial class it’s not being done mainly due to economical issues, as claimed by Almeida.
However, in the past alternative electrical solutions as trolleys were considered. In 1976 Mr. Ficinski said
that in the next 5 years electrical busses will not be implemented due to economical impracticability, because
of the costs relative to the import of the infrastructures (IPPUC, 2000:83), albeit the idea of implementing an
electrical system was there.
In 1979, Mayor Lerner and Mr.Ficinski – at that time President of IPPUC – did not discard the possibility of
implementing electrical trolleys in Curitiba (ibid), and the new Mayor Fruet in 1983 presented his project to
the Federal Government for the adoption of electrical trolleybus so as to reduce the consumption of diesel
fuel (mainly responsible for the high operational costs) with a less pollutant technology (ibid.). But as the
demand was always increasing, other, faster solutions as the ligeirinhos were implemented. In reality, the
city wanted to put into practice a tram system instead of ligeirinhos and it was not done because of its
economical feasibility again, as stated by Ms. Soares. Although it was studied a project about a light rail
system, in 1995 the City Hall decided to implement the biarticulated busses, even if the financial resources
for the trolleys were guaranteed by World Bank loans (IPPUC, 2000). Mr.Ceneviva, at that time President of
URBS, claimed that working with busses was cheaper, and the implementation was easier; in particular the
bi-articulated with boarding on level, pre-paid system guaranteed by the tube stations, 270 users per trip,
were able to accomplish the users demand, and were able to be implemented in only 7 months (ibid.).
It was in perfect symbiosis with the city’s philosophy: always achieve simple, cheap and rapid solutions. The
implementation revealed to be 7 times cheaper than the US$280 million estimated for the implementation of
electrical trolleys on the same line, with a capacity of only 300 users per trip, almost as the biarticulated
(ibid.) – presumably due to the length of the stations platform.
For Mr. Almeida, the struggle of a transport system as the one in Curitiba consists in the fact that it is not
possible to implement new solutions counting on subsidies; at the state of things, an increase in the revenues
represents the most practicable manner in order to invest in the system. As already mentioned, the system is
self-sustaining (Garrick et al., 2006), working without subsidies and generating profits both for the private
companies, even with vehicles replacement costs, both for the municipality, as highlighted by Mr. Lerner;
Conclusions
The situation of Curitiba is better than many other cities of Brazil and other cities around the world. The city
has a lower use of oil compared to other cities, thus it means that it is used more efficiently having a high bus
rider-ship. New low-polluting fuels are currently being researched and more efficient engines, but the
presence of a single line (tourism) with busses that run on alcohol while the entire system is still depending
on fossil fuels is confusing to the author. A system based on a resource that will have its peak (IEA, 2005) in
a couple of decades cannot be considered sustainable. Other alternative energies must be considered in order

Andrea Cinquina Lumes Thesis 2008
41
to achieve sustainability of the system, but in this paper the author cannot address the issue related to the use
of biofuels because the focus is at a higher level.
7.1.7 Promote electronic information services Encourage and promote public access to electronic information services.
Public access to electronic information services is being developed in Curitiba during the last years. Mr.
Almeida asserted that sixty-nine multimedia “totems” (internet points) were established all over the city in
order to give the possibility to citizens to check different information, such as bus timetables, bus routes or
other information regarding the city; in 2007 3,573,699 accesses were registered(URBS,2008). Under this
aspect the situation in Curitiba is surprisingly good considering the reality of the city, for example comparing
this service with other cities in Brazil, or taking into account generally the situation of Brazil itself.
Conclusions
The city is putting a lot of efforts into achieving this criterion and it can be said that the actual situation fits
the UN recommendation, with an increase in public access area to electronic information services and their
use.
In order to be a sustainable system, it must include all the relevant criteria to urban public transport listed
in the UN Habitat framework, the analysis of the Curitiba system has shown that it achieves many of these
criteria, however the analysis has also shown that it does not meet some criteria. Therefore while the
Curitiba system is on the path towards sustainability it cannot be termed as sustainable given the framework
utilised in this paper.
7.2 Main features to move towards a sustainable public transport system
In this subsection are presented what, according to the author, are the main features in order to move towards
a sustainable a public transport system, using the Curitiba experience as a basis for this discussion, and the
UN Habitat framework as a guide. The different elements are grouped under four different areas:
environment, society, economy and institutions. It should be noted that many of them have overlapping
impacts.
7.2.1 Environment
7.2.1.1 Reduce the impact on the atmosphere There is a strong correlation between traffic and air pollution; in a study on traffic related air pollution
conducted in France, Switzerland and Austria, half of the deaths due to air pollution were connected to
motorized traffic (Kunzli et al, 2000). Transport, especially road vehicles, is a main source of pollutants as
oxides of nitrogen or volatile organic compounds (Greene et al, 1997); it emits 1/6 of global anthropogenic
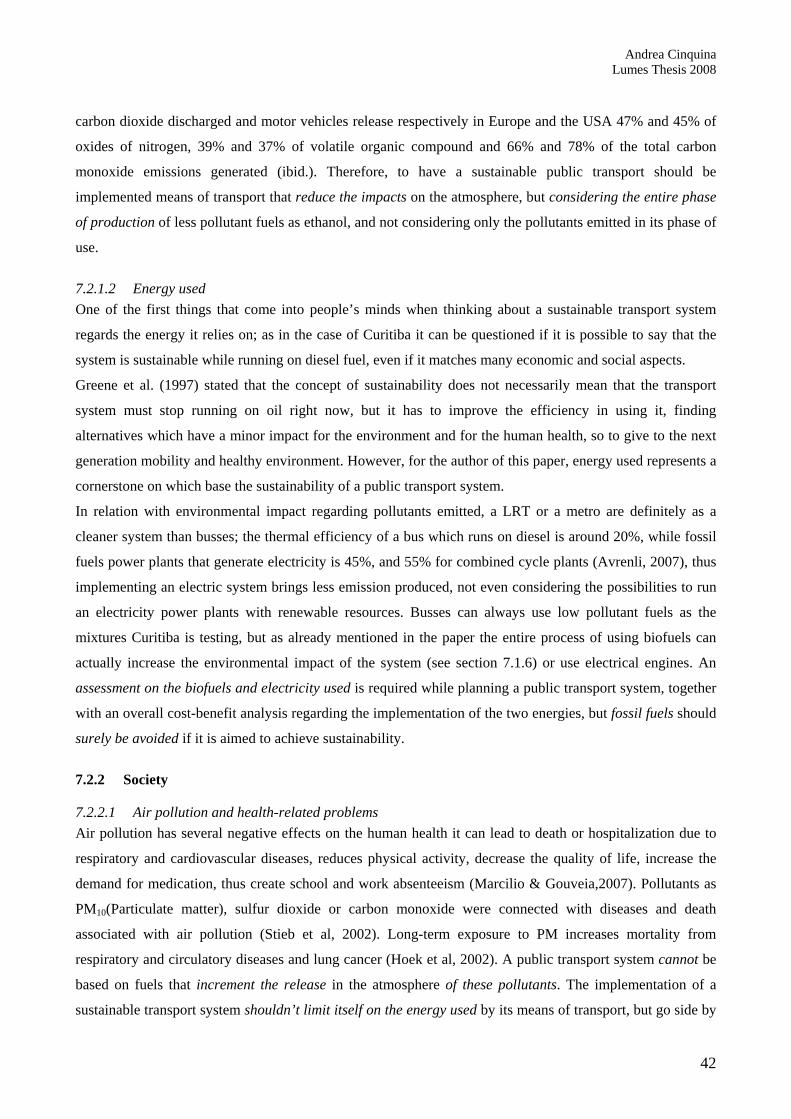
Andrea Cinquina Lumes Thesis 2008
42
carbon dioxide discharged and motor vehicles release respectively in Europe and the USA 47% and 45% of
oxides of nitrogen, 39% and 37% of volatile organic compound and 66% and 78% of the total carbon
monoxide emissions generated (ibid.). Therefore, to have a sustainable public transport should be
implemented means of transport that reduce the impacts on the atmosphere, but considering the entire phase
of production of less pollutant fuels as ethanol, and not considering only the pollutants emitted in its phase of
use.
7.2.1.2 Energy used One of the first things that come into people’s minds when thinking about a sustainable transport system
regards the energy it relies on; as in the case of Curitiba it can be questioned if it is possible to say that the
system is sustainable while running on diesel fuel, even if it matches many economic and social aspects.
Greene et al. (1997) stated that the concept of sustainability does not necessarily mean that the transport
system must stop running on oil right now, but it has to improve the efficiency in using it, finding
alternatives which have a minor impact for the environment and for the human health, so to give to the next
generation mobility and healthy environment. However, for the author of this paper, energy used represents a
cornerstone on which base the sustainability of a public transport system.
In relation with environmental impact regarding pollutants emitted, a LRT or a metro are definitely as a
cleaner system than busses; the thermal efficiency of a bus which runs on diesel is around 20%, while fossil
fuels power plants that generate electricity is 45%, and 55% for combined cycle plants (Avrenli, 2007), thus
implementing an electric system brings less emission produced, not even considering the possibilities to run
an electricity power plants with renewable resources. Busses can always use low pollutant fuels as the
mixtures Curitiba is testing, but as already mentioned in the paper the entire process of using biofuels can
actually increase the environmental impact of the system (see section 7.1.6) or use electrical engines. An
assessment on the biofuels and electricity used is required while planning a public transport system, together
with an overall cost-benefit analysis regarding the implementation of the two energies, but fossil fuels should
surely be avoided if it is aimed to achieve sustainability.
7.2.2 Society
7.2.2.1 Air pollution and health-related problems Air pollution has several negative effects on the human health it can lead to death or hospitalization due to
respiratory and cardiovascular diseases, reduces physical activity, decrease the quality of life, increase the
demand for medication, thus create school and work absenteeism (Marcilio & Gouveia,2007). Pollutants as
PM10(Particulate matter), sulfur dioxide or carbon monoxide were connected with diseases and death
associated with air pollution (Stieb et al, 2002). Long-term exposure to PM increases mortality from
respiratory and circulatory diseases and lung cancer (Hoek et al, 2002). A public transport system cannot be
based on fuels that increment the release in the atmosphere of these pollutants. The implementation of a
sustainable transport system shouldn’t limit itself on the energy used by its means of transport, but go side by

Andrea Cinquina Lumes Thesis 2008
43
side with measures as emission control, tolls to enter the city with private motorized vehicles and area
restricted to their use, making the vehicles and engines more efficient, encouraging intermodal means of
transport as cycling and walking.
7.2.2.2 Accidents Traffic accidents do not bring only physical outcomes, but can also cause psychological problems such as
anxiety, depression and post-traumatic stress disorder, resulting in a decrease of the quality of life (Wang
CH, 2005). Transport accidents are considered by the World Bank to jeopardize the human health having
impact on the economy and health of the society, thus affecting two pillars of sustainability (Greene et al.,
1997). So, the presence of a good public transport system should encourages intermodal transportation that
reduce the use of private vehicles and thus it lowers the risks and occurrence of accidents, giving the citizens
a safer and healthier environment.
7.2.2.3 Accessibility and priority to alternative to private motorization A sustainable transport system, instead of supporting only a greater movement at higher speeds, should give
importance to accessibility, providing to all the citizens in an equal, impartial, economically affordable and
with low impacts on health and environment, the access to services, goods or houses (Litman, 1999).
It should be given higher priority to public transit, or other means of non-motorized transport that are
available to almost all the citizens (ibid.), as Curitiba did being the first in Brazil implementing pedestrian
roads and prioritizing the public transport integrated with land use. As the world trend of possessing and
using cars is always growing, if the transport system does not want to lose users, must be attractive, must
represent always a good alternative to cars, as explained by Mr. Ceneviva. He also commented: “it’s needed
to reach new areas, create new reserved lanes, new stations, because if it does not happen the system will
lose quality, thus users, starting a trend that hardly will be inverted: the public system must be considered the
priority system of mobility”. Prioritize public transport through disincentive private motorization,
implementing higher taxes on registrations, fuels, discourage their use through unavailability of parking
areas and high park-fees.
A sustainable system must be accessible to all the population, especially to disadvantaged class that have
already problems with mobility; they should have the same opportunities as the other users of the system.
Boarding on level, low floor busses with their interior especially designed for people with disabilities,
presence of lifts to help the boarding, employees trained to handle these situations, are essential conditions
for a sustainable transport system.
The creation of the single fare increase the accessibility of the citizens, gives to all of them the same
opportunities in reaching, at the same price, the entire area of the city and part of its greater area: should be
implemented a system that allows its users to switch lines without paying extra fees.
The accessibility must not be only physical but also economical; the system must be affordable for the low
class. The municipality should provide free transfers when are needed, and also subsidized the class of

Andrea Cinquina Lumes Thesis 2008
44
population that cannot afford the fares with special programs that stimulate a higher sense of community, as
showed by the Curitiba’s case with the programs where garbage is exchanged with tickets.
7.2.2.4 Safety and comfortableness The system should be safe for its users, both regarding the rides themselves and the presence of criminality.
From the interviews and conversation with the users in Curitiba emerged how criminality on busses, stops
and terminals, especially when it is dark can affect the use of public transportation. A more active presence
of police is required. The rides must be safe and comfortable, especially for elderly, pregnant women or
people with disabilities. Seminars should be held for the employees of the public system on this theme, along
with more education of the users as well, as proposed by an interviewee after he testified a common situation
of finding the sector of the bus next to the door crowded, while there were sectors on the same bus with a
much lower passenger density. In case of presence of reserved lanes people should be aware also about the
risks of crossing them, as it can be a matter of violent brakes.
It was noticed, and confirmed by Mr. Almeida, that only a small share of users are the middle-upper class,
and they should be involved more.
7.2.2.5 Improving the infrastructures Infrastructures for intermodal transport as bike lanes needs to be improved, especially giving the bikers the
opportunity to go to work by bike and not giving to bikes only a recreational connotation. Exchange areas to
encourage intermodal transport are needed; it is not possible to pretend that people from the metropolitan
area will not drive through the city with their own cars if are not provided parking lots next to public
transport access in the outskirt of the city, so to park the car and catch the public transport.
Stops, busses, trains, terminals should always be cleaned, repaired and improved. They must be supplied
with city maps and route maps, so to make the user more confident with the system. In the case of Curitiba, it
should be said that if you are not from the city or not a customary user of the system it can be hard to get
information on where to go.
Creation of reserved lanes is definitely improving the quality of the system. Features as signal priority for
pubic transport, pre-boarding fare collection, boarding on level, free transfers between lines, overlapping
systems of services (FTA, 1998) increase the quality of the system.
Means of transport should always receive an accurate maintenance so as to be always efficient and not
generating waste.
Making the system attractive, will be one of the key for its future good functioning, thus restricting the
number of private vehicles used in the city.
7.2.2.6 Public participation In the case study emerged from the interviews and informal conversation that public participation in the
decision is considered inadequate or almost totally absent; it was a nearly total agreement on the fact that
when politicians adopt solutions they don’t leave the citizens the opportunity to in the process.

Andrea Cinquina Lumes Thesis 2008
45
Ms. Vallicelli claimed that IPPUC first suggest, then discuss with the population and then adopt the
decisions, and the public are asked to suggest as well, that is a form of public participation.
The citizens must have the opportunity to take part in the decision that might affect their health, economic
and social life, through seminars, meeting, referendum, attending presentation or forums.
7.2.3 Economy
7.2.3.1 Traffic Traffic has heavy consequences on the economy
(as it could be seen from Tab.9), society, human
health, safeness and the environment (Vivier,
1999). Has showed by the case study, the
integration of public transport with land use can
reduce the need to travel, thus the need to use
motorized transportation. Decentralization of main
services and recreational activities instead of
centralized everything in some areas of the city is
needed.
Measures that reduce the use of private vehicles on the roads as car-free day or afternoon should be
implemented.
7.2.3.2 Match transit capacity with feasible solutions MR. Almeida claimed that generally, as it does not require high investments in infrastructures because it
basically runs on normal roads, the execution of a bus system is more cost-effective compared with other
solutions as metro or light rail. A study conducted by Kühn(2002) in different US cities shows that
differences in capital costs when implementing the different systems are significant: from US$21 million for
LRT to a BRT range from US$ 8 to 0.42 million per km depending on the type of street the BRT is
implemented on – mainly due to higher prices of vehicles, rails, infrastructures for the electricity unless there
is already an existing rail track, while the operating and maintenance costs resulted generally to be lower in
BRT, mainly due to the higher number of staff required (ibid.). The costs regarding a metro system are much
higher, US$50-100 million per km (Adielsson & Friberg, 2001), and as Mr. Lerner said the vantage of a
surface metro is that actually citizens know their city better and feel more part of it, thus caring more about
it. The normally acknowledge theory that LRT has higher capacity than BRT is not always applicable (Kühn,
2002), as showed also before regarding the Curitiba’s North-South axis capacity.
Avrenli (2007) states that, in presence of high level of rider ship, light rail is the best economical solution,
because it is true that the implementation costs are higher per km, but they can be lower per user, while –due
to its lower costs and better adaptability to changes – bus rapid transit is a more efficient system if
Table 18. External Cost of transport. Source: Vivier, 1999
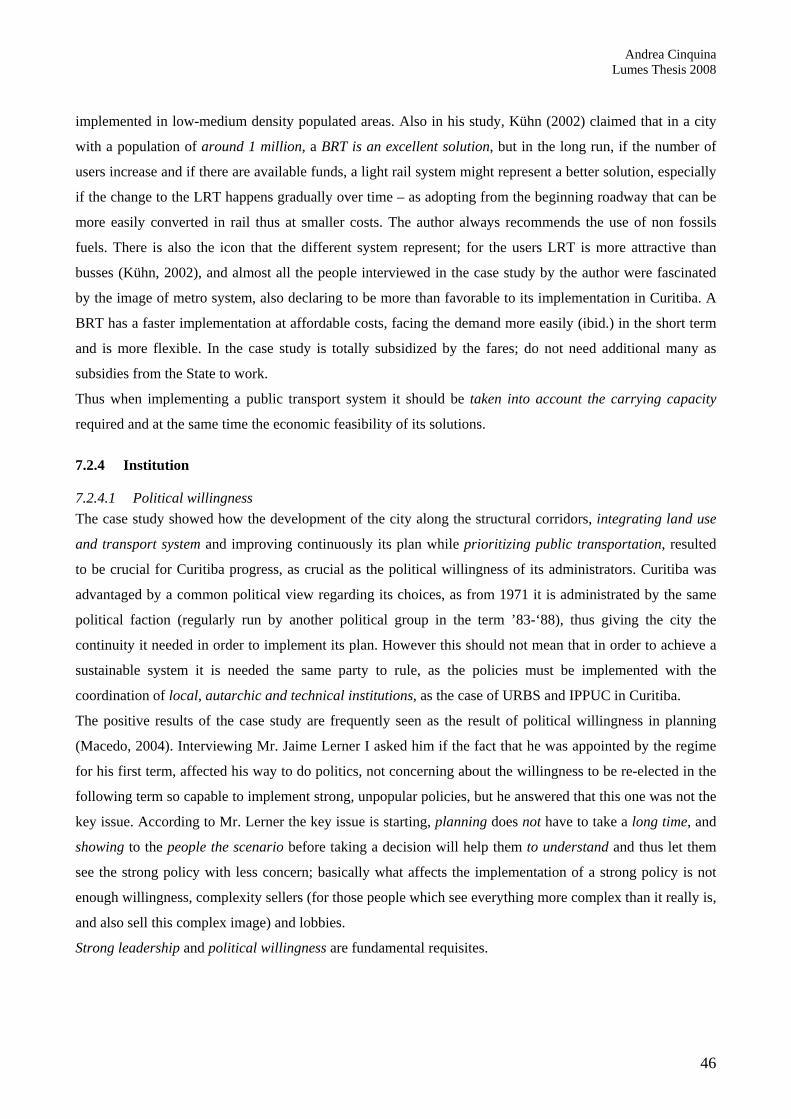
Andrea Cinquina Lumes Thesis 2008
46
implemented in low-medium density populated areas. Also in his study, Kühn (2002) claimed that in a city
with a population of around 1 million, a BRT is an excellent solution, but in the long run, if the number of
users increase and if there are available funds, a light rail system might represent a better solution, especially
if the change to the LRT happens gradually over time – as adopting from the beginning roadway that can be
more easily converted in rail thus at smaller costs. The author always recommends the use of non fossils
fuels. There is also the icon that the different system represent; for the users LRT is more attractive than
busses (Kühn, 2002), and almost all the people interviewed in the case study by the author were fascinated
by the image of metro system, also declaring to be more than favorable to its implementation in Curitiba. A
BRT has a faster implementation at affordable costs, facing the demand more easily (ibid.) in the short term
and is more flexible. In the case study is totally subsidized by the fares; do not need additional many as
subsidies from the State to work.
Thus when implementing a public transport system it should be taken into account the carrying capacity
required and at the same time the economic feasibility of its solutions.
7.2.4 Institution
7.2.4.1 Political willingness The case study showed how the development of the city along the structural corridors, integrating land use
and transport system and improving continuously its plan while prioritizing public transportation, resulted
to be crucial for Curitiba progress, as crucial as the political willingness of its administrators. Curitiba was
advantaged by a common political view regarding its choices, as from 1971 it is administrated by the same
political faction (regularly run by another political group in the term ’83-‘88), thus giving the city the
continuity it needed in order to implement its plan. However this should not mean that in order to achieve a
sustainable system it is needed the same party to rule, as the policies must be implemented with the
coordination of local, autarchic and technical institutions, as the case of URBS and IPPUC in Curitiba.
The positive results of the case study are frequently seen as the result of political willingness in planning
(Macedo, 2004). Interviewing Mr. Jaime Lerner I asked him if the fact that he was appointed by the regime
for his first term, affected his way to do politics, not concerning about the willingness to be re-elected in the
following term so capable to implement strong, unpopular policies, but he answered that this one was not the
key issue. According to Mr. Lerner the key issue is starting, planning does not have to take a long time, and
showing to the people the scenario before taking a decision will help them to understand and thus let them
see the strong policy with less concern; basically what affects the implementation of a strong policy is not
enough willingness, complexity sellers (for those people which see everything more complex than it really is,
and also sell this complex image) and lobbies.
Strong leadership and political willingness are fundamental requisites.

Andrea Cinquina Lumes Thesis 2008
47
7.2.4.2 Importance of small steps achievable in short time A more sustainable approach to transport is to implement low-priced strategies and projects instead of setting
high-priced plans all at once (Litman, 1999), and in the case presented there was a continuous improvement
and expansion of the transport system that brought a high quality service at small capital costs – as the
system is financed by the users (Rabinovitch et al.,1995), demonstrating that coordinated land use with
transport system bring greater benefits for the long-term than in the short-term (Kühn, 2002). This must go
side by side with fastness in implementing the solutions, as claimed by Mr. Lerner: “it is needed to show to
the stakeholders as users, normal citizens and private companies what is going on and how things will be in
the end, show them the scenario proposing them better and valid alternatives, and show rapidity in taking
decisions and adopting solutions”. The “Rua XV de Novembro”, the pedestrian street was created in 48
hours in the city studied, represents a perfect example.
7.2.4.3 Presence of a urban plan, institutions and economical viability
The presence of an urban plan is determinant in achieving the sustainability of the public transport system;
for Mr. Ceneviva having a team with a good vision of what it is going to be in the future and implementing a
well thought plan is fundamental, as well as the economical viability – the system should be self-sustaining.
In the case study, as pointed out by Ms Soares, the main difference between the city and the other Brazilian
cities consisted in the implementation of a good Master Plan. Land use integrated to the transport system
should be the key of the plan, decentralizing the services needed for daily activities. Encourage a linear
development with high density areas and provide them a higher access to the transport system. The presence
of local institutions such as IPPUC and URBS that plan, guide the implementation and the revisions of the
planning process is vital. Interdisciplinary institutions as those are needed in order to address in a better way
the different issues related to transport, not focusing only about public transportation or parking (Bleviss,
2004). It is important to rely on local institutions, because they know better the problems of their city and the
public transportation needed. Also they should have a strong autarchic character, so to not totally depend on
the political party that rules the city at a given time.
7.2.4.4 Equation of co-responsibility As strongly recommended by Mr. Lerner, always try to create an equation of co-responsibility between the
stakeholders. In this way in the case study, where solved many possible issues as the presence of abusive
private companies as in the other Brazilians cities, and also it was possible to implement an ambitious
infrastructure otherwise impossible to execute. Call together all the stakeholders when planning a solution,
let tem all take part to the process make them understand that thing that can be seen such as a negative trade
off now can turn to be positive in the long term. Implementing an equation of co-responsibility reinforce the
sense of community amongst the stakeholder.

Andrea Cinquina Lumes Thesis 2008
48
7.2.4.5 Public participation There is a dispute regarding the public participation at decisions, and to what extent people should be
involved in taking decisions for the sustainability itself: many times the only voices that speak up
representing the communities are “local professional elite” or “activist representing special interest” (Litman
et al, 2006: 340), thus not representing the real interest of the communities. Municipalities must include
citizens in the implementation of decision that might affect their lives.
8 Further research A further suggested research topic could be to analyse the impacts on the economical, social, health and
environmental features regarding the future implementation in Curitiba of a light rail system, a metro system
or a bus system which runs on biofuels. To study the impacts that would have been produced by biodiesel
fuel or electricity, not only in the phase of use but also in the phase of production, or their carrying capacity
and their possibility to generate higher incomes for the city, but it would be interesting to study whether it is
better and possible just to increase the frequency of the busses running on renewable resources or
implementing another system as light rail or metro, or maybe the two options together.
Future research should study other age structures, as the author focused on younger generation, taking into
consideration that most of the older generation users need to be shown a formal identification card from the
municipality in order to be interviewed.
9 Conclusion The cities will increase their role in the future due to the growth of their dwellers, side by side with the
increase of their urban issues. Many problems today have their foundation or its bigger share in the cities,
thus the cities must be seen as the solutions to these problems. The case presented showed how the political
willingness in adopting an urban plan which integrates land use, road hierarchy and transport system can
represent the alleviation to many of the city problems, as the transportation issues.
The RIT, analysed under the criteria presented, resulted to be a very effective system, mixing very positive
indicators such as physical and economic accessibility, economical viability, coordination of land use and
transport system, giving electronic access to the information and being more efficient in use of resources.
Although there are indicators that cannot let the author say that the system is sustainable, as the
encouragement of effective intermodal transportation, the presence of disincentives for private motorization
traffic and the use of diesel fuel. In the future the city is already implementing new solutions, some of them
based on biofuels, but regarding the future sustainability of these choices further researches needs to be done.
The overall impression is still very positive and after all the system in Curitiba is better than many other
systems implemented in other cities worldwide; overall the system is on the path to be sustainable, but it can
be not until a change in those (unsustainable) indicators discussed above are addressed.

Andrea Cinquina Lumes Thesis 2008
49
This paper has concluded, what for the author are the key criteria, in implementing a sustainable public
transport system, highlighting the importance of the presence of good planning, political willingness,
accessibility and use of renewable resources.
References Adielsson M.K., Friberg L. 2001.Sustainable public transport - Curitiba, a case study. Uppsala, Sweden: Swedish University of
Agricultural Sciences, Avrenli Kivanc. 2007. Can light rail transit outdo bus rapid transit?. URL:
http://epil.urban.uiuc.edu:8900/sample_essays/folder.2007-03-06.3008784545/essay4_avrenli2.pdf; Website accessed on 2008, April 20th
Black W. 2000. Socio-economic barriers to sustainable transport. Journal of Transport Geography, Volume 8: 141-147 Bleviss D. 2004. The Opportunities for Sustainable Urban Transportation in Medium-Sized Cities in Latin American and the
Caribbean. Inter-American Development Bank, Sustainable Development Department, Environment Division Brundtland G.1987.Our common future: The World Commission on Environment and Development. Oxford: Oxford University Press Bryman A. 2004. Social research methods, second edition, Oxford University Press Campbell T. 2006. IPPUC: The Untold Secret of Curitiba, Urban Age Institute, San Rafael, California, USA Cidadesdobrasil, 2000, Volume recorde, Revista Cidade dos Brasil, URL: http://cidadesdobrasil.com.br/cgi-
cn/news.cgi?cl=099105100097100101098114&arecod=8&newcod=572; Website Accessed on 2008, April 14th Colvile R, Kaur S, Britter R, Robins A, Bell M, Shallcross D, Belcher S, D.A.P.P.L.E. Project Co-investigators. 2004. Sustainable
development of urban transport systems and human exposure to air pollution. The Science of The Total Environment, Volume 334-335: 481-487
Curitiba in English, Bus Terminals Maintenance and the implant of “Ligeirao” in 2008. N. 02, December/January Demery L. 2004.Bus rapid transit in Curitiba, Brazil – an information summary. Vallejo, California, USA: Publictransit.us, Fairclough N. 2003.Analysing discourse: textual analysis for social research. London: Routledge Friberg L. 2001. Innovative Solutions for Public Transport; Curitiba, Brazil. Sustainable Development International:153-156 Friedman T. 2008, Dumb as we wanna be, New York Times, March 30th,URL:
http://www.nytimes.com/2008/04/30/opinion/30friedman.html?_r=1&oref=slogin; Website accessed on 2008, May 21st FTA,1998. Issues in Bus Rapid Transit. Washington, D.C., United States
Department of Transportation, Federal Transit Administration Garrick, Karis, McCartney, Veilleux, Yannes.2006.Curitiba, Brazil. Transportation Case Study. URL:
http://www.engr.uconn.edu/~garrick/ce255/2006/Curitiba_1.pdf; Website accessed on 2008, April 21st Goodman J., Laube M., Schwenk J., 2007.Curitiba’s Bus System is Model for Rapid Transit. Report for the Federal Transit
Administration Greene D.,Wegener M.1997. Sustainable transport. Journal of Transport Geography, Volume 5: 177-190 Grunwald M, 2008. The clean energy myth. Time, April 27th ,URL:
http://www.time.com/time/magazine/article/0,9171,1725975,00.html; Website accessed on 2008, May 25th Gudmundsson H., HiSjer M. 1996, Sustainable development principles and their implications for Transport, Ecological Economics,
Volume 19: 269-282 Hawken P., Lovins B, Lovins L, 2004.Natural Capitalism. The next Industrial Revolution. London: Earthscan. Hoek G,Brunekreef B,Goldbohm S,Fischer P,Van den Brandt P. 2002. Association between mortality and indicators of traffic-
related air pollution in the Netherlands: a cohort study" Lancet (British edition), Volume 360:1203-1209 IEA, 2005, Resources to Reserves Oil and Gas Technologies for the Energy Markets of the Future:28 IPPUC. Instituto de Pesquisa e Planejamento Urbano de Curitiba, 1991. Memoria da Curitiba Urbana. Curitiba: IPPUC IPPUC. Instituto de Pesquisa e Planejamento Urbano de Curitiba, 2000.A historia do sistema do transporte coletivo de
Curitiba,1887-2000, Curitiba: IPPUC IPPUC. Instituto de Pesquisa e Planejamento Urbano de Curitiba 2007. Plano de mobilidade urbana e transporte integrado, Curitiba:
IPPUC IPPUC. Instituto de Pesquisa e Planejamento Urbano de Curitiba, 2008a, brochure, Curitiba: IPPUC Kingstone S., 2004, Brazil remembers 1964 coup d'etat, BBC, April 1st URL: http://news.bbc.co.uk/2/hi/americas/3588339.stm;
Website accessed on 2008, May 10th Kroll L., 1999. Creative Curitiba: The urban design of Curitiba, Brazil. The Architectural Review URL:
http://findarticles.com/p/articles/mi_m3575/is_1227_205/ai_54956126 Kühn F. 2002.Bus Rapid or light rail transit for intermediate cities?. Arcueil, France: INRETS, Institut National de Recherche sur
les Transports et leur Sécurité, Künzli N, R Kaiser, S Medina, M Studnicka, O Chanel, P Filliger, M Herry, F Horak Jr, V Puybonnieux-Texier, P Quénel,J
Schneider, R Seethaler, J-C Vergnaud, H Sommer, 2000. Public-health impact of outdoor and traffic-related air pollution: a European assessment. The Lancet , Volume 356: 795 - 801
Litman T., 1999. Transportation Cost Analysis for Sustainability. Victoria, BC, Canada, Victoria Transport Policy Institute. Litman T., Burdwell D. 2006. Issues in sustainable transportation. Int. J. Global Environmental Issues, Vol. 6, No. 4: 331 - 347 Macedo J. 2004 .Curitiba. Cities, Vol. 21, No. 6: 537-549 Marcilio I.,Gouveia N. 2007.Quantifying the impact of air pollution on the urban population of Brazil.Cad Saude Publica.23: 529-36 Meadows D. 1995. The city of first priorities. Whole earth review. Spring URL:
http://findarticles.com/p/articles/mi_m1510/is_n85/ai_16816234; Website accessed on 2008, May 25th
Andrea Cinquina Lumes Thesis 2008
50
Meurs P. 1994.Curitiba, uma capital ecologica no Brasil.De Architect 1994-2: 51-59 OECD, 2002. Guidelines towards environmentally sustainable transport. France: OECD Publication Service OECD, 2000. The OECD Initiative on Sustainable Development. Progress report to the 2000 ministerial council meeting. Pedreira M., Goodstein C. 1992. Blueprint for an eco-safe city. Americas (English Edition), 44(4), (in Macedo J. 2004 .Curitiba.
Cities, Vol. 21, No. 6: 537-549) Perman R, Ma Y, McGilvray J, Common M, 1999.Environmental and Natural Resource Economics. 2nd ed. London: Addison
Wesley Longman. Phillips T, 2008. Quiet Revolution. Guardian, March 26th , URL:
http://www.guardian.co.uk/society/2008/mar/26/communities.regeneration; Website accessed on 2008, May 21st Powell, Westbrook, Glazier, 1997.Basic Research Methods for Librarians. Greenwich, CT: third edition, Greenwood Publishing
Group Rabinovitch J., Hoehn J. 1995. A sustainable urban transportation system: the surface metro in Curitiba, Brazil. MUCIA Working
Paper Roseland M.,Cureton M., Wornell H. 1998. Toward Sustainable Communities: Resources for Citizens and Their Governments, New
Society Publishers, Schwartz H. 2004. Urban Renewal, Municipal Revitalization: The Case of Curitiba, Brazil. URL:
http://www.brazilmax.com/news.cfm/tborigem/pl_south/id/9; Website accessed on 2008, April 10th Stanfield B. 2000. The Art of Focused Conversation. New Society Publishers Stieb D.,Judek S.,Burnett R. 2002. Meta-Analysis of Time-Series Studies of Air Pollution and Mortality: Effects of Gases and
Particles and the Influence of Cause of Death, Age, and Season.Journal of the Air & Waste Management Association, 52:470-484
United Nations. 2006. World population prospects: the 2006 revision population database. URL: http://esa.un.org/unpp/ ; Websites accessed on 2008, March 18th
UNEPTransported to the Future. URL: http://www.unep.org/OurPlanet/imgversn/121/tanig.html; Website accessed on 2008, May 25th
UNFPA. The United Nation Population Fund. 2004. State of the World Population 2004, New York: The United Nation Population Fund
UN Habitat Agenda. 1996. Istanbul Declaration on Human Settlements. URL: http://ww2.unhabitat.org/declarations/ch-4c-7.htm; Website accessed on 2008, May 25th
Vivier J.1999. Urban transport pricing. Public Transport International, 5:28-35 Wang CH, Tsay SL, Bond AE. 2005. Post-traumatic stress disorder, depression, anxiety and quality of life in patients with traffic-
related injuries. Journal of advanced nursing. Volume 52: 22-30 Wilheim J. 1969. Urbanismo no subdesenvolvimento. Rio de Janeiro: Saga. (In Macedo J. 2004 .Curitiba. Cities, Vol. 21, No. 6:
537-549) World Bank. 2000.World Development Report 1999/2000. Oxford University Press Presentation IPPUC, Instituto de Pesquisa e Planejamento Urbano de Curitiba, presentation attended on 21-01-2008(b) Websites Comec, Curitiba Metropolitan Region Coordination, 2008, URL: www.pr.gov.br/comec, accessed on 2008, May 3rd Curitiba, 2008, www.curitiba.pr.gov.br, accessed on 2008, April Curitiba.org, 2008 http://www.cidadedoconhecimento.org.br, accessed on 2008, April Denatran, Departamento Nacional de Transito, www.denatran.org.br, accessed on 2008, February EEA, 2003, European Environment Agency, Final energy consumption in the transport sector, 2003
http://dataservice.eea.europa.eu/atlas/viewdata/viewpub.asp?id=1725, accessed on 2008, May EEA, 2002, European Environment Agency Land take by transport infrastructure, Indicator fact sheet, 2002
http://themes.eea.europa.eu/Sectors_and_activities/transport/indicators/consequences/TERM08%2C2002/TERM_2002_08_EUAC_Land_take.pdf; accessed on 2008, May
IBGE, Instituto Brasileiro de Geografia e Estatistica, 2008, www.ibge.gov.br, accessed on 2008, March IPPUC, Instituto de Pesquisa e Planejamento Urbano de Curitiba, 2008, www.ippuc.org.br, accessed on 2008, March Linhaverde, 2008, www.linhaverde.curitiba.pr.gov.br, accessed on 2008, May Ministry of Cities, 2008 , http://www.cidades.gov.br/secretarias-nacionais/transporte-e-
mobilidade/arquivos/TotalPassageirosAnoTransportePublicoUrbanoMunicipiosRMs2005e2006.pdf/view?searchterm=passageiros; accessed on 2008, May
PSDB-PR, Partito da Soacial Democracia Brasileira, 2007, http://www.psdb-pr.org.br/web/municipios.asp?cod=834515, accessed on 2008, May 12th
URBS, Urbanization of Curitiba, 2007, www.urbs.curitiba.pr.gov.br; accessed on 2008, March URBS, Urbanization of Curitiba, 2008, www.urbs.curitiba.pr.gov.br; accessed on 2008, March Yahoo Finance, http://finance.yahoo.com accessed on 2008, May 25th All the data and article used in the paper are contained in a compact disk supplied with the paper.

Andrea Cinquina Lumes Thesis 2008
51
Appendix 1 Question asked during the interviews, translate in English as they were made in Portuguese
Date: 2008, February, 20th Respondent: Almeida Clever, Engineer, IPPUC. After an average ten year period time the busses can be part of the system anymore. What happens after that? Is it easily possible to access the information on public transport online? Are there any free internet points in the streets? Who decide the routes, fares, who are going to be excluded to paying fares? How many people live next to the structural corridors? What are the predictions regarding the population for the future? How many people? How many cars? What about the users of the public system? What is the trend? I had the impression that the middle-upper class doesn’t use public transportation that much. Is that true? Do you have any data about accidents? Can you tell which the main features of the Green Line are? And the metro project? Date: 2008, March, 11th (a) Respondent: Almeida Clever, Engineer, IPPUC. Who is responsible for the public transport in the metropolitan area, URBS or COMEC? Do you always apply am environmental impact assessment to your projects? How much is going to be invested in the green line? Who is paying that money? What do you think are the area that needs a better development? Is the city thinking about any disincentive measures for private cars in the future?
Date: 2008, February, 28th Respondent: Ceneviva Carlos Eduardo former President of IPPUC and
former president of URBS

Andrea Cinquina Lumes Thesis 2008
52
What was important for the implementation of the Curitiba’s system? What is for you a sustainable transport system? Is Curitiba’s system sustainable? Is the system covering effectively the entire city? Do you see any correlation between poor areas and lack of transportation? Between favelas and lack of transportation? What you think must be done in order to improve the present situation? Alternative solutions are needed? Which ones? What you think about the metro project? Date: 2008, May, 14th Respondent: Costa Daniel, Engineer, URBS In many sources I read that the city is investing in new fuel-efficient fleets, but wasn’t it a prerogative of the private bus companies? Why the tourism line is the only line running on alcohol? How it comes that in Curitiba there isn’t the presence of private vans working as public transport but without the authorization of the municipality, as in Rio or Sao Paulo? Date: 2008, March, 14th Respondent: Daher Ariadne, Architect, Jaime Lerner Arquitetos
Associados What is the function of the Jaime Lerner institute? Can you give me a background of the Curitiba Transport system, history, planning, etc? What about the abusive private bus companies? Do you know why the tourism line is the only one running on alcohol? Can you tell me the main features of the green line? The municipality has complete authority on its territory? Do you see any relationship between criminality and lack of public transport? And between the favelas and the lack of public tansport? What is the future of the public system? Date: 2008, February, 28th Respondent: Ficinski Lubomir Dunin, former president of IPPUC What happened with land use in Curitiba? How the public transport is connected to poor areas?
Andrea Cinquina Lumes Thesis 2008
53
Date: 2008, January, 21st Respondent: Jaime Lerner, former Mayor of Curitiba and Governor of
Paraná, former President of IPPUC Can you give me an introduction to what for you is a sustainable city? Do you think that the public transport system in Curitiba is sustainable? Where you appointed for the first term or elected? Did it play an important role in the boldness of your choices? And the facts that for the Brazilian law you cant get elected twice in a row? What was the reaction of the people to your policies? There were problems while creating the system? Corridors, lanes, tubs? The city is attracting people, would this be a problem in the long run? Why the other cities do not implement system similar to the one in Curitiba? Date: 2008, March, 12th Respondent: Soares Anive, Architect, URBS Can you tell me something about the history of the public transport? What are its future developments? What was the Curitiba secret? How the URBS started? Which are the main URBS´s functions? What URBS is doing in order to diminish its environmental impacts? There is the level of public participation in your decision? Date: 2008, January, 23rd Respondent: Vallicelli Liana, Foreign Affairs Advisor, IPPUC Which one are the IPPUC´s functions? How do you judge the public participation here in Curitiba? Which are the bureaucratic issues that IPPUC normally faces? What are the future development of Curitiba?

Andrea Cinquina Lumes Thesis 2008
54
Appendix 2 Question asked during the interviews, translate in English as they were made in Portuguese Since how long are you living in Curitiba? Where? What is your profession? Do you use the public transport system? Why? How many times per week? Which lines? What image do you relate to the transport system? Do have access to a car in your household? Do you own a car? How many times do you use it? Why? When you don’t use your car is because you think that transport system is a good alternative? Would you like to buy yourself a car? If you could use your car everyday, would you use it? Why it is needed a car in Curitiba? What do you think are the main problems in the public system in Curitiba that should be improved? Do you feel comfortable in the public transport? How much is influent the presence on the political programs of improves in transport planning in your political choice when voting for a Mayor? What are the average waiting times of the busses? Are they usually late? What you think about the integrate network the busses have? There are the areas that should be improved? Do you think there is an important difference in accessibility to services between who live in the center, who live on the corridor and who live in peripheral areas? It is possible to have the same quality of life? Is the ticket fair? What do you think about the single fare? What do you think about the green line? And the metro? Do you think public participation is present in Curitiba? Are you happy about Curitiba? Do you like to live in another city?