Embed Size (px)
Citation preview
International Service for the Acquisition of Agri-biotech Applications (ISAAA)SEAMEO Regional Center for Graduate Study and Research in Agriculture (SEARCA)
College of Development Communication, University of the Philippines Los Baños (CDC-UPLB)
MARCH 2006
Cleofe S. TorresMa. Theresa H. Velasco
Ma. Celeste H. CadizRhodora Ramonette M. de Villa
Public Understanding and Perception of and AttitudeTowards Agricultural Biotechnology in Indonesia
Public Understanding and Perception of and Attitude Towards Agricultural Biotechnology �
TABLE OF CONTENTS
ACRONYMS... ................................................................................. ii
LIST.OF.TABLES........................................................................... iii
LIST.OF.APPENDIX.TABLES....................................................... iii
ABSTRACT.....................................................................................v
PART.I.....INTRODUCTION............................................................1
. . A...Rationale........................................................................1
. . B...Objectives.......................................................................2
. . C...Conceptual.Framework..................................................2
D.Definitions......................................................................3
PART.II...REVIEW.OF.LITERATURE.............................................5
PART.III..METHODOLOGY..........................................................10
. . A...Research.Design..........................................................10
. . B...Locale.of.the.Study.......................................................10
. . C...Sampling.of.Respondents............................................10
. . D...Data.Gathering.Methods.and.Instruments...................11
. . E...Data.Analysis................................................................12
PART.IV..RESULTS.AND.DISCUSSION......................................13
. . A....Socio-.Demographic.Characteristics...........................13
. . B....Worldviews.and.Values...............................................13
. . C....Information.Sources.on.Biotechnology.......................16
. . D....Understanding.of.Biotechnology.................................17
. . E....Perception.of.Agricultural.Biotechnology.....................20
. . F....Attitude.Towards.Agricultural.Biotechnology.............................................22
Public Understanding and Perception of and Attitude Towards Agricultural Biotechnology ��
. . G...Relationships.Between.Socio-Demographic.Characteristics.
. . . and.Understanding.and.Perception.of.and.Attitude.Towards.
. . . Agricultural.Biotechnology........................................................................23
. . H...Relationships.Between.World.Views.and.Values.and.Understanding
....... . ...... and.Perception.of.and.Attitude.Towards.Agricultural.Biotechnology...24
. . I....Relationships.Between.Information.Sources.and.Understanding.
....... . and.Perception.of.and.Attitude.Towards.Agricultural.Biotechnology......... 25
PART.V...SUMMARY.AND.CONCLUSIONS.............................................................37
PART.VI..RECOMMENDATIONS..............................................................................44
REFERENCES...........................................................................................................49.
Public Understanding and Perception of and Attitude Towards Agricultural Biotechnology ���
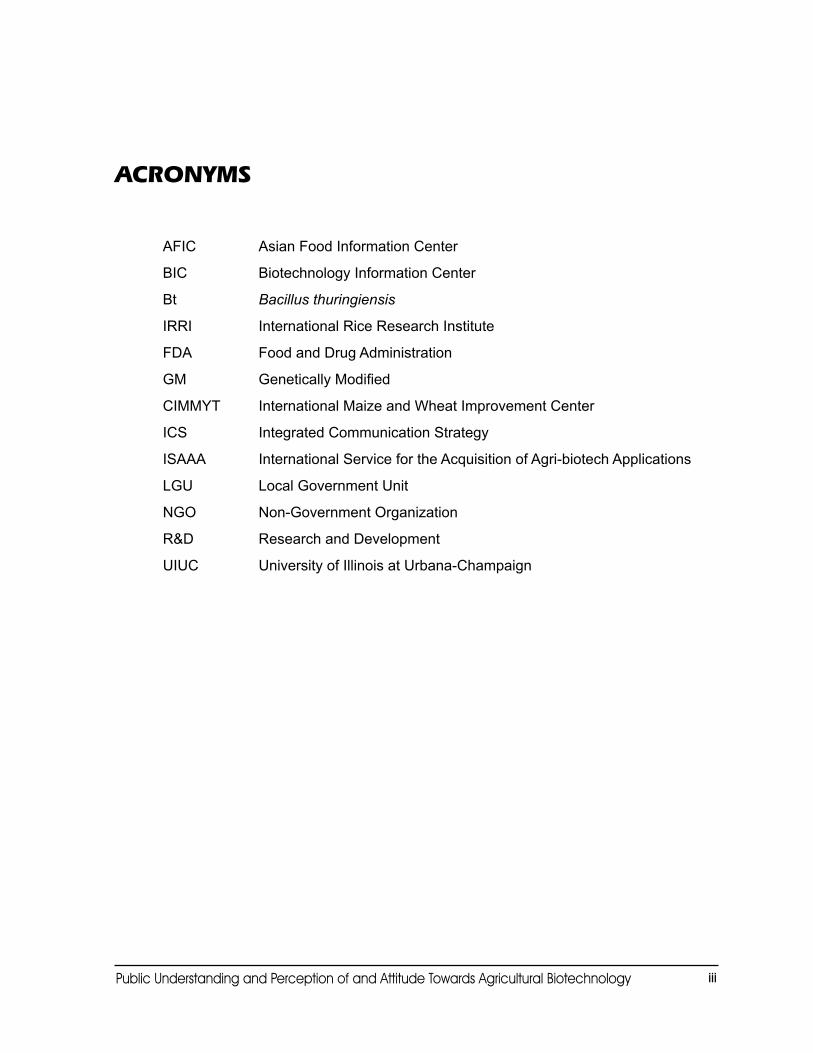
AFIC. Asian.Food.Information.Center
BIC. Biotechnology.Information.Center
Bt. Bacillus.thuringiensis
IRRI. International.Rice.Research.Institute
FDA. Food.and.Drug.Administration.
GM GeneticallyModified
CIMMYT. International.Maize.and.Wheat.Improvement.Center
ICS. Integrated.Communication.Strategy.
ISAAA. International.Service.for.the.Acquisition.of.Agri-biotech.Applications
LGU. Local.Government.Unit
NGO. Non-Government.Organization
R&D. Research.and.Development
UIUC. University.of.Illinois.at.Urbana-Champaign
ACRONYMS
Public Understanding and Perception of and Attitude Towards Agricultural Biotechnology �v
LIST OF TABLES
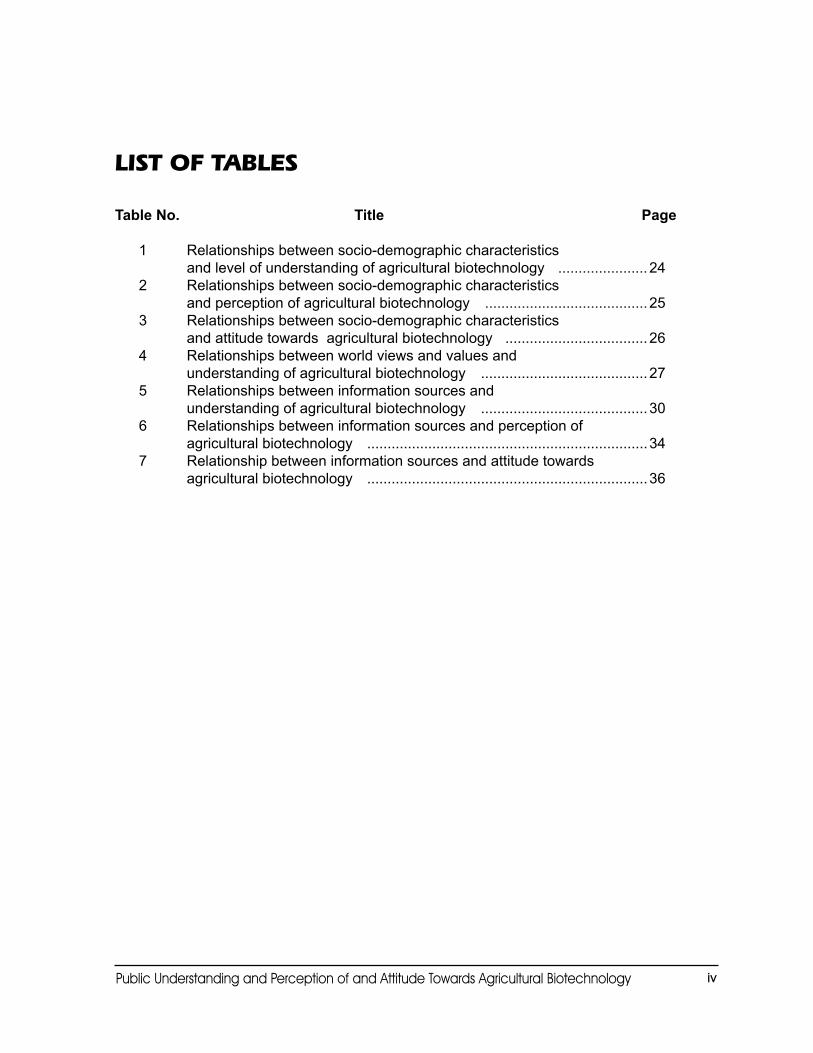
Table.No.. . . . . Title. . . . . . Page
. 1. . Relationships.between.socio-demographic.characteristics.
. . . and.level.of.understanding.of.agricultural.biotechnology..........................24
. 2. . Relationships.between.socio-demographic.characteristics.
. . . and.perception.of.agricultural.biotechnology............................................25
. 3. . Relationships.between.socio-demographic.characteristics.
. . . and.attitude.towards..agricultural.biotechnology.......................................26
. 4. . Relationships.between.world.views.and.values.and.
. . . understanding.of.agricultural.biotechnology.............................................27
. 5. . Relationships.between.information.sources.and.
. . . understanding.of.agricultural.biotechnology.............................................30
. 6. . Relationships.between.information.sources.and.perception.of.
. . . agricultural.biotechnology.........................................................................34
. 7. . Relationship.between.information.sources.and.attitude.towards.
. . . agricultural.biotechnology.........................................................................36
Public Understanding and Perception of and Attitude Towards Agricultural Biotechnology v
LIST OF APPENDIX TABLESAppendix.Table.No.. . Title
1. Distribution.of.respondents.by.gender2. Distribution.of.respondents.by.civil.status3. Distribution.of.respondents.by.age4. Distribution.of.respondents.by.educational.attainment5. Distribution.of.respondents.by.area.of.residence6. Distribution.of.respondents.by.religion7. Stakeholders’.views.on.society.and.values8. Sources.of.biotechnology.information.most.frequently.contacted.within.the.
past.two.months9. Extent.of.trust.in.information.sources.on.agricultural.biotechnology10. Usefulness.of.information.in.making.judgments.about.agricultural.
biotechnology.and.food.production11 Stakeholders’perceptiononhowscientificistheinformationtheygeton
agricultural.biotechnology12. Understanding.of.science13. Knowledge.on.the.uses.of.biotechnology.in.food.production14. Understanding.of.biotechnology.in.food.production15. Factual.knowledge.of.biotechnology:.the.use.of.biotechnology.crops16. Factual.knowledge.of.biotechnology:.the.importance.of.food.characteristics17. Rating.of.perceived.risks/hazards.associated.with.the.uses.of.agricultural.
biotechnology.in.food.production18 Ratingofperceivedbenefitsofagriculturalbiotechnologyinfoodproduction19. Perception.of.agricultural.biotechnology.20. Perceived.involvement.of.individuals,.groups,.and.organizations.in.public.
health.and.safety.with.regard.to.agricultural.biotechnology21. Extent.that.science.should.be.a.part.of.agricultural.development.in.Indonesia22. Interest.in.the.uses.of.agricultural.biotechnology.in.food.production23. Concern.on.the.uses.of.agricultural.biotechnology.in.food.production24. Attitude.towards.agricultural.biotechnology25. Biotechnology.applications.stakeholders.would.consider.when.making.
judgments.on.biotechnology
Public Understanding and Perception of and Attitude Towards Agricultural Biotechnology v�
Abstract
F ocusingontheIndonesiancontext,thisstudysoughttodeterminethesocio- culturalcharacteristicsofthevariousstakeholdersinagriculturalbiotechnology; theirworldviewsrelatedtoagriculturalbiotechnology;theirinformationsourcesonagriculturalbiotechnology;theirlevelofunderstandingandperceptionofandattitudetowardsagriculturalbiotechnology;andtherelationshipsbetweenthesocio-culturalfactors,worldviews,andinformationsourcesononehand,andthestakeholders’levelofunderstandingandperceptionofandattitudetowardsagriculturalbiotechnology,ontheotherhand.
Respondentsincluded432agriculturalbiotechnologystakeholderscomprisingbusinessmenandtraders,consumers,extensionworkers,farmerleadersandcommunityleaders,journalists,policymakers,religiousleaders,andscientistsfromselectedrural,suburban,andurbanareasinIndonesia.Datawereanalyzedusingfrequencycounts,percentages,ranges,weightedmeansandChi-squareandSpearmanRankCorrelationtests.
Abouttwo-thirdsofthepresentrespondentsweremalesandmarried.Therewasnoconsiderabledifferenceineducationalattainmentwithafairdistributionofthosewhohavefinishedhighschool,collegedegrees,andpostgraduatedegrees.Thedistributionofruralandurbandwellers(abouthalfinsub-urbanareasandalittlemorethan10percentintheruralareas).Mostofthefarmer-leadersandcommunity-leaders,religiousleaders,extensionworkers,andbusinessmenandtraderslivedintheruralareaswhereas,morepolicymakers,scientists,consumers,andjournalistslivedinthesuburbanareas.
Significantfindingsofthestudywithstrongimplicationsontheplanninganddesigningofcommunicationstrategytoenhancepublicunderstandingandperceptionofandattitudetowardsagriculturalbiotechnologyareasfollows:
1. AmongtheIndonesianstakeholders,thejournalistsandreligiousleadershavethemostconservativeviewofagriculturalbiotechnology.Bothviewbiotechnologyinfoodproductionasagainsttheirmoralvalues.
2. Religiousleadersareactiveinformationseekersandreceiverswhenitcomestobiotechnologybuttheyhavelowunderstandingofscienceandclaimthattheyknownothingatallonusesofbiotechnologyinfoodproduction.
3. Thejournalistshavesomecontradictingstanceasillustratedbythesefindings:
Whiletheyclaimtohavehighunderstandingofscience,theyfindtheinformationtheygetonagriculturalbiotechnologyonlyas“somewhatscientific.”
Whiletheyaremostconcernedwithfactualknowledgeofallfoodcharacteristicswhenconsideringtheusesofbiotechnologyinfoodproduction,theyareonly
Public Understanding and Perception of and Attitude Towards Agricultural Biotechnology v��
moderatelyinterestedintheuseofbiotechnologyinfoodproductionanddon’tseebiotechnologyasameansforprovidingnutritiousandcheaperfoodforthepublic.
4. Stakeholdershavemultipleinformationsourceswhenitcomestoagriculturalbiotechnology.University-basedscientistsandsciencemagazinescomeoutasthemosttrustedsourcesofinformation.Informationobtainedareperceivedasveryusefulandveryscientific.
5. Allstakeholdersperceivethemselvesashavingmoderateknowledgeabouttheusesofbiotechnologyinfoodproduction,exceptthereligiousleaderswhoclaimthattheyhavelowunderstandingofthesubject.
6. There’sageneraltendencyforthevariousstakeholdergroupstoperceiveagriculturalbiotechnologyashazardousbutatthesametimebeneficial.Alittlemorethan30percenthavenoopinionyetastothehazardsofagriculturalbiotechnology.
7. Allstakeholdergroups,exceptthejournalists,arewillingtoattendinformationsessionsonagriculturalbiotechnologythattheircommunitywillhold.
8. Allstakeholdergroups:
arenotwillingtopaythecostforlabelingGMfoods; arewillingtosupporttheconsumersrighttochoosewhattoeatandtoknowwhat
theyareeating;and believethatthepublicshouldbeconsultedinformulatingfoodregulationsandlaws.
9. Intermsofframesusedwhenmakingjudgmentsonbiotechnology,Indonesianpolicymakersandscientistsarenotstronglyinclinedtowardsbiotechnologyapplicationsthatwouldimprovefoodquality,makecropsmoreresistant,orcurediseases.
10.Thehighertheeducationofthestakeholders,themorefavorableistheirperceptionandattitudetowardsagriculturalbiotechnology.
11.ThecurrentsourcesofinformationonagriculturalbiotechnologyinvolvingbothmassmediaandinterpersonalonestendtoinfluencetheIndonesianpublicintothinkingthatagriculturalbiotechnologyisnotgoodfortheircountry’sagriculture.
12.Theworldviewsandvaluesofstakeholdersimpingegreatlyontheirperceptionofandattitudetowardsagriculturalbiotechnology.Conservativeworldviewsandvalues,suchastheapplicationofagriculturalbiotechnologybeingagainsttheirmoralvalues,consistentlyleadtonegativeperceptionandattitudetowardstheuseofbiotechnologyinfoodproduction.
Theabovefindingsandimplicationspointoutthenecessitytopromptlyconductaggressivepubliceducationandstrategiccommunicationtoaddressknowledgegapsandmisconceptions.Thelatterusuallyleadtounduenegativeperceptionandunfavorableattitudetowardsagriculturalbiotechnology.
Public Understanding and Perception of and Attitude Towards Agricultural Biotechnology �
Rationale hydoesthepublicseemtobedividedwhenitcomestoissuesabout biotechnology?Howcomethatevenamongthescientiststhemselves,thereisnoagreementastothesafetyoforriskssurroundingbiotechnology?Thismixedreceptionofbiotechnologyparticularlyinagriculturalproductionhasbecomeachallengetocommunicationindealingwithuncertaintiesbroughtaboutbyscience.Fundamentalinaddressingtheissueistheneedtoknowthepublicunderstandingandawarenessoftherelevanceandimportanceofbiotechnology.
Afive-countryAsianstudywasconductedin2002bytheInternationalServicefortheAcquisitionofAgri-biotechApplications(ISAAA)andtheUniversityofIllinoisatUrbana-Champaign(UIUC).ThecountriescoveredwereIndonesia,Malaysia,Philippines,Thailand,andVietnam.Itwasdesignedtodeterminethepublicunderstanding,perception,andattitudetowardsagriculturalbiotechnology.Representingthepublicasstakeholdersinthe2002studyweresevensectors,namely:policymakers,journalists,scientists,farmerleadersandcommunityleaders,extensionworkers,consumers,andbusinessmenandtraders.
Resultsofthefirststudywereusefulbecausetheyprovidedanswerstothefollowingquestions:
1. Whatdostakeholdersgenerallyknoworunderstandaboutagriculturalbiotechnology?2. Whataretheirviewsandopinionsabouttheimpactandroleofbiotechnologyintheir
lives?3. Wheredotheyobtaininformationandwhatkindofinformationormessagecontentsdo
theyget?4. Whodotheytrusttotellthetruthaboutbiotechnology?
Atthetimethisearlierstudywasconductedin2002,IndonesiawasalreadycommercializingBtcotton.Butin2005,IndonesiastoppedplantingBtcotton.SuchdecisionraisestheneedtoknowwhattrendsinpublicunderstandingandperceptionofandattitudetowardsbiotechnologywillemergenowthatitspracticeinIndonesiahasbeenstopped.Basedonthese,appropriatecommunicationinitiativescouldberecommendedandundertakensothatpublicunderstandingandperceptionofandattitudetowardsbiotechnologycanbeenhanced.This2005studyaimstorespondtothatneed.
Part 11 Introduction
W
Public Understanding and Perception of and Attitude Towards Agricultural Biotechnology �
ObjectivesThisstudyaimedtodetermine:
1. Thesocio-culturalcharacteristicsofthevariousIndonesianstakeholdersinagriculturalbiotechnology;
2. Theinformationsourcesonagriculturalbiotechnologyofthesestakeholders;3. Theirlevelofunderstandingandperceptionofandattitudetowardsagricultural
biotechnology;and4. Therelationshipsbetweensocio-culturalfactorsandstakeholders’understandingand
perceptionofandattitudetowardsagriculturalbiotechnology.
Significance of the StudyIssuesaboutbiotechnologyhavesegmentizedthepublicintothosewhoareforit,againstit,andstillundecidedpendingavailabilityofmoreinformationandmoreproofs.Resultsofthisstudywill,therefore,helpprovideindicativestatusonwheretheIndonesiansstandnowintermsofunderstandingandperceptionofaswellasattitudetowardsbiotechnology.Identifiedgapswillserveasbasisforformulatingandundertakingeducationandcommunicationactivitiesthatwillhelppromotebetterunderstandingandappreciationofagriculturalbiotechnologyamongdefinedsectorsinthesociety.
Limitations of the Study
Whileastatisticallysoundsamplingtechniquewasemployedinthestudy,itshouldbeemphasizedthatonly432wereinterviewedtorepresentthe200millionpopulationofIndonesia.Theycamefromfourmajorareas,namelyBogor,Java,YogyakartaandJakarta.Thissetsthelimitationsofthestudyintermsofgeneralizingtheresultsonlytotheselected,andnottheentire,populationofIndonesia.
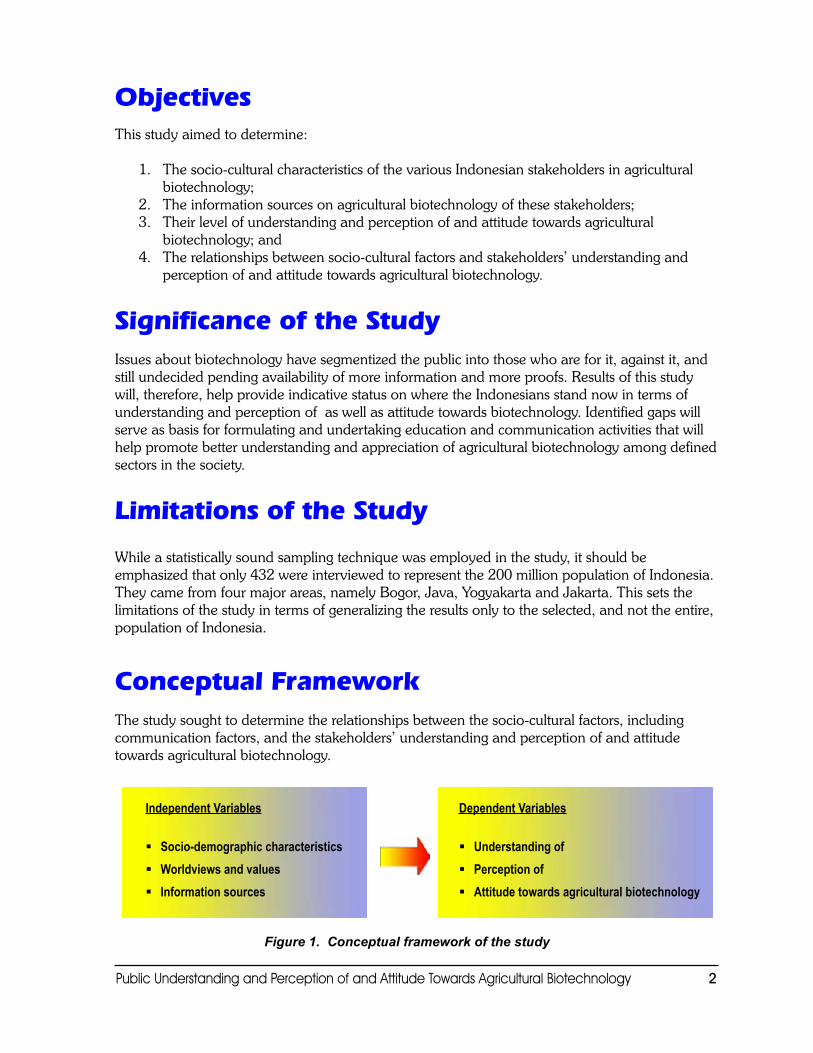
Conceptual FrameworkThestudysoughttodeterminetherelationshipsbetweenthesocio-culturalfactors,includingcommunicationfactors,andthestakeholders’understandingandperceptionofandattitudetowardsagriculturalbiotechnology.
Independent Variables
Socio-demographic characteristics Worldviews and values Information sources
Dependent Variables
Understanding of Perception of Attitude towards agricultural biotechnology
Figure 1. Conceptual framework of the study
Public Understanding and Perception of and Attitude Towards Agricultural Biotechnology �
ThevariablesandtheiroperationaldefinitionswerepatternedafterthoseusedintheISAAA2002study.Howeverreligion(asasocio-demographiccharacteristic)andworldviewsandvalueswereaddedinthis2005studytobroadenthesocio-culturaldimensionsinrelationtounderstandingandperceptionofandattitudetowardsagriculturalbiotechnology.Thesetsofvariablesusedinthisstudyarelistedbelow.
1. Independentvariables–thethreeindependentvariablesindicatedintheobjectivesandconceptualframeworkwereoperationallydefinedasfollows:
a. Socio-demographiccharacteristics–gender,civilstatus,age,education,areaofresidence,andreligion
b. Worldviewsandvalues–inferredfromscoresinapopquiz c. Informationsources–frequency,perceivedtrust;characteristicsofinformationsought
orreceived(i.e.,quality,scientific);issuesandconcernsheardorknownaboutbiotechnology,(i.e.,moral,political,cultural,religious)
2. DependentVariables-thesewerecomposedofunderstanding,perception,andattitudeandtheircorrespondingmeasuresasfollows:
Understandinga.Self-ratingonunderstandingofscienceb. Self-ratingonunderstandingofbiotechnologyc. Factualknowledgeonbiotechnology
Perceptiona. Perceivedrisksb. Perceivedbenefitsc. Perceptionofinstitutionalconcernabouthealthandsafetyd. Perceptionofinstitutionalresponsibilityforriskassessmentandriskmanagemente. Perceptionofroleofscienceinagriculturaldevelopment
Attitudea. Interestinbiotechnologyb. Concernforbiotechnologyc. Attitudetowardsbiotechnologyd. Framestobeusedwhenmakingjudgmentsaboutbiotechnologyapplications(only
forpolicymakersandscientists)
Definitions of StakeholdersEightgroupsofstakeholderswereincludedinthis2005studyandtheyareasfollows:
1. Businessmenandtraders–individualswhoaredirectlyinvolvedinthefoodandagriculturalindustry
2. Consumers–market-goers(themarketmaybeasupermarketoranordinaryone)
3. Extensionworkers–personnelworkinginuniversities,colleges,agricultureministries,
Public Understanding and Perception of and Attitude Towards Agricultural Biotechnology �
orstateresearchinstituteswhoseresponsibilitiesincludeinformationdissemination,technologytransfer,assistingfarmers,andprovidingfeedbacktouniversitiesandresearchinstitutesontheneedsoffarmersandtheircommunities
4. Farmerleadersandcommunityleaders–officersoffarmerassociationsandcooperativesandnon-electedmembersofcommunitycouncilsatthecommunitylevel,whoseopinionsandideastendtoinfluencetheoveralldynamicsofcommunitydebatesordiscussiononcropbiotechnologyand/oragriculturalproduction
5. Journalists–mediawritersandbroadcastersonnationalandlocaltelevision,radio,andprintwhoseprimarybeatisagricultureorscienceandtechnology.Theymayalsoincludeprominentcolumnistsandcommentatorsinmajornationaldailies,radio,andtelevision.Ifpossible,respondentsshouldhavecoveredbiotechnology.
6. Policymakers–individualswhosedecisionsandopinionswouldhavesignificantinfluenceorimpactonnationalpolicies,laws,andregulationsrelatingtotheoveralldirectionofthecountry’sagriculturaldevelopmentprogramsincludingproduction,research,andtrade.Policymakersmayincludesenators,congressmen,parliamentarians,electedrepresentativesatthenationallevel,membersoflegislativelevelagriculturalcommittees,officialsinagriculturedepartmentsorministriesatthenationalorregionallevelsuchasdirectorsandheadsofunits,andlocalgovernmentofficialssuchasmayors,vice-mayors,andcouncilors.
7. Religiousleaders–peoplewhoarerecognizedleadersofmajorreligiousgroupsinthecountry
8. Scientists–individualswhoarenotpartofthecountry’scropbiotechnologyresearchconsortium,whoconductresearchordeveloptechnologiesrelatedtoagriculturalproductionandarebasedattheuniversitiesandR&Dinstitutions
Public Understanding and Perception of and Attitude Towards Agricultural Biotechnology �
Part 22 Review of Literature
nrecentyears,publicopinionresearchonagriculturalbiotechnologyhasbeen intensivelyconductedindifferentpartsoftheworldtomeasureitssocialacceptability.ItstartedwhenR&Dagenciesrealizedthatthebenefitsofagriculturalbiotechnologywillbebestachievediftheconsumers,foodmanufacturers,andpolicymakersconsideritsafeandbeneficial.
AbulkofstudiesonthisfieldwasundertakenintheUnitedStatesandEurope.ComparablepublicopinionstudieswerelikewisedoneinthedevelopingcountriesparticularlyintheSoutheastAsianRegion.GlobaltrendswerealsopresentedtoassessthesocialacceptabilityofagriculturalbiotechnologyinIndonesiacomparedwithotherpartsoftheworld.
Global TrendsStudiesontrendsregardingpublicawarenessandunderstandingofagriculturalbiotechnologyintheUSshowedthatonlyone-thirdofconsumersintheUShaveheardorreadaboutbiotechnology.Thetrend,however,changedin1997when‘Dolly,thesheep’,waswidelypublicizedbythemedia.SurveyresultsintheUSandinJapanshowedthatincreasinglevelofawarenessleadstoincreasingconsumeracceptanceofagriculturalbiotechnologyproducts(Hoban,1998).
Analysisofsurveyresultsfurthershowedthatsocialacceptabilityofagriculturalbiotechnologywasinfluencedbyanumberofinterlinkedfactors:1)benefitsthatcanbederivedfromagriculturalbiotechnologyshouldbeclearanddemonstrable,2)risksshouldbesociallyacceptable,and3)biotechnologyapplicationsshouldbeviewedasmorallyacceptabletosociety.Researchersrecommendedthatpublicunderstandingofthebenefitsandrisksofagriculturalbiotechnologybeimprovedthroughcommunicationandeducationprograms.Theethicsof“feedingtheworldwhileprotectingtheenvironment”mayalsoinfluenceconsumers’attitudes.Itwillfurtherbeimportanttoensurethatgovernmentregulationsareinplacetominimizeanyrisks(Hoban,1998).
TheMellmannGroupandPublicOpinionStrategiesconductedastudyinAugust2003thatprobedontopicsrarelyexploredinwidely-availableopinionpollsaboutagriculturalbiotechnology.ThisincludedhowAmericansfeelaboutthewayGMproductsareregulatedintheUSandtheapplicationofgeneticengineeringtechnologytoanimals.KeyfindingsindicatedthatAmericansopposeabanonGMfoods,butarestronglysupportiveofaregulatoryprocessthatdirectlyinvolvestheFoodandDrugAdministration(FDA).ItwasalsodeterminedthatAmericansarefarmorecomfortablewithgeneticmodificationsinplantsthaninanimalsand
I
Public Understanding and Perception of and Attitude Towards Agricultural Biotechnology �
areparticularlysupportiveofgeneticmodificationsthatimprovehealthandnutrition.
ThestudybyPewInitiativeonFoodandBiotechnologyin2003revealedthatAmericans’knowledgeofGMfoodsremainslowandtheiropinionsaboutitssafetyisjustasdividedasitwastwoyearsago.ThesurveyalsoshowedthatsocialacceptabilityofGMproductsincreaseswhenthepublicknowsthatitwasreviewedandapprovedbyFDA.AnotherimportantfindingwasthatpublicsupportforGMproductsdecreasesasusesofthetechnologyshiftfromplantstoanimals(Pew,2003).
TheParticipatoryAssessmentofSocialandEconomicImpactsofBiotechnology,acollaborativeresearchprojectofInitiativeforFutureAgricultureandFoodSystemsandtheUSDepartmentofAgricultureconductedapublicopinionresearchonthesocialacceptanceofbiotechnologyintheUS.Thestudyemployedcomputer-assistedtelephoneinterviewswithmorethan1,200respondentsacrosstheUS.About80percentoftherespondentswerewillingtoembraceagriculturalbiotechnologyforitssocialbenefits.Ontheotherhand,thestudyshowedapolarizedresultwhentherelationshipofpersonalbenefitandwillingnesstoacceptagriculturalbiotechnologywasexamined(Nevittetal.,2004).
TheEnvironicsInternationalcompletedthemostextensiveinternationalstudyofconsumerattitudetowardsagriculturalbiotechnology.Thestudycovered35,000respondentsfrom35countries(Hoban,2004).Respondentswereaskedwhetherthebenefitsofagriculturalbiotechnologyaregreaterthantherisks.ResultsshowedthatconsumersintheUnitedStates(US)andAsiahaveamorepositiveattitudetowardsbiotechnologythanEuropeansandAustralians.TheUSleadstheindustrializedcountriesinsupportingbiotechnology.Overall,peopleinthedevelopingcountriestendtobequitesupportiveofgeneticallymodified(GM)crops(Hoban,2004).
Overtwo-thirdsoftherespondentsinthefollowingcountriesperceivedthatthebenefitsofgeneticallymodifiedfoodsoutweightherisks:US,Colombia,Cuba,DominicanRepublic,China,India,Indonesia,andThailand(Hoban2004).
Fewerthan40percentofconsumersinfourEuropeancountries(France,Greece,Italy,andSpain)andinJapanconsideredthebenefitsofGMcropsgreaterthantherisks.RespondentsinmostEuropeancountries,Japan,andSouthKoreaweremuchmorenegativeinoutlooktowardsagriculturalbiotechnologythaninotherpartsoftheworld(Hoban,2004).
AnotherstudybyEnvironicsInternationalentitled“FoodIssuesMonitor”probedintoconsumers’attitudetowardsGMfood.Consumersin10countrieswereaskedwhethertheywouldbuyfoodwithGMingredientsiftheresultingproductswerehigherinnutritionalvalue.Respondentsweregiventheoptionofcontinuingtobuytheproductortostopbuyingitiftheylearneditwasgeneticallymodified.Amongthestakeholdersincludedinthestudy,consumersinChinaandIndiaexhibitedthehighestsupportforGMfooditems.MajorityofconsumersfromtheUS,Brazil,andCanadagavesimilarsupportforGMfoodproducts.Ontheotherhand,majorityofEuropeanandAustralianconsumerswouldtendtorejectGMfoodseveniftheyweremorenutritious(Hoban,2004).
Overtheyears,trendsinawarenessonagriculturalbiotechnologyvaryacrosscountries.StudiesfoundthatawarenesstendstobehighinGermany,Austria,Denmark,andJapan.ItwasalsoquitehighinCanada,TheNetherlands,andinthreeotherScandinaviancountries.Nineother
Public Understanding and Perception of and Attitude Towards Agricultural Biotechnology �
Europeancountriesreportedrelativelylowerlevelsofawarenessofbiotechnology.Duringthelastfewyears,awarenessappearstohaveriseninEurope.Thisfluctuatingtrendcanbepartiallyattributedtomediacoverageandtoactivistswhooveremphasizedpotentialrisksofagriculturalbiotechnology.Moreover,anumberoffundamentalculturaldifferencesexistamongtheEuropeancountriesandinNorthAmericathatimpedethediffusionandacceptanceofinformationandknowledgeonagriculturalbiotechnology(Hoban,2004).
Trends in AsiaTheAsianFoodInformationCentre(AFIC)conductedman-on-the-streetinterviewswith600consumersinChina,Indonesia,andthePhilippines(AFIC,2003).Theresearchaimedtodeterminetheawarenessofandattitudeofconsumersinthethreecountriestowardsagriculturalbiotechnology,andfoodsafetyandqualityingeneral;andtoidentifyconsumers’demandforagriculturalbiotechnology,nutrition,andfoodsafetyinformation.
ResultsshowedthatmajorityoftheconsumerswereawarethatGMfoodsarepresentintheireverydaydietandtheywerenotworriedaboutit.ThosewhoreportedthattheyhadeatenGMfoodsalsoindicatedthattheytooknoactiontoavoidthem.Moreover,theyalsoexpressedtheirwillingnesstotrysamplesofGMfoods.
Respondentswerealsoaskedabouttheirconcernsonfoodsafetyandquality.Morethan90percentreportedastrongconcernonnutritionalvalue,microbialcontamination,andpesticideresidues;butnotonGMfoodswhichturnedouttobetheirleastconcern.
TheAFIC(2003)study,moreover,revealedthatAsianshaveapositiveattitudetowardsthebenefitsofbiotechnology-derivedfoods.Theyperceivedagriculturalbiotechnologyasameanstoimprovethenutritionalvalueoffoodandreducethefoodcost.About60percentofrespondentsreportedthattheyexpectedeitherthemselvesortheirfamiliestobenefitfromfoodbiotechnologyduringthenextfiveyears(Hoban,2004).
Knowledgeofagriculturalbiotechnologywasalsoassessed.ItrevealedthattheknowledgeofconsumersinChina,Indonesia,andthePhilippinesonscienceandtechnologyandtechnicaltermsassociatedwithagriculturalbiotechnologywasquitelow.However,consumershaveexhibitedawarenessofwhichcropshavebeendevelopedthroughbiotechnology(AFIC,2003).
Whenaskedaboutwheretheygetinformationonagriculturalbiotechnology,respondentsidentifiedmassmediaastheirprimarysourceofinformation.Theyalsoindicatedthattheypreferredmassmediaoverpublicsectorbodies.However,theyperceivedthatthelatter,suchasgovernmentagenciesandscientists,are“reliableandcredibleprotectorsofhumanhealthandsafety.”ConsumersalsoindicatednodemandforlabelingGMfoods(AFIC,2003).
ISAAA,incollaborationwithUIUC,conductedakeystakeholders’perceptionsurveyinfiveSoutheastAsiancountries:Indonesia,Malaysia,Philippines,Thailand,andVietnam.Thestudyfocusedonthekeystakeholders’knowledgeandunderstandingofagriculturalbiotechnology,theirviewsandopinionsabouttheimpactandroleofbiotechnology,sourcesandkindsofinformation,andtheirperceivedtrustworthysourcesoftruthaboutbiotechnology.ThestudyfoundthatSoutheastAsianshavehighinterestinbiotechnologyandstronglyappreciatedtheroleofscienceinthedevelopmentofagriculture.Inaddition,theyperceivedthatagriculturalbiotechnologyisnotarisktopublichealthandfoodsafety.Theyalsobelievedthat
Public Understanding and Perception of and Attitude Towards Agricultural Biotechnology �
agriculturalbiotechnologywillbringforthimprovementstoagriculturethat,inturn,canbenefitsmallfarmers.
RespondentswerealsoaskedabouttheirwillingnesstopaythecostforlabelingGMfoods.Businessmen,consumers,andfarmerleadersindicatedtheirdemandforsuchlabels,butnotallofthemwerewillingtopayfortheextracostinvolved.MajorityofthestakeholdersinThailand,Vietnam,Indonesia,andMalaysiaexpresseddisagreementwithposingextracosttoconsumersforfoodlabeling.However,therespondentsinthePhilippinesremaineddividedonthisissue(UIUC-ISAAA,2003).
WhenaskedabouttheirperceivedtrustworthysourcesoftruthaboutGMfood,majorityofthestakeholdersanswereduniversityscientistsandresearchinstitutesasthemosttrustworthy.Theyperceivedthissectorashighlyconcernedaboutpublichealthandsafetyissuesincludingbiotechnology.Thisisbecauseuniversityscientistsandresearchinstitutesareverycapableofassessingandmanagingtherisksassociatedwithagriculturalbiotechnology(UIUC-ISAAA,2003).
Trends in Indonesia TwosimilarresearchstudiesonpublicknowledgeandperceptionofandattitudestowardsagriculturalbiotechnologyinIndonesiawereexamined.Keyfindingsarepresentedtoestablishatrendandtodeterminethegapsthatthisstudyhopestoaddress.
TheUIUC-ISAAAstudyin2003employedanextensivesurveyofjournalists,scientists,farmerleadersandcommunityleaders,extensionworkers,consumers,businessmenandtraders,andreligiousleaders.Thesurveyfocusedonthefollowingvariables:1)interestinandconcernaboutagriculturalbiotechnology;2)perceivedrisksandbenefitsofbiotechnology;3)perceptionofinstitutionalconcernandinstitutionalaccountability;4)opinions,understanding,andknowledgeaboutscienceandbiotechnology;5)sourcesandcharacteristicsofinformationonbiotechnology;and6)attitudetowardsbiotechnology.
Moststakeholders,exceptforpolicymakers,showedhighinterestinandconcernaboutagriculturalbiotechnology.Farmerleadersandcommunityleadersledthestakeholdersinexpressingsuchhighinterestinagriculturalbiotechnology(UIUC-ISAAA,2003).
However,theAFICstudyin2003foundotherwise.AlthoughIndonesianrespondentsshowedlowconcernaboutbiotechnology,theyputmuchimportancetofoodsafetyingeneral.Whenaskediftheywereconcernedaboutthefoodtheyeat,Indonesianrespondents(99%)expressedthegreatestconcerncomparedwiththoseinChinaandthePhilippines.Mostoftherespondents,notonlyinIndonesiabutalsoinChinaandthePhilippines,indicatedthattheirmainconcernisfoodcontent,specificallythenutritionalvalueofthefood.AnothersignificantfindingwasthatIndonesianrespondentswerealsoconcernedaboutthepreservativesoradditives(20%)containedinthefoodtheyeat,andadequatefoodpackaging(28%)(AFIC,2003).
Intermsoftherespondents’perceptionofagriculturalbiotechnology,surveyresultsshowedthatingeneral,Indonesianstakeholdersdonotreallyseebiotechnologyasposinghighriskstopublichealthandfoodsafety.Indeed,themajorityofIndonesia’sstakeholdersviewagriculturalbiotechnologyashavingmoderatetohighbenefits.Thisviewwasparticularlyevidentamongconsumers,farmerleaders,policymakers,extensionworkers,andscientists(UIUC-ISAAA,2003).
Insupportoftheaforementionedfindings,theAFICstudyfoundthatIndonesiatopstheother
Public Understanding and Perception of and Attitude Towards Agricultural Biotechnology �
twocountriesinbelievingthatbiotechnologyfoodshaveassociatedbenefits.EightysixpercentofIndonesianrespondentscited“improvedeatingquality”asthebenefittheymostexpect.MorethanhalfofIndonesianrespondents(57%)believedthat“improvedshelflife”couldbeasignificantbenefitofagriculturalbiotechnology(AFIC,2003).
Astotheirunderstandingofscienceandknowledgeaboutagriculturalbiotechnology,majorityofIndonesia’sstakeholdersgavethemselvesmoderatetolowratings.Inapop-quizof12statementstomeasuretheirknowledgeonbiotechnology,mostofthestakeholdersobtainedmoderatescores.Amongthosewhoobtainedrelativelyhighscoresinthepop-quizwerebusinessmenandconsumers(UIUC-ISAAA,2003).
Regardingrespondents’awarenessofterminologiesusedinbiotechnology,researchersfoundsuchawarenesstobelowamongallthestakeholdersinthethreecountries.Forthosefewwhoreportedlevelofawarenessoftheseterms,themostcommondefinitionsare:1)changingthegeneticcodecontentofaproduct,2)productionofabetterproduct,and3)additionofothercomponentstoaproduct.Moreover,respondentsalsoratedthemselves“verylow”intheawarenessoftheterms‘geneticallymodifiedfoods’and‘biotechnologyderivedfoods’(AFIC,2003).
Thestudyalsolookedintotherespondents’awarenessofthescopeoffoodbiotechnology.WhenIndonesianrespondentswereaskedtogiveanexampleofbiotechnology-derivedfoods,tomatowasfoundtobethemostpopular(AFIC,2003).
Regardingrespondents’attitudetowardsagriculturalbiotechnology,likeinthePhilippines,Indonesianstakeholderstookanoverwhelminglymoderatepositiononagriculturalbiotechnology.Sixty-ninepercentofthestakeholdersexpressedatleastanabove-moderatestanceonbiotechnologywiththeexceptionofpolicymakersat40percent.However,noremarkablenumberssuggeststronglypositiveattitudestowardbiotechnology(UIUC-ISAAA,2003).
Indonesia’sstakeholdersputenormoustrustonscientificorganizations.Allsevenstakeholdersalsoperceiveduniversityscientistsandagriculturalbiotechnologycompaniesashighlyconcernedentitieswithregardtoagriculturalbiotechnologyissues(UIUC-ISAAA,2003).
Amongallthestakeholders,journalists,consumers,policymakers,andscientiststendtogetinformationonbiotechnologyfrombothmassmediaandinterpersonalsourcesmorefrequentlythantheotherstakeholders.Whenaskedaboutthesourcesofinformationtheytrustedmost,Indonesianstakeholdersciteduniversityscientistsashighlytrustworthysources,followedbysciencemagazinesandnewspapers(UIUC-ISAAA,2003).
SimilarfindingswerepresentedbytheAFICstudy.Seventy-fivepercentoftheIndonesianrespondentsgotinformationfromthenewspapers.However,52percentoftheIndonesianrespondentspreferredthegovernment,specificallytheDepartmentofHealth,tobetheirprimarysourceofinformation.About49percentofIndonesianswantedsuchinformationtobeinmagazines,while36percentsaidtheypreferredsupermarketstoinformthemaboutfoodbiotechnology(AFIC,2003).
Public Understanding and Perception of and Attitude Towards Agricultural Biotechnology �0
Research Design
hisstudyusedthesurveydesign,whichwasdeemedappropriateinobtaininga pictureofthebehavioralpatternofacross-sectionofstakeholders’populationinselectedareasinIndonesiaconcerningagriculturalbiotechnology.
Locale of the StudyCriteriaforchoosingtheareasinIndonesiawhererespondentswereselectedfromwereasfollows:
ThereisanexistinginstitutionlinkedwiththeBiotechnologyInformationCenterthroughwhichdatagatheringmaybecoordinatedwith;and
Peoplearefamiliarwithorhavebasicknowledgeofbiotechnology.
Basedontheabovecriteria,theidentifiedprojectsitesincludedBanten/Tangerang,Lampung,JawaBaratinBogorProvince,JabarinWestJava,DaerahIstiemwainYogyakartaandinIndonesia’scapital,Jakarta.
Sampling of Respondents Samplerespondentswerechosenfromthefollowingeightstakeholdergroups:
1. Businessmenandtraders2. Consumers3. Extensionworkers4. Farmerleadersandcommunityleaders5. Journalists6. Policymakers7. Religiousleaders8. Scientists
Astatistically-determinedsamplesizeforthedifferentstakeholderswasderivedbyastatistician.
Part 33 Methodology
T
Public Understanding and Perception of and Attitude Towards Agricultural Biotechnology ��
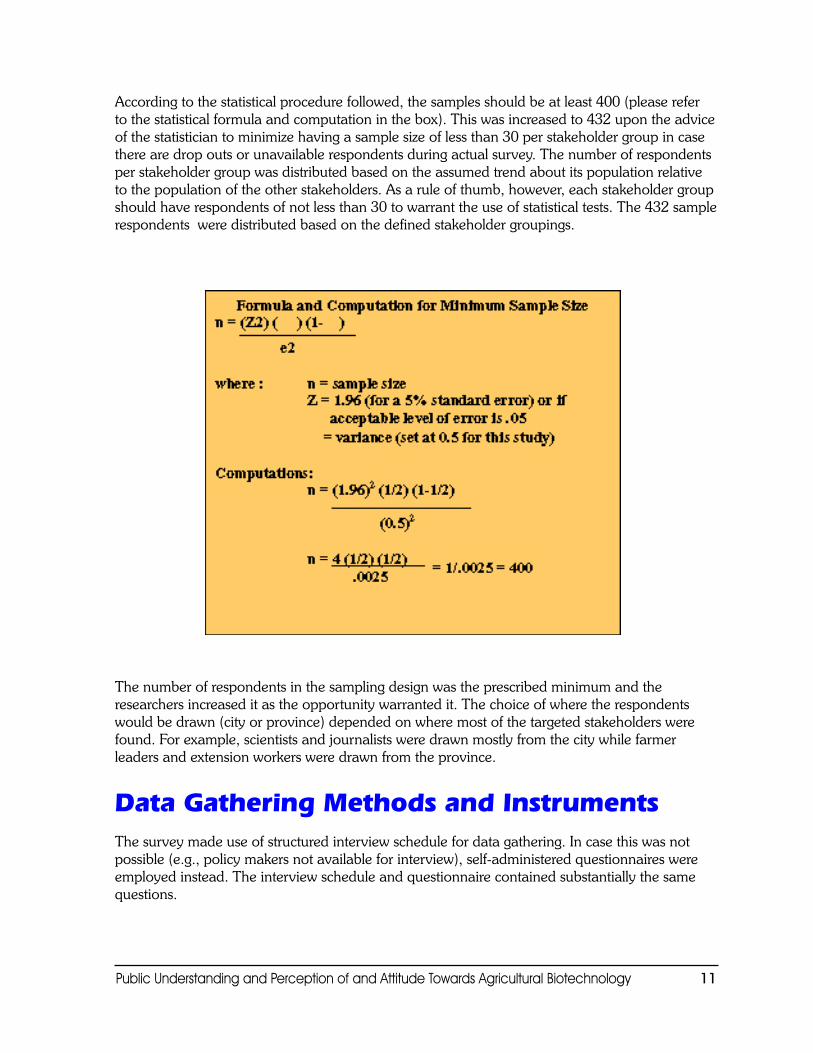
Accordingtothestatisticalprocedurefollowed,thesamplesshouldbeatleast400(pleaserefertothestatisticalformulaandcomputationinthebox).Thiswasincreasedto432upontheadviceofthestatisticiantominimizehavingasamplesizeoflessthan30perstakeholdergroupincasetherearedropoutsorunavailablerespondentsduringactualsurvey.Thenumberofrespondentsperstakeholdergroupwasdistributedbasedontheassumedtrendaboutitspopulationrelativetothepopulationoftheotherstakeholders.Asaruleofthumb,however,eachstakeholdergroupshouldhaverespondentsofnotlessthan30towarranttheuseofstatisticaltests.The432samplerespondentsweredistributedbasedonthedefinedstakeholdergroupings.
Thenumberofrespondentsinthesamplingdesignwastheprescribedminimumandtheresearchersincreaseditastheopportunitywarrantedit.Thechoiceofwheretherespondentswouldbedrawn(cityorprovince)dependedonwheremostofthetargetedstakeholderswerefound.Forexample,scientistsandjournalistsweredrawnmostlyfromthecitywhilefarmerleadersandextensionworkersweredrawnfromtheprovince.
Data Gathering Methods and Instruments Thesurveymadeuseofstructuredinterviewschedulefordatagathering.Incasethiswasnotpossible(e.g.,policymakersnotavailableforinterview),self-administeredquestionnaireswereemployedinstead.Theinterviewscheduleandquestionnairecontainedsubstantiallythesamequestions.
Public Understanding and Perception of and Attitude Towards Agricultural Biotechnology ��
Data AnalysesDatawereanalyzedusingacombinationofquantitativeanddescriptivetechniques.Frequencycounts,percentages,ranges,andweightedmeanswereusedtodescribethestakeholders’socio-demographiccharacteristics,worldviewsandvalues,informationsources,understandingandperceptionofandattitudetowardsagriculturalbiotechnology.Relationshipsbetweenthesocio-culturalfactorsandthestakeholders’understandingandperceptionofandattitudetowardsagriculturalbiotechnologywereanalyzedusingmeasuresofassociationsuchastheChi-squaretestandtheSpearmanRankCorrelationtest.
Public Understanding and Perception of and Attitude Towards Agricultural Biotechnology ��
Socio-Demographic Characteristics
heIndonesianrespondentsweremostlymale(70.8%)andmarried(67.6%).Interms ofage,theywerenearlyequallydistributedintothe21-30(30.5%),31-40(27.7%)and41-50(27.1%)agebrackets.Thoughnotamajority,manycamefromrural(44.1%)andsuburban(41.3%)areas.Nomajoritytrendwasnotedintermsofeducationasrespondentswerequitedistributedintothosewithcollegedegrees(29.1%),highschoolgraduate(25.25%),andsomecollegeeducation.Asexpected,therespondentswerepredominantlyMuslims.Detailsofdistributionofrespondentsbasedonthesesocio-demographiccharacteristicsareshowninAppendixTables1-6.
Othertrendsshowedthatextensionworkerstendtobeofolderageandtheconsumers,younger.Also,agreaternumberofpolicymakers(57.6%),scientists(57.1%)usuallycamefromsuburbanareas.Thoughnotamajority,manyofthejournaliststendtocomefromsuburban(42.9%)andurbanareas(37.1%).Theseareusuallytheareaswheretheypracticetheirbeat.
Worldviews and ValuesTodeterminetheworldviewsandvaluesoftherespondents,theywereaskedtoratetheirdegreeofagreementordisagreementwith11statementspertainingtotheuseandapplicationofbiotechnology,Four-pointratingscalewasusedwith1asthelowestand4,thehighest.
Ofthese11items,onlythestatementpertainingtotheirattendanceininformationsessiononbiotechnologyinfoodproductionthattheircommunitywillholdgarneredmajority(60%)agreementfromallthestakeholders(AppendixTable7).Thetrendofmorethan50%agreeingtothestatementwascommonforallstakeholdergroups,exceptforthejournalists,many(44%)ofwhomdisagreed.Responsesweremoredispersedfortheother10items.Detailsarediscussedbelow.
The use of biotechnology in food production is against my moral values.
Religiousleaders(60%)expressedreservationsaboutthemoralandethicalconsiderationsofagriculturalbiotechnology.Considerablymorefromtheirranksagreedthattheuseofbiotechnologyinfoodproductionwasagainsttheirmoralvalues(AppendixTable7).This
Part 44 Results and Discussion
T
Public Understanding and Perception of and Attitude Towards Agricultural Biotechnology ��
wasfurthercorroboratedbytheirweightedmeanof2.5(nearlyagree).Ontheotherhand,policymakers(66.7%),extensionworkers(63.9%),consumers(50.5%),andscientists(50.0%)disagreedthattheuseofbiotechnologyinfoodproductionwasagainsttheirmoralvalues.Highestweightedmeanof2.6wasobservedforjournalistsand2.5forfarmerandcommunityleaderssuggestingthatthesetwogroupstendtoagreewiththestatementabove,justlikethereligiousleaderswith2.5.
If my community would hold an information session on biotechnology in food production, I would attend.
Manyofthejournalists(44%)disagreedwiththeabovestatementimplyingtheirnon-preferenceforcommunityinformationsessionsonbiotechnology.Thoughtheirweightedmeanof2.8reflectsagreementwiththestatement,itwasthelowestamongallweightedmeansforthedifferentstakeholders.Alltheotherstakeholders,basedonfrequencyandweightedmean,indicatedtheirsupporttothisactivity(AppendixTable7).
Foods that have been genetically altered should be labeled.
Nomajoritytrendwasnotedbutmanyagreedwiththestatement.Forthejournalists,itdoesnotmatterthatgeneticallyalteredfoodsbelabeledasindicatedbyonly5.7percentagreeingtodoso(AppendixTable7).Stakeholderswhostronglyagreedtodosobasedontheirweightedmeanswerethebusinessmenandtraders(3.4),consumers(3.3),farmerleadersandcommunityleaders(3.3),andscientists(3.5).
Genetic manipulation takes mankind into realms that belong to God and God alone.
Thosewhodidnotconformwiththisstatementwerefromtheranksofpolicymakers(63.6%)andscientists(54.3%).Thesetwosectorsareactuallyheavilyinvolvedintheuseofscienceintheirwork,thus,theirview.Veryfewrespondentsagreedwiththisstatement.Asindicatedbytheweightedmeanof2.6,thejournalistswereinclinedtoagreethatgeneticmanipulationtakesmankindintorealmsthatbelongtoGodalone.
Until we know that genetically altered foods are totally safe, those products should be banned.
Combiningthepercentagesfor‘stronglyagree’(16.1%)and‘agree’(21.35)andcomparingtheirsum(47.4%)withcombinedpercentages(45.7%)ofthosewhodisagreed(36.4%)andstronglydisagreed(9.3%),itcanbesaidthatmanytooksidewiththestatement.ThismeansthatmanyinIndonesiastillbelievethatgeneticallyalteredfoodsshouldbebanneduntilitisproventhattheyaresafe.Majorityofthestakeholders,though,expresseddisagreementwiththisstand.Theweightedmeanofscientists(3.2)andjournalists(3.1.)indicatetheirconservativestandtofavorthestatement(AppendixTable7).
We have no business meddling with nature.
Public Understanding and Perception of and Attitude Towards Agricultural Biotechnology ��
About50percentofthestakeholdersdidnotagreewiththisclaim.Scientists(62.9%)andpolicymakers(60.6%)weretheleadingoppositioniststothisstatement.Whilethereweregenerallyafewwhoagreedwiththisview,itisnoteworthythatmanyofthemcamefromthejournalists(42.9%)morethanthereligiousgroup(22.9%)(Table7).Basedonweightedmeanof2.5forbothjournalistsandfarmer/communityleaders,itcanbesaidthatthesegroupstendtoagreethatwehavenobusinessmeddlingwithnature.
I am willing to pay the extra cost for labeling GM foods.
Therewasnomajoritytrendastothisstatement.Therewas,however,analmostequalnumberofrespondents,regardlessofstakeholdergroups,whowerewilling(26.3%)andnotwillingtopaytheextracostforlabelinggeneticallymodifiedfoods(25.4%).Thosewillingweremostlythebusinessmenandtradersasindicatedbytheirmeanof2.7.Unwillingwerethefarmerandcommunityleaderswithaweightedmeanof1.8andscientistswith1.7signifyingdisagreement.
The regulation of modern biotechnology should be left mainly to industry.
Basedontheweightedmeanofnearly2.0,allstakeholdergroupsdidnotagreethatregulationofbiotechnologyshouldbeleftmainlytoindustry.Majorityofthepolicymakers(62.5%)andthebusinessmen(57.5%)opposedthisstand.
Genetic engineering means nutritious and cheaper foods for consumers.
Nomajoritytrendwasobservedforthisitem.Worthnotingwasthefactthataboutone-fifthofthestakeholders(21.2%)didnotknowanythingaboutthisconcern(Table7).Weightedmeansindicatethatextensionworkers(2.9%),consumers(2.7%),andbusinessmenandtraders(2.6)supportthisstatementwhilejournalists(2.1)donot.
Consumers have a right to choose what they eat; hence, to know what they are eating.
Respondentsfromallsectorswereoneinsayingthatconsumershavearighttochoosewhattheyeat,hence,toknowwhattheyareeating.Mostofthosewhoheldthisviewcamefromthepolicymakers(60.6%)andthescientists(60.0%)(Table7).Weightedmeansforallstakeholdergroups,exceptforjournalists,rangedfrom3.0toashighas3.6.Thelatter’sviewfallsonaborderlinebetweenagreeanddisagree.
Onthewhole,itcanbesaidthatamongtheIndonesianstakeholdersinagriculturalbiotechnology,itisthejournalists whichconsistentlyexhibitedunfavorableattitudetowardsbiotechnology.Theywouldnotattendcommunitysessionsonbiotechnology,believedthatbiotechnologyisagainsttheirmoralvalues,werenotwillingtopayforextracostoflabeling,believedthatwehavenorightmeddlingwithnature,anddidnotagreethatbiotechnologywouldleadtonutritiousandcheaperfood.
Information Sources on Biotechnology
Public Understanding and Perception of and Attitude Towards Agricultural Biotechnology ��
InformationExposure
Ontheaverage,allthestakeholdershadlowexposuretoinformationonbiotechnologyinthelasttwomonths.Aboutone-thirdeachhadbeenexposedonlyonceandnoneatalltomassmedia(AppendixTable8).Talkingtoorhearingfrompersonsourcesaboutbiotechnologywasgenerallynotpracticedbythedifferentstakeholders.
InformationSourcesonBiotechnology
Majorityoftherespondentsinallstakeholdergroupshadnotaccessedthemassmediaonmatterspertainingtobiotechnologyinthepasttwomonths.Thefewwhomadeuseofmassmediacamefromthegroupsofreligiousleaders(25.7%)andthescientists(22.9%).Thefollowingsourceswerealsonotfrequentlyaccessedbytherespondents:Internet;booksonbiotechnology;newsletter/pamphlets/brochuresonbiotechnology;andseminars/publicforumsonbiotechnology(AppendixTable8).
Thepatternofresponsesonsourcesofinformationonbiotechnology,likewise,revealedthatthestakeholdersdidnotrefermuchtointerpersonalsourcesforinformationonagriculturalbiotechnology.Thesepersonsourceswereinfactnotcontactedonbiotechnology-relatedmattersbymajorityofrespondentsfromallgroupsinthepasttwomonths.
However,aconsiderablenumberofreligiousleadershadtalkedtoorheardaboutbiotechnologyfromfellowreligiousfigures(42,9%);accessedawebsite(45.7);readbooks,newspapers,pamphlets,brochures(31.4%);talkedtoandheardfromfoodregulators(40.0%);andattendedseminarsandpublicforums(48.6%).Thesesuggestthatreligiousleadersarequiteinterestedinbiotechnologyastheyhavebeenactivelyseekingandreceivinginformation.Itfurtherimpliesthattheyhavehighpotentialassourcesofbiotechnology-relatedinformation.
ExtentofTrustinInformationSources
Ingeneral,respondentsfromallstakeholdergroupshadonlymoderatetrustonvariousinformationsourcesonbiotechnology(AppendixTable9).University-basedscientists(59.0%)andsciencemagazinesandnewsletters(49.2%)weretheonlyinformationsourcesidentifiedbyallstakeholdersastheonesthey“totally”trusted.Thisisunderstandablesincetheyarelookeduponashavingthecompetenceonbiotechnology,beingmorefamiliarwithscience.
Trustworthyinformationsourcesbasedontheweightedmeansof3.0andaboveamongallstakeholdergroupsweretheagriculturalworkers/services,newspapers,privatesectorscientists,radiobroadcasts,TVbroadcasts,andwebsites.Thosehavingrelativelylowtrust(withweightedmeansrangingfrom2.2to2.7)werefamily/friends/neighborsanddealersofagriculturalinputs.Trustonreligiousleadersassourcesofinformationonbiotechnologywasgenerallymoderate(AppendixTable9).
UsefulnessofInformationinMakingJudgments
Public Understanding and Perception of and Attitude Towards Agricultural Biotechnology ��
Despitelowexposuretoinformationsourcesonbiotechnology,therewasageneralagreementamongallthestakeholdersthattheavailableinformationonbiotechnologywasveryuseful(53.6%)inmakingjudgmentsabouttheapplicationsofbiotechnologyinfoodproduction.Theweightedmeansfurthersupportthis.Thosewhofoundthebiotechnologyinformation“veryuseful”includedtheextensionworkers(65.5%),religiousleaders(62.9%),farmerandcommunityleaders(62.9%),businessmenandtraders(52.6%),andscientists(51.5%)(AppendixTable10).
Itisinterestingtonotethat61.8percentofthejournalistsfoundtheinformationfromvarioussourcesonlyasonly“useful.”Thissuggeststhatthejournalistsalsohavesomedegreeofreservationregardingthestoriestheircolleaguesandtheotherinformationsourceswriteaboutagriculturalbiotechnology(AppendixTable10).
Usefulnessofinformationwasmeasuredusinga3-pointscale,with1asthelowestand3asthehighest.Forallstakeholdergroups,perceivedusefulnessofinformationrangedfromaweightedmeanof2.3to2.6,implyingaratingof“veryuseful.”
PerceptionofHowScientifictheInformationonBiotechnologyAre
Theapparenttrendbasedonfrequencycountingandweightedmeansisforthestakeholders(50.%)toperceivetheinformationtheygetonbiotechnologyas“veryscientific.”Thisviewwashighestamongtheextensionworkers(67.2%),farmerleadersandcommunityleaders(67.1%),andreligiousleaders(57.1%).Consistentwithearlierfindings,thejournalists(71.4%)werequiteconservativeinsayingthattheinformationtheyusuallygetwas“somewhatscientific”(AppendixTable11).Fromascaleof1(lowest)to3(highest),theweightedmeansrangedfrom2.3toashighas2.7forthevariousstakeholdersindicatingthattheyperceivetheinformationtheygetonagriculturalbiotechnologyasveryscientific.
Understanding of Biotechnology UnderstandingofScience
Stakeholderswereaskedtoratetheirunderstandingofsciencefrom1(poor)to3(verygood).Nostakeholdergroupclaimedtohavingverygoodunderstandingofscience.Eventhescientistsratedthemselvesonlyas2.2orhavingonlyadequateunderstandingofscience(AppendixTable12).
Oftheeightgroups,thereligiousleaders(57.1%)ownedtohavingpoorunderstandingofscience.Theyhadthelowestweightedmeanratingof1.5.Aconsiderablepercentageofextensionworkers(45.8%)alsoratedthemselvesashavingpoorunderstandingofscienceandtheirweightedmeanratingof1.6wasveryclosetothatofreligiousleaders.Therestofthestakeholdergroups–businessmenandtraders,consumers,extensionworkers,farmerleadersandcommunityleaders,journalists,policymakers,andscientists–feltthey
Public Understanding and Perception of and Attitude Towards Agricultural Biotechnology ��
hadadequateunderstandingofscience.Thegroupwiththegreatestnumberwhosaidtheyunderstoodsciencewasthatofjournalists(77.1%),followedbythegroupsofscientists(71.4%),andpolicymakers(69.7%)(AppendixTable12).
KnowledgeontheUsesofBiotechnologyinFoodProduction
Knowledgeontheusesofbiotechnologyinfoodproductionwasratedusinga3-pointscale,where:1=knownothingatall,2=knowsome,and3=knowagreatdeal.Weightedmeansforthedifferentstakeholdergroupsrangedfrom1.6to2.2suggestingthatrespondentsonlyknewsome(andnotagreatdeal)oftheusesofbiotechnologyinfoodproduction.
Closetohalfofthereligiousleaders(45.7%)claimedknowingnothingatallandtheirweightedmeanof1.6furthersupportsthisclaim.Theeightstakeholdergroupswereunanimousinclaimingmoderateknowledgeabouttheusesofbiotechnologyinfoodproduction.Leadingthepackwerethepolicymakers(87.9%),journalists(85.7%),extensionworkers(78.7%),andconsumers(75.7%)(AppendixTable13).
UnderstandingoftheUsesofBiotechnologyinFoodProduction
Togaugetherespondents’understandingofbiotechnologyingeneralanditsroleinfoodproductioninparticular,theywereaskedtoevaluatetheveracityof13statements(AppendixTable14).Majorityoftherespondentsinallthestakeholdergroupscorrectlyassessedthefollowingfivestatementstobetrue:
Inreality,allcropshavebeen“geneticallymodified”fromtheiroriginalstatethroughdomestication,selection,andcontrolledbreedingoverlongperiodsoftime.
Yeastforbrewingconsistsoflivingorganisms. Witheverynewemergingtechnology,therewillalwaysbepotentialrisks. Ingeneticengineering,genesofinterestaretransferredfromoneorganismtoanother. Plantvirusesinfectvegetablesandfruits.
However,majority(65.1%and67%)werewronginbelievingthatgeneticallymodifiedcropswerebeinggrownandsoldinIndonesiaatthetimethisstudywasconducted.ThiswasactuallyamisconceptionsincegrowingofGMcropssuchascottonwasnotanymoregoingoninIndonesiaatthattime.Religiousleaders(60.0%)infactwerenotawareofthis(AppendixTable14).
Sixoftheeightstakeholdergroupscorrectlyperceivedthatplantvirusesinfectvegetablesandfruits.Majorityofthescientists(60%)thoughtthestatementwasfalse.Thiscouldimplythatthescientistsareholdingontowrongknowledgeaboutusesofbiotechnologyinfoodproduction.Thereligiousleaders,ontheotherhand,werealmostdividedintobelievingthisstatementaseitherfalse(37.1%)ortheydidnotknowatall(34.3%)(AppendixTable14)..Meanwhile,fourstatementswerecorrectlyperceivedtobefalsebythemajorityofthestakeholder
Public Understanding and Perception of and Attitude Towards Agricultural Biotechnology ��
groups.Thesewere: Ordinarytomatoesdonotcontaingenes,whilegeneticallymodifiedtomatoesdo. Plantvirusesaretransferredtohumanswhentheyeatvegetablesandfruitsinfectedwith
plantviruses.” Sciencecanguaranteezero-risk. Byeatinggeneticallymodifiedcorn,aperson’sgenescouldalsobemodified.
Therewasonlyonestatementwhichmajorityclaimedtheydidnotknowmuchaboutandthiswas:Goldenrice(geneticallymodifiedrice)containsbeta-carotene.Onlythescientists(62.9%)correctlydeclaredthatgoldenricecontainedbeta-carotene.
Thefact“Morethanhalfofhumangenesareidenticaltothoseofamonkey”wasconsideredtruebymany(41.3%),thoughnotamajority,oftherespondents.Worthnotingisthefactthataboutone-third(33.4%)didnotknowtheanswer(AppendixTable14).
FactualKnowledgeofBiotechnology:UseofBiotechnologyCrops
Theoreticalscenariosofpossiblebiotechnologycropsweregiventothestakeholders.Theywereaskedwhattheywoulddoifanumberofthesebiotechnologycropsaredeveloped.Theyweregiventhefollowingchoices:togroworplantthecrop,useitasfood,asanimalfeed,orasindustrialby-products(AppendixTable15).
Inmostinstances,Indonesianrespondentsweremoreinterestedtouseagriculturalbiotechnologyproductssuchastomato,papaya,eggplant,corn,andriceforfoodandasplantingmaterialratherthanasanimalfeedandindustrialby-products.Theseareshownbyhigherfrequencycountsobtainedfortheseusesbasedonmultipleresponsesofstakeholders(AppendixTable15).Onlybiotechnologycornwashighlypreferredtobeusedforindustrialby-products.
FactualKnowledgeofBiotechnology:ImportanceofFoodCharacteristics
Respondentswereaskedtoratethisitemusinga4-pointscaleasfollows:1-veryunimportant,2-moderatelyunimportant,3-moderatelyimportant,and4-veryunimportant.
Whenusingbiotechnologyinfoodproduction,foodcharacteristicsconsideredimportantbymajorityofthestakeholderswereasfollows:non-poisonous(60.8%),nutritionalquality(60.4%),andpesticideresiduecontent(51.9%)(AppendixTable16).Othercharacteristicssuchasbeingnon-allergenic,price,foodappearance,andbettertastedidnotcomeashigh.Theweightedmeansformostitems,though,rangedfrom3.0andaboveindicatingthatallfoodcharacteristicsareconsideredeithermoderatelyorveryimportant.
Notablewasthetrendforthejournalists,amongallotherstakeholders,toexpresshighestconcernonallfoodcharacteristics.Thisisindicatedbytheirconsistentlyhighfrequencycountsandweightedmeans(3.0andabove)forallthefoodcharacteristicscited.Thescientists,ontheotherhand,consideredtasteasmoderatelyunimportant(85.7%)whenconsideringbiotechnologyforfoodproduction(AppendixTable16).
Public Understanding and Perception of and Attitude Towards Agricultural Biotechnology �0
Perception of Agricultural BiotechnologyPerceivedRisksThosewhoconsideredtheuseofbiotechnologyhazardousinfoodproductionoutnumberedthosewhothoughtotherwiseacrossallcategories.However,responsesveeredmoretowards“somewhathazardous”(39.3%)than“veryhazardous”(9.6%).Asizeablenumber(36.4%)hadnoopiniononthematter,toppedbyextensionworkers(42.6%),businessmenandtraders(40%),andscientists(40%)(AppendixTable17).
Basedonthe3-pointratingscale(where1=veryhazardous,2=somewhathazardous,and3=notatallhazardous),weightedmeansforallstakeholderssuggestthattheyfindtheperceivedrisksassociatedwiththeuseofbiotechnologyassomewhathazardous.Thissupportsthetrenddepictedbyfrequencycounts(AppendixTable17).
PerceivedBenefits
Thesameratingscaleusedforperceivedriskwasusedforthisitem.Basedonweightedmeans,theextensionworkers(2.7),religiousleaders(2.6),andpolicymakers(2.5)foundthebenefitsofagriculturalbiotechnologyasverybeneficial(AppendixTable18).
Basedonfrequencycounts,however,onlythegroupofextensionworkers(54.1%)hadamajorityperceivingthebenefitsasverybeneficial.Nomajoritytrendwasdepictedforotherstakeholders.Itshouldbenotedthoughthataboutonefourthormoreamongallthestakeholdergroupsindicatednoopinionontheperceivedbenefitsofbiotechnologyinfoodproduction.Thesepeoplehaveyettoformtheiropinions;hence,theycompriseanimportantsegmentthatcommunicationcampaignsaboutbiotechnologymaystillinfluence(Table18).
PerceptionofAgriculturalBiotechnology
Forthispart,respondentswereaskedtorate12itemspertainingtoregulationsinbiotechnologyusinga4-pointscale:1=stronglydisagree;2=disagree,3=agree,and4=stronglyagree.
Basedonfrequencycounts,majority(55.4%)ofallthestakeholdergroupsstronglyagreedthatgovernmentagenciesinIndonesiaaredoingtheirbesttoensurethatthefoodtheyeatissafe(AppendixTable19).Basedonweightedmeans,strongagreementcamefromthebusinessmenandtraders(3.7),religiousleaders(3.7),andextensionworkers(3.6)(AppendixTable19).
Mereagreementwasgiventothethreestatementsbelowandthisissupportedfurtherbytheweightedmeansobtainedforthevariousstakeholders:
BiotechnologyisgoodforIndonesianagriculture. Expertstatementsonbiotechnologyarebasedonscientificanalysisandare,therefore,
Public Understanding and Perception of and Attitude Towards Agricultural Biotechnology ��
objective. Regulationsonbiotechnologyshouldincludeinputsfromthenon-governmentsector.
Amongthestakeholdergroups,thescientistsbelievedthatbiotechnologyisgoodfortheIndonesianagriculture(65.7%),andthatexpertstatementsarebasedonscientificanalysesandare,therefore,objective(65.7%).Similarly,thepolicymakersbelievedthatregulationsonbiotechnologyshouldincludeinputsfromnon-governmentsector(60.6%)(AppendixTable19).
Ontheotherhand,alittlelessthan50percentofstakeholdersdidnotbelievethat:
Biotechnologyinfoodproductiononlybenefitslargeagriculturalcompanies(46.6.%). Vitalinformationaboutthehealtheffectsofgeneticallymodifiedfoodsisbeingheldback
(46.3%).
Weightedmeansalsosuggestrespondents’disagreementwiththeseitems.
Stakeholdersarequitedistributedwhenitcomestothestatementthat“geneticengineeringoffoodproductscouldcreateunexpectednewallergensorcontaminateproductsinunanticipatedways,resultinginthreatstopublichealth.”Meanratings,though,suggestagreementwiththisitem(AppendixTable19).
InstitutionalConcernAboutHealthandSafety
Therespondentsperceivedthefollowingsectorstobehighlyconcernedaboutpublichealthandsafetywithregardtoagriculturalbiotechnology:internationalresearchinstitutions(64.6%),university-basedscientists(64.2%),governmentresearchinstitutions(59.6%),andconsumergroups(53.7%)(AppendixTable20).
Theyperceivedtherestasbeingjust“somewhatconcerned”andthisissupportedfurtherbythetrendinweightedmeansforallitemstoapproximatetheratingof3or“somewhatconcerned.”
PerceptionthatScienceShouldbeaPartofAgriculturalDevelopment
Majorityofrespondentsfromallstakeholdergroups(78.6%)indicatedthatscienceshouldbeverymuchapartofagriculturaldevelopmentinIndonesia,withthemostfrequentpositiveresponseexpressedbyfarmerleadersandcommunityleaders(88.0%)andscientiststhemselves(85.7%).NoneofthescientistsandextensionworkersagreedwiththenegativestatementthatscienceshouldnotbeapartatallofagriculturaldevelopmentinIndonesia(AppendixTable21).Alltheweightedmeansrangingfrom2.5to2.8(with3asthehighest)suggeststrongsupporttothisitem.
Attitude Towards Agricultural Biotechnology
Public Understanding and Perception of and Attitude Towards Agricultural Biotechnology ��
InterestinBiotechnologyinFoodProduction
Nomajoritytrendwasobservedforthisitem.Despitethestakeholders’beliefthatscienceshouldbeapartofagriculturalproduction,itisironicthatmostofthem(46.4%)wereonlymoderatelyinterestedintheusesofbiotechnologyinfoodproduction.Mostcamefromthegroupsofjournalists(58.8%),policymakers(54.5%),extensionworkers(52.5%),andbusinessmenandtraders(50.0%)Weightedmeansrangingfrom1.9to2.4(with3asthehighest)supportthisfinding(AppendixTable22).
ConcernonUsesofAgriculturalBiotechnologyinFoodProduction
Similarly,therespondentsfromallsectorsweregenerally“somewhatconcerned”(59.2%)abouttheusesofagriculturalbiotechnologyinfoodproduction.Thisisfurtherconfirmedbytheweightedmeansforthisitemrangingfrom1.6to2.2(with2beingequivalenttosomewhatconcerned).Itshouldbenotedthattwooutoffiveamongthereligiousleaders(42.4%),werenotatallconcernedwiththisissue(AppendixTable23).
AttitudeTowardsBiotechnology
Todeterminethevariousstakeholders’attitudetowardsbiotechnology,theywereaskedtoindicatetheirdegreeofagreementordisagreementwithsixstatementsconcerningactivitiesoractionsaboutbiotechnology.A4-pointratingscalewasusedwith1asthelowestand4asthehighest.
Majoritytrend(53.2%)wasnotedonlyforthestatement“If my community would hold an information session on biotechnology in food production, I would attend.” Levelofagreementforallstakeholdergroupsasshownbytheweightedmeanratingsrevolvesaroundtheratingof3oragreeandnotstronglyagree(AppendixTable24).
Stakeholderswerenotwillingtocontributetheirtimeandmoneytoanorganizationthatpromotesabanongeneticallymodifiedfoods.Thisisbestreflectedbytheweightedmeansofthevariousstakeholdersthatrangedfrom1.8to2.3indicatingdisagreement.Themostwhodisagreed(51.5%)camefrompolicymakers.One-fourthhaveuncertainstandonthisissueandmanycamefromreligiousleaders(38.2%)andpolicymakers(33.3%)(AppendixTable24).
Astolabelingofgeneticallyalteredfoods,weightedmeans(3.2to3.5)forallstakeholdersreflectagreement,thoughintensitywasnotverystrong.Majoritywerefromreligiousleaders(54.3%),businessmenandtraders(52.5%),andpolicymakers(50.0%)(AppendixTable24).Thoughtherewasagreementtolabelgeneticallyalteredfoods,stakeholderswere,however,notinclinedtopayforsuchbasedonbothfrequencydistributionandweightedmeans(2.1to2.4).Again,religiousleadershadamajoritydisagreeingtothis(AppendixTable24).Therewasageneraltrendforallstakeholderstoeitheragree(46.9%)orstronglyagree(41.9%)withregardtothepublicbeingconsultedinformulatingfoodregulationsandlaws.Weightedmeans(3.1to3.5)indicateagreement.AllstakeholdersbelievedthatthepublicshouldbedirectlyconsultedinapprovingR&Dinagriculturalbiotechnology.Majorityofthescientists(51.4%)stronglysupportedthisandextensionworkers(54.1%)alsoagreedtothis(Appendix
Public Understanding and Perception of and Attitude Towards Agricultural Biotechnology ��
Table24).
FramestobeUsedWhenMakingJudgmentsAboutBiotechnologyApplications
Thisissuewasaskedonlytothepolicymakersandscientistsandnotallthestakeholders.Thereweresixbiotechnologyapplicationswhichthesetwostakeholderswereaskedtorateifevertheywouldconsiderthemwhenmakingjudgmentsonbiotechnology.A4-pointratingscalewasused,with1asthelowestand4asthehighest.
ThetrendindicatedthattheIndonesianpolicymakersandscientistsdidnothaveanystronginclinationtowardsbiotechnologyapplicationsthatwouldimprovefoodquality,makecropsmoreresistant,producemedicinesandvaccines,studyhumandiseaseslikecancer,producetemperatureresistantstrawberries,anddetectandtreatdiseaseswemighthaveinheritedfromourparents(AppendixTable25).Frequencycountsdidnotshowmajoritytrendforanyparticularitemorstakeholder.Similarly,theweightedmeans,rangingfrom1.8to2.6,reflectthattheyseldomconsidertheseapplicationswhenmakingjudgmentsaboutbiotechnology(AppendixTable25).
Basedonthesefindings,thereisnotenoughdatatosupportoridentifywhatparticularapplicationstakeholdersreallyconsiderwhenmakingjudgmentsaboutbiotechnology.
Relationships Between Socio-Demographic Characteristics and Understanding of Agricultural Biotechnology Chi-square(X2)testwasusedtodeterminetherelationshipsbetweengender,civilstatus,andareaofresidencewiththestakeholders’understandingandperceptionofandattitudetowardsagriculturalbiotechnology.Forageandeducation,theSpearmanRankCorrelation(rs)testwasused.ReligionwasnotanymoreincludedinthetestsincetherespondentswerepredominantlyMuslims.Onlythosevariableswithsignificantrelationshipsarediscussedbelow.
Exceptforage,allsocio-demographiccharacteristicsaresignificantlyrelatedwithcertainstatementsassociatedwithlevelofunderstandingofagriculturalbiotechnology.
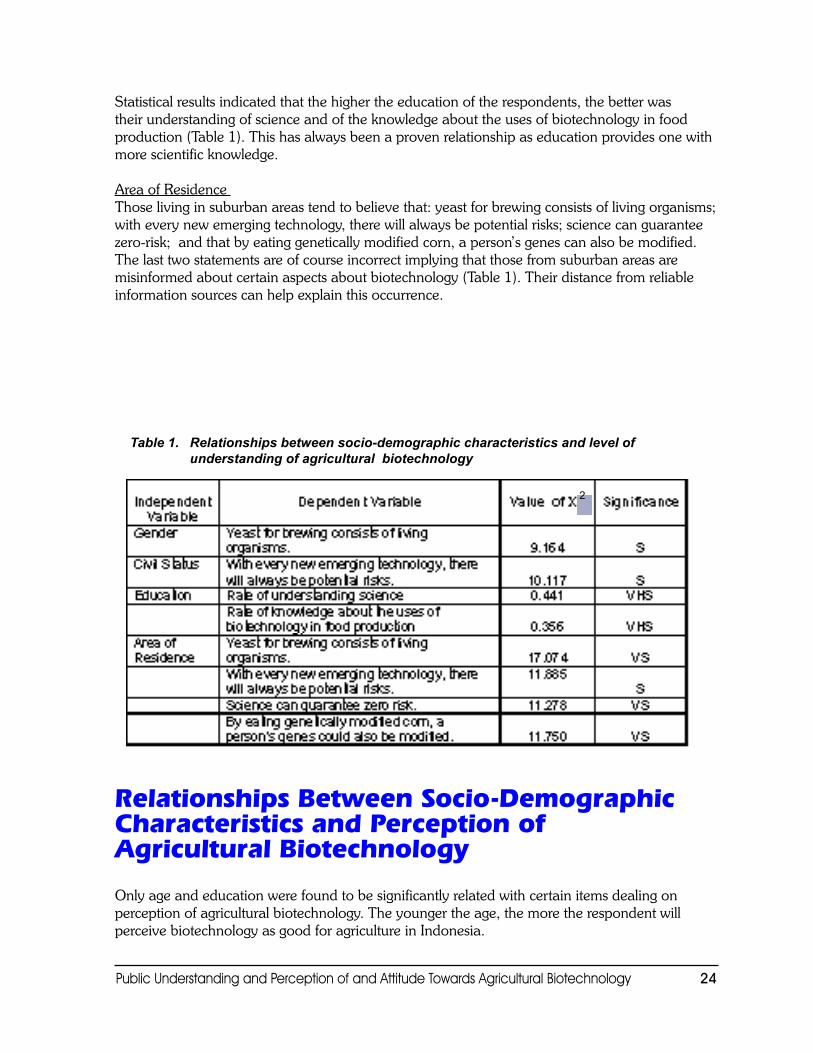
GenderResultsofstatisticaltestshowedthatgenderwasrelatedwiththeunderstandingthat:yeastforbrewingconsistsoflivingorganisms.Femalestendtolabelthestatementastruewhilemalestendtolabelitasfalse(Table1).Itmaybeattributedtothefactthatfemales,beingthefoodhandlersathome,aremorefamiliarwiththenatureofyeastbeingusedinfoodpreparation.CivilStatusCivilstatuswasfoundtobesignificantlyrelatedwiththeunderstandingthatwitheverynewemergingtechnology,therewillalwaysbepotentialrisks.Themarriedonestendtotakesuchstatementsastrue(Table1).
Education
Public Understanding and Perception of and Attitude Towards Agricultural Biotechnology ��
Statisticalresultsindicatedthatthehighertheeducationoftherespondents,thebetterwastheirunderstandingofscienceandoftheknowledgeabouttheusesofbiotechnologyinfoodproduction(Table1).Thishasalwaysbeenaprovenrelationshipaseducationprovidesonewithmorescientificknowledge.
AreaofResidenceThoselivinginsuburbanareastendtobelievethat:yeastforbrewingconsistsoflivingorganisms;witheverynewemergingtechnology,therewillalwaysbepotentialrisks;sciencecanguaranteezero-risk;andthatbyeatinggeneticallymodifiedcorn,aperson’sgenescanalsobemodified.Thelasttwostatementsareofcourseincorrectimplyingthatthosefromsuburbanareasaremisinformedaboutcertainaspectsaboutbiotechnology(Table1).Theirdistancefromreliableinformationsourcescanhelpexplainthisoccurrence.
Relationships Between Socio-Demographic Characteristics and Perception of Agricultural Biotechnology
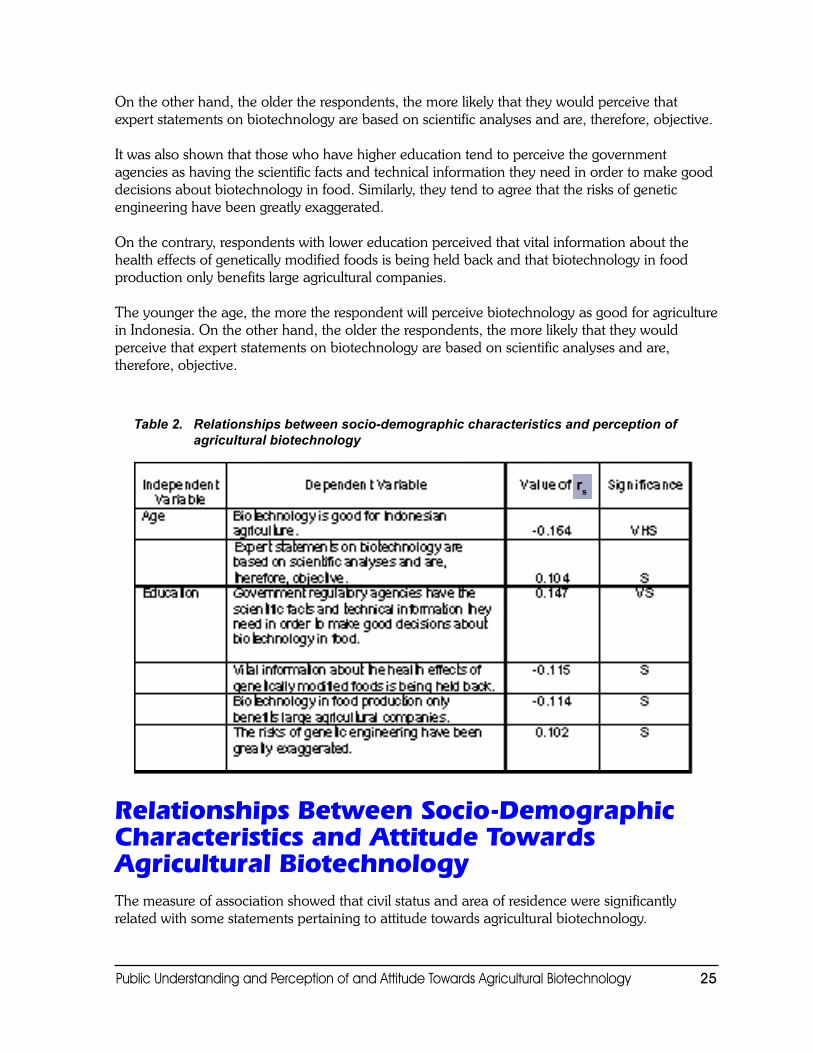
Onlyageandeducationwerefoundtobesignificantlyrelatedwithcertainitemsdealingonperceptionofagriculturalbiotechnology.Theyoungertheage,themoretherespondentwillperceivebiotechnologyasgoodforagricultureinIndonesia.
Table 1. Relationships between socio-demographic characteristics and level of understanding of agricultural biotechnology
2
Public Understanding and Perception of and Attitude Towards Agricultural Biotechnology ��
Ontheotherhand,theoldertherespondents,themorelikelythattheywouldperceivethatexpertstatementsonbiotechnologyarebasedonscientificanalysesandare,therefore,objective.
Itwasalsoshownthatthosewhohavehighereducationtendtoperceivethegovernmentagenciesashavingthescientificfactsandtechnicalinformationtheyneedinordertomakegooddecisionsaboutbiotechnologyinfood.Similarly,theytendtoagreethattherisksofgeneticengineeringhavebeengreatlyexaggerated.
Onthecontrary,respondentswithlowereducationperceivedthatvitalinformationaboutthehealtheffectsofgeneticallymodifiedfoodsisbeingheldbackandthatbiotechnologyinfoodproductiononlybenefitslargeagriculturalcompanies.
Theyoungertheage,themoretherespondentwillperceivebiotechnologyasgoodforagricultureinIndonesia.Ontheotherhand,theoldertherespondents,themorelikelythattheywouldperceivethatexpertstatementsonbiotechnologyarebasedonscientificanalysesandare,therefore,objective.
Relationships Between Socio-Demographic Characteristics and Attitude Towards Agricultural Biotechnology Themeasureofassociationshowedthatcivilstatusandareaofresidenceweresignificantlyrelatedwithsomestatementspertainingtoattitudetowardsagriculturalbiotechnology.
Table 2. Relationships between socio-demographic characteristics and perception of agricultural biotechnology
rs
Public Understanding and Perception of and Attitude Towards Agricultural Biotechnology ��
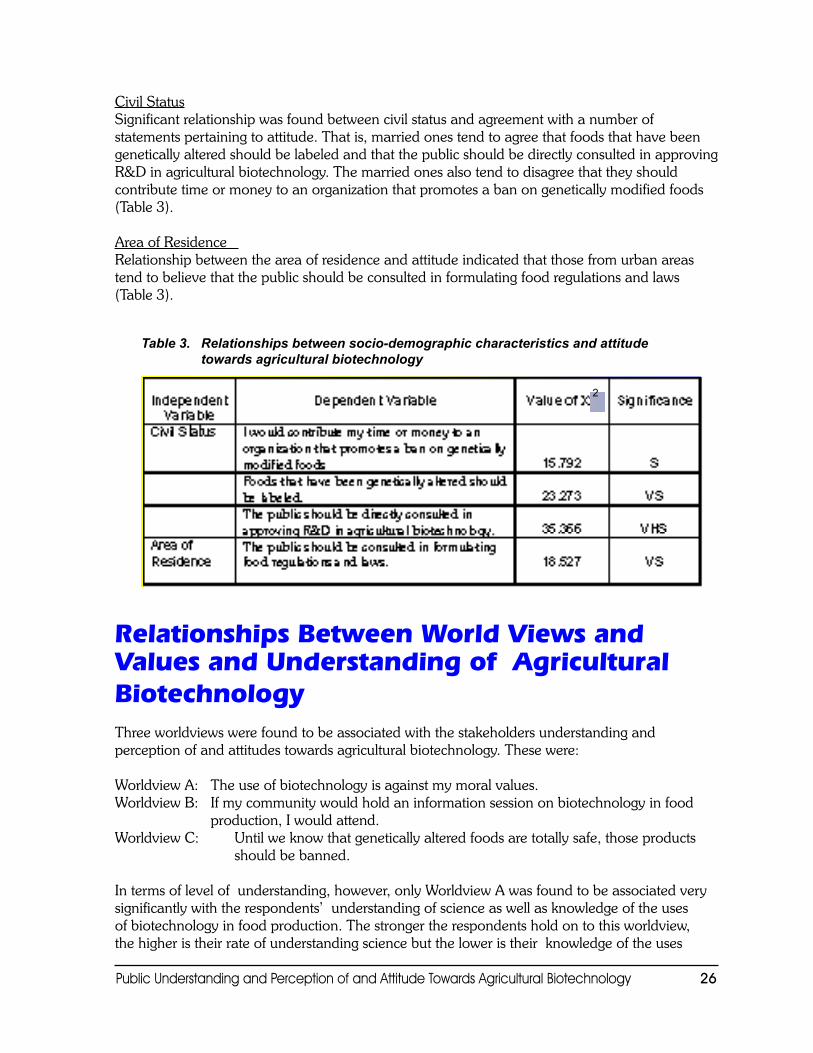
CivilStatusSignificantrelationshipwasfoundbetweencivilstatusandagreementwithanumberofstatementspertainingtoattitude.Thatis,marriedonestendtoagreethatfoodsthathavebeengeneticallyalteredshouldbelabeledandthatthepublicshouldbedirectlyconsultedinapprovingR&Dinagriculturalbiotechnology.Themarriedonesalsotendtodisagreethattheyshouldcontributetimeormoneytoanorganizationthatpromotesabanongeneticallymodifiedfoods(Table3).
AreaofResidenceRelationshipbetweentheareaofresidenceandattitudeindicatedthatthosefromurbanareastendtobelievethatthepublicshouldbeconsultedinformulatingfoodregulationsandlaws(Table3).
Relationships Between World Views and Values and Understanding of Agricultural Biotechnology Threeworldviewswerefoundtobeassociatedwiththestakeholdersunderstandingandperceptionofandattitudestowardsagriculturalbiotechnology.Thesewere:
WorldviewA:Theuseofbiotechnologyisagainstmymoralvalues.WorldviewB:Ifmycommunitywouldholdaninformationsessiononbiotechnologyinfood
production,Iwouldattend.WorldviewC: Untilweknowthatgeneticallyalteredfoodsaretotallysafe,thoseproducts
shouldbebanned.
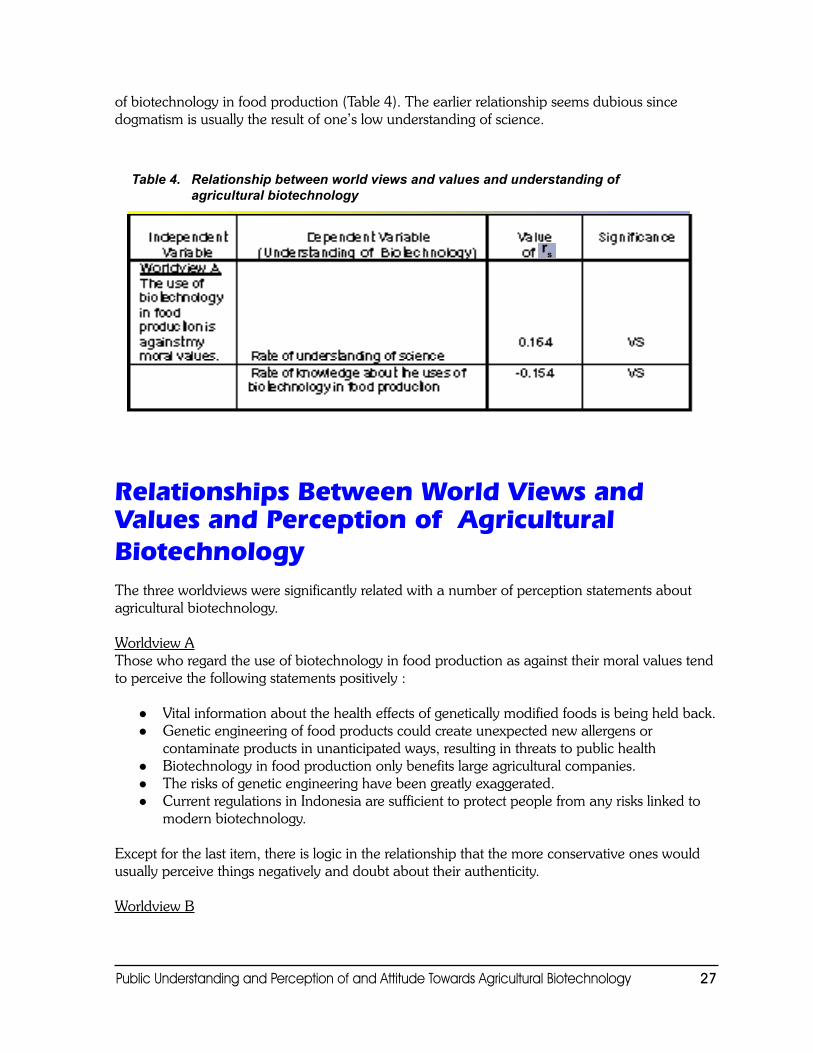
Intermsoflevelofunderstanding,however,onlyWorldviewAwasfoundtobeassociatedverysignificantlywiththerespondents’understandingofscienceaswellasknowledgeoftheusesofbiotechnologyinfoodproduction.Thestrongertherespondentsholdontothisworldview,thehigheristheirrateofunderstandingsciencebuttheloweristheirknowledgeoftheuses
Table 3. Relationships between socio-demographic characteristics and attitude towards agricultural biotechnology
2
Public Understanding and Perception of and Attitude Towards Agricultural Biotechnology ��
ofbiotechnologyinfoodproduction(Table4).Theearlierrelationshipseemsdubioussincedogmatismisusuallytheresultofone’slowunderstandingofscience.
Table 4. Relationship between world views and values and understanding of agricultural biotechnology
Relationships Between World Views and Values and Perception of Agricultural Biotechnology Thethreeworldviewsweresignificantlyrelatedwithanumberofperceptionstatementsaboutagriculturalbiotechnology.
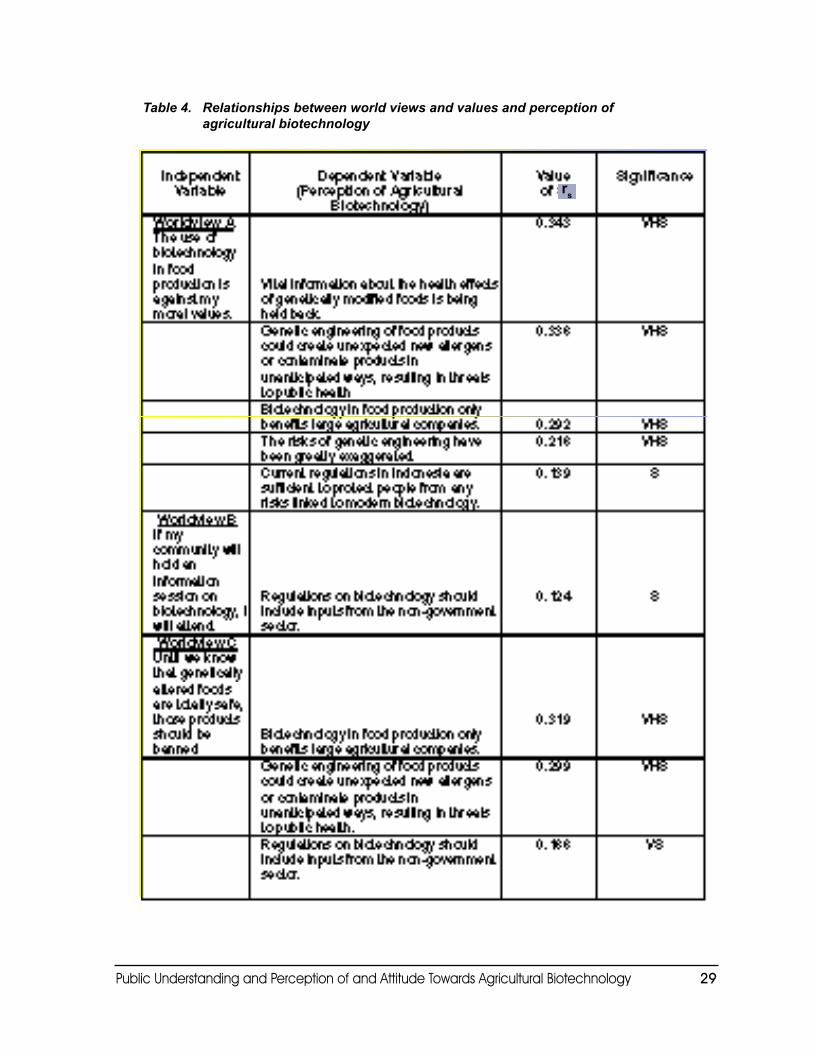
WorldviewAThosewhoregardtheuseofbiotechnologyinfoodproductionasagainsttheirmoralvaluestendtoperceivethefollowingstatementspositively:
Vitalinformationaboutthehealtheffectsofgeneticallymodifiedfoodsisbeingheldback. Geneticengineeringoffoodproductscouldcreateunexpectednewallergensor
contaminateproductsinunanticipatedways,resultinginthreatstopublichealth Biotechnologyinfoodproductiononlybenefitslargeagriculturalcompanies. Therisksofgeneticengineeringhavebeengreatlyexaggerated. CurrentregulationsinIndonesiaaresufficienttoprotectpeoplefromanyriskslinkedto
modernbiotechnology.
Exceptforthelastitem,thereislogicintherelationshipthatthemoreconservativeoneswouldusuallyperceivethingsnegativelyanddoubtabouttheirauthenticity.
WorldviewB
rs
Public Understanding and Perception of and Attitude Towards Agricultural Biotechnology ��
Thosewhoholdontothisworldviewtendtoperceiveandagreethatregulationsonbiotechnologyshouldincludeinputsfromthenon-governmentsector.Therelationshipislogicalinthatattendancetoinformationsessionisoneofthevenuesforgatheringinputsfromnon-governmentsector(Table5).
WorldviewCTheaboveworldviewhasstrongassociationwiththeperceptionsthat:1) biotechnologyinfoodproductiononlybenefitslargeagriculturalcompanies;2) geneticengineeringoffoodproductscouldcreateunexpectednewallergensorcontaminate
productsinunanticipatedways,resultinginthreatstopublichealth;and3) regulationsonbiotechnologyshouldincludeinputsfromthenon-governmentsector.
Suchpositiverelationshipssupporttheearlierimplicationthatrespondentsstillfeelquitewaryaboutthesocialandhealthconsequencesoffoodbiotechnology.Respondentsalsotendtotrustandfavorcivilsocietyparticipationinsettingfoodbiotechnologyregulations.
Relationships Between World Views and Values and Attitude Towards Agricultural Biotechnology Nosignificantrelationshipwasfoundbetweenworldviewsandvaluesandattitudetowardsagriculturalbiotechnology.
Relationships Between Information Sources and Understanding of Agricultural BiotechnologyTheSpearmanRankCorrelationtestwasusedtodeterminetherelationshipbetweeninformationsourcesandthestakeholders’understanding,perception,andattitudetowardsagriculturalbiotechnology.Twelvevariablesunderinformationsourceswereshowntobeassociatedwithunderstandingofagriculturalbiotechnology,namely:
1. Readorwatchedaboutbiotechnologyinthemassmedia(TV,newspapers,radio)2. Talkedtoorheardfromfamily/friends/neighbors/officemates3. Talkedtoorheardfromreligiousfigures4. Talkedtoprofessionalsorexperts5. TalkedtoorheardfromNGOs6. Talkedtoorheardfromapolitician/leader7. Accessedawebsite8. Readbooks9. Readnewsletters,pamphlets,orbrochures10.Talkedtoorheardfromfoodregulators11.Attendedseminarsandpublicforums12.Talkedtoorheardfromagriculturalbiotechnologycompanies
Public Understanding and Perception of and Attitude Towards Agricultural Biotechnology ��
Table 4. Relationships between world views and values and perception of agricultural biotechnology
rs
Public Understanding and Perception of and Attitude Towards Agricultural Biotechnology �0
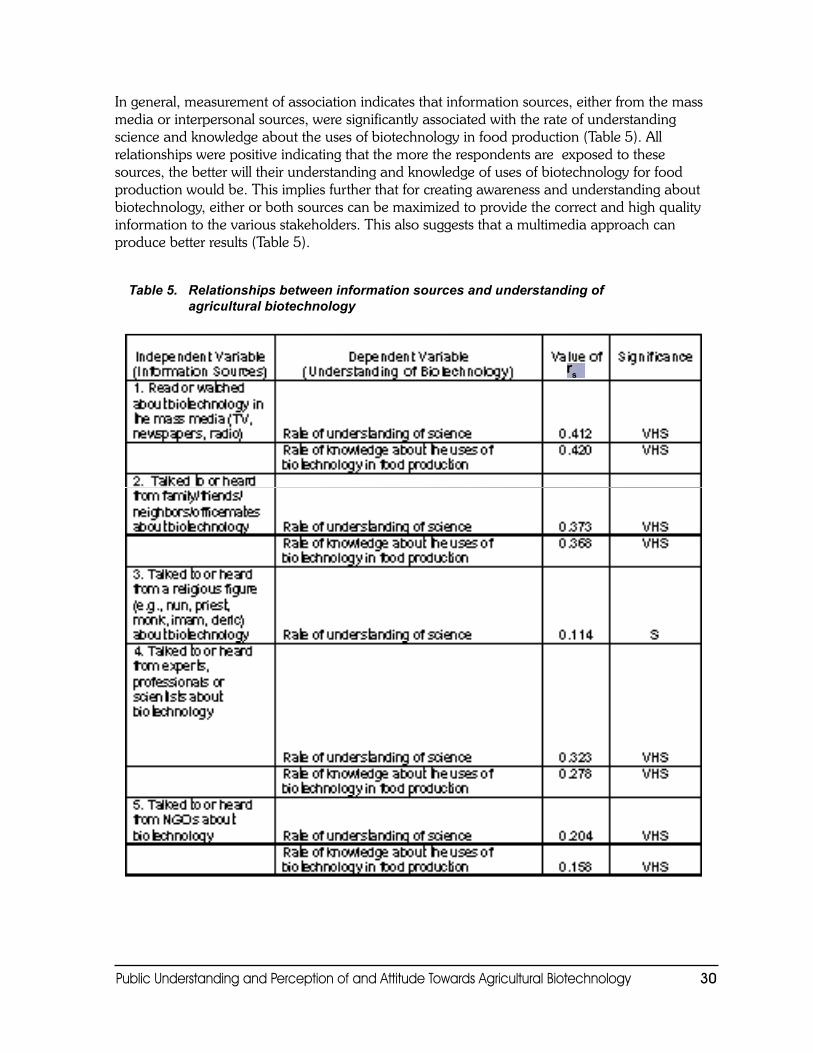
Ingeneral,measurementofassociationindicatesthatinformationsources,eitherfromthemassmediaorinterpersonalsources,weresignificantlyassociatedwiththerateofunderstandingscienceandknowledgeabouttheusesofbiotechnologyinfoodproduction(Table5).Allrelationshipswerepositiveindicatingthatthemoretherespondentsareexposedtothesesources,thebetterwilltheirunderstandingandknowledgeofusesofbiotechnologyforfoodproductionwouldbe.Thisimpliesfurtherthatforcreatingawarenessandunderstandingaboutbiotechnology,eitherorbothsourcescanbemaximizedtoprovidethecorrectandhighqualityinformationtothevariousstakeholders.Thisalsosuggeststhatamultimediaapproachcanproducebetterresults(Table5).
Table 5. Relationships between information sources and understanding of agricultural biotechnology
rs
Public Understanding and Perception of and Attitude Towards Agricultural Biotechnology ��
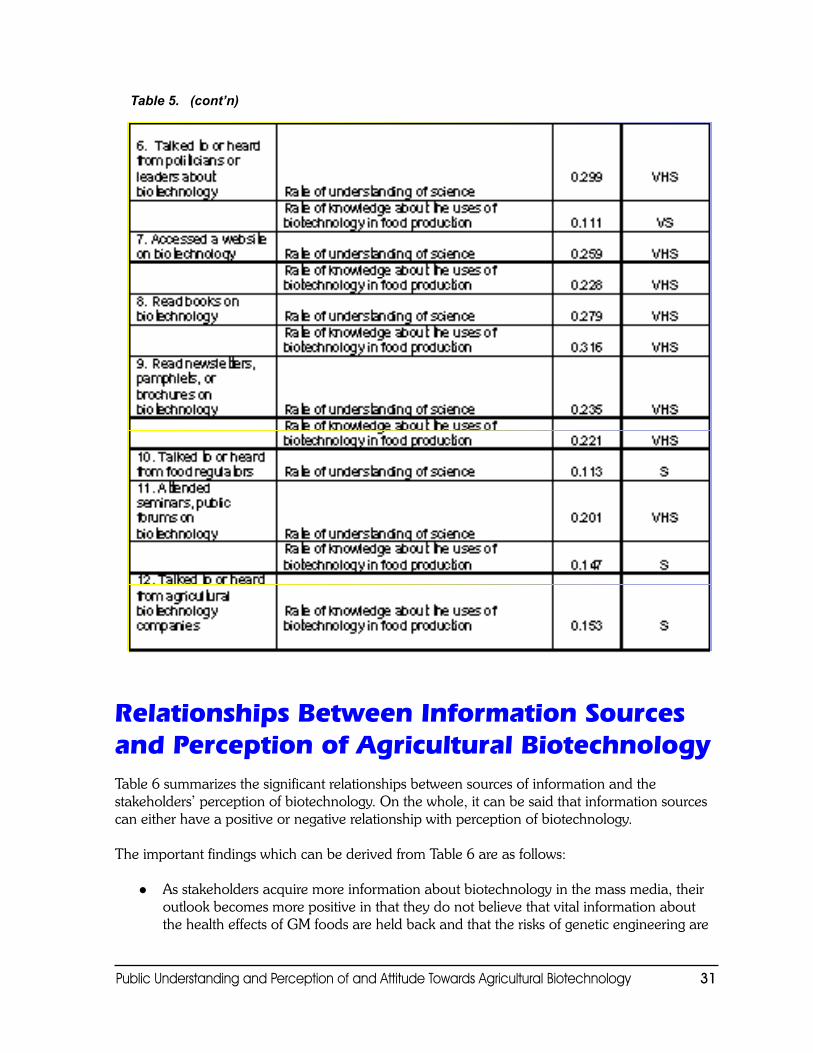
Table 5. (cont’n)
Relationships Between Information Sources and Perception of Agricultural Biotechnology Table6summarizesthesignificantrelationshipsbetweensourcesofinformationandthestakeholders’perceptionofbiotechnology.Onthewhole,itcanbesaidthatinformationsourcescaneitherhaveapositiveornegativerelationshipwithperceptionofbiotechnology.
TheimportantfindingswhichcanbederivedfromTable6areasfollows:
Asstakeholdersacquiremoreinformationaboutbiotechnologyinthemassmedia,theiroutlookbecomesmorepositiveinthattheydonotbelievethatvitalinformationaboutthehealtheffectsofGMfoodsareheldbackandthattherisksofgeneticengineeringare
Public Understanding and Perception of and Attitude Towards Agricultural Biotechnology ��
exaggerated.Massmediaassourcecan,however,leadtothenegativeperceptionthatbiotechnologyisnotgoodforIndonesianagriculture(Table5).ThelatterimpliesthattheIndonesianmassmediamaybeconvincinglycarryingnegativeratherthanpositiveimagesoffoodbiotechnology.
Gettinginformationfromtheirimmediatesocialcircle,suchasfamily,friends,neighbors,officematescanleadtonegativeresultsinthattheytendtobelievethat1)biotechnologyisnotgoodforIndonesianagriculture;2)thatexpertstatementsonbiotechnology,thoughbasedonscientificanalyses,arenotobjective;and3)therisksofbiotechnologyarenotexaggerated.Thismayimplythattherespondents’informalinterpersonalcommunicationsourcesofbiotechnologyinformationmaynotbeproperlyequippedwithcorrectinformationaboutbiotechnology.
Religiousfiguresassourcesofbiotechnologyinformationhaveaverysignificantnegativerelationshipwiththestakeholders’perceptionofhowgoodbiotechnologyisforagricultureinIndonesia.Thiscouldmeanthatalthoughtalkingtoareligiousfigureaboutagriculturalbiotechnologycontributestoenhancingtherespondents’understandingofscience,itdoesnotnecessarilymakethemthinkthatbiotechnologyisgoodforIndonesia’sagriculturaleconomy.Thissuggeststhatthereligiousleaders’stockofknowledgeinbiotechnologyneedstobeenhancedsothattheycancontributepositivelyinenhancingpublicperceptionofagriculturalbiotechnology.
Averysignificantnegativerelationshipcameoutbetweenexposuretoprofessionals,experts,andscientistasbiotechnologyinformationsourcesandtherespondents’perceptionthat“therisksofgeneticengineeringhavebeengreatlyexaggerated.”Thisfindingsupportsthelogicthatscientistsandbiotechnologyexperts,asidefromhelpingenhancetherespondents’understandingofscience,canpositivelyinfluencetheirperceptionaboutbiotechnologyapplicationsinfoodproduction.
TalkingtoorhearingfromanNGOaboutbiotechnologyhasaverysignificantnegativerelationshipwiththestakeholders’perceptionthatgovernmentagenciesaredoingtheirbesttoensurethatthefoodtheyeatissafe;implyingtheirdistrustofthesegovernmentregulatorybodies.Thus,NGOsassourcesofinformationtendtocreateamorenegativeperceptionofbiotechnology.
Whiletalkingwithpoliticiansandleadersaboutfoodbiotechnologymaycontributetotherespondents’understandingofscienceandknowledgeonitsuses,thismaynotnecessarilycontributetocreatinginthesestakeholdersapositiveoutlookonthepotentialcontributionsofbiotechnologytoIndonesianagriculture.ThiscouldbelietheearlierfindingthatIndonesianpoliticiansandleadersagreeandbelievethatbiotechnologyisgoodforIndonesianagriculture.
Accesstowebsiteswasfoundtorelatenegativelywithotherperceptionstatements.Thismeansthatthebetteristheaccesstowebsites,thehigheristhetendencyforstakeholderstoperceive1)therisksofgeneticengineeringasgreatlyexaggerated;2)biotechnologyasnotgoodforagricultureinIndonesia;and3)expertstatementsonbiotechnologyasnotbeingbasedonscientificanalysesandare,therefore,subjective.

Public Understanding and Perception of and Attitude Towards Agricultural Biotechnology ��
Thus,whilewebsitesenhancedtherespondents’scientificappreciationoffoodbiotechnology,theydidnotnecessarilycontributetomakingtherespondents’perceptionsofitmorefavorable.ThisimpliesthatthecontentofthesewebsitesmaybeconveyingmorenegativeinformationaboutbiotechnologytotheIndonesianpublic.
Readingbiotechnologybooksalsotendstosignificantlynegatethestakeholders’perceptionsthat1)therisksofgeneticengineeringhavebeengreatlyexaggerated;2)biotechnologyisgoodforagricultureinIndonesia;3)expertstatementsonbiotechnologyarebasedonscientificanalysesandare,therefore,objective;and4)geneticengineeringoffoodproductscouldcreateunexpectednewallergensorcontaminateproductsinunanticipatedways,resultinginthreatstopublichealth.
Thenegativerelationshipwiththefirstthreeperceptionstatementsimplythatreadingmoreaboutbiotechnologyinbookstendstopaintasomewhatunfavorablepictureofitinthemindsofthestakeholders.However,readingbiotechnologybooksmayhaveinformedthemthatfearsofunexpectednewallergensorcontaminantsinbiotechnologyfoodproductsmaybeunfounded.
Analysesrevealedasignificantnegativerelationshipontheuseofnewsletters/pamphlets/brochureswiththeperceptionthatbiotechnologyisgoodforagricultureinIndonesia;butasignificantpositiverelationshipwiththeperceptionthatcurrentregulationsinIndonesiaaresufficienttoprotectpeoplefromanyriskslinkedtomodernbiotechnology.
Havingfoodregulatorsasone’sinformationsourceonbiotechnologyalsohasaveryhighlysignificantnegativerelationshipwiththeperceptionthatbiotechnologyisgoodforagricultureinIndonesia.Itseemsthattalkingtotheseinformationsourcesonfoodbiotechnologygavethestakeholdersanegativeoutlookonitsbenefitstotheircountry’sagriculture.Inarelatedvein,talkingtofoodregulatorstendtosignificantlygivethestakeholdersdoubtsthat“expertstatementsonbiotechnologyarebasedonscientificanalysesandare,therefore,objective.”
AttendanceinseminarsandforumsdoesnotnecessarilymeanthatstakeholderswillgainapositiveoutlookaboutthebenefitsofbiotechnologytoagricultureinIndonesia.Rather,itsignificantlyraisedtheirconcerninusingagriculturalbiotechnologyinfoodproduction.
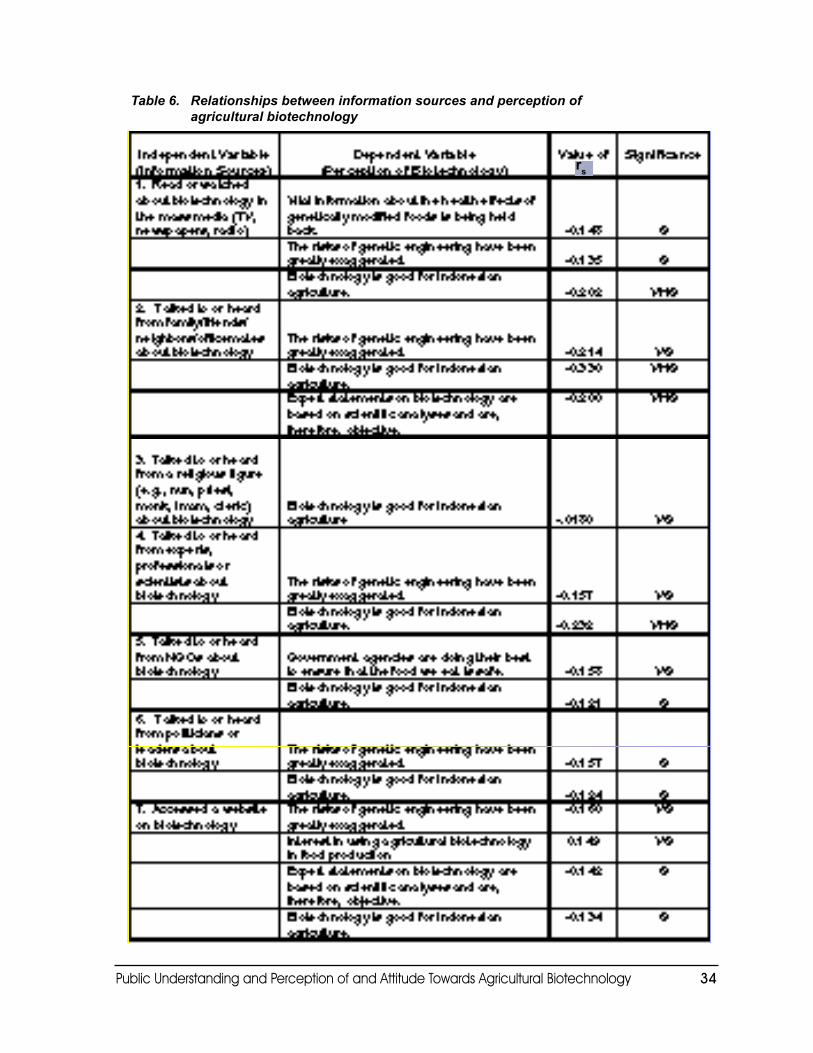
Public Understanding and Perception of and Attitude Towards Agricultural Biotechnology ��
Table 6. Relationships between information sources and perception of agricultural biotechnology
rs
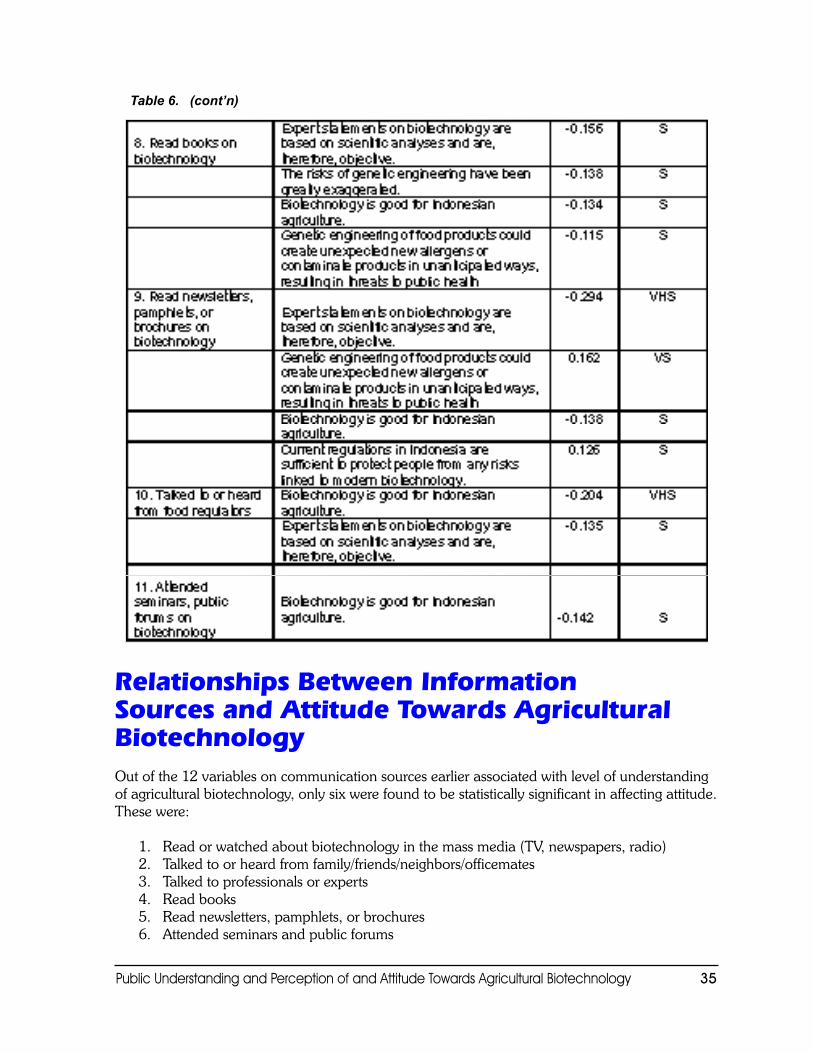
Public Understanding and Perception of and Attitude Towards Agricultural Biotechnology ��
Table 6. (cont’n)
Relationships Between Information Sources and Attitude Towards Agricultural BiotechnologyOutofthe12variablesoncommunicationsourcesearlierassociatedwithlevelofunderstandingofagriculturalbiotechnology,onlysixwerefoundtobestatisticallysignificantinaffectingattitude.Thesewere:
1. Readorwatchedaboutbiotechnologyinthemassmedia(TV,newspapers,radio)2. Talkedtoorheardfromfamily/friends/neighbors/officemates3. Talkedtoprofessionalsorexperts4. Readbooks5. Readnewsletters,pamphlets,orbrochures6. Attendedseminarsandpublicforums
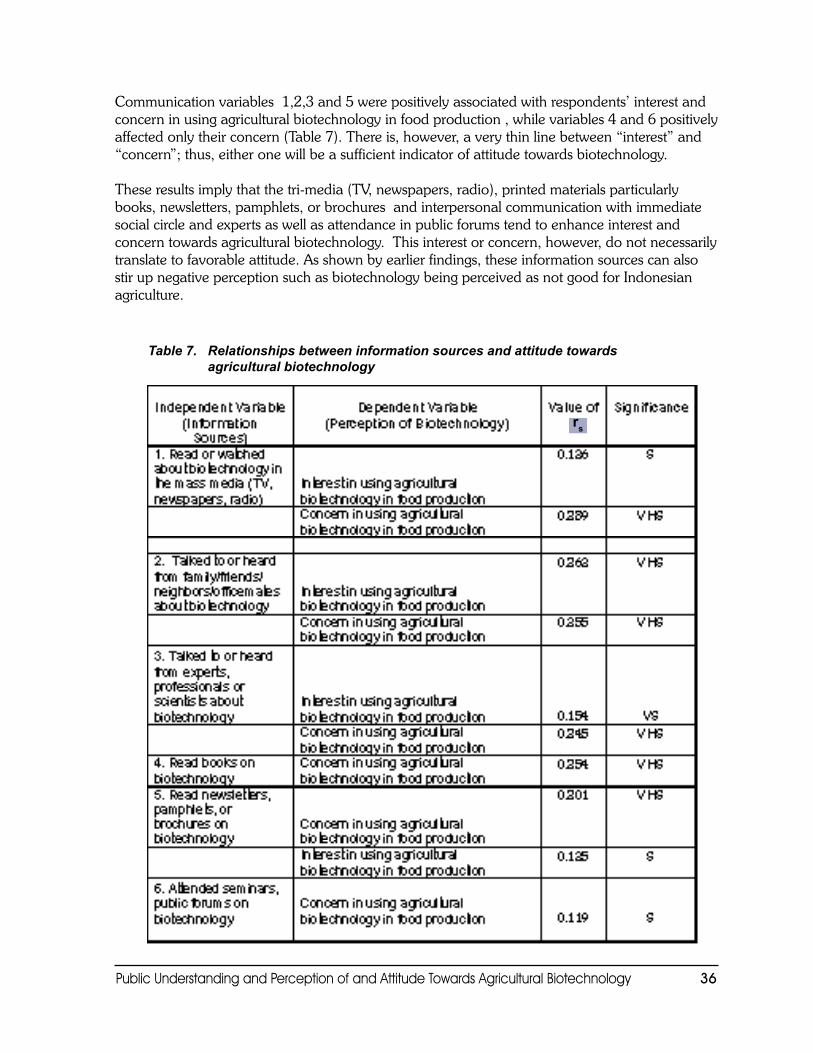
Public Understanding and Perception of and Attitude Towards Agricultural Biotechnology ��
Communicationvariables1,2,3and5werepositivelyassociatedwithrespondents’interestandconcerninusingagriculturalbiotechnologyinfoodproduction,whilevariables4and6positivelyaffectedonlytheirconcern(Table7).Thereis,however,averythinlinebetween“interest”and“concern”;thus,eitheronewillbeasufficientindicatorofattitudetowardsbiotechnology.
Theseresultsimplythatthetri-media(TV,newspapers,radio),printedmaterialsparticularlybooks,newsletters,pamphlets,orbrochuresandinterpersonalcommunicationwithimmediatesocialcircleandexpertsaswellasattendanceinpublicforumstendtoenhanceinterestandconcerntowardsagriculturalbiotechnology.Thisinterestorconcern,however,donotnecessarilytranslatetofavorableattitude.Asshownbyearlierfindings,theseinformationsourcescanalsostirupnegativeperceptionsuchasbiotechnologybeingperceivedasnotgoodforIndonesianagriculture.
Table 7. Relationships between information sources and attitude towards agricultural biotechnology
rs
Public Understanding and Perception of and Attitude Towards Agricultural Biotechnology ��
Part 55 Summary andConclusions
Summary
ithIndonesiaasthefocalarea,thisstudysoughttodeterminethesocio-cultural characteristicsofthevariousstakeholdersinagriculturalbiotechnology;theirworldviewsrelatedtoagriculturalbiotechnology;theirinformationsourcesonagriculturalbiotechnology;theirlevelofunderstandingandperceptionofandattitudetowardsagriculturalbiotechnology;andtherelationshipsbetweenthesocio-culturalfactors,worldviews,andinformationsourcesononehand,andthestakeholders’levelofunderstandingandperceptionofandattitudetowardsagriculturalbiotechnology,ontheotherhand.
Respondentsincluded432agriculturalbiotechnologystakeholderscomprisingbusinessmenandtraders,consumers,extensionworkers,farmerleadersandcommunityleaders,journalists,policymakers,religiousleaders,andscientists.TheycamefromtheselectedareasinBanten/Tangerang,Lampung,JawaBaratinBogor,JabarinWestJava,DaerahIstiemwainYogyakarta,andJakarta,Indonesia.Theywereinterviewedorwereaskedtoaccomplishself-administeredquestionnaireswhentheyweredifficulttogather.Datawereanalyzedusingfrequencycounts,percentages,ranges,weightedmeansandChi-squareandSpearmanRankCorrelationtests.
Socio-DemographicCharacteristics
Therespondentsweremostlymales,married,Muslims,andaged21to50yearsold.Manyoftheolderrespondentswereextensionworkersandtheyoungeroneswereconsumers.Theireducationalattainmentswerequitevaried,fromhighschool,somecollegeeducation,andcollegedegrees.Theymostlylivedinruralandsuburbanareas.Residingintheruralareaswerethefarmerleadersandcommunityleaders,religiousleaders,extensionworkers,andbusinessmenandtraders.Moreofthepolicymakers,scientists,consumers,andjournalistslivedinthesuburbanareas.
WorldviewsandValues
Religiousleadersconsideredtheuseofbiotechnologyinfoodproductionasagainsttheirmoralvalues,followedcloselybyjournalists.Majorityoftherespondentswouldattendinformationsessiononbiotechnologyinfoodproductionthattheircommunitywouldhold.Manyamongthestakeholdergroups,approximatingamajority,agreedthatgeneticallyalteredfoodsshouldbelabeled,butjournalistsdisagreed.VeryfewagreedthatmanipulationtakesmankindintorealmsthatbelongtoonlytoGod;whiletheeverconservativejournalistsagreed.
W
Public Understanding and Perception of and Attitude Towards Agricultural Biotechnology ��
MajoritydisagreedtobanGMfoodsuntilitisknownthattheyaretotallysafe.Therewasalsoageneraltrendforallstakeholderstodisagreethatwehavenobusinessmeddlingwithnature.AstolabelingofGMfoods,respondentswerealmostequallydistributedtothosewhowereandwerenotwilling.Mostwillingwerethebusinessmenandtraders;mostunwillingwerethefarmerleadersandcommunityleaders.
AllstakeholdergroupswerenotwillingtopaythecostforlabelingGMfoods.Therewasnodistincttrendastotheiragreementordisagreementthatgeneticengineeringmeansnutritiousandcheaperfoodsforconsumers.Infact,aboutathirddidnotknowmuchandcouldnotdecide.Allthestakeholdergroupsexpressedsupporttothestatementthatconsumershavearighttochoosewhattheyeatandtoknowwhattheyareeating.
Information Sources on Biotechnology
Exceptforthereligiousleaders,allthestakeholdershavelowlevelofexposuretosourcesofinformationonagriculturalbiotechnology. Thestudyfoundthatnosinglesourceofinformationonbiotechnologystoodoutamongthestakeholders.However,itisinterestingtonotethattheIndonesianstakeholderswerestartingtorecognizereligiousleadersorfiguresaspotentialsourcesofbiotechnology-relatedinformation.
Ironically,whilereligiousleaderswereemergingaspotentialsourcesofbiotechnology-relatedinformation,theywerethoseamongthegroup,alongwithbusinessmenandtraders,andfarmerleadersandcommunityleaders,whohaverelativelylowexposuretoinformationonbiotechnology.Infact,itmaybeacauseofconcernthattheIndonesianstakeholderssoughtlessinformationonbiotechnologyasindicatedbytheresultsofthisstudy.
Nevertheless,despitethelowerinformationseekingbehavioronbiotechnology,thereligiousleadersweregettingmoreexposedtoinformationonbiotechnologyasbornebythefactthatmanyofthemhaveconsistentlybeenexposedtomassandinterpersonalcommunicationsourcesthreetimesormoreinthelasttwomonthsbeforetheyhavebeeninterviewed.Ingeneral,thescientistsandsciencemagazinesornewsletterwereregardedasthemosttrustedsourcesofinformationonagriculturalbiotechnologybytherespondentsacrossstakeholdergroups.Informationobtainedwerefoundtobeveryusefulandveryscientificbythesegroups.
Level of Understanding of Biotechnology
Stakeholdersunanimouslyclaimedtohaveobtained‘moderate’knowledgeabouttheusesofbiotechnologyinfoodproduction.Uponvalidation,mostoftherespondentsinallthestakeholdergroupsindeedhadcorrectunderstandingofbiotechnology.
Itisalsoworthnotingthatstakeholderswereconfidentinratingthemselvesmodestlyinterms
Public Understanding and Perception of and Attitude Towards Agricultural Biotechnology ��
oflevelofunderstanding.Allstakeholders—includingthefarmerleadersandcommunityleaders—unanimouslyself-ratedthemselvesashaving‘moderate’knowledgeabouttheusesofbiotechnologyinfoodproduction.
Ironically,thereligiousleaders,whowereemergingaspotentialsourcesofbiotechnology-relatedinformation,werefoundtohavethelowestunderstandingofbiotechnology.
Perception of Agricultural Biotechnology
Majorityoftherespondentsviewedbiotechnologyas“hazardous”infoodproduction.Expandedmediacoverageonhumanhealthissuesandthegrowinghypeonwellnessprogramsmayhaveinfluencedrespondentstobecomemorecautiousinthefoodtheyeat.Also,theirincreasedlevelofunderstandingonbiotechnologymaysignifythattheynowunderstoodmorefacetsandissuesregardingbiotechnology,includingitsrisks,challenges,potentials,andbenefits.
Nevertheless,theaboveperceptionmaybelimitedtotheuseofbiotechnologyforfoodproductionbecausemajorityoftherespondentsperceivedagriculturalbiotechnologyaseithermoderately orvery beneficial. Agriculturalbiotechnologyencompassesabroadercontextthanfoodproductionincludingforestryandenvironment,animalproduction,waterresources,andothers.Extensionworkerstoppedthelistofthosewhobelievedinthebenefitsofagriculturalbiotechnologyinfoodproduction,followedbyreligiousleaders,andpolicymakers.
TherewasaprevailingperceptionthatbiotechnologyregulationsinIndonesiaarequiteinsufficienttoprotectpeoplefromrisks.Whilemajorityofthescientistscontendedagainstthisperception,theycomprisedonlyasectoramongthemanystakeholdersinagriculturalbiotechnology.
Indonesianstakeholdersputhighregardingovernmentresearchinstitutionsandconsumergroupsintheirperceptionofwhoshouldbeconcernedabouthealthandsafetyconcerningbiotechnology.
Attitude Towards Agricultural Biotechnology
Mostoftherespondentsfromallsectorswerenotoverlyconcernedwiththeusesofagriculturalbiotechnologyinfoodproduction.Majoritywerenotwillingtocontributemoneyandtimetobangeneticallymodifiedfoods.Infactnooneintheranksofconsumers,extensionworkers,journalists,andpolicymakers‘stronglyagreed’withtheidea.Moreover,majorityfromeachstakeholdergroupexpressedtheirwillingnesstoattendaninformationsessiononbiotechnologyintheircommunity.TheseimplythatIndonesianstakeholdersarebecomingmoreopen-mindedtodiscussissuesrelatedtoagriculturalbiotechnology.However,therewasaverystrongsentimentinfavoroflabelingGMfoodsalthoughmanydisagreedorwereundecidedaboutpayingforthelabeling.Generally,therespondentsalsoagreedthatthepublicshouldbeconsultedinformulatingfoodregulationsandlaws.
Intermsofframesusedwhenmakingjudgmentsonbiotechnology,thetrendindicatedthattheIndonesianpolicymakersandscientistsdidnothaveanystronginclinationtowardsbiotechnologyapplicationsthatwouldimprovefoodquality,makecropsmoreresistant,produce
Public Understanding and Perception of and Attitude Towards Agricultural Biotechnology �0
medicinesandvaccines,studyhumandiseaseslikecancer,producetemperatureresistantstrawberries,anddetectandtreatdiseaseswemighthaveinheritedfromourparents.ThiscouldbeexplainedbythereligiousbeliefsthatMuslimshaveaboutman,natureandaSupremeBeing.
Relationships of Socio-demographic Characteristics with Understanding and Perception of and Attitude Towards Agricultural Biotechnology Socio-demographicCharacteristicsandLevelofUnderstanding
Exceptforage,allsocio-demographiccharacteristicsaresignificantlyrelatedwithcertainstatementsassociatedwithlevelofunderstandingofagriculturalbiotechnology.Femalestendtolabelthestatementthat“yeastforbrewingconsistsoflivingorganisms”astruewhilemalestendtolabelitasfalse.Themarriedonestendtotakethestatementthat“witheverynewemergingtechnology,therewillalwaysbepotentialrisks”astrue.
Statisticalresultsindicatedthatthehighertheeducationoftherespondents,thebetterwastheirunderstandingofscienceandoftheknowledgeabouttheusesofbiotechnologyinfoodproduction.Thoselivinginsuburbanareastendtobelievethat:yeastforbrewingconsistsoflivingorganisms;witheverynewemergingtechnology,therewillalwaysbepotentialrisks;sciencecanguaranteezero-risk;andbyeatinggeneticallymodifiedcorn,aperson’sgenescanalsobemodified.Thelaststatementisofcoursefalse.
Socio-demographicCharacteristicsandPerception
Onlyageandeducationwerefoundtobesignificantlyrelatedwithcertainitemsdealingonperceptionofagriculturalbiotechnology.Theyoungertheage,themoretherespondentwillperceivebiotechnologyasgoodforagricultureinIndonesia.Ontheotherhand,theoldertherespondents,themorelikelythattheywouldperceivethatexpertstatementsonbiotechnologyarebasedonscientificanalysesandare,therefore,objective.
Itwasalsoshownthatthosewhohavehighereducationtendtoperceivethegovernmentagenciesashavingthescientificfactsandtechnicalinformationtheyneedinordertomakegooddecisionsaboutbiotechnologyinfood.Similarly,theytendtoagreethattherisksofgeneticengineeringhavebeengreatlyexaggerated.
Onthecontrary,respondentswithlowereducationperceivedthatvitalinformationaboutthehealtheffectsofgeneticallymodifiedfoodsisbeingheldbackandthatbiotechnologyinfoodproductiononlybenefitslargeagriculturalcompanies.
Socio-demographicCharacteristicsandAttitude
Public Understanding and Perception of and Attitude Towards Agricultural Biotechnology ��
MarriedonestendtoagreethatfoodsthathavebeengeneticallyalteredshouldbelabeledandthatthepublicshouldbedirectlyconsultedinapprovingR&Dinagriculturalbiotechnology.Themarriedonesalsotendtodisagreethattheyshouldcontributetimeormoneytoanorganizationthatpromotesabanongeneticallymodifiedfoods.
Relationshipbetweentheareaofresidenceandattitudeindicatedthatthosefromurbanareastendtobelievethatthepublicshouldbeconsultedinformulatingfoodregulationsandlaws.
Relationships of Sources of Information with Understanding and Perception of and Attitude Towards Agricultural Biotechnology SourcesofInformationandLevelofUnderstanding
Thestudyshowedthat whilealltheformsofmediaorinformationsourcesincreasedthestakeholders’levelofunderstandingaboutscienceandtheusesofbiotechnologyinfoodproductionasshownbypositiveandsignificantcorrelations,notallthesemedianecessarilypromotedpositiveperceptionorattitudeofthestakeholderstowardsbiotechnology.
Thoseexposedtoareligiousfigureforbiotechnologyinformationhadabetterunderstandingofsciencebutnotnecessarilyofbiotechnology.Ontheotherhand,thosewhotalkedorheardfromfoodregulatorsandrepresentativesofagriculturalbiotechnologycompaniesweretheopposite-theyhadhigherlevelofknowledgeabouttheusesofbiotechnologyforfoodproductionbuttheirlevelofknowledgeonsciencewasnotsignificantlyhigher.
SourcesofInformationandPerception
Whatshouldbeaddressedbypolicymakersandcommunicationplannersisthedisturbingfindingthatthoseexposedtomassmedia,interpersonalsources,religiousfigures,expertsorscientists,NGOs,localpoliticianorleader,website,books,otherpublications,foodregulators,seminars/fora,andespeciallyagriculturalbiotechnologycompaniesperceivedthat‘biotechnologywasnotgoodforIndonesianagriculture.’
Further,thoseexposedtointerpersonalsourcesforbiotechnologyinformationnotonlyperceivedthatbiotechnologywasnotgoodforIndonesianagriculture,butthatexpertstatementswerenotobjective,thatgeneticengineeringwasriskytopublichealth,andthattherewasinsufficientinformationabouttherisksofgeneticengineeringavailabletothepublic.
ThosewhotalkedtoNGOsdidnotperceivethatthegovernmentagenciesweredoingtheirbesttoensurefoodsafety.Further,thosewhotalkedtolocalleaders/politician,accessedtheweb,andreadbooks,perceivedthattherewasinadequatedisseminationofinformationabouttheriskstogeneticengineeringorthatindeed,therewereriskstogeneticengineering.
SourcesofInformationandAttitude
Public Understanding and Perception of and Attitude Towards Agricultural Biotechnology ��
Intermsofattitude,stakeholderswhoweremoreexposedtomassmedia,interpersonalsources,expertsorscientists,websites,books,otherpublications,andseminarsweremoreinterestedand/orconcernedinusingagriculturalbiotechnologyinfoodproduction.Thesehadsignificanttohighlysignificantandpositiverelationships.Meanwhile,nosuchsignificantrelationshipswerefoundintheperceptionofstakeholdersandtheirexposuretoareligiousfigure,representativefromanNGO,politicians/localleader,andfoodregulator.
WorldviewsandAttitude
Thosewhobelievedthattheuseofbiotechnologyisagainsttheirmoralvaluesalsoperceivedthatbiotechnologybenefitsonlylargeagriculturalcompanies,thatvitalinformationaboutthehealtheffectsofGMfoodsareheldback,thatgeneticengineeringoffoodproductscouldcreateunexpectednewallergensorcontaminateproductsinunanticipatedways,resultinginthreatsinpublichealth,andthatcurrentregulationsinIndonesiaarenotsufficienttoprotectpeoplefrommanyrisksinbiotechnology.
ThosewhowereuncertainorbelievedthatGMfoodsshouldbebannedunlesstheyareprovensafe,alsoperceivedthatbenefitsaccrueonlytolargecompanies,thatgeneticengineeringhasrisks,andthatNGOsshouldinputinformulatingregulationsonbiotechnology.
Conclusions1. AmongtheIndonesianstakeholders,thejournalistsandreligiousleadershavethemost
conservativeviewofagriculturalbiotechnology.Bothviewbiotechnologyinfoodproductionasagainsttheirmoralvalues.
2. Religiousleadersareactiveinformationseekersandreceiverswhenitcomestobiotechnologybuttheyhavelowunderstandingofscienceandclaimthattheyknownothingatallonusesofbiotechnologyinfoodproduction.
3. Thejournalistshavesomecontradictingstanceasillustratedbythesefindings:
Whiletheyclaimtohavehighunderstandingofscience,theyfindtheinformationtheygetonagriculturalbiotechnologyonlyas“somewhatscientific.”
Whiletheyaremostconcernedwithfactualknowledgeofallfoodcharacteristicswhenconsideringtheusesofbiotechnologyinfoodproduction,theyareonlymoderatelyinterestedintheuseofbiotechnologyinfoodproductionanddon’tseebiotechnologyasameansforprovidingnutritiousandcheaperfoodforthepublic.
4. Stakeholdershavemultipleinformationsourceswhenitcomestoagriculturalbiotechnology.University-basedscientistsandsciencemagazinescomeoutasthemosttrustedsourcesofinformation.Informationobtainedareperceivedasveryusefulandveryscientific.
5. Allstakeholdersperceivethemselvesashavingmoderateknowledgeabouttheusesof
Public Understanding and Perception of and Attitude Towards Agricultural Biotechnology ��
biotechnologyinfoodproduction,exceptthereligiousleaderswhoclaimthattheyhavelowunderstandingofthesubject.
6. There’sageneraltendencyforthevariousstakeholdergroupstoperceiveagriculturalbiotechnologyashazardousbutatthesametimebeneficial.Alittlemorethan30percenthavenoopinionyetastothehazardsofagriculturalbiotechnology.
7. Allstakeholdergroups,exceptthejournalists,arewillingtoattendinformationsessionsonagriculturalbiotechnologythattheircommunitywillhold.
8. Allstakeholdergroups:
arenotwillingtopaythecostforlabelingGMfoods; arewillingsupporttheconsumersrighttochoosewhattoeatandtoknowwhattheyare
eating;and believethatthepublicshouldbeconsultedinformulatingfoodregulationsandlaws.
9. Intermsofframesusedwhenmakingjudgmentsonbiotechnology,Indonesianpolicymakersandscientistsarenotstronglyinclinedtotowardsbiotechnologyapplicationsthatwouldimprovefoodquality,makecropsmoreresistant,orcurediseases.
10.Thehighertheeducationofthestakeholders,themorefavorableistheirperceptionandattitudetowardsagriculturalbiotechnology.
11.ThecurrentsourcesofinformationonagriculturalbiotechnologyinvolvingbothmassmediaandinterpersonalonestendtoinfluencetheIndonesianpublicintothinkingthatagriculturalbiotechnologyisnotgoodfortheircountry’sagriculture.
12.Theworldviewsandvaluesofstakeholdersimpingegreatlyontheirperceptionofandattitudetowardsagriculturalbiotechnology.Conservativeworldviewsandvalues,suchastheapplicationofagriculturalbiotechnologybeingagainsttheirmoralvalues,consistentlyleadtonegativeperceptionandattitudetowardstheuseofbiotechnologyinfoodproduction.
Public Understanding and Perception of and Attitude Towards Agricultural Biotechnology ��
Part 66 Recommendations
asedonmajorandsignificantfindings,thefollowingimmediateandpractical recommendationsarebeingmadeinlinewiththecommunicationandpubliceducationeffortsonagriculturalbiotechnology:
1. Thegroupofjournalistsneedtobeeducatedonagriculturalbiotechnologyfirstandforemostastheyplayapivotalroleininformingthepublicandshapingthelatter’sperceptionandattitudetowardsbiotechnology.Hence,ifstrategiccommunicationistobeformulated,ithastoaddressthissectorfirst.Mediaeducationonagriculturalbiotechnologymayincludeamongothersseminars/workshops,forums,andstudytourstobecomplementedbyqualityreferencematerialsinprintedandelectronicforms.
2. Religiousleadersarehighlypotentialinformationsources.Thelatter’spotentialasinfluentialsourcesofinformationcanbeexploredfurtherandpossiblytappedinfuturecommunicationprograms.However,theirunderstandingofscienceandoftheusesofbiotechnologyinfoodproductionhavetobegreatlyenhanced.Thiscallsforspecialeducationclassessuchasattendancetoshortcoursesinagriculturalbiotechnologysupplementedbyreadingmaterials.Thetopicinbiotechnologymayalsobeintegratedintheirspecialtopiccollegecourses.Inadditiontoequippingthereligiousleaderswithknowledgeofthesubjectmatter,theyalsoneedtohavecapacitybuildingoncommunication.Thelattermayincludeclearandeffectivewriting,publicspeakingandpresentation,strategiccommunication,riskcommunication,andevendesignandproductionofcommunicationmaterials.
3. Partnershipneedsalsotobeestablishedwithuniversityscientistssincetheyhavebeenregardedasmosttrustedsourcesofinformationonagriculturalbiotechnology.Thesescientistscanbeorganizedintoabureauorpoolofresourcepersonswhoseservicesaswriters,speakers,advisers,reactors,anddiscussantsmaybetappedeverynowandthen.Publicationofregularsciencemagazinesornewsletterscanalsobedonetocomplementthecommunicationefforts.
4. Muchhasyettobedoneintermsofinformingandeducatingthemanysegmentsofthepublicasshownbytheirmoderatelevelofknowledgeaboutagriculturalbiotechnology.Informationaboutasharedresponsibilitywouldbemoreappropriateasthecommercializationofbiotechnologyproductsfollowsacontinuumfromthescientisttotheextensionworkers,farmersandconsumersaswellastheregulatorybodiesandpolicymakers.
5. Anothercommunicationstrategyistoconductinformationsessionsatthecommunity
B
Public Understanding and Perception of and Attitude Towards Agricultural Biotechnology ��
levelaboutagriculturalbiotechnology.Findingsindicateitsstrongviabilityintermsofnumberofpeopleattending.
ThismaybeorganizedjointlywithLGUsorbarangays.Theadvantageofthisisthatitgivesmoreopportunitytothelocalpeopletoparticipateinthediscussionaboutbiotechnology.
6. Educationisakeytodevelopingfavorableperceptionandattitudetowardsagriculturalbiotechnology.Hence,asustainedeffortinmakingtheinformationaccessibletoandinprovidingvenuesfordiscussionamongthevariousstakeholdersareimportantguidelinesformakingthepublicmoreeducatedaboutissuesandconcernsinagriculturalbiotechnology.Multiplevenuescanbeestablishedthroughmultiplepartnershipswithinstitutionsandgroupshavingthesamemandateandinterestinbiotechnology.
7. ThedisturbingfindingthatthecurrentsourcesofinformationinIndonesiaseemtoinfluencetheIndonesianpublictothinkthatagriculturalbiotechnologyisnotgoodfortheircountry’sagricultureshouldbeprobedfurther.Itmayberelatedtoreligionorsomeotherfactors.Findingoutthemoredefinitereasonswouldenablecommunicationplannerstocomeupwithmorestrategiccommunicationapproaches.Thisiswheretheconductoffocusgroupdiscussionswouldhelp.
8. Nowisthebestandmostappropriatetimetoaddressthegapinpublicunderstanding,perceptionandattitudetowardsagriculturalbiotechnologyinIndonesia.Aconsiderablesegment(aboutone-thirdbasedonthisstudy)haveyettoformtheirstandaboutbiotechnology.Theyare,therefore,potentialsupporters.Basedontheprincipleofprimacy,thefirstsetofinformationreceivedcanhavebetterandlastingimpactthanthesucceedingones.Hence,itisbuttimelytosupportandcomplementthedevelopmentshappeninginbiotechnologynowwithcommunication.
Onalongertermbasis,itissuggestedthatawellthoughtoutcommunicationstrategyinagriculturalbiotechnologybedevelopedtoguidethesystematicplanningandimplementationofcommunicationactivitiesgearedtowardspromotingbetterpublicunderstandingandperceptionofandattitudetowardsagriculturalbiotechnology.Topursuethis,thefollowingarefurtherrecommended:
1. Develop an Integrated Communication Strategy (ICS) for promoting use of agricultural biotechnology in Indonesia.
FindingsofthestudylaydownthefoundationforthedevelopmentofanIntegratedCommunicationStrategy(ICS)forthepromotionofagriculturalbiotechnologyinIndonesia.AnICSwouldaddressdirectlytheconcernsarisingfromdiscrepanciesbetweenandamongthevariousstakeholders’understandingofscience,theirknowledgeaboutbiotechnology,theirattitudestowardsagriculturalbiotechnology,andtheirratingsofattendantrisksandhazards,whichtheresultsofstatisticaltestshaveestablished.
AnICSanchoredonthetenetsofstrategiccommunicationandthephilosophyofmulti-stakeholderparticipationandcapabilitybuildingshouldengenderanenvironmentthatpositively
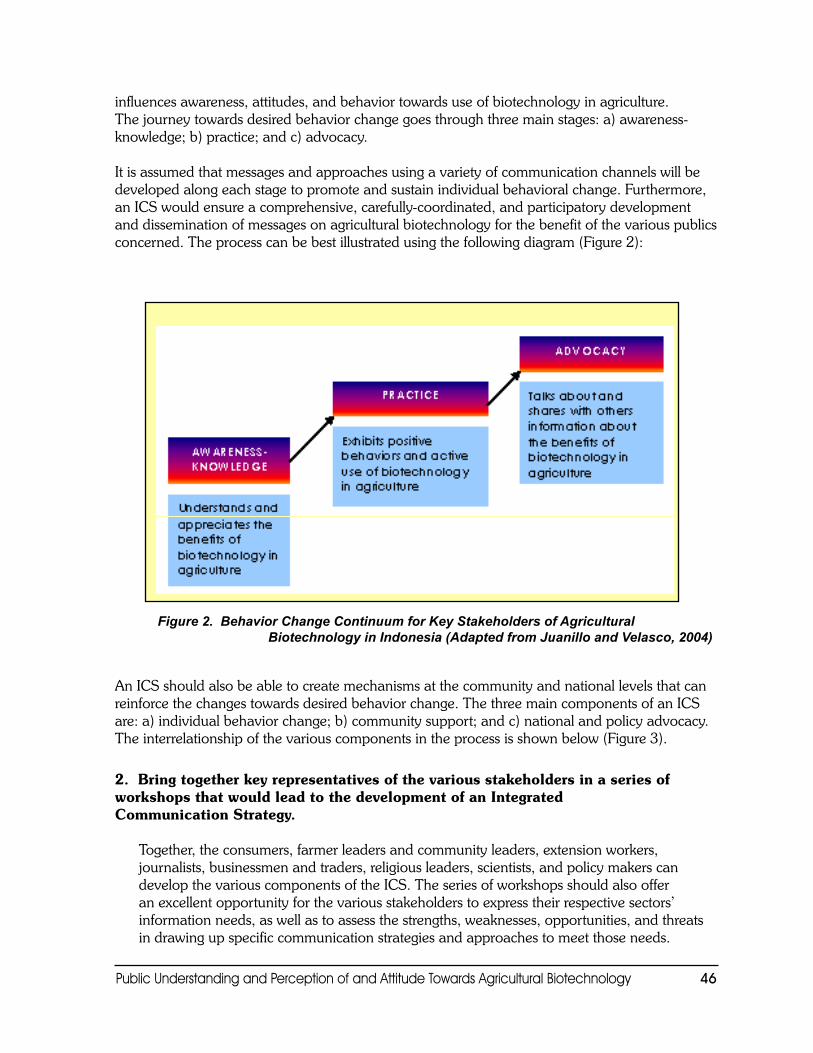
Public Understanding and Perception of and Attitude Towards Agricultural Biotechnology ��
influencesawareness,attitudes,andbehaviortowardsuseofbiotechnologyinagriculture.Thejourneytowardsdesiredbehaviorchangegoesthroughthreemainstages:a)awareness-knowledge;b)practice;andc)advocacy.
Itisassumedthatmessagesandapproachesusingavarietyofcommunicationchannelswillbedevelopedalongeachstagetopromoteandsustainindividualbehavioralchange.Furthermore,anICSwouldensureacomprehensive,carefully-coordinated,andparticipatorydevelopmentanddisseminationofmessagesonagriculturalbiotechnologyforthebenefitofthevariouspublicsconcerned.Theprocesscanbebestillustratedusingthefollowingdiagram(Figure2):
Figure 2. Behavior Change Continuum for Key Stakeholders of Agricultural Biotechnology in Indonesia (Adapted from Juanillo and Velasco, 2004)
AnICSshouldalsobeabletocreatemechanismsatthecommunityandnationallevelsthatcanreinforcethechangestowardsdesiredbehaviorchange.ThethreemaincomponentsofanICSare:a)individualbehaviorchange;b)communitysupport;andc)nationalandpolicyadvocacy.Theinterrelationshipofthevariouscomponentsintheprocessisshownbelow(Figure3).
2. Bring together key representatives of the various stakeholders in a series of workshops that would lead to the development of an Integrated Communication Strategy.
Together,theconsumers,farmerleadersandcommunityleaders,extensionworkers,journalists,businessmenandtraders,religiousleaders,scientists,andpolicymakerscandevelopthevariouscomponentsoftheICS.Theseriesofworkshopsshouldalsoofferanexcellentopportunityforthevariousstakeholderstoexpresstheirrespectivesectors’informationneeds,aswellastoassessthestrengths,weaknesses,opportunities,andthreatsindrawingupspecificcommunicationstrategiesandapproachestomeetthoseneeds.
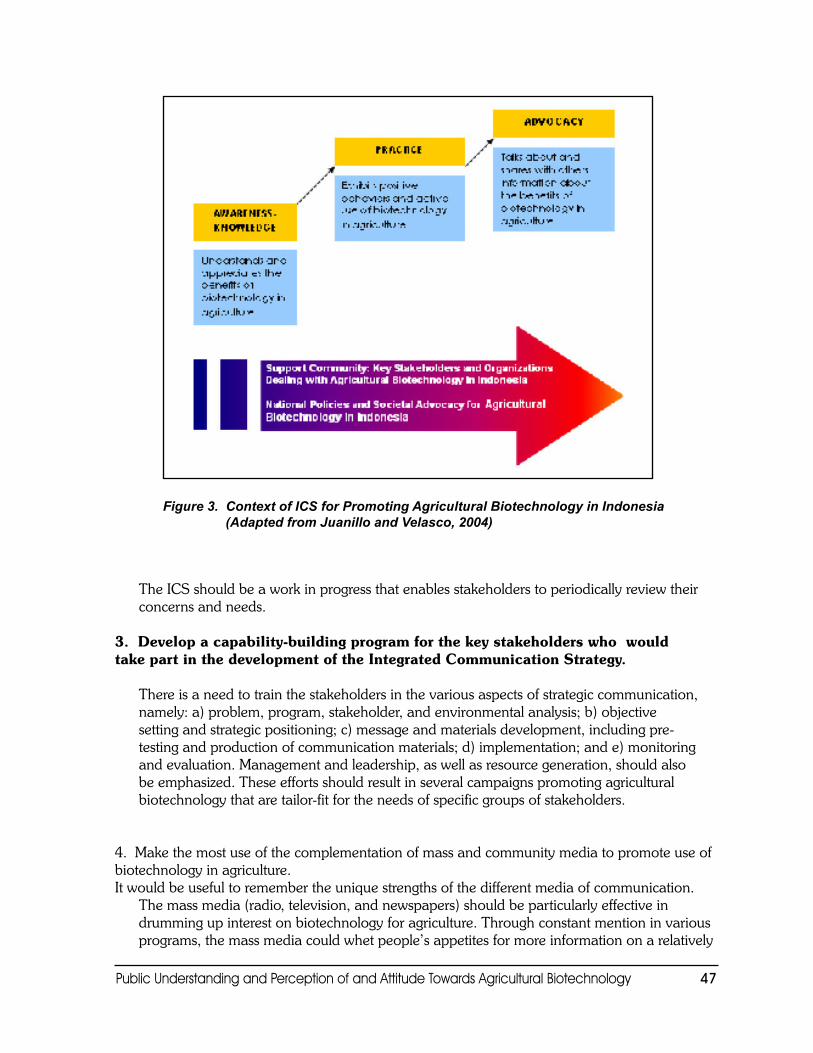
Public Understanding and Perception of and Attitude Towards Agricultural Biotechnology ��
Figure 3. Context of ICS for Promoting Agricultural Biotechnology in Indonesia (Adapted from Juanillo and Velasco, 2004)
TheICSshouldbeaworkinprogressthatenablesstakeholderstoperiodicallyreviewtheirconcernsandneeds.
3. Develop a capability-building program for the key stakeholders who would take part in the development of the Integrated Communication Strategy.
Thereisaneedtotrainthestakeholdersinthevariousaspectsofstrategiccommunication,namely:a)problem,program,stakeholder,andenvironmentalanalysis;b)objectivesettingandstrategicpositioning;c)messageandmaterialsdevelopment,includingpre-testingandproductionofcommunicationmaterials;d)implementation;ande)monitoringandevaluation.Managementandleadership,aswellasresourcegeneration,shouldalsobeemphasized.Theseeffortsshouldresultinseveralcampaignspromotingagriculturalbiotechnologythataretailor-fitfortheneedsofspecificgroupsofstakeholders.
4.Makethemostuseofthecomplementationofmassandcommunitymediatopromoteuseofbiotechnologyinagriculture.Itwouldbeusefultoremembertheuniquestrengthsofthedifferentmediaofcommunication.
Themassmedia(radio,television,andnewspapers)shouldbeparticularlyeffectiveindrummingupinterestonbiotechnologyforagriculture.Throughconstantmentioninvariousprograms,themassmediacouldwhetpeople’sappetitesformoreinformationonarelatively
Public Understanding and Perception of and Attitude Towards Agricultural Biotechnology ��
newtopic,encouragedebateanddialogueonimportantissues,andgenerallyallowfortheconceptofagriculturalbiotechnologytocarveanicheinpeople’sconsciousness.Meanwhile,thesmaller,community-basedchannelsofcommunicationthatallowforinterpersonalexchangescouldencouragemorein-depthdiscussionsofissuesthroughcommunityassembliesandpublicdiscussions.
Themassmediaareeffectiveintheawareness-knowledgestagewhilethecommunitymediaarecriticalinthepracticeandadvocacystages.However,itwouldbeusefultorememberalwaysthatcomplementationshouldworkforthegreatestgoodconsideringthatplannerscouldtakeadvantageofthevariouschannels’strongestfeatures.Thereligiousleaders,forinstance,areemergingasformidablesourcesofinformationonagriculturalbiotechnology.
5. Develop action-research programs employing participatory development communication (PDC) techniques among a community of learners in promoting agricultural biotechnology.
PDC,withits10steps,couldbeausefulcomplementtothedevelopmentofanICS.Thesestepsare:a)developingarelationshipwiththecommunity/understandingthelocalsetting;b)workingwiththecommunitytoidentifytheproblem;c)identifyingthestakeholders;d)identifyingcommunicationneeds,objectives,andactivities;e)identifyingappropriatecommunicationtools;f)preparingandpre-testingcommunicationcontentandmaterials;g)facilitatingthebuildingofpartnerships;h)producinganimplementationplan;i)monitoring,documentation,andevaluation;andj)sharingandfacilitatingtheutilizationofresults.
Sharingofresearchresultscouldbefacilitatedthroughanelectronicforum.ParticipantsinPDC-relatedprogramsandotheractivitiesconcerningagriculturalbiotechnologypromotioncouldlearnfromoneanother’sexperiencesthroughsharingviaaweb-basedforum.
Theforumwouldbeagoodopportunityforthecommunityoflearnerstoknowwhatworksordoesnotworkincertaincircumstances,aswellastogainaccesstoevidence-baseddataquickly.
6. Develop and produce advocacy cum research information kits that contain evidence-based information on biotechnology applications in agriculture.
Thesekitscouldbedistributedtoparticipantsinbiotechnology-relatedsymposia,mediapeople,publicrelationsofficersofmediaoutfits,informationofficersofgovernmentagencies,andindependentprintandbroadcastjournalists.Emphasisshouldbeonevidence-basedinformationthattheabove-mentionedstakeholderscouldquotesafely.Thesematerialsshouldalsodirectuserstosourceswheretheycangetadditionalinformationonbiotechnologyforagriculture.
Public Understanding and Perception of and Attitude Towards Agricultural Biotechnology ��
REFERENCES
AsianFoodInformationCentre(AFIC).2003.Consumer perceptions of food biotechnology in Asia: Public report on the AFIC 2002 Consumer Survey.http://www.afic.org/2002%20consumer%20survey%20public%20report.doc.
Hoban,Thomas.(2004).Public Attitudes Toward Agricultural Biotechnology. ESAWorkingPaperNo.04-09.AgriculturalEconomicsandDevelopmentDivision,FoodandAgricultureOrganizationoftheUnitedNations.Availableat:www.fao.org.es/esa
Hoban,Thomas.(1998).Trends in Consumer Attitudes About Agricultural Biotechnology.AgBioForum,1(1),3-7.http://www.agbioforum.org
InitiativeforFutureAgricultureandFoodSystems(IFAFS)2006.ParticipatoryAssessmentofSocialandEconomicImpactsofBiotechnology,ACollaborativeResearchProjecthttp://www.agecon.vt.edu/biotechimpact/index.htm
Juanillo,NapoleonJr.andMa.TheresaH.Velasco.IntegratedCommunicationStrategyforPhilTIPS(unpublishedreport),2004.
Mataia,A.,Cataquiz,G.,Francisco,R.,Sebastian,I.,Bernardino,M.,Hossain,M.,&Garcia,L.Public Knowledge, Attitude and Perception on Rice Biotechnology Research in the Philippines.PhilRice–IRRICollaborativeProject,2003.
Nevitt,J.,Mills,B.F.,Reaves,D.W.,&Norton,G.W.Perceived Social Costs of Agricultural Biotechnology. Participatory Assessment of Social and Economic Impacts of Biotechnology.WorkingPaperNo.03,September,2004.
PewInitiativeonFoodandBiotechnology.2003.Public Sentiment on Genetically Modified Food.http://pewagbiotech.org/research/2003update/
UIUC-ISAAASurvey:Southeast Asians positive towards agri-biotech, exhibit high trust in university scientists and research instituteshttp://www.seedquest.com/News/releases/2003/may/5864.htm
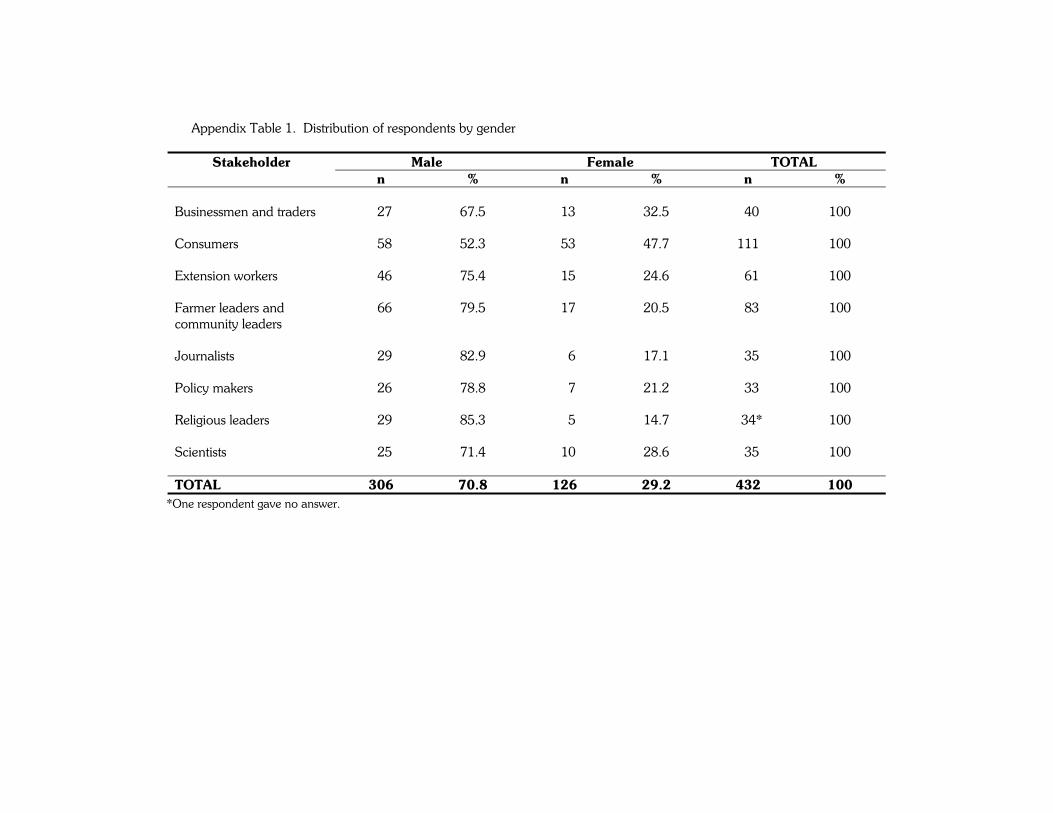
Appendix Table 1. Distribution of respondents by gender
*One respondent gave no answer.
Male Female TOTAL Stakeholder n % n % n %
Businessmen and traders 027 67.5 013 32.5 040 100 Consumers 058 52.3 053 47.7 111 100 Extension workers 046 75.4 015 24.6 061 100 Farmer leaders and community leaders
066 79.5 017 20.5 083 100
Journalists 029 82.9 006 17.1 035 100 Policy makers 026 78.8 007 21.2 033 100 Religious leaders 029 85.3 005 14.7 034* 100 Scientists 025 71.4 010 28.6 035 100 TOTAL 306 70.8 126 29.2 432 100
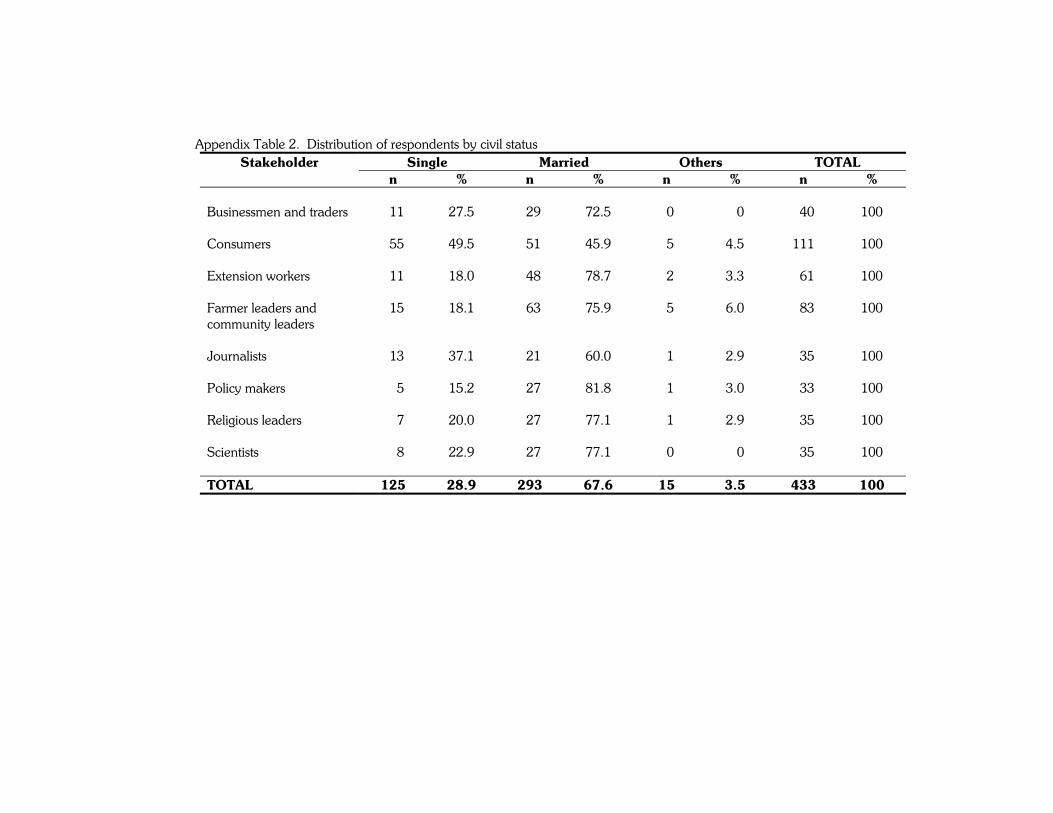
Appendix Table 2. Distribution of respondents by civil status
Single Married Others TOTAL Stakeholder n % n % n % n %
Businessmen and traders 011 27.5 029 72.5 00 0.0 040 100 Consumers 055 49.5 051 45.9 05 4.5 111 100 Extension workers 011 18.0 048 78.7 02 3.3 061 100 Farmer leaders and community leaders
015 18.1 063 75.9 05 6.0 083 100
Journalists 013 37.1 021 60.0 01 2.9 035 100 Policy makers 005 15.2 027 81.8 01 3.0 033 100 Religious leaders 007 20.0 027 77.1 01 2.9 035 100 Scientists 008 22.9 027 77.1 00 0.0 035 100 TOTAL 125 28.9 293 67.6 15 3.5 433 100
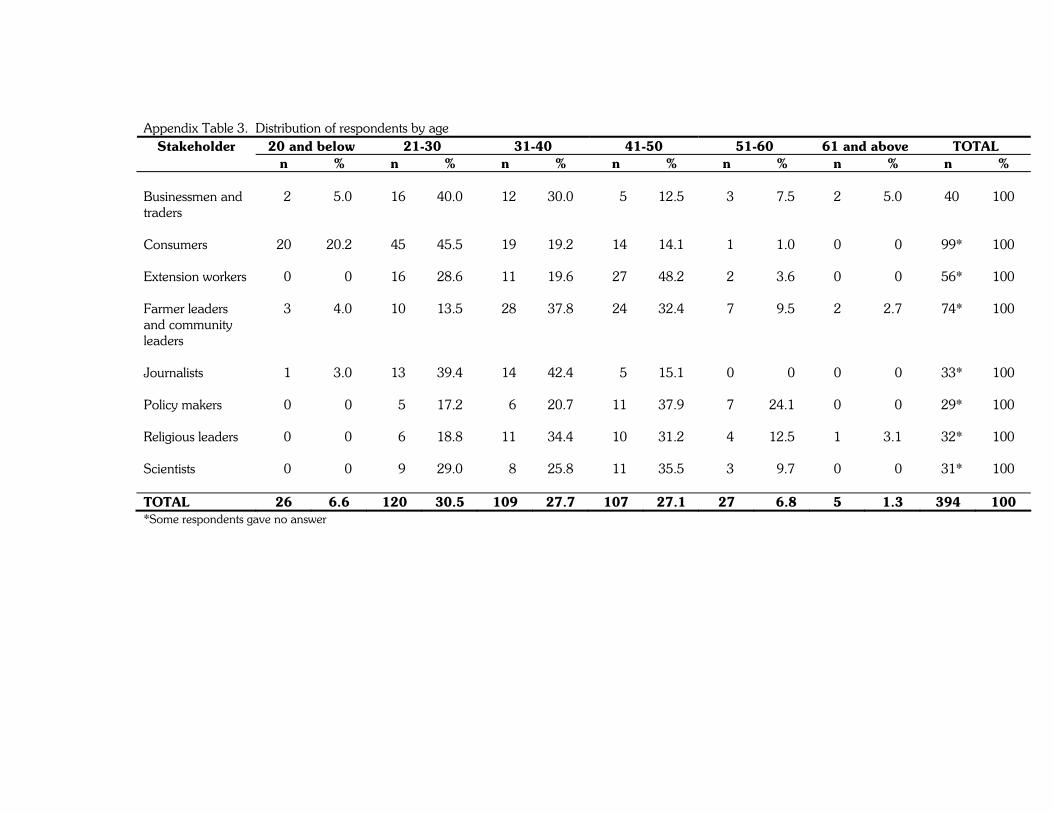
Appendix Table 3. Distribution of respondents by age 20 and below 21-30 31-40 41-50 51-60 61 and above TOTAL Stakeholder
n % n % n % n % n % n % n % Businessmen and traders
02 05.0 016 40.0 012 30.0 005 12.5 03 07.5 2 5.0 040 100
Consumers 20 20.2 045 45.5 019 19.2 014 14.1 01 01.0 0 0.0 099* 100 Extension workers 00 00.0 016 28.6 011 19.6 027 48.2 02 03.6 0 0.0 056* 100 Farmer leaders and community leaders
03 04.0 010 13.5 028 37.8 024 32.4 07 09.5 2 2.7 074* 100
Journalists 01 03.0 013 39.4 014 42.4 005 15.1 00 00.0 0 0.0 033* 100 Policy makers 00 00.0 005 17.2 006 20.7 011 37.9 07 24.1 0 0.0 029* 100 Religious leaders 00 00.0 006 18.8 011 34.4 010 31.2 04 12.5 1 3.1 032* 100 Scientists 00 00.0 009 29.0 008 25.8 011 35.5 03 09.7 0 0.0 031* 100 TOTAL 26 6.6 120 30.5 109 27.7 107 27.1 27 06.8 5 1.3 394 100 *Some respondents gave no answer
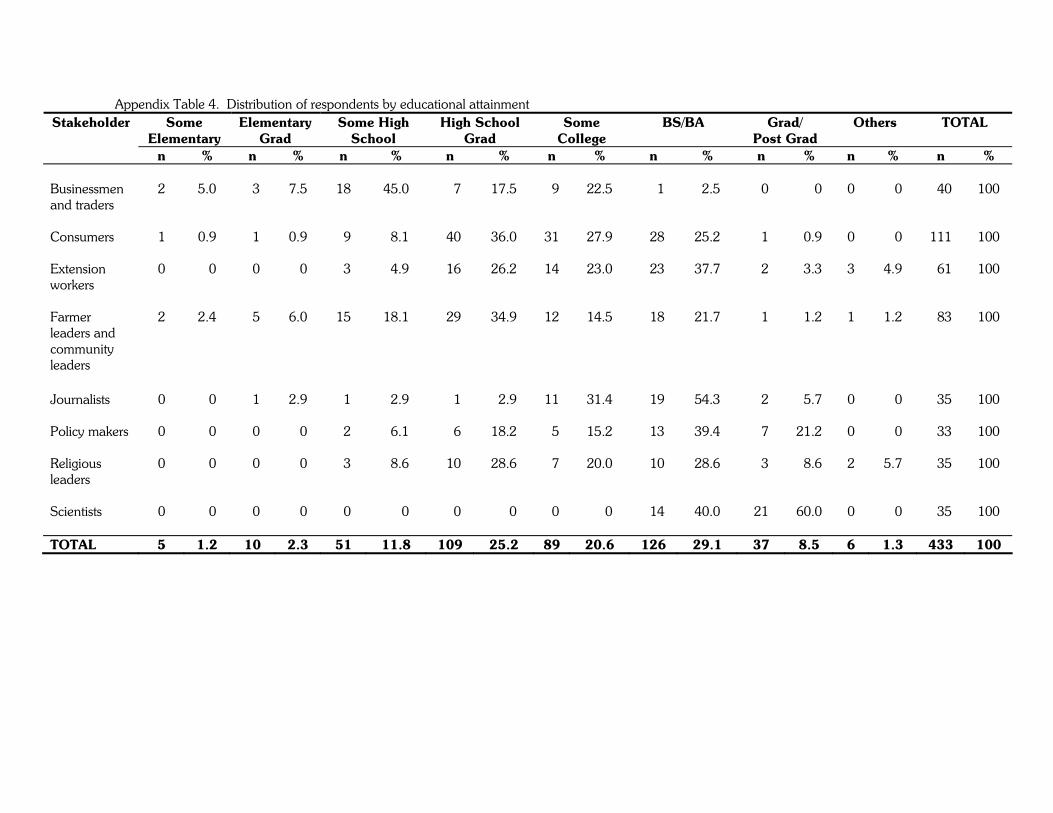
Appendix Table 4. Distribution of respondents by educational attainment Some
Elementary Elementary
Grad Some High
School High School
Grad Some
College BS/BA Grad/
Post Grad Others TOTAL Stakeholder
n % n % n % n % n % n % n % n % n % Businessmen and traders
2 5.0 03 7.5 18 45.0 007 17.5 09 22.5 001 02.5 00 00.0 0 0.0 040 100
Consumers 1 0.9 01 0.9 09 08.1 040 36.0 31 27.9 028 25.2 01 00.9 0 0.0 111 100 Extension workers
0 0.0 00 0.0 03 04.9 016 26.2 14 23.0 023 37.7 02 03.3 3 4.9 061 100
Farmer leaders and community leaders
2 2.4 05 6.0 15 18.1 029 34.9 12 14.5 018 21.7 01 01.2 1 1.2 083 100
Journalists 0 0.0 01 2.9 01 02.9 001 02.9 11 31.4 019 54.3 02 05.7 0 0.0 035 100 Policy makers 0 0.0 00 0.0 02 06.1 006 18.2 05 15.2 013 39.4 07 21.2 0 0.0 033 100 Religious leaders
0 0.0 00 0.0 03 08.6 010 28.6 07 20.0 010 28.6 03 08.6 2 5.7 035 100
Scientists 0 0.0 00 0.0 00 00.0 000 00.0 00 00.0 014 40.0 21 60.0 0 0.0 035 100 TOTAL 5 1.2 10 2.3 51 11.8 109 25.2 89 20.6 126 29.1 37 8.5 6 1.3 433 100
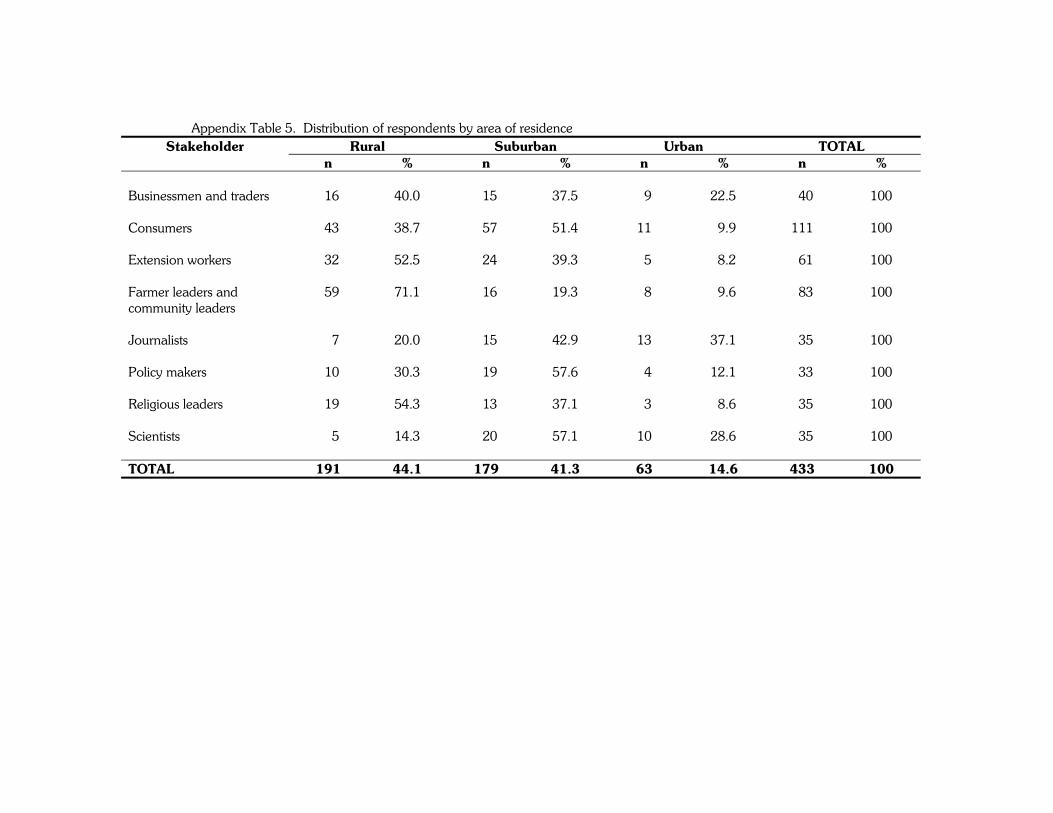
Appendix Table 5. Distribution of respondents by area of residence Rural Suburban Urban TOTAL Stakeholder
n % n % n % n % Businessmen and traders 016 40.0 015 37.5 09 22.5 040 100 Consumers 043 38.7 057 51.4 11 09.9 111 100 Extension workers 032 52.5 024 39.3 05 08.2 061 100 Farmer leaders and community leaders
059 71.1 016 19.3 08 09.6 083 100
Journalists 007 20.0 015 42.9 13 37.1 035 100 Policy makers 010 30.3 019 57.6 04 12.1 033 100 Religious leaders 019 54.3 013 37.1 03 08.6 035 100 Scientists 005 14.3 020 57.1 10 28.6 035 100 TOTAL 191 44.1 179 41.3 63 14.6 433 100
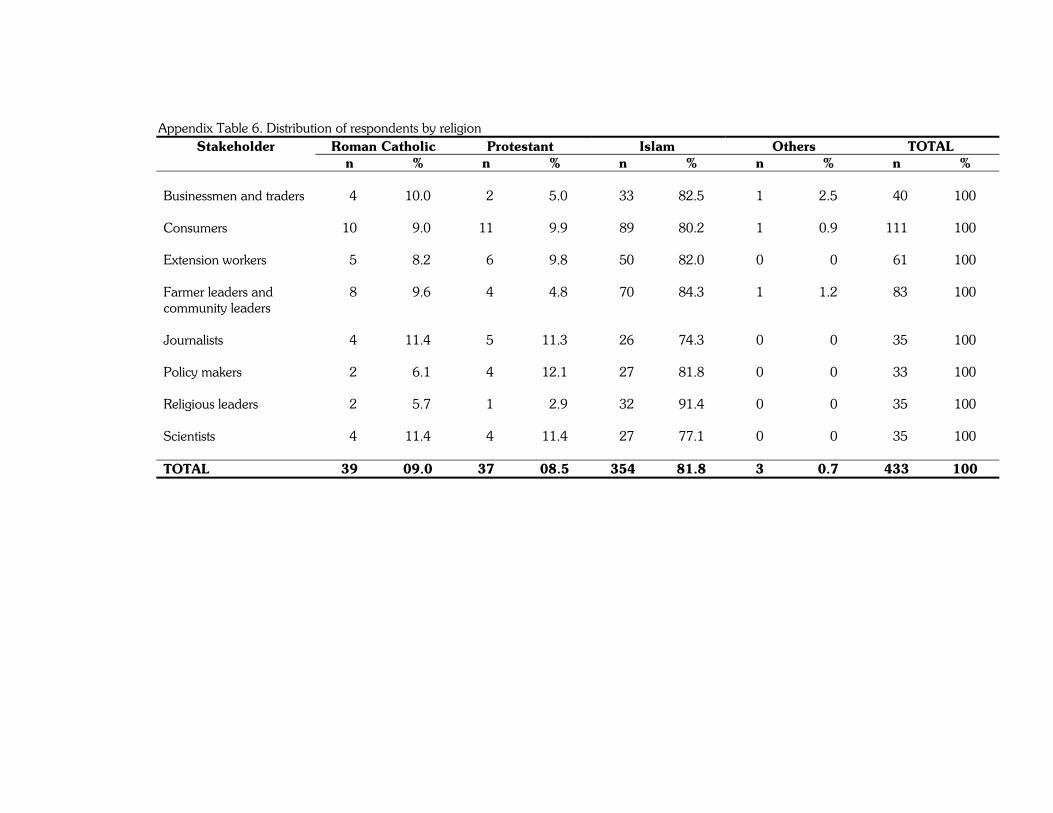
Appendix Table 6. Distribution of respondents by religion Roman Catholic Protestant Islam Others TOTAL Stakeholder
n % n % n % n % n % Businessmen and traders 04 10.0 02 05.0 033 82.5 1 2.5 040 100 Consumers 10 09.0 11 09.9 089 80.2 1 0.9 111 100 Extension workers 05 08.2 06 09.8 050 82.0 0 0.0 061 100 Farmer leaders and community leaders
08 09.6 04 04.8 070 84.3 1 1.2 083 100
Journalists 04 11.4 05 11.3 026 74.3 0 0.0 035 100 Policy makers 02 06.1 04 12.1 027 81.8 0 0.0 033 100 Religious leaders 02 05.7 01 02.9 032 91.4 0 0.0 035 100 Scientists 04 11.4 04 11.4 027 77.1 0 0.0 035 100 TOTAL 39 09.0 37 08.5 354 81.8 3 0.7 433 100
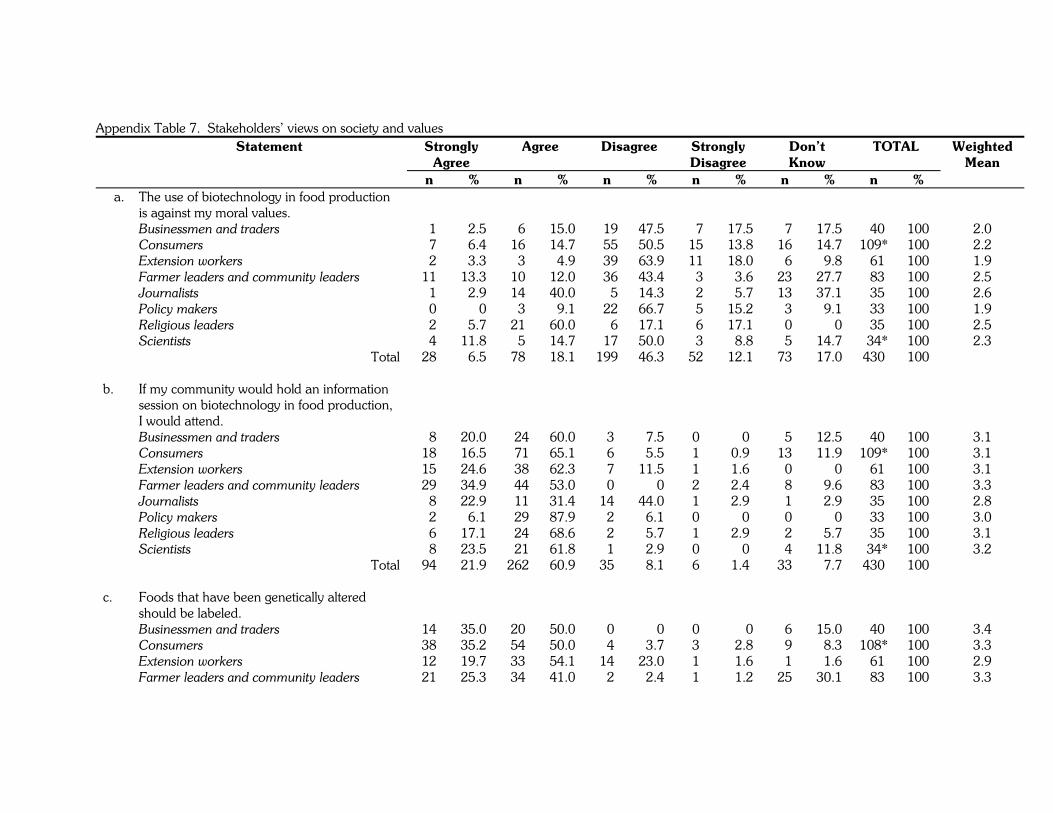
Appendix Table 7. Stakeholders’ views on society and values Strongly
Agree Agree Disagree Strongly
Disagree Don’t Know
TOTAL
Weighted Mean
Statement
n % n % n % n % n % n % a. The use of biotechnology in food production
is against my moral values.
Businessmen and traders 01 02.5 06 15.0 019 47.5 07 17.5 07 17.5 040 100 2.0 Consumers 07 06.4 16 14.7 055 50.5 15 13.8 16 14.7 109* 100 2.2 Extension workers 02 03.3 03 04.9 039 63.9 11 18.0 06 09.8 061 100 1.9 Farmer leaders and community leaders 11 13.3 10 12.0 036 43.4 03 03.6 23 27.7 083 100 2.5 Journalists 01 02.9 14 40.0 005 14.3 02 05.7 13 37.1 035 100 2.6 Policy makers 00 00.0 03 09.1 022 66.7 05 15.2 03 09.1 033 100 1.9 Religious leaders 02 05.7 21 60.0 006 17.1 06 17.1 00 00.0 035 100 2.5 Scientists 04 11.8 05 14.7 017 50.0 03 08.8 05 14.7 034* 100 2.3 Total 28 06.5 78 18.1 199 46.3 52 12.1 73 17.0 430 100 b. If my community would hold an information
session on biotechnology in food production, I would attend.
Businessmen and traders 08 20.0 024 60.0 03 07.5 0 0.0 05 12.5 040 100 3.1 Consumers 18 16.5 071 65.1 06 05.5 1 0.9 13 11.9 109* 100 3.1 Extension workers 15 24.6 038 62.3 07 11.5 1 1.6 00 00.0 061 100 3.1 Farmer leaders and community leaders 29 34.9 044 53.0 00 00.0 2 2.4 08 09.6 083 100 3.3 Journalists 08 22.9 011 31.4 14 44.0 1 2.9 01 02.9 035 100 2.8 Policy makers 02 06.1 029 87.9 02 06.1 0 0.0 00 00.0 033 100 3.0 Religious leaders 06 17.1 024 68.6 02 05.7 1 2.9 02 05.7 035 100 3.1 Scientists 08 23.5 021 61.8 01 02.9 0 0.0 04 11.8 034* 100 3.2 Total 94 21.9 262 60.9 35 08.1 6 1.4 33 07.7 430 100 c. Foods that have been genetically altered
should be labeled.
Businessmen and traders 14 35.0 20 50.0 00 00.0 0 00.0 06 15.0 040 100 3.4 Consumers 38 35.2 54 50.0 04 03.7 3 02.8 09 08.3 108* 100 3.3 Extension workers 12 19.7 33 54.1 14 23.0 1 01.6 01 01.6 061 100 2.9 Farmer leaders and community leaders 21 25.3 34 41.0 02 02.4 1 01.2 25 30.1 083 100 3.3
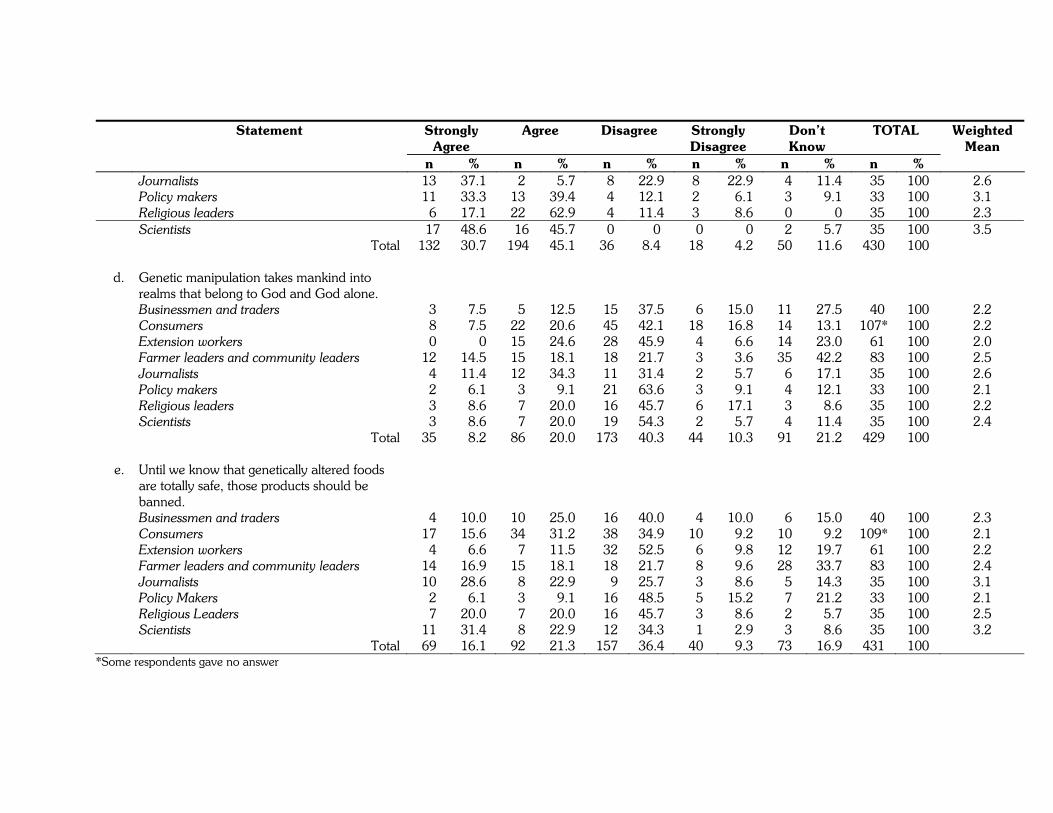
Strongly Agree
Agree Disagree Strongly Disagree
Don’t Know
TOTAL
Weighted Mean
Statement
n % n % n % n % n % n % Journalists 13 37.1 02 05.7 08 22.9 8 22.9 04 11.4 035 100 2.6 Policy makers 11 33.3 13 39.4 04 12.1 2 06.1 03 09.1 033 100 3.1 Religious leaders 06 17.1 22 62.9 04 11.4 3 08.6 00 00.0 035 100 2.3
Scientists 017 48.6 016 45.7 00 0.0 00 00.0 02 05.7 035 100 3.5 Total 132 30.7 194 45.1 36 8.4 18 04.2 50 11.6 430 100
d. Genetic manipulation takes mankind into realms that belong to God and God alone.
Businessmen and traders 03 07.5 05 12.5 015 37.5 06 15.0 11 27.5 040 100 2.2 Consumers 08 07.5 22 20.6 045 42.1 18 16.8 14 13.1 107* 100 2.2 Extension workers 00 00.0 15 24.6 028 45.9 04 06.6 14 23.0 061 100 2.0 Farmer leaders and community leaders 12 14.5 15 18.1 018 21.7 03 03.6 35 42.2 083 100 2.5 Journalists 04 11.4 12 34.3 011 31.4 02 05.7 06 17.1 035 100 2.6 Policy makers 02 06.1 03 09.1 021 63.6 03 09.1 04 12.1 033 100 2.1 Religious leaders 03 08.6 07 20.0 016 45.7 06 17.1 03 08.6 035 100 2.2 Scientists 03 08.6 07 20.0 019 54.3 02 05.7 04 11.4 035 100 2.4 Total 35 08.2 86 20.0 173 40.3 44 10.3 91 21.2 429 100
e. Until we know that genetically altered foods are totally safe, those products should be banned.
Businessmen and traders 04 10.0 10 25.0 016 40.0 04 10.0 06 15.0 040 100 2.3 Consumers 17 15.6 34 31.2 038 34.9 10 09.2 10 09.2 109* 100 2.1 Extension workers 04 06.6 07 11.5 032 52.5 06 09.8 12 19.7 061 100 2.2 Farmer leaders and community leaders 14 16.9 15 18.1 018 21.7 08 09.6 28 33.7 083 100 2.4 Journalists 10 28.6 08 22.9 009 25.7 03 08.6 05 14.3 035 100 3.1 Policy Makers 02 06.1 03 09.1 016 48.5 05 15.2 07 21.2 033 100 2.1 Religious Leaders 07 20.0 07 20.0 016 45.7 03 08.6 02 05.7 035 100 2.5 Scientists 11 31.4 08 22.9 012 34.3 01 02.9 03 08.6 035 100 3.2 Total 69 16.1 92 21.3 157 36.4 40 09.3 73 16.9 431 100
*Some respondents gave no answer
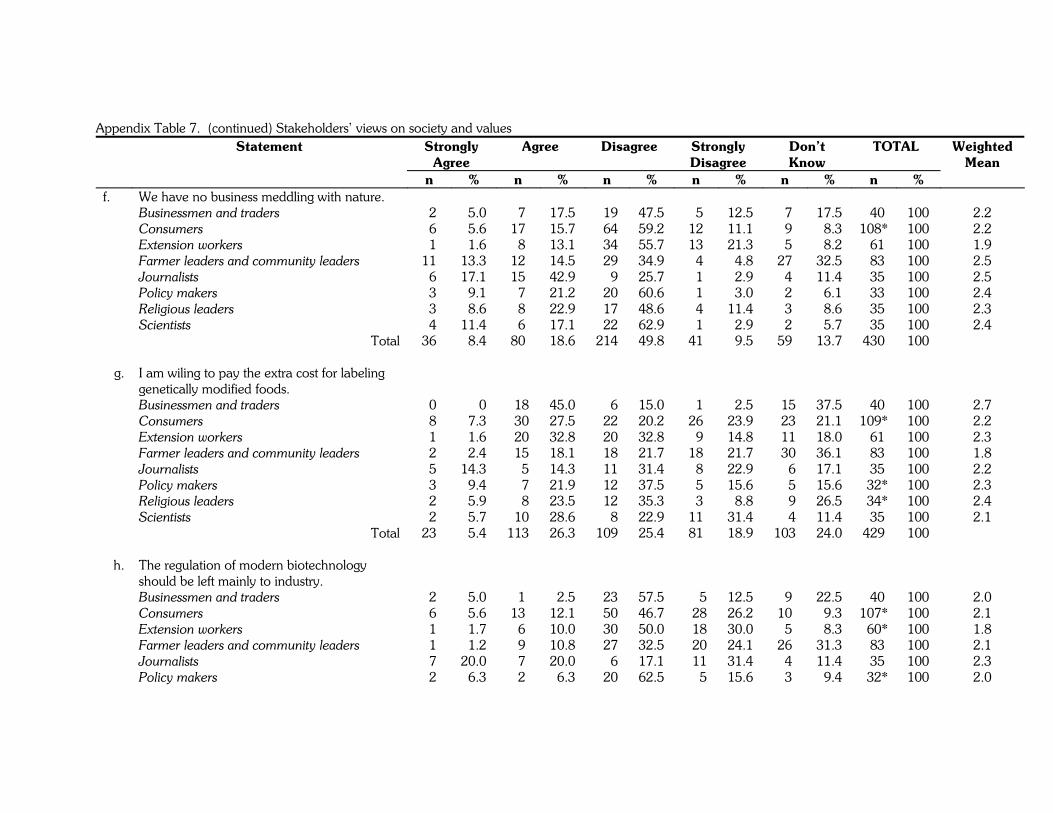
Appendix Table 7. (continued) Stakeholders’ views on society and values Strongly
Agree Agree Disagree Strongly
Disagree Don’t Know
TOTAL
Weighted Mean
Statement
n % n % n % n % n % n % f. We have no business meddling with nature.
Businessmen and traders 02 05.0 07 17.5 019 47.5 05 12.5 07 17.5 040 100 2.2 Consumers 06 05.6 17 15.7 064 59.2 12 11.1 09 08.3 108* 100 2.2 Extension workers 01 01.6 08 13.1 034 55.7 13 21.3 05 08.2 061 100 1.9 Farmer leaders and community leaders 11 13.3 12 14.5 029 34.9 04 04.8 27 32.5 083 100 2.5 Journalists 06 17.1 15 42.9 009 25.7 01 02.9 04 11.4 035 100 2.5 Policy makers 03 09.1 07 21.2 020 60.6 01 03.0 02 06.1 033 100 2.4 Religious leaders 03 08.6 08 22.9 017 48.6 04 11.4 03 08.6 035 100 2.3 Scientists 04 11.4 06 17.1 022 62.9 01 02.9 02 05.7 035 100 2.4 Total 36 08.4 80 18.6 214 49.8 41 09.5 59 13.7 430 100
g. I am wiling to pay the extra cost for labeling genetically modified foods.
Businessmen and traders 00 00.0 018 45.0 006 15.0 01 02.5 015 37.5 040 100 2.7 Consumers 08 07.3 030 27.5 022 20.2 26 23.9 023 21.1 109* 100 2.2 Extension workers 01 01.6 020 32.8 020 32.8 09 14.8 011 18.0 061 100 2.3 Farmer leaders and community leaders 02 02.4 015 18.1 018 21.7 18 21.7 030 36.1 083 100 1.8 Journalists 05 14.3 005 14.3 011 31.4 08 22.9 006 17.1 035 100 2.2 Policy makers 03 09.4 007 21.9 012 37.5 05 15.6 005 15.6 032* 100 2.3 Religious leaders 02 05.9 008 23.5 012 35.3 03 08.8 009 26.5 034* 100 2.4 Scientists 02 05.7 010 28.6 008 22.9 11 31.4 004 11.4 035 100 2.1 Total 23 05.4 113 26.3 109 25.4 81 18.9 103 24.0 429 100
h. The regulation of modern biotechnology should be left mainly to industry.
Businessmen and traders 02 05.0 01 02.5 023 57.5 005 12.5 09 22.5 040 100 2.0 Consumers 06 05.6 13 12.1 050 46.7 028 26.2 10 09.3 107* 100 2.1 Extension workers 01 01.7 06 10.0 030 50.0 018 30.0 05 08.3 060* 100 1.8 Farmer leaders and community leaders 01 01.2 09 10.8 027 32.5 020 24.1 26 31.3 083 100 2.1 Journalists 07 20.0 07 20.0 006 17.1 011 31.4 04 11.4 035 100 2.3 Policy makers 02 06.3 02 06.3 020 62.5 005 15.6 03 09.4 032* 100 2.0
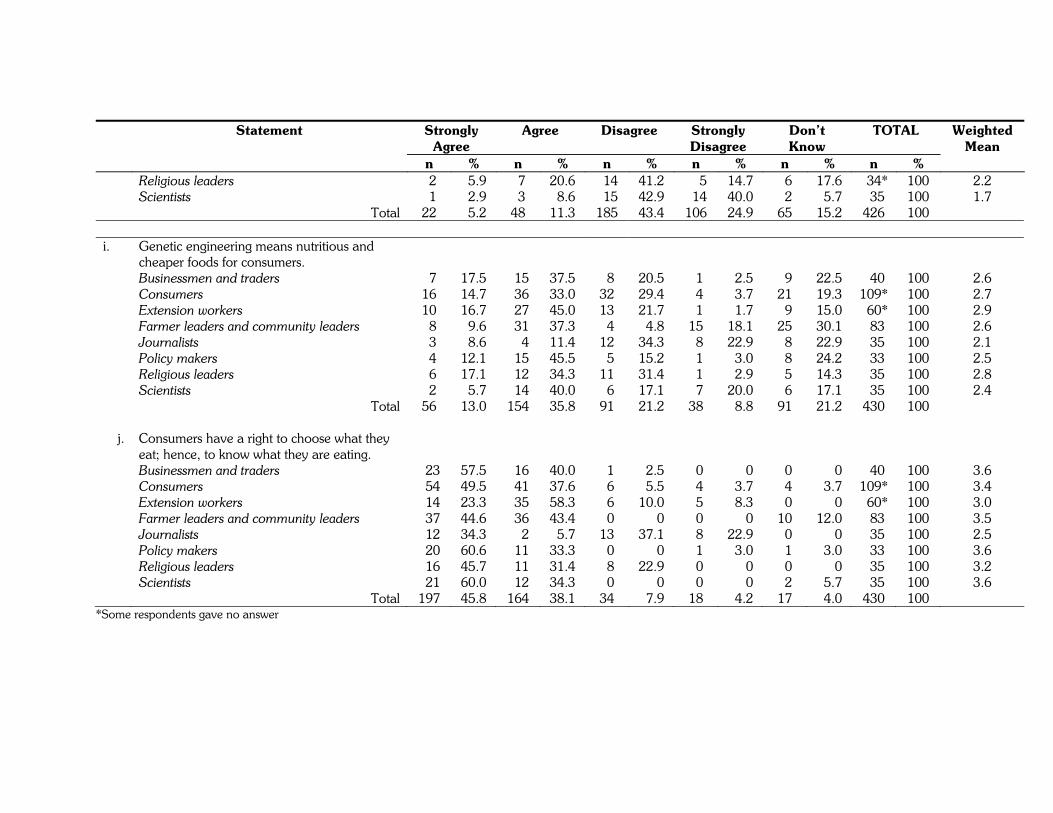
Strongly Agree
Agree Disagree Strongly Disagree
Don’t Know
TOTAL
Weighted Mean
Statement
n % n % n % n % n % n % Religious leaders 02 05.9 07 20.6 014 41.2 005 14.7 06 17.6 034* 100 2.2 Scientists 01 02.9 03 08.6 015 42.9 014 40.0 02 05.7 035 100 1.7
Total 22 05.2 48 11.3 185 43.4 106 24.9 65 15.2 426 100 i. Genetic engineering means nutritious and
cheaper foods for consumers.
Businessmen and traders 07 17.5 015 37.5 08 20.5 01 02.5 09 22.5 040 100 2.6 Consumers 16 14.7 036 33.0 32 29.4 04 03.7 21 19.3 109* 100 2.7 Extension workers 10 16.7 027 45.0 13 21.7 01 01.7 09 15.0 060* 100 2.9 Farmer leaders and community leaders 08 09.6 031 37.3 04 04.8 15 18.1 25 30.1 083 100 2.6 Journalists 03 08.6 004 11.4 12 34.3 08 22.9 08 22.9 035 100 2.1 Policy makers 04 12.1 015 45.5 05 15.2 01 03.0 08 24.2 033 100 2.5 Religious leaders 06 17.1 012 34.3 11 31.4 01 02.9 05 14.3 035 100 2.8 Scientists 02 05.7 014 40.0 06 17.1 07 20.0 06 17.1 035 100 2.4 Total 56 13.0 154 35.8 91 21.2 38 08.8 91 21.2 430 100
j. Consumers have a right to choose what they eat; hence, to know what they are eating.
Businessmen and traders 023 57.5 016 40.0 01 02.5 00 00.0 00 00.0 040 100 3.6 Consumers 054 49.5 041 37.6 06 05.5 04 03.7 04 03.7 109* 100 3.4 Extension workers 014 23.3 035 58.3 06 10.0 05 08.3 00 00.0 060* 100 3.0 Farmer leaders and community leaders 037 44.6 036 43.4 00 00.0 00 00.0 10 12.0 083 100 3.5 Journalists 012 34.3 002 05.7 13 37.1 08 22.9 00 00.0 035 100 2.5 Policy makers 020 60.6 011 33.3 00 00.0 01 03.0 01 03.0 033 100 3.6 Religious leaders 016 45.7 011 31.4 08 22.9 00 00.0 00 00.0 035 100 3.2 Scientists 021 60.0 012 34.3 00 00.0 00 00.0 02 05.7 035 100 3.6
Total 197 45.8 164 38.1 34 07.9 18 04.2 17 04.0 430 100 *Some respondents gave no answer
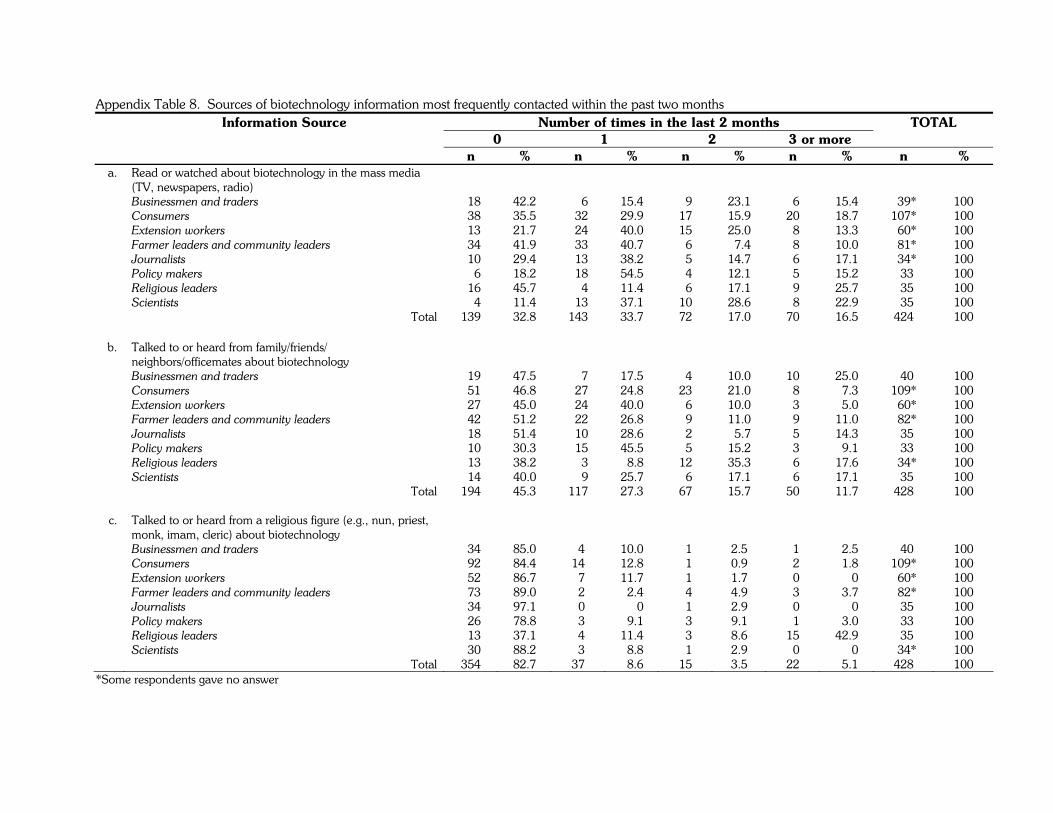
Appendix Table 8. Sources of biotechnology information most frequently contacted within the past two months Information Source Number of times in the last 2 months 0 1 2 3 or more
TOTAL
n % n % n % n % n % a. Read or watched about biotechnology in the mass media
(TV, newspapers, radio)
Businessmen and traders 018 42.2 006 15.4 09 23.1 06 15.4 039* 100 Consumers 038 35.5 032 29.9 17 15.9 20 18.7 107* 100 Extension workers 013 21.7 024 40.0 15 25.0 08 13.3 060* 100 Farmer leaders and community leaders 034 41.9 033 40.7 06 07.4 08 10.0 081* 100 Journalists 010 29.4 013 38.2 05 14.7 06 17.1 034* 100 Policy makers 006 18.2 018 54.5 04 12.1 05 15.2 033 100 Religious leaders 016 45.7 004 11.4 06 17.1 09 25.7 035 100 Scientists 004 11.4 013 37.1 10 28.6 08 22.9 035 100 Total 139 32.8 143 33.7 72 17.0 70 16.5 424 100
b. Talked to or heard from family/friends/ neighbors/officemates about biotechnology
Businessmen and traders 019 47.5 007 17.5 04 10.0 10 25.0 040 100 Consumers 051 46.8 027 24.8 23 21.0 08 07.3 109* 100 Extension workers 027 45.0 024 40.0 06 10.0 03 05.0 060* 100 Farmer leaders and community leaders 042 51.2 022 26.8 09 11.0 09 11.0 082* 100 Journalists 018 51.4 010 28.6 02 05.7 05 14.3 035 100 Policy makers 010 30.3 015 45.5 05 15.2 03 09.1 033 100 Religious leaders 013 38.2 003 08.8 12 35.3 06 17.6 034* 100 Scientists 014 40.0 009 25.7 06 17.1 06 17.1 035 100 Total 194 45.3 117 27.3 67 15.7 50 11.7 428 100
c. Talked to or heard from a religious figure (e.g., nun, priest, monk, imam, cleric) about biotechnology
Businessmen and traders 034 85.0 04 10.0 01 2.5 01 02.5 040 100 Consumers 092 84.4 14 12.8 01 0.9 02 01.8 109* 100 Extension workers 052 86.7 07 11.7 01 1.7 00 00.0 060* 100 Farmer leaders and community leaders 073 89.0 02 02.4 04 4.9 03 03.7 082* 100 Journalists 034 97.1 00 00.0 01 2.9 00 00.0 035 100 Policy makers 026 78.8 03 09.1 03 9.1 01 03.0 033 100 Religious leaders 013 37.1 04 11.4 03 8.6 15 42.9 035 100 Scientists 030 88.2 03 08.8 01 2.9 00 00.0 034* 100 Total 354 82.7 37 08.6 15 3.5 22 05.1 428 100
*Some respondents gave no answer
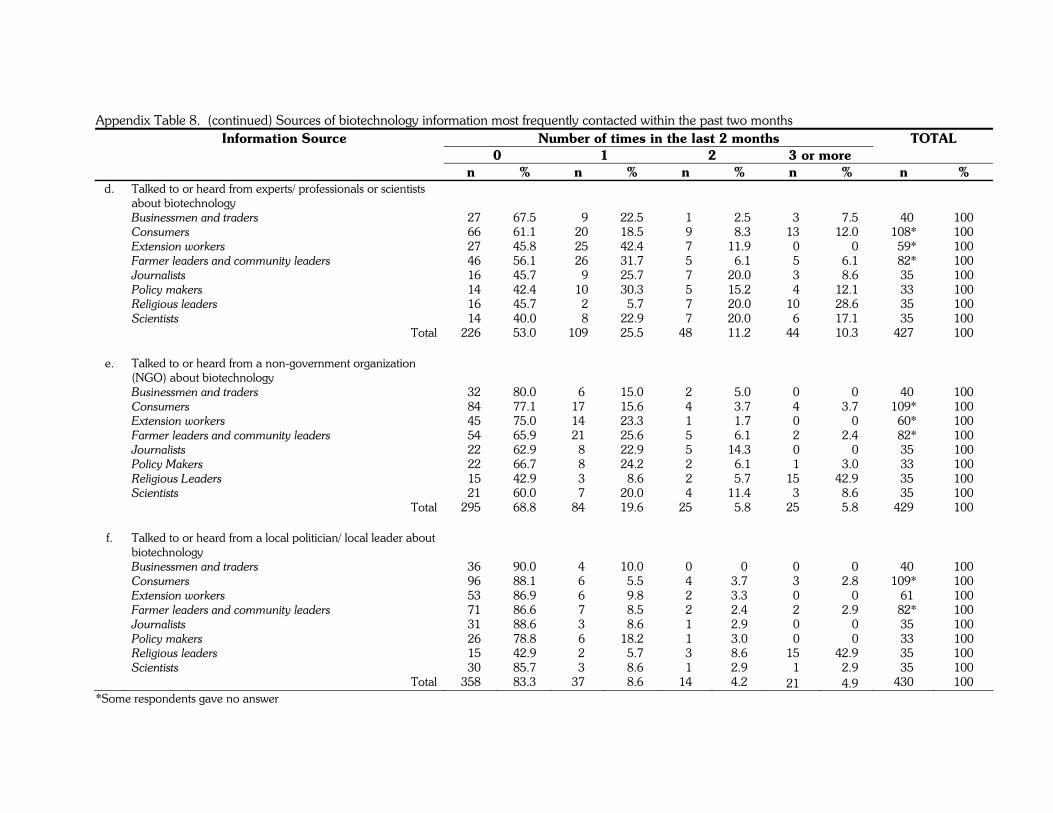
Appendix Table 8. (continued) Sources of biotechnology information most frequently contacted within the past two months Information Source Number of times in the last 2 months 0 1 2 3 or more
TOTAL
n % n % n % n % n % d. Talked to or heard from experts/ professionals or scientists
about biotechnology
Businessmen and traders 027 67.5 009 22.5 01 02.5 03 07.5 040 100 Consumers 066 61.1 020 18.5 09 08.3 13 12.0 108* 100 Extension workers 027 45.8 025 42.4 07 11.9 00 00.0 059* 100 Farmer leaders and community leaders 046 56.1 026 31.7 05 06.1 05 06.1 082* 100 Journalists 016 45.7 009 25.7 07 20.0 03 08.6 035 100 Policy makers 014 42.4 010 30.3 05 15.2 04 12.1 033 100 Religious leaders 016 45.7 002 05.7 07 20.0 10 28.6 035 100 Scientists 014 40.0 008 22.9 07 20.0 06 17.1 035 100 Total 226 53.0 109 25.5 48 11.2 44 10.3 427 100
e. Talked to or heard from a non-government organization (NGO) about biotechnology
Businessmen and traders 032 80.0 06 15.0 02 05.0 00 00.0 040 100 Consumers 084 77.1 17 15.6 04 03.7 04 03.7 109* 100 Extension workers 045 75.0 14 23.3 01 01.7 00 00.0 060* 100 Farmer leaders and community leaders 054 65.9 21 25.6 05 06.1 02 02.4 082* 100 Journalists 022 62.9 08 22.9 05 14.3 00 00.0 035 100 Policy Makers 022 66.7 08 24.2 02 06.1 01 03.0 033 100 Religious Leaders 015 42.9 03 08.6 02 05.7 15 42.9 035 100 Scientists 021 60.0 07 20.0 04 11.4 03 08.6 035 100 Total 295 68.8 84 19.6 25 05.8 25 05.8 429 100 f. Talked to or heard from a local politician/ local leader about
biotechnology
Businessmen and traders 036 90.0 04 10.0 00 0.0 00 00.0 040 100 Consumers 096 88.1 06 05.5 04 3.7 03 02.8 109* 100 Extension workers 053 86.9 06 09.8 02 3.3 00 00.0 061 100 Farmer leaders and community leaders 071 86.6 07 08.5 02 2.4 02 02.9 082* 100 Journalists 031 88.6 03 08.6 01 2.9 00 00.0 035 100 Policy makers 026 78.8 06 18.2 01 3.0 00 00.0 033 100 Religious leaders 015 42.9 02 05.7 03 8.6 15 42.9 035 100 Scientists 030 85.7 03 08.6 01 2.9 01 02.9 035 100 Total 358 83.3 37 08.6 14 4.2 21 04.9 430 100
*Some respondents gave no answer
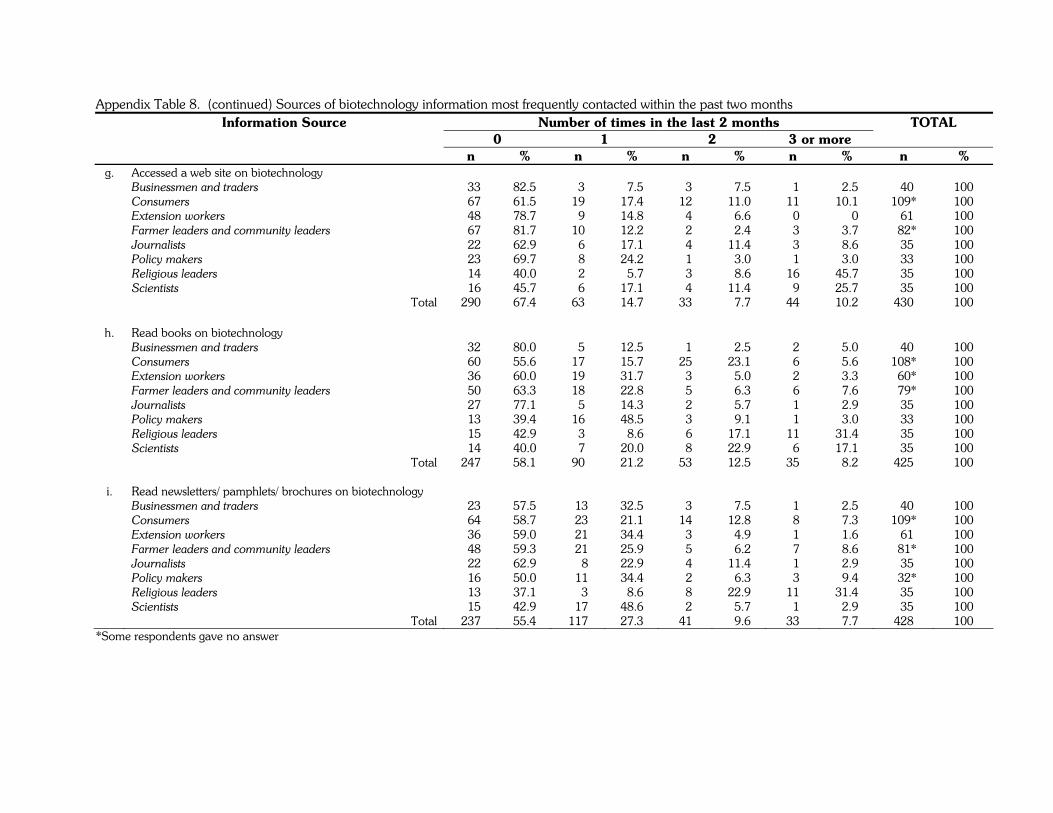
Appendix Table 8. (continued) Sources of biotechnology information most frequently contacted within the past two months Information Source Number of times in the last 2 months 0 1 2 3 or more
TOTAL
n % n % n % n % n % g. Accessed a web site on biotechnology Businessmen and traders 033 82.5 03 07.5 03 07.5 01 02.5 040 100 Consumers 067 61.5 19 17.4 12 11.0 11 10.1 109* 100 Extension workers 048 78.7 09 14.8 04 06.6 00 00.0 061 100 Farmer leaders and community leaders 067 81.7 10 12.2 02 02.4 03 03.7 082* 100 Journalists 022 62.9 06 17.1 04 11.4 03 08.6 035 100 Policy makers 023 69.7 08 24.2 01 03.0 01 03.0 033 100 Religious leaders 014 40.0 02 05.7 03 08.6 16 45.7 035 100 Scientists 016 45.7 06 17.1 04 11.4 09 25.7 035 100 Total 290 67.4 63 14.7 33 07.7 44 10.2 430 100
h. Read books on biotechnology Businessmen and traders 032 80.0 05 12.5 01 02.5 02 05.0 040 100 Consumers 060 55.6 17 15.7 25 23.1 06 05.6 108* 100 Extension workers 036 60.0 19 31.7 03 05.0 02 03.3 060* 100 Farmer leaders and community leaders 050 63.3 18 22.8 05 06.3 06 07.6 079* 100 Journalists 027 77.1 05 14.3 02 05.7 01 02.9 035 100 Policy makers 013 39.4 16 48.5 03 09.1 01 03.0 033 100 Religious leaders 015 42.9 03 08.6 06 17.1 11 31.4 035 100 Scientists 014 40.0 07 20.0 08 22.9 06 17.1 035 100 Total 247 58.1 90 21.2 53 12.5 35 08.2 425 100 i. Read newsletters/ pamphlets/ brochures on biotechnology Businessmen and traders 023 57.5 013 32.5 03 07.5 01 02.5 040 100 Consumers 064 58.7 023 21.1 14 12.8 08 07.3 109* 100 Extension workers 036 59.0 021 34.4 03 04.9 01 01.6 061 100 Farmer leaders and community leaders 048 59.3 021 25.9 05 06.2 07 08.6 081* 100 Journalists 022 62.9 008 22.9 04 11.4 01 02.9 035 100 Policy makers 016 50.0 011 34.4 02 06.3 03 09.4 032* 100 Religious leaders 013 37.1 003 08.6 08 22.9 11 31.4 035 100 Scientists 015 42.9 017 48.6 02 05.7 01 02.9 035 100 Total 237 55.4 117 27.3 41 09.6 33 07.7 428 100
*Some respondents gave no answer
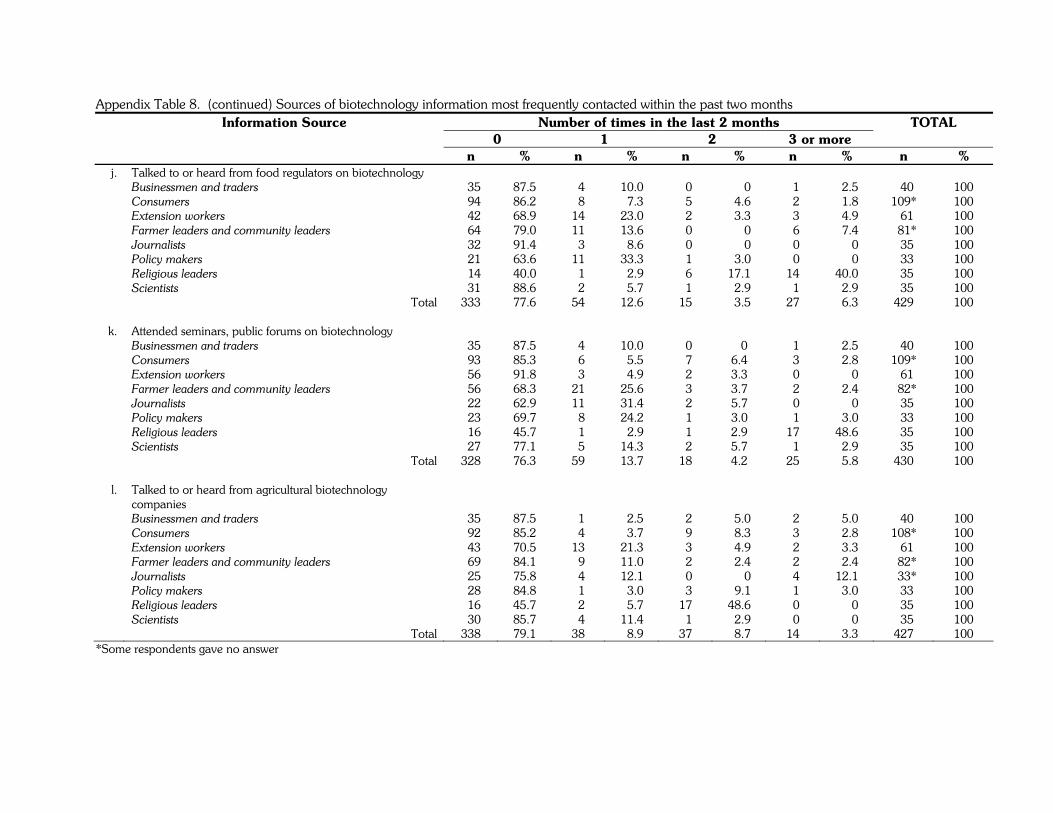
Appendix Table 8. (continued) Sources of biotechnology information most frequently contacted within the past two months Information Source Number of times in the last 2 months 0 1 2 3 or more
TOTAL
n % n % n % n % n % j. Talked to or heard from food regulators on biotechnology Businessmen and traders 035 87.5 04 10.0 00 00.0 01 02.5 040 100 Consumers 094 86.2 08 07.3 05 04.6 02 01.8 109* 100 Extension workers 042 68.9 14 23.0 02 03.3 03 04.9 061 100 Farmer leaders and community leaders 064 79.0 11 13.6 00 00.0 06 07.4 081* 100 Journalists 032 91.4 03 08.6 00 00.0 00 00.0 035 100 Policy makers 021 63.6 11 33.3 01 03.0 00 00.0 033 100 Religious leaders 014 40.0 01 02.9 06 17.1 14 40.0 035 100 Scientists 031 88.6 02 05.7 01 02.9 01 02.9 035 100 Total 333 77.6 54 12.6 15 03.5 27 06.3 429 100
k. Attended seminars, public forums on biotechnology Businessmen and traders 035 87.5 04 10.0 00 0.0 01 02.5 040 100 Consumers 093 85.3 06 05.5 07 6.4 03 02.8 109* 100 Extension workers 056 91.8 03 04.9 02 3.3 00 00.0 061 100 Farmer leaders and community leaders 056 68.3 21 25.6 03 3.7 02 02.4 082* 100 Journalists 022 62.9 11 31.4 02 5.7 00 00.0 035 100 Policy makers 023 69.7 08 24.2 01 3.0 01 03.0 033 100 Religious leaders 016 45.7 01 02.9 01 2.9 17 48.6 035 100 Scientists 027 77.1 05 14.3 02 5.7 01 02.9 035 100 Total 328 76.3 59 13.7 18 4.2 25 05.8 430 100
l. Talked to or heard from agricultural biotechnology companies
Businessmen and traders 035 87.5 01 02.5 02 05.0 02 05.0 040 100 Consumers 092 85.2 04 03.7 09 08.3 03 02.8 108* 100 Extension workers 043 70.5 13 21.3 03 04.9 02 03.3 061 100 Farmer leaders and community leaders 069 84.1 09 11.0 02 02.4 02 02.4 082* 100 Journalists 025 75.8 04 12.1 00 00.0 04 12.1 033* 100 Policy makers 028 84.8 01 03.0 03 09.1 01 03.0 033 100 Religious leaders 016 45.7 02 05.7 17 48.6 00 00.0 035 100 Scientists 030 85.7 04 11.4 01 02.9 00 00.0 035 100 Total 338 79.1 38 08.9 37 08.7 14 03.3 427 100
*Some respondents gave no answer
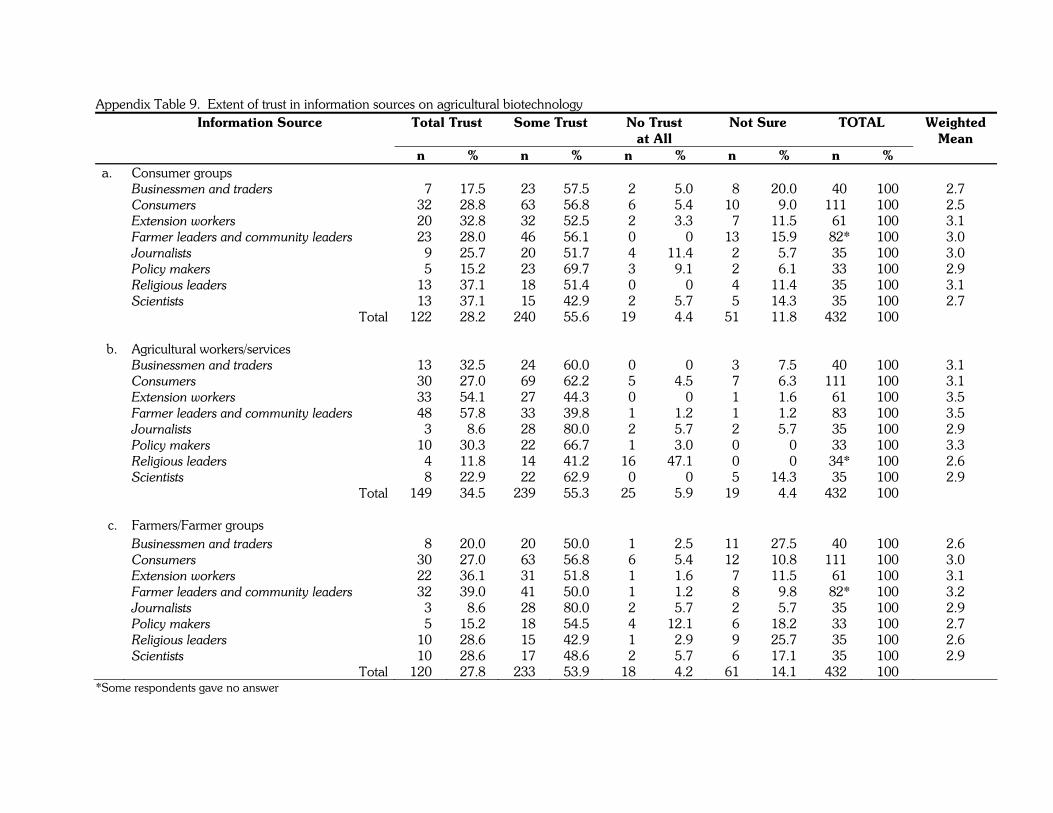
Appendix Table 9. Extent of trust in information sources on agricultural biotechnology Total Trust Some Trust No Trust
at All Not Sure TOTAL Weighted
Mean
Information Source
n % n % n % n % n % a. Consumer groups
Businessmen and traders 007 17.5 023 57.5 02 05.0 08 20.0 040 100 2.7 Consumers 032 28.8 063 56.8 06 05.4 10 09.0 111 100 2.5 Extension workers 020 32.8 032 52.5 02 03.3 07 11.5 061 100 3.1 Farmer leaders and community leaders 023 28.0 046 56.1 00 00.0 13 15.9 082* 100 3.0 Journalists 009 25.7 020 51.7 04 11.4 02 05.7 035 100 3.0 Policy makers 005 15.2 023 69.7 03 09.1 02 06.1 033 100 2.9 Religious leaders 013 37.1 018 51.4 00 00.0 04 11.4 035 100 3.1 Scientists 013 37.1 015 42.9 02 05.7 05 14.3 035 100 2.7 Total 122 28.2 240 55.6 19 04.4 51 11.8 432 100
b. Agricultural workers/services Businessmen and traders 013 32.5 024 60.0 00 00.0 03 07.5 040 100 3.1 Consumers 030 27.0 069 62.2 05 04.5 07 06.3 111 100 3.1 Extension workers 033 54.1 027 44.3 00 00.0 01 01.6 061 100 3.5 Farmer leaders and community leaders 048 57.8 033 39.8 01 01.2 01 01.2 083 100 3.5 Journalists 003 08.6 028 80.0 02 05.7 02 05.7 035 100 2.9 Policy makers 010 30.3 022 66.7 01 03.0 00 00.0 033 100 3.3 Religious leaders 004 11.8 014 41.2 16 47.1 00 00.0 034* 100 2.6 Scientists 008 22.9 022 62.9 00 00.0 05 14.3 035 100 2.9 Total 149 34.5 239 55.3 25 05.9 19 04.4 432 100
c. Farmers/Farmer groups Businessmen and traders 008 20.0 020 50.0 01 02.5 11 27.5 040 100 2.6 Consumers 030 27.0 063 56.8 06 05.4 12 10.8 111 100 3.0 Extension workers 022 36.1 031 51.8 01 01.6 07 11.5 061 100 3.1 Farmer leaders and community leaders 032 39.0 041 50.0 01 01.2 08 09.8 082* 100 3.2 Journalists 003 08.6 028 80.0 02 05.7 02 05.7 035 100 2.9 Policy makers 005 15.2 018 54.5 04 12.1 06 18.2 033 100 2.7 Religious leaders 010 28.6 015 42.9 01 02.9 09 25.7 035 100 2.6 Scientists 010 28.6 017 48.6 02 05.7 06 17.1 035 100 2.9 Total 120 27.8 233 53.9 18 04.2 61 14.1 432 100
*Some respondents gave no answer
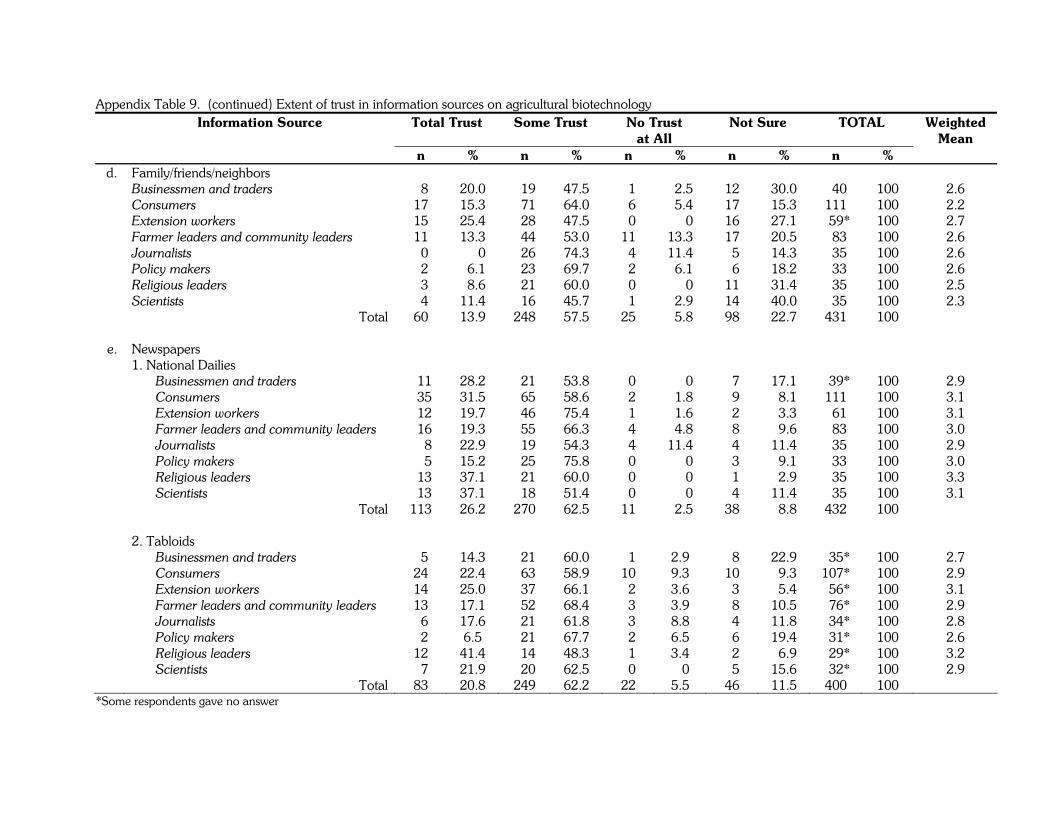
Appendix Table 9. (continued) Extent of trust in information sources on agricultural biotechnology Total Trust Some Trust No Trust
at All Not Sure TOTAL Weighted
Mean
Information Source
n % n % n % n % n % d. Family/friends/neighbors
Businessmen and traders 08 20.0 019 47.5 01 02.5 12 30.0 040 100 2.6 Consumers 17 15.3 071 64.0 06 05.4 17 15.3 111 100 2.2 Extension workers 15 25.4 028 47.5 00 00.0 16 27.1 059* 100 2.7 Farmer leaders and community leaders 11 13.3 044 53.0 11 13.3 17 20.5 083 100 2.6 Journalists 00 00.0 026 74.3 04 11.4 05 14.3 035 100 2.6 Policy makers 02 06.1 023 69.7 02 06.1 06 18.2 033 100 2.6 Religious leaders 03 08.6 021 60.0 00 00.0 11 31.4 035 100 2.5 Scientists 04 11.4 016 45.7 01 02.9 14 40.0 035 100 2.3 Total 60 13.9 248 57.5 25 05.8 98 22.7 431 100
e. Newspapers 1. National Dailies Businessmen and traders 011 28.2 021 53.8 00 00.0 07 17.1 039* 100 2.9 Consumers 035 31.5 065 58.6 02 01.8 09 08.1 111 100 3.1 Extension workers 012 19.7 046 75.4 01 01.6 02 03.3 061 100 3.1 Farmer leaders and community leaders 016 19.3 055 66.3 04 04.8 08 09.6 083 100 3.0 Journalists 008 22.9 019 54.3 04 11.4 04 11.4 035 100 2.9 Policy makers 005 15.2 025 75.8 00 00.0 03 09.1 033 100 3.0 Religious leaders 013 37.1 021 60.0 00 00.0 01 02.9 035 100 3.3 Scientists 013 37.1 018 51.4 00 00.0 04 11.4 035 100 3.1 Total 113 26.2 270 62.5 11 02.5 38 08.8 432 100 2. Tabloids Businessmen and traders 05 14.3 021 60.0 01 2.9 08 22.9 035* 100 2.7 Consumers 24 22.4 063 58.9 10 9.3 10 09.3 107* 100 2.9 Extension workers 14 25.0 037 66.1 02 3.6 03 05.4 056* 100 3.1 Farmer leaders and community leaders 13 17.1 052 68.4 03 3.9 08 10.5 076* 100 2.9 Journalists 06 17.6 021 61.8 03 8.8 04 11.8 034* 100 2.8 Policy makers 02 6.5 021 67.7 02 6.5 06 19.4 031* 100 2.6 Religious leaders 12 41.4 014 48.3 01 3.4 02 06.9 029* 100 3.2 Scientists 07 21.9 020 62.5 00 0.0 05 15.6 032* 100 2.9 Total 83 20.8 249 62.2 22 5.5 46 11.5 400 100
*Some respondents gave no answer
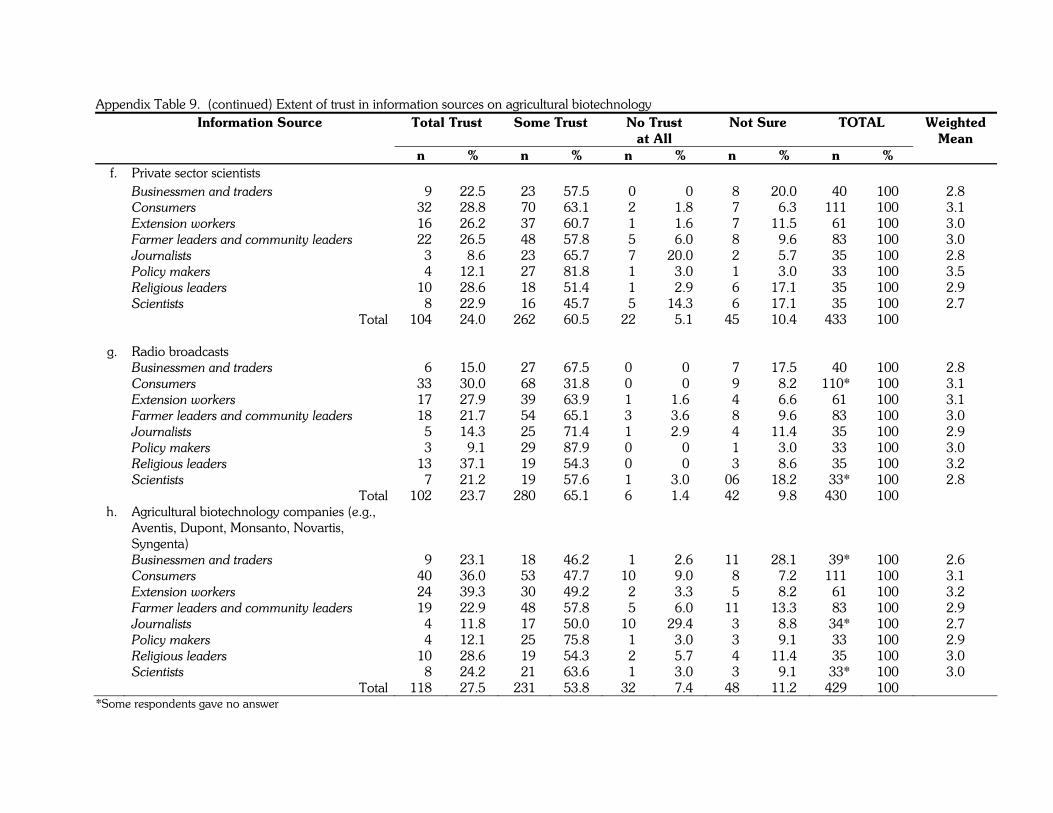
Appendix Table 9. (continued) Extent of trust in information sources on agricultural biotechnology
Total Trust Some Trust No Trust at All
Not Sure TOTAL Weighted Mean
Information Source
n % n % n % n % n % f. Private sector scientists
Businessmen and traders 009 22.5 023 57.5 00 00.0 08 20.0 040 100 2.8 Consumers 032 28.8 070 63.1 02 01.8 07 06.3 111 100 3.1 Extension workers 016 26.2 037 60.7 01 01.6 07 11.5 061 100 3.0 Farmer leaders and community leaders 022 26.5 048 57.8 05 06.0 08 09.6 083 100 3.0 Journalists 003 08.6 023 65.7 07 20.0 02 05.7 035 100 2.8 Policy makers 004 12.1 027 81.8 01 03.0 01 03.0 033 100 3.5 Religious leaders 010 28.6 018 51.4 01 02.9 06 17.1 035 100 2.9 Scientists 008 22.9 016 45.7 05 14.3 06 17.1 035 100 2.7 Total 104 24.0 262 60.5 22 05.1 45 10.4 433 100
g. Radio broadcasts Businessmen and traders 006 15.0 027 67.5 0 0.0 07 17.5 040 100 2.8 Consumers 033 30.0 068 31.8 0 0.0 09 08.2 110* 100 3.1 Extension workers 017 27.9 039 63.9 1 1.6 04 06.6 061 100 3.1 Farmer leaders and community leaders 018 21.7 054 65.1 3 3.6 08 09.6 083 100 3.0 Journalists 005 14.3 025 71.4 1 2.9 04 11.4 035 100 2.9 Policy makers 003 09.1 029 87.9 0 0.0 01 03.0 033 100 3.0 Religious leaders 013 37.1 019 54.3 0 0.0 03 08.6 035 100 3.2 Scientists 007 21.2 019 57.6 1 3.0 06 18.2 033* 100 2.8 Total 102 23.7 280 65.1 6 1.4 42 09.8 430 100
h. Agricultural biotechnology companies (e.g., Aventis, Dupont, Monsanto, Novartis, Syngenta)
Businessmen and traders 009 23.1 018 46.2 01 02.6 11 28.1 039* 100 2.6 Consumers 040 36.0 053 47.7 10 09.0 08 07.2 111 100 3.1 Extension workers 024 39.3 030 49.2 02 03.3 05 08.2 061 100 3.2 Farmer leaders and community leaders 019 22.9 048 57.8 05 06.0 11 13.3 083 100 2.9 Journalists 004 11.8 017 50.0 10 29.4 03 08.8 034* 100 2.7 Policy makers 004 12.1 025 75.8 01 03.0 03 09.1 033 100 2.9 Religious leaders 010 28.6 019 54.3 02 05.7 04 11.4 035 100 3.0 Scientists 008 24.2 021 63.6 01 03.0 03 09.1 033* 100 3.0 Total 118 27.5 231 53.8 32 07.4 48 11.2 429 100
*Some respondents gave no answer
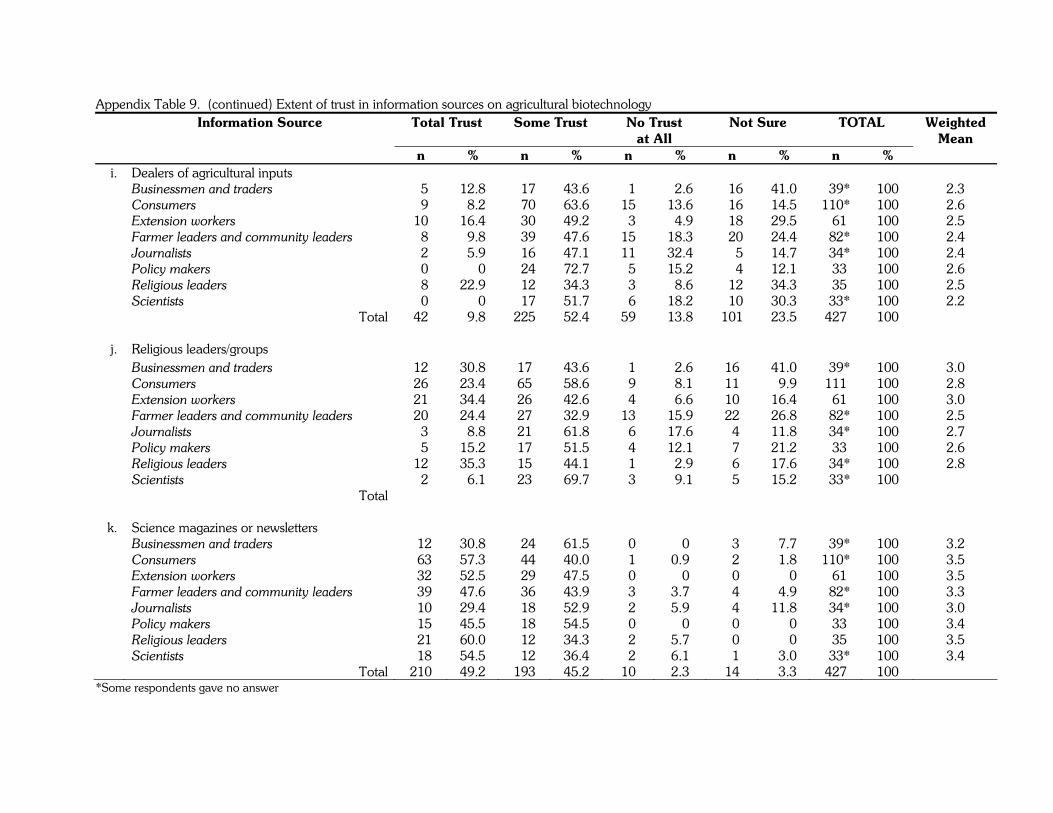
Appendix Table 9. (continued) Extent of trust in information sources on agricultural biotechnology Total Trust Some Trust No Trust
at All Not Sure TOTAL Weighted
Mean
Information Source
n % n % n % n % n % i. Dealers of agricultural inputs Businessmen and traders 05 12.8 017 43.6 01 02.6 016 41.0 039* 100 2.3 Consumers 09 08.2 070 63.6 15 13.6 016 14.5 110* 100 2.6 Extension workers 10 16.4 030 49.2 03 04.9 018 29.5 061 100 2.5 Farmer leaders and community leaders 08 09.8 039 47.6 15 18.3 020 24.4 082* 100 2.4 Journalists 02 05.9 016 47.1 11 32.4 005 14.7 034* 100 2.4 Policy makers 00 00.0 024 72.7 05 15.2 004 12.1 033 100 2.6 Religious leaders 08 22.9 012 34.3 03 08.6 012 34.3 035 100 2.5 Scientists 00 00.0 017 51.7 06 18.2 010 30.3 033* 100 2.2 Total 42 09.8 225 52.4 59 13.8 101 23.5 427 100
j. Religious leaders/groups Businessmen and traders 12 30.8 17 43.6 01 02.6 16 41.0 039* 100 3.0 Consumers 26 23.4 65 58.6 09 08.1 11 09.9 111 100 2.8 Extension workers 21 34.4 26 42.6 04 06.6 10 16.4 061 100 3.0 Farmer leaders and community leaders 20 24.4 27 32.9 13 15.9 22 26.8 082* 100 2.5 Journalists 03 08.8 21 61.8 06 17.6 04 11.8 034* 100 2.7 Policy makers 05 15.2 17 51.5 04 12.1 07 21.2 033 100 2.6 Religious leaders 12 35.3 15 44.1 01 02.9 06 17.6 034* 100 2.8 Scientists 02 06.1 23 69.7 03 09.1 05 15.2 033* 100 Total
k. Science magazines or newsletters Businessmen and traders 012 30.8 024 61.5 00 0.0 03 07.7 039* 100 3.2 Consumers 063 57.3 044 40.0 01 0.9 02 01.8 110* 100 3.5 Extension workers 032 52.5 029 47.5 00 0.0 00 00.0 061 100 3.5 Farmer leaders and community leaders 039 47.6 036 43.9 03 3.7 04 04.9 082* 100 3.3 Journalists 010 29.4 018 52.9 02 5.9 04 11.8 034* 100 3.0 Policy makers 015 45.5 018 54.5 00 0.0 00 00.0 033 100 3.4 Religious leaders 021 60.0 012 34.3 02 5.7 00 00.0 035 100 3.5 Scientists 018 54.5 012 36.4 02 6.1 01 03.0 033* 100 3.4 Total 210 49.2 193 45.2 10 2.3 14 03.3 427 100
*Some respondents gave no answer
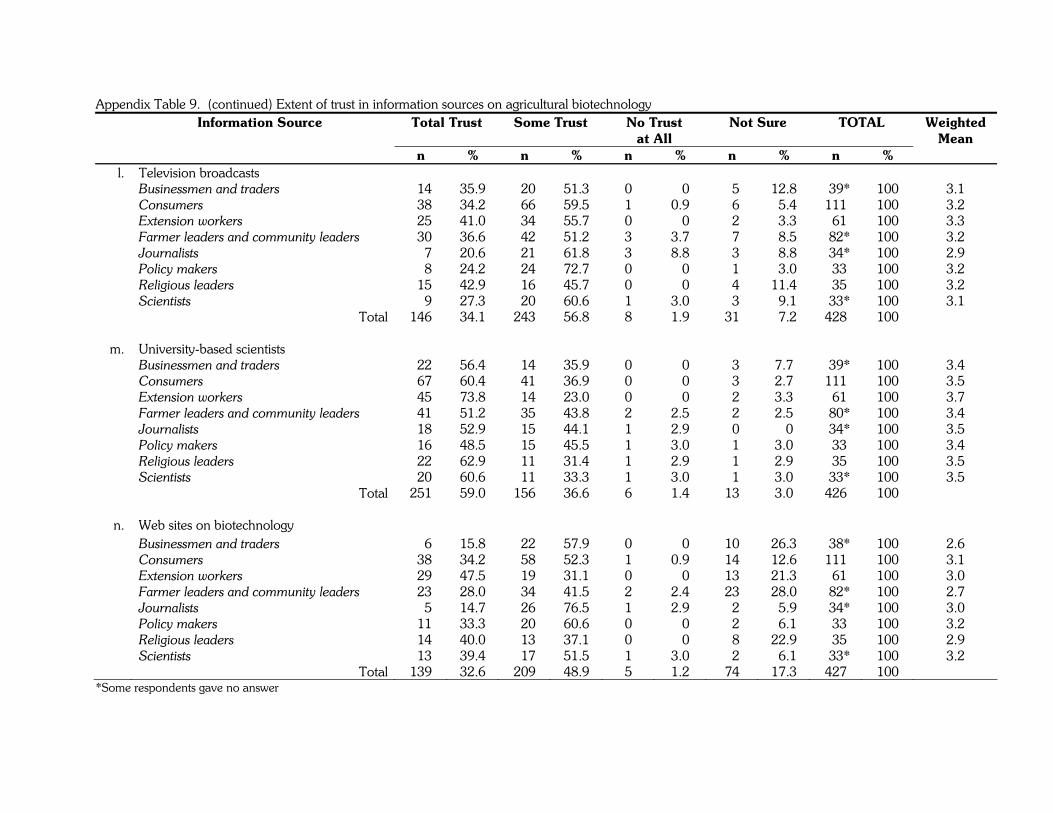
Appendix Table 9. (continued) Extent of trust in information sources on agricultural biotechnology Total Trust Some Trust No Trust
at All Not Sure TOTAL Weighted
Mean
Information Source
n % n % n % n % n % l. Television broadcasts Businessmen and traders 014 35.9 020 51.3 0 0.0 05 12.8 039* 100 3.1 Consumers 038 34.2 066 59.5 1 0.9 06 05.4 111 100 3.2 Extension workers 025 41.0 034 55.7 0 0.0 02 03.3 061 100 3.3 Farmer leaders and community leaders 030 36.6 042 51.2 3 3.7 07 08.5 082* 100 3.2 Journalists 007 20.6 021 61.8 3 8.8 03 08.8 034* 100 2.9 Policy makers 008 24.2 024 72.7 0 0.0 01 03.0 033 100 3.2 Religious leaders 015 42.9 016 45.7 0 0.0 04 11.4 035 100 3.2 Scientists 009 27.3 020 60.6 1 3.0 03 09.1 033* 100 3.1 Total 146 34.1 243 56.8 8 1.9 31 07.2 428 100
m. University-based scientists Businessmen and traders 022 56.4 014 35.9 0 0.0 03 7.7 039* 100 3.4 Consumers 067 60.4 041 36.9 0 0.0 03 2.7 111 100 3.5 Extension workers 045 73.8 014 23.0 0 0.0 02 3.3 061 100 3.7 Farmer leaders and community leaders 041 51.2 035 43.8 2 2.5 02 2.5 080* 100 3.4 Journalists 018 52.9 015 44.1 1 2.9 00 0.0 034* 100 3.5 Policy makers 016 48.5 015 45.5 1 3.0 01 3.0 033 100 3.4 Religious leaders 022 62.9 011 31.4 1 2.9 01 2.9 035 100 3.5 Scientists 020 60.6 011 33.3 1 3.0 01 3.0 033* 100 3.5 Total 251 59.0 156 36.6 6 1.4 13 3.0 426 100
n. Web sites on biotechnology Businessmen and traders 006 15.8 022 57.9 0 0.0 10 26.3 038* 100 2.6 Consumers 038 34.2 058 52.3 1 0.9 14 12.6 111 100 3.1 Extension workers 029 47.5 019 31.1 0 0.0 13 21.3 061 100 3.0 Farmer leaders and community leaders 023 28.0 034 41.5 2 2.4 23 28.0 082* 100 2.7 Journalists 005 14.7 026 76.5 1 2.9 02 05.9 034* 100 3.0 Policy makers 011 33.3 020 60.6 0 0.0 02 06.1 033 100 3.2 Religious leaders 014 40.0 013 37.1 0 0.0 08 22.9 035 100 2.9 Scientists 013 39.4 017 51.5 1 3.0 02 06.1 033* 100 3.2 Total 139 32.6 209 48.9 5 1.2 74 17.3 427 100
*Some respondents gave no answer
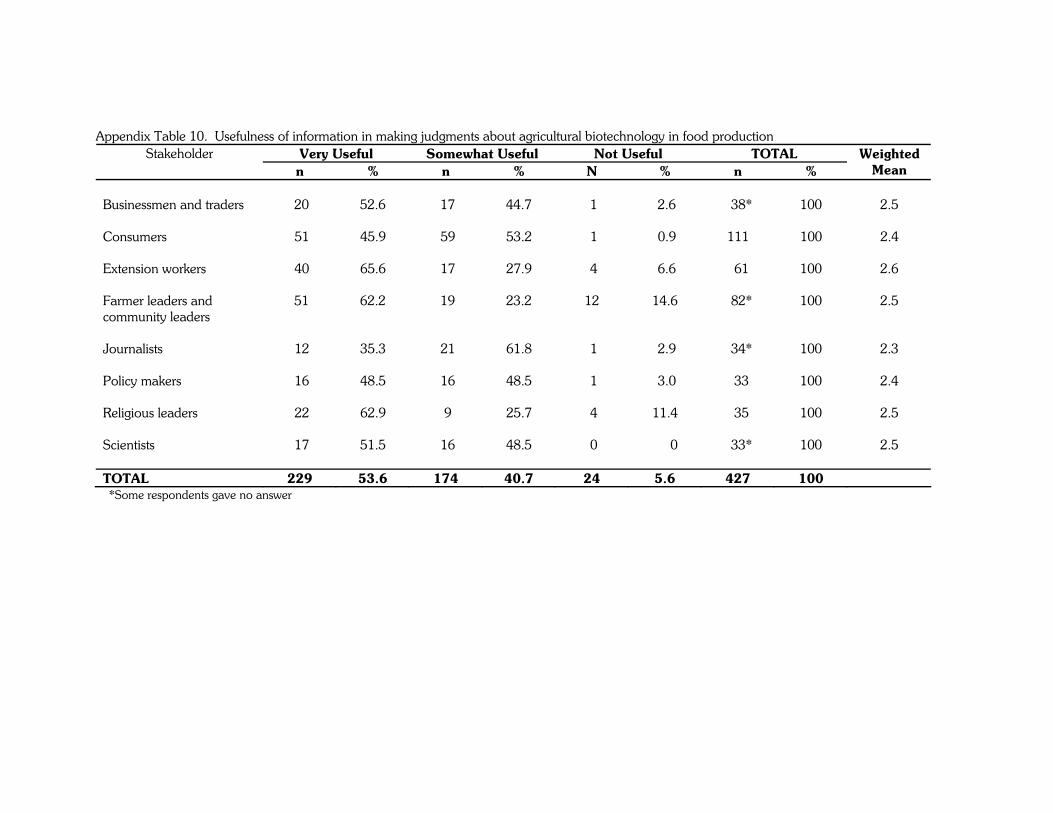
Appendix Table 10. Usefulness of information in making judgments about agricultural biotechnology in food production
Very Useful Somewhat Useful Not Useful TOTAL Stakeholder n % n % N % n %
Weighted Mean
Businessmen and traders 20 52.6 17 44.7 1 2.6 038* 100 2.5 Consumers 51 45.9 59 53.2 1 0.9 111 100 2.4 Extension workers 40 65.6 17 27.9 4 6.6 061 100 2.6 Farmer leaders and community leaders
51 62.2 19 23.2 12 14.6 082* 100 2.5
Journalists 12 35.3 21 61.8 1 2.9 034* 100 2.3 Policy makers 16 48.5 16 48.5 1 3.0 033 100 2.4 Religious leaders 22 62.9 9 25.7 4 11.4 035 100 2.5 Scientists 17 51.5 16 48.5 0 00.0 033* 100 2.5 TOTAL 229 53.6 174 40.7 24 5.6 427 100
*Some respondents gave no answer
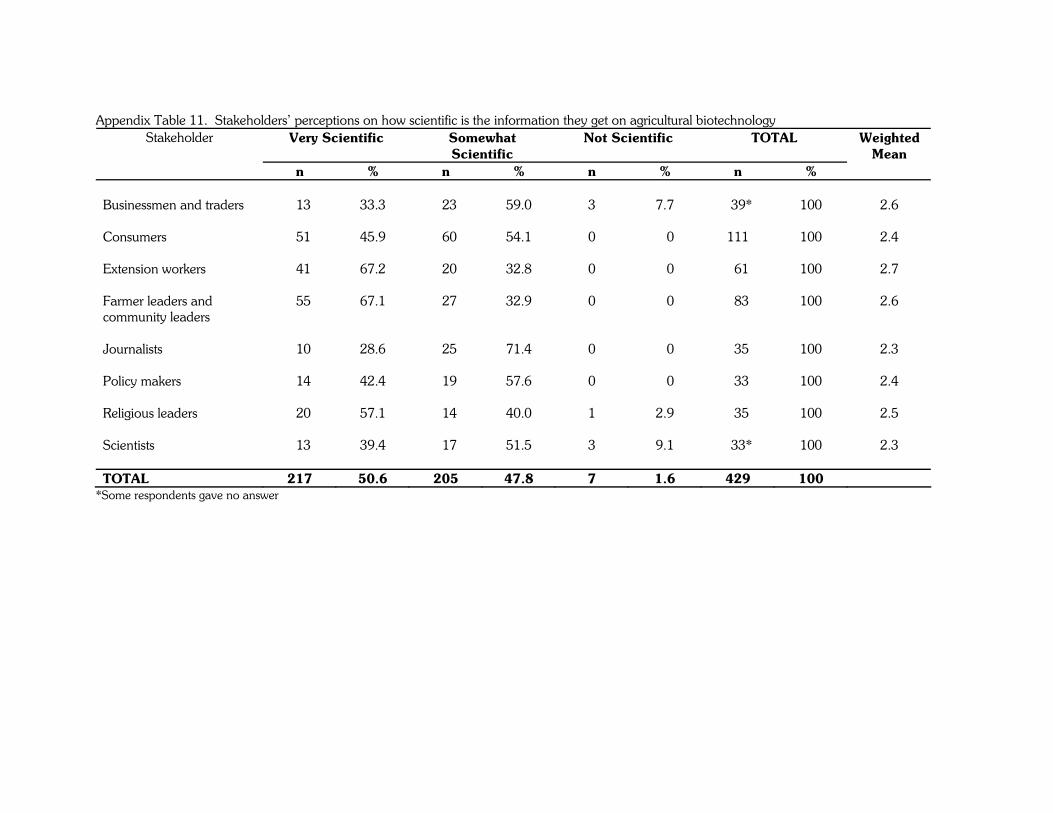
Appendix Table 11. Stakeholders’ perceptions on how scientific is the information they get on agricultural biotechnology
Very Scientific Somewhat Scientific
Not Scientific TOTAL Stakeholder
n % n % n % n %
Weighted Mean
Businessmen and traders 013 33.3 023 59.0 3 7.7 039* 100 2.6 Consumers 051 45.9 060 54.1 0 0.0 111 100 2.4 Extension workers 041 67.2 020 32.8 0 0.0 061 100 2.7 Farmer leaders and community leaders
055 67.1 027 32.9 0 0.0 083 100 2.6
Journalists 010 28.6 025 71.4 0 0.0 035 100 2.3 Policy makers 014 42.4 019 57.6 0 0.0 033 100 2.4 Religious leaders 020 57.1 014 40.0 1 2.9 035 100 2.5 Scientists 013 39.4 017 51.5 3 9.1 033* 100 2.3 TOTAL 217 50.6 205 47.8 7 1.6 429 100
*Some respondents gave no answer
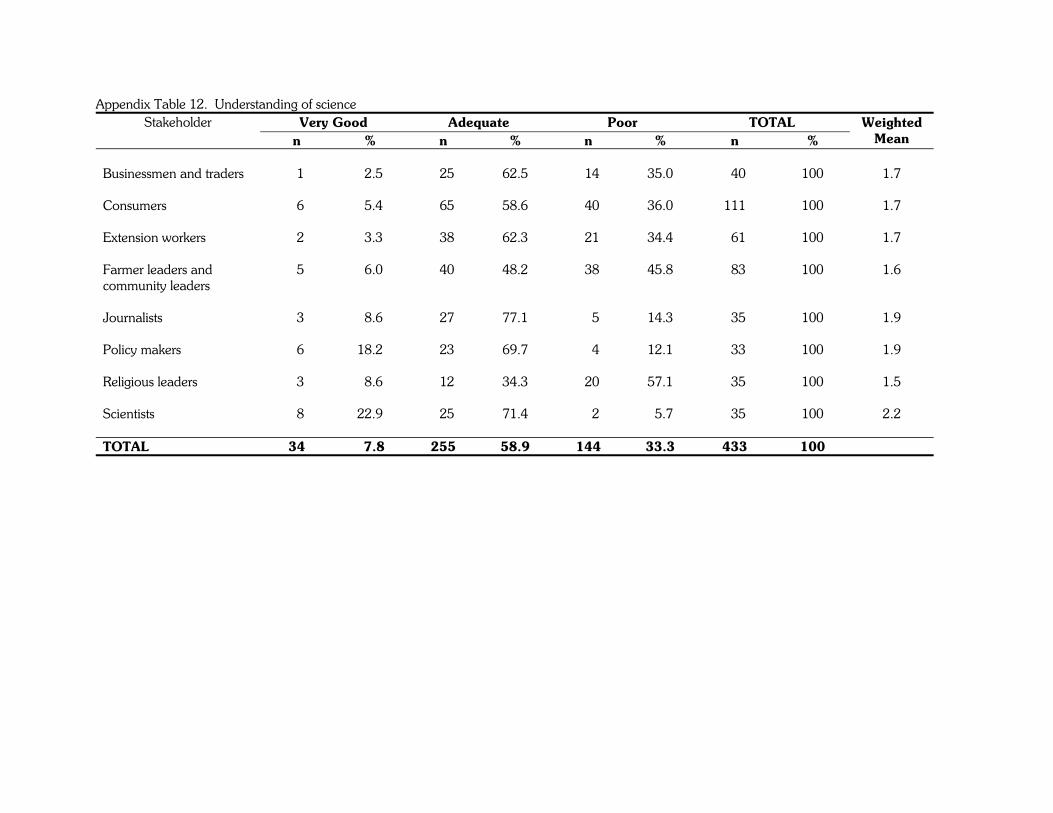
Appendix Table 12. Understanding of science Very Good Adequate Poor TOTAL Stakeholder
n % n % n % n % Weighted
Mean Businessmen and traders 01 02.5 025 62.5 014 35.0 040 100 1.7 Consumers 06 05.4 065 58.6 040 36.0 111 100 1.7 Extension workers 02 03.3 038 62.3 021 34.4 061 100 1.7 Farmer leaders and community leaders
05 06.0 040 48.2 038 45.8 083 100 1.6
Journalists 03 08.6 027 77.1 005 14.3 035 100 1.9 Policy makers 06 18.2 023 69.7 004 12.1 033 100 1.9 Religious leaders 03 08.6 012 34.3 020 57.1 035 100 1.5 Scientists 08 22.9 025 71.4 002 05.7 035 100 2.2 TOTAL 34 07.8 255 58.9 144 33.3 433 100
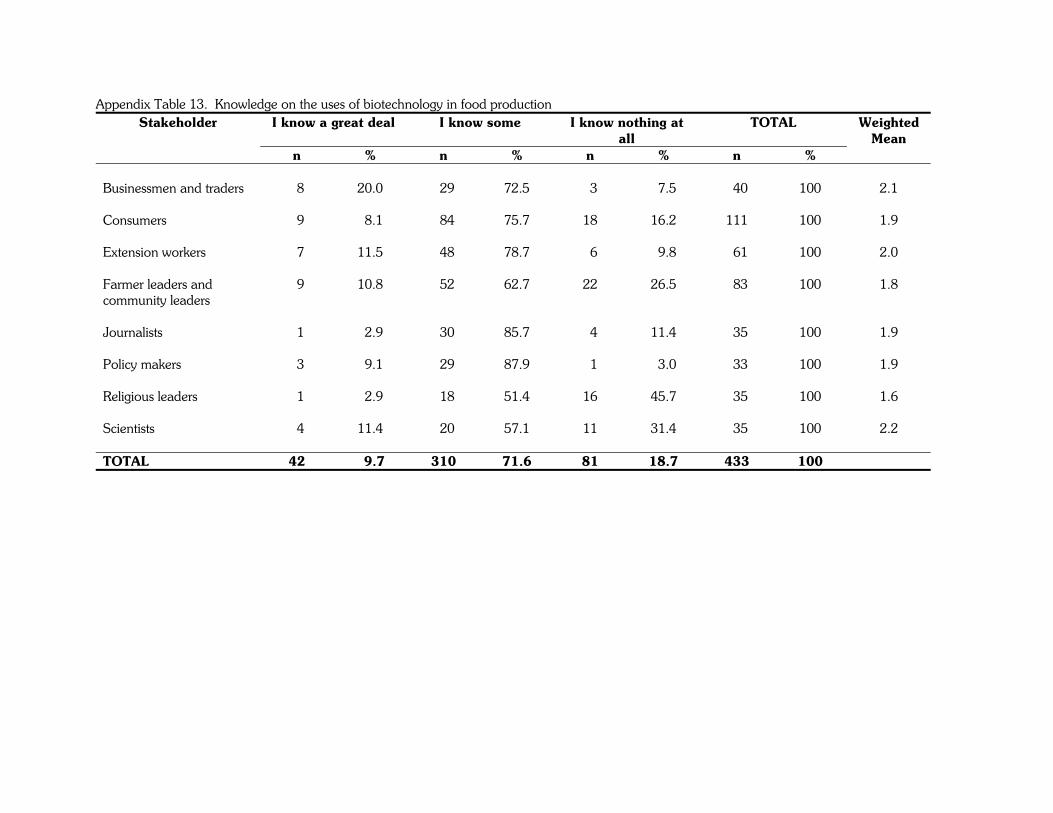
Appendix Table 13. Knowledge on the uses of biotechnology in food production I know a great deal I know some I know nothing at
all TOTAL Stakeholder
n % n % n % n %
Weighted Mean
Businessmen and traders 08 20.0 029 72.5 03 07.5 040 100 2.1 Consumers 09 08.1 084 75.7 18 16.2 111 100 1.9 Extension workers 07 11.5 048 78.7 06 09.8 061 100 2.0 Farmer leaders and community leaders
09 10.8 052 62.7 22 26.5 083 100 1.8
Journalists 01 02.9 030 85.7 04 11.4 035 100 1.9 Policy makers 03 09.1 029 87.9 01 03.0 033 100 1.9 Religious leaders 01 02.9 018 51.4 16 45.7 035 100 1.6 Scientists 04 11.4 020 57.1 11 31.4 035 100 2.2 TOTAL 42 09.7 310 71.6 81 18.7 433 100
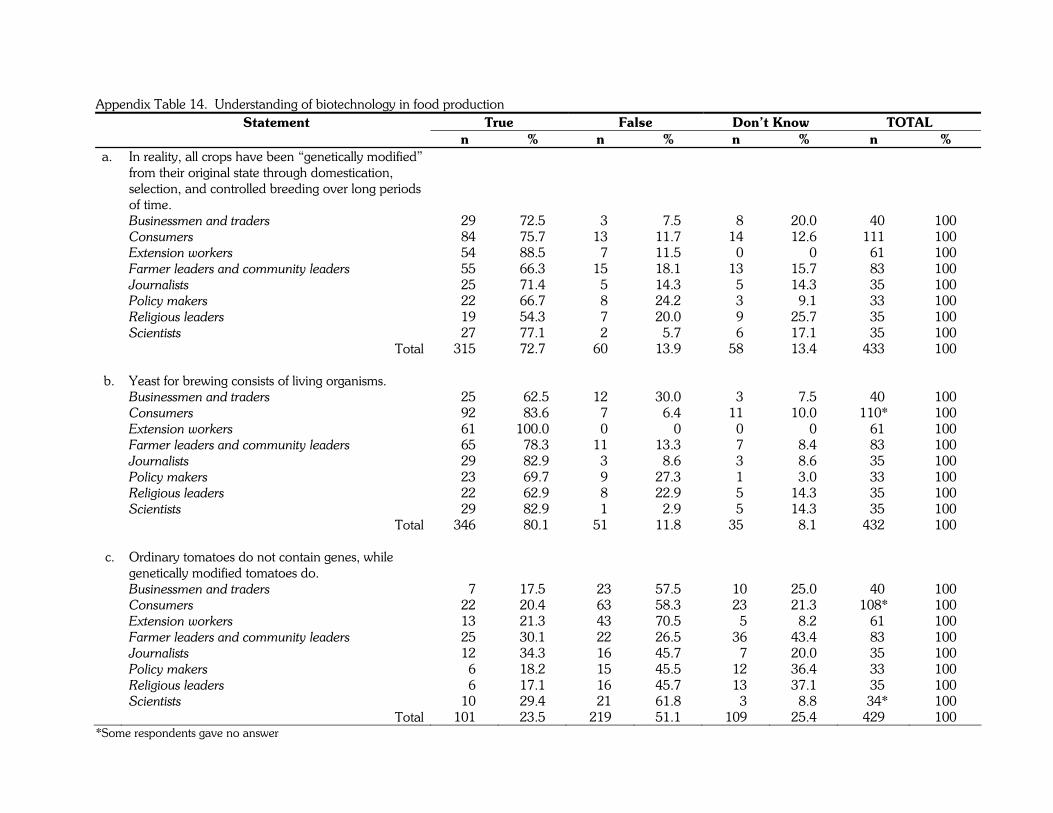
Appendix Table 14. Understanding of biotechnology in food production True False Don’t Know TOTAL
Statement n % n % n % n %
a. In reality, all crops have been “genetically modified” from their original state through domestication, selection, and controlled breeding over long periods of time.
Businessmen and traders 029 72.5 03 07.5 08 20.0 040 100 Consumers 084 75.7 13 11.7 14 12.6 111 100 Extension workers 054 88.5 07 11.5 00 00.0 061 100 Farmer leaders and community leaders 055 66.3 15 18.1 13 15.7 083 100 Journalists 025 71.4 05 14.3 05 14.3 035 100 Policy makers 022 66.7 08 24.2 03 09.1 033 100 Religious leaders 019 54.3 07 20.0 09 25.7 035 100 Scientists 027 77.1 02 05.7 06 17.1 035 100 Total 315 72.7 60 13.9 58 13.4 433 100
b. Yeast for brewing consists of living organisms. Businessmen and traders 025 062.5 12 30.0 03 07.5 040 100 Consumers 092 083.6 07 06.4 11 10.0 110* 100 Extension workers 061 100.0 00 00.0 00 00.0 061 100 Farmer leaders and community leaders 065 078.3 11 13.3 07 08.4 083 100 Journalists 029 082.9 03 08.6 03 08.6 035 100 Policy makers 023 069.7 09 27.3 01 03.0 033 100 Religious leaders 022 062.9 08 22.9 05 14.3 035 100 Scientists 029 082.9 01 02.9 05 14.3 035 100 Total 346 080.1 51 11.8 35 08.1 432 100
c. Ordinary tomatoes do not contain genes, while genetically modified tomatoes do.
Businessmen and traders 007 17.5 023 57.5 010 25.0 040 100 Consumers 022 20.4 063 58.3 023 21.3 108* 100 Extension workers 013 21.3 043 70.5 005 08.2 061 100 Farmer leaders and community leaders 025 30.1 022 26.5 036 43.4 083 100 Journalists 012 34.3 016 45.7 007 20.0 035 100 Policy makers 006 18.2 015 45.5 012 36.4 033 100 Religious leaders 006 17.1 016 45.7 013 37.1 035 100 Scientists 010 29.4 021 61.8 003 08.8 034* 100
Total 101 23.5 219 51.1 109 25.4 429 100 *Some respondents gave no answer
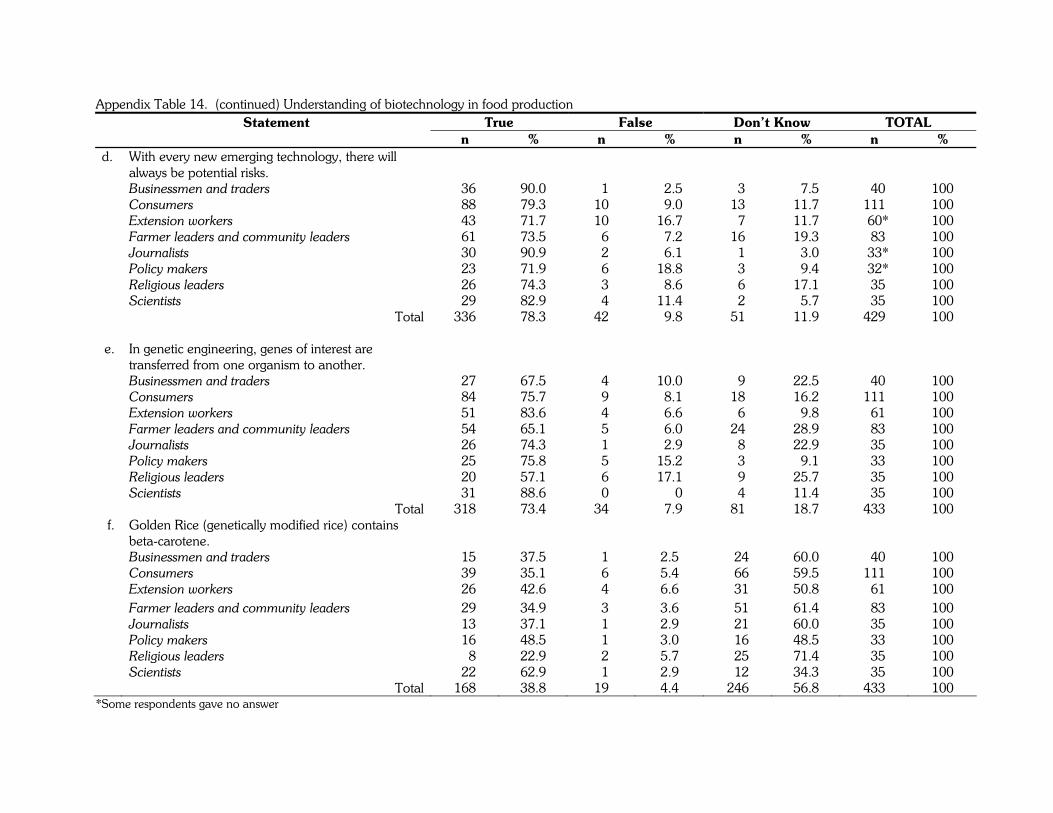
Appendix Table 14. (continued) Understanding of biotechnology in food production True False Don’t Know TOTAL
Statement n % n % n % n %
d. With every new emerging technology, there will always be potential risks.
Businessmen and traders 036 90.0 01 02.5 03 07.5 040 100 Consumers 088 79.3 10 09.0 13 11.7 111 100 Extension workers 043 71.7 10 16.7 07 11.7 060* 100 Farmer leaders and community leaders 061 73.5 06 07.2 16 19.3 083 100 Journalists 030 90.9 02 06.1 01 03.0 033* 100 Policy makers 023 71.9 06 18.8 03 09.4 032* 100 Religious leaders 026 74.3 03 08.6 06 17.1 035 100 Scientists 029 82.9 04 11.4 02 05.7 035 100 Total 336 78.3 42 09.8 51 11.9 429 100
e. In genetic engineering, genes of interest are transferred from one organism to another.
Businessmen and traders 027 67.5 04 10.0 09 22.5 040 100 Consumers 084 75.7 09 08.1 18 16.2 111 100 Extension workers 051 83.6 04 06.6 06 09.8 061 100 Farmer leaders and community leaders 054 65.1 05 06.0 24 28.9 083 100 Journalists 026 74.3 01 02.9 08 22.9 035 100 Policy makers 025 75.8 05 15.2 03 09.1 033 100 Religious leaders 020 57.1 06 17.1 09 25.7 035 100 Scientists 031 88.6 00 00.0 04 11.4 035 100 Total 318 73.4 34 07.9 81 18.7 433 100
f. Golden Rice (genetically modified rice) contains beta-carotene.
Businessmen and traders 015 37.5 01 2.5 024 60.0 040 100 Consumers 039 35.1 06 5.4 066 59.5 111 100 Extension workers 026 42.6 04 6.6 031 50.8 061 100 Farmer leaders and community leaders 029 34.9 03 3.6 051 61.4 083 100 Journalists 013 37.1 01 2.9 021 60.0 035 100 Policy makers 016 48.5 01 3.0 016 48.5 033 100 Religious leaders 008 22.9 02 5.7 025 71.4 035 100 Scientists 022 62.9 01 2.9 012 34.3 035 100
Total 168 38.8 19 4.4 246 56.8 433 100 *Some respondents gave no answer
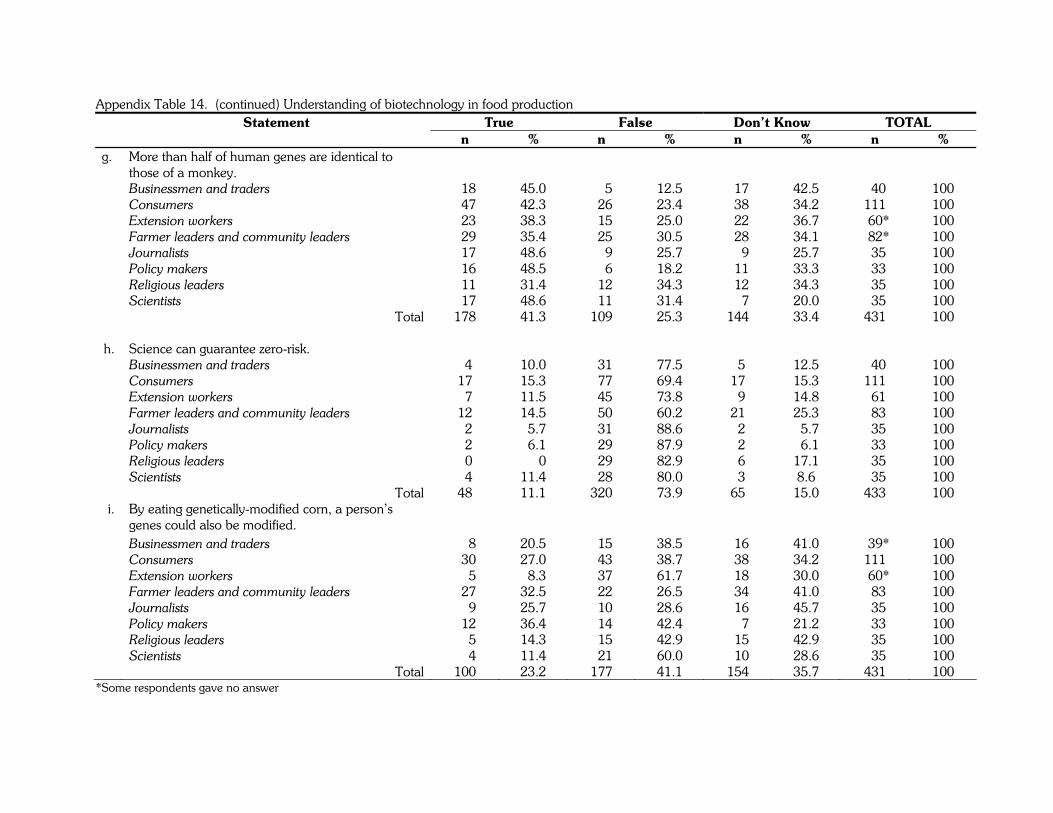
Appendix Table 14. (continued) Understanding of biotechnology in food production True False Don’t Know TOTAL
Statement n % n % n % n %
g. More than half of human genes are identical to those of a monkey.
Businessmen and traders 018 45.0 005 12.5 017 42.5 040 100 Consumers 047 42.3 026 23.4 038 34.2 111 100 Extension workers 023 38.3 015 25.0 022 36.7 060* 100 Farmer leaders and community leaders 029 35.4 025 30.5 028 34.1 082* 100 Journalists 017 48.6 009 25.7 009 25.7 035 100 Policy makers 016 48.5 006 18.2 011 33.3 033 100 Religious leaders 011 31.4 012 34.3 012 34.3 035 100 Scientists 017 48.6 011 31.4 007 20.0 035 100 Total 178 41.3 109 25.3 144 33.4 431 100
h. Science can guarantee zero-risk. Businessmen and traders 04 10.0 031 77.5 05 12.5 040 100 Consumers 17 15.3 077 69.4 17 15.3 111 100 Extension workers 07 11.5 045 73.8 09 14.8 061 100 Farmer leaders and community leaders 12 14.5 050 60.2 21 25.3 083 100 Journalists 02 05.7 031 88.6 02 05.7 035 100 Policy makers 02 06.1 029 87.9 02 06.1 033 100 Religious leaders 00 00.0 029 82.9 06 17.1 035 100 Scientists 04 11.4 028 80.0 03 8.6 035 100 Total 48 11.1 320 73.9 65 15.0 433 100
i. By eating genetically-modified corn, a person’s genes could also be modified.
Businessmen and traders 008 20.5 015 38.5 016 41.0 039* 100 Consumers 030 27.0 043 38.7 038 34.2 111 100 Extension workers 005 08.3 037 61.7 018 30.0 060* 100 Farmer leaders and community leaders 027 32.5 022 26.5 034 41.0 083 100 Journalists 009 25.7 010 28.6 016 45.7 035 100 Policy makers 012 36.4 014 42.4 007 21.2 033 100 Religious leaders 005 14.3 015 42.9 015 42.9 035 100 Scientists 004 11.4 021 60.0 010 28.6 035 100 Total 100 23.2 177 41.1 154 35.7 431 100
*Some respondents gave no answer

Appendix Table 14. (continued) Understanding of biotechnology in food production True False Don’t Know TOTAL
Statement n % n % n % n %
j. Products from genetically modified crops are now being sold in the Indonesia.
Businessmen and traders 030 75.0 01 02.5 009 22.5 040 100 Consumers 077 69.4 07 06.3 027 24.3 111 100 Extension workers 037 61.7 03 05.0 020 33.3 060* 100 Farmer leaders and community leaders 049 59.0 03 03.6 031 37.3 083 100 Journalists 026 76.5 04 11.8 004 11.8 034* 100 Policy makers 024 72.7 02 06.1 007 21.2 033 100 Religious leaders 020 58.8 02 05.9 012 35.3 034* 100 Scientists 025 71.4 04 11.4 006 17.1 035 100 Total 288 67.0 26 06.0 116 27.0 430 100
k. Genetically modified crops are now being commercially grown in the Indonesia.
Businessmen and traders 027 67.5 02 05.0 011 27.5 040 100 Consumers 071 64.0 09 08.1 031 27.9 111 100 Extension workers 039 63.9 06 09.8 016 26.2 061 100 Farmer leaders and community leaders 056 67.5 01 01.2 026 31.3 083 100 Journalists 025 75.4 01 02.9 009 25.7 035 100 Policy makers 027 81.8 01 03.0 005 15.2 033 100 Religious leaders 011 31.4 03 08.6 021 60.0 035 100 Scientists 026 74.3 04 11.4 005 14.3 035 100 Total 282 65.1 27 06.2 124 28.7 433 100
l. Plant viruses infect vegetables and fruits. Businessmen and traders 035 87.5 03 07.5 02 05.0 040 100 Consumers 074 66.7 14 12.6 23 20.7 111 100 Extension workers 051 83.6 07 11.5 03 04.9 061 100 Farmer leaders and community leaders 066 79.5 03 03.6 14 16.9 083 100 Journalists 023 67.6 05 14.7 06 17.6 034* 100 Policy makers 029 87.9 02 06.1 02 06.1 033 100 Religious leaders 010 28.6 13 37.1 12 34.3 035 100 Scientists 006 17.1 21 60.0 08 22.9 035 100 Total 294 68.1 68 15.7 70 16.2 432 100
*Some respondents gave no answer
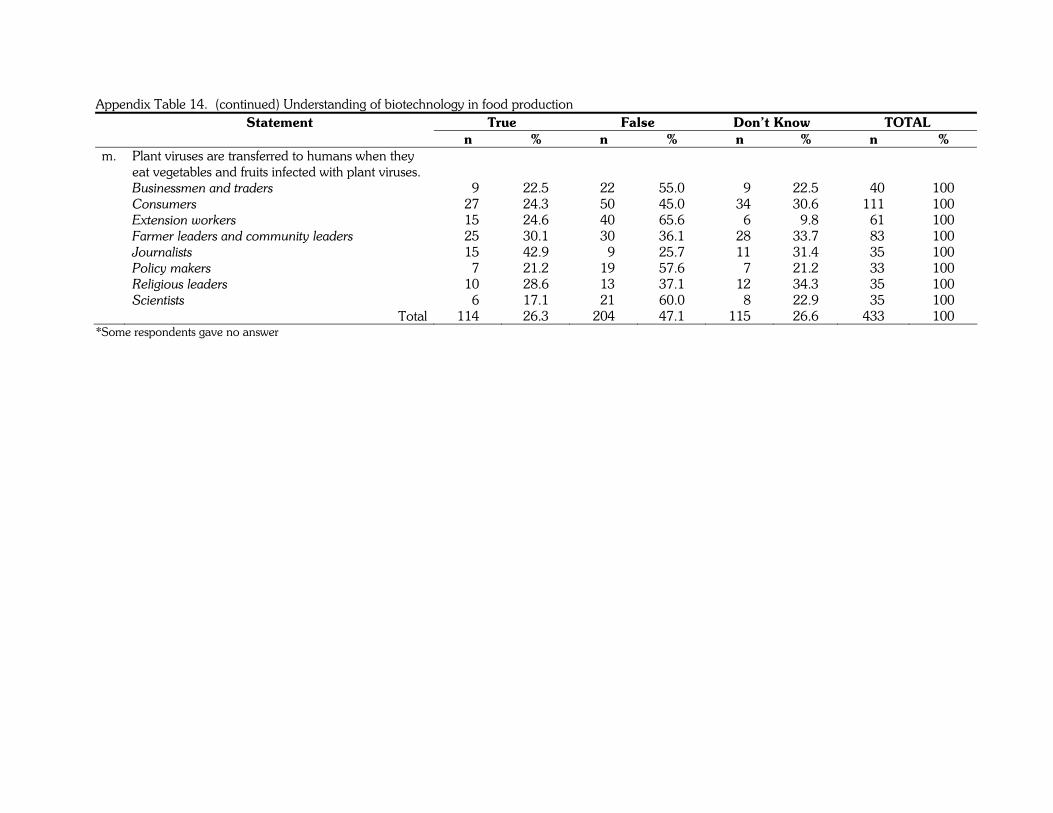
Appendix Table 14. (continued) Understanding of biotechnology in food production
True False Don’t Know TOTAL
Statement n % n % n % n %
m. Plant viruses are transferred to humans when they eat vegetables and fruits infected with plant viruses.
Businessmen and traders 009 22.5 022 55.0 009 22.5 040 100 Consumers 027 24.3 050 45.0 034 30.6 111 100 Extension workers 015 24.6 040 65.6 006 09.8 061 100 Farmer leaders and community leaders 025 30.1 030 36.1 028 33.7 083 100 Journalists 015 42.9 009 25.7 011 31.4 035 100 Policy makers 007 21.2 019 57.6 007 21.2 033 100 Religious leaders 010 28.6 013 37.1 012 34.3 035 100 Scientists 006 17.1 021 60.0 008 22.9 035 100
Total 114 26.3 204 47.1 115 26.6 433 100 *Some respondents gave no answer
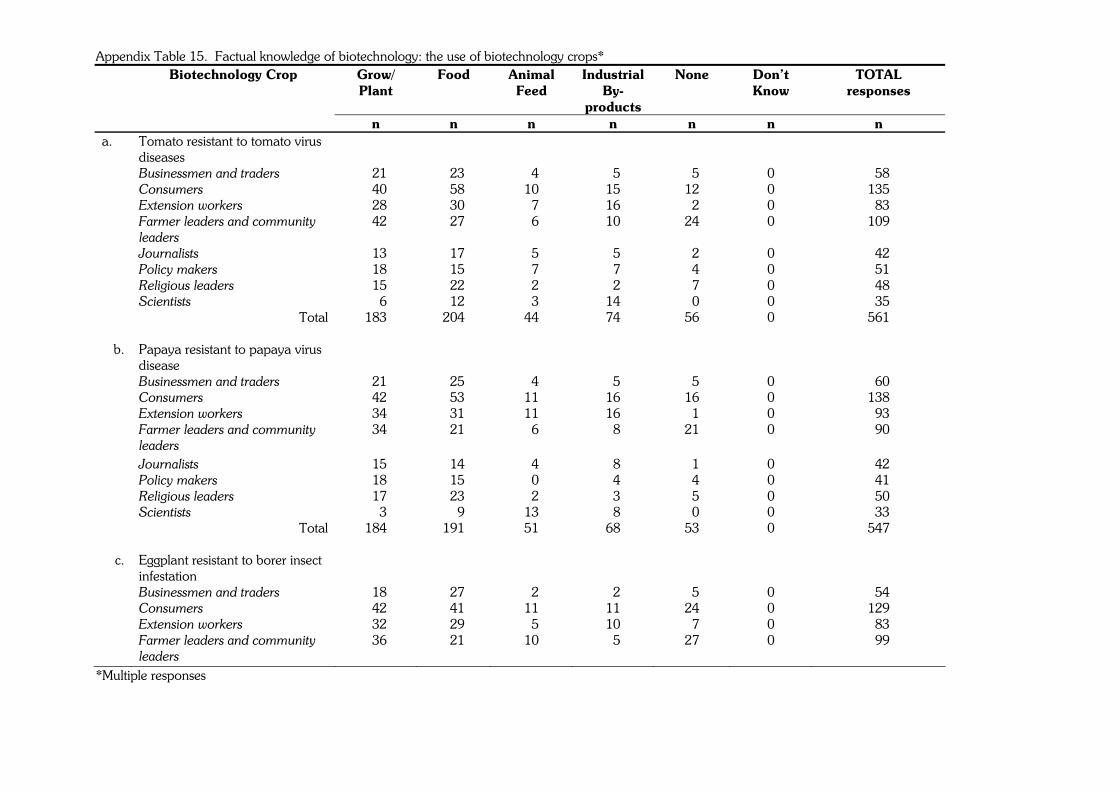
Appendix Table 15. Factual knowledge of biotechnology: the use of biotechnology crops* Biotechnology Crop Grow/
Plant Food Animal
Feed Industrial
By-products
None Don’t Know
TOTAL responses
n n n n n n n a. Tomato resistant to tomato virus
diseases
Businessmen and traders 021 023 04 05 05 0 058 Consumers 040 058 10 15 12 0 135 Extension workers 028 030 07 16 02 0 083 Farmer leaders and community
leaders 042 027 06 10 24 0 109
Journalists 013 017 05 05 02 0 042 Policy makers 018 015 07 07 04 0 051 Religious leaders 015 022 02 02 07 0 048 Scientists 006 012 03 14 00 0 035 Total 183 204 44 74 56 0 561
b. Papaya resistant to papaya virus disease
Businessmen and traders 021 025 04 05 05 0 060 Consumers 042 053 11 16 16 0 138 Extension workers 034 031 11 16 01 0 093 Farmer leaders and community
leaders 034 021 06 08 21 0 090
Journalists 015 014 04 08 01 0 042 Policy makers 018 015 00 04 04 0 041 Religious leaders 017 023 02 03 05 0 050 Scientists 003 009 13 08 00 0 033 Total 184 191 51 68 53 0 547
c. Eggplant resistant to borer insect infestation
Businessmen and traders 018 027 02 02 05 0 054 Consumers 042 041 11 11 24 0 129 Extension workers 032 029 05 10 07 0 083 Farmer leaders and community
leaders 036 021 10 05 27 0 099
*Multiple responses
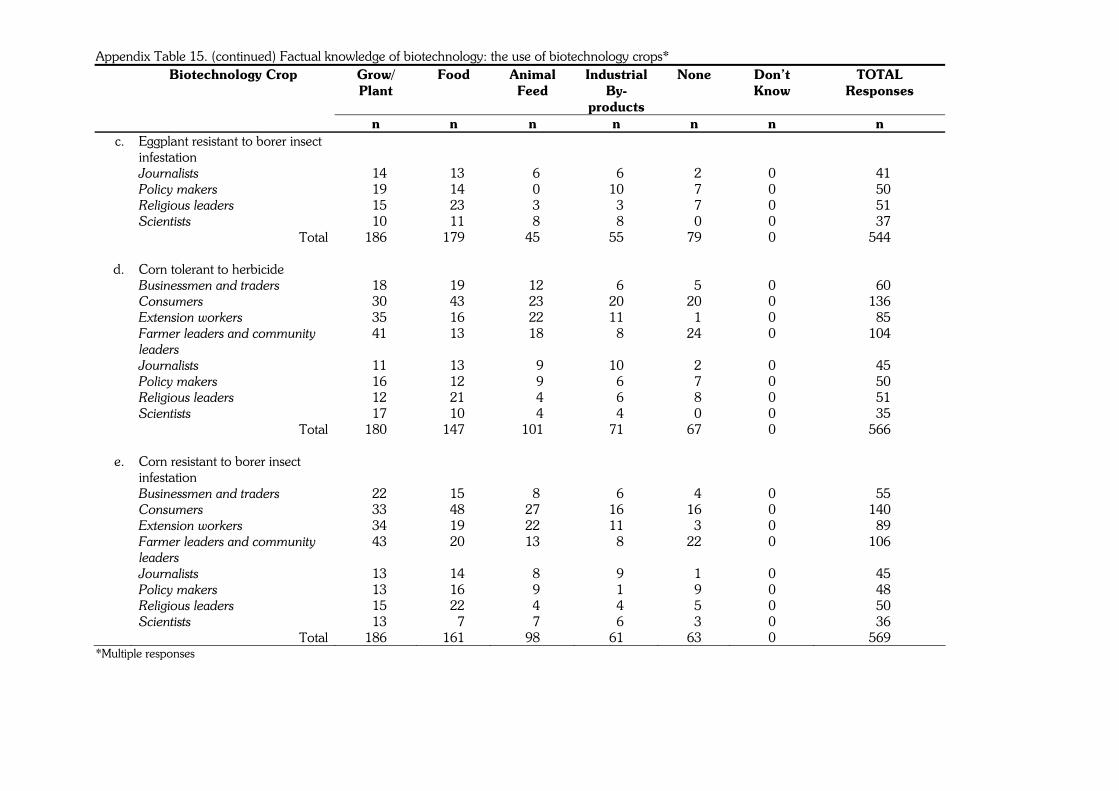
Appendix Table 15. (continued) Factual knowledge of biotechnology: the use of biotechnology crops* Biotechnology Crop Grow/
Plant Food Animal
Feed Industrial
By-products
None Don’t Know
TOTAL Responses
n n n n n n n c. Eggplant resistant to borer insect
infestation
Journalists 014 013 06 06 02 0 041 Policy makers 019 014 00 10 07 0 050 Religious leaders 015 023 03 03 07 0 051 Scientists 010 011 08 08 00 0 037 Total 186 179 45 55 79 0 544
d. Corn tolerant to herbicide Businessmen and traders 018 019 012 06 05 0 060 Consumers 030 043 023 20 20 0 136 Extension workers 035 016 022 11 01 0 085 Farmer leaders and community
leaders 041 013 018 08 24 0 104
Journalists 011 013 009 10 02 0 045 Policy makers 016 012 009 06 07 0 050 Religious leaders 012 021 004 06 08 0 051 Scientists 017 010 004 04 00 0 035 Total 180 147 101 71 67 0 566
e. Corn resistant to borer insect infestation
Businessmen and traders 022 015 08 06 04 0 055 Consumers 033 048 27 16 16 0 140 Extension workers 034 019 22 11 03 0 089 Farmer leaders and community
leaders 043 020 13 08 22 0 106
Journalists 013 014 08 09 01 0 045 Policy makers 013 016 09 01 09 0 048 Religious leaders 015 022 04 04 05 0 050 Scientists 013 007 07 06 03 0 036 Total 186 161 98 61 63 0 569
*Multiple responses
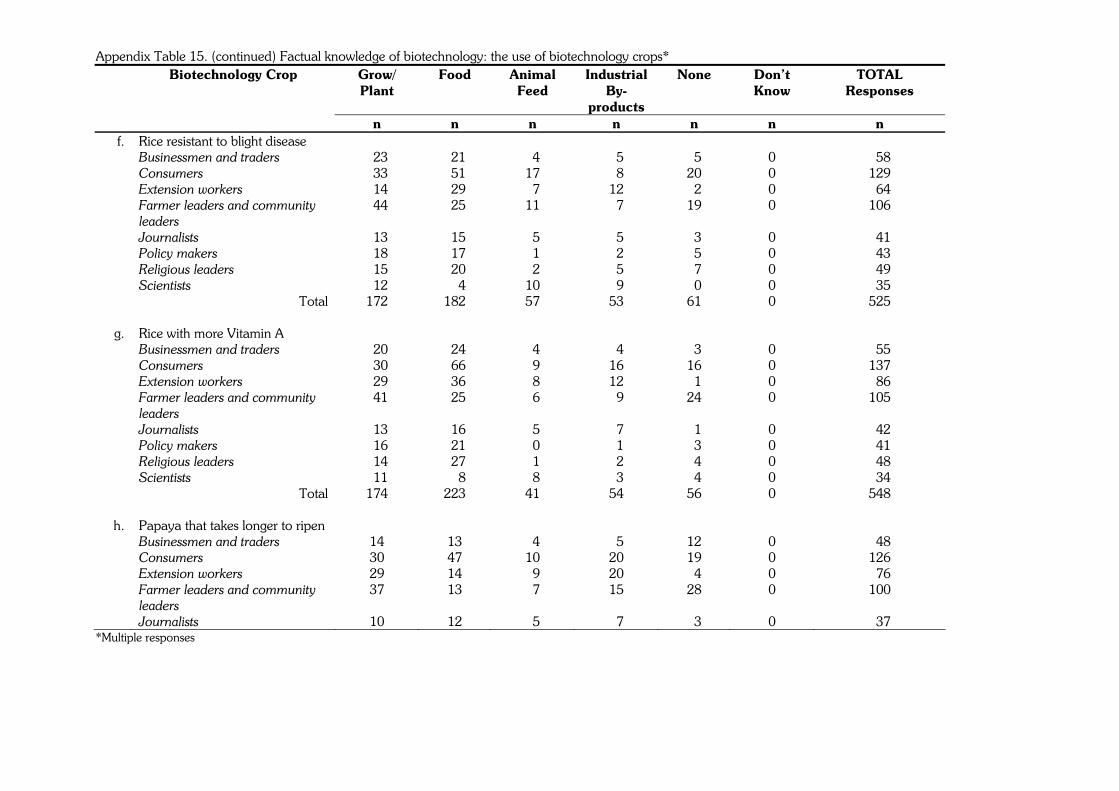
Appendix Table 15. (continued) Factual knowledge of biotechnology: the use of biotechnology crops* Biotechnology Crop Grow/
Plant Food Animal
Feed Industrial
By-products
None Don’t Know
TOTAL Responses
n n n n n n n f. Rice resistant to blight disease
Businessmen and traders 023 021 04 05 05 0 058 Consumers 033 051 17 08 20 0 129 Extension workers 014 029 07 12 02 0 064 Farmer leaders and community
leaders 044 025 11 07 19 0 106
Journalists 013 015 05 05 03 0 041 Policy makers 018 017 01 02 05 0 043 Religious leaders 015 020 02 05 07 0 049 Scientists 012 004 10 09 00 0 035 Total 172 182 57 53 61 0 525
g. Rice with more Vitamin A Businessmen and traders 020 024 04 04 03 0 055 Consumers 030 066 09 16 16 0 137 Extension workers 029 036 08 12 01 0 086 Farmer leaders and community
leaders 041 025 06 09 24 0 105
Journalists 013 016 05 07 01 0 042 Policy makers 016 021 00 01 03 0 041 Religious leaders 014 027 01 02 04 0 048 Scientists 011 008 08 03 04 0 034 Total 174 223 41 54 56 0 548
h. Papaya that takes longer to ripen Businessmen and traders 14 13 04 05 12 0 048 Consumers 30 47 10 20 19 0 126 Extension workers 29 14 09 20 04 0 076 Farmer leaders and community
leaders 37 13 07 15 28 0 100
Journalists 10 12 05 07 03 0 037 *Multiple responses
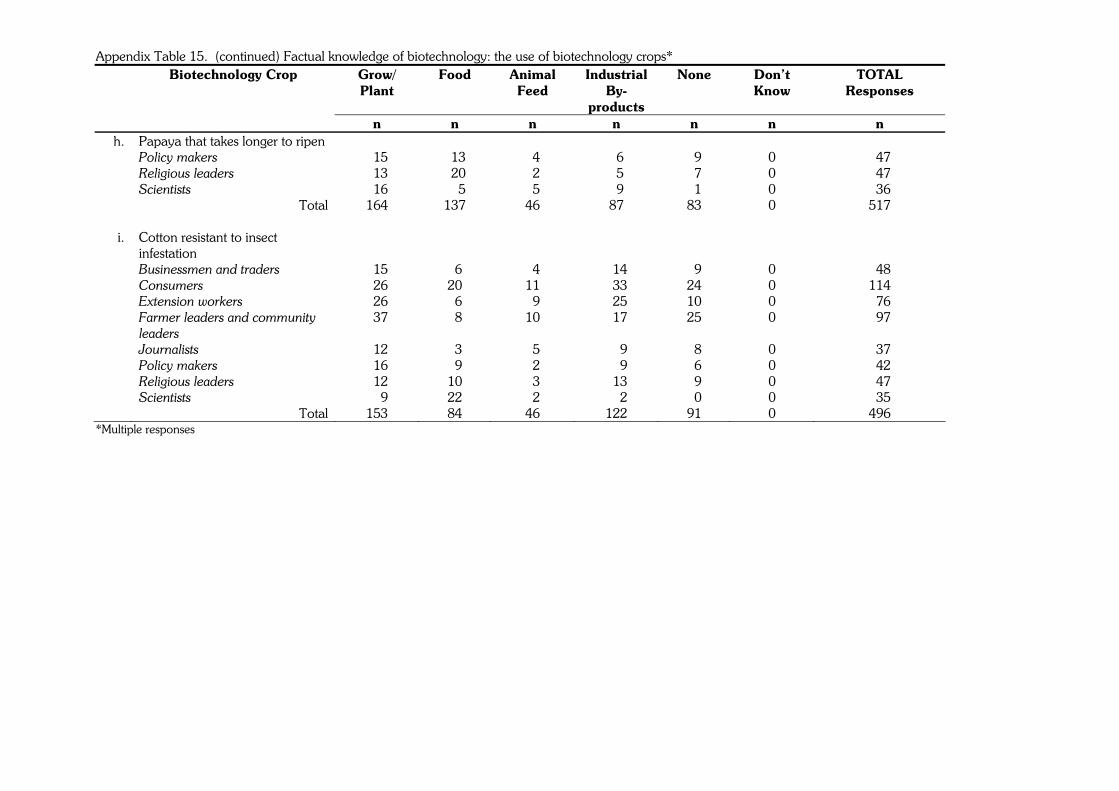
Appendix Table 15. (continued) Factual knowledge of biotechnology: the use of biotechnology crops* Biotechnology Crop Grow/
Plant Food Animal
Feed Industrial
By-products
None Don’t Know
TOTAL Responses
n n n n n n n h. Papaya that takes longer to ripen
Policy makers 015 013 04 06 09 0 047 Religious leaders 013 020 02 05 07 0 047 Scientists 016 005 05 09 01 0 036 Total 164 137 46 87 83 0 517
i. Cotton resistant to insect infestation
Businessmen and traders 015 06 04 014 09 0 048 Consumers 026 20 11 033 24 0 114 Extension workers 026 06 09 025 10 0 076 Farmer leaders and community
leaders 037 08 10 017 25 0 097
Journalists 012 03 05 009 08 0 037 Policy makers 016 09 02 009 06 0 042 Religious leaders 012 10 03 013 09 0 047
Scientists 009 22 02 002 00 0 035 Total 153 84 46 122 91 0 496
*Multiple responses
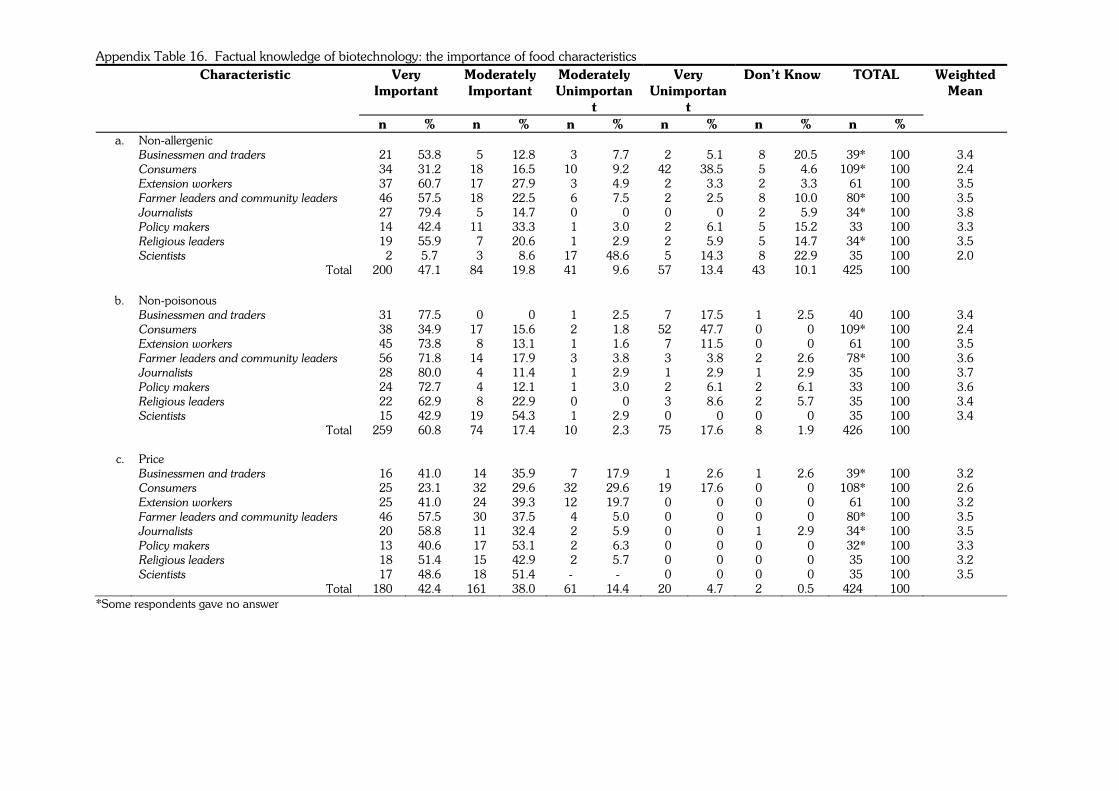
Appendix Table 16. Factual knowledge of biotechnology: the importance of food characteristics Very
Important Moderately Important
Moderately Unimportan
t
Very Unimportan
t
Don’t Know TOTAL Weighted Mean
Characteristic
n % n % n % n % n % n % a. Non-allergenic
Businessmen and traders 021 53.8 05 12.8 03 07.7 02 05.1 08 20.5 039* 100 3.4 Consumers 034 31.2 18 16.5 10 09.2 42 38.5 05 04.6 109* 100 2.4 Extension workers 037 60.7 17 27.9 03 04.9 02 03.3 02 03.3 061 100 3.5 Farmer leaders and community leaders 046 57.5 18 22.5 06 07.5 02 02.5 08 10.0 080* 100 3.5 Journalists 027 79.4 05 14.7 00 00.0 00 00.0 02 05.9 034* 100 3.8 Policy makers 014 42.4 11 33.3 01 03.0 02 06.1 05 15.2 033 100 3.3 Religious leaders 019 55.9 07 20.6 01 02.9 02 05.9 05 14.7 034* 100 3.5 Scientists 002 5.7 03 08.6 17 48.6 05 14.3 08 22.9 035 100 2.0 Total 200 47.1 84 19.8 41 09.6 57 13.4 43 10.1 425 100
b. Non-poisonous Businessmen and traders 031 77.5 00 00.0 01 02.5 07 17.5 1 2.5 040 100 3.4 Consumers 038 34.9 17 15.6 02 01.8 52 47.7 0 0.0 109* 100 2.4 Extension workers 045 73.8 08 13.1 01 01.6 07 11.5 0 0.0 061 100 3.5 Farmer leaders and community leaders 056 71.8 14 17.9 03 03.8 03 03.8 2 2.6 078* 100 3.6 Journalists 028 80.0 04 11.4 01 02.9 01 02.9 1 2.9 035 100 3.7 Policy makers 024 72.7 04 12.1 01 03.0 02 06.1 2 6.1 033 100 3.6 Religious leaders 022 62.9 08 22.9 00 00.0 03 08.6 2 5.7 035 100 3.4 Scientists 015 42.9 19 54.3 01 02.9 00 00.0 0 0.0 035 100 3.4 Total 259 60.8 74 17.4 10 02.3 75 17.6 8 1.9 426 100
c. Price Businessmen and traders 016 41.0 014 35.9 07 17.9 01 02.6 1 2.6 039* 100 3.2 Consumers 025 23.1 032 29.6 32 29.6 19 17.6 0 0.0 108* 100 2.6 Extension workers 025 41.0 024 39.3 12 19.7 00 00.0 0 0.0 061 100 3.2 Farmer leaders and community leaders 046 57.5 030 37.5 04 05.0 00 00.0 0 0.0 080* 100 3.5 Journalists 020 58.8 011 32.4 02 05.9 00 00.0 1 2.9 034* 100 3.5 Policy makers 013 40.6 017 53.1 02 06.3 00 00.0 0 0.0 032* 100 3.3 Religious leaders 018 51.4 015 42.9 02 05.7 00 00.0 0 0.0 035 100 3.2 Scientists 017 48.6 018 51.4 - - 00 00.0 0 0.0 035 100 3.5 Total 180 42.4 161 38.0 61 14.4 20 04.7 2 0.5 424 100
*Some respondents gave no answer
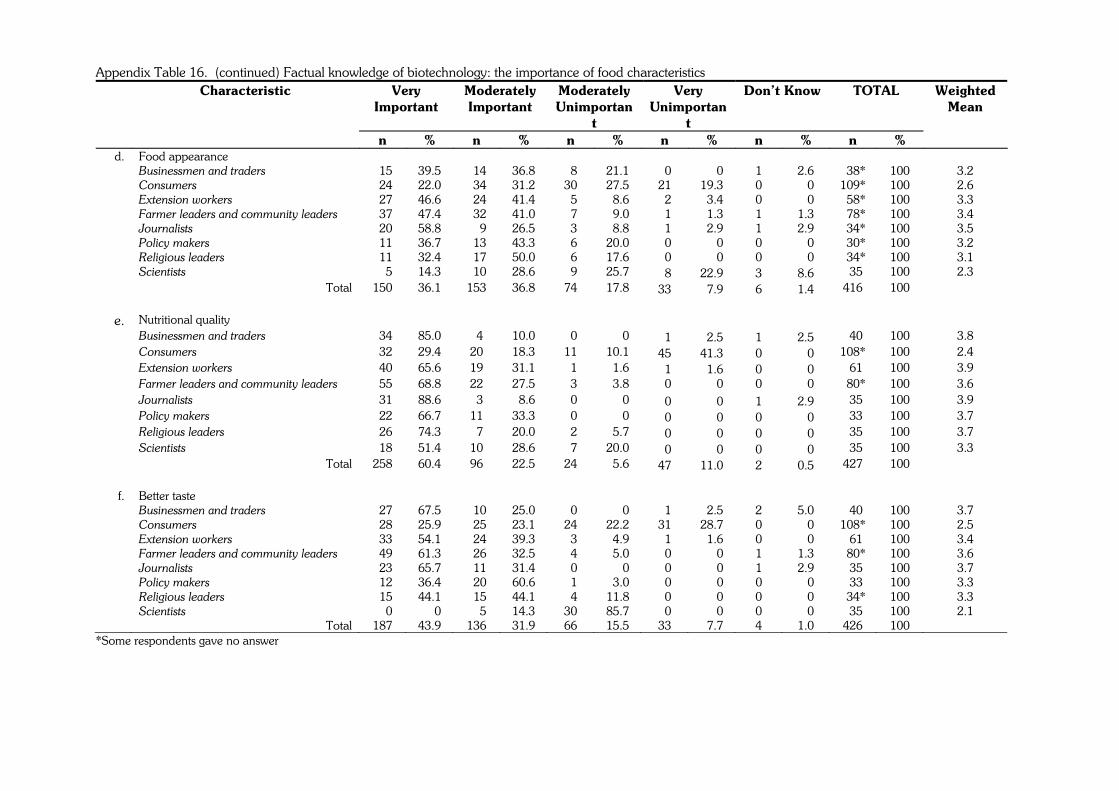
Appendix Table 16. (continued) Factual knowledge of biotechnology: the importance of food characteristics
Very Important
Moderately Important
Moderately Unimportan
t
Very Unimportan
t
Don’t Know TOTAL Weighted Mean
Characteristic
n % n % n % n % n % n % d. Food appearance
Businessmen and traders 015 39.5 014 36.8 08 21.1 00 00.0 1 2.6 038* 100 3.2 Consumers 024 22.0 034 31.2 30 27.5 21 19.3 0 0.0 109* 100 2.6 Extension workers 027 46.6 024 41.4 05 08.6 02 03.4 0 0.0 058* 100 3.3 Farmer leaders and community leaders 037 47.4 032 41.0 07 09.0 01 01.3 1 1.3 078* 100 3.4 Journalists 020 58.8 009 26.5 03 08.8 01 02.9 1 2.9 034* 100 3.5 Policy makers 011 36.7 013 43.3 06 20.0 00 00.0 0 0.0 030* 100 3.2 Religious leaders 011 32.4 017 50.0 06 17.6 00 00.0 0 0.0 034* 100 3.1 Scientists 005 14.3 010 28.6 09 25.7 08 22.9 3 8.6 035 100 2.3 Total 150 36.1 153 36.8 74 17.8 33 07.9 6 1.4 416 100
e. Nutritional quality Businessmen and traders 034 85.0 04 10.0 00 00.0 01 02.5 1 2.5 040 100 3.8 Consumers 032 29.4 20 18.3 11 10.1 45 41.3 0 0.0 108* 100 2.4 Extension workers 040 65.6 19 31.1 01 01.6 01 01.6 0 0.0 061 100 3.9 Farmer leaders and community leaders 055 68.8 22 27.5 03 03.8 00 00.0 0 0.0 080* 100 3.6 Journalists 031 88.6 03 08.6 00 00.0 00 00.0 1 2.9 035 100 3.9 Policy makers 022 66.7 11 33.3 00 00.0 00 00.0 0 0.0 033 100 3.7 Religious leaders 026 74.3 07 20.0 02 05.7 00 00.0 0 0.0 035 100 3.7 Scientists 018 51.4 10 28.6 07 20.0 00 00.0 0 0.0 035 100 3.3 Total 258 60.4 96 22.5 24 05.6 47 11.0 2 0.5 427 100
f. Better taste Businessmen and traders 027 67.5 010 25.0 00 00.0 01 02.5 2 5.0 040 100 3.7 Consumers 028 25.9 025 23.1 24 22.2 31 28.7 0 0.0 108* 100 2.5 Extension workers 033 54.1 024 39.3 03 04.9 01 01.6 0 0.0 061 100 3.4 Farmer leaders and community leaders 049 61.3 026 32.5 04 05.0 00 00.0 1 1.3 080* 100 3.6 Journalists 023 65.7 011 31.4 00 00.0 00 00.0 1 2.9 035 100 3.7 Policy makers 012 36.4 020 60.6 01 03.0 00 00.0 0 0.0 033 100 3.3 Religious leaders 015 44.1 015 44.1 04 11.8 00 00.0 0 0.0 034* 100 3.3 Scientists 000 00.0 005 14.3 30 85.7 00 00.0 0 0.0 035 100 2.1 Total 187 43.9 136 31.9 66 15.5 33 07.7 4 1.0 426 100
*Some respondents gave no answer
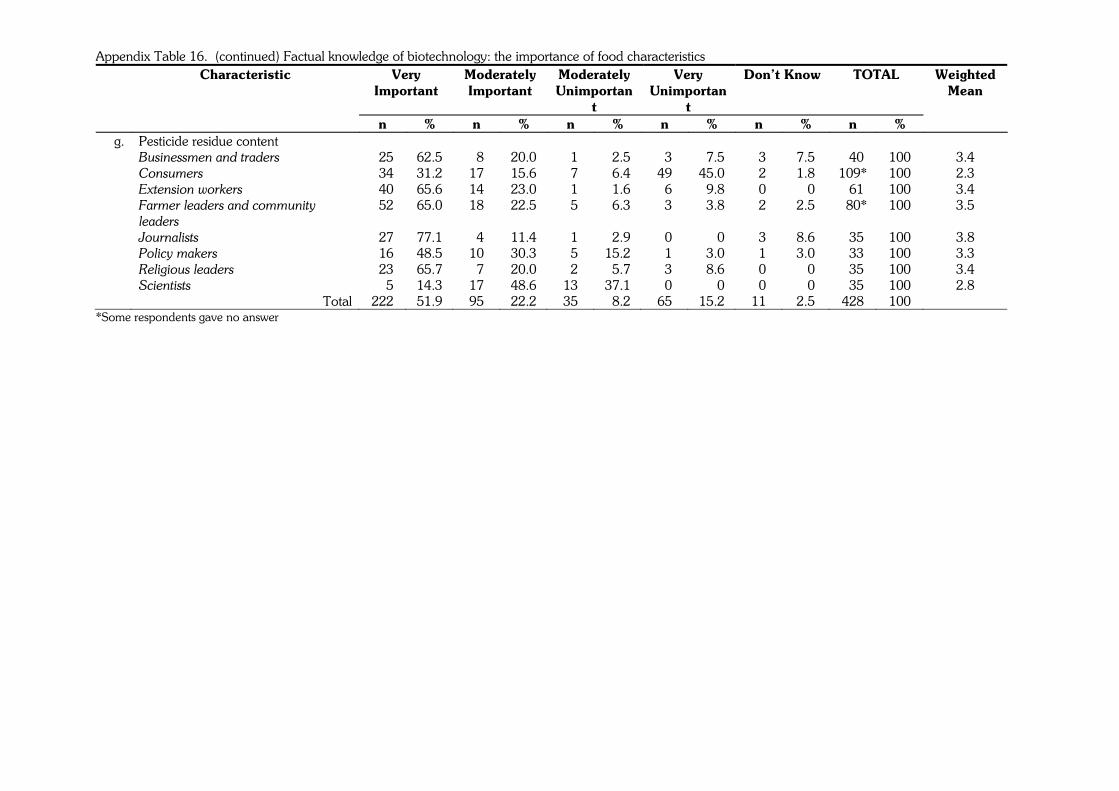
Appendix Table 16. (continued) Factual knowledge of biotechnology: the importance of food characteristics Very
Important Moderately Important
Moderately Unimportan
t
Very Unimportan
t
Don’t Know TOTAL Weighted Mean
Characteristic
n % n % n % n % n % n % g. Pesticide residue content
Businessmen and traders 025 62.5 08 20.0 01 02.5 03 07.5 03 7.5 040 100 3.4 Consumers 034 31.2 17 15.6 07 06.4 49 45.0 02 1.8 109* 100 2.3 Extension workers 040 65.6 14 23.0 01 01.6 06 09.8 00 0.0 061 100 3.4 Farmer leaders and community
leaders 052 65.0 18 22.5 05 06.3 03 03.8 02 2.5 080* 100 3.5
Journalists 027 77.1 04 11.4 01 02.9 00 00.0 03 8.6 035 100 3.8 Policy makers 016 48.5 10 30.3 05 15.2 01 03.0 01 3.0 033 100 3.3 Religious leaders 023 65.7 07 20.0 02 05.7 03 08.6 00 0.0 035 100 3.4 Scientists 005 14.3 17 48.6 13 37.1 00 00.0 00 0.0 035 100 2.8 Total 222 51.9 95 22.2 35 08.2 65 15.2 11 2.5 428 100
*Some respondents gave no answer
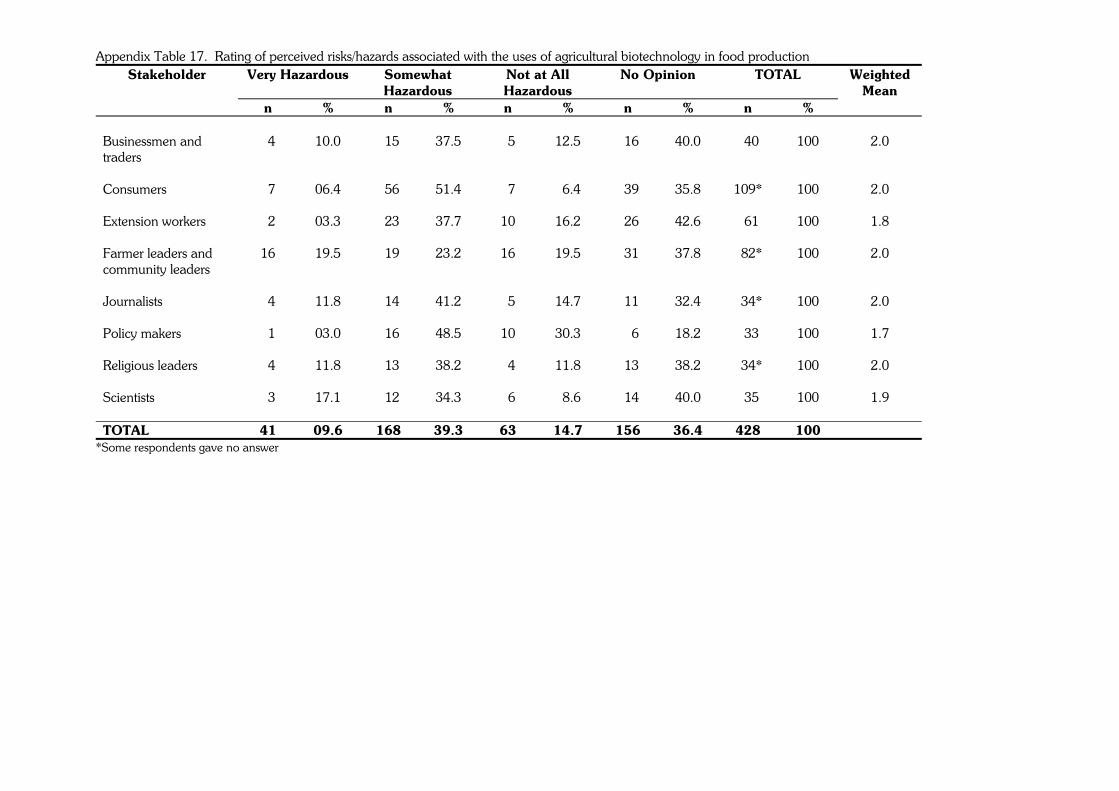
Appendix Table 17. Rating of perceived risks/hazards associated with the uses of agricultural biotechnology in food production Very Hazardous Somewhat
Hazardous Not at All Hazardous
No Opinion TOTAL Weighted Mean
Stakeholder
n % n % n % n % n % Businessmen and traders
04 10.0 015 37.5 05 12.5 016 40.0 040 100 2.0
Consumers 07 06.4 056 51.4 07 06.4 039 35.8 109* 100 2.0 Extension workers 02 03.3 023 37.7 10 16.2 026 42.6 061 100 1.8 Farmer leaders and community leaders
16 19.5 019 23.2 16 19.5 031 37.8 082* 100 2.0
Journalists 04 11.8 014 41.2 05 14.7 011 32.4 034* 100 2.0 Policy makers 01 03.0 016 48.5 10 30.3 006 18.2 033 100 1.7 Religious leaders 04 11.8 013 38.2 04 11.8 013 38.2 034* 100 2.0 Scientists 03 17.1 012 34.3 06 08.6 014 40.0 035 100 1.9 TOTAL 41 09.6 168 39.3 63 14.7 156 36.4 428 100
*Some respondents gave no answer
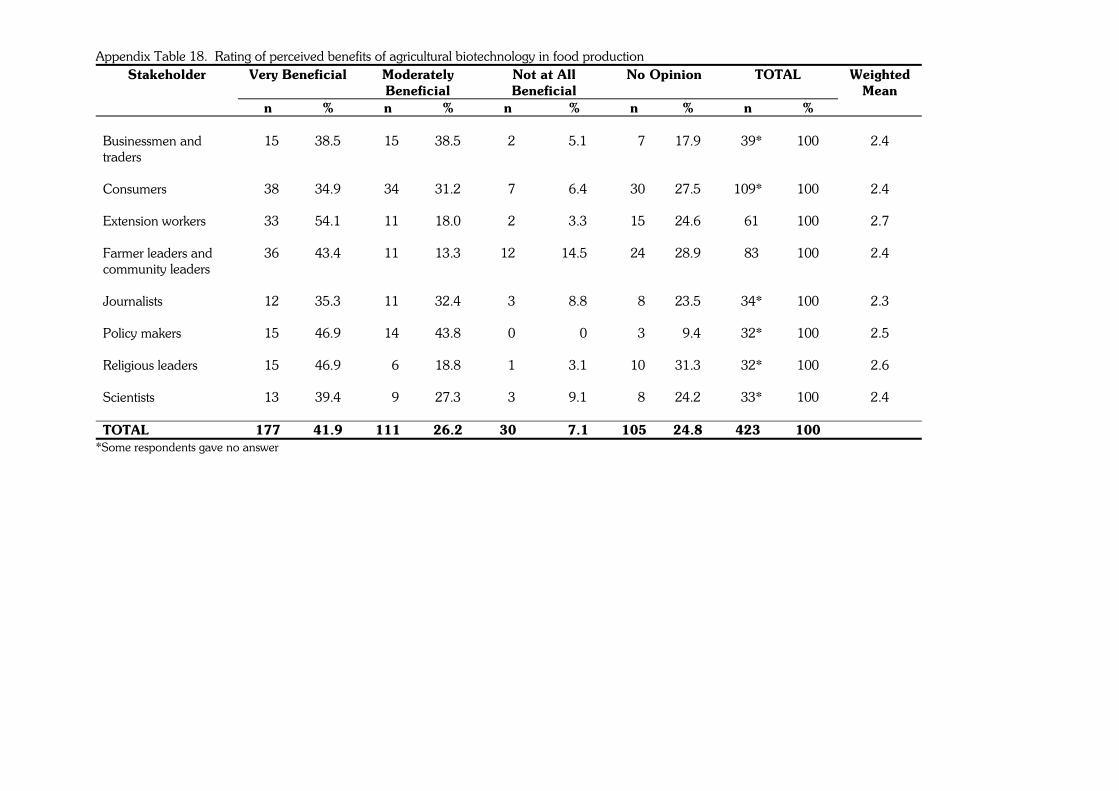
Appendix Table 18. Rating of perceived benefits of agricultural biotechnology in food production Very Beneficial Moderately
Beneficial Not at All Beneficial
No Opinion TOTAL Weighted Mean
Stakeholder
n % n % n % n % n % Businessmen and traders
015 38.5 015 38.5 02 05.1 007 17.9 039* 100 2.4
Consumers 038 34.9 034 31.2 07 06.4 030 27.5 109* 100 2.4 Extension workers 033 54.1 011 18.0 02 03.3 015 24.6 061 100 2.7 Farmer leaders and community leaders
036 43.4 011 13.3 12 14.5 024 28.9 083 100 2.4
Journalists 012 35.3 011 32.4 03 08.8 008 23.5 034* 100 2.3 Policy makers 015 46.9 014 43.8 00 00.0 003 09.4 032* 100 2.5 Religious leaders 015 46.9 006 18.8 01 03.1 010 31.3 032* 100 2.6 Scientists 013 39.4 009 27.3 03 09.1 008 24.2 033* 100 2.4 TOTAL 177 41.9 111 26.2 30 07.1 105 24.8 423 100
*Some respondents gave no answer
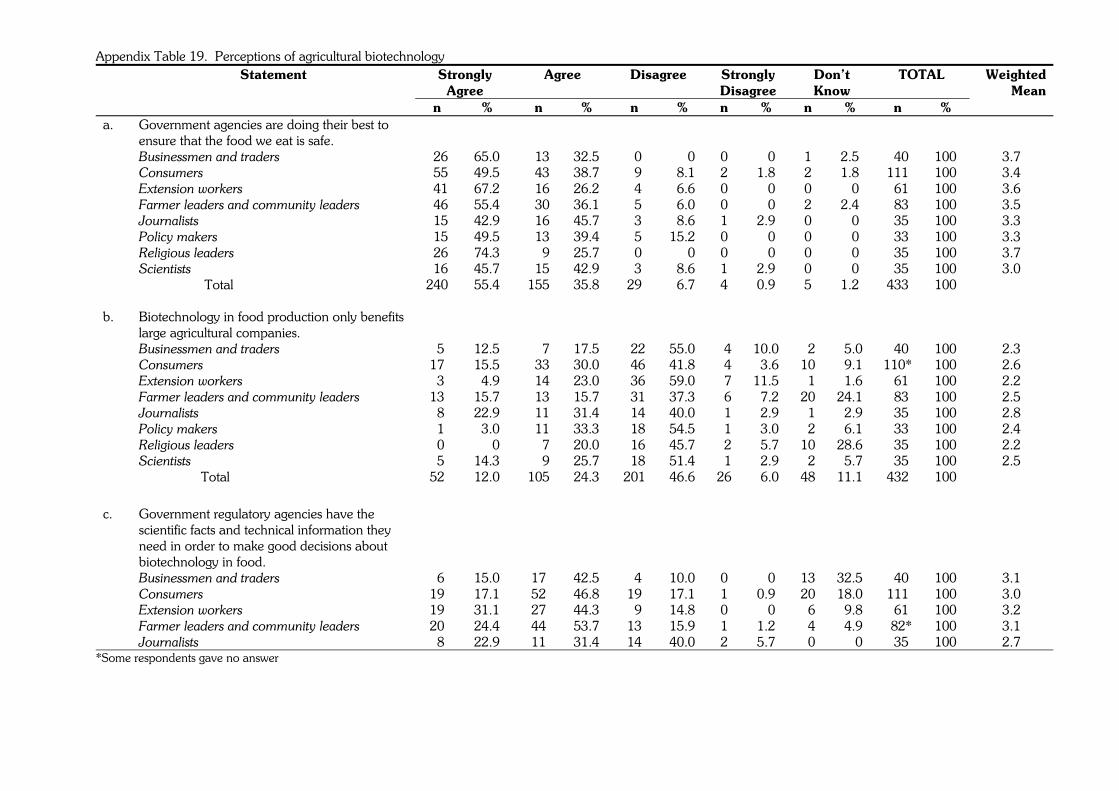
Appendix Table 19. Perceptions of agricultural biotechnology Strongly
Agree Agree Disagree Strongly
Disagree Don’t Know
TOTAL
Statement
n % n % n % n % n % n %
Weighted Mean
a. Government agencies are doing their best to ensure that the food we eat is safe.
Businessmen and traders 026 65.0 013 32.5 00 00.0 0 0.0 1 2.5 040 100 3.7 Consumers 055 49.5 043 38.7 09 08.1 2 1.8 2 1.8 111 100 3.4 Extension workers 041 67.2 016 26.2 04 06.6 0 0.0 0 0.0 061 100 3.6 Farmer leaders and community leaders 046 55.4 030 36.1 05 06.0 0 0.0 2 2.4 083 100 3.5 Journalists 015 42.9 016 45.7 03 08.6 1 2.9 0 0.0 035 100 3.3 Policy makers 015 49.5 013 39.4 05 15.2 0 0.0 0 0.0 033 100 3.3 Religious leaders 026 74.3 009 25.7 00 00.0 0 0.0 0 0.0 035 100 3.7 Scientists 016 45.7 015 42.9 03 08.6 1 2.9 0 0.0 035 100 3.0 Total 240 55.4 155 35.8 29 06.7 4 0.9 5 1.2 433 100 b. Biotechnology in food production only benefits
large agricultural companies.
Businessmen and traders 05 12.5 007 17.5 022 55.0 04 10.0 02 05.0 040 100 2.3 Consumers 17 15.5 033 30.0 046 41.8 04 03.6 10 09.1 110* 100 2.6 Extension workers 03 04.9 014 23.0 036 59.0 07 11.5 01 01.6 061 100 2.2 Farmer leaders and community leaders 13 15.7 013 15.7 031 37.3 06 07.2 20 24.1 083 100 2.5 Journalists 08 22.9 011 31.4 014 40.0 01 02.9 01 02.9 035 100 2.8 Policy makers 01 03.0 011 33.3 018 54.5 01 03.0 02 06.1 033 100 2.4 Religious leaders 00 00.0 007 20.0 016 45.7 02 05.7 10 28.6 035 100 2.2 Scientists 05 14.3 009 25.7 018 51.4 01 02.9 02 05.7 035 100 2.5 Total 52 12.0 105 24.3 201 46.6 26 06.0 48 11.1 432 100
c. Government regulatory agencies have the
scientific facts and technical information they need in order to make good decisions about biotechnology in food.
Businessmen and traders 06 15.0 17 42.5 04 10.0 0 0.0 13 32.5 040 100 3.1 Consumers 19 17.1 52 46.8 19 17.1 1 0.9 20 18.0 111 100 3.0 Extension workers 19 31.1 27 44.3 09 14.8 0 0.0 06 09.8 061 100 3.2 Farmer leaders and community leaders 20 24.4 44 53.7 13 15.9 1 1.2 04 04.9 082* 100 3.1 Journalists 08 22.9 11 31.4 14 40.0 2 5.7 00 00.0 035 100 2.7
*Some respondents gave no answer
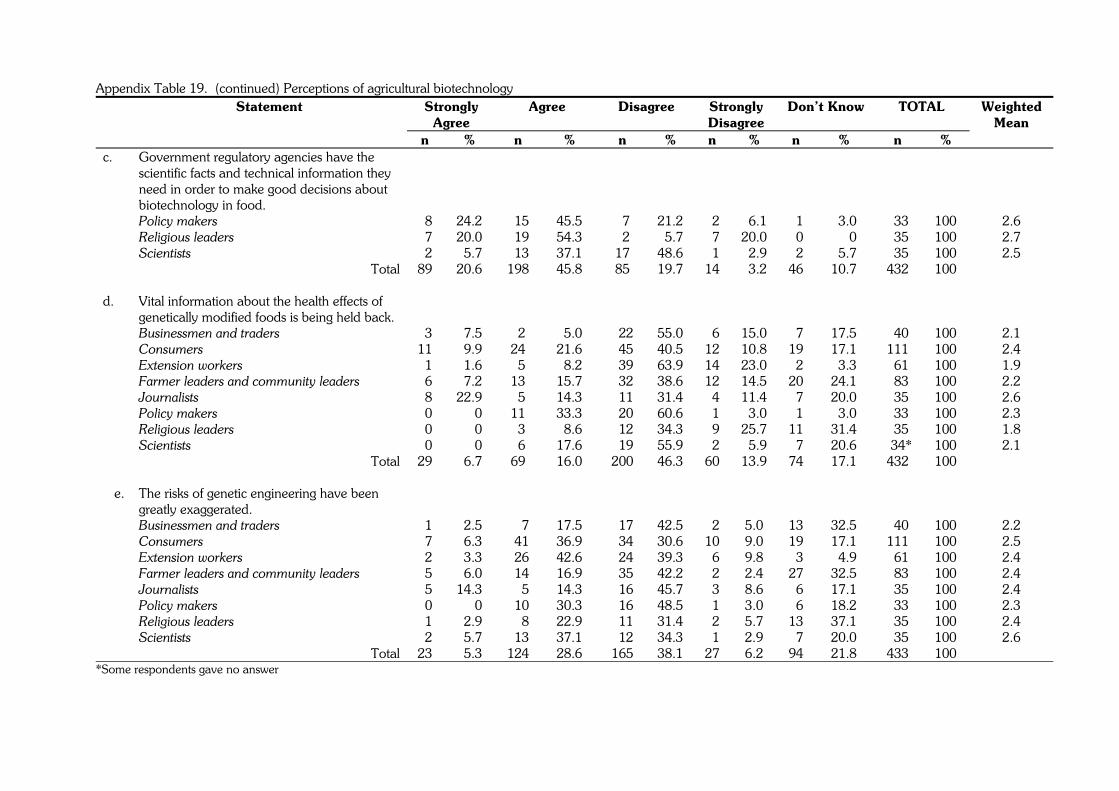
Appendix Table 19. (continued) Perceptions of agricultural biotechnology
Strongly Agree
Agree Disagree Strongly Disagree
Don’t Know TOTAL
Weighted Mean
Statement
n % n % n % n % n % n % c. Government regulatory agencies have the
scientific facts and technical information they need in order to make good decisions about biotechnology in food.
Policy makers 08 24.2 015 45.5 07 21.2 02 06.1 01 03.0 033 100 2.6 Religious leaders 07 20.0 019 54.3 02 05.7 07 20.0 00 00.0 035 100 2.7 Scientists 02 05.7 013 37.1 17 48.6 01 02.9 02 05.7 035 100 2.5
Total 89 20.6 198 45.8 85 19.7 14 03.2 46 10.7 432 100 d. Vital information about the health effects of
genetically modified foods is being held back.
Businessmen and traders 03 07.5 02 05.0 022 55.0 06 15.0 07 17.5 040 100 2.1 Consumers 11 09.9 24 21.6 045 40.5 12 10.8 19 17.1 111 100 2.4 Extension workers 01 01.6 05 08.2 039 63.9 14 23.0 02 03.3 061 100 1.9 Farmer leaders and community leaders 06 07.2 13 15.7 032 38.6 12 14.5 20 24.1 083 100 2.2 Journalists 08 22.9 05 14.3 011 31.4 04 11.4 07 20.0 035 100 2.6 Policy makers 00 00.0 11 33.3 020 60.6 01 03.0 01 03.0 033 100 2.3 Religious leaders 00 00.0 03 08.6 012 34.3 09 25.7 11 31.4 035 100 1.8 Scientists 00 00.0 06 17.6 019 55.9 02 05.9 07 20.6 034* 100 2.1 Total 29 06.7 69 16.0 200 46.3 60 13.9 74 17.1 432 100
e. The risks of genetic engineering have been greatly exaggerated.
Businessmen and traders 01 02.5 007 17.5 017 42.5 02 5.0 13 32.5 040 100 2.2 Consumers 07 06.3 041 36.9 034 30.6 10 9.0 19 17.1 111 100 2.5 Extension workers 02 03.3 026 42.6 024 39.3 06 9.8 03 04.9 061 100 2.4 Farmer leaders and community leaders 05 06.0 014 16.9 035 42.2 02 2.4 27 32.5 083 100 2.4 Journalists 05 14.3 005 14.3 016 45.7 03 8.6 06 17.1 035 100 2.4 Policy makers 00 00.0 010 30.3 016 48.5 01 3.0 06 18.2 033 100 2.3 Religious leaders 01 02.9 008 22.9 011 31.4 02 5.7 13 37.1 035 100 2.4 Scientists 02 05.7 013 37.1 012 34.3 01 2.9 07 20.0 035 100 2.6
Total 23 05.3 124 28.6 165 38.1 27 6.2 94 21.8 433 100 *Some respondents gave no answer
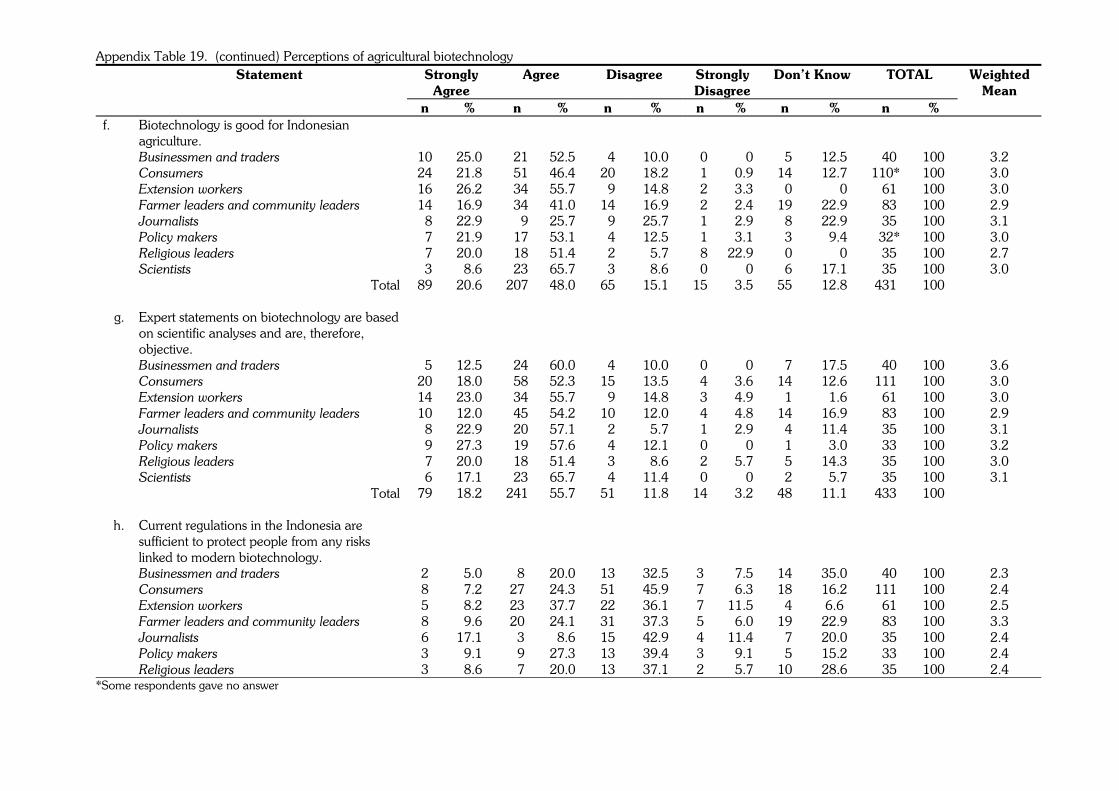
Appendix Table 19. (continued) Perceptions of agricultural biotechnology Strongly
Agree Agree Disagree Strongly
Disagree Don’t Know TOTAL
Weighted
Mean
Statement
n % n % n % n % n % n % f. Biotechnology is good for Indonesian
agriculture.
Businessmen and traders 10 25.0 021 52.5 04 10.0 00 00.0 05 12.5 040 100 3.2 Consumers 24 21.8 051 46.4 20 18.2 01 00.9 14 12.7 110* 100 3.0 Extension workers 16 26.2 034 55.7 09 14.8 02 03.3 00 00.0 061 100 3.0 Farmer leaders and community leaders 14 16.9 034 41.0 14 16.9 02 02.4 19 22.9 083 100 2.9 Journalists 08 22.9 009 25.7 09 25.7 01 02.9 08 22.9 035 100 3.1 Policy makers 07 21.9 017 53.1 04 12.5 01 03.1 03 09.4 032* 100 3.0 Religious leaders 07 20.0 018 51.4 02 05.7 08 22.9 00 00.0 035 100 2.7 Scientists 03 08.6 023 65.7 03 08.6 00 00.0 06 17.1 035 100 3.0 Total 89 20.6 207 48.0 65 15.1 15 03.5 55 12.8 431 100
g. Expert statements on biotechnology are based on scientific analyses and are, therefore, objective.
Businessmen and traders 05 12.5 024 60.0 04 10.0 00 00.0 07 17.5 040 100 3.6 Consumers 20 18.0 058 52.3 15 13.5 04 03.6 14 12.6 111 100 3.0 Extension workers 14 23.0 034 55.7 09 14.8 03 04.9 01 01.6 061 100 3.0 Farmer leaders and community leaders 10 12.0 045 54.2 10 12.0 04 04.8 14 16.9 083 100 2.9 Journalists 08 22.9 020 57.1 02 05.7 01 02.9 04 11.4 035 100 3.1 Policy makers 09 27.3 019 57.6 04 12.1 00 00.0 01 03.0 033 100 3.2 Religious leaders 07 20.0 018 51.4 03 08.6 02 05.7 05 14.3 035 100 3.0 Scientists 06 17.1 023 65.7 04 11.4 00 00.0 02 05.7 035 100 3.1 Total 79 18.2 241 55.7 51 11.8 14 03.2 48 11.1 433 100
h. Current regulations in the Indonesia are sufficient to protect people from any risks linked to modern biotechnology.
Businessmen and traders 2 05.0 08 20.0 13 32.5 3 07.5 14 35.0 040 100 2.3 Consumers 8 07.2 27 24.3 51 45.9 7 06.3 18 16.2 111 100 2.4 Extension workers 5 08.2 23 37.7 22 36.1 7 11.5 04 6.6 061 100 2.5 Farmer leaders and community leaders 8 09.6 20 24.1 31 37.3 5 06.0 19 22.9 083 100 3.3 Journalists 6 17.1 03 08.6 15 42.9 4 11.4 07 20.0 035 100 2.4 Policy makers 3 09.1 09 27.3 13 39.4 3 09.1 05 15.2 033 100 2.4 Religious leaders 3 08.6 07 20.0 13 37.1 2 05.7 10 28.6 035 100 2.4
*Some respondents gave no answer
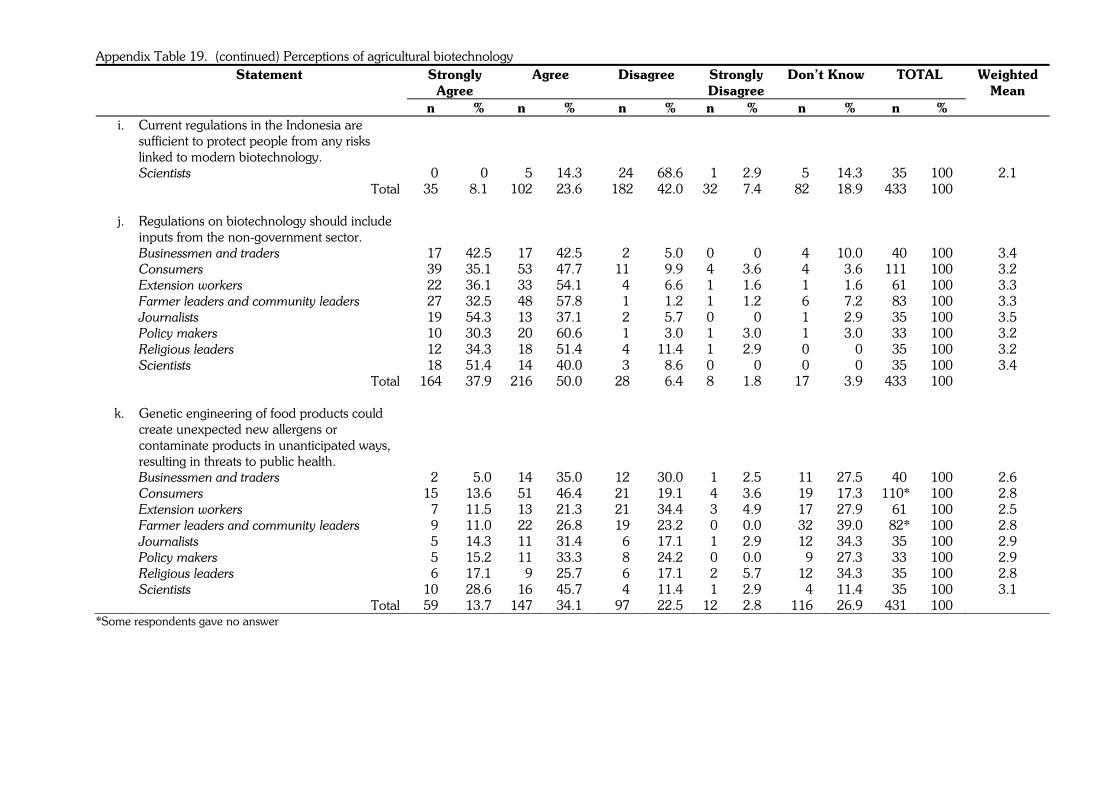
Appendix Table 19. (continued) Perceptions of agricultural biotechnology Strongly
Agree Agree Disagree Strongly
Disagree Don’t Know TOTAL
Weighted
Mean
Statement
n % n % n % n % n % n % i. Current regulations in the Indonesia are
sufficient to protect people from any risks linked to modern biotechnology.
Scientists 00 0.0 005 14.3 024 68.6 01 2.9 05 14.3 035 100 2.1 Total 35 8.1 102 23.6 182 42.0 32 7.4 82 18.9 433 100
j. Regulations on biotechnology should include inputs from the non-government sector.
Businessmen and traders 017 42.5 017 42.5 02 05.0 0 0.0 04 10.0 040 100 3.4 Consumers 039 35.1 053 47.7 11 09.9 4 3.6 04 03.6 111 100 3.2 Extension workers 022 36.1 033 54.1 04 06.6 1 1.6 01 01.6 061 100 3.3 Farmer leaders and community leaders 027 32.5 048 57.8 01 01.2 1 1.2 06 07.2 083 100 3.3 Journalists 019 54.3 013 37.1 02 05.7 0 0.0 01 02.9 035 100 3.5 Policy makers 010 30.3 020 60.6 01 03.0 1 3.0 01 03.0 033 100 3.2 Religious leaders 012 34.3 018 51.4 04 11.4 1 2.9 00 00.0 035 100 3.2 Scientists 018 51.4 014 40.0 03 08.6 0 0.0 00 00.0 035 100 3.4 Total 164 37.9 216 50.0 28 06.4 8 1.8 17 03.9 433 100
k. Genetic engineering of food products could create unexpected new allergens or contaminate products in unanticipated ways, resulting in threats to public health.
Businessmen and traders 02 05.0 014 35.0 12 30.0 01 2.5 011 27.5 040 100 2.6 Consumers 15 13.6 051 46.4 21 19.1 04 3.6 019 17.3 110* 100 2.8 Extension workers 07 11.5 013 21.3 21 34.4 03 4.9 017 27.9 061 100 2.5 Farmer leaders and community leaders 09 11.0 022 26.8 19 23.2 00 0.0 032 39.0 082* 100 2.8 Journalists 05 14.3 011 31.4 06 17.1 01 2.9 012 34.3 035 100 2.9 Policy makers 05 15.2 011 33.3 08 24.2 00 0.0 009 27.3 033 100 2.9 Religious leaders 06 17.1 009 25.7 06 17.1 02 5.7 012 34.3 035 100 2.8 Scientists 10 28.6 016 45.7 04 11.4 01 2.9 004 11.4 035 100 3.1 Total 59 13.7 147 34.1 97 22.5 12 2.8 116 26.9 431 100
*Some respondents gave no answer
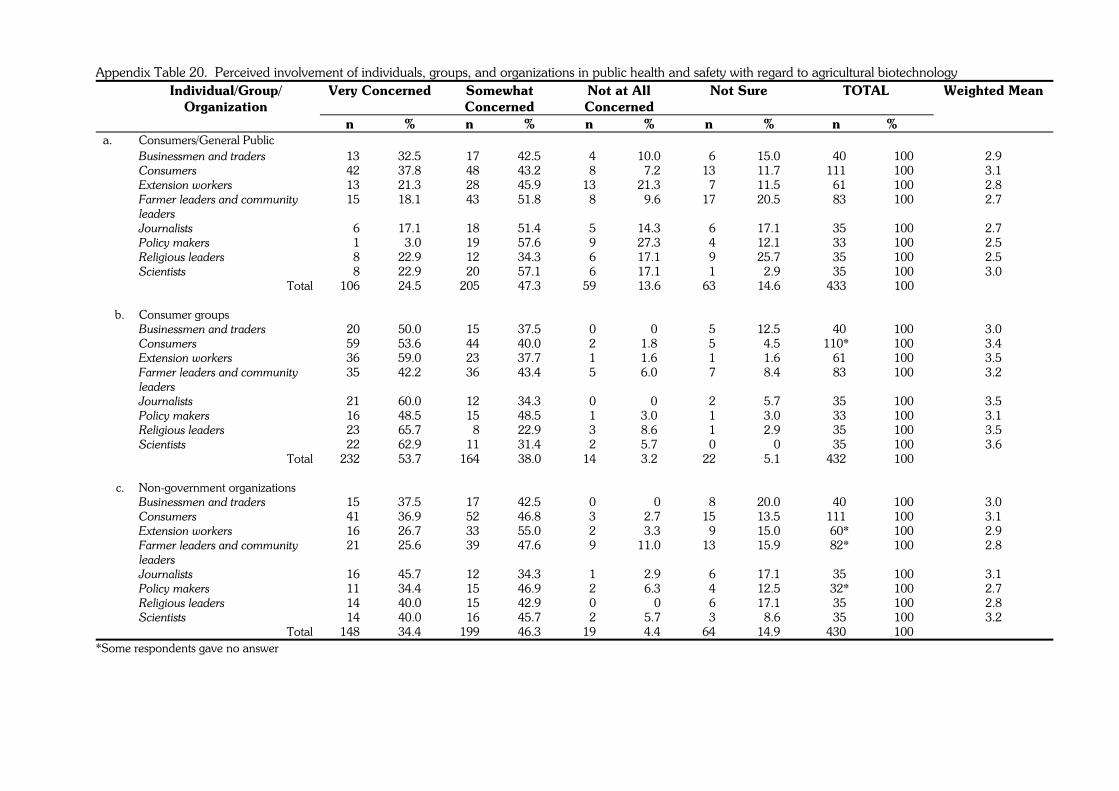
Appendix Table 20. Perceived involvement of individuals, groups, and organizations in public health and safety with regard to agricultural biotechnology
Very Concerned Somewhat Concerned
Not at All Concerned
Not Sure TOTAL
Weighted Mean
Individual/Group/ Organization
n % n % n % n % n % a. Consumers/General Public
Businessmen and traders 013 32.5 017 42.5 04 10.0 06 15.0 040 100 2.9 Consumers 042 37.8 048 43.2 08 07.2 13 11.7 111 100 3.1 Extension workers 013 21.3 028 45.9 13 21.3 07 11.5 061 100 2.8 Farmer leaders and community
leaders 015 18.1 043 51.8 08 09.6 17 20.5 083 100 2.7
Journalists 006 17.1 018 51.4 05 14.3 06 17.1 035 100 2.7 Policy makers 001 03.0 019 57.6 09 27.3 04 12.1 033 100 2.5 Religious leaders 008 22.9 012 34.3 06 17.1 09 25.7 035 100 2.5 Scientists 008 22.9 020 57.1 06 17.1 01 02.9 035 100 3.0 Total 106 24.5 205 47.3 59 13.6 63 14.6 433 100
b. Consumer groups Businessmen and traders 020 50.0 015 37.5 00 0.0 05 12.5 040 100 3.0 Consumers 059 53.6 044 40.0 02 1.8 05 04.5 110* 100 3.4 Extension workers 036 59.0 023 37.7 01 1.6 01 01.6 061 100 3.5 Farmer leaders and community
leaders 035 42.2 036 43.4 05 6.0 07 08.4 083 100 3.2
Journalists 021 60.0 012 34.3 00 0.0 02 05.7 035 100 3.5 Policy makers 016 48.5 015 48.5 01 3.0 01 03.0 033 100 3.1 Religious leaders 023 65.7 008 22.9 03 8.6 01 02.9 035 100 3.5 Scientists 022 62.9 011 31.4 02 5.7 00 00.0 035 100 3.6 Total 232 53.7 164 38.0 14 3.2 22 05.1 432 100
c. Non-government organizations Businessmen and traders 015 37.5 017 42.5 00 00.0 08 20.0 040 100 3.0 Consumers 041 36.9 052 46.8 03 02.7 15 13.5 111 100 3.1 Extension workers 016 26.7 033 55.0 02 03.3 09 15.0 060* 100 2.9 Farmer leaders and community
leaders 021 25.6 039 47.6 09 11.0 13 15.9 082* 100 2.8
Journalists 016 45.7 012 34.3 01 02.9 06 17.1 035 100 3.1 Policy makers 011 34.4 015 46.9 02 06.3 04 12.5 032* 100 2.7 Religious leaders 014 40.0 015 42.9 00 00.0 06 17.1 035 100 2.8 Scientists 014 40.0 016 45.7 02 05.7 03 08.6 035 100 3.2 Total 148 34.4 199 46.3 19 04.4 64 14.9 430 100
*Some respondents gave no answer
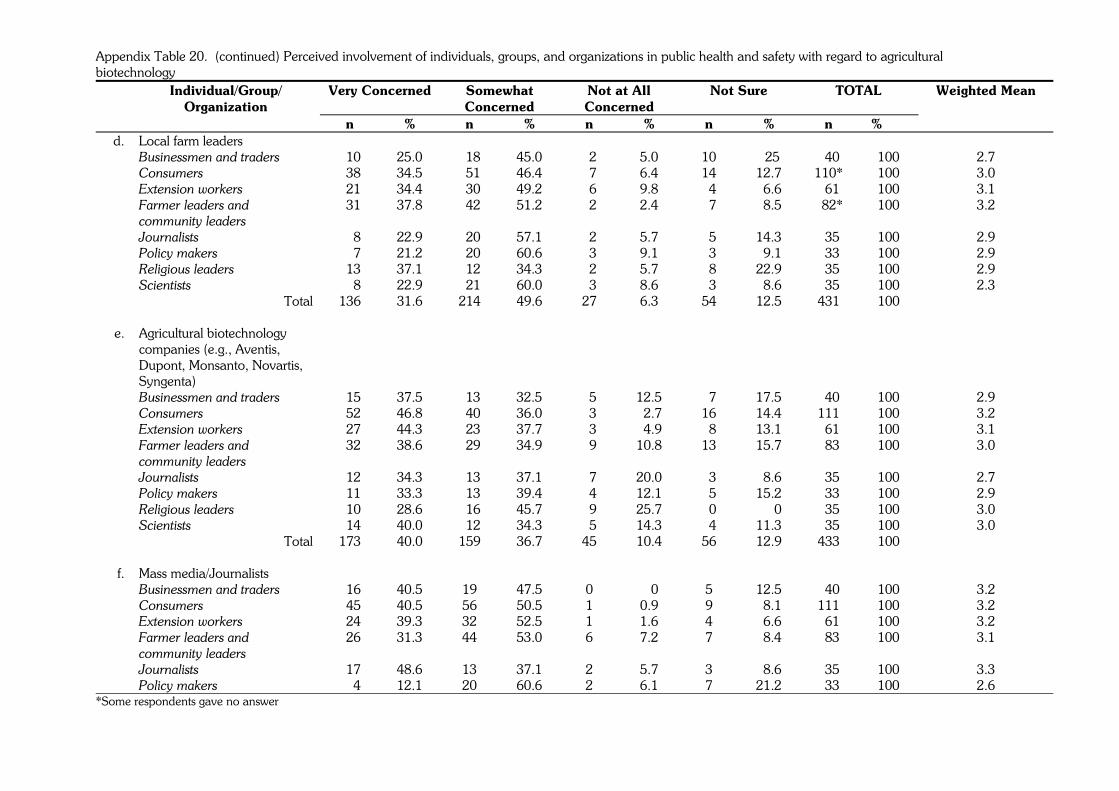
Appendix Table 20. (continued) Perceived involvement of individuals, groups, and organizations in public health and safety with regard to agricultural biotechnology
Very Concerned Somewhat Concerned
Not at All Concerned
Not Sure TOTAL
Weighted Mean
Individual/Group/ Organization
n % n % n % n % n % d. Local farm leaders
Businessmen and traders 010 25.0 018 45.0 02 5.0 10 025 040 100 2.7 Consumers 038 34.5 051 46.4 07 6.4 14 12.7 110* 100 3.0 Extension workers 021 34.4 030 49.2 06 9.8 04 06.6 061 100 3.1 Farmer leaders and
community leaders 031 37.8 042 51.2 02 2.4 07 08.5 082* 100 3.2
Journalists 008 22.9 020 57.1 02 5.7 05 14.3 035 100 2.9 Policy makers 007 21.2 020 60.6 03 9.1 03 09.1 033 100 2.9 Religious leaders 013 37.1 012 34.3 02 5.7 08 22.9 035 100 2.9 Scientists 008 22.9 021 60.0 03 8.6 03 08.6 035 100 2.3 Total 136 31.6 214 49.6 27 6.3 54 12.5 431 100
e. Agricultural biotechnology companies (e.g., Aventis, Dupont, Monsanto, Novartis, Syngenta)
Businessmen and traders 015 37.5 013 32.5 05 12.5 07 17.5 040 100 2.9 Consumers 052 46.8 040 36.0 03 02.7 16 14.4 111 100 3.2 Extension workers 027 44.3 023 37.7 03 04.9 08 13.1 061 100 3.1 Farmer leaders and
community leaders 032 38.6 029 34.9 09 10.8 13 15.7 083 100 3.0
Journalists 012 34.3 013 37.1 07 20.0 03 08.6 035 100 2.7 Policy makers 011 33.3 013 39.4 04 12.1 05 15.2 033 100 2.9 Religious leaders 010 28.6 016 45.7 09 25.7 00 00.0 035 100 3.0 Scientists 014 40.0 012 34.3 05 14.3 04 11.3 035 100 3.0 Total 173 40.0 159 36.7 45 10.4 56 12.9 433 100
f. Mass media/Journalists Businessmen and traders 016 40.5 19 47.5 0 0.0 5 12.5 040 100 3.2 Consumers 045 40.5 56 50.5 1 0.9 9 08.1 111 100 3.2 Extension workers 024 39.3 32 52.5 1 1.6 4 06.6 061 100 3.2 Farmer leaders and
community leaders 026 31.3 44 53.0 6 7.2 7 08.4 083 100 3.1
Journalists 017 48.6 13 37.1 2 5.7 3 08.6 035 100 3.3 Policy makers 004 12.1 20 60.6 2 6.1 7 21.2 033 100 2.6
*Some respondents gave no answer
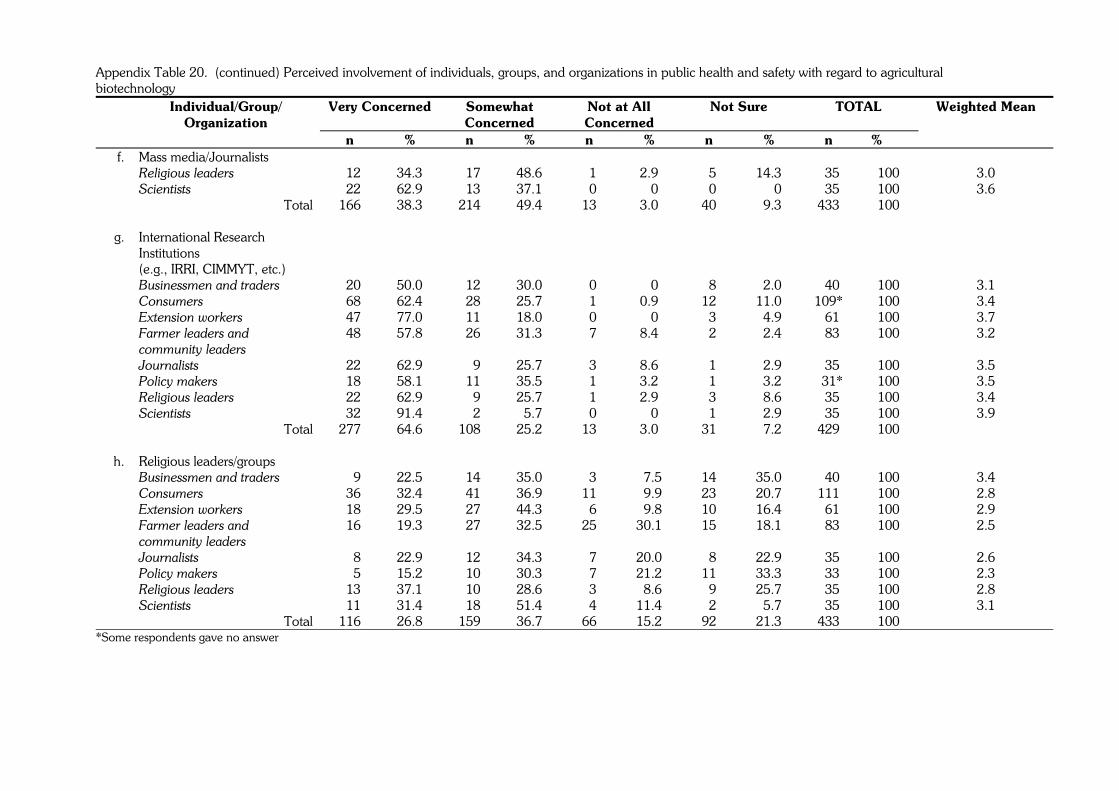
Appendix Table 20. (continued) Perceived involvement of individuals, groups, and organizations in public health and safety with regard to agricultural biotechnology
Very Concerned Somewhat Concerned
Not at All Concerned
Not Sure TOTAL
Weighted Mean
Individual/Group/ Organization
n % n % n % n % n % f. Mass media/Journalists
Religious leaders 012 34.3 017 48.6 01 2.9 05 14.3 035 100 3.0 Scientists 022 62.9 013 37.1 00 0.0 00 00.0 035 100 3.6 Total 166 38.3 214 49.4 13 3.0 40 09.3 433 100
g. International Research Institutions (e.g., IRRI, CIMMYT, etc.)
Businessmen and traders 020 50.0 012 30.0 00 0.0 08 02.0 040 100 3.1 Consumers 068 62.4 028 25.7 01 0.9 12 11.0 109* 100 3.4 Extension workers 047 77.0 011 18.0 00 0.0 03 04.9 061 100 3.7 Farmer leaders and
community leaders 048 57.8 026 31.3 07 8.4 02 02.4 083 100 3.2
Journalists 022 62.9 009 25.7 03 8.6 01 02.9 035 100 3.5 Policy makers 018 58.1 011 35.5 01 3.2 01 03.2 031* 100 3.5 Religious leaders 022 62.9 009 25.7 01 2.9 03 08.6 035 100 3.4 Scientists 032 91.4 002 05.7 00 0.0 01 02.9 035 100 3.9 Total 277 64.6 108 25.2 13 3.0 31 07.2 429 100
h. Religious leaders/groups Businessmen and traders 009 22.5 014 35.0 03 07.5 14 35.0 040 100 3.4 Consumers 036 32.4 041 36.9 11 09.9 23 20.7 111 100 2.8 Extension workers 018 29.5 027 44.3 06 09.8 10 16.4 061 100 2.9 Farmer leaders and
community leaders 016 19.3 027 32.5 25 30.1 15 18.1 083 100 2.5
Journalists 008 22.9 012 34.3 07 20.0 08 22.9 035 100 2.6 Policy makers 005 15.2 010 30.3 07 21.2 11 33.3 033 100 2.3 Religious leaders 013 37.1 010 28.6 03 08.6 09 25.7 035 100 2.8 Scientists 011 31.4 018 51.4 04 11.4 02 05.7 035 100 3.1
Total 116 26.8 159 36.7 66 15.2 92 21.3 433 100 *Some respondents gave no answer
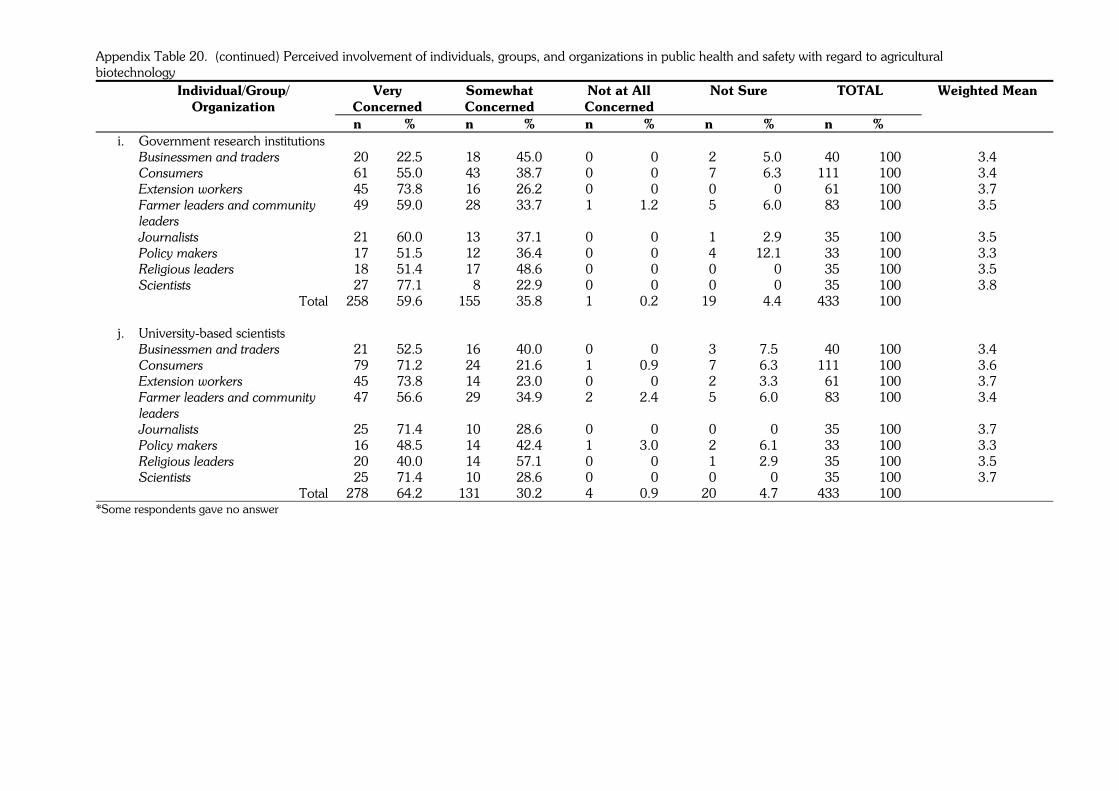
Appendix Table 20. (continued) Perceived involvement of individuals, groups, and organizations in public health and safety with regard to agricultural biotechnology
Very Concerned
Somewhat Concerned
Not at All Concerned
Not Sure TOTAL
Weighted Mean
Individual/Group/ Organization
n % n % n % n % n % i. Government research institutions Businessmen and traders 020 22.5 018 45.0 0 0.0 02 05.0 040 100 3.4 Consumers 061 55.0 043 38.7 0 0.0 07 06.3 111 100 3.4 Extension workers 045 73.8 016 26.2 0 0.0 00 00.0 061 100 3.7 Farmer leaders and community
leaders 049 59.0 028 33.7 1 1.2 05 06.0 083 100 3.5
Journalists 021 60.0 013 37.1 0 0.0 01 02.9 035 100 3.5 Policy makers 017 51.5 012 36.4 0 0.0 04 12.1 033 100 3.3 Religious leaders 018 51.4 017 48.6 0 0.0 00 00.0 035 100 3.5 Scientists 027 77.1 008 22.9 0 0.0 00 00.0 035 100 3.8 Total 258 59.6 155 35.8 1 0.2 19 04.4 433 100
j. University-based scientists Businessmen and traders 021 52.5 016 40.0 0 0.0 03 7.5 040 100 3.4 Consumers 079 71.2 024 21.6 1 0.9 07 6.3 111 100 3.6 Extension workers 045 73.8 014 23.0 0 0.0 02 3.3 061 100 3.7 Farmer leaders and community
leaders 047 56.6 029 34.9 2 2.4 05 6.0 083 100 3.4
Journalists 025 71.4 010 28.6 0 0.0 00 0.0 035 100 3.7 Policy makers 016 48.5 014 42.4 1 3.0 02 6.1 033 100 3.3 Religious leaders 020 40.0 014 57.1 0 0.0 01 2.9 035 100 3.5 Scientists 025 71.4 010 28.6 0 0.0 00 0.0 035 100 3.7
Total 278 64.2 131 30.2 4 0.9 20 4.7 433 100 *Some respondents gave no answer
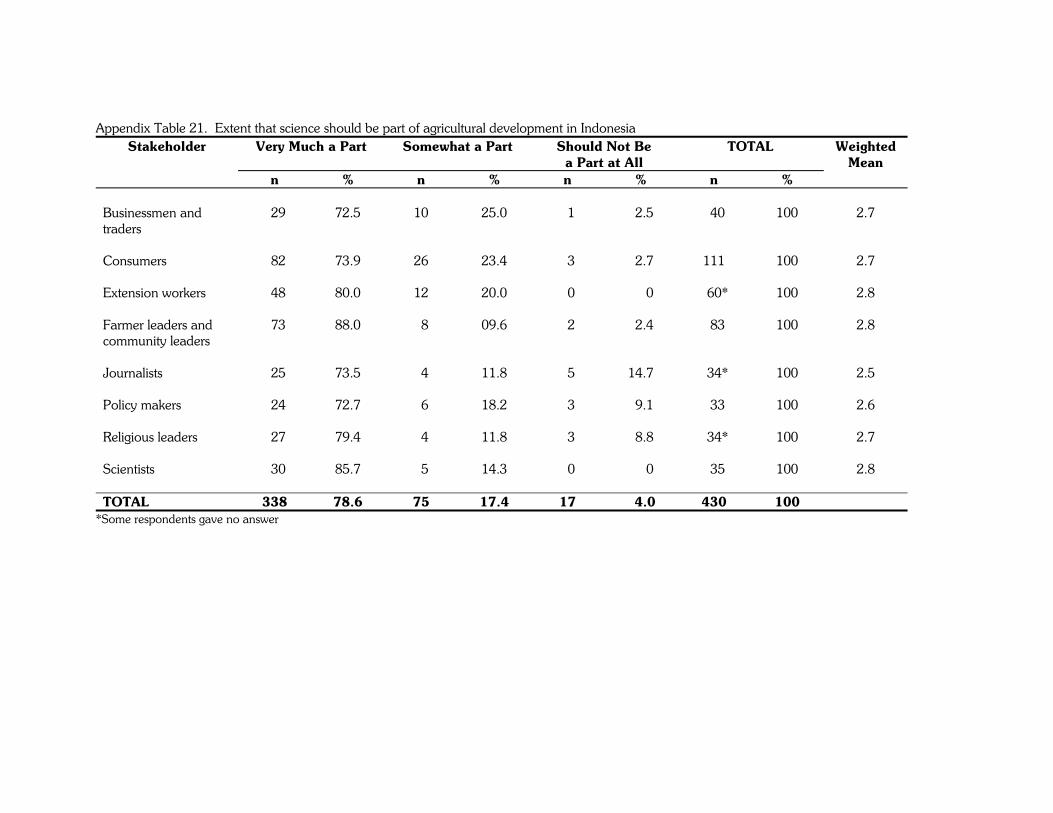
Appendix Table 21. Extent that science should be part of agricultural development in Indonesia Very Much a Part Somewhat a Part Should Not Be
a Part at All TOTAL Weighted
Mean Stakeholder
n % n % n % n % Businessmen and traders
029 72.5 10 25.0 01 02.5 040 100 2.7
Consumers 082 73.9 26 23.4 03 02.7 111 100 2.7 Extension workers 048 80.0 12 20.0 00 00.0 060* 100 2.8 Farmer leaders and community leaders
073 88.0 08 09.6 02 02.4 083 100 2.8
Journalists 025 73.5 04 11.8 05 14.7 034* 100 2.5 Policy makers 024 72.7 06 18.2 03 09.1 033 100 2.6 Religious leaders 027 79.4 04 11.8 03 08.8 034* 100 2.7 Scientists 030 85.7 05 14.3 00 00.0 035 100 2.8 TOTAL 338 78.6 75 17.4 17 04.0 430 100
*Some respondents gave no answer
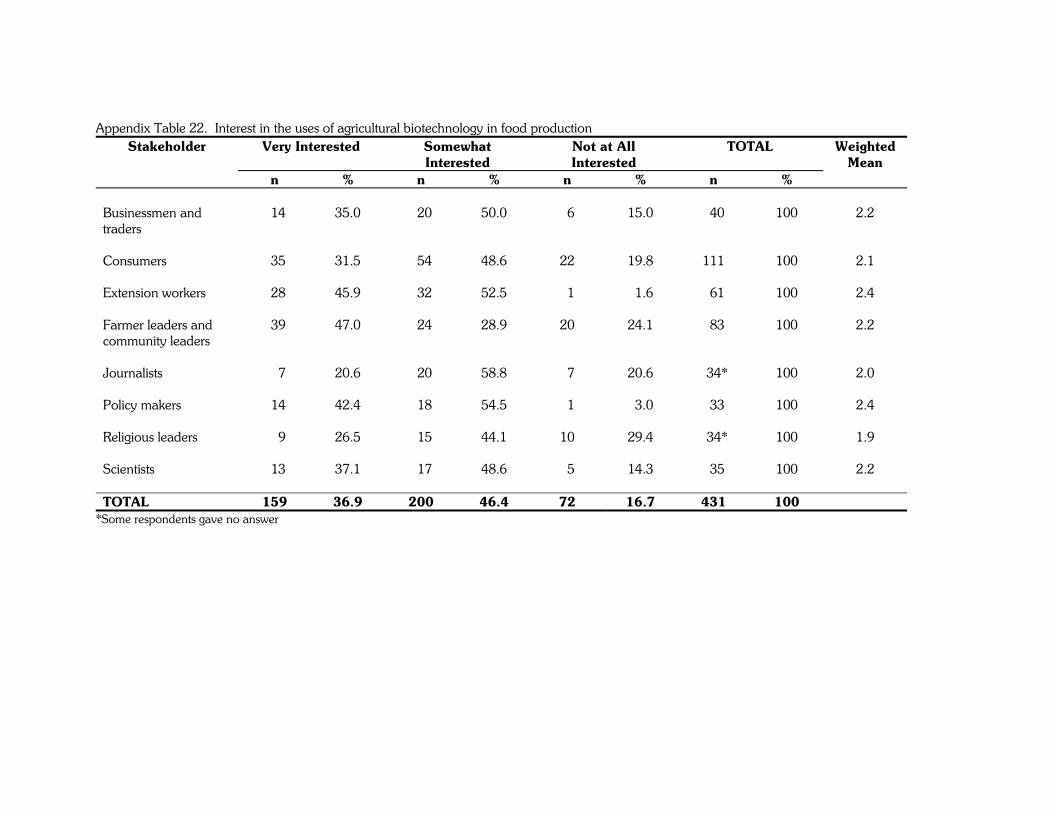
Appendix Table 22. Interest in the uses of agricultural biotechnology in food production Very Interested Somewhat
Interested Not at All Interested
TOTAL Weighted Mean
Stakeholder
n % n % n % n % Businessmen and traders
014 35.0 020 50.0 06 15.0 040 100 2.2
Consumers 035 31.5 054 48.6 22 19.8 111 100 2.1 Extension workers 028 45.9 032 52.5 01 01.6 061 100 2.4 Farmer leaders and community leaders
039 47.0 024 28.9 20 24.1 083 100 2.2
Journalists 007 20.6 020 58.8 07 20.6 034* 100 2.0 Policy makers 014 42.4 018 54.5 01 03.0 033 100 2.4 Religious leaders 009 26.5 015 44.1 10 29.4 034* 100 1.9 Scientists 013 37.1 017 48.6 05 14.3 035 100 2.2 TOTAL 159 36.9 200 46.4 72 16.7 431 100
*Some respondents gave no answer
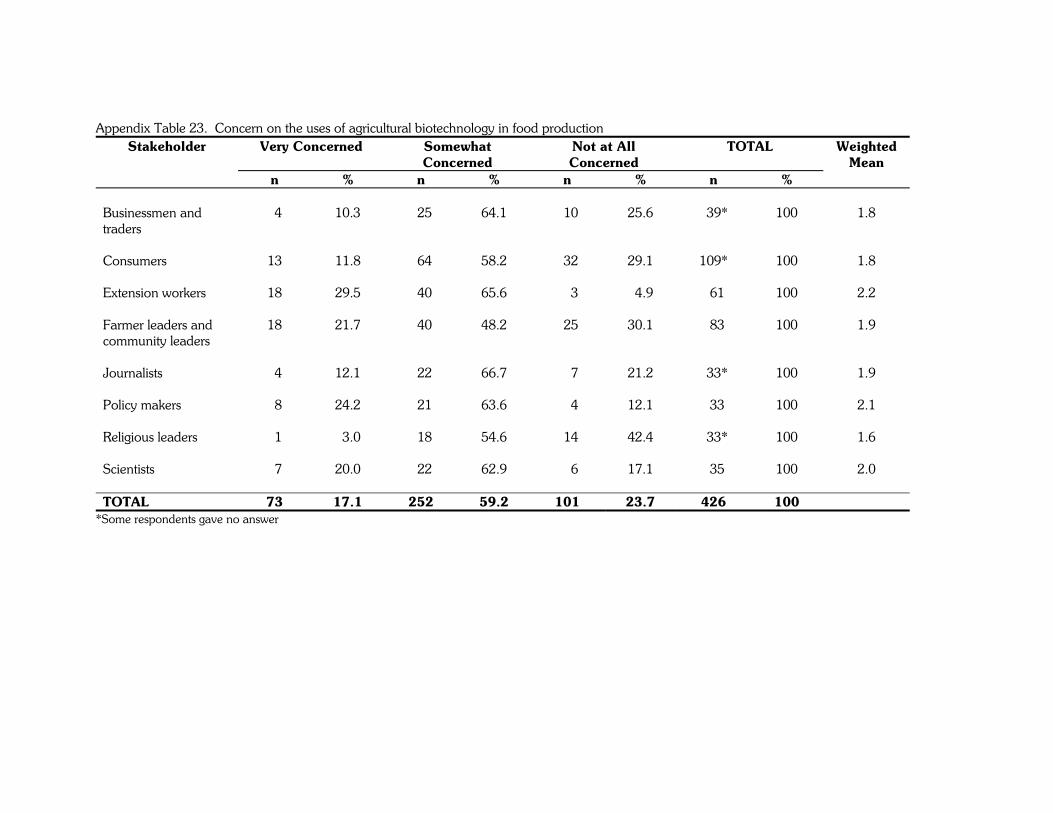
Appendix Table 23. Concern on the uses of agricultural biotechnology in food production Very Concerned Somewhat
Concerned Not at All Concerned
TOTAL Weighted Mean
Stakeholder
n % n % n % n % Businessmen and traders
04 10.3 025 64.1 010 25.6 039* 100 1.8
Consumers 13 11.8 064 58.2 032 29.1 109* 100 1.8 Extension workers 18 29.5 040 65.6 003 04.9 061 100 2.2 Farmer leaders and community leaders
18 21.7 040 48.2 025 30.1 083 100 1.9
Journalists 04 12.1 022 66.7 007 21.2 033* 100 1.9 Policy makers 08 24.2 021 63.6 004 12.1 033 100 2.1 Religious leaders 01 03.0 018 54.6 014 42.4 033* 100 1.6 Scientists 07 20.0 022 62.9 006 17.1 035 100 2.0 TOTAL 73 17.1 252 59.2 101 23.7 426 100
*Some respondents gave no answer
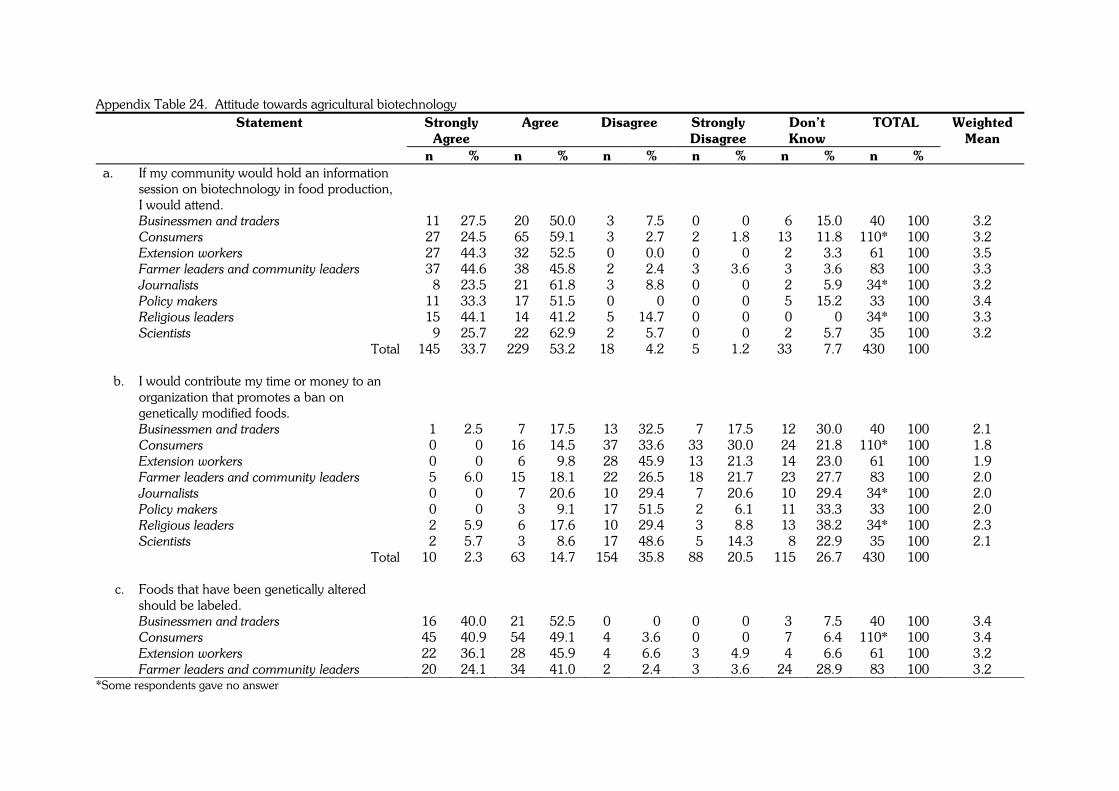
Appendix Table 24. Attitude towards agricultural biotechnology Strongly
Agree Agree Disagree Strongly
Disagree Don’t Know
TOTAL
Weighted Mean
Statement
n % n % n % n % n % n % a. If my community would hold an information
session on biotechnology in food production, I would attend.
Businessmen and traders 011 27.5 020 50.0 03 07.5 0 0.0 06 15.0 040 100 3.2 Consumers 027 24.5 065 59.1 03 02.7 2 1.8 13 11.8 110* 100 3.2 Extension workers 027 44.3 032 52.5 00 00.0 0 0.0 02 03.3 061 100 3.5 Farmer leaders and community leaders 037 44.6 038 45.8 02 02.4 3 3.6 03 03.6 083 100 3.3 Journalists 008 23.5 021 61.8 03 08.8 0 0.0 02 05.9 034* 100 3.2 Policy makers 011 33.3 017 51.5 00 00.0 0 0.0 05 15.2 033 100 3.4 Religious leaders 015 44.1 014 41.2 05 14.7 0 0.0 00 00.0 034* 100 3.3 Scientists 009 25.7 022 62.9 02 05.7 0 0.0 02 05.7 035 100 3.2 Total 145 33.7 229 53.2 18 04.2 5 1.2 33 07.7 430 100
b. I would contribute my time or money to an organization that promotes a ban on genetically modified foods.
Businessmen and traders 01 2.5 07 17.5 013 32.5 07 17.5 012 30.0 040 100 2.1 Consumers 00 0.0 16 14.5 037 33.6 33 30.0 024 21.8 110* 100 1.8 Extension workers 00 0.0 06 09.8 028 45.9 13 21.3 014 23.0 061 100 1.9 Farmer leaders and community leaders 05 6.0 15 18.1 022 26.5 18 21.7 023 27.7 083 100 2.0 Journalists 00 0.0 07 20.6 010 29.4 07 20.6 010 29.4 034* 100 2.0 Policy makers 00 0.0 03 09.1 017 51.5 02 06.1 011 33.3 033 100 2.0 Religious leaders 02 5.9 06 17.6 010 29.4 03 08.8 013 38.2 034* 100 2.3 Scientists 02 5.7 03 08.6 017 48.6 05 14.3 008 22.9 035 100 2.1 Total 10 2.3 63 14.7 154 35.8 88 20.5 115 26.7 430 100
c. Foods that have been genetically altered should be labeled.
Businessmen and traders 16 40.0 21 52.5 0 0.0 0 0.0 03 07.5 040 100 3.4 Consumers 45 40.9 54 49.1 4 3.6 0 0.0 07 06.4 110* 100 3.4 Extension workers 22 36.1 28 45.9 4 6.6 3 4.9 04 06.6 061 100 3.2 Farmer leaders and community leaders 20 24.1 34 41.0 2 2.4 3 3.6 24 28.9 083 100 3.2
*Some respondents gave no answer
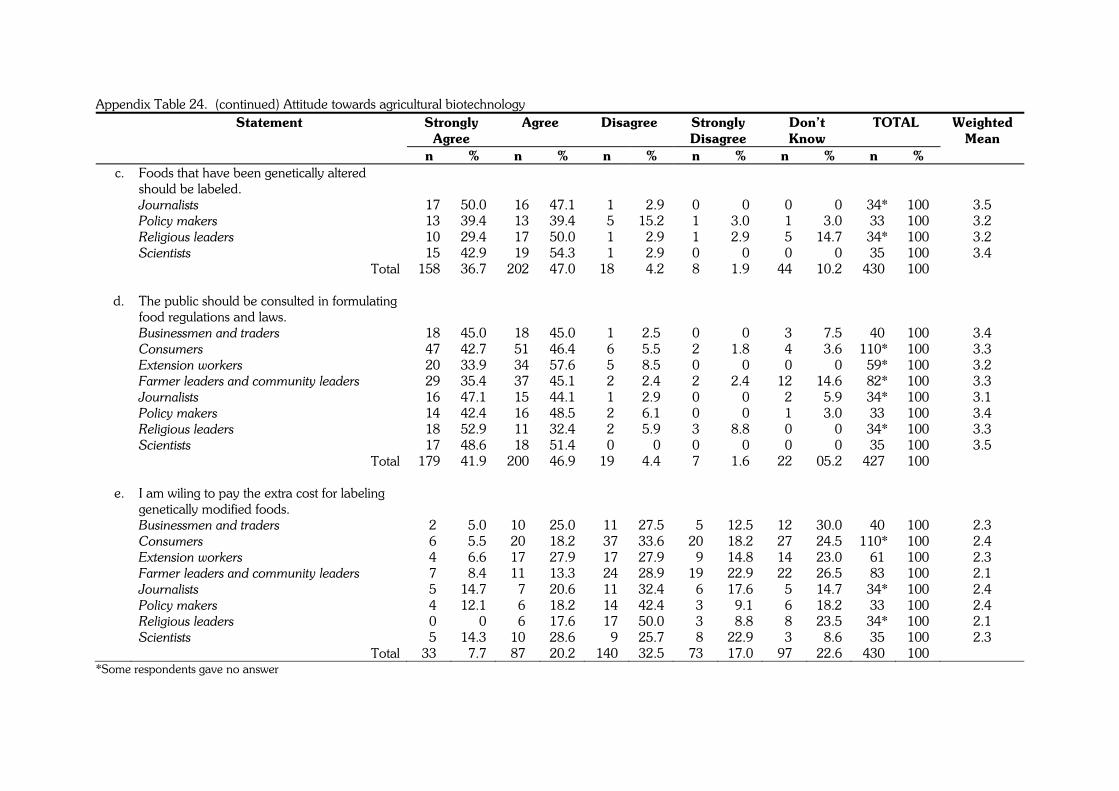
Appendix Table 24. (continued) Attitude towards agricultural biotechnology
Strongly Agree
Agree Disagree Strongly Disagree
Don’t Know
TOTAL
Weighted Mean
Statement
n % n % n % n % n % n % c. Foods that have been genetically altered
should be labeled.
Journalists 017 50.0 016 47.1 01 02.9 0 0.0 00 00.0 034* 100 3.5 Policy makers 013 39.4 013 39.4 05 15.2 1 3.0 01 03.0 033 100 3.2 Religious leaders 010 29.4 017 50.0 01 02.9 1 2.9 05 14.7 034* 100 3.2 Scientists 015 42.9 019 54.3 01 02.9 0 0.0 00 00.0 035 100 3.4 Total 158 36.7 202 47.0 18 04.2 8 1.9 44 10.2 430 100
d. The public should be consulted in formulating food regulations and laws.
Businessmen and traders 018 45.0 018 45.0 01 2.5 0 0.0 03 07.5 040 100 3.4 Consumers 047 42.7 051 46.4 06 5.5 2 1.8 04 03.6 110* 100 3.3 Extension workers 020 33.9 034 57.6 05 8.5 0 0.0 00 00.0 059* 100 3.2 Farmer leaders and community leaders 029 35.4 037 45.1 02 2.4 2 2.4 12 14.6 082* 100 3.3 Journalists 016 47.1 015 44.1 01 2.9 0 0.0 02 05.9 034* 100 3.1 Policy makers 014 42.4 016 48.5 02 6.1 0 0.0 01 03.0 033 100 3.4 Religious leaders 018 52.9 011 32.4 02 5.9 3 8.8 00 00.0 034* 100 3.3 Scientists 017 48.6 018 51.4 00 0.0 0 0.0 00 00.0 035 100 3.5 Total 179 41.9 200 46.9 19 4.4 7 1.6 22 05.2 427 100
e. I am wiling to pay the extra cost for labeling genetically modified foods.
Businessmen and traders 02 05.0 10 25.0 011 27.5 05 12.5 12 30.0 040 100 2.3 Consumers 06 05.5 20 18.2 037 33.6 20 18.2 27 24.5 110* 100 2.4 Extension workers 04 06.6 17 27.9 017 27.9 09 14.8 14 23.0 061 100 2.3 Farmer leaders and community leaders 07 08.4 11 13.3 024 28.9 19 22.9 22 26.5 083 100 2.1 Journalists 05 14.7 07 20.6 011 32.4 06 17.6 05 14.7 034* 100 2.4 Policy makers 04 12.1 06 18.2 014 42.4 03 09.1 06 18.2 033 100 2.4 Religious leaders 00 00.0 06 17.6 017 50.0 03 08.8 08 23.5 034* 100 2.1 Scientists 05 14.3 10 28.6 009 25.7 08 22.9 03 08.6 035 100 2.3 Total 33 07.7 87 20.2 140 32.5 73 17.0 97 22.6 430 100
*Some respondents gave no answer
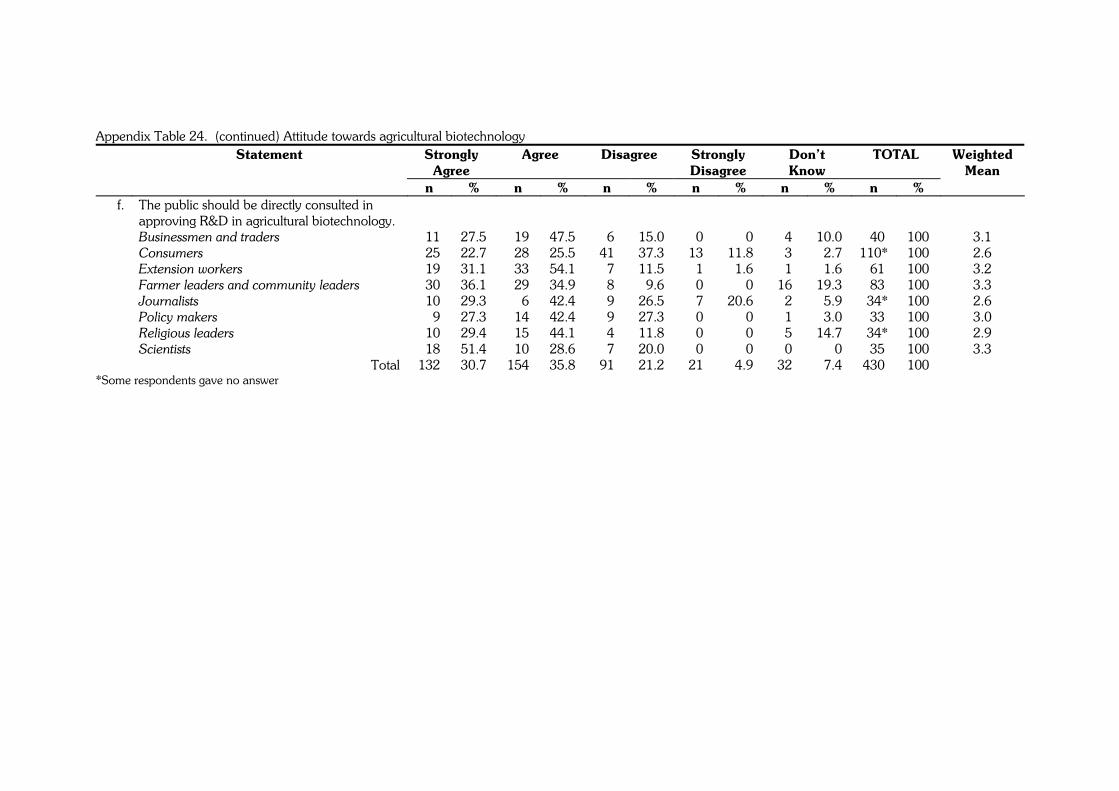
Appendix Table 24. (continued) Attitude towards agricultural biotechnology
Strongly Agree
Agree Disagree Strongly Disagree
Don’t Know
TOTAL
Weighted Mean
Statement
n % n % n % n % n % n % f. The public should be directly consulted in
approving R&D in agricultural biotechnology.
Businessmen and traders 011 27.5 019 47.5 06 15.0 00 00.0 04 10.0 040 100 3.1 Consumers 025 22.7 028 25.5 41 37.3 13 11.8 03 02.7 110* 100 2.6 Extension workers 019 31.1 033 54.1 07 11.5 01 01.6 01 01.6 061 100 3.2 Farmer leaders and community leaders 030 36.1 029 34.9 08 09.6 00 00.0 16 19.3 083 100 3.3 Journalists 010 29.3 006 42.4 09 26.5 07 20.6 02 05.9 034* 100 2.6 Policy makers 009 27.3 014 42.4 09 27.3 00 00.0 01 03.0 033 100 3.0 Religious leaders 010 29.4 015 44.1 04 11.8 00 00.0 05 14.7 034* 100 2.9 Scientists 018 51.4 010 28.6 07 20.0 00 00.0 00 00.0 035 100 3.3 Total 132 30.7 154 35.8 91 21.2 21 04.9 32 07.4 430 100
*Some respondents gave no answer
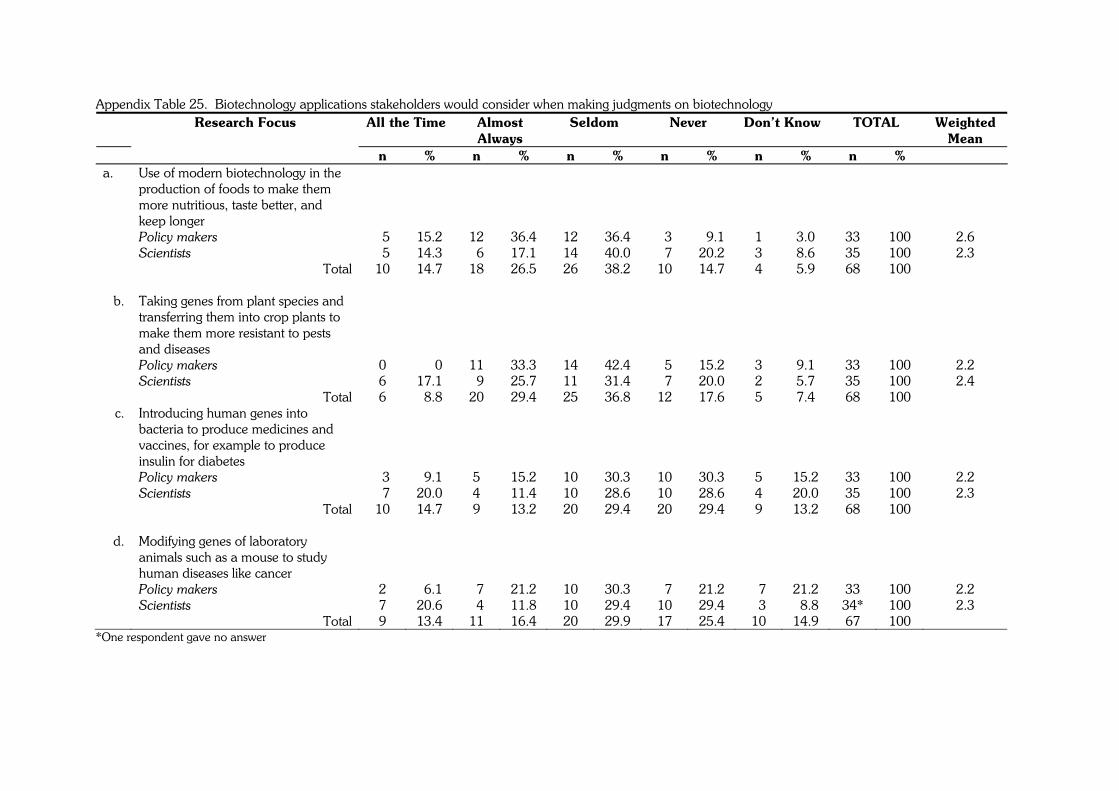
Appendix Table 25. Biotechnology applications stakeholders would consider when making judgments on biotechnology All the Time Almost
Always Seldom Never Don’t Know TOTAL Weighted
Mean
Research Focus
n % n % n % n % n % n % a. Use of modern biotechnology in the
production of foods to make them more nutritious, taste better, and keep longer
Policy makers 05 15.2 12 36.4 12 36.4 03 09.1 1 3.0 33 100 2.6 Scientists 05 14.3 06 17.1 14 40.0 07 20.2 3 8.6 35 100 2.3 Total 10 14.7 18 26.5 26 38.2 10 14.7 4 5.9 68 100
b. Taking genes from plant species and transferring them into crop plants to make them more resistant to pests and diseases
Policy makers 0 00.0 11 33.3 14 42.4 05 15.2 3 9.1 33 100 2.2 Scientists 6 17.1 09 25.7 11 31.4 07 20.0 2 5.7 35 100 2.4 Total 6 08.8 20 29.4 25 36.8 12 17.6 5 7.4 68 100
c. Introducing human genes into bacteria to produce medicines and vaccines, for example to produce insulin for diabetes
Policy makers 03 09.1 5 15.2 10 30.3 10 30.3 5 15.2 33 100 2.2 Scientists 07 20.0 4 11.4 10 28.6 10 28.6 4 20.0 35 100 2.3 Total 10 14.7 9 13.2 20 29.4 20 29.4 9 13.2 68 100
d. Modifying genes of laboratory animals such as a mouse to study human diseases like cancer
Policy makers 2 06.1 07 21.2 10 30.3 07 21.2 07 21.2 33 100 2.2 Scientists 7 20.6 04 11.8 10 29.4 10 29.4 03 08.8 34* 100 2.3 Total 9 13.4 11 16.4 20 29.9 17 25.4 10 14.9 67 100
*One respondent gave no answer
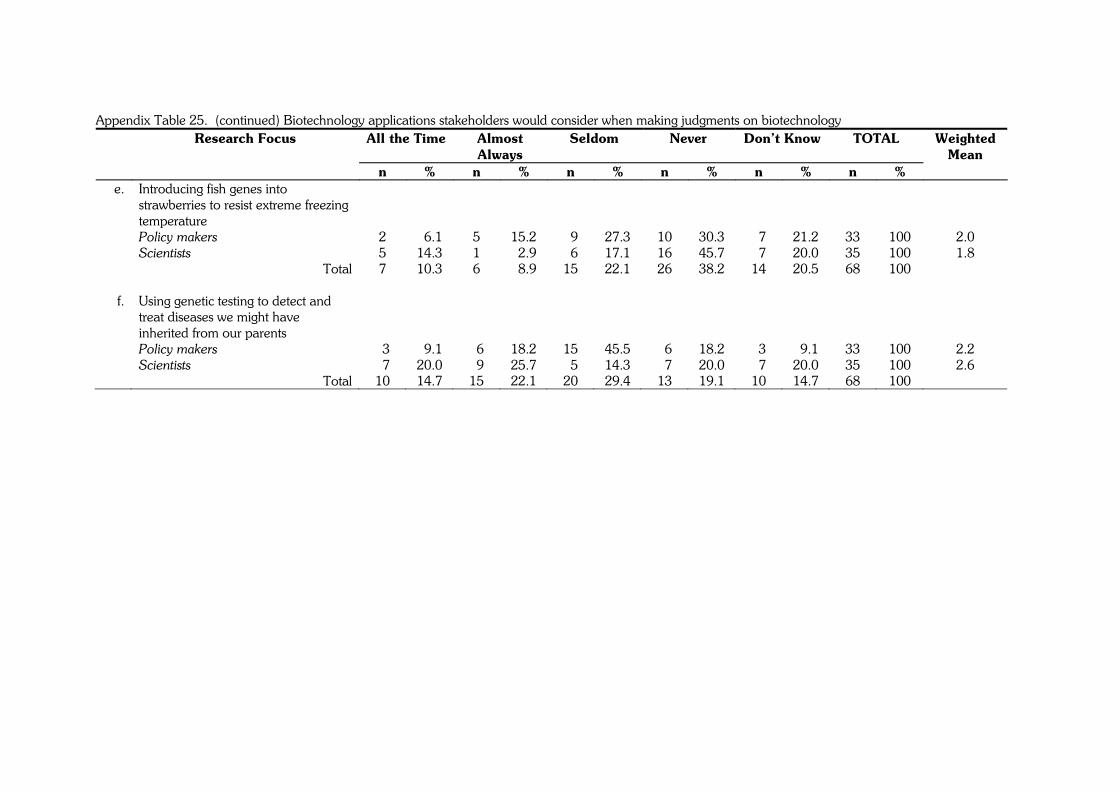
Appendix Table 25. (continued) Biotechnology applications stakeholders would consider when making judgments on biotechnology
All the Time Almost Always
Seldom Never Don’t Know TOTAL Weighted Mean
Research Focus
n % n % n % n % n % n % e. Introducing fish genes into
strawberries to resist extreme freezing temperature
Policy makers 2 06.1 5 15.2 09 27.3 10 30.3 07 21.2 33 100 2.0 Scientists 5 14.3 1 02.9 06 17.1 16 45.7 07 20.0 35 100 1.8 Total 7 10.3 6 08.9 15 22.1 26 38.2 14 20.5 68 100
f. Using genetic testing to detect and treat diseases we might have inherited from our parents
Policy makers 03 09.1 06 18.2 15 45.5 06 18.2 03 09.1 33 100 2.2 Scientists 07 20.0 09 25.7 05 14.3 07 20.0 07 20.0 35 100 2.6 Total 10 14.7 15 22.1 20 29.4 13 19.1 10 14.7 68 100
RESEARCHTEAM College of Development Communication University of the Philippines Los Baños
Lead Researcher: CleofeS.Torres Associate Professor
Researchers: Ma.TheresaH.Velasco Professor MariaCelesteH.Cadiz Dean and Associate Professor RhodoraRamonetteM.deVilla Instructor
Editor: SerlieB.Jamias
Translator: Ines Vivian D. Domingo Statistician: MarianoB.deRamos
Encoder: NiloB.Argañosa
Research Assistants: LailaM.Garcia ElisaS.Banasihan WinifredoB.Dagli MarieCddyqaJayaG.Rogel
Administrative BernabeM.Remoquillo Support Staff: RomeoC.Estimado