Embed Size (px)
Citation preview

PUBLIC TRANSPORT: FUNDING AND
SUBSIDISATION
Presentation to Southern African Bus Operators Association Conference
Presenter: Ulrike Rwida | Public Finance, National Treasury | 4 March 2015

Outline
• What do we know – Results from the National Household Travel Survey
– Findings in the Public Transport Infrastructure and Systems Expenditure and Performance Review
• Where we are – Allocations for public transport
– Allocations vs. ridership
– Public transport operations performance
• Where do we need to go – Institutional arrangements
– Allocative efficiency
1

Household vehicle ownership
3
• 71 per cent of households do not
own a working car/bakkie/station
wagon
• Car ownership higher among high
income households
• Car ownership rates in Western Cape
(44% of HHs) and Gauteng (39% of
HHs) higher than national average
• All other provinces below national
average, with ownership in Eastern
Cape the lowest (18% of HHs)
Source: Statistics South Africa, 2013

Main transport mode to educational
institution
4
Source: Statistics South Africa, 2013

Main transport mode to work
5
Source: Statistics South Africa, 2013

Public Transport Usage
6
0%
10%
20%
30%
40%
50%
60%
70%
80%
90%
100%
Western Cape Eastern Cape Northern Cape Free State KwaZulu Natal North West Gauteng Mpumalanga Limpopo
Bus Metrorail BRT/IRT Minibus Taxi
Source: Statistics South Africa, 2013

Time taken to work by mode
7
Source: Statistics South Africa, 2013

Public Transport usage by annual income
• Less than R12 000
– 11% of bus commuters
– 0% of BRT commuters
– 8% of metrorail
commuters
– 21% of minibus taxi
commuters
• Less than R72 000
– 80% of bus commuters
– 63% of BRT commuters
– 82% of metrorail
commuters
– 79% of minibus taxi
commuters
8
Source: Statistics South Africa, 2013

Demand for public transport
Where
9
Source: National Treasury and Department of Planning,
Monitoring and Evaluation, 2014
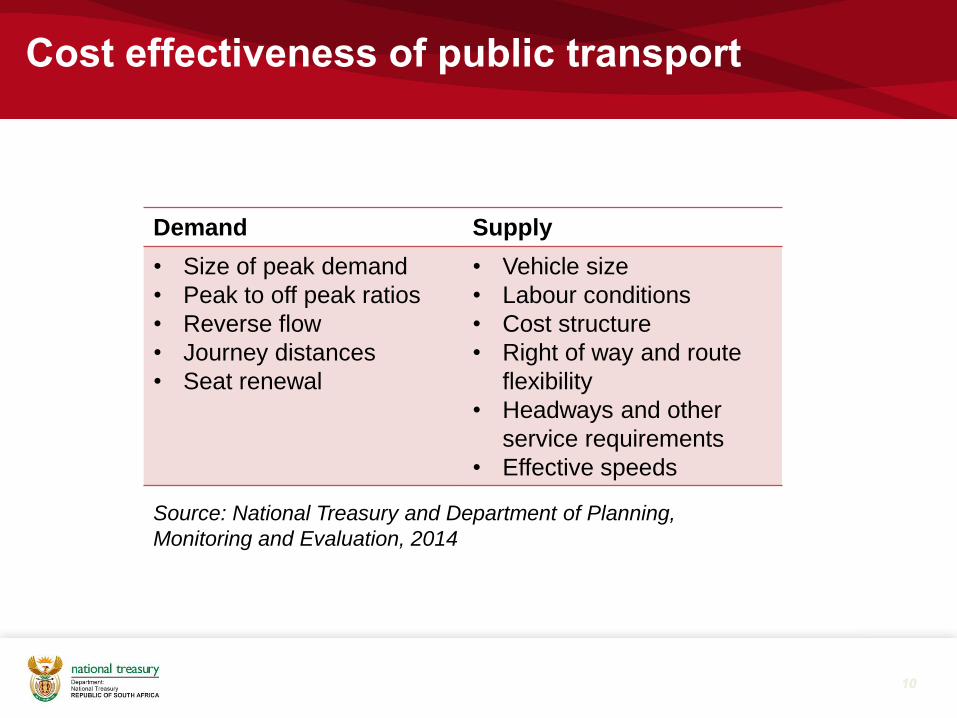
Cost effectiveness of public transport
10
Demand Supply
• Size of peak demand
• Peak to off peak ratios
• Reverse flow
• Journey distances
• Seat renewal
• Vehicle size
• Labour conditions
• Cost structure
• Right of way and route
flexibility
• Headways and other
service requirements
• Effective speeds
Source: National Treasury and Department of Planning,
Monitoring and Evaluation, 2014

Impact of changes in demand on cost
effectiveness
11
Source: National Treasury and Department of Planning,
Monitoring and Evaluation, 2014

Impact of supply on cost effectiveness
Vehicle size
Labour conditions
Headways and other service
requirements
Right of way and route flexibility
Effective speeds
Relationship between fixed and variable
costs
Other factors
12
Source: National Treasury and Department of Planning
Monitoring and Evaluation, 2014

Public transport expenditure
13
Source: National Treasury, 2014

Allocations (2014/15) vs. ridership
14
Source: National Treasury, 2014, Statistics South Africa, 2013

Bus subsidies performance
15
March 2014 Mpumalanga Gauteng Eastern Cape Free State
KwaZulu
Natal North West
Western
Cape
Northern
Cape Limpopo
National
Average
Number of vehicles subsidised 567 2 370 291 257 1 270 84 1 046 32 390 6 307
Number of routes subsidised 154 2 868 1 289 234 1 656 133 2 419 21 964 9 738
Subsidy/vehicle 69 409.89 63 822.56 31 134.33 67 154.80 63 430.96 78 281.16 56 146.09 136 909.01 50 871.76 61 363.02
Subsidy/kilometre operated 17.11 18.45 17.65 17.51 23.38 16.94 19.32 74.76 13.97 24.34
Passengers/trip operated 73.72 40.32 42.21 75.12 61.38 41.56 46.66 33.22 83.35 55.28
Trips per vehicle 123.43 69.21 71.18 83.92 76.90 97.11 105.05 48.44 78.98 86.52
Passenger revenue/kilometre 31.62 9.27 14.91 16.32 11.73 8.44 17.02 11.47 11.79 14.73
Passenger revenue/subsidy 1.85 0.50 0.84 0.93 0.50 0.50 0.88 0.15 0.84 0.61
Source: Department of Transport, 2014

PTOG allocations in 2014/15 vs. ridership
16
No Passengers Percent Allocation Percent
Eastern Cape 97 169 5% 195 282 4%
Free State 80 369 4% 215 900 4%
Gauteng 428 192 21% 1 819 854 38%
KwaZulu Natal 349 756 17% 904 783 19%
Limpopo 219 373 11% 291 852 6%
Mpumalanga 363 272 18% 491 418 10%
Northern Cape 38 151 2% 43 937 1%
North West 210 309 10% 90 318 2%
Western Cape 242 808 12% 779 365 16%
Total 2 029 399 100% 4 832 709 100%
Source: National Treasury, 2014, Statistics South Africa, 2013

Implications for public transport
subsidisation
• Public transport demand is characterised by:
– Long trip distances
– Uni-directional “line-haul” flow
– High peak demand and low off peak demand
• National Development Plan and IUDF
– Linking transport and land-use
• The right densities and land uses for more financially viable public transport
• Public Transport Strategy
– Aligning bus services to Integrated Public Transport Networks
17
Public Goods
Private Goods
Access Mobility

Institutional arrangements
• Aligning bus subsidy routes to Public Transport Strategy
• Through the devolution of public transport regulation in terms of the
National Land Transport Act
• Providing certainty to
operators
– Entering into negotiated
contracts as per the NLTA
– Changing payment method in
areas where IPTN not
finalised
– Negotiate/tender services
outside IPTN
– Last resort to reduce
services
18
0
5
10
15
20
25
30
35
40
Bus Contracts as at 31 December 2014
Interim Negotiated Tendered

Towards allocative efficiency
Subsidising modes/services
that are currently used
Subsidising services where the people are
Aligning modes/services
to need
Tension between
access and mobility
Assigning functions to appropriate
authority
19
Need for
operational
subsidy policy to
improve equity
(access) and
efficiency
(mobility)

Thank you
20