Embed Size (px)
Citation preview
Public Spending and Poverty Reduction in Nigeria: A Benefit Incidence Analysis
in Education and HealthBy
Uzochukwu AmakomDepartment of Economics Nnamdi Azikiwe University
Awka, Nigeria
AERC Research Paper 254African Economic Research Consortium, Nairobi
January 2013
THIS RESEARCH STUDY was supported by a grant from the African Economic Research Consortium. The findings, opinions and recommendations are those of the author, however, and do not necessarily reflect the views of the Consortium, its indi-vidual members or the AERC Secretariat.
Published by: The African Economic Research Consortium P.O. Box 62882 – City Square Nairobi 00200, Kenya
Printed by: Modern Lithographic (K) Ltd P.O. Box 52810 – City Square Nairobi 00200, Kenya
ISBN 978-9966-023-31-5
© 2013, African Economic Research Consortium.
ContentsList of tablesList of figuresAbstractList of abbreviations and acronyms
1. Introduction 1
2. Literature review 6
3. Theoretical framework and methodology 19
4. Results, findings and discussion 29
5. Conclusions and policy implications 46
Notes 48
References 51
Annexes 55

List of tables1.1: Basic social and poverty indicators across region and location in Nigeria 22.1: Summary of selected empirical expenditure incidences across the globe 84.1: Usage of education and healthcare facilities by quintiles, type (public/private) & location 304.2: Average benefit incidence by quintile per social service (N) 314.3: Average benefit by location per social service (N) 344.4: Dominance results for social services (education and healthcare) relative to the Lorenz curve and the 45-degrees line in Nigeria 39
A1: Average education and healthcare benefit for regions by quintiles (N) 55A2: Average education benefit for states by quintiles (N) 56A3: Average healthcare benefit for states by quintiles (N) 58A4: Two-Way ANOVA – Education BIA (national) 60A5: Two-Way ANOVA – Healthcare BIA (national) 60A6: Two-Way ANOVA – Education and healthcare by location (Rural/Urban) 60A7: Two-Way ANOVA – Education BIA by states 61A8: Two-Way ANOVA – Healthcare BIA by states 61A9: Two-Way ANOVA – Education BIA by zones 61A10: Two-Way ANOVA – Healthcare BIA by zones 61

List of figures4.1: Concentration curves for education by gender in Nigeria 334.2: Concentration curves for healthcare by gender in Nigeria 334.3: Concentration curves for primary education and healthcare in Nigeria 384.4: Concentration curves for secondary education and healthcare in Nigeria 384.5: Concentration curves for tertiary education and healthcare in Nigeria 39

AbstractOne of the functions that people usually expect a government to perform is to reduce inequality and poverty, and public spending is one way a policy maker works towards achieving such important task. Education and healthcare provision have been suggested as key sectors that help every policy maker achieve the above objective. The study evaluated public spending efforts in reducing inequality and poverty at all levels of these two sectors using the Benefit Incidence Analysis (BIA) in Nigeria. Findings from the study suggest that primary education and healthcare were more pro-poor in absolute terms than tertiary education and healthcare. Secondary education and healthcare reveal mixed results, while the findings suggests state, regional (geopolitical), location and gender biases in benefits from public spending for both education and healthcare. The study findings have an implication that income redistribution may be effected through subsidized government services, rather than through direct income or consumption transfers.
List of abbreviations and acronymsAIAE African Institute for Applied Economics AERC African Economic Research Consortium ANOVA Analysis of Variance ASUU Academic Staff Union of Universities BIA Benefit Incidence AnalysisCBN Central Bank of Nigeria EFA Education For All FCT Federal Capital Territory FEAP Family Economic Advancement ProgrammeFMH Federal Ministry of HealthGDP Gross Domestic ProductHDI Human Development IndexHMB Hospital Management Board HND Higher National Diploma JAMB Joint Admissions and Matriculation Board JS Junior Secondary LGAs Local Government Areas MDGs Millennium Development Goals NBS National Bureau of StatisticsNBTE National Board for Technical EducationNCCoE National Commission for Colleges of Education NCE Nigeria Certificate in Education NCML National Commission for Mass Literacy ND National Diploma NEEDS National Economic Empowerment and Development Strategy NEMA National Emergency Management Agency NHIS National Health Insurance Scheme NISER Nigerian Institute of Social and Economic ResearchNLSS Nigerian Living Standard Survey NUC Nigerian University Commission PETS Public Expenditure Tracking SurveyPHDA Primary Healthcare Development Agency PPSMB Post-Primary School Management Board PSM Propensity Score MatchingRBM Roll Back Malaria

SAP Structural Adjustment Programme SEEDS State Economic Empowerment and Development StrategySS Senior Secondary SSA Sub-Saharan AfricaSSCE Senior Secondary Certificate ExaminationSUBEB States Universal Basic Education BoardUBE Universal Basic EducationUBEC Universal Basic Education Commission UNDP United Nations Development ProgrammeUPE Universal Primary Education USA United States of AmericaVAT Value Added Tax WHO World Health Organisation WHR World Health Report
Public SPending and Poverty reduction in nigeria
1
1. Introduction
The state, in promoting development functions, acts as the provider of goods and services in some areas and plays the role of a facilitator towards private sector enhancement and development in other areas. By so doing, it undertakes
expenditures to pursue a variety of economic, social and political goals which include poverty alleviation, reduction in inequality and creating an enabling environment for the private sector. In support of the above, Sahn and Younger (2000) opined that, two functions that people routinely expect a government to perform are to reduce both inequality and poverty. This implies that poverty reduction may not be enough unless there is a corresponding reduction in inequality. Besides the targeted programmes of food and housing subsidies, investment in the form of public expenditure that increases access to, and provision of, basic social services like education and healthcare is central to increasing the welfare of the poor.
According to Heltberg et al. (2003), reduction in poverty and inequality usually requires a combination of well distributed economic growth and increased investment in human capital, especially among the poor. Two key areas for such investment are education and health, both sectors in which the state is the major service provider. If it is believed that investment in education and healthcare helps to improve the welfare of the poor, then there is a need to look at who is benefiting from such spending for equity reasons. The incidence of public spending is crucial for efficient targeting which has become increasingly important in the current era of macroeconomic reforms as most governments are under pressure to reduce their total expenditure due to growing deficits. It is also equally important because if not well-targeted, such spending may not be able to achieve its goals; hence, for this challenge to be met, policy makers need information on the structure of the sector and its financing. Such information provides a basis for the understanding of the government’s financial operations that will contribute to the goals of resource usage and fairly balance spread of budget allocation among sectors, locations, states, regions as wells as gender.
Shenggen et al. (1999) argued that government spending can have direct and indirect effects on people’s welfare in three ways such as the macroeconomic effects (inflation and unemployment), the primary income effect (the expenditure incidence), and the transfer effect (the benefit incidence). It is also believed that public expenditure can have a direct impact on human development outcomes. According to Demery (2000), public spending is expected to create other incomes directly, some of which are expected to benefit poor households and these incomes in turn create other incomes through the income-expenditure multiplier process. Such spending generates transfers to the population either
2 ReseaRch PaPeR 254
in the form of cash or monetary transfers, social assistance1 or social insurance payments or in kind payments if spending is progressive2 and otherwise if regressive.
Progressive monetary or cash transfers, through public expenditure, can help reduce income inequality through its redistribution process. In support of this believe, Ajawd and Wodon (2001) maintained that if public spending gets to the richer households before reaching the poorer households, especially if there are some level saturation in the services that can be provided to the rich, then the poor may benefit more from an increase in spending than from the existing level of spending. Spending in social services like education and health care is generally considered as a redistributive or anti-poverty policy instrument in developing countries (Bourguignon et al., 2003; Luiz et al., 2002). This is so because when subsidy is provided for a particular expenditure which households would have made, there is every tendency that the income set aside for that particular expenditure will be used for other expenditures or rather saved.
Nigeria’s public expenditure, as an aspect of fiscal policy for nearly four decades, has been based on two goals of helping spurring rapid economic growth, and ensuring that economic growth is distributed in a fair and equitable manner. This has been the target of all the policy regimes.3 These policy regimes have also recognized the importance and the need to invest in education and healthcare as one way of tackling sustainable reduction in poverty and inequality with the introduction of notable education and healthcare programmes like Universal Primary Education (UPE) in 1975, National Primary Healthcare in the 1990s, Family Economic Advancement Programme (FEAP) of 1992, National Commission for Mass Literacy (NCML) in 1997, Universal Basic Education (UBE) Programme in 2000, Immunization Programmes from 1970 to date, Roll Back Malaria (RBM) in 2001, amongst others. In summary, Nigeria’s health targets for nearly four decades include: affordable and cost-effective basic health services for 90% of the population, and 100% routine and special immunization coverage while that of education target has been Education for All (EFA).
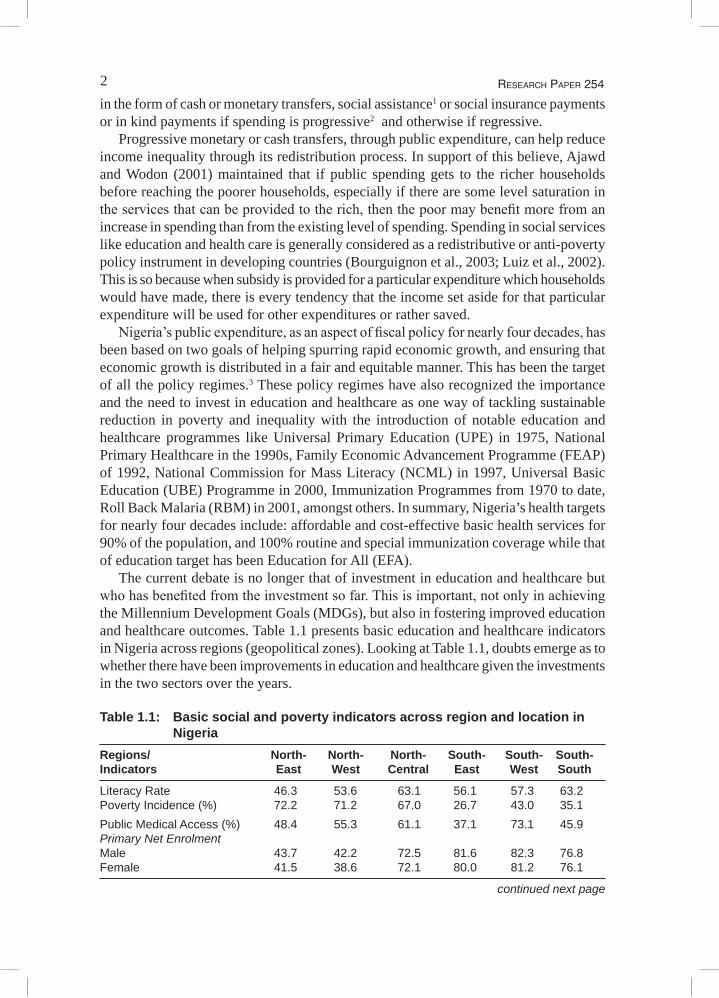
The current debate is no longer that of investment in education and healthcare but who has benefited from the investment so far. This is important, not only in achieving the Millennium Development Goals (MDGs), but also in fostering improved education and healthcare outcomes. Table 1.1 presents basic education and healthcare indicators in Nigeria across regions (geopolitical zones). Looking at Table 1.1, doubts emerge as to whether there have been improvements in education and healthcare given the investments in the two sectors over the years.
Table 1.1: Basic social and poverty indicators across region and location in Nigeria
Regions/ North- North- North- South- South- South-Indicators East West Central East West South
Literacy Rate 46.3 53.6 63.1 56.1 57.3 63.2Poverty Incidence (%) 72.2 71.2 67.0 26.7 43.0 35.1Public Medical Access (%) 48.4 55.3 61.1 37.1 73.1 45.9Primary Net Enrolment Male 43.7 42.2 72.5 81.6 82.3 76.8Female 41.5 38.6 72.1 80.0 81.2 76.1
continued next page
3Public SPending and Poverty reduction in nigeria
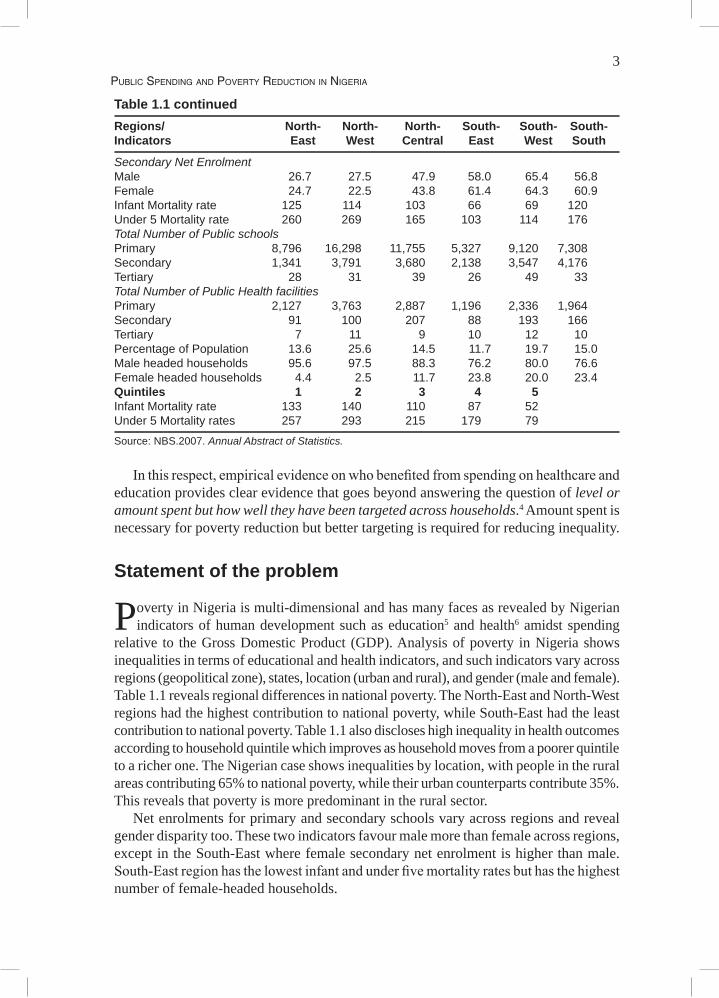
Table 1.1 continuedRegions/ North- North- North- South- South- South-Indicators East West Central East West South
Secondary Net Enrolment Male 26.7 27.5 47.9 58.0 65.4 56.8Female 24.7 22.5 43.8 61.4 64.3 60.9Infant Mortality rate 125 114 103 66 69 120Under 5 Mortality rate 260 269 165 103 114 176Total Number of Public schools Primary 8,796 16,298 11,755 5,327 9,120 7,308Secondary 1,341 3,791 3,680 2,138 3,547 4,176Tertiary 28 31 39 26 49 33Total Number of Public Health facilities Primary 2,127 3,763 2,887 1,196 2,336 1,964Secondary 91 100 207 88 193 166Tertiary 7 11 9 10 12 10Percentage of Population 13.6 25.6 14.5 11.7 19.7 15.0Male headed households 95.6 97.5 88.3 76.2 80.0 76.6Female headed households 4.4 2.5 11.7 23.8 20.0 23.4Quintiles 1 2 3 4 5 Infant Mortality rate 133 140 110 87 52 Under 5 Mortality rates 257 293 215 179 79
Source: NBS.2007. Annual Abstract of Statistics.
In this respect, empirical evidence on who benefited from spending on healthcare and education provides clear evidence that goes beyond answering the question of level or amount spent but how well they have been targeted across households.4 Amount spent is necessary for poverty reduction but better targeting is required for reducing inequality.
Statement of the problem
Poverty in Nigeria is multi-dimensional and has many faces as revealed by Nigerian indicators of human development such as education5 and health6 amidst spending
relative to the Gross Domestic Product (GDP). Analysis of poverty in Nigeria shows inequalities in terms of educational and health indicators, and such indicators vary across regions (geopolitical zone), states, location (urban and rural), and gender (male and female). Table 1.1 reveals regional differences in national poverty. The North-East and North-West regions had the highest contribution to national poverty, while South-East had the least contribution to national poverty. Table 1.1 also discloses high inequality in health outcomes according to household quintile which improves as household moves from a poorer quintile to a richer one. The Nigerian case shows inequalities by location, with people in the rural areas contributing 65% to national poverty, while their urban counterparts contribute 35%. This reveals that poverty is more predominant in the rural sector.
Net enrolments for primary and secondary schools vary across regions and reveal gender disparity too. These two indicators favour male more than female across regions, except in the South-East where female secondary net enrolment is higher than male. South-East region has the lowest infant and under five mortality rates but has the highest number of female-headed households.
4 ReseaRch PaPeR 254
In terms of health outcomes, rural infant mortality rate in 2007 was 121 as against 81 per every 1000 live births for urban while under five mortality rate for rural was 243 as against 153 per every 1000 live births for the urban. A look at the situation tends to corroborate the fact that poverty in Nigeria is becoming dynastic with the children of the poor likely to become poor due to widening inequality in access to education and healthcare facilities.
The story is not different at the state level. Poverty incidence increased in nine states from the 1996 figures and the increase was more pronounced in Jigawa State, which increased from 71% in 1996 to 95% in 2004. In general, poverty increased more in the northern states than in the southern states.
With the scenario presented above, it is worrisome if public spending and subsidies in these two sectors have been progressive (concentrated among the poor). This is because public spending is known to have direct linkage to the poor through social transfers. This study, therefore, is aimed at measuring benefits accruing to households from public expenditure in education and healthcare and to find if they are progressive, regressive or neutral. Benefits from public spending and subsidies are progressive if they are more concentrated among the poorer households and regressive if otherwise. The study is an evaluation of public spending on poverty reduction and inequality using the Benefit Incidence Analysis7 (BIA). Though there are other comparable measures of expenditure impact, BIA even with some limitations and flaws is preferred because it is easier to calculate the current benefits as opposed to benefits over the recipients’ lifetime. BIA also combines the cost of providing public spending with information on their use in order to generate distributions of the benefit of government spending.
The result of the study will be very useful as information on distributional impacts; particularly, the extent of benefit on the different quintiles can help policy makers in making public spending choices. According to Reinikka (2002), employing BIA is most appropriate because of evidence of limited impact of public spending on growth and human development outcomes across developing countries and there is a dearth of studies in Nigeria in that direction.
The goal and objectives of the study
The goal of the study is to determine how equitable the public expenditures are at every level of education and healthcare through the benefits that accrue to different
households quintiles in Nigeria. In other words, the study’s main goal is to determine what the distribution pattern of expenditure in education and health has been and ascertain if public expenditures in these sectors have been progressive, regressive or neutral when compared to the 450 lines and per capita consumption or expenditure known as the Lorenz curve.
Specifically, the study is to analyse benefits from public expenditure on education and healthcare at all levels in Nigeria to ascertain if they are:• Progressive across different household groups (quintiles); • Progressive across regions (geopolitical zones) and states of the federation; and• Progressive by location and according to gender of recipients.

5Public SPending and Poverty reduction in nigeria
The study will also assess the distribution of beneficiaries using tests for welfare dominance with simple binary indicator of whether or not one uses a service as well as test and compare the result from different methods (traditional BIA and assessment of distributions of beneficiaries using tests for welfare dominance with simple binary indicator).
6 ReseaRch PaPeR 254
6
2. Literature review
Benefit Incidence Analysis (BIA): Brief theoretical andempirical evidence
BIA is always defined in terms of the financial subsidy received from public resources, as distinct from volume of services delivered (education, health and other social
sectors) or some other form of output measure. It is usually employed in public finance field, to determine the progressive or regressive nature of government expenditures. BIA offers an important perspective on budgets, and can illuminate the distributional impacts of proposed reallocations of government resources among projects.
According to Demery (2000: 1), public expenditures affect the population in a number of ways. First, fiscal policy influences the macroeconomic balances, particularly the fiscal and trade deficits and the rate of inflation. These changes, in turn, affect living standards — directly, through influencing real incomes, and indirectly, through changing the rate of economic growth. These are the macroeconomic effects of public spending. Second, public spending creates incomes directly, some of which might benefit poor households. These incomes in turn create other incomes through the income-expenditure multiplier process. These are the primary income effects (or the ‘expenditure incidence’) of public spending. Finally, public expenditures generate transfers to the population. These may be either in the form of cash or monetary transfers, such as social assistance or social insurance payments, or in kind. The latter includes subsidized government services such as health, education, and infrastructure services. These in kind transfers improve the current well-being of the beneficiaries, and also enhance their longer-run income-earning potential. They, therefore, involve current and capital transfers to the recipients, and can be called the transfer effects (or the ‘benefit incidence’) of spending.
If the above conditions hold, assessing the actual level and allocation of public expenditure is, therefore, the key to understanding any government’s true expenditure priorities and its coherence with the policy objectives. This has been a long-standing problem in the economics literature, i.e., the measurement of publicly provided goods to individuals and the society. The above task requires an analytical framework to organize data on the government’s financial operations which will give insight to how and who benefit from such spending.
Apart from poverty reduction, the case for public subsidy is also based on equity considerations and most economists think it is the responsibility of the State. It is becoming widely accepted that, provisions of social services for the poor is one of the

7Public SPending and Poverty reduction in nigeria
most effective instruments the state can employ to achieve this crucial objective. What follows, according to Demery (2001), is based on the following arguments:• First, public expenditures can only be effective in reducing poverty when the policy
setting is right. It is hardly worth increasing spending on primary education for girls if distortions in labour markets prevent female school graduates from securing employment. Similarly, it is futile to increase spending on agricultural extension or research if overvalued exchange rates make agricultural activity unprofitable. Pro-poor experiences must be accompanied by pro-poor policies.
• Second, it is assumed that open public expenditure process (including budget management, accountability, transparency and stakeholders’ participation) is based on outcomes and impacts and not just line items and inputs. Simply spending money on the provision of a service, without attending to the efficiency with which that spending generates services and to the impact on the intended beneficiaries, is not what is recommended here (Filmer et al., 1998).
• Third, public policy in general and public expenditure decisions in particular, must be based on a sound understanding of the needs and preferences of the population at large. The provision of public services should be viewed as collaboration between governments, on the one hand, and the households on the other. To make this collaboration effective, there must be a two-way flow of information, with governments constantly ‘listening’ to households and households, in turn, being informed of government objectives and their rights under explicit contracts or covenants. The big concern here is with one dimension of the information flow: how can governments be informed about the needs of their clients, especially the poor? Who indeed benefits from public spending?
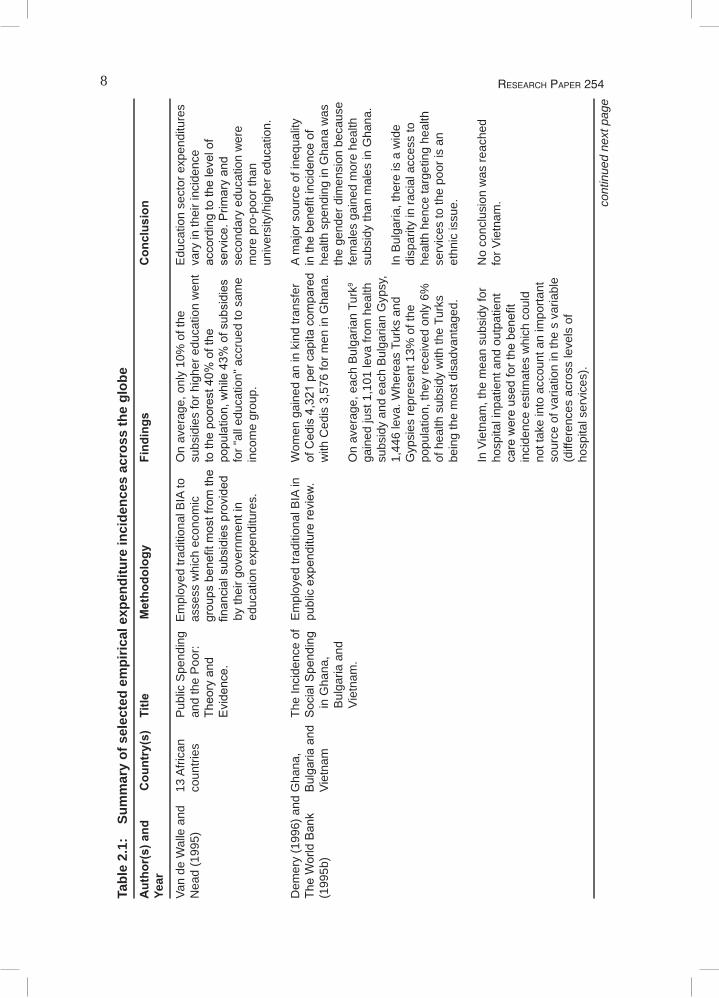
In an effort to provide answers to the above issues, especially when governments subsidize the provisions of goods and services or when they take the responsibility of providing them, gave birth to the Benefit Incidence Analysis (BIA). BIA came to the limelight through the works of Meerman (1979) on Malaysia and Selowsky (1979) on Columbia which stem from Aaron and McGuire (1970) who set out the basic principles to be followed in assessing how public expenditures benefit households. The need for principles and basic framework were borne on the fact that, when such goods and services are provided by the State (public goods and services), price(s) may not be the best guide. Based on the above works, BIA has been employed in several assessments towards finding who benefited from public spending. BIA is easier to calculate unlike the welfarist8 approach, which is more theoretical with simulation alternative outcomes that are based on the estimated demand functions. Several authors have used BIA to assess how progressive public spending has been. Some selected empirical studies are presented in the Table 2.1.
8 ReseaRch PaPeR 254
Tabl
e 2.
1:
Sum
mar
y of
sel
ecte
d em
piric
al e
xpen
ditu
re in
cide
nces
acr
oss
the
glob
e A
utho
r(s)
and
C
ount
ry(s
) Ti
tle
Met
hodo
logy
Fi
ndin
gs
Con
clus
ion
Year
Van
de W
alle
and
13
Afri
can
Pub
lic S
pend
ing
Em
ploy
ed tr
aditi
onal
BIA
to
On
aver
age,
onl
y 10
% o
f the
E
duca
tion
sect
or e
xpen
ditu
res
Nea
d (1
995)
co
untri
es
and
the
Poo
r:
asse
ss w
hich
eco
nom
ic
subs
idie
s fo
r hig
her e
duca
tion
wen
t va
ry in
thei
r inc
iden
ce
Theoryand
groupsbenefitm
ostfromthetothepoorest40%
ofthe
accordingtothelevelof
Evidence.
financialsubsidiesprovided
population,while43%
ofsubsidiesservice.Prim
aryand
by
thei
r gov
ernm
ent i
n fo
r "al
l edu
catio
n" a
ccru
ed to
sam
e se
cond
ary
educ
atio
n w
ere
ed
ucat
ion
expe
nditu
res.
in
com
e gr
oup.
m
ore
pro-
poor
than
un
iver
sity
/hig
her e
duca
tion.
Dem
ery
(199
6) a
nd G
hana
, Th
e In
cide
nce
of
Em
ploy
ed tr
aditi
onal
BIA
in
Wom
en g
aine
d an
in k
ind
trans
fer
A m
ajor
sou
rce
of in
equa
lity
TheWorldBank
BulgariaandS
ocialSpending
publicexpenditurereview
.ofCedis4,321percapitacom
paredinthebenefitincidenceof
(199
5b)
Viet
nam
in
Gha
na,
w
ith C
edis
3,5
76 fo
r men
in G
hana
. he
alth
spe
ndin
g in
Gha
na w
as
B
ulga
ria a
nd
the
gend
er d
imen
sion
bec
ause
Viet
nam
.
On
aver
age,
eac
h B
ulga
rian
Turk
9 fe
mal
es g
aine
d m
ore
heal
th
ga
ined
just
1,1
01 le
va fr
om h
ealth
su
bsid
y th
an m
ales
in G
hana
.
su
bsid
y an
d ea
ch B
ulga
rian
Gyp
sy,
1,44
6 le
va. W
here
as T
urks
and
In
Bul
garia
, the
re is
a w
ide
Gyp
sies
repr
esen
t 13%
of t
he
disp
arity
in ra
cial
acc
ess
to
po
pula
tion,
they
rece
ived
onl
y 6%
he
alth
hen
ce ta
rget
ing
heal
th
of
hea
lth s
ubsi
dy w
ith th
e Tu
rks
serv
ices
to th
e po
or is
an
bein
g th
e m
ost d
isad
vant
aged
. et
hnic
issu
e.
In
Vie
tnam
, the
mea
n su
bsid
y fo
r N
o co
nclu
sion
was
reac
hed
hosp
ital i
npat
ient
and
out
patie
nt
for V
ietn
am.
carewereusedforthebenefit
inci
denc
e es
timat
es w
hich
cou
ld
not t
ake
into
acc
ount
an
impo
rtant
so
urce
of v
aria
tion
in th
e s
varia
ble
(d
iffer
ence
s ac
ross
leve
ls o
f
ho
spita
l ser
vice
s).
cont
inue
d ne
xt p
age
9Public SPending and Poverty reduction in nigeria
Tabl
e 2.
1 co
ntin
ued
Aut
hor(
s) a
nd
Cou
ntry
(s)
Title
M
etho
dolo
gy
Find
ings
C
oncl
usio
nYe
ar
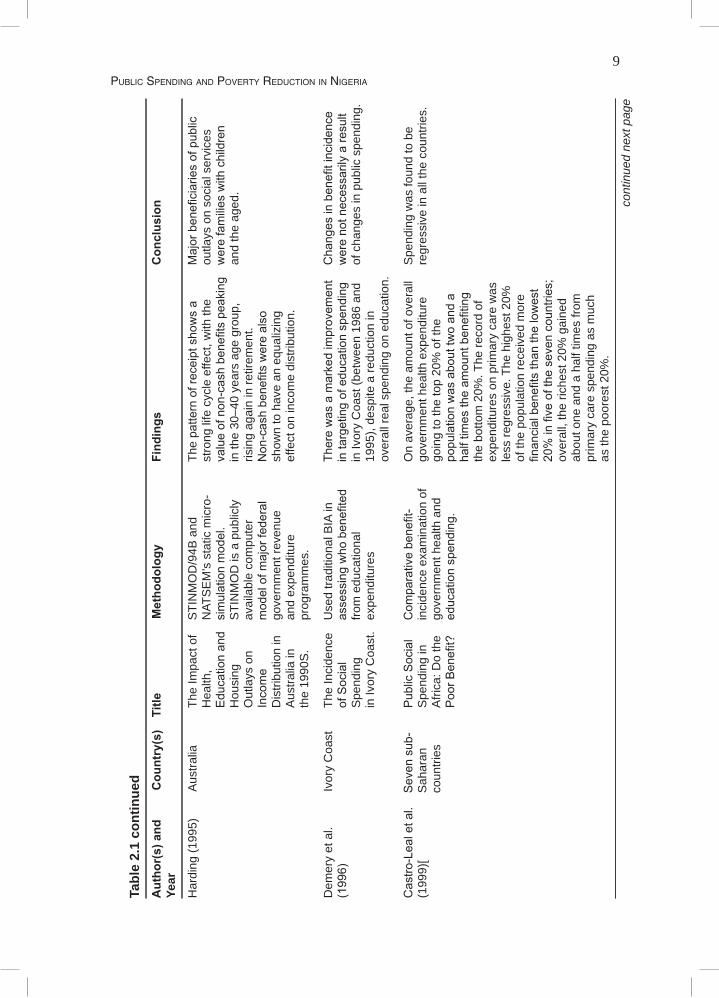
Har
ding
(199
5)
Aus
tralia
Th
e Im
pact
of
STI
NM
OD
/94B
and
Th
epatternofreceiptshowsa
Majorbeneficiariesofpublic
Hea
lth,
NAT
SE
M’s
sta
tic m
icro
- st
rong
life
cyc
le e
ffect
, with
the
outla
ys o
n so
cial
ser
vice
s
Educationand
simulationmodel.
valueofnon-cashbenefitspeaking
werefamilieswithchildren
Hou
sing
S
TIN
MO
D is
a p
ublic
ly
in th
e 30
–40
year
s ag
e gr
oup,
an
d th
e ag
ed.
Out
lays
on
av
aila
ble
com
pute
r ris
ing
agai
n in
retir
emen
t.
Income
modelofm
ajorfederal
Non-cashbenefitswerealso
Dis
tribu
tion
in
gove
rnm
ent r
even
ue
show
n to
hav
e an
equ
aliz
ing
Aus
tralia
in
and
expe
nditu
re
effe
ct o
n in
com
e di
strib
utio
n.
th
e 19
90S
. pr
ogra
mm
es.
Dem
ery
et a
l.
Ivor
y C
oast
Th
e In
cide
nce
Use
d tra
ditio
nal B
IA in
Therewasamarkedimprovem
ent
Changesinbenefitincidence
(1996)
ofSocial
assessingwhobenefited
intargetingofeducationspending
werenotnecessarilyaresult
Spe
ndin
g fro
m e
duca
tiona
l
in Iv
ory
Coa
st (b
etw
een
1986
and
of
cha
nges
in p
ublic
spe
ndin
g.
in
Ivor
y C
oast
. ex
pend
iture
s 19
95),
desp
ite a
redu
ctio
n in
over
all r
eal s
pend
ing
on e
duca
tion.
Castro-Lealetal.Sevensub-
PublicSocial
Com
parativebenefit-
On
aver
age,
the
amou
nt o
f ove
rall
Spe
ndin
g w
as fo
und
to b
e(1
999)
[ S
ahar
an
Spe
ndin
g in
in
cide
nce
exam
inat
ion
of
gove
rnm
ent h
ealth
exp
endi
ture
re
gres
sive
in a
ll th
e co
untri
es.
co
untri
es
Afri
ca: D
o th
e go
vern
men
t hea
lth a
nd
goin
g to
the
top
20%
of t
he
PoorB
enefit?
educationspending.
populationwasabouttw
oanda
halftim
estheam
ountbenefiting
the
botto
m 2
0%. T
he re
cord
of
expe
nditu
res
on p
rimar
y ca
re w
as
less
regr
essi
ve. T
he h
ighe
st 2
0%
of th
e po
pula
tion
rece
ived
mor
e
financialbenefitsthanthelowest
20%infiveofthesevencountries;
over
all,
the
riche
st 2
0% g
aine
d
ab
out o
ne a
nd a
hal
f tim
es fr
om
prim
ary
care
spe
ndin
g as
muc
h
as
the
poor
est 2
0%.
cont
inue
d ne
xt p
age
10 ReseaRch PaPeR 254
Tabl
e 2.
1 co
ntin
ued
Aut
hor(
s) a
nd
Cou
ntry
(s)
Title
M
etho
dolo
gy
Find
ings
C
oncl
usio
nYe
ar
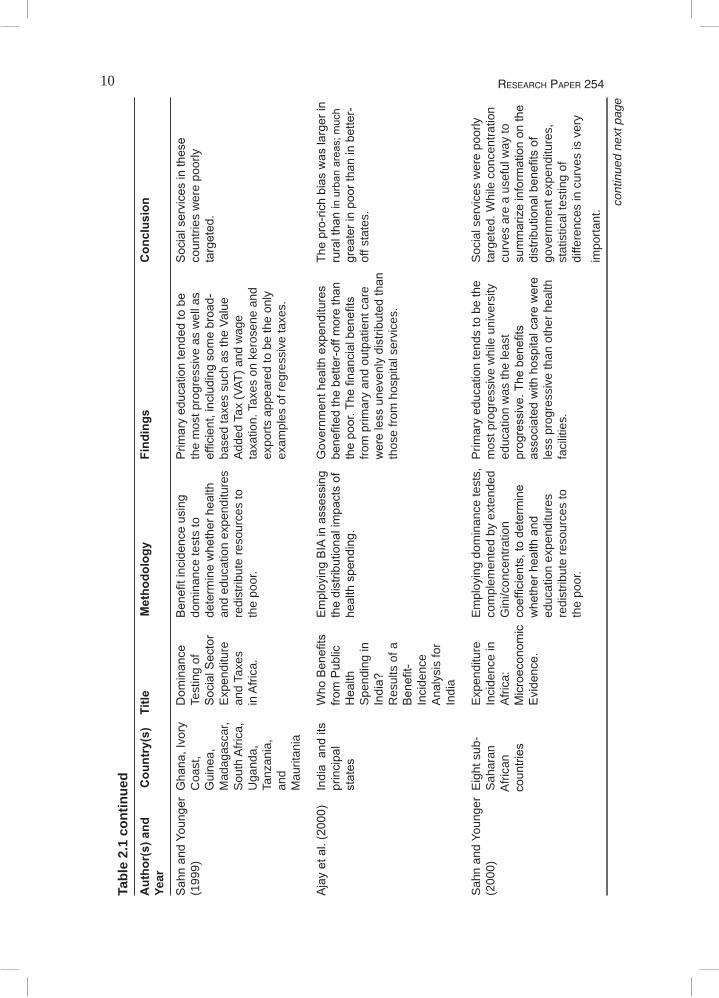
SahnandYoungerGhana,Ivory
Dom
inance
Benefitincidenceusing
Prim
aryeducationtendedtobe
Socialservicesinthese
(199
9)
Coa
st,
Test
ing
of
dom
inan
ce te
sts
to
the
mos
t pro
gres
sive
as
wel
l as
coun
tries
wer
e po
orly
Guinea,
SocialSector
determinewhetherhealth
efficient,includingsom
ebroad-
targeted.
M
adag
asca
r,
Exp
endi
ture
an
d ed
ucat
ion
expe
nditu
res
base
d ta
xes
such
as
the
Valu
e
Sou
th A
frica
, an
d Ta
xes
redi
strib
ute
reso
urce
s to
A
dded
Tax
(VAT
) and
wag
e
Uga
nda,
in
Afri
ca.
the
poor
. ta
xatio
n. T
axes
on
kero
sene
and
Ta
nzan
ia,
expo
rts a
ppea
red
to b
e th
e on
ly
an
d
exam
ples
of r
egre
ssiv
e ta
xes.
M
aurit
ania
Ajayetal.(2000)
IndiaanditsWhoBenefits
EmployingBIAinassessingGovernm
enthealthexpenditures
Thepro-richbiaswaslargerin
principal
fromPublic
thedistributionalimpactsofbenefitedthebetter-offm
orethan
ruralthaninurbanareas;m
uch
states
Health
healthspending.
thepoor.Thefinancialbenefits
greaterinpoorthaninbetter-
Spe
ndin
g in
from
prim
ary
and
outp
atie
nt c
are
off s
tate
s.
India?
werelessunevenlydistributedthan
Res
ults
of a
thos
e fro
m h
ospi
tal s
ervi
ces.
Benefit-
Inci
denc
e
A
naly
sis
for
Indi
a
Sah
n an
d Yo
unge
r E
ight
sub
- E
xpen
ditu
re
Em
ploy
ing
dom
inan
ce te
sts,
P
rimar
y ed
ucat
ion
tend
s to
be
the
Soc
ial s
ervi
ces
wer
e po
orly
(200
0)
Sah
aran
In
cide
nce
in
com
plem
ente
d by
ext
ende
d m
ost p
rogr
essi
ve w
hile
uni
vers
ity
targ
eted
. Whi
le c
once
ntra
tion
A
frica
n
Afri
ca:
Gin
i/con
cent
ratio
n ed
ucat
ion
was
the
leas
t cu
rves
are
a u
sefu
l way
to
countries
Microeconom
iccoefficients,todetermine
progressive.Thebenefits
summarizeinformationonthe
Evidence.
whetherhealthand
associatedwithhospitalcarewere
distributionalbenefitsof
ed
ucat
ion
expe
nditu
res
le
ss p
rogr
essi
ve th
an o
ther
hea
lth
gove
rnm
ent e
xpen
ditu
res,
re
dist
ribut
e re
sour
ces
to
faci
litie
s.
stat
istic
al te
stin
g of
th
e po
or.
di
ffere
nces
in c
urve
s is
ver
y
impo
rtant
.
cont
inue
d ne
xt p
age
11Public SPending and Poverty reduction in nigeria
Tabl
e 2.
1 co
ntin
ued
Aut
hor(
s) a
nd
Cou
ntry
(s)
Title
M
etho
dolo
gy
Find
ings
C
oncl
usio
nYe
ar
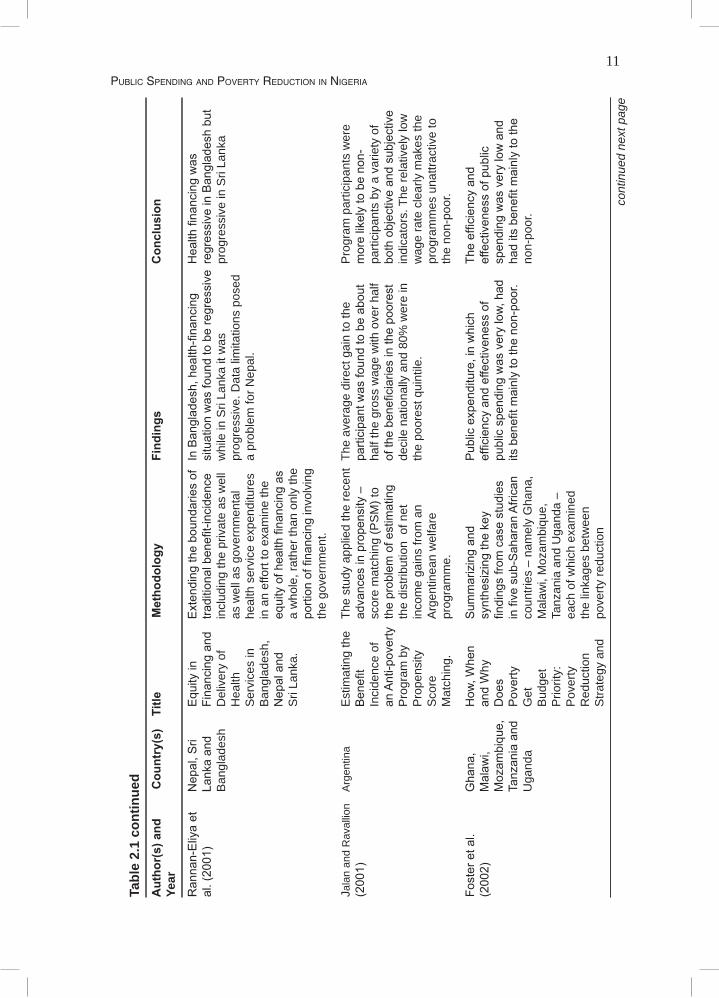
Rannan-Eliyaet
Nepal,S
riEquityin
ExtendingtheboundariesofInBangladesh,health-financing
Healthfinancingwas
al.(2001)
Lankaand
Financingand
traditionalbenefit-incidencesituationwasfoundtoberegressiveregressiveinBangladeshbut
B
angl
ades
h D
eliv
ery
of
incl
udin
g th
e pr
ivat
e as
wel
l w
hile
in S
ri La
nka
it w
as
prog
ress
ive
in S
ri La
nka
Hea
lth
as w
ell a
s go
vern
men
tal
prog
ress
ive.
Dat
a lim
itatio
ns p
osed
Ser
vice
s in
he
alth
ser
vice
exp
endi
ture
s a
prob
lem
for N
epal
.
B
angl
ades
h,
in a
n ef
fort
to e
xam
ine
the
Nepaland
equityofhealthfinancingas
Sri
Lank
a.
a w
hole
, rat
her t
han
only
the
portionoffinancing
invo
lvin
g
the
gove
rnm
ent.
Jala
n an
d R
aval
lion
A
rgen
tina
Est
imat
ing
the
The
stud
y ap
plie
d th
e re
cent
The
ave
rage
dire
ct g
ain
to th
e P
rogr
am p
artic
ipan
ts w
ere
(2001)
Benefit
advancesinpropensity–
participantwasfoundtobeabout
morelikelytobenon-
Inci
denc
e of
sc
ore
mat
chin
g (P
SM
) to
half
the
gros
s w
age
with
ove
r hal
f pa
rtici
pant
s by
a v
arie
ty o
f
anAnti-povertytheproblem
ofestimating
ofthebeneficiariesinthepoorest
bothobjectiveandsubjective
Pro
gram
by
th
e di
strib
utio
n o
f net
de
cile
nat
iona
lly a
nd 8
0% w
ere
in
indi
cato
rs. T
he re
lativ
ely
low
Pro
pens
ity
inco
me
gain
s fro
m a
n th
e po
ores
t qui
ntile
. w
age
rate
cle
arly
mak
es th
e
S
core
A
rgen
tinea
n w
elfa
re
pr
ogra
mm
es u
nattr
activ
e to
Mat
chin
g.
prog
ram
me.
the
non-
poor
.
Fosteretal.
Ghana,
How
,When
Sum
marizingand
Publicexpenditure,inwhich
Theefficiencyand
(2002)
Malaw
i,
andWhy
synthesizingthekey
efficiencyandeffectivenessof
effectivenessofpublic
Mozam
bique,Does
findingsfromcasestudies
publicspendingwasverylow,had
spendingwasverylowand
TanzaniaandPoverty
infivesub-SaharanAfrican
itsbenefitm
ainlytothenon-poor.
haditsbenefitm
ainlytothe
U
gand
a G
et
coun
tries
– n
amel
y G
hana
,
non-
poor
.
B
udge
t M
alaw
i, M
ozam
biqu
e,
Prio
rity:
Ta
nzan
ia a
nd U
gand
a –
Pov
erty
ea
ch o
f whi
ch e
xam
ined
Red
uctio
n
the
linka
ges
betw
een
Stra
tegy
and
po
verty
redu
ctio
n
cont
inue
d ne
xt p
age
12 ReseaRch PaPeR 254
Tabl
e 2.
1 co
ntin
ued
Aut
hor(
s) a
nd
Cou
ntry
(s)
Title
M
etho
dolo
gy
Find
ings
C
oncl
usio
nYe
ar
Pub
lic
stra
tegy
and
pub
lic
E
xpen
ditu
re
expe
nditu
re
in
Fiv
e
man
agem
ent.
Afri
can
Cou
ntrie
s.
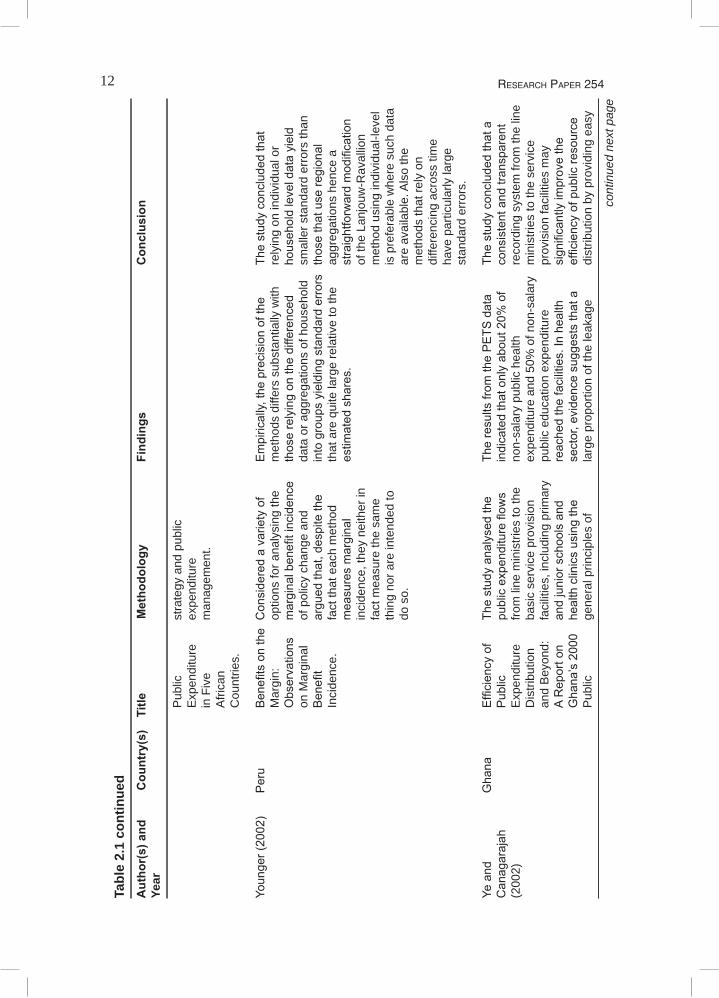
Younger(2002)
Peru
Benefitsonthe
Consideredavarietyof
Empirically,theprecisionofthe
Thestudyconcludedthat
Mar
gin:
op
tions
for a
naly
sing
the
met
hods
diff
ers
subs
tant
ially
with
re
lyin
g on
indi
vidu
al o
r
Observations
marginalbenefitincidence
thoserelyingonthedifferenced
householdleveldatayield
on M
argi
nal
of p
olic
y ch
ange
and
da
ta o
r agg
rega
tions
of h
ouse
hold
sm
alle
r sta
ndar
d er
rors
than
Benefit
arguedthat,despitethe
intogroupsyieldingstandarderrorsthosethatuseregional
Inci
denc
e.
fact
that
eac
h m
etho
d
that
are
qui
te la
rge
rela
tive
to th
e ag
greg
atio
ns h
ence
a
measuresmarginal
estim
atedshares.
straightforwardmodification
in
cide
nce,
they
nei
ther
in
of
the
Lanj
ouw
-Rav
allio
n
fact
mea
sure
the
sam
e
m
etho
d us
ing
indi
vidu
al-le
vel
th
ing
nor a
re in
tend
ed to
is p
refe
rabl
e w
here
suc
h da
ta
do s
o.
ar
e av
aila
ble.
Als
o th
e
met
hods
that
rely
on
di
ffere
ncin
g ac
ross
tim
e
have
par
ticul
arly
larg
e
stan
dard
err
ors.
Yeand
Ghana
Efficiencyof
Thestudyanalysedthe
Theresultsfrom
thePETS
data
Thestudyconcludedthata
Canagarajah
Public
publicexpenditureflow
sindicatedthatonlyabout20%
of
consistentandtransparent
(200
2)
E
xpen
ditu
re
from
line
min
istri
es to
the
non-
sala
ry p
ublic
hea
lth
reco
rdin
g sy
stem
from
the
line
Dis
tribu
tion
ba
sic
serv
ice
prov
isio
n ex
pend
iture
and
50%
of n
on-s
alar
y m
inis
tries
to th
e se
rvic
e
an
d B
eyon
d:
faci
litie
s, in
clud
ing
prim
ary
publ
ic e
duca
tion
expe
nditu
re
prov
isio
n fa
cilit
ies
may
AReporton
andjuniorschoolsand
reachedthefacilities.Inhealth
significantlyim
provethe
Ghana’s2000healthclinicsusingthe
sector,evidencesuggeststhata
efficiencyofpublicresource
Pub
lic
gene
ral p
rinci
ples
of
larg
e pr
opor
tion
of th
e le
akag
e di
strib
utio
n by
pro
vidi
ng e
asy
cont
inue
d ne
xt p
age
13Public SPending and Poverty reduction in nigeria
Tabl
e 2.
1 co
ntin
ued
Aut
hor(
s) a
nd
Cou
ntry
(s)
Title
M
etho
dolo
gy
Find
ings
C
oncl
usio
nYe
ar
Exp
endi
ture
P
ublic
Exp
endi
ture
and
oc
curr
ed b
etw
een
the
line
publ
ic a
cces
s to
the
reso
urce
Tracking
TrackingSurvey(PETS
).ministriesandthedistrictoffices,
flowdata.
Sur
vey
in th
e
w
here
pub
lic e
xpen
ditu
res
are
Sec
tors
of
tu
rned
into
mat
eria
ls fr
om c
ash
Prim
aryHealth
flows.
and
Edu
catio
n.
H
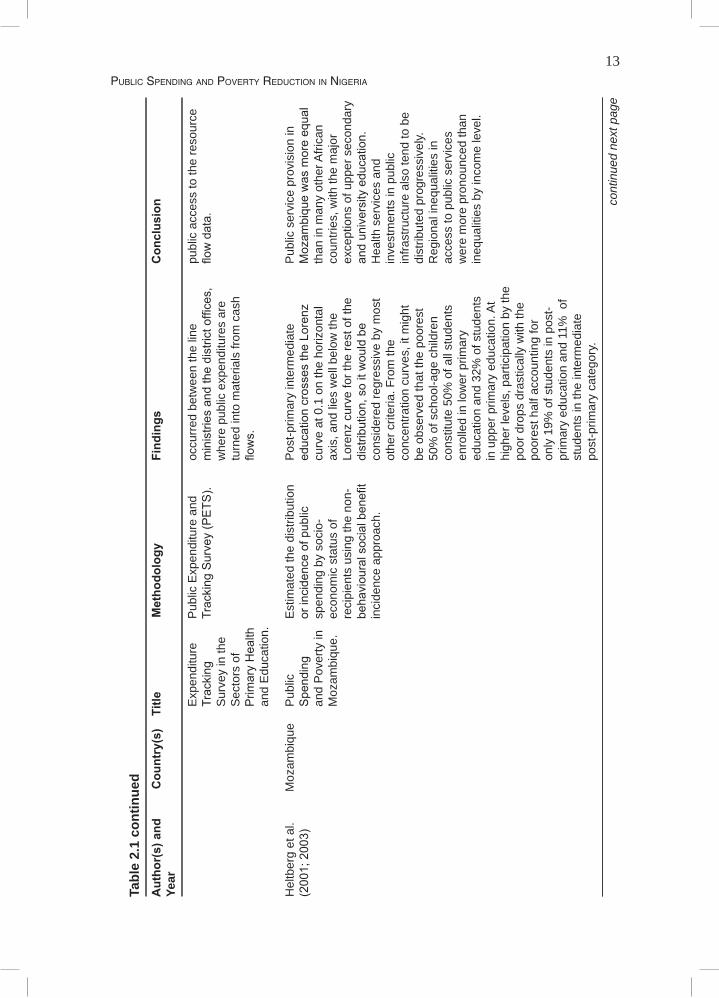
eltb
erg
et a
l.
Moz
ambi
que
Pub
lic
Est
imat
ed th
e di
strib
utio
n P
ost-p
rimar
y in
term
edia
te
Pub
lic s
ervi
ce p
rovi
sion
in(2001;2003)
Spending
orincidenceofpublic
educationcrossestheLorenz
Mozam
biquewasmoreequal
and
Pov
erty
in
spen
ding
by
soci
o-
curv
e at
0.1
on
the
horiz
onta
l th
an in
man
y ot
her A
frica
n
M
ozam
biqu
e.
econ
omic
sta
tus
of
axis
, and
lies
wel
l bel
ow th
e co
untri
es, w
ith th
e m
ajor
re
cipi
ents
usi
ng th
e no
n-
Lore
nz c
urve
for t
he re
st o
f the
ex
cept
ions
of u
pper
sec
onda
ry
behaviouralsocialbenefit
distribution,soitwouldbe
anduniversityeducation.
in
cide
nce
appr
oach
. co
nsid
ered
regr
essi
ve b
y m
ost
Hea
lth s
ervi
ces
and
othe
r crit
eria
. Fro
m th
e
inve
stm
ents
in p
ublic
conc
entra
tion
curv
es, i
t mig
ht
infra
stru
ctur
e al
so te
nd to
be
be o
bser
ved
that
the
poor
est
dist
ribut
ed p
rogr
essi
vely.
50
% o
f sch
ool-a
ge c
hild
ren
R
egio
nal i
nequ
aliti
es in
cons
titut
e 50
% o
f all
stud
ents
ac
cess
to p
ublic
ser
vice
s
en
rolle
d in
low
er p
rimar
y
wer
e m
ore
pron
ounc
ed th
an
ed
ucat
ion
and
32%
of s
tude
nts
in
equa
litie
s by
inco
me
leve
l.
in
upp
er p
rimar
y ed
ucat
ion.
At
high
er le
vels
, par
ticip
atio
n by
the
poor
dro
ps d
rast
ical
ly w
ith th
e
po
ores
t hal
f acc
ount
ing
for
only
19%
of s
tude
nts
in p
ost-
prim
ary
educ
atio
n an
d 11
% o
f
st
uden
ts in
the
inte
rmed
iate
po
st-p
rimar
y ca
tego
ry.
cont
inue
d ne
xt p
age
14 ReseaRch PaPeR 254
Tabl
e 2.
1 co
ntin
ued
Aut
hor(
s) a
nd
Cou
ntry
(s)
Title
M
etho
dolo
gy
Find
ings
C
oncl
usio
nYe
ar
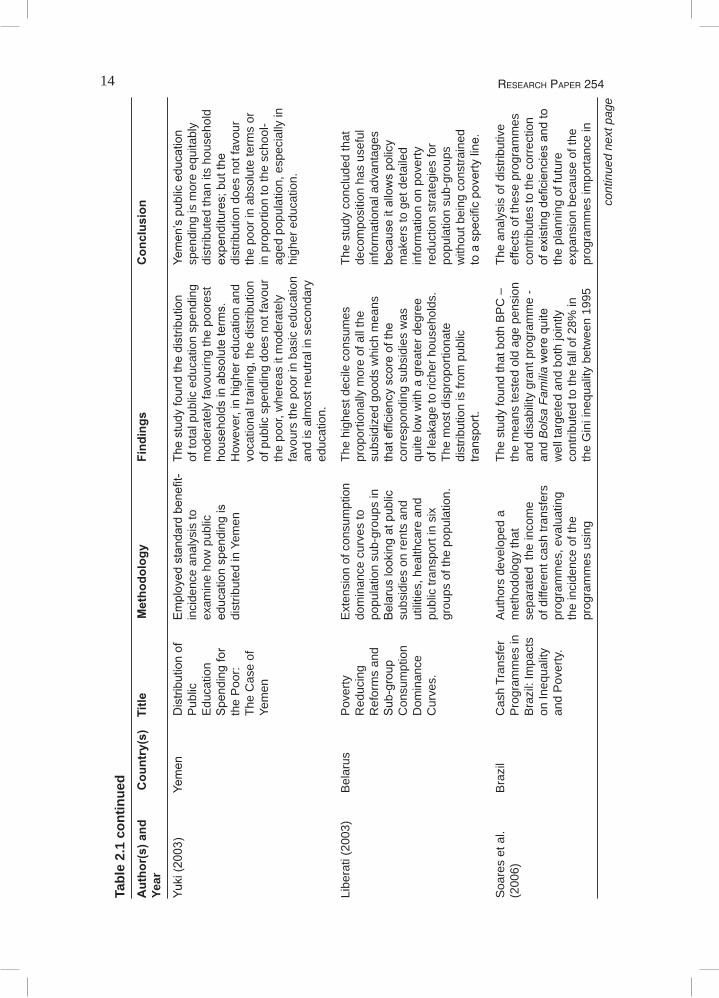
Yuki(2003)
Yemen
Distributionof
Employedstandardbenefit-
Thestudyfoundthedistribution
Yemen’spubliceducation
Pub
lic
inci
denc
e an
alys
is to
of
tota
l pub
lic e
duca
tion
spen
ding
sp
endi
ng is
mor
e eq
uita
bly
Edu
catio
n
exam
ine
how
pub
lic
mod
erat
ely
favo
urin
g th
e po
ores
t di
strib
uted
than
its
hous
ehol
d
Spendingfor
educationspendingis
householdsinabsoluteterms.
expenditures;butthe
the
Poo
r:
dist
ribut
ed in
Yem
en
How
ever
, in
high
er e
duca
tion
and
dist
ribut
ion
does
not
favo
ur
Th
e C
ase
of
vo
catio
nal t
rain
ing,
the
dist
ribut
ion
the
poor
in a
bsol
ute
term
s or
Yem
en
of
pub
lic s
pend
ing
does
not
favo
ur
in p
ropo
rtion
to th
e sc
hool
-
th
e po
or, w
here
as it
mod
erat
ely
ag
ed p
opul
atio
n, e
spec
ially
in
fa
vour
s th
e po
or in
bas
ic e
duca
tion
hig
her e
duca
tion.
and
is a
lmos
t neu
tral i
n se
cond
ary
educ
atio
n. Li
bera
ti (2
003)
B
elar
us
Pov
erty
E
xten
sion
of c
onsu
mpt
ion
The
high
est d
ecile
con
sum
es
The
stud
y co
nclu
ded
that
Red
ucin
g
dom
inan
ce c
urve
s to
pr
opor
tiona
lly m
ore
of a
ll th
e de
com
posi
tion
has
usef
ul
R
efor
ms
and
po
pula
tion
sub-
grou
ps in
su
bsid
ized
goo
ds w
hich
mea
ns
info
rmat
iona
l adv
anta
ges
Sub-group
Belaruslookingatpublic
thatefficiencyscoreofthe
becauseitallowspolicy
Con
sum
ptio
n
subs
idie
s on
rent
s an
d co
rres
pond
ing
subs
idie
s w
as
mak
ers
to g
et d
etai
led
Dom
inan
ce
utili
ties,
hea
lthca
re a
nd
quite
low
with
a g
reat
er d
egre
e in
form
atio
n on
pov
erty
Cur
ves.
pu
blic
tran
spor
t in
six
of
leak
age
to ri
cher
hou
seho
lds.
re
duct
ion
stra
tegi
es fo
r
grou
ps o
f the
pop
ulat
ion.
Th
e m
ost d
ispr
opor
tiona
te
popu
latio
n su
b-gr
oups
dist
ribut
ion
is fr
om p
ublic
w
ithou
t bei
ng c
onst
rain
ed
transport.
toaspecificpovertyline.
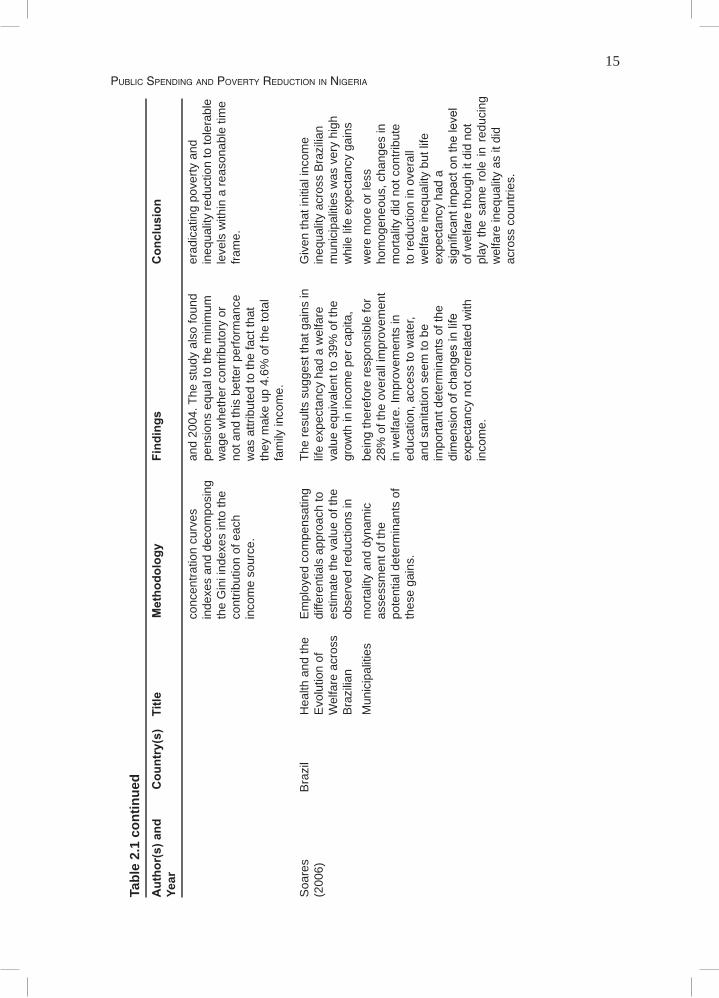
Soa
res
et a
l.
Bra
zil
Cas
h Tr
ansf
er
Aut
hors
dev
elop
ed a
Th
e st
udy
foun
d th
at b
oth
BP
C –
Th
e an
alys
is o
f dis
tribu
tive
(200
6)
P
rogr
amm
es in
m
etho
dolo
gy th
at
the
mea
ns te
sted
old
age
pen
sion
ef
fect
s of
thes
e pr
ogra
mm
es
B
razi
l: Im
pact
s
sepa
rate
d th
e in
com
e an
d di
sabi
lity
gran
t pro
gram
me
- co
ntrib
utes
to th
e co
rrec
tion
on In
equa
lity
of
diff
eren
t cas
h tra
nsfe
rs
and
Bol
sa F
amili
awerequite
ofexistingdeficienciesandto
and
Pov
erty
. pr
ogra
mm
es, e
valu
atin
g
wel
l tar
gete
d an
d bo
th jo
intly
th
e pl
anni
ng o
f fut
ure
th
e in
cide
nce
of th
e
cont
ribut
ed to
the
fall
of 2
8% in
ex
pans
ion
beca
use
of th
e
prog
ram
mes
usi
ng
the
Gin
i ine
qual
ity b
etw
een
1995
pr
ogra
mm
es im
porta
nce
in
cont
inue
d ne
xt p
age
15Public SPending and Poverty reduction in nigeria
Tabl
e 2.
1 co
ntin
ued
Aut
hor(
s) a
nd
Cou
ntry
(s)
Title
M
etho
dolo
gy
Find
ings
C
oncl
usio
nYe
ar
co
ncen
tratio
n cu
rves
an
d 20
04. T
he s
tudy
als
o fo
und
erad
icat
ing
pove
rty a
nd
inde
xes
and
deco
mpo
sing
pe
nsio
ns e
qual
to th
e m
inim
um
ineq
ualit
y re
duct
ion
to to
lera
ble
th
e G
ini i
ndex
es in
to th
e
wag
e w
heth
er c
ontri
buto
ry o
r le
vels
with
in a
reas
onab
le ti
me
co
ntrib
utio
n of
eac
h
not a
nd th
is b
ette
r per
form
ance
fra
me.
in
com
e so
urce
. w
as a
ttrib
uted
to th
e fa
ct th
at
they
mak
e up
4.6
% o
f the
tota
l
fa
mily
inco
me.
S
oare
s
Bra
zil
Hea
lth a
nd th
e E
mpl
oyed
com
pens
atin
g Th
e re
sults
sug
gest
that
gai
ns in
G
iven
that
initi
al in
com
e(2
006)
Evo
lutio
n of
di
ffere
ntia
ls a
ppro
ach
to
life
expe
ctan
cy h
ad a
wel
fare
in
equa
lity
acro
ss B
razi
lian
Wel
fare
acr
oss
es
timat
e th
e va
lue
of th
e va
lue
equi
vale
nt to
39%
of t
he
mun
icip
aliti
es w
as v
ery
high
Bra
zilia
n
obse
rved
redu
ctio
ns in
gr
owth
in in
com
e pe
r cap
ita,
whi
le li
fe e
xpec
tanc
y ga
ins
Mun
icip
aliti
es
mor
talit
y an
d dy
nam
ic
bein
g th
eref
ore
resp
onsi
ble
for
wer
e m
ore
or le
ss
asse
ssm
ent o
f the
28
% o
f the
ove
rall
impr
ovem
ent
hom
ogen
eous
, cha
nges
in
pote
ntia
l det
erm
inan
ts o
f in
wel
fare
. Im
prov
emen
ts in
m
orta
lity
did
not c
ontri
bute
th
ese
gain
s.
educ
atio
n, a
cces
s to
wat
er,
to re
duct
ion
in o
vera
ll
an
d sa
nita
tion
seem
to b
e
wel
fare
ineq
ualit
y bu
t life
impo
rtant
det
erm
inan
ts o
f the
ex
pect
ancy
had
a
dimensionofchangesinlife
significantim
pactonthelevel
expe
ctan
cy n
ot c
orre
late
d w
ith
of w
elfa
re th
ough
it d
id n
ot
in
com
e.
play
the
sam
e ro
le in
red
ucin
g
wel
fare
ineq
ualit
y as
it d
id
ac
ross
cou
ntrie
s.
16 ReseaRch PaPeR 254
The Nigerian education and health sectors: A brief inquiry on structures
Education and healthcare in Nigeria fall under the concurrent list of the 1999 Nigerian Constitution. This implies that provision of such service should be done by all the
levels of government. The local government level has the basic responsibilities for primary education and healthcare with interventions from the state and federal levels. The states have the basic responsibilities for the provision of secondary education and healthcare as well as contribution to tertiary education and healthcare. The federal level does intervene in secondary education through the federal government colleges, federal technical centres and the unity schools, but the states provide for more than 90% of the secondary education nationwide.
Currently, the federal level of government provides for more than 60% of the public tertiary education and healthcare institutions while the states provides for the rest. The tertiary education being provided by the federal level includes the federal colleges of education, federal monotechnics and polytechnics, federal conventional universities, federal universities of technology and the federal universities of agriculture. Similarly, the federal level provides for most tertiary healthcare institutions including the federal medical centres, specialist hospitals, federal university teaching hospitals and colleges of medicines. Table 1.1 provides the detailed number of each of these publicly-owned institutions as of December 2006.
The education system in Nigeria is based on 6-3-3-4 system, that is, six years of primary school, three years of junior secondary school, three years of senior secondary school and four years of tertiary education leading to a degree. With the introduction of the Universal Basic Education (UBE) in 1999, the first nine years of education (primary and junior secondary levels) are tuition-free and a meal per day per pupil subsidy for all public schools. Primary schools throughout the country are administered by the Universal Basic Education Commission (UBEC) with offices in all the 36 states of the federation including the Federal Capital Territory (FCT) for easy and up-to-date administration. As at December 2006, a total of 58,604 pubic primary schools were operating in the country with Kano State having the highest number of 3,676 and Oyo State having the lowest number of 422.
Similarly, secondary schools are administered by the Post-Primary School Management Board (PPSMB) with offices in all the 36 states of the federation including the FCT. This system is a result of the reform in the sector, which objective is to make education functional and enable outputs employable and self-reliant. It is also to encourage vocational and technical education that would be of relevance to the needs of the society. The junior secondary school is both pre-vocational and academic. At the senior level, technical, commercial and other vocational courses are included to make senior secondary school leavers employable after the Senior Secondary Certificate Examination (SSCE). There were 18,673 public secondary schools in operation by December 2006, with the highest number of 1,143 operating in Plateau State. Apart from the FCT that had 85 public secondary schools, Taraba State had the lowest number of 91 public secondary schools.
17Public SPending and Poverty reduction in nigeria
The tertiary level of education includes colleges of education, monotechnics, polytechnics, colleges of technology and the universities. Colleges of education are responsible for the training of middle-level manpower in teacher education. Successful candidates from senior secondary school that gain admission into the colleges are trained as teachers for three years; on completion, they are awarded the Nigeria Certificate in Education (NCE). As professional teachers, they can teach in primary, junior secondary (JS) or the senior secondary (SS) schools, depending on their areas of specialization. Colleges of education in the country are managed by the National Commission for Colleges of Education (NCCoE).
The monotechnics, polytechnics and colleges of technology are mainly to produce middle-level technical manpower at the sub-professional level of two categories: National Diploma (ND) and Higher National Diploma (HND). These institutions are administered by the National Board for Technical Education (NBTE).
The third tier of higher education in Nigeria is the universities. Admissions into first degree courses are through tests conducted by the Joint Admissions and Matriculation Board (JAMB) or by direct entry with Higher School Certificate or its equivalent. The basic admission requirement is SSCE with a minimum of five credits in subjects relevant to the proposed course of study. These institutions are administered by the Nigerian University Commission (NUC). The country, as of December 2006, had a total of 206 tertiary educational institutions; 93 colleges of education; 56 monotechnics, polytechnics and Colleges of Technology; and a total of 57 public universities, out of which 26 are federally controlled including one military university while 25 belong to the states. About 24 private universities were in operation in the country at the same period.
On the reflex, the healthcare sector in Nigeria comprises primary, secondary and tertiary levels. The primary healthcare is healthcare services provided by health centres, clinics, dispensaries and maternities. At this lower level, the states and Local Government Areas (LGAs) share responsibility for healthcare. States largely operate secondary health facilities (general hospitals and comprehensive health centres), providing mostly secondary care and serving as referral level for the LGAs which provide the essential elements of primary healthcare centres (PHC). Operationally, the decentralized health structures of the federal government are in the states, while those of the states are in the LGAs. Some states build and operate tertiary facilities or specialist hospitals. While the federal government is responsible for the management of teaching hospitals and medical schools for the training of doctors, the states are responsible for training nurses, midwives and community health extension workers (CHEWs). The LGAs provide basic health services and manage the primary healthcare facilities which are normally the first contact in the health system.
The primary healthcare level is administered by the Primary Healthcare Development Agency (PHDA) with offices in every state of the federation, including the FCT. In December 2006, the country had a total of 14,273 public primary healthcare centres. Kaduna State had about 813 and is the state with the highest number, while Ebonyi State has the lowest number with 30 only. There existed 6,575 private primary healthcare centres at the same period operating in the country.
Similarly, secondary healthcare facilities are administered by the respective states Hospital Management Boards (HMB) and by December 2006, Nigeria had a total of 845 public secondary healthcare centres with Kogi State having the highest number of 83,
18 ReseaRch PaPeR 254
while Taraba State had the lowest number of two public secondary healthcare centres. It is also interesting to note that private secondary healthcare centres in operation in the country as at December 2006 were 2,458 with 315 in Edo State alone and none in more than five states. Also, a total of 60 tertiary healthcare facilities were in operation as at December 2006 with only one being privately owned. Every State has at least one public tertiary healthcare centre with Lagos and Edo states having the highest number of four each.
Apart from public and private education and healthcare facilities, there also exist education and healthcare facilities established by religious and industrial organisations. According to the National Bureau of Statistics (NBS, 2007) about 2% of the population used these facilities for their education and healthcare needs in 2007.
According to the National Health Policy, the federal government is responsible for policy formulation, strategic guidance, coordination, supervision, monitoring and evaluation at all levels. It also has the operational responsibility for disease surveillance, essential drugs supply and vaccine management. In addition, it provides specialized healthcare services at tertiary health institutions (university teaching hospitals and federal medical centres). These facilities serve as referral institutions for the secondary health facilities.
Public SPending and Poverty reduction in nigeria
3. Theoretical framework and methodology
Analysing benefit incidence of public sector expenditures is tantamount to testing fiscal policy performance with respect to reduction in poverty and inequality. A number of reasons can be cited as to why the distributional outcomes from
public spending are important for Nigeria. Increasingly, the Nigerian Government is resorting to spending discretions to alleviate poverty and addressing equity objectives. In this respect, the government has increased, in nominal terms, the amounts of public resources channelled towards social and community services10 and established social investment funds such as the Universal Basic Education (UBE) fund and the National Health Insurance Scheme (NHIS).
Another factor that justifies incidence analysis in Nigeria is that households are diverse in terms of ability to access and utilize social services. Most times, it is households in the upper income echelons which may reap larger benefits from public spending programmes. Such variations could stem from wide ranging factors as derivation formula11, urban bias in concentration of public services to possible tremendous opportunity costs incurred by poor households, e.g., in sending a child to a school.
Furthermore, the poor oftentimes are not sufficiently insulated from the adverse effects of expenditure cutbacks. When reductions in total public sector expenditure become a must due to situations like a drop in the price of oil in the international market12, allocations to social sectors tend to shrink more. This point is stressed by Ravallion (2002) who pinpoints the need for safety net measures to alleviate the negative incidence impacts.
Hence, the social welfare functions for Nigeria could be conceptualized as developmental challenges that aim to maximize a composite good of poverty reduction and growth with fiscal policy entering as a right-hand side argument. A mathematical representation of such types of social welfare functions can be defined using the Gini coefficient of inequality (Gy):
2 cov [Y, F(y)]_y
G y = (1)
where cov = covariance Y = Income level F (y) = normalized rank of a household in the distribution of income
_y = mean income
19
20 ReseaRch PaPeR 254
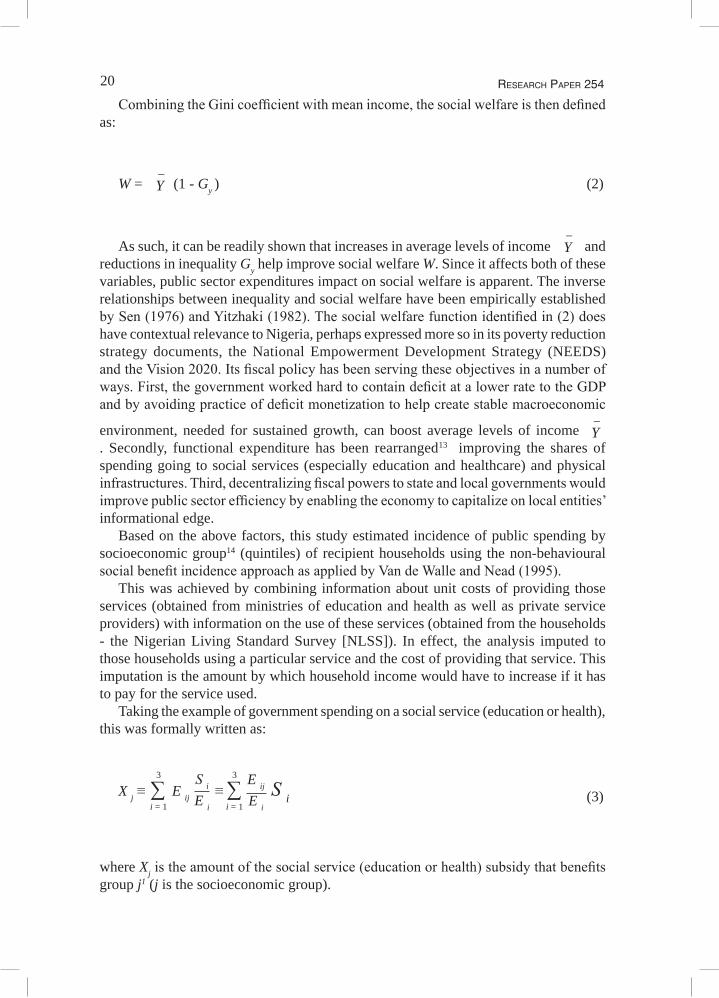
Combining the Gini coefficient with mean income, the social welfare is then defined as:
W = _Y (1 - Gy ) (2)
As such, it can be readily shown that increases in average levels of income _Y and
reductions in inequality Gy help improve social welfare W. Since it affects both of these variables, public sector expenditures impact on social welfare is apparent. The inverse relationships between inequality and social welfare have been empirically established by Sen (1976) and Yitzhaki (1982). The social welfare function identified in (2) does have contextual relevance to Nigeria, perhaps expressed more so in its poverty reduction strategy documents, the National Empowerment Development Strategy (NEEDS) and the Vision 2020. Its fiscal policy has been serving these objectives in a number of ways. First, the government worked hard to contain deficit at a lower rate to the GDP and by avoiding practice of deficit monetization to help create stable macroeconomic
environment, needed for sustained growth, can boost average levels of income _Y
. Secondly, functional expenditure has been rearranged13 improving the shares of spending going to social services (especially education and healthcare) and physical infrastructures. Third, decentralizing fiscal powers to state and local governments would improve public sector efficiency by enabling the economy to capitalize on local entities’ informational edge.
Based on the above factors, this study estimated incidence of public spending by socioeconomic group14 (quintiles) of recipient households using the non-behavioural social benefit incidence approach as applied by Van de Walle and Nead (1995).
This was achieved by combining information about unit costs of providing those services (obtained from ministries of education and health as well as private service providers) with information on the use of these services (obtained from the households - the Nigerian Living Standard Survey [NLSS]). In effect, the analysis imputed to those households using a particular service and the cost of providing that service. This imputation is the amount by which household income would have to increase if it has to pay for the service used.
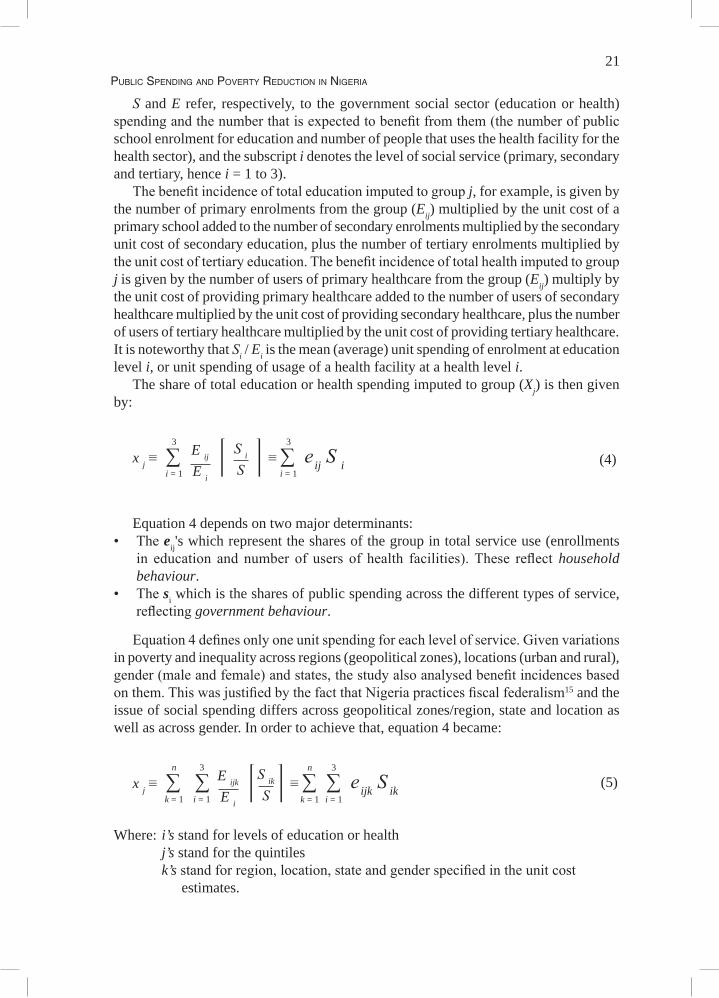
Taking the example of government spending on a social service (education or health), this was formally written as:
3
i = 1
3
i = 1X j ≡ ∑ E ij ≡ ∑ S i
S i
E i
E ij
E i (3)
where Xj is the amount of the social service (education or health) subsidy that benefits group j1 (j is the socioeconomic group).
21Public SPending and Poverty reduction in nigeria
S and E refer, respectively, to the government social sector (education or health) spending and the number that is expected to benefit from them (the number of public school enrolment for education and number of people that uses the health facility for the health sector), and the subscript i denotes the level of social service (primary, secondary and tertiary, hence i = 1 to 3).
The benefit incidence of total education imputed to group j, for example, is given by the number of primary enrolments from the group (Eij) multiplied by the unit cost of a primary school added to the number of secondary enrolments multiplied by the secondary unit cost of secondary education, plus the number of tertiary enrolments multiplied by the unit cost of tertiary education. The benefit incidence of total health imputed to group j is given by the number of users of primary healthcare from the group (Eij) multiply by the unit cost of providing primary healthcare added to the number of users of secondary healthcare multiplied by the unit cost of providing secondary healthcare, plus the number of users of tertiary healthcare multiplied by the unit cost of providing tertiary healthcare. It is noteworthy that Si / Ei is the mean (average) unit spending of enrolment at education level i, or unit spending of usage of a health facility at a health level i.
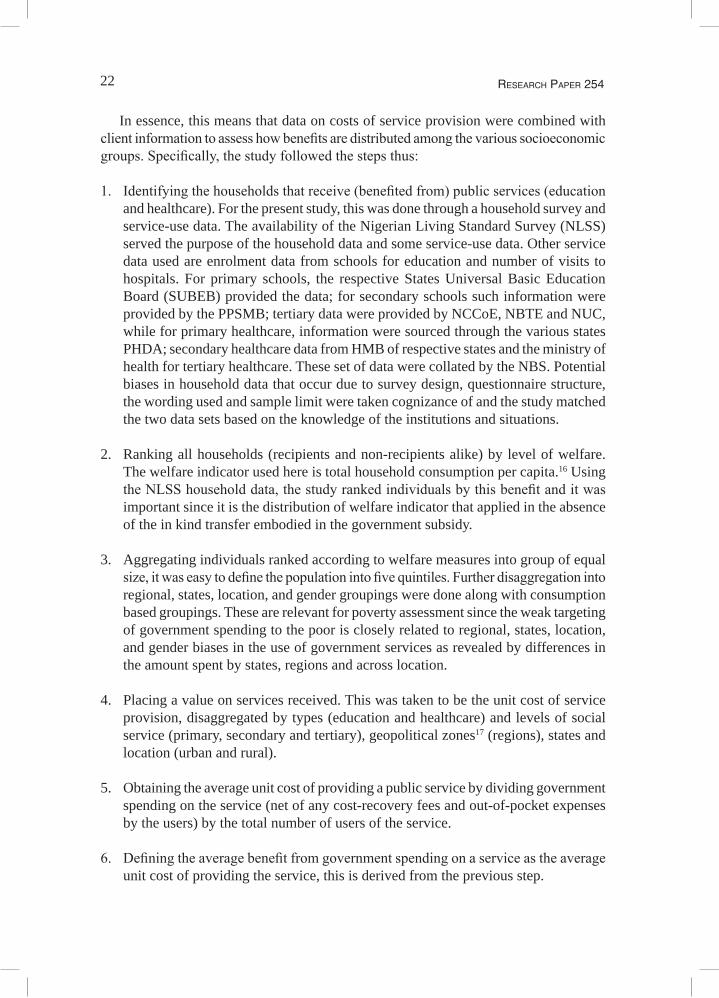
The share of total education or health spending imputed to group (Xj) is then given by:
S i
S
3
i = 1
3
i = 1x j ≡ ∑ f p ≡ ∑ e ij S i
E ij
E i
(4)
Equation 4 depends on two major determinants: • The eij's which represent the shares of the group in total service use (enrollments
in education and number of users of health facilities). These reflect household behaviour.
• The si which is the shares of public spending across the different types of service, reflecting government behaviour.
Equation 4 defines only one unit spending for each level of service. Given variations in poverty and inequality across regions (geopolitical zones), locations (urban and rural), gender (male and female) and states, the study also analysed benefit incidences based on them. This was justified by the fact that Nigeria practices fiscal federalism15 and the issue of social spending differs across geopolitical zones/region, state and location as well as across gender. In order to achieve that, equation 4 became:
x j ≡ ∑ ∑ f p ≡ ∑ ∑ e ijk S ikS ik
S
n
k = 1
3
i = 1
n
k = 1
3
i = 1
E ijk
E i
(5)
Where: i’s stand for levels of education or health j’s stand for the quintiles k’s stand for region, location, state and gender specified in the unit cost estimates.
22 ReseaRch PaPeR 254
In essence, this means that data on costs of service provision were combined with client information to assess how benefits are distributed among the various socioeconomic groups. Specifically, the study followed the steps thus:
1. Identifying the households that receive (benefited from) public services (education and healthcare). For the present study, this was done through a household survey and service-use data. The availability of the Nigerian Living Standard Survey (NLSS) served the purpose of the household data and some service-use data. Other service data used are enrolment data from schools for education and number of visits to hospitals. For primary schools, the respective States Universal Basic Education Board (SUBEB) provided the data; for secondary schools such information were provided by the PPSMB; tertiary data were provided by NCCoE, NBTE and NUC, while for primary healthcare, information were sourced through the various states PHDA; secondary healthcare data from HMB of respective states and the ministry of health for tertiary healthcare. These set of data were collated by the NBS. Potential biases in household data that occur due to survey design, questionnaire structure, the wording used and sample limit were taken cognizance of and the study matched the two data sets based on the knowledge of the institutions and situations.
2. Ranking all households (recipients and non-recipients alike) by level of welfare. The welfare indicator used here is total household consumption per capita.16 Using the NLSS household data, the study ranked individuals by this benefit and it was important since it is the distribution of welfare indicator that applied in the absence of the in kind transfer embodied in the government subsidy.
3. Aggregating individuals ranked according to welfare measures into group of equal size, it was easy to define the population into five quintiles. Further disaggregation into regional, states, location, and gender groupings were done along with consumption based groupings. These are relevant for poverty assessment since the weak targeting of government spending to the poor is closely related to regional, states, location, and gender biases in the use of government services as revealed by differences in the amount spent by states, regions and across location.
4. Placing a value on services received. This was taken to be the unit cost of service provision, disaggregated by types (education and healthcare) and levels of social service (primary, secondary and tertiary), geopolitical zones17 (regions), states and location (urban and rural).
5. Obtaining the average unit cost of providing a public service by dividing government spending on the service (net of any cost-recovery fees and out-of-pocket expenses by the users) by the total number of users of the service.
6. Defining the average benefit from government spending on a service as the average unit cost of providing the service, this is derived from the previous step.
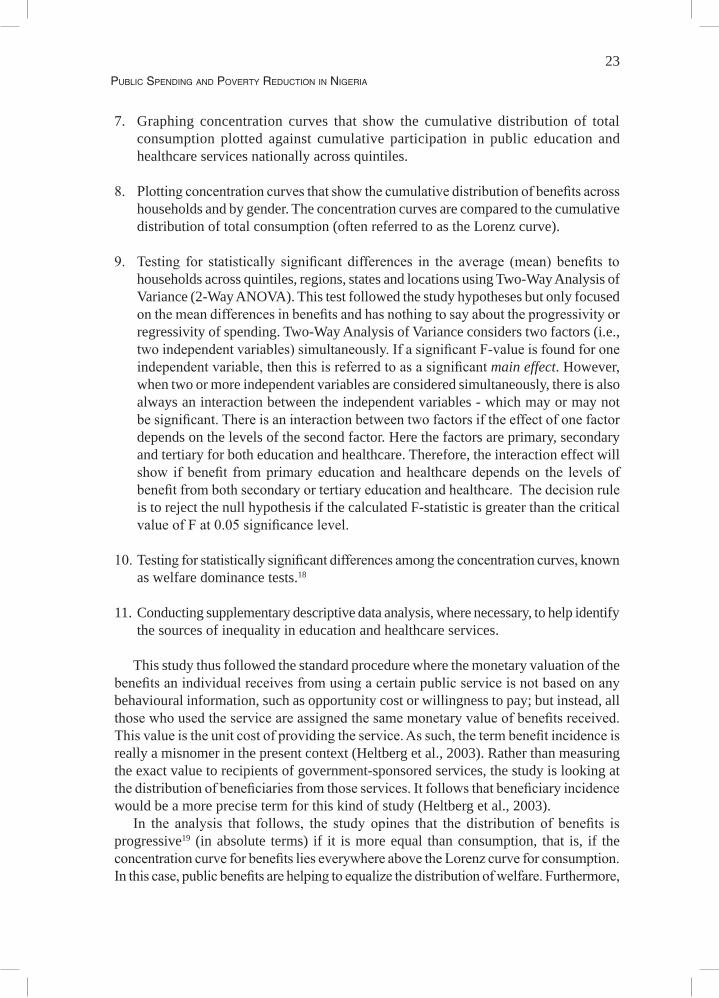
23Public SPending and Poverty reduction in nigeria
7. Graphing concentration curves that show the cumulative distribution of total consumption plotted against cumulative participation in public education and healthcare services nationally across quintiles.
8. Plotting concentration curves that show the cumulative distribution of benefits across households and by gender. The concentration curves are compared to the cumulative distribution of total consumption (often referred to as the Lorenz curve).
9. Testing for statistically significant differences in the average (mean) benefits to households across quintiles, regions, states and locations using Two-Way Analysis of Variance (2-Way ANOVA). This test followed the study hypotheses but only focused on the mean differences in benefits and has nothing to say about the progressivity or regressivity of spending. Two-Way Analysis of Variance considers two factors (i.e., two independent variables) simultaneously. If a significant F-value is found for one independent variable, then this is referred to as a significant main effect. However, when two or more independent variables are considered simultaneously, there is also always an interaction between the independent variables - which may or may not be significant. There is an interaction between two factors if the effect of one factor depends on the levels of the second factor. Here the factors are primary, secondary and tertiary for both education and healthcare. Therefore, the interaction effect will show if benefit from primary education and healthcare depends on the levels of benefit from both secondary or tertiary education and healthcare. The decision rule is to reject the null hypothesis if the calculated F-statistic is greater than the critical value of F at 0.05 significance level.
10. Testing for statistically significant differences among the concentration curves, known as welfare dominance tests.18
11. Conducting supplementary descriptive data analysis, where necessary, to help identify the sources of inequality in education and healthcare services.
This study thus followed the standard procedure where the monetary valuation of the benefits an individual receives from using a certain public service is not based on any behavioural information, such as opportunity cost or willingness to pay; but instead, all those who used the service are assigned the same monetary value of benefits received. This value is the unit cost of providing the service. As such, the term benefit incidence is really a misnomer in the present context (Heltberg et al., 2003). Rather than measuring the exact value to recipients of government-sponsored services, the study is looking at the distribution of beneficiaries from those services. It follows that beneficiary incidence would be a more precise term for this kind of study (Heltberg et al., 2003).
In the analysis that follows, the study opines that the distribution of benefits is progressive19 (in absolute terms) if it is more equal than consumption, that is, if the concentration curve for benefits lies everywhere above the Lorenz curve for consumption. In this case, public benefits are helping to equalize the distribution of welfare. Furthermore,

24 ReseaRch PaPeR 254
if the distribution of spending is such that poorer individuals receive more per capita in absolute terms than richer individuals or if bq1>bq2>bq3>bq4>bq5 (where bq1 is the benefit to first quintile, bq2 is the benefit to second quintile, bq3 is the benefit to third quintile, bq4 is the benefit to fourth quintile and bq5 is the benefit to the fifth quintile) for the traditional benefit incidence results, the study will say that the distribution is per capita progressive (also referred to as absolute progressivity). Graphically, per capita progressivity appears as a concentration curve of benefits above the 45-degree line. Per capita progressivity indicates successful targeting of benefits towards lower income groups. If benefits are distributed more unequally than consumption (i.e., the concentration curve lies below the Lorenz curve), services are said to be regressive. When curves cross, no determination of progressivity or regressivity can be made using the Lorenz criterion.20
The main advantage of the non-behavioural benefit incidence methodology is its simplicity and the relatively modest data requirements. A potential problem occurs when quality of the service varies systematically with the level of welfare. If poorer individuals receive lower quality services, the results will be biased in the direction of finding progressive results. It is most important to use data for the unit costs of service provision that are as disaggregated as possible. In this way, variation in the quality of service may be captured (to the extent quality variation shows up in the unit costs), and bias will be reduced.21 The study, therefore, obtained unit costs at levels that are disaggregated by region, state, location and kind of service provided.
This study estimated unit costs at all levels and for all social services based on actual public expenditure and not on budget allocations. This was done across states, regions and locations. Revenue from cost recovery was netted out for secondary education22 in some states that their tuition fees are paid directly into the state government coffers only. Revenue from cost recovery was not netted out for other states and other levels of education and healthcare because other levels of education and healthcare have their revenue remaining within the facilities providing the service hence this revenue adds to the value of the service that the household obtains, over and above the government subsidy. Therefore, it can be regarded as cost sharing rather than cost recovery.
Pearson (2002) has shown that BIA relates to public expenditure, and is concerned with the issue of how effectively governments are able to target their limited, resources towards meeting the need of the poor. The study argument rests in employing the incidence analysis in the health system performance instead of the World Health Report (WHR) approach which was criticized mainly on the ground that WHR approach treats the health system as a “black box” attempting to measure the performance by investigating the link between health expenditure and five health sector goals (average health status, distribution of health status, average responsiveness and the fairness of financial contribution). The WHR approach made no attempt to look inside the black box and explain how the expenditure translates into these goals by looking at which health services are delivered and who receives them. On the other hand, using BIA was found to give better insight into these factors responsible for health sector performance hence the study findings contributed conveniently and reliably to the policy debate.
Further development, as shown by Demery (2000) BIA model focusing on average benefits from public spending, has been in use. The model, has its final result, discusses the issue of how effectively governments are able to target their limited resources
25Public SPending and Poverty reduction in nigeria
towards meeting the need of the poor. From the model, it is easy to identify users of basic spending or services which are based on information obtained through a household survey. The survey data, which is usually through a sample of some households, is used alongside service data (enrolment data from schools, or visits from hospital records). Hence, unit subsidy data that will be estimated from spending, which is derived from official sources is combined with service-use information from the selected household survey. The above methodology has been used for most developing countries like Ghana, Ivory Coast, Indonesia, among others.
BIA has been applied by some studies but it has its limitations. Some of the limitations include: • its description of average participation rates is not necessarily useful in guiding
marginal changes in public expenditure policy from the status quo, a point first made by Lipton and Ravallion (1995) and confirmed by Younger (2002);
• unit costs do not always reflect values. Unit costs also reflect inefficiency in public provision. For example, a tracking study in Uganda found that only 38% of non-wage recurrent primary education spending actually reached the schools. Quality variations in services are not always reflected in unit costs (Demery, 2001);
• BIA takes the pattern of service-use as given which tells nothing about what determines such behaviour and what constrains households;
• it is less theoretically robust, and does not permit counterfactual experiments, simulating alternative outcomes based on the estimated demand functions;
• incidence analysis does not deal very well with issues of service quality; • BIA measures distributional impact and not impact itself; and • interpreting the pattern of benefit incidence tells us very little about what would
happen if governments increase spending on certain categories.
BIA is also based on the following assumptions and conditions:• benefit incidence should be assigned to households based on household survey
information on usage rather than on ad hoc assumptions that assign benefits based on income or the number of members in the household;
• improved annual cost measures for services need to be developed, particularly for capital inputs;
• careful attention to life cycle benefits, benefit shifting, rent-seeking, out-of-pocket costs, displacement of private sector efforts, average versus marginal incidence, and several other issues can significantly increase the value of benefit incidence analysis to policymakers;
• aggregate results based on the zero-government counterfactual rely on strong assumptions about fixed relative prices and incomes, government efficiency, and the relationship between marginal and total benefits; and
• it assumes that all relative prices and real incomes are fixed, and benefits are not shifted, marginal benefits are equal to average benefits, and average cost is a good proxy for marginal benefit.
Despite its limitations, it is generally believed that the expenditure-based incidence approach can provide a useful first look at the allocation of government expenditure among households.
26 ReseaRch PaPeR 254
Procedure of testing for differences in concentration curves (dominance tests)
Dominance test, in this study, was primarily based on ranking the progressivity of benefits of categories of social expenditure (education and healthcare) across
all levels (primary, secondary and tertiary). The tests evaluated the distribution of expenditure against two benchmarks looking at whether they are absolutely progressive (i.e., inequality reducing relative to welfare benchmark which is the 45-degree line), and if they are per capita progressive meaning that households at the lower (upper) end of the income distribution receive at least an equal level of benefit as upper (lower) income households. These tests were necessary because concentration curves are estimated from survey data and are therefore subject to sampling variability hence the need for statistical comparisons. It is true that visual inspection of a concentration curve in comparison with the 45-degree line or another concentration curve like the Lorenz curve (per capita expenditure/consumption) may give an impression of whether there is dominance, but clearly this inspection may not be sufficient to conclude whether or not dominance is statistically significant. In order to make inferences about dominance, the standard errors of the concentration curve ordinates must be computed in addition to their point estimates.
Several approaches have been applied by various authors in testing for differences in concentration curves or dominance tests depending on the interest of analyst. If the interest is to test dominance of a concentration curve(s) against the Lorenz curve of expenditure/consumption or against another concentration curve estimated from the same sample, then the standard errors for the differences between curve ordinates must be computed though this is complicated by the fact that, in such cases, the curves are dependent. An appropriate variance-covariance matrix which allows for dependence between curves was derived by Bishop et al. (1994) and Davidson and Duclos (1997) to help overcome the problem. Davidson and Duclos (1997) thus derived an estimator which is a distribution-free standard error for the difference between two concentration curves that may be dependent. Such estimator was used to establish a confidence interval around the estimated concentration curves and then tested for significant differences between them with the null hypothesis that the ordinates of two concentration curves are equal at each of 19 evenly spaced abscissa. According to Howes (1996), the null hypothesis of equality will be rejected if all 19 ordinate pairs are significantly different.
Dominance tests in this study followed the above as applied by Sahn and Younger (1999; 2000) and O’Donnell et al. (2007), but in addition to accounting for the possible dependence between concentration curves, the current study used the covariance matrix for the ordinates estimates which was also used by Sahn and Younger (1999). This was to avoid the fact that, statistical tests using only t-tests for the difference between ordinates of two concentration curves at several abscissa (usually 0.1 to 0.9) leading to the rejection of the null hypothesis of non-dominance when one of the ordinates differs statistically in the direction of dominance as long as none of the other pairs indicates a statistically significant result in the opposite direction which has been widely used commonly leads to the acceptance of the null hypothesis quite often. This has resulted to very little in concluding about the progressivity of categories of, not only expenditures/consumption, but also taxes.
27Public SPending and Poverty reduction in nigeria
However, according to Sahn and Younger (1999), bounding the size of test at the risk of low power is consistent with standard econometric but failure to reject the null hypothesis leads to indeterminate result, unless there is an establishment that the two curves cross and can be revealed by two significant differences in ordinates of opposite signs.
Besides the decision rule, the study noted that, it is important to choose the number of quantile points at which ordinates are to be compared. If the number of comparison points is too restricted, then dominance across the full range of the distribution is not being tested. According to Howes (1996), it is difficult to find dominance at the extremes of distributions. With reasonably large samples, a popular choice has been to test for differences at 19 evenly spaced quantiles from 0.05 to 0.9523 as applied by Sahn and Younger (2000), Sahn et al. (2000) and O’Donnell et al. (2007). Therefore, the decision rule will be thus: Using 19 equally spaced ordinates from 0.05 to 0.95, the null hypothesis (non-dominance) is rejected in favour of dominance if all t-statistics are greater than the critical value and of the same sign; or the null hypothesis is rejected in favour of crossing if there are at least two significant t-statistics with opposite signs. This means that rejecting the null on non-dominance using the above procedure implies that one distribution is preferred to the other under any social welfare function that favours progressivity.24
Data and sources
The survey data for the study was primarily drawn from the NLSS 2003/2004, a welfare monitoring survey collected by the NBS in collaboration with the European
Union and the World Bank. The data has 19,158 households with complete information out of the 22,000 households in the sample. These households comprised both rural and urban households. Broad issues included in the survey range from access to education, healthcare services, and housing status to possession of assets and other selected living standard indicators. Information were also collected on individual basis for education and healthcare issues and further disaggregated by gender with 40,967 responses from male and 39,725 responses from females for education issues as well as 47,208 from males and 45,308 from females for healthcare related issues.25 Here, access to education and healthcare were chosen for analysis taking into account their close correlation with welfare status of households. The data contained information on households’ total expenditure and households’ expenditure on education and healthcare. Data from the survey was disaggregated into state levels, and gender (male and female) in both healthcare and education. The data was also disaggregated into location (rural and urban) and into geopolitical zones.26 Though there were many inconsistencies in the data, to partially overcome this data problem, the study assumes that service-access rates for each household group (quintile) in a specific zone overlaps with corresponding rural or urban patterns. This was certain to compromise the degree of analytical insights and policy derivations, which otherwise would have been achieved, by masking existing access differences among local administrations.
The following data from secondary sources were helpful in this study:• Actual revenue and expenditures on education and healthcare across local
28 ReseaRch PaPeR 254
governments, states and the federal level for the year 2004. These set of data were sourced from the Central Bank of Nigeria (CBN), respective states auditor generals reports for actual spending on education and healthcare in the 36 states, including the FCT. These reports were already submitted to the African Institute for Applied Economics (AIAE), Enugu, Nigeria. The institution coordinated the State Economic Empowerment and Development Strategy (SEEDS) benchmarking exercise for all states hence has access to all the state finances and expenditures except that of Ogun State in the south-west region which the author sourced directly. The federal component was sourced from the Federal Ministry of Finance, Abuja, Nigeria.
• Enrolment rates for every level of education was sourced from the NBS, Federal Ministry of Education as well as the respective states UBEC, PPSMB, NCCoE, NBTE, and NUC.
Public SPending and Poverty reduction in nigeria
29
4. Results, findings and discussion
The study analysed benefits across household groups, regions, states and location using the traditional BIA technique as reflected in the study’s methodology. The study also graphed concentration curves that show the cumulative distribution
of total consumption, plotted against cumulative participation in public education and healthcare services. Concentration curves were applied to test the progressivity, regressivity or neutrality of public expenditure on education and healthcare across household groups by federal spending, states, regions, location and gender. The results of the traditional BIA are presented in tables 4.2, 4.3, A1, A2, and A3, while concentration curves across household groups and by gender are presented in figures 4.1–4.5. Concentration curves for states and regions were not presented because they lack visual comprehensiveness but their ordinates were used in the dominance tests.
Usage of public education and healthcare facilities across quintiles and location
Benefiting from a facility can only be possible when a household uses such facility: the study analysed the usage of all levels of public and private education and healthcare
facilities by household groups (quintiles) and also across location to ascertain who uses and who does not use. Table 4.1 shows the result of the analysis.
The results in Table 4.1 show that more than 70% and 58% of households in the first quintile (the poorest households) make use of public primary education and healthcare facilities, respectively, while only 14% and 29% of household in the fifth quintile (the richest households) are using the same facilities. It also shows that over 80% and 70%, respectively, of household in the fifth quintile (the richest households) patronize private primary schools and healthcare centres as against 13% and 31%, respectively, from the first quintile (the poorest households). Apart from the public and private education and healthcare facilities, there also exist religious, industrial and other education and healthcare facilities. Such education and healthcare facilities make up for the shortfall from 100% in the addition of public and private facilities across quintiles.
Another striking evidence from Table 4.1 is that, usage of public education and healthcare facilities by poorer households (Quintiles 1-3) decreases as the level of education or healthcare increases while usage of public education and healthcare facilities by richer households (Quintiles 4-5) increases with increase in the level of education and healthcare. This, in effect, may imply that usage of higher levels of public education and healthcare facilities depends on how rich every household is.
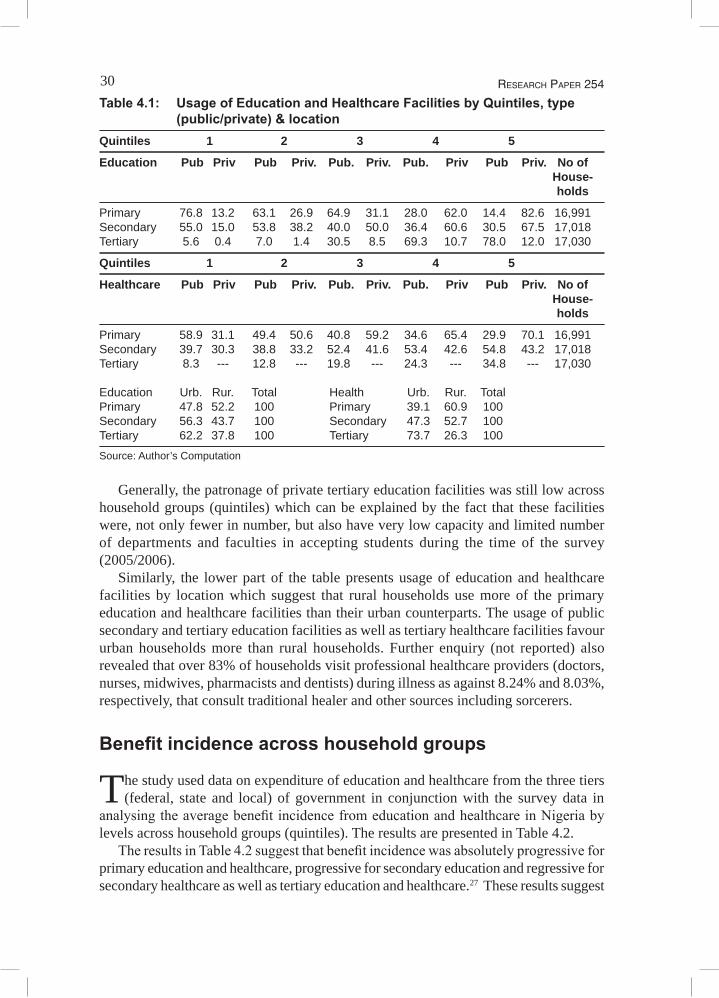
30 ReseaRch PaPeR 254
Table 4.1: Usage of Education and Healthcare Facilities by Quintiles, type (public/private) & location
Quintiles 1 2 3 4 5
Education Pub Priv Pub Priv. Pub. Priv. Pub. Priv Pub Priv. No of House- holds
Primary 76.8 13.2 63.1 26.9 64.9 31.1 28.0 62.0 14.4 82.6 16,991Secondary 55.0 15.0 53.8 38.2 40.0 50.0 36.4 60.6 30.5 67.5 17,018Tertiary 5.6 0.4 7.0 1.4 30.5 8.5 69.3 10.7 78.0 12.0 17,030
Quintiles 1 2 3 4 5
Healthcare Pub Priv Pub Priv. Pub. Priv. Pub. Priv Pub Priv. No of House- holds
Primary 58.9 31.1 49.4 50.6 40.8 59.2 34.6 65.4 29.9 70.1 16,991Secondary 39.7 30.3 38.8 33.2 52.4 41.6 53.4 42.6 54.8 43.2 17,018Tertiary 8.3 --- 12.8 --- 19.8 --- 24.3 --- 34.8 --- 17,030 Education Urb. Rur. Total Health Urb. Rur. Total Primary 47.8 52.2 100 Primary 39.1 60.9 100Secondary 56.3 43.7 100 Secondary 47.3 52.7 100Tertiary 62.2 37.8 100 Tertiary 73.7 26.3 100
Source: Author’s Computation
Generally, the patronage of private tertiary education facilities was still low across household groups (quintiles) which can be explained by the fact that these facilities were, not only fewer in number, but also have very low capacity and limited number of departments and faculties in accepting students during the time of the survey (2005/2006).
Similarly, the lower part of the table presents usage of education and healthcare facilities by location which suggest that rural households use more of the primary education and healthcare facilities than their urban counterparts. The usage of public secondary and tertiary education facilities as well as tertiary healthcare facilities favour urban households more than rural households. Further enquiry (not reported) also revealed that over 83% of households visit professional healthcare providers (doctors, nurses, midwives, pharmacists and dentists) during illness as against 8.24% and 8.03%, respectively, that consult traditional healer and other sources including sorcerers.
Benefit incidence across household groups
The study used data on expenditure of education and healthcare from the three tiers (federal, state and local) of government in conjunction with the survey data in
analysing the average benefit incidence from education and healthcare in Nigeria by levels across household groups (quintiles). The results are presented in Table 4.2.
The results in Table 4.2 suggest that benefit incidence was absolutely progressive for primary education and healthcare, progressive for secondary education and regressive for secondary healthcare as well as tertiary education and healthcare.27 These results suggest
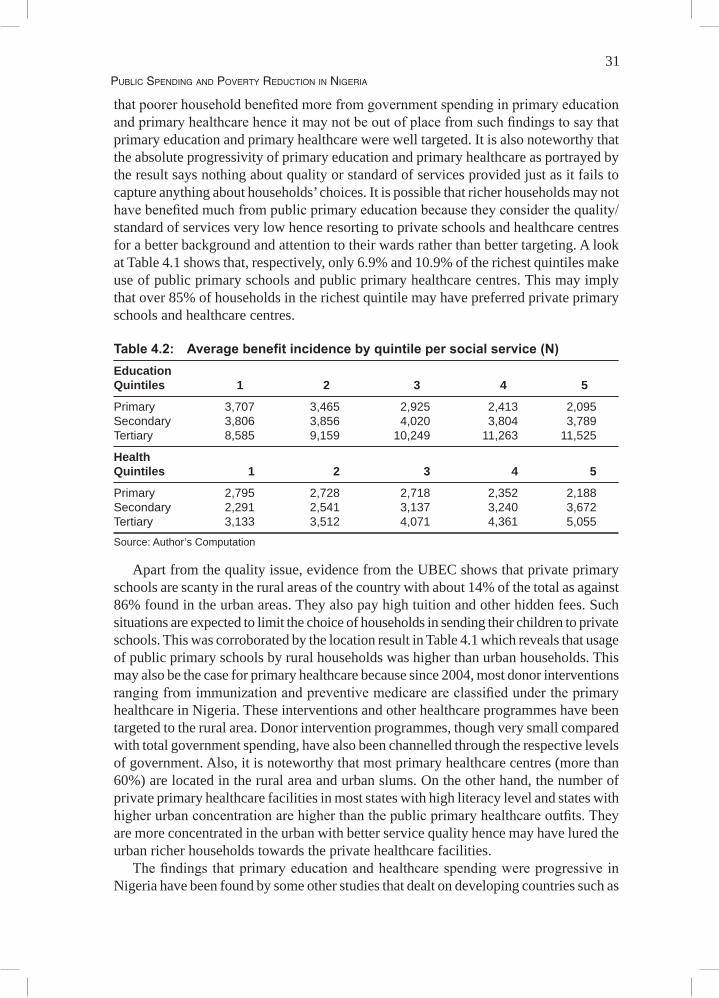
31Public SPending and Poverty reduction in nigeria
that poorer household benefited more from government spending in primary education and primary healthcare hence it may not be out of place from such findings to say that primary education and primary healthcare were well targeted. It is also noteworthy that the absolute progressivity of primary education and primary healthcare as portrayed by the result says nothing about quality or standard of services provided just as it fails to capture anything about households’ choices. It is possible that richer households may not have benefited much from public primary education because they consider the quality/standard of services very low hence resorting to private schools and healthcare centres for a better background and attention to their wards rather than better targeting. A look at Table 4.1 shows that, respectively, only 6.9% and 10.9% of the richest quintiles make use of public primary schools and public primary healthcare centres. This may imply that over 85% of households in the richest quintile may have preferred private primary schools and healthcare centres.
Table 4.2: Average benefit incidence by quintile per social service (N)Education Quintiles 1 2 3 4 5
Primary 3,707 3,465 2,925 2,413 2,095Secondary 3,806 3,856 4,020 3,804 3,789Tertiary 8,585 9,159 10,249 11,263 11,525
Health Quintiles 1 2 3 4 5
Primary 2,795 2,728 2,718 2,352 2,188Secondary 2,291 2,541 3,137 3,240 3,672Tertiary 3,133 3,512 4,071 4,361 5,055
Source: Author’s Computation
Apart from the quality issue, evidence from the UBEC shows that private primary schools are scanty in the rural areas of the country with about 14% of the total as against 86% found in the urban areas. They also pay high tuition and other hidden fees. Such situations are expected to limit the choice of households in sending their children to private schools. This was corroborated by the location result in Table 4.1 which reveals that usage of public primary schools by rural households was higher than urban households. This may also be the case for primary healthcare because since 2004, most donor interventions ranging from immunization and preventive medicare are classified under the primary healthcare in Nigeria. These interventions and other healthcare programmes have been targeted to the rural area. Donor intervention programmes, though very small compared with total government spending, have also been channelled through the respective levels of government. Also, it is noteworthy that most primary healthcare centres (more than 60%) are located in the rural area and urban slums. On the other hand, the number of private primary healthcare facilities in most states with high literacy level and states with higher urban concentration are higher than the public primary healthcare outfits. They are more concentrated in the urban with better service quality hence may have lured the urban richer households towards the private healthcare facilities.
The findings that primary education and healthcare spending were progressive in Nigeria have been found by some other studies that dealt on developing countries such as
32 ReseaRch PaPeR 254
Van de Walle and Nead (1995) for thirteen developing countries, Demery (1996) and the World Bank (1995b) for Ghana and Bulgaria, Rannan-Eliya et al. (2001) for Sri Lanka, Yuki (2003) for Yemen, Heltberg et al. (2001; 2003) for Mozambique where public service provision were found to be more equal than in many other African countries with the exception of the upper secondary and university education, amongst others.
Conversely, the finding of regressivity of spending from Table 4.2 for secondary and tertiary education and healthcare have corroborated findings of other studies from developing countries such as Castro-Leal et al. (1999) for seven Sub-Saharan African countries, Ajay et al. (2000) for India and its principal states, Sahn and Younger (2000) for eight sub-Saharan African countries, Rannan-Eliya et al. (2001) for Bangladesh, Foster et al. (2002) for Ghana, Malawi, Mozambique, Tanzania and Uganda. Specifically, Sabir (2002) in a study on Pakistan, found that government subsidies directed towards higher education, either general education or professional education, were poorly targeted to low-income households and indeed favoured those who were better-off.
Benefit incidence by gender
The study analysed the benefit incidence for education and healthcare by gender (male and female). Unlike most other traditional BIA studies reviewed in this study,
the gender dimension used individuals with responses from 27,845 males and 22,753 females as its unit of analysis instead of the households. This was due to the fact that the only available household data disaggregated into gender is the household head. Using household head to represent gender has been criticized by Muthwa (1993:8), who stated that “within the household, there is much exploitation of women by men which goes unnoticed when we use poverty measures which simply treat households as units and ignore intra-household aspects of exploitation.”
The use of individual, by the study, was based on the argument by Moser (1998) who argued that a focus on what the poor aspire to, what they have, and how they make use of it, allows for a much more holistic, person-oriented, appreciation of how survival is negotiated. Similarly, González de la Rocha and Grinspun (2001:59-60) observes that “analysing vulnerability requires opening up the household so as to assess how resources are generated and used, how they are converted into assets, and how the returns from these assets are distributed among household members.”
Based on the forgoing argument, the study used individual as a unit of analysis instead of the head of the household to represent the gender dimension. The results of gender disaggregated analysis for education and healthcare are presented in figures 4.1 and 4.2, respectively.
A visual inspection of figures 4.1 (for education) and 4.2 (for healthcare) reveals an absolute progressivity for primary education and healthcare spending for both males and females; absolute progressivity for female secondary education spending; progressivity for male secondary healthcare expenditure; and regressivity for both male and female tertiary education and healthcare spending. The progressivity or regressivity of male secondary education spending could not be ascertained by a visual look at the concentration curve.
The absolute progressivity for primary education and healthcare spending for both

33Public SPending and Poverty reduction in nigeria
sexes corroborated the general findings on incidence to national household groups, but progressivity for male secondary healthcare contradicted the general findings by national household groups for healthcare.
Figure 4.1: Concentration curves for education by gender in Nigeria
Figure 4.2: Concentration curves for healthcare by gender in Nigeria
The finding of female absolute progressivity in secondary education benefit in Nigeria can be attributed to the fact that, secondary education in Nigeria is normally in three forms viz: boys, girls and mixed and it has been observed, by most studies, that girls’ secondary schools are more in number than their boys’ counterparts and per capita spending for such public girls’ secondary schools are by far higher than public boys’ secondary schools in order to encourage girls education. Such arrangement of providing separate schools for males and females may have given the female folk an edge in secondary education benefits than secondary healthcare where both sexes are required to use the same facilities ignoring religious and cultural beliefs which may inhibit a particular sex from not using
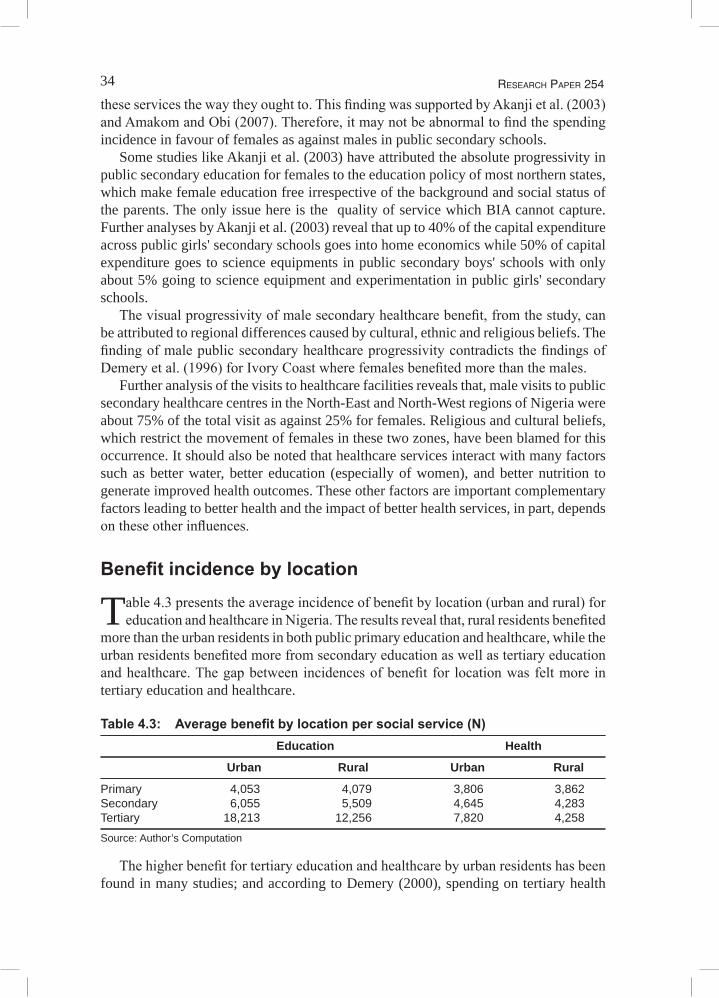
34 ReseaRch PaPeR 254
these services the way they ought to. This finding was supported by Akanji et al. (2003) and Amakom and Obi (2007). Therefore, it may not be abnormal to find the spending incidence in favour of females as against males in public secondary schools.
Some studies like Akanji et al. (2003) have attributed the absolute progressivity in public secondary education for females to the education policy of most northern states, which make female education free irrespective of the background and social status of the parents. The only issue here is the quality of service which BIA cannot capture. Further analyses by Akanji et al. (2003) reveal that up to 40% of the capital expenditure across public girls' secondary schools goes into home economics while 50% of capital expenditure goes to science equipments in public secondary boys' schools with only about 5% going to science equipment and experimentation in public girls' secondary schools.
The visual progressivity of male secondary healthcare benefit, from the study, can be attributed to regional differences caused by cultural, ethnic and religious beliefs. The finding of male public secondary healthcare progressivity contradicts the findings of Demery et al. (1996) for Ivory Coast where females benefited more than the males.
Further analysis of the visits to healthcare facilities reveals that, male visits to public secondary healthcare centres in the North-East and North-West regions of Nigeria were about 75% of the total visit as against 25% for females. Religious and cultural beliefs, which restrict the movement of females in these two zones, have been blamed for this occurrence. It should also be noted that healthcare services interact with many factors such as better water, better education (especially of women), and better nutrition to generate improved health outcomes. These other factors are important complementary factors leading to better health and the impact of better health services, in part, depends on these other influences.
Benefit incidence by location
Table 4.3 presents the average incidence of benefit by location (urban and rural) for education and healthcare in Nigeria. The results reveal that, rural residents benefited
more than the urban residents in both public primary education and healthcare, while the urban residents benefited more from secondary education as well as tertiary education and healthcare. The gap between incidences of benefit for location was felt more in tertiary education and healthcare.
Table 4.3: Average benefit by location per social service (N) Education Health
Urban Rural Urban Rural
Primary 4,053 4,079 3,806 3,862Secondary 6,055 5,509 4,645 4,283Tertiary 18,213 12,256 7,820 4,258
Source: Author’s Computation
The higher benefit for tertiary education and healthcare by urban residents has been found in many studies; and according to Demery (2000), spending on tertiary health
35Public SPending and Poverty reduction in nigeria
facilities (teaching hospitals, for example) will not benefit the population at large, as such facilities are used mostly by better-off urban residents. This may be true in Nigeria where more than 60% of public secondary and tertiary education, as well as healthcare facilities, are sited in the urban areas. It should also be noted that, education and healthcare services typically attract higher subsidies in urban than in rural areas. It has also been observed that, in Nigeria, education and healthcare services, generally, are often better financed in capital cities than in other urban areas. These variations in unit subsidies may have led to inequalities in the distribution of benefits across location in Nigeria.
Benefit incidence across regions (geopolitical zones)
Nigeria is divided into six regions known as geopolitical zones, with three from the north and three from the south. Each region is made up of five to seven states.
There are no legal regional governments with autonomous expenditure, though states in every region do come together to look at common problems and agree on strategies towards solving them. Regional spending, from the study’s results, was generated through the aggregation of different states spending. Therefore, much discussion may not be necessary at this level but at the states level, where there exists a legal backing for all spending priorities. Incidence of benefits across region (geopolitical zones) in Nigeria is presented in Table A1 in Annex 1. A look at the traditional BIA results showed an absolute progressivity for primary education and healthcare for South-East and South-South regions and progressivity for other regions of the country. Secondary education and healthcare revealed a mixed trend, while tertiary education and healthcare services showed regressivity. It is also noteworthy that the South-East region, with the least average incidence of benefit for public primary education and next to South-South and North-Central in primary healthcare, comes up to be the region with lowest poverty incidence, lowest infant mortality rate, lowest public medical access, lowest under five mortality rates, lowest number of public primary schools but with the highest number of private primary education and healthcare facilities per capita, as shown in Table 1.1.
If the region has lowest average incidence of the basic public education, yet one of the best education and poverty outcomes, this may imply that the progress may not be entirely attributed to public or government spending. The high patronage of private education and healthcare providers in the region was corroborated by Ichoku (2008) who revealed that the region is incurring catastrophic expenditure because it spends 40% or more of its discretionary (non-food) or 10% or more of its total expenditure on healthcare. The study further revealed that, in 2004, 24% of South-East households incurred catastrophic health expenditure; about 37% of the households spent more than 25% of total annual expenditure on healthcare and this catastrophic expenditure is more prevalent among the richest income quintile. This may also be true for the entire country since a careful analysis of other regions, in comparison with the secondary statistics provided in Table 1.1, reveals no significant correlation between the education/healthcare benefit incidences and the general outcomes of education/healthcare. Therefore, it may not just be that there are regional differences in benefit incidence of public education and healthcare services in Nigeria but also different outcomes. The finding of differences in regional incidences corroborated Demery (1996)and The World Bank (1995b) for Ghana and
36 ReseaRch PaPeR 254
Bulgaria, in a study that showed a wide disparity in racial access to healthcare, thereby making healthcare targeting a regional or ethnic issue. The above analyses are based on the results of the traditional BIA. Further issues about the progressivity or regressivity of spending are dealt with under the section on dominance tests.
Benefit incidence across Nigeria states
Nigeria is a federal state with three tiers of government (one national or federal, 36 states including the Federal Capital Territory (FCT) and 774 local governments).
The three levels are autonomous in decision making, especially on spending, though the last Supreme Court judgment recognized local government councils as appendages of the state level. All the states have every right under the 1999 NigerianConstitution to do the following: • identify its priority areas for development and sources of revenue;• estimate how much to be generated and how much to be spent on the priority areas
identified; • get the approval of the lawmakers (state legislatures) to generate money from
the sources identified and spend money as allocated to the priority areas for development;
• generate money from the approved sources and spend the money on the approved priority areas for development; and
• allow for monitoring and evaluation as to how well the money was generated and spent.
The above breakdown of state rights underscores an actual need for state benefit incidence analysis because if decisions on public spending at this level are well managed and targeted, it will complement the effort of the federal level in poverty and inequality reduction.
The results of incidence of benefits across Nigerian states for education and healthcare are presented in tables A2 and A3 in Annex 1. Evidences from the results reveal differences in average benefits across states for different social services at different levels across different quintiles. The BIA results show absolute progressive benefits for primary education in most states except for Abia, Adamawa, Akwa Ibom, Bauchi, Benue, Delta, Imo, Kano, Kwara and Niger states which were just progressive. Similar trend exists for primary healthcare benefits.
A further look at the results in terms of primary healthcare shows that, benefits from public healthcare services across the states showed high differences with four states (Benue, Jigawa, Katsina and Kogi) having the lowest public primary healthcare average benefit incidence. The four states, unfortunately, have the worst healthcare outcomes according to NBS (2007). It is also interesting to note that the five states with the highest benefit incidence in primary healthcare from the study results are also states with very high negative healthcare outcomes according to NBS (2007). The latter may be attributed to the fact that health services interact with many factors to generate improved health outcomes such as better drinking water, better education and better nutrition which are lacking in the former states and are important complementary factors leading to better health.
37Public SPending and Poverty reduction in nigeria
Public secondary healthcare revealed mixed results with some states showing just progressive benefits while others show regressive benefits. The result is such that states with high number of public secondary healthcare facilities have higher incidence of benefits with the exception of Kogi State. The tertiary result revealed regressive benefits for more than two third of the states.
On average, the FCT emerged as one of the top five high incidences of benefits for all levels of education and healthcare which further corroborate the notion that public education and healthcare services are often better financed in the capital cities than in other urban areas. Further discussion on the states results will be based on the dominance tests results since the aforementioned analyses have been based on visual analysis of the traditional BIA results which have not been tested statistically.
ANOVA tests for differences in average (mean) benefits from public expenditure
The study carried out a test to ascertain if there are differences in benefits by household groups (quintiles) across social services (education and healthcare). In other words,
testing if there are differences across the means. Testing the first mean difference hypothesis (H01) of the study thus: Public expenditure on education and healthcare at all levels does not differ significantly, the study employed the 2-Way ANOVA as highlighted under the section on theoretical framework and methodology. Results (Annex 2: tables A4 and A5) from the tests suggested that the first hypothesis was not rejected because F calculated (0.00765, 0.4727) for education and healthcare, respectively, were less than the critical F (3.478) at 0.05 level of significance for household benefit effect for both social services (education and healthcare). Therefore, the study concluded that, benefits from national or federal public expenditure on education and healthcare, at all levels, do not differ significantly.
The second null hypothesis of mean difference was to find if public expenditure on education and healthcare at all levels across regions (geopolitical zones) and states of the federation do not differ significantly. The result (Annex 2: tables A7 – A10) shows an F calculated for education by states and region (geopolitical zones), respectively, were 57.6486 and 13.1243 as against the critical F (1.7101 and 1.8259) which implies that the calculated F were greater than the critical F for education across states and regions. Similarly, the healthcare calculated F was 10.20286 and 11.7732 for states and regions as against the critical F (1.7101 and 1.8259) which was also greater than the calculated F values for both states and region. The above finding led to the rejection of the second null hypothesis of mean difference; hence the study concluded that, benefits from public expenditure on education and healthcare, at all levels, across regions (geopolitical zones) and states of the federation differ significantly at 0.05 significance level.
The third hypothesis for mean difference was to find if benefits from public expenditure on education and healthcare, at all levels, do not differ significantly across location. The ANOVA result for location (Annex 2: Table A6) shows an F calculated value of 0.7769 as against a critical F value of 4.06618 hence the study could not reject the null hypothesis and concluded that benefits from public expenditure on education and healthcare, at all levels, do not differ significantly across location at 0.05 significance level.
It is also interesting to note that, the three ANOVA results for the three hypotheses
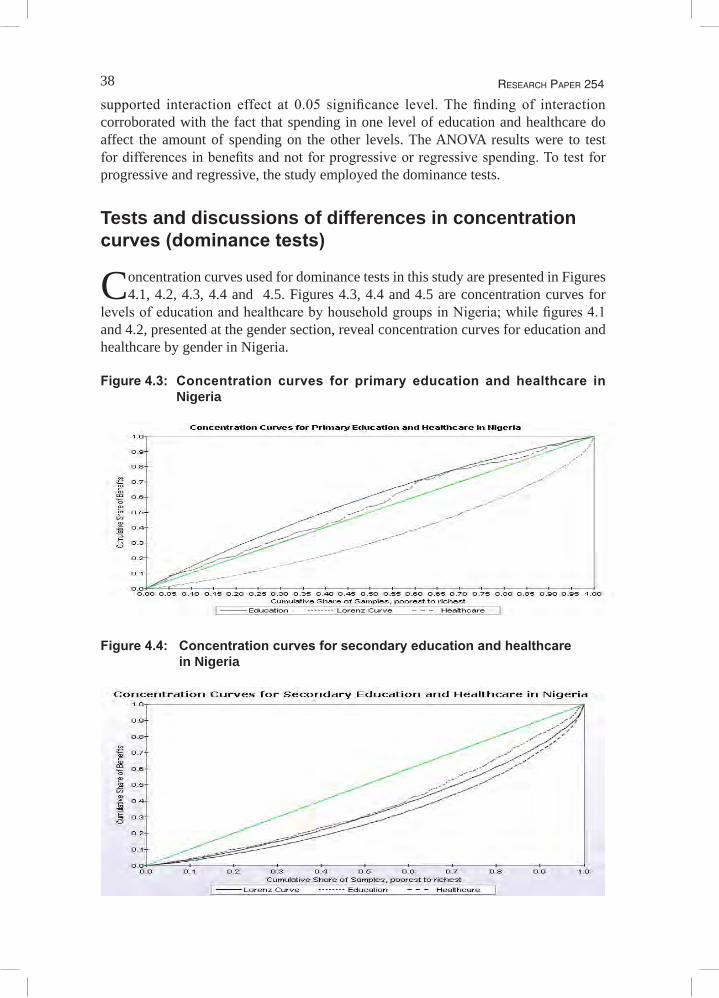
38 ReseaRch PaPeR 254
supported interaction effect at 0.05 significance level. The finding of interaction corroborated with the fact that spending in one level of education and healthcare do affect the amount of spending on the other levels. The ANOVA results were to test for differences in benefits and not for progressive or regressive spending. To test for progressive and regressive, the study employed the dominance tests.
Tests and discussions of differences in concentration curves (dominance tests)
Concentration curves used for dominance tests in this study are presented in Figures 4.1, 4.2, 4.3, 4.4 and 4.5. Figures 4.3, 4.4 and 4.5 are concentration curves for
levels of education and healthcare by household groups in Nigeria; while figures 4.1 and 4.2, presented at the gender section, reveal concentration curves for education and healthcare by gender in Nigeria.
Figure 4.3: Concentration curves for primary education and healthcare in Nigeria
Figure 4.4: Concentration curves for secondary education and healthcare in Nigeria
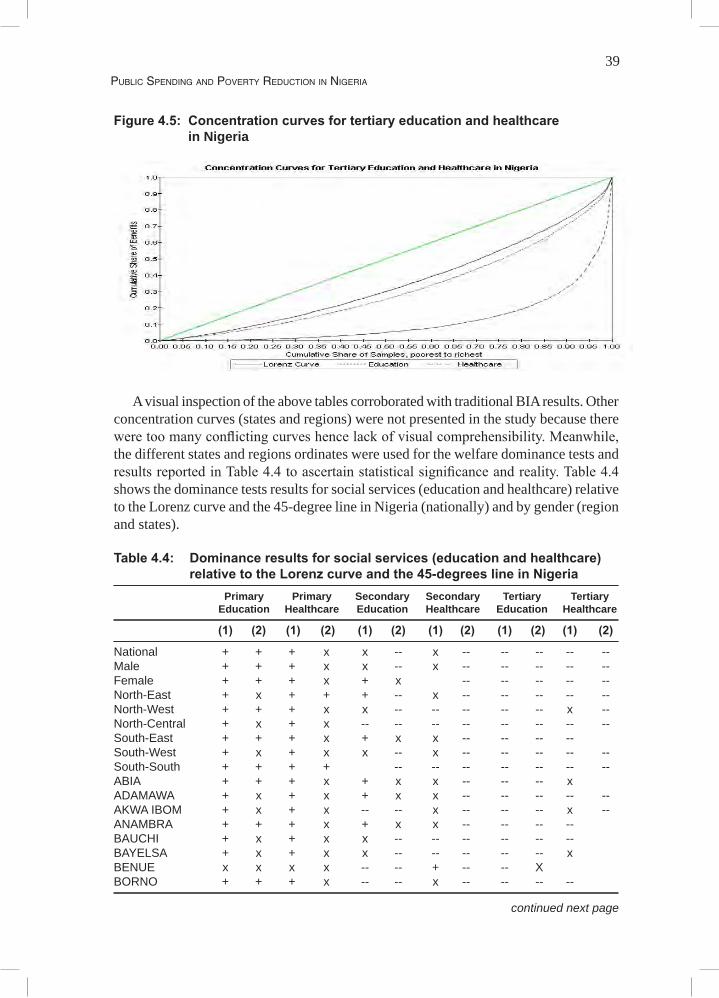
39Public SPending and Poverty reduction in nigeria
Figure 4.5: Concentration curves for tertiary education and healthcare in Nigeria
A visual inspection of the above tables corroborated with traditional BIA results. Other
concentration curves (states and regions) were not presented in the study because there were too many conflicting curves hence lack of visual comprehensibility. Meanwhile, the different states and regions ordinates were used for the welfare dominance tests and results reported in Table 4.4 to ascertain statistical significance and reality. Table 4.4 shows the dominance tests results for social services (education and healthcare) relative to the Lorenz curve and the 45-degree line in Nigeria (nationally) and by gender (region and states).
Table 4.4: Dominance results for social services (education and healthcare) relative to the Lorenz curve and the 45-degrees line in Nigeria
Primary Primary Secondary Secondary Tertiary Tertiary Education Healthcare Education Healthcare Education Healthcare
(1) (2) (1) (2) (1) (2) (1) (2) (1) (2) (1) (2)
National + + + x x -- x -- -- -- -- --Male + + + x x -- x -- -- -- -- --Female + + + x + x -- -- -- -- --North-East + x + + + -- x -- -- -- -- --North-West + + + x x -- -- -- -- -- x --North-Central + x + x -- -- -- -- -- -- -- --South-East + + + x + x x -- -- -- --South-West + x + x x -- x -- -- -- -- --South-South + + + + -- -- -- -- -- -- --ABIA + + + x + x x -- -- -- x ADAMAWA + x + x + x x -- -- -- -- --AKWA IBOM + x + x -- -- x -- -- -- x --ANAMBRA + + + x + x x -- -- -- --BAUCHI + x + x x -- -- -- -- -- --BAYELSA + x + x x -- -- -- -- -- x BENUE x x x x -- -- + -- -- XBORNO + + + x -- -- x -- -- -- --
continued next page

40 ReseaRch PaPeR 254
Table 4.4 continued Primary Primary Secondary Secondary Tertiary Tertiary Education Healthcare Education Healthcare Education Healthcare
(1) (2) (1) (2) (1) (2) (1) (2) (1) (2) (1) (2)
CROSS RIVER + + + + x -- -- -- -- -- --DELTA + x + x -- -- -- -- -- -- -- --EBONYI + x + x + x x -- -- -- --EDO + + + x -- -- x -- x -- -- EKITI + + + x -- -- -- -- -- --ENUGU + + + x + x x -- -- -- -- --FCT + x + x -- x -- -- -- x --GOMBE + x + + x -- x -- -- -- -- IMO + x + x x -- x -- -- -- -- --JIGAWA + x + x -- -- -- -- -- KADUNA + x + x -- -- -- -- -- -- -- --KANO + x + + -- x x -- -- -- -- --KATSINA + x + + x -- -- -- -- --KEBBI + + + x x -- -- -- -- x KOGI + x + x -- -- -- -- -- --KWARA + x + x -- x -- -- -- -- --LAGOS + + + + -- -- -- -- x NASSARAWA + + + + x -- -- -- -- --NIGER + x + + x -- -- -- -- -- --OGUN + + + x -- x -- -- -- -- --ONDO + + + x x -- + -- -- -- --OSUN + + x -- -- -- -- -- --OYO + x x x -- -- -- -- -- --PLATEAU + + + + -- -- -- -- -- --RIVERS + + + + -- -- -- -- -- XSOKOTO + + + x + -- -- -- --TARABA + x + x + x -- -- x -- --YOBE + x + x x x x -- -- -- -- --ZAMFARA + + + + -- + x -- -- X
Notes: (1) compares the column’s concentration curve with the Lorenz curve for per capita household expenditure
(progressive if + and regressive if x or --) (2) compares the column’s concentration curve with the 45-degree line (absolute progressive if +) and
progressive if x) ‘+’indicatesthatthebenefitsfromthecolumn’sservicearemoreconcentratedamongthepoorthanpercapita
expenditure (Lorenz curve) (for [1]) or an equal per capita distribution (for [2])‘--‘indicates that the service is less concentrated among the poor ‘x’ indicates that the concentration curves cross Ifthecurvesarestatisticallyinsignificantfromoneanother,thecorrespondingcellisblankSource: Author’s Computation
This dominance tests results are country-specific (Nigeria) following the process and method explained under the section on procedure testing for differences in concentration curves to ascertain whether social services (education and healthcare): (a) were absolutely progressive (i.e., the concentration curve is above 45-degree line, implying that the poor receive more benefits than the rich in absolute terms), (b) were progressive (i.e., the concentration curve is above the expenditure distribution (Lorenz curve), implying that the poor benefit more in relative terms), and (c) can be ranked or ordered by their degree of progressivity.
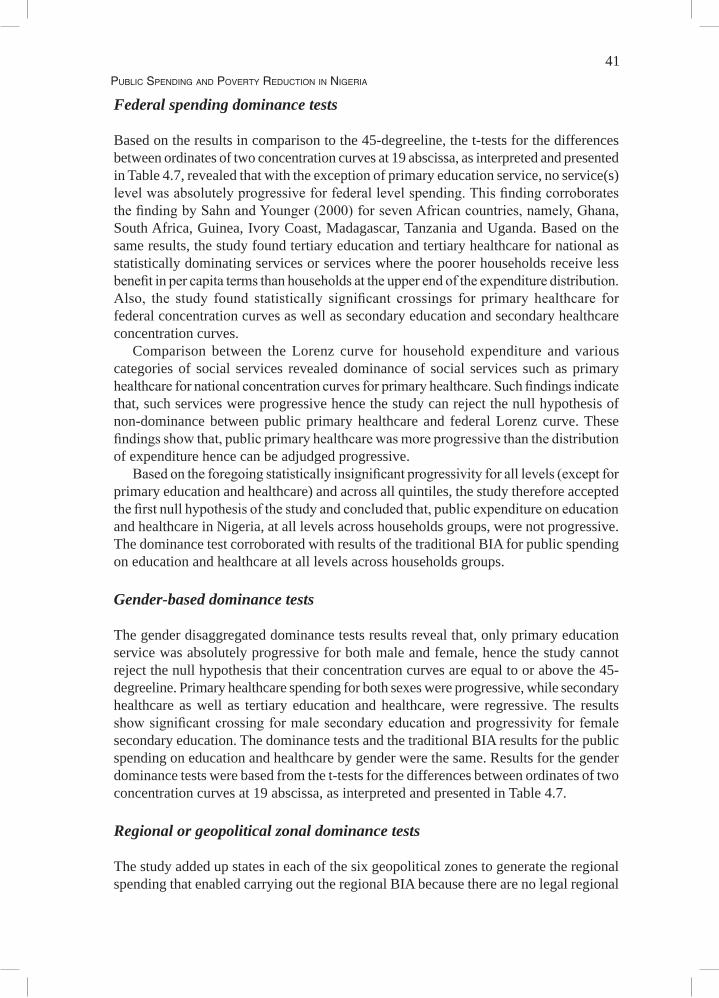
41Public SPending and Poverty reduction in nigeria
Federal spending dominance tests
Based on the results in comparison to the 45-degreeline, the t-tests for the differences between ordinates of two concentration curves at 19 abscissa, as interpreted and presented in Table 4.7, revealed that with the exception of primary education service, no service(s) level was absolutely progressive for federal level spending. This finding corroborates the finding by Sahn and Younger (2000) for seven African countries, namely, Ghana, South Africa, Guinea, Ivory Coast, Madagascar, Tanzania and Uganda. Based on the same results, the study found tertiary education and tertiary healthcare for national as statistically dominating services or services where the poorer households receive less benefit in per capita terms than households at the upper end of the expenditure distribution. Also, the study found statistically significant crossings for primary healthcare for federal concentration curves as well as secondary education and secondary healthcare concentration curves.
Comparison between the Lorenz curve for household expenditure and various categories of social services revealed dominance of social services such as primary healthcare for national concentration curves for primary healthcare. Such findings indicate that, such services were progressive hence the study can reject the null hypothesis of non-dominance between public primary healthcare and federal Lorenz curve. These findings show that, public primary healthcare was more progressive than the distribution of expenditure hence can be adjudged progressive.
Based on the foregoing statistically insignificant progressivity for all levels (except for primary education and healthcare) and across all quintiles, the study therefore accepted the first null hypothesis of the study and concluded that, public expenditure on education and healthcare in Nigeria, at all levels across households groups, were not progressive. The dominance test corroborated with results of the traditional BIA for public spending on education and healthcare at all levels across households groups.
Gender-based dominance tests
The gender disaggregated dominance tests results reveal that, only primary education service was absolutely progressive for both male and female, hence the study cannot reject the null hypothesis that their concentration curves are equal to or above the 45-degreeline. Primary healthcare spending for both sexes were progressive, while secondary healthcare as well as tertiary education and healthcare, were regressive. The results show significant crossing for male secondary education and progressivity for female secondary education. The dominance tests and the traditional BIA results for the public spending on education and healthcare by gender were the same. Results for the gender dominance tests were based from the t-tests for the differences between ordinates of two concentration curves at 19 abscissa, as interpreted and presented in Table 4.7.
Regional or geopolitical zonal dominance tests
The study added up states in each of the six geopolitical zones to generate the regional spending that enabled carrying out the regional BIA because there are no legal regional
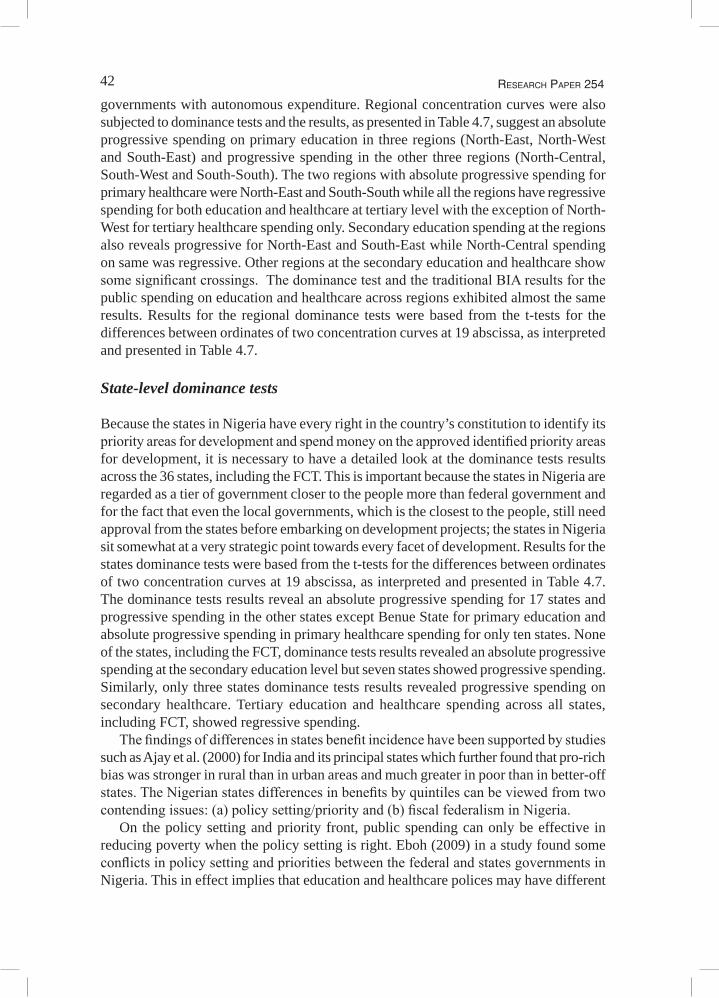
42 ReseaRch PaPeR 254
governments with autonomous expenditure. Regional concentration curves were also subjected to dominance tests and the results, as presented in Table 4.7, suggest an absolute progressive spending on primary education in three regions (North-East, North-West and South-East) and progressive spending in the other three regions (North-Central, South-West and South-South). The two regions with absolute progressive spending for primary healthcare were North-East and South-South while all the regions have regressive spending for both education and healthcare at tertiary level with the exception of North-West for tertiary healthcare spending only. Secondary education spending at the regions also reveals progressive for North-East and South-East while North-Central spending on same was regressive. Other regions at the secondary education and healthcare show some significant crossings. The dominance test and the traditional BIA results for the public spending on education and healthcare across regions exhibited almost the same results. Results for the regional dominance tests were based from the t-tests for the differences between ordinates of two concentration curves at 19 abscissa, as interpreted and presented in Table 4.7.
State-level dominance tests
Because the states in Nigeria have every right in the country’s constitution to identify its priority areas for development and spend money on the approved identified priority areas for development, it is necessary to have a detailed look at the dominance tests results across the 36 states, including the FCT. This is important because the states in Nigeria are regarded as a tier of government closer to the people more than federal government and for the fact that even the local governments, which is the closest to the people, still need approval from the states before embarking on development projects; the states in Nigeria sit somewhat at a very strategic point towards every facet of development. Results for the states dominance tests were based from the t-tests for the differences between ordinates of two concentration curves at 19 abscissa, as interpreted and presented in Table 4.7. The dominance tests results reveal an absolute progressive spending for 17 states and progressive spending in the other states except Benue State for primary education and absolute progressive spending in primary healthcare spending for only ten states. None of the states, including the FCT, dominance tests results revealed an absolute progressive spending at the secondary education level but seven states showed progressive spending. Similarly, only three states dominance tests results revealed progressive spending on secondary healthcare. Tertiary education and healthcare spending across all states, including FCT, showed regressive spending.
The findings of differences in states benefit incidence have been supported by studies such as Ajay et al. (2000) for India and its principal states which further found that pro-rich bias was stronger in rural than in urban areas and much greater in poor than in better-off states. The Nigerian states differences in benefits by quintiles can be viewed from two contending issues: (a) policy setting/priority and (b) fiscal federalism in Nigeria.
On the policy setting and priority front, public spending can only be effective in reducing poverty when the policy setting is right. Eboh (2009) in a study found some conflicts in policy setting and priorities between the federal and states governments in Nigeria. This in effect implies that education and healthcare polices may have different
43Public SPending and Poverty reduction in nigeria
targets, strategies and outcomes at the two tiers of government. Such conflicts may have resulted to different targeting and outcomes between the federal and the states. Policy settings also affect efficiency and equity levels. The above conflicts may have ignored the principles of public policy information flow from the people to the government and vice versa. According to Demery (2001), public policy in general, and public expenditure decisions in particular, must be based on a sound understanding of the needs and preferences of the population at large. For policy to be complete and inclusive, the provision of public services should be viewed as collaboration between governments, on the one hand, and the households on the other. To make this collaboration effective, there must be a two-way flow of information, with governments constantly ‘listening’ to households and households, in turn, being informed of government’s objectives and their rights under explicit contracts or covenants. The big concern here is with one dimension of the information flow: how can governments be informed about the needs and behaviour of their clients, especially the poor? Who indeed benefits from public spending?
The second issue from the states results have to do with the practice of fiscal federalism in Nigeria. First, state creation in Nigeria has been borne out of political benefits rather than true efficiency, equity and viability concerns. Study by Eboh et al. (2006) found that more than 70% of the Nigerian states cannot generate up to 20% of the yearly expenditure internally, which means they depend on the federal allocation for every of their expenditure, including recurrent expenditure. State allocation, on the other hand, is not the same across all states but depends on so many factors. Issues on financing of education and healthcare in Nigeria at the state level, therefore, are embedded in the virtually endemic problems of fiscal federalism – in particular, the so-called vertical and horizontal fiscal imbalances. In Nigeria, since independence, the search for appropriate instruments and formulas for minimizing each set of imbalances has been particularly problematic. According to Hinchliffe (2002:1-2), between 1960 and 1991, sixteen changes were made to the constitution in attempts to resolve these issues. Education figures centrally in these debates for several reasons. First, primary school enrolments are part of the allocation formula for distributing centrally collected revenue across states. Second, the education and healthcare sectors typically consume a significant share of states and local government resources. And third, the financial responsibility for primary education and healthcare across levels of government has never been fully reserved.
Summary and further discussion of findings
The major findings of the study revealed an absolute progressivity for primary education in Nigeria, progressivity for primary healthcare while tertiary education
and healthcare were regressive from the federal, regional and state public spending. The finding of absolute progressivity for primary education should be taken with a pinch of salt because benefit incidence says nothing about the standard/quality of public primary education in Nigeria as well as coverage. Descriptive statistics presented in Table 4.1 show the spread of its usage, which suggested that the poor may have benefited more because they use the facilities more. For standard, the average teacher-pupil ratio in Nigeria public primary schools in 2007 was well above 1:40 as against 1:35 as stipulated in the county’s educational policy. Available statistics from the National Bureau of
44 ReseaRch PaPeR 254
Statistics (NBS) showed that teacher-pupil ratio in basic education fell from 7.1% in 1993 to 5.9% in 2005.
In terms of access and coverage, available statistics in 2009 suggested that Nigeria is one of the 15 countries with the highest number of illiterates and one of the top five countries of the developing world that will not achieve any meaningful Education For All (EFA) goals in 2020, let alone 2015. This is because only 22.1million out of 42.1million Nigerian children are in primary schools; only 10.4million out of 33.9 million of those eligible for secondary education are attending; only 25% of those who sat for Senior Secondary Certificate Examination (SSCE) from 2000 to 2006 passed with credits in mathematics and English language; while only 19.5% out of 1.5 million Nigerians seeking for admission to tertiary education, got admitted (Ikechukwu, 2006). It is expected that most of these children outside the educational system belong to the poorer households. These children are not captured in any statistics and are not known to be part of the nation’s calculation when deliberating on investment in capacity issues. They are not in any vocational institutions, trade centres, or skills giving activities planned and delivered by the government as a deliberate policy. The implication, therefore, is that more than 30% of children who ought to be in primary, secondary or tertiary schools are nowhere nearer to the school environment.
For those who have the opportunity to be in schools at all levels, Soludo (2008) opined that the problems of the so called Nigerian graduates are not unemployment but unemployable. Such statements has further strengthened the fact that Nigeria’s economic landscape, especially since the oil boom of mid 1970s, has become a textbook example of Africa’s economic growth and development tragedy. Therefore, a careful analysis of the aforementioned facts reveals serious challenges facing policy makers, not only in terms of standard or quality of education, but also access at all levels hence the need for political will and transparent financial commitment towards solving the twin problems.
On the healthcare front, the finding that only primary healthcare shows dominance with the Lorenz curve does not mean that primary healthcare system is perfect. Healthcare outcomes in the country remain scary with maternal mortality rate in 2007 estimated at 800 per 100,000 live births (UNDP, 2007) and was rated one of the highest in the world. Infant and under-five mortality differ across location (81 for urban and 121 for rural) for every 1,000 live births while under-five mortality rate was 243 for rural and 153 for urban for every 10,000 with a life expectancy of 54 years in 2007 (NBS, 2008). In summary, health issue in Nigeria is one of the worst around the globe (UNDP, 2002).
Healthcare delivery service centres in rural Nigeria is found spasmodically, with more than half of the population not having access to basic health infrastructure. According to NISER (2006: 128) there is inadequate food supply and high morbidity, especially of malaria. In 2006, nurses per capita stood at 839, doctors per capita stood at 3,180 in absolute terms while per capita public spending on healthcare was less than US$15 and as low as US$3 in some parts of Nigeria which is far below the US$34 recommended by WHO for low income countries. Although the federal government recurrent healthcare budgets have shown an upward trend from 1999 to 2006, available evidence indicates that the bulk of this expenditure goes to personnel costs.
The regressivity of tertiary education and healthcare spending in Nigeria need an urgent and comprehensive review for the two social service levels. Tertiary level of
45Public SPending and Poverty reduction in nigeria
education and healthcare are known to be out of the reach of the poor in Nigeria and some other developing countries. In tertiary education, apart from the number of such facilities, they also have the problem of capacity in terms of numbers to admit, number of lecturers, standards of facilities and other indicators in education. Similarly, tertiary healthcare facilities suffer from number of beds, number of medical practitioners and equipment as well as underfunding. The two facilities have suffered from several and constant industrial actions due to underfunding-led agitations by workers which have very high cost to the economy. The NUC estimated the country’s financial loss due to 2003 industrial action by the Academic Staff Union of Universities (ASUU) at N83.3 billion or US$0.72 billion and US$1.06 billion in 2009. For the five months in the two years when the university system was shut down, the nation lost the estimated amount.
46 ReseaRch PaPeR 254
5. Conclusions and policy implications
Accessing the actual level and allocation of public expenditure (subsidy) is the key to understanding any government’s true expenditure priorities and its coherence with the government’s policy objectives. In the light of this, the study attempted
to determine what has been the distribution pattern of public expenditure in education and healthcare in Nigeria. Two important sectors (education and healthcare) which the state uses in undertaking expenditures to pursue a variety of economic, social and political goals, were chosen and the distributional pattern of government subsidies was analysed.
Findings from the study suggest there is a wide disparity in state access to education and healthcare, hence targeting education and healthcare services to the poor is a state issue. A major source of inequality, in the benefit incidence for secondary education and healthcare spending in Nigeria, was the gender dimension because females gained more from secondary education spending while males gained more from secondary healthcare spending. Education and healthcare sectors expenditures vary in their incidences according to the level of service. Primary education and healthcare were more pro-poor than tertiary education and healthcare. It is also noteworthy that changes in benefit incidence were not necessarily a result of changes in public spending hence the fact that most government spending is not imputable means that benefit incidence simply cannot be exhaustive. Analysts therefore, must be aware that benefit incidence cannot hope to be exhaustive in its coverage of public expenditure. At best, benefit incidence provides clues about which components of government spending have the greatest impact on the current income and consumption levels of households.
It is a general believe that public expenditure can help government achieve the goal of poverty reduction as well as reduction in inequality when the policy setting is right. The present situation in Nigeria may be at variance with right policy setting because it abhors open public expenditure process including budget management, accountability, transparency and stakeholders’ participation that is based on outcomes and impacts and not just line items and inputs. According to Filmer et al. (1998), simply spending money on the provision of a service, without attending to the efficiency with which that spending generates services and to the impact on the intended beneficiaries, is not what is recommended. Nigeria’s public spending process should be based on a sound understanding of the needs and preferences of the population at large. The provision of public services should be viewed as collaboration between governments, on the one hand, and the households on the other.
Results from the state analyses reveal differences in state public spending on education and healthcare at all levels as a result of cooperative federalism being practiced currently in Nigeria. Cooperative federalism, as practiced in Nigeria, gives larger share of the revenue to the federal government on account of larger responsibilities as defined in the
46
47Public SPending and Poverty reduction in nigeria
Executive List. The study results suggest that such practice may not have favoured the country as evidenced by all indicators of development when compared with the country’s position in the 1960s when dual federalism was in place.
While much attention in the past four decades in Nigeria has been given to the issues of horizontal imbalances (particularly between states), less has focused on whether the revenue allocation arrangements are sufficient to minimize vertical imbalances and to allow each level of government to perform the responsibilities allocated to it. In the education and healthcare sectors where, in spite of some overlaps, the major financial responsibility for each separate level lies with a different tier of government, it is relevant to ask whether the vertical allocation criteria allow for the provision of ‘appropriate’ funding for the education and healthcare system as a whole and for each individual level of the system.
The study findings have an implication that income redistribution may be effected through subsidized government services, rather than through direct income or consumption transfers. Benefit incidence may give some measures of targeting efficiency, but the basis for such targeting does not go beyond the objectives of current income redistribution. There are many reasons why observed household income (or expenditures) will be affected by government spending. The provision of services by the state can influence household spending decisions in some cases displacing private spending and in others augmenting it (van de Walle, 1995). For example, government spending on secondary education will have the effect of reducing private spending on such schooling, and government’s subsidies in health may induce households to spend on other services.
In conclusion, it should be noted that the analysis does not necessarily measure the actual benefits households and individuals receive. The reason why the approach is termed benefit incidence is to distinguish it from expenditure incidence. The benefit flows to recipients of government services are distinguished from the income flows government spending generates to the providers of those services. In line with Demery (2000) argument, this should not be taken, however, to imply that benefit incidence analysis is an accurate tool for measuring benefits to service recipients. Perhaps a better term to describe the technique is beneficiary incidence since this avoids the suggestion that true benefits are measured, but simply conveys the message that spending is imputed to the beneficiaries.
48 ReseaRch PaPeR 254
Notes 1. Social assistance here includes subsidized government services such as education, health
and infrastructure services, which will in effect improve the well-being of the beneficiaries and enhance their longer-run income earning potentials.
2. Public expenditure is progressive if the poorer households benefits more than the richer households.
3. Notable policy regimes include the Rolling Plan (1974-1979), the Austerity Measures (1981-1984), the Structural Adjustment Programme (SAP) of 1985-1992, Vision 2010 (1992-1998), Obasanjo Economic Direction (1999-2003), the National Economic Empowerment and Development Strategy (NEEDS) of 2003-2007 and the current Yar’Adua Seven Point Agenda (2007-2011).
4. See literature review for details of such studies.
5. Adult literacy rate is still struggling to leave 57%, a position it has maintained for more than five years now.
6. Health poverty in Nigeria is at a different dimension when the percentage of people that has access to clean/safe water and essential drugs is compared to other sub-Saharan African (SSA) countries.
7. In assessing how public expenditure benefit households, hot argument has been in existence with two major approaches; the need to measure households preferences for the goods in question based on theory and the benefit incidence analysis that combines cost of providing public services with data on their use in order to generate distribution of the benefit of government spending.
8. The (welfarist) literature has been characterized by two broad approaches. The first emphasizes the need to measure individual preferences for the goods in question, based on refinements of the Aaron and McGuire (1970) methodology. The second approach is benefit incidence analysis, which combines the cost of providing public services with information on their use in order to generate distributions of the benefit of government spending.
9. The Turks and Gypsy are the two minority groups in Bulgaria comprising 13% of the total population, 25% of the poorest quintile and very few are found among the better-off (only about 3% in the richest quintile).
48
49Public SPending and Poverty reduction in nigeria
10. The Federal Government of Nigeria made available about one billion dollar debt relief. This amount has been channelled to education, health and other MDG sectors annually starting from 2006 as part of the benefits of the debt relief granted Nigeria.
11. In Nigeria, different states get different allocation from the federation account. The allocation is distributed using a formula comprising of vertical (federal 52.7%, states 26.7% and local government 20.6%) and horizontal (equality 40%, population 30%, internally generated revenue 10%, land mass and terrain 10% and social development factors 10%). The social development factor is used to determine states that have better literacy levels, hospital facilities, and others factors and it includes: territorial spread 1.5%, rainfall 1.5%, primary/secondary enrolment 4%, and hospital beds 3%.
12. A notable shock in Nigeria comes from her overdependence in oil revenue.
13. A telling indicator is the annual channeling of over N100 billion (US$1 billion) debt relief to key sectors known as MDG sectors since the debt relief of 2006.
14. Disaggregating the entire population into quintiles represents every household socioeconomic status.
15. There are three levels of funding, namely: federal, state and local government. Also both health and education fall under the concurrent list and hence is being taken care by the three arms independently.
16. Total consumption here is the sum of food and non-food consumption expenditures, using standard definitions (see, for example, The World Bank [2000]). Food consumption includes all items consumed by the household (from purchase, own production, wages in kind, or transfers). Non-food consumption includes all non-food items, such as clothing, house rents, cooking fuel, transport, education and others as well as imputed values for rents if the household lives in owner-occupied housing, and imputed use values of household durable goods.
17. Nigeria has six regions known as geopolitical zones and thirty-six (36) states.
18. See details in section 4.7.
19. Some authors refer progressive spending as pro-poor spending.
20. In such situations, one could resort to other criteria such as the Gini coefficient, Atkinson index, or generalized entropy measures for a complete ordering.
21. To the extent that quality variation is not captured in the cost data, e.g., because of systematic variation in teacher absenteeism between the schools attended by poorer and richer students (which is plausible), bias in the direction of finding progressivity still prevails. Similarly, the cost of providing services of identical quality may vary with the remoteness of an area or the size of the population served, with a higher proportion of fixed costs in more remote areas. If poorer households are disproportionately represented in areas where the unit cost of service delivery is high, our analysis would be biased toward findings of progressivity. Alternative methods for adjusting for differences in the quality of services delivered are necessary, but difficult to identify.

50 ReseaRch PaPeR 254
22. For secondary education in states that collect fees, tuition is paid directly into the government coffers.
23. See the cited papers for details.
24. This method used is a demanding criterion, especially in the light of low power of the test hence effort should be made to explore alternatives like the use of extended Gini coefficients as an alternative means for stochastic dominance as used by Sahn and Younger (2000).
25. This individual disaggregation enabled the study to draw concentration curves by gender.
26. Nigeria is divided into six geopolitical zones and each of these zones comprises of nothing less than five states.
27. The result was further subjected to dominance tests and only primary education passed the absolute progressive test.
Public SPending and Poverty reduction in nigeria
ReferencesAaron, H. and M.C. McGuire. 1970. ”Public goods and income distribution”. Econometrica,
38(6): 907-20.Ajawd, M.I. and Q. Wodon. 2001. Who Benefits from Increased Access to Public Services at a
Local Level? A Marginal Benefit Incidence Analysis for Education and Basic Infrastructure. Washington, D.C.: The World Bank.
Ajay, M., J. Singh and F. Afridi. 2000. Who Benefits from Public Health Spending in India? Results of a Benefit-Incidence Analysis for India. Washington, D.C: The World Bank.
Akanji, B., Zwaku, B. and A. Salihu. 2003. Gender-Aware Analysis of the Federal Budget in Nigeria (1995-2002): Focus on the Education and Agricultural Sectors. Lagos: CDDN.
Amakom, U. and A. Obi. 2007. “Nigeria’s education sector allocation and expenditures (1995-2005): Implications for poverty reduction and gender empowerment”. Journal of Economic Studies, 6(1): 1-19.
Bishop, J.A., K.V. Chow and J.P. Formby. 1994. “Testing for marginal changes in income distributions with Lorenz and concentration curves”. International Economic Review, 35(2): 479–88.
Bourguignon, F. and A. L. Pereira da Silva. 2003. The Impact of Economic Policies on Poverty and Income Distribution: Evaluation Techniques and Tools. Washington, D.C. and New York: The World Bank and Oxford University Press.
At http://www1.worldbank.org/publications/pdfs/15491frontmat.pdf Castro-Leal, F., J. Dayton, L. Demery and M. Kalpana. 1999. Public Social Spending in Africa:
Do the Poor Benefit? Washington, D.C.: The World Bank. Demery, L. 1996. ‘Gender and Public Social Spending: Disaggregating Benefit Incidence’,
Poverty and Social Policy Department, The World Bank (unprocessed).Davidson, R. and J.Y. Duclos. 1997. “Statistical inference for the measurement of the incidence
of taxes and transfers”. Econometrica, 65(6): 1453–65.Demery, L., J. Dayton and K. Mehra. 1996. ‘The incidence of social spending in Ivory Coast,
1986-95”. Poverty and Social Policy Department. Mimeo. The World Bank, Washington, D.C.
Demery, L. 2000. “Benefit incidence: A practitioners guide”. Poverty Development Group Africa Region. The World Bank, Washington, D.C.
Demery, L. 2001. “Analysing the incidence of public spending”. Tool Kit – Chapter 2. The World Bank, Washington, D.C.
Eboh, E., U. Amakom and M. Oduh. 2006. “Budget and public expenditure across Nigerian States”. BECANS Working Paper No. 3. African Institute for Applied Economics, Enugu, Nigeria, June.
Eboh, E.C. 2009. “Fiscal federalism, sub-national governance and MDGs in Nigeria”. AIAE Research Paper No. 4. African Institute for Applied Economics, Enugu, Nigeria, December.
Filmer, D., J. Hammer and L. Pritchett. 1998. Health Policy in Poor Countries: Weak Links in the Chain. World Bank Policy Research Working Paper Number 1874, January.
51
52 ReseaRch PaPeR 254
Foster, M., F. Adrian, F. Naschold and T. Conway. 2002. “How, when and why does poverty get budget priority: Poverty reduction strategy and public expenditure in five African countries”. Working Paper No. 168. Overseas Development Institute, London. May.
González de la Rocha, M. and A. Grinspun. 2001. ”Private Adjustments: Households, Crisis and Work”.In Alejandro Grinspun, ed., Choices for the Poor: Lessons from National Poverty Strategies, pp. 55-87. New York: UNDP.
Harding, A. 1995. The Impact of Health, Education and Housing Outlays on Income Distribution in Australia in the 1990s. Discussion Paper, No. 7. National Centre for Social and Economic Modelling, Faculty of Management, University of Canberra, Canberra.
Heltberg, R., K. Simler and F. Tarp. 2001. ”Public Spending and Poverty in Mozambique”. UNU/WIDER project on New Fiscal Policies for Growth and Poverty Reduction.
Heltberg, R., K. Simler and F. Tarp. 2003. "Public Spending and Poverty in Mozambique". FCND Discussion Paper No. 167. Food Consumption and Nutrition Division, International Food Policy Research Institute, Washington, D.C.
Hinchliffe, K. 2002. “Public expenditure on education in Nigeria: Issues, estimates and some implications”. African Region Human Development Report. Working Paper Series. The World Bank, Washington, D.C.
Howes, S. 1996. “A new test for inferring dominance from sample data”. Mimeo. The World Bank, Washington, D.C.
Howes, S.1996b. “The influence of aggregation on the ordering of distributions”. JSTOR Economica, 63(250): 253-73.
Ichoku, H.E. 2008. Report of Public Expenditure Review and Health Outcomes in South-East Nigeria, Abuja. European Union – Support to Reforming Institution Programme (EU-SRIP).
Ikechukwu, O. 2006. “Education: While the Debates Lasts”. In This Day Newspaper of 10.18.2006.
Jalan, Y. and M. Ravallion. 2001. “Estimating the benefit incidence of an antipoverty program by propensity score matching”. Journal of Business and Economic Statistics, 21(1): 19-30
Liberati, P. 2003. “Poverty reducing reforms and sub-group consumption dominance curves”. Review of Income and Wealth, 49(4): 589-601.
Lipton, M. and M. Ravallion. 1995. "Poverty and policy". In Handbook of Development Economics, 3rd ed.
Luiz A., B. Pereira da Silva, N. Essama and S. Issouf. 2002. A Poverty Analysis Macroeconomic Simulator (PAMS) Linking Household Surveys with Macro-Models. Washington, D.C.: The World Bank.
Meerman, J. 1979. Public Expenditure in Malaysia: Who Benefits and Why. Kuala Lumpur, Oxford University Press.
Moser, J.T. 1998. "Contracting innovations and the evolution of clearing and settlement methods at futures exchanges". Working Paper Series WP-98-26, Federal Reserve Bank of Chicago.
Muthwa, S. 1993. ”Household Survival, Urban Poverty and Female Household Headship in Soweto: Some Key Issues for Further Policy Research'. Paper presented in seminar series 'The Societies of Southern Africa in the 19th and 20th Centuries: Women, Colonialism and Commonwealth”. Institute of Commonwealth Studies, University of London, 19 November.
NBS. 2007. Annual Abstract of Statistics. Abuja, National Bureau of Statistics, Federal Republic of Nigeria.
NBS. 2008. Annual Abstract of Statistics. Abuja, National Bureau of Statistics, Federal Republic of Nigeria.
NISER. 2006. Intergovernmental Fiscal Coordination in Nigeria, Ibadan. Nigerian Institute for
53Public SPending and Poverty reduction in nigeria
Social and Economic Research. O’Donnell, O., E. van Doorslaer, R.P. Rannan-Eliya, A. Somanathan, S.R. Adhikari, D. Harbianto,
C.G. Garg, P. Hanvoravongchai, M.N. Huq, A. Karan, G.M. Leung, C.W. Ng, B. R. Pande, K. Tin, L. Trisnantoro, C. Vasavid, Y. Zhang and Y. Zhao. 2007. “The Incidence of Public Spending on Health Care: Comparative Evidence from Asia”. World Bank Economic Review, 21(1): 93–123.
Pearson, M. 2002. Benefit Incidence Analysis: How can it contribute to our understanding of Health System Performance? Issues Paper, DFID Health system Resource Centre, London.
Rannan-Eliya, R., P. Badri, J. Killingworth and A. Somanathan. 2001. Equity in Financing and Delivery of Health Services in Bangladesh, Nepal and Sri Lanka. Washington, D.C.: The World Bank.
Ravallion, M. 2002. “Who is Protected? On the Incidence of Fiscal Adjustment”, Washington D.C. The World Bank.
At http://www.imf.org/external/np/res/seminars/2002/poverty/mr.pdf Reinikka, R. 2002. “Public expenditure tracking and service delivery surveys: A review of
design and implementation issues”. PEAM Course, May 23, DECRG. The World Bank, Washington, D.C.
Sabir, M. 2002. "Gender and Public Spending on Education in Pakistan: A Case Study of Disaggregated Benefit Incidence", The Pakistan Development Review, Pakistan Institute of Development Economics, 41(4): 477-93.
Sahn, D.E. and S.D. Younger. 1999. “Dominance testing of social expenditures and taxes in Africa”. IMF Working Paper No. 99/172, Washington, D.C., December.
Sahn, D.E. and S. Younger. 2000. “Expenditure incidence in Africa: Microeconomic evidence”. Fiscal Studies, 21(3): 329-48.
Sahn, D.E., S.D. Younger and K.R. Simler. 2000. "Dominance testing of transfers in Romania". Review of Income and Wealth, 46(3): 309-27.
Selowsky, M. 1979. Who Benefits from Government Expenditures? A Case Study of Colombia. New York: Oxford University Press.
Sen, A. 1976. “Real National Income”. Review of Economics Studies, 43(1): 19-39.Shenggen Fan, P. Hazell and S. Thorat 1999. “Linkages between government spending, growth,
and poverty in rural India”. IFPRI Research Report No. 110. Soares, R.R. 2006. “Health and the evolution of welfare across Brazilian municipalities”. Journal
of Development Economics, 84: 590–608.Soares, F.V., S. Soares, M. Medeiros and R.G. Osorio. 2006. “Cash Transfer Programmes in
Brazil: Impacts on Inequality and Poverty”. Brasilla, International Poverty Centre, UNDP.Soludo. 2008. "Nigeria: 60 per cent of Nigerian Graduates Unemployable". Paper Presented at the
Convocation Ceremony of the Federal University of Technology, Owerri (FUTO), Published by This Day Newspaper on February 18, 2008.
The World Bank. 1995b. Ghana: Poverty Past, Present and Future. West Central Africa Department, Report No. 14504-GH, Washington, D.C. (June 29).
The World Bank. 2002. World Development Indicators 2002.UNDP. 2002. Human Development Report 2002: Deepening Democracy in a Fragmented World.
New York, United Nations Development Programme. UNDP. 2007. Human Development Report 2007: Fighting Climate Change: Human Solidarity
in a Divided World. New York, United Nations Development Programme. Van de Walle, D. and K. Nead. 1995. “Public Spending and the Poor: Theory and Evidence”.
Baltimore and London: The Johns Hopkins University Press (for the World Bank, 1995), pp. 226-58.

54 ReseaRch PaPeR 254
Van de Walle, D. 1995. ‘The Distribution of Subsidies through public Health Services in Indonesia, 1978-87.’ In D. van de Walle and K. Nead. Public Spending and the Poor: Theory and Evidence, Chapter 9. Baltimore and London: The Johns Hopkins University Press.
Yitzhaki, S. 1982. “Relative Deprivation and Economic Welfare”. European Economic Review, 17(1): 99-113
Ye, and S. Canagarajah. 2002. “Efficiency of public expenditure distribution and beyond: A report on Ghana’s 2000 public expenditure tracking survey in the sectors of primary health and education”. The World Bank, Washington, D.C.
Younger, S. 2002. “Benefits on the margin: Observations on marginal benefit incidence”. USAID Cooperative Agreement AOT-0546-A-00-3178-00.
Yuki, T. 2003. “Distribution of public education spending for the poor: The case of Yemen”. Asia Pacific Education Review, 4(2): 129-39.
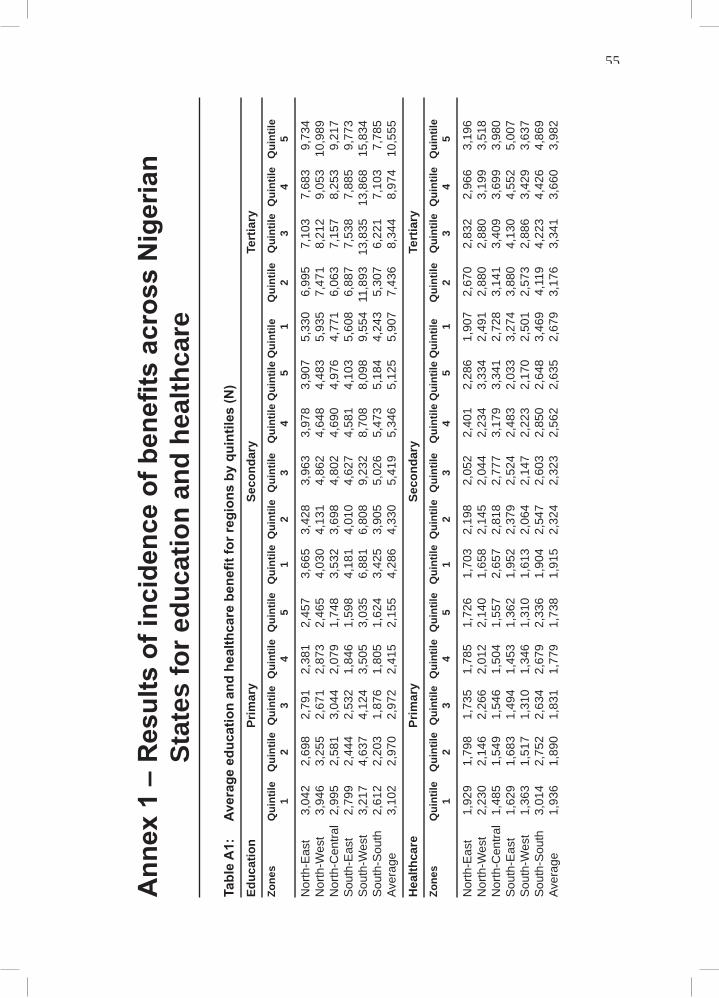
55Public SPending and Poverty reduction in nigeria
Ann
ex 1
– R
esul
ts o
f inc
iden
ce o
f ben
efits
acr
oss
Nig
eria
n St
ates
for e
duca
tion
and
heal
thca
re
Tabl
e A
1:
Aver
age
educ
atio
n an
d he
alth
care
ben
efit f
or re
gion
s by
qui
ntile
s (N
)Ed
ucat
ion
Pr
imar
y Se
cond
ary
Tert
iary
Zone
s Q
uint
ile
Qui
ntile
Qui
ntile
Qui
ntile
Qui
ntile
Q
uint
ile Q
uint
ile Q
uint
ile
Qui
ntile
Qui
ntile
Qui
ntile
Q
uint
ile
Qui
ntile
Qui
ntile
Q
uint
ile
1
2 3
4 5
1 2
3 4
5 1
2 3
4 5
Nor
th-E
ast
3,04
2 2,
698
2,79
1 2,
381
2,45
7 3,
665
3,42
8 3,
963
3,97
8 3,
907
5,33
0 6,
995
7,10
3 7,
683
9,73
4 N
orth
-Wes
t 3,
946
3,
255
2,
671
2,
873
2,
465
4,
030
4,
131
4,
862
4,
648
4,
483
5,
935
7,
471
8,
212
9,
053
10
,989
N
orth
-Cen
tral
2,99
5
2,58
1
3,04
4
2,07
9
1,74
8
3,53
2
3,69
8
4,80
2
4,69
0
4,97
6
4,77
1
6,06
3
7,15
7
8,25
3
9,21
7 S
outh
-Eas
t 2,
799
2,
444
2,
532
1,
846
1,
598
4,
181
4,
010
4,
627
4,
581
4,
103
5,
608
6,
887
7,
538
7,
885
9,
773
Sou
th-W
est
3,21
7
4,63
7
4,12
4
3,50
5
3,03
5
6,88
1
6,80
8
9,23
2
8,70
8
8,09
8
9,55
4 1
1,89
3 1
3,83
5
13,8
68
15,8
34
Sou
th-S
outh
2,
612
2,
203
1,
876
1,
805
1,
624
3,
425
3,
905
5,
026
5,
473
5,
184
4,
243
5,
307
6,
221
7,
103
7,
785
Aver
age
3
,102
2,
970
2,
972
2,
415
2,
155
4,
286
4,
330
5,
419
5,
346
5,
125
5,
907
7,
436
8,
344
8,
974
10
,555
Hea
lthca
re
Prim
ary
Seco
ndar
y Te
rtia
ryZo
nes
Qui
ntile
Q
uint
ile Q
uint
ile Q
uint
ile Q
uint
ile
Qui
ntile
Qui
ntile
Qui
ntile
Q
uint
ile Q
uint
ile Q
uint
ile
Qui
ntile
Q
uint
ile Q
uint
ile
Qui
ntile
1 2
3 4
5 1
2 3
4 5
1 2
3 4
5
Nor
th-E
ast
1,92
9
1,79
8
1,73
5
1,78
5
1,72
6
1,70
3
2,19
8
2,05
2
2,40
1
2,28
6
1,90
7
2,67
0
2,83
2
2,96
6
3,19
6 N
orth
-Wes
t 2,
230
2,
146
2,
266
2,
012
2,
140
1,
658
2,
145
2,
044
2,
234
3,
334
2,
491
2,
880
2,
880
3,
199
3,
518
Nor
th-C
entra
l 1,
485
1,
549
1,
546
1,
504
1,
557
2,
657
2,
818
2,
777
3,
179
3,
341
2,
728
3,
141
3,
409
3,
699
3,
980
Sou
th-E
ast
1,62
9
1,68
3
1,49
4
1,45
3
1,36
2
1,95
2
2,37
9
2,52
4
2,48
3
2,03
3
3,27
4
3,88
0
4,13
0
4,55
2
5,00
7 S
outh
-Wes
t 1,
363
1,
517
1,
310
1,
346
1,
310
1,
613
2,
064
2,
147
2,
223
2,
170
2,
501
2,
573
2,
886
3,
429
3,
637
Sou
th-S
outh
3,
014
2,
752
2,
634
2,
679
2,
336
1,
904
2,
547
2,
603
2,
850
2,
648
3,
469
4,
119
4,
223
4,
426
4,
869
Aver
age
1,
936
1,
890
1,
831
1,
779
1,
738
1,
915
2,
324
2,
323
2,
562
2,
635
2,
679
3,
176
3,
341
3,
660
3,
982
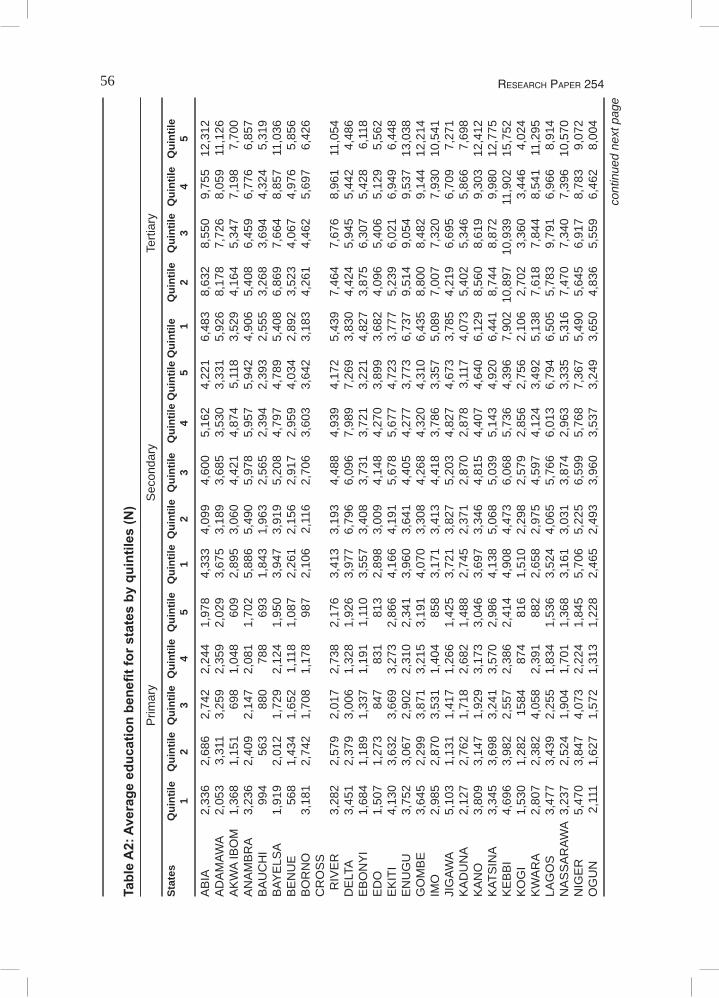
56 ReseaRch PaPeR 254
Tabl
e A
2: A
vera
ge e
duca
tion
bene
fit fo
r sta
tes
by q
uint
iles
(N)
P
rimar
y S
econ
dary
Te
rtiar
y
Stat
es
Qui
ntile
Q
uint
ile Q
uint
ile Q
uint
ile Q
uint
ile
Qui
ntile
Qui
ntile
Qui
ntile
Q
uint
ile Q
uint
ile Q
uint
ile
Qui
ntile
Q
uint
ile Q
uint
ile
Qui
ntile
1 2
3 4
5 1
2 3
4 5
1 2
3 4
5
AB
IA
2,33
6
2,68
6
2,74
2
2,24
4
1,97
8
4,33
3
4,09
9
4,60
0
5,16
2
4,22
1
6,48
3
8,63
2
8,55
0
9,75
5
12,3
12
AD
AM
AWA
2,05
3
3,31
1
3,25
9
2,35
9
2,02
9
3,67
5
3,18
9
3,68
5
3,53
0
3,33
1
5,92
6
8,17
8
7,72
6
8,05
9
11,1
26
AK
WA
IBO
M
1,36
8
1,15
1
698
1,
048
60
9
2,89
5
3,06
0
4,42
1
4,87
4
5,11
8
3,52
9
4,16
4
5,34
7
7,19
8
7,70
0 A
NA
MB
RA
3,23
6
2,40
9
2,14
7
2,08
1
1,70
2
5,88
6
5,49
0
5,97
8
5,95
7
5,94
2
4,90
6
5,40
8
6,45
9
6,77
6
6,85
7 B
AU
CH
I 99
4
563
88
0
788
69
3
1,84
3
1,96
3
2,56
5
2,39
4
2,39
3
2,55
5
3,26
8
3,69
4
4,32
4
5,31
9 B
AYE
LSA
1,91
9
2,01
2
1,72
9
2,12
4
1,95
0
3,94
7
3,91
9
5,20
8
4,79
7
4,78
9
5,40
8
6,86
9
7,66
4
8,85
7
11,0
36
BE
NU
E
568
1,
434
1,
652
1,
118
1,
087
2,
261
2,
156
2,
917
2,
959
4,
034
2,
892
3,
523
4,
067
4,
976
5,
856
BO
RN
O
3,18
1
2,74
2
1,70
8
1,17
8
987
2,
106
2,
116
2,
706
3,
603
3,
642
3,
183
4,
261
4,
462
5,
697
6,
426
CR
OS
S
RIV
ER
3,
282
2,
579
2,
017
2,
738
2,
176
3,
413
3,
193
4,
488
4,
939
4,
172
5,
439
7,
464
7,
676
8,
961
11
,054
D
ELT
A 3,
451
2,
379
3,
006
1,
328
1,
926
3,
977
6,
796
6,
096
7,
989
7,
269
3,
830
4,
424
5,
945
5,
442
4,
486
EB
ON
YI
1,68
4
1,18
9
1,33
7
1,19
1
1,11
0
3,55
7
3,40
8
3,73
1
3,72
1
3,22
1
4,82
7
3,87
5
6,30
7
5,42
8
6,11
8 E
DO
1,
507
1,
273
847
831
81
3
2,89
8
3,00
9
4,14
8
4,27
0
3,89
9
3,68
2
4,09
6
5,40
6
5,12
9
5,56
2 E
KIT
I 4,
130
3,
632
3,
669
3,
273
2,
866
4,
166
4,
191
5,
678
5,
677
4,
723
3,
777
5,
239
6,
021
6,
949
6,
448
EN
UG
U
3,75
2
3,06
7
2,90
2
2,31
0
2,34
1
3,96
0
3,64
1
4,40
5
4,27
7
3,77
3
6,73
7
9,51
4
9,05
4
9,53
7
13,0
38
GO
MB
E
3,64
5
2,29
9
3,87
1
3,21
5
3,19
1
4,07
0
3,30
8
4,26
8
4,32
0
4,31
0
6,43
5
8,80
0
8,48
2
9,14
4
12,2
14
IMO
2,98
5
2,87
0
3,53
1
1,40
4
858
3,
171
3,
413
4,
418
3,
786
3,
357
5,
089
7,
007
7,
320
7,
930
10
,541
JI
GAW
A 5,
103
1,
131
1,
417
1,
266
1,
425
3,
721
3,
827
5,
203
4,
827
4,
673
3,
785
4,
219
6,
695
6,
709
7,
271
KA
DU
NA
2,12
7
2,76
2
1,71
8
2,68
2
1,48
8
2,74
5
2,37
1
2,87
0
2,87
8
3,11
7
4,07
3
5,40
2
5,34
6
5,86
6
7,69
8 K
AN
O
3,80
9
3,14
7
1,92
9
3,17
3
3,04
6
3,69
7
3,34
6
4,81
5
4,40
7
4,64
0
6,12
9
8,56
0
8,61
9
9,30
3
12,4
12
KAT
SIN
A 3,
345
3,
698
3,
241
3,
570
2,
986
4,
138
5,
068
5,
039
5,
143
4,
920
6,
441
8,
744
8,
872
9,
980
12
,775
K
EB
BI
4,69
6
3,98
2
2,55
7
2,38
6
2,41
4
4,90
8
4,47
3
6,06
8
5,73
6
4,39
6
7,90
2 1
0,89
7 1
0,93
9
11,9
02
15,7
52
KO
GI
1,53
0
1,28
2
1584
87
4
816
1,
510
2,
298
2,
579
2,
856
2,
756
2,
106
2,
702
3,
360
3,
446
4,
024
KW
AR
A 2,
807
2,
382
4,
058
2,
391
88
2
2,65
8
2,97
5
4,59
7
4,12
4
3,49
2
5,13
8
7,61
8
7,84
4
8,54
1
11,2
95
LAG
OS
3,
477
3,43
9
2,25
5
1,83
4
1,53
6
3,52
4
4,06
5
5,76
6
6,01
3
6,79
4
6,50
5
5,78
3
9,79
1
6,96
6
8,91
4 N
AS
SA
RAW
A 3,
237
2,
524
1,
904
1,
701
1,
368
3,
161
3,
031
3,
874
2,
963
3,
335
5,
316
7,
470
7,
340
7,
396
10
,570
N
IGE
R
5,47
0
3,84
7
4,07
3
2,22
4
1,84
5
5,70
6
5,22
5
6,59
9
5,76
8
7,36
7
5,49
0
5,64
5
6,91
7
8,78
3
9,07
2 O
GU
N
2,11
1
1,62
7
1,57
2
1,31
3
1,22
8
2,46
5
2,49
3
3,96
0
3,53
7
3,24
9
3,65
0
4,83
6
5,55
9
6,46
2
8,00
4
cont
inue
d ne
xt p
age
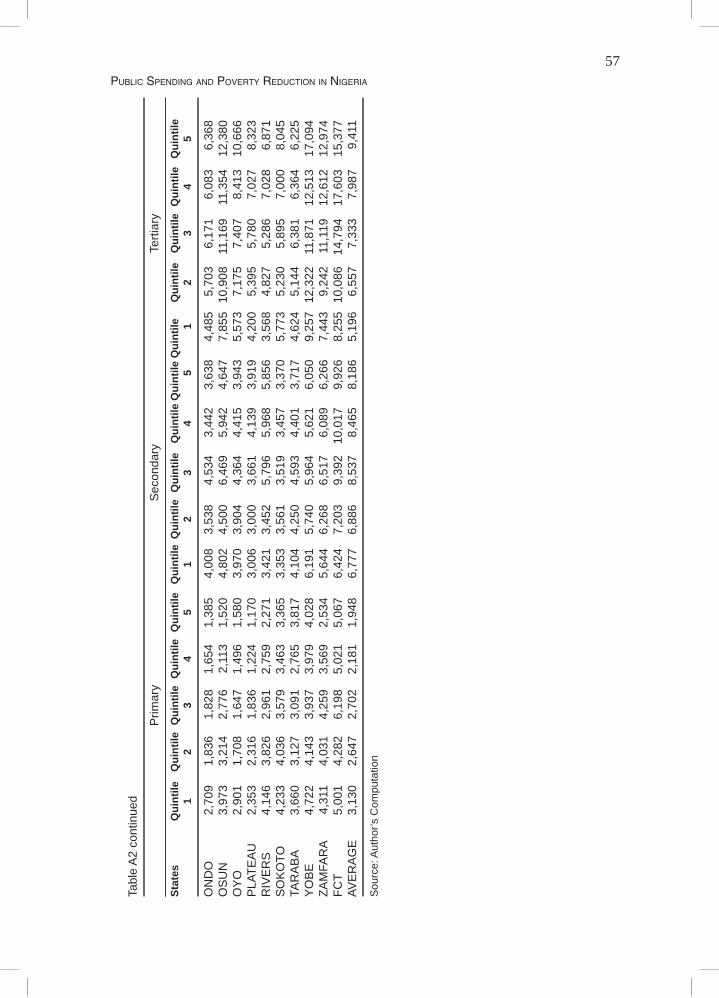
57Public SPending and Poverty reduction in nigeria
Tabl
e A
2 co
ntin
ued
P
rimar
y S
econ
dary
Te
rtiar
y
Stat
es
Qui
ntile
Q
uint
ile Q
uint
ile Q
uint
ile Q
uint
ile
Qui
ntile
Qui
ntile
Qui
ntile
Q
uint
ile Q
uint
ile Q
uint
ile
Qui
ntile
Q
uint
ile Q
uint
ile
Qui
ntile
1 2
3 4
5 1
2 3
4 5
1 2
3 4
5
ON
DO
2,
709
1,
836
1,
828
1,
654
1,
385
4,
008
3,
538
4,
534
3,
442
3,
638
4,
485
5,
703
6,
171
6,
083
6,
368
OS
UN
3,
973
3,
214
2,
776
2,
113
1,
520
4,
802
4,
500
6,
469
5,
942
4,
647
7,
855
10,
908
11
,169
11
,354
12
,380
O
YO
2,
901
1,
708
1,
647
1,
496
1,
580
3,
970
3,
904
4,
364
4,
415
3,
943
5,
573
7,
175
7,
407
8,
413
10
,666
P
LATE
AU
2,
353
2,
316
1,
836
1,
224
1,
170
3,
006
3,
000
3,
661
4,
139
3,
919
4,
200
5,
395
5,
780
7,
027
8,
323
RIV
ER
S
4,14
6
3,82
6
2,96
1
2,75
9
2,27
1
3,42
1
3,45
2
5,79
6
5,96
8
5,85
6
3,56
8
4,82
7
5,28
6
7,02
8
6,87
1 S
OK
OTO
4,
233
4,
036
3,
579
3,
463
3,
365
3,
353
3,
561
3,
519
3,
457
3,
370
5,
773
5,
230
5,
895
7,
000
8,
045
TAR
AB
A 3,
660
3,
127
3,
091
2,
765
3,
817
4,
104
4,
250
4,
593
4,
401
3,
717
4,
624
5,
144
6,
381
6,
364
6,
225
YO
BE
4,
722
4,
143
3,
937
3,
979
4,
028
6,
191
5,
740
5,
964
5,
621
6,
050
9,
257
12,
322
11
,871
12
,513
17
,094
ZA
MFA
RA
4,31
1
4,03
1
4,25
9
3,56
9
2,53
4
5,64
4
6,26
8
6,51
7
6,08
9
6,26
6
7,44
3
9,24
2
11,1
19
12,6
12
12,9
74
FCT
5,00
1
4,28
2
6,19
8
5,02
1
5,06
7
6,42
4
7,20
3
9,39
2 1
0,01
7
9,92
6
8,25
5 1
0,08
6 1
4,79
4
17,6
03
15,3
77
AVE
RA
GE
3,
130
2,
647
2,
702
2,
181
1,
948
6,
777
6,
886
8,
537
8,
465
8,
186
5,
196
6,
557
7,
333
7,
987
9,
411
Sou
rce:
Aut
hor’s
Com
puta
tion
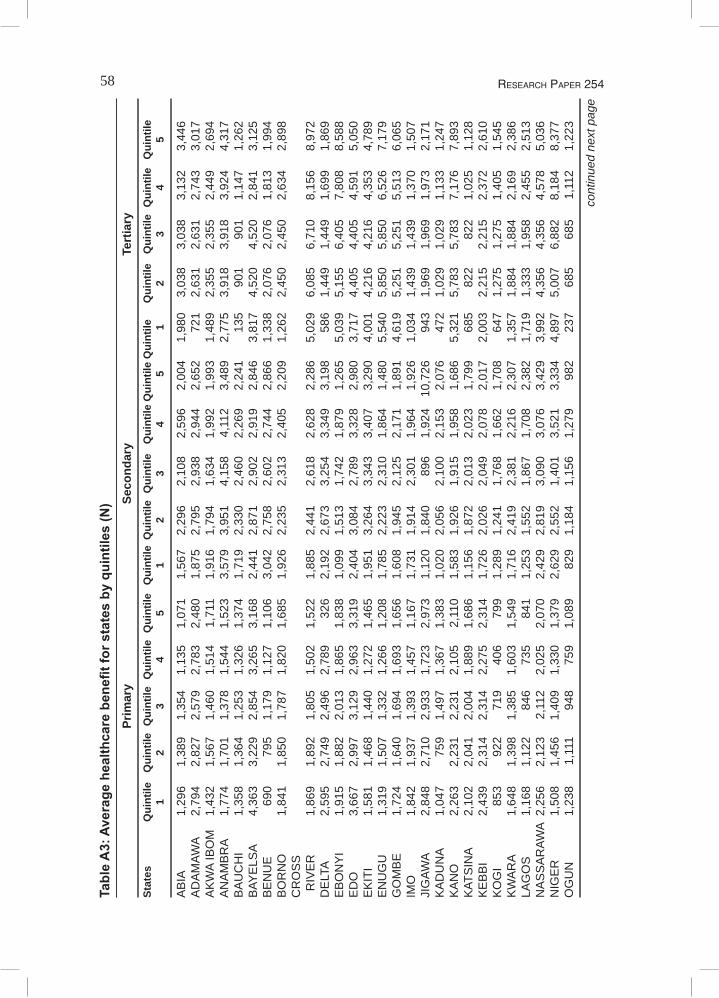
58 ReseaRch PaPeR 254
Tabl
e A
3: A
vera
ge h
ealth
care
ben
efit f
or s
tate
s by
qui
ntile
s (N
)
Prim
ary
Seco
ndar
y Te
rtia
rySt
ates
Q
uint
ile
Qui
ntile
Qui
ntile
Qui
ntile
Qui
ntile
Q
uint
ile Q
uint
ile Q
uint
ile
Qui
ntile
Qui
ntile
Qui
ntile
Q
uint
ile
Qui
ntile
Qui
ntile
Q
uint
ile
1
2 3
4 5
1 2
3 4
5 1
2 3
4 5
AB
IA
1,29
6
1,38
9
1,35
4
1,13
5
1,07
1
1,56
7
2,29
6
2,10
8
2,59
6
2,00
4
1,98
0
3,03
8
3,03
8
3,13
2
3,44
6 A
DA
MAW
A 2,
794
2,
827
2,
579
2,
783
2,
480
1,
875
2,
795
2,
938
2,
944
2,
652
72
1
2,63
1
2,63
1
2,74
3
3,01
7 A
KW
A IB
OM
1,
432
1,
567
1,
460
1,
514
1,
711
1,
916
1,
794
1,
634
1,
992
1,
993
1,
489
2,
355
2,
355
2,
449
2,
694
AN
AM
BR
A 1,
774
1,
701
1,
378
1,
544
1,
523
3,
579
3,
951
4,
158
4,
112
3,
489
2,
775
3,
918
3,
918
3,
924
4,
317
BA
UC
HI
1,35
8
1,36
4
1,25
3
1,32
6
1,37
4
1,71
9
2,33
0
2,46
0
2,26
9
2,24
1
135
90
1
901
1,
147
1,
262
BAY
ELS
A 4,
363
3,
229
2,
854
3,
265
3,
168
2,
441
2,
871
2,
902
2,
919
2,
846
3,
817
4,
520
4,
520
2,
841
3,
125
BE
NU
E
690
79
5
1,17
9
1,12
7
1,10
6
3,04
2
2,75
8
2,60
2
2,74
4
2,86
6
1,33
8
2,07
6
2,07
6
1,81
3
1,99
4 B
OR
NO
1,
841
1,
850
1,
787
1,
820
1,
685
1,
926
2,
235
2,
313
2,
405
2,
209
1,
262
2,
450
2,
450
2,
634
2,
898
CR
OS
S
RIV
ER
1,
869
1,
892
1,
805
1,
502
1,
522
1,
885
2,
441
2,
618
2,
628
2,
286
5,
029
6,
085
6,
710
8,
156
8,
972
DE
LTA
2,59
5
2,74
9
2,49
6
2,78
9
326
2,
192
2,
673
3,
254
3,
349
3,
198
58
6
1,44
9
1,44
9
1,69
9
1,86
9 E
BO
NY
I 1,
915
1,
882
2,
013
1,
865
1,
838
1,
099
1,
513
1,
742
1,
879
1,
265
5,
039
5,
155
6,
405
7,
808
8,
588
ED
O
3,66
7
2,99
7
3,12
9
2,96
3
3,31
9
2,40
4
3,08
4
2,78
9
3,32
8
2,98
0
3,71
7
4,40
5
4,40
5
4,59
1
5,05
0 E
KIT
I 1,
581
1,
468
1,
440
1,
272
1,
465
1,
951
3,
264
3,
343
3,
407
3,
290
4,
001
4,
216
4,
216
4,
353
4,
789
EN
UG
U
1,31
9
1,50
7
1,33
2
1,26
6
1,20
8
1,78
5
2,22
3
2,31
0
1,86
4
1,48
0
5,54
0
5,85
0
5,85
0
6,52
6
7,17
9 G
OM
BE
1,
724
1,
640
1,
694
1,
693
1,
656
1,
608
1,
945
2,
125
2,
171
1,
891
4,
619
5,
251
5,
251
5,
513
6,
065
IMO
1,
842
1,
937
1,
393
1,
457
1,
167
1,
731
1,
914
2,
301
1,
964
1,
926
1,
034
1,
439
1,
439
1,
370
1,
507
JIG
AWA
2,84
8
2,71
0
2,93
3
1,72
3
2,97
3
1,12
0
1,84
0
896
1,
924
10,
726
94
3
1,96
9
1,96
9
1,97
3
2,17
1 K
AD
UN
A 1,
047
75
9
1,49
7
1,36
7
1,38
3
1,02
0
2,05
6
2,10
0
2,15
3
2,07
6
472
1,
029
1,
029
1,
133
1,
247
KA
NO
2,
263
2,
231
2,
231
2,
105
2,
110
1,
583
1,
926
1,
915
1,
958
1,
686
5,
321
5,
783
5,
783
7,
176
7,
893
KAT
SIN
A 2,
102
2,
041
2,
004
1,
889
1,
686
1,
156
1,
872
2,
013
2,
023
1,
799
68
5
822
82
2
1,02
5
1,12
8 K
EB
BI
2,43
9
2,31
4
2,31
4
2,27
5
2,31
4
1,72
6
2,02
6
2,04
9
2,07
8
2,01
7
2,00
3
2,21
5
2,21
5
2,37
2
2,61
0 K
OG
I 85
3
922
71
9
406
79
9
1,28
9
1,24
1
1,76
8
1,66
2
1,70
8
647
1,
275
1,
275
1,
405
1,
545
KW
AR
A 1,
648
1,
398
1,
385
1,
603
1,
549
1,
716
2,
419
2,
381
2,
216
2,
307
1,
357
1,
884
1,
884
2,
169
2,
386
LAG
OS
1,
168
1,
122
84
6
735
84
1
1,25
3
1,55
2
1,86
7
1,70
8
2,38
2
1,71
9
1,33
3
1,95
8
2,45
5
2,51
3 N
AS
SA
RAW
A 2,
256
2,
123
2,
112
2,
025
2,
070
2,
429
2,
819
3,
090
3,
076
3,
429
3,
992
4,
356
4,
356
4,
578
5,
036
NIG
ER
1,
508
1,
456
1,
409
1,
330
1,
379
2,
629
2,
552
1,
401
3,
521
3,
334
4,
897
5,
007
6,
882
8,
184
8,
377
OG
UN
1,
238
1,
111
94
8
759
1,
089
82
9
1,18
4
1,15
6
1,27
9
982
23
7
685
68
5
1,11
2
1,22
3
cont
inue
d ne
xt p
age
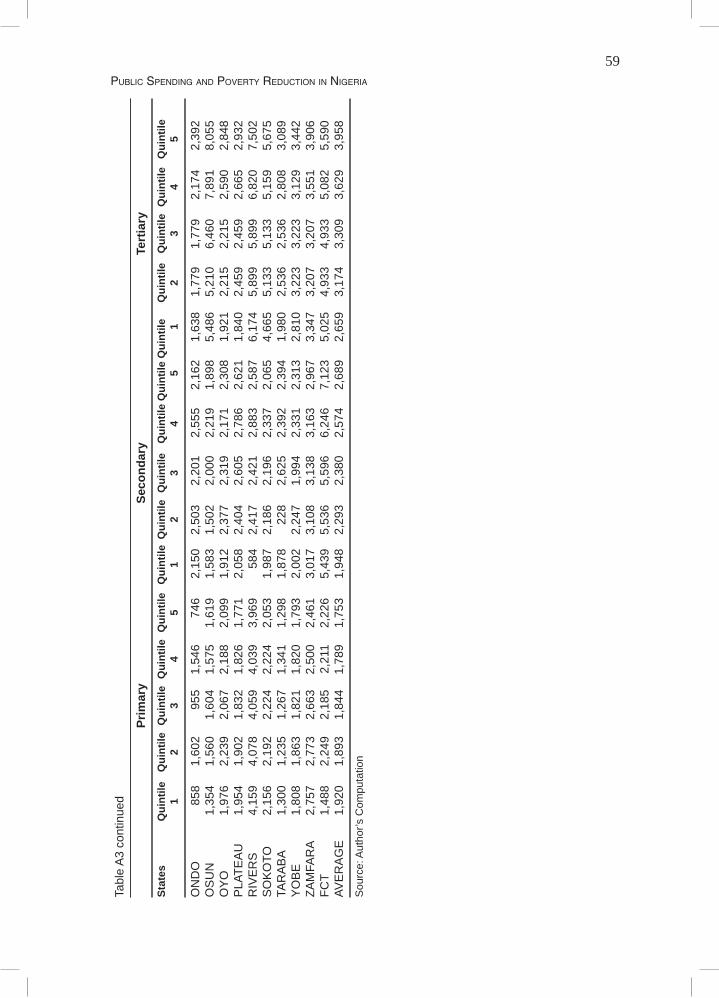
59Public SPending and Poverty reduction in nigeria
Tabl
e A
3 co
ntin
ued
Pr
imar
y Se
cond
ary
Tert
iary
Stat
es
Qui
ntile
Q
uint
ile Q
uint
ile Q
uint
ile Q
uint
ile
Qui
ntile
Qui
ntile
Qui
ntile
Q
uint
ile Q
uint
ile Q
uint
ile
Qui
ntile
Q
uint
ile Q
uint
ile
Qui
ntile
1 2
3 4
5 1
2 3
4 5
1 2
3 4
5
ON
DO
85
8
1,60
2
955
1,
546
74
6
2,15
0
2,50
3
2,20
1
2,55
5
2,16
2
1,63
8
1,77
9
1,77
9
2,17
4
2,39
2 O
SU
N
1,35
4
1,56
0
1,60
4
1,57
5
1,61
9
1,58
3
1,50
2
2,00
0
2,21
9
1,89
8
5,48
6
5,21
0
6,46
0
7,89
1
8,05
5 O
YO
1,
976
2,
239
2,
067
2,
188
2,
099
1,
912
2,
377
2,
319
2,
171
2,
308
1,
921
2,
215
2,
215
2,
590
2,
848
PLA
TEA
U
1,95
4
1,90
2
1,83
2
1,82
6
1,77
1
2,05
8
2,40
4
2,60
5
2,78
6
2,62
1
1,84
0
2,45
9
2,45
9
2,66
5
2,93
2 R
IVE
RS
4,
159
4,
078
4,
059
4,
039
3,
969
58
4
2,41
7
2,42
1
2,88
3
2,58
7
6,17
4
5,89
9
5,89
9
6,82
0
7,50
2 S
OK
OTO
2,
156
2,
192
2,
224
2,
224
2,
053
1,
987
2,
186
2,
196
2,
337
2,
065
4,
665
5,
133
5,
133
5,
159
5,
675
TAR
AB
A 1,
300
1,
235
1,
267
1,
341
1,
298
1,
878
22
8
2,62
5
2,39
2
2,39
4
1,98
0
2,53
6
2,53
6
2,80
8
3,08
9 Y
OB
E
1,80
8
1,86
3
1,82
1
1,82
0
1,79
3
2,00
2
2,24
7
1,99
4
2,33
1
2,31
3
2,81
0
3,22
3
3,22
3
3,12
9
3,44
2 ZA
MFA
RA
2,75
7
2,77
3
2,66
3
2,50
0
2,46
1
3,01
7
3,10
8
3,13
8
3,16
3
2,96
7
3,34
7
3,20
7
3,20
7
3,55
1
3,90
6 FC
T 1,
488
2,
249
2,
185
2,
211
2,
226
5,
439
5,
536
5,
596
6,
246
7,
123
5,
025
4,
933
4,
933
5,
082
5,
590
AVE
RA
GE
1,
920
1,
893
1,
844
1,
789
1,
753
1,
948
2,
293
2,
380
2,
574
2,
689
2,
659
3,
174
3,
309
3,
629
3,
958
Sou
rce:
Aut
hor’s
Com
puta
tion
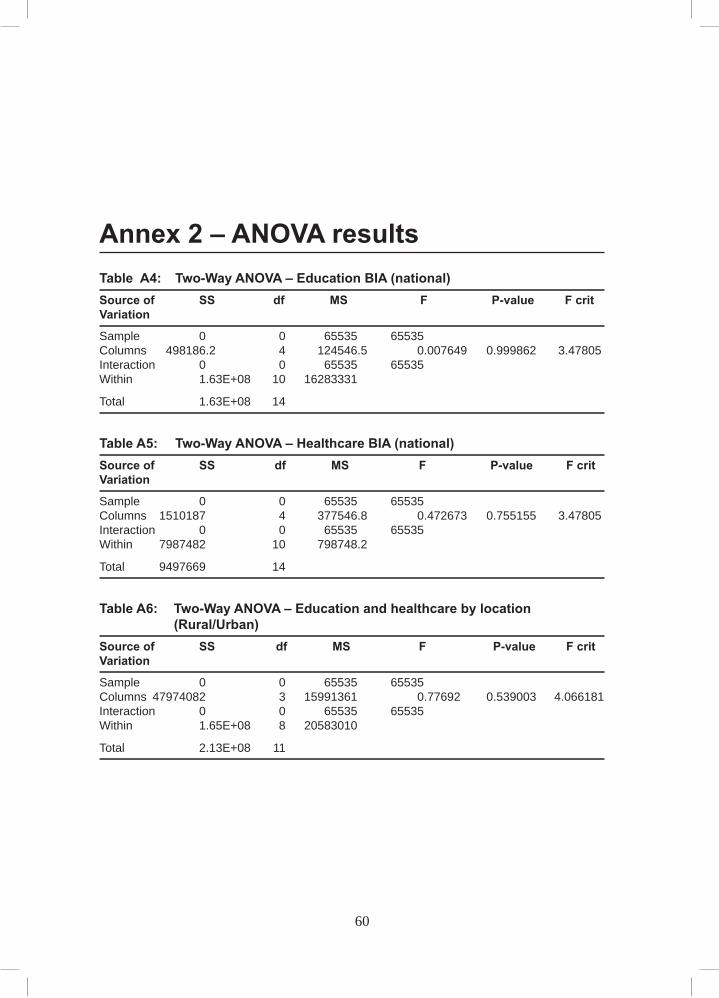
60 ReseaRch PaPeR 254
Annex 2 – ANOVA results Table A4: Two-Way ANOVA – Education BIA (national) Source of SS df MS F P-value F critVariation
Sample 0 0 65535 65535 Columns 498186.2 4 124546.5 0.007649 0.999862 3.47805Interaction 0 0 65535 65535 Within 1.63E+08 10 16283331
Total 1.63E+08 14
Table A5: Two-Way ANOVA – Healthcare BIA (national) Source of SS df MS F P-value F critVariation
Sample 0 0 65535 65535 Columns 1510187 4 377546.8 0.472673 0.755155 3.47805Interaction 0 0 65535 65535 Within 7987482 10 798748.2
Total 9497669 14
Table A6: Two-Way ANOVA – Education and healthcare by location (Rural/Urban)Source of SS df MS F P-value F critVariation
Sample 0 0 65535 65535 Columns 47974082 3 15991361 0.77692 0.539003 4.066181Interaction 0 0 65535 65535 Within 1.65E+08 8 20583010
Total 2.13E+08 11
60
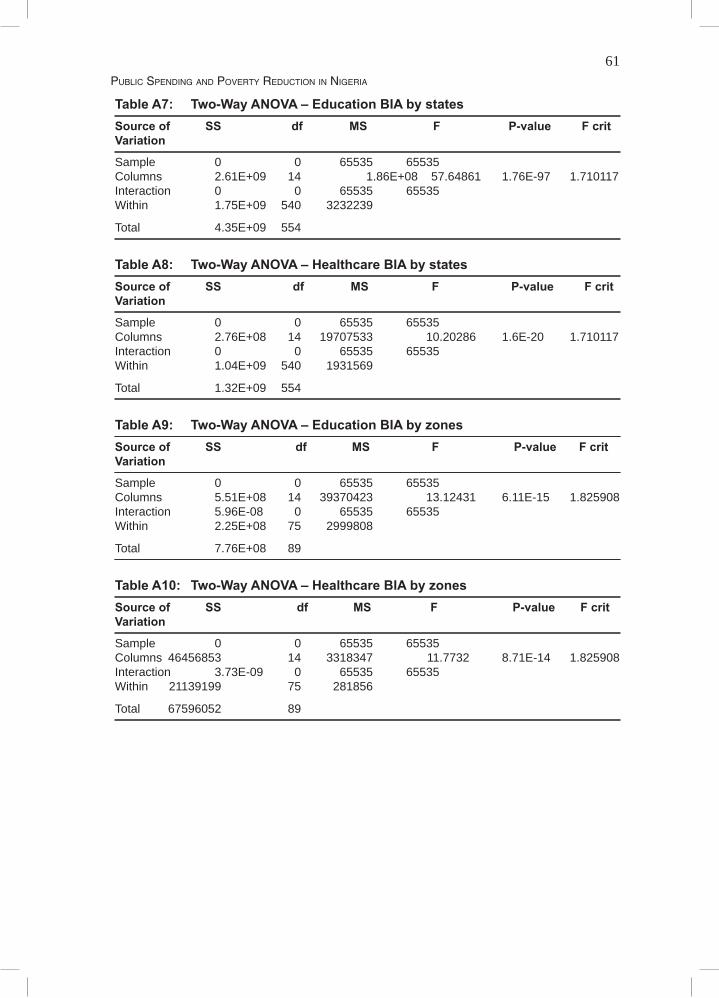
61Public SPending and Poverty reduction in nigeria
Table A7: Two-Way ANOVA – Education BIA by states Source of SS df MS F P-value F critVariation
Sample 0 0 65535 65535 Columns 2.61E+09 14 1.86E+08 57.64861 1.76E-97 1.710117Interaction 0 0 65535 65535 Within 1.75E+09 540 3232239
Total 4.35E+09 554
Table A8: Two-Way ANOVA – Healthcare BIA by states Source of SS df MS F P-value F critVariation
Sample 0 0 65535 65535 Columns 2.76E+08 14 19707533 10.20286 1.6E-20 1.710117Interaction 0 0 65535 65535 Within 1.04E+09 540 1931569
Total 1.32E+09 554
Table A9: Two-Way ANOVA – Education BIA by zones Source of SS df MS F P-value F critVariation
Sample 0 0 65535 65535 Columns 5.51E+08 14 39370423 13.12431 6.11E-15 1.825908Interaction 5.96E-08 0 65535 65535 Within 2.25E+08 75 2999808
Total 7.76E+08 89
Table A10: Two-Way ANOVA – Healthcare BIA by zones Source of SS df MS F P-value F critVariation
Sample 0 0 65535 65535 Columns 46456853 14 3318347 11.7732 8.71E-14 1.825908Interaction 3.73E-09 0 65535 65535 Within 21139199 75 281856
Total 67596052 89
62 ReseaRch PaPeR 254
Other recent publications in the AERC Research Papers Series:
FDI and Economic Growth: Evidence from Nigeria, by Adeolu B. Ayanwale, Research Paper 165.An Econometric Analysis of Capital Flight from Nigeria: A Portfolio Approach, by Akanni Lawanson,
Research Paper 166.Extent and Determinnanttts of Child Labour in Uganda, by Tom Mwebaze, Research Paper 167.Oil Wealth and Economic Growth in Oil Exporting African Countries, by Olomola Philip Akanni, Re-
search Paper 168.Implications of Rainfall Shocks for Household Income and Consumption in Uganda, by John Bosco
Asiimwe, Research Paper 169.Relative Price Variability and Inflation: Evidence from the Agricultural Sector in Nigeria, by Obasi O.
Ukoha, Research Paper 170.A Modelling of Ghana's Inflation: 1960–2003, by Mathew Kofi Ocran, Research Paper 171.The Determinants of School and Attainment in Ghana: A Gender Perspective, by Harry A. Sackey, Re-
search Paper 172.Private Returns to Education in Ghana: Implications for Investments in Schooling and Migration, by
Harry A. Sackey, Research Paper 173.Oil Wealth and Economic Growth in Oil Exporting African Countries, by Olomola Philip Akanni, Re-
search Paper 174.Private Investment Behaviour and Trade Policy Practice in Nigeria, by Dipo T. Busari and Phillip C.
Omoke, Research Paper 175.Determinants of the Capital Structure of Ghanaian Firms, by Jochua Abor, Research Paper 176.Privatization and Enterprise Performance in Nigeria: Case Study of some Privatized Enterprises, by
Afeikhena Jerome, Research Paper 177.Sources of Technical Efficiency among Smallholder Maize Farmers in Southern Malawi, by Ephraim W.
Chirwa, Research Paper 178.Technical Efficiency of Farmers Growing Rice in Northern Ghana, by Seidu Al-hassan, Research Paper
179.Empirical Analysis of Tariff Line-Level Trade, Tariff Revenue and Welfare Effects of Reciprocity under an
Economic Partnership Agreement with the EU: Evidence from Malawi and Tanzania, by Evious K. Zgovu and Josaphat P. Kweka, Research Paper 180.
Effect of Import Liberalization on Tariff Revenue in Ghana, by William Gabriel Brafu-Insaidoo and Camara Kwasi Obeng, Research Paper 181.
Distribution Impact of Public Spending in Cameroon: The Case of Health Care, by Bernadette Dia Ka-mgnia, Research Paper 182.
Social Welfare and Demand for Health Care in the Urban Areas of Côte d'Ivoire, by Arsène Kouadio, Vincent Monsan and Mamadou Gbongue, Research Paper 183.
Modelling the Inflation Process in Nigeria, by Olusanya E. Olubusoye and Rasheed Oyaromade, Re-search Paper 184.
Determinants of Expected Poverty Among Rural Households in Nigeria, by O.A. Oni and S.A. Yusuf, Research Paper 185.
Exchange Rate Volatility and Non-Traditional Exports Performance: Zambia, 1965–1999, by Anthony Musonda, Research Paper 186.
Macroeconomic Fluctuations in the West African Monetary Union: A Dynamic Structural Factor Model Approach, by Romain Houssa, Research Paper 187.
Price Reactions to Dividend Announcements on the Nigerian Stock Market, by Olatundun Janet Adel-egan, Research Paper 188.
Does Corporate Leadership Matter? Evidence from Nigeria, by Olatundun Janet Adelegan, Research Paper 189.
Determinants of Child Labour and Schooling in the Native Cocoa Households of Côte d'Ivoire, by Guy Blaise Nkamleu, Research Paper 190.
Analysis of Health Care Utilization in Côte d'Ivoire, by Alimatou CISSE, Research Paper 191.Poverty and the Anthropometric Status of Children: A Comparative Analysis of Rural and Urban House-
hold in Togo, by Kodjo Abalo, Research Paper 192.African Economic and Monetary Union (WAEMU), by Sandrine Kablan, Research Paper 193.
63Public SPending and Poverty reduction in nigeria
Economic Liberalization, Monetary and Money Demand in Rwanda: 1980–2005, by Musoni J. Rutayisire, Research Paper 194.
An Empirical Analysis of the Determinants of Food Imports in Congo, by Léonard Nkouka Safoulanitou and Mathias Marie Adrien Ndinga, Research Paper 195.
Determinants of a Firm's Level of Exports: Evidence from Manufacturing Firms in Uganda, by Aggrey Niringiye and Richard Tuyiragize, Research Paper 196.
Supply Response, Risk and Institutional Change in Nigerian Agriculture, by Joshua Olusegun Ajetomobi, Research Paper 197.
Multidimensional Spatial Poverty Comparisons in Cameroon, by Aloysius Mom Njong, Research Paper 198.Earnings and Employment Sector Choice in Kenya, by Robert Kivuti Nyaga, Research Paper 199.Convergence and Economic Integration in Africa: the Case of the Franc Zone Countries, by Latif A.G.
Dramani, Research Paper 200.Determinants of Employment in the Formal and Informal Sectors of the Urban Areas of Kenya, by Wambui
R. Wamuthenya, Research Paper 201.Financial Sector Liberalization and Productivity Change in Uganda's Commercial Banking Sector, by
Kenneth Alpha Egesa, Research Paper 202.Fiscal Reforms and Income Inequality in Senegal and Burkina Faso: A Comparative Study, by Mbaya Diene,
Research Paper 203.Factors Influencing Technical Efficiencies among Selected Wheat Farmers in Uasin Gishu District, Kenya,
by James Njeru, Research Paper 204.Exact Configuration of Poverty, Inequality and Polarization Trends in the Distribution of well-being in
Cameroon, by Francis Menjo Baye, Research Paper 205.Child Labour and Poverty Linkages: A Micro Analysis from Rural Malawian Data, by Leviston S. Chiwaula,
Research Paper 206.The Determinants of Private Investment in Benin: A Panel Data Analysis, by Sosthène Ulrich Gnansounou,
Research Paper 207. Contingent Valuation in Community-Based Project Planning: The Case of Lake Bamendjim Fishery Re-
Stocking in Cameroon, by William M. Fonta, Hyacinth E. Ichoku and Emmanuel Nwosu, Research Paper 208.
Multidimensional Poverty in Cameroon: Determinants and Spatial Distribution, by Paul Ningaye, Laurent Ndjanyou and Guy Marcel Saakou, Research Paper 209.
What Drives Private Saving in Nigeria, by Tochukwu E. Nwachukwu and Peter Odigie, Research Paper 210.Board Independence and Firm Financial Performance: Evidence from Nigeria, by Ahmadu U. Sanda, Tukur
Garba and Aminu S. Mikailu, Research Paper 211.Quality and Demand for Health Care in Rural Uganda: Evidence from 2002/03 Household Survey, by
Darlison Kaija and Paul Okiira Okwi, Research Paper 212.Capital Flight and its Determinants in the Franc Zone, by Ameth Saloum Ndiaya, Research Paper 213.The Efficacy of Foreign Exchange Market Intervention in Malawi, by Kisukyabo Simwaka and Leslie
Mkandawire, Research Paper 214.The Determinants of Child Schooling in Nigeria, by Olanrewaju Olaniyan, Research Paper 215.Influence of the Fiscal System on Income Distribution in Regions and Small Areas: Microsimulated CGE
Model for Côte d'Ivoire, by Bédia F. Aka and Souleymane S. Diallo, Research Paper 216.An Econometric Analysis of the Monetary Policy Reaction Function in Nigeria, by Chukwuma Agu, Research
Paper 217.Analysis of Technical Efficiency Differentials among Maize Farmers in Nigeria, by Luke Oyesola Olarinde,
Research Paper 218.Import Demand in Ghana: Structure, Behaviour and Stability, by Simon Lwadzpgah Harvey and Kordzo
Sedegah, Research Paper 219.Monetary Policy Rules: Lessons Learned from ECOWAS Countries, by Alain Siri, Research Paper 220.Volatility of resources inflows and Domestic Investment in Cameroon by Sunday A. Khan, Research
Paper 221.Efficiency Wage, Rent-Sharing Theories and Wage Determination in Manufacturing Sector in Nigeria by
Ben E. Aigbokhan, Research Paper 222.Government Wage Review Policy and Public-Private Sector Wage Differential in Nigeria by Alarudeen
Aminu, Research Paper 223.Rural Non-Farm Incomes and Poverty Reduction In Nigeria by Awoyemi Taiwo Timothy, Research
Paper 224.

64 ReseaRch PaPeR 254
After Fifteen Year Use of the Human Development Index (HDI) of the United Nations Development Pro-gram (UNDP): What Shall We Know? by Jean Claude Saha, Research Paper 225.
Uncertainty and Investment Behavior in the Democratic Republic of Congo by Xavier Bitemo Ndiwulu and Jean-Papy Manika Manzongani, Research Paper 226.
An Analysis of Stock Market Anomalies and Momentum Strategies on the Stock Exchange of Mauritius by Sunil K. Bundoo, Research Paper 227.
The Effect of Price Stability On Real Sector Performance in Ghana by Peter Quartey, Research Paper 228.
The Impact of Property Land Rights on the Production of Paddy Rice in the Tillabéry, Niamey and Dosso Regions in Niger by Maman Nafiou, Research Paper 229.
An Econometric Analysis of the Monetary Policy Reaction Function in Nigeria by Chukwuma Agu, Research Paper 230.
Investment in Technology and Export Potential of Firms in Southwest Nigeria by John Olatunji Adeoti, Research Paper 231.
Analysis of Technical Efficiency Differentials among Maize Farmers in Nigeria by Luke Oyesola Olar-inde, Research Paper 232.
Import Demand in Ghana: Structure, Behaviour and Stability by Simon Kwadzogah Harvey and Kordzo Sedegah, Research Paper 233.
Trade Liberalization Financing and Its Impact on Poverty and Income Distribution in Ghana by Vijay K. Bhasin, Research Paper 234.
An Empirical Evaluation of Trade Potential in Southern African Development Community by Kisukyabo Simwaka, Research Paper 235.
Government Capital Spending and Financing and Its Impact on Private Investment in Kenya: 1964-2006 by Samuel O. Oyieke, Research Paper 236.
Determinants of Venture Capital in Africa: Cross Section Evidence by Jonathan Adongo, Research Paper 237.
Social Capital and Household Welfare in Cameroon: A Multidimensional Analysis by Tabi Atemnkeng Johannes, Research Paper 238.
Analysis of the Determinants of Foreign Direct Investment Flows to the West African and Economic Union Countries by Yélé Maweki Batana, Research Paper 239.
Urban Youth Labour Supply and the Employment Policy in Côte d’Ivoire by Clément Kouadio Kouakou, Research Paper 240.
Managerial Characteristics, Corporate Governance and Corporate Performance: The Case of Nigerian Quoted Companies by Adenikinju Olayinka, Research Paper 241.
Effects of Deforestation on Household Time Allocation among Rural Agricultural Activities: Evidence from Western Uganda by Paul Okiira Okwi and Tony Muhumuza, Research Paper 242.
The Determinants of Inflation in Sudan by Kabbashi M. Suliman, Research Paper 243.Monetary Policy Rules: Lessons Learned From ECOWAS Countries by Alain Siri, Research Paper 244.Zimbabwe’s Experience with Trade Liberalization by Makochekanwa Albert, Hurungo T. James and
Kambarami Prosper, Research Paper 245.Determinants in the Composition of Investment in Equipment and Structures in Uganda by Charles
Augustine Abuka, Research Paper 246.Corruption at household level in Cameroon: Assessing Major Determinants by Joseph-Pierre Timnou
and Dorine K. Feunou, Research Paper 247. Growth, Income Distribution and Poverty: The Experience Of Côte d’Ivoire from 1985 to 2002 by Koua-
dio Koffi Eric, Mamadou Gbongue and Ouattara Yaya, Research Paper 248.Does Bank Lending Channel Exist In Kenya? Bank Level Panel Data Analysis by Moses Muse Sichei
and Githinji Njenga, Research Paper 249.Governance and Economic Growth in Cameroon by Fondo Sikod and John Nde Teke, Research Paper
250.Analyzing Multidimensional Poverty in Guinea: A Fuzzy Set Approach by Fatoumata Lamarana Diallo,
Research Paper 251.The Effects of Monetary Policy on Prices in Malawi by Ronald Mangani, Research Paper 252.Managerial Characteristics, Corporate Governance and Corporate Performance: The Case of Nigerian
Quoted Companies by Olayinka Adenikinju, Research Paper 253.