Embed Size (px)
Citation preview


Public Safety Committee Meeting Record
The Public Safety Committee meetings are recorded. Agenda materials are available online at www.dallascityhall.com. Recordings may be reviewed/copied by contacting the Public Safety Committee Coordinator at 214-670-3316.
Meeting Date: Monday, February 22, 2016 Convened: 11:08 A.M. Adjourned: 12:39 P.M. Committee Members Present: Committee Members Absent: Council Member Adam Medrano, Chair Council Member B. Adam McGough, Vice Chair Council Member Sandy Greyson Other Council Members Present: Council Member Tiffinni A. Young Council Member Jennifer S. Gates Council Member Philip T. Kingston Staff Present: Assistant City Manager Eric D. Campbell, CMO Director Kris Sweckard, CCS Police Chief David O. Brown, DPD 2nd Driver David Lindsey, DFR Fire Chief Louie Bright, III, DFR Assistant Chief Daniel Salazar, DFR Director Molly Carroll, HR Deputy Chief George Gamez, DFR Deputy Chief Vernon Hale, DPD Deputy Chief Tameji Berry, DFR Assistant Chief Norman Seals, DFR Assistant Director/City Marshal Ron Everett, CTS Dr. Marshal Isaacs, UTSW Assistant Director Cornell Perry, CIS Sr. Assistant City Attorney Bert Vandenberg, CAO Assistant Director Donzell Gipson, DPD Executive Assistant City Attorney Tammy Palomino, CAO Executive Assistant Chief Pughes, DPD AGENDA: Call to Order 1. Approval of Minutes from the February 8, 2016 Public Safety Committee Meeting
Presenter(s): Council Member Medrano, Chair Information Only:
Action Taken/Committee Recommendation(s): A motion was made to approve the February 8, 2016 minutes.
Motion made by: Council Member Greyson Motion Seconded by: Council Member Young Item passed unanimously: Item passed on a divided vote: Item failed unanimously: Item failed on a divided vote:
2. DFR Fire Chief Recruitment Update
Presenter(s): ACM Eric D. Campbell, CMO Information Only:
Action Taken/Committee Recommendation(s): This briefing provided the committee with an update on the Dallas Fire-Rescue Department’s Fire Chief recruitment.
Motion made by: Motion Seconded by: Item passed unanimously: Item passed on a divided vote: Item failed unanimously: Item failed on a divided vote:

Public Safety Committee Meeting Record – February 22, 2016 Page 2 of 3
3. K2 & Drug Paraphernalia Shops
Presenter(s): Deputy Chief Vernon Hale, DPD Information Only:
Action Taken/Committee Recommendation(s): This briefing provided the committee with background on K2 and the public safety issues that surrounds this synthetic cannabinoid. Council Member Gates would like a district map of where K2 arrests have been and the number of patients using K2 from the North Texas Poison Center. She would also like more information on the zoning issues related to the smoke shops. Council Member Young would like staff to work with the CAO and see what is possible in terms of an ordinance and would like a briefing on the findings. She would also like to know the area of East Dallas that is mentioned in the briefing where there is K2 presence. Staff will get with Council Member Young on this location. Council Member McGough would like to know what the City can legally do specifically with the head shops.
Motion made by: Motion Seconded by: Item passed unanimously: Item passed on a divided vote: Item failed unanimously: Item failed on a divided vote:
4. Dallas Fire-Rescue Department Critical Stress Management Team
Presenter(s): 2nd Driver David Lindsey, DFR Information Only:
Action Taken/Committee Recommendation(s): This briefing provided the committee with an overview of the DFR Critical Stress Management Team. Council Member Kingston would like to know as a percentage of the department, how many employees are being reached through this program. Motion made by: Motion Seconded by: Item passed unanimously: Item passed on a divided vote: Item failed unanimously: Item failed on a divided vote:
5. Quality Management Program
Presenter(s): Deputy Chief George Gamez, DFR Information Only:
Action Taken/Committee Recommendation(s): This briefing provide the committee with an update on the Quality Management Program. Council Member Kingston would like to see the department at some point in the future benchmark the results that we get against other in-house ambulance services and against private sector.
Motion made by: Motion Seconded by: Item passed unanimously: Item passed on a divided vote: Item failed unanimously: Item failed on a divided vote:
Public Safety Committee Meeting Record – February 22, 2016 Page 3 of 3
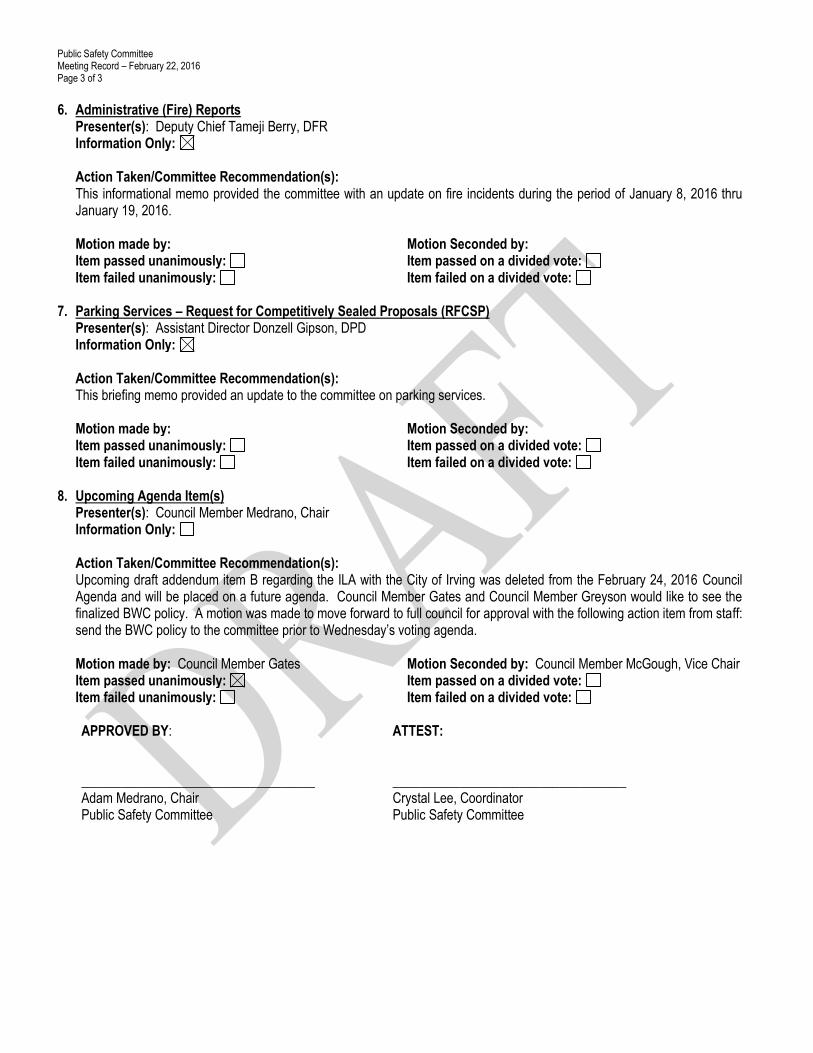
6. Administrative (Fire) Reports
Presenter(s): Deputy Chief Tameji Berry, DFR Information Only:
Action Taken/Committee Recommendation(s): This informational memo provided the committee with an update on fire incidents during the period of January 8, 2016 thru January 19, 2016.
Motion made by: Motion Seconded by: Item passed unanimously: Item passed on a divided vote: Item failed unanimously: Item failed on a divided vote:
7. Parking Services – Request for Competitively Sealed Proposals (RFCSP)
Presenter(s): Assistant Director Donzell Gipson, DPD Information Only:
Action Taken/Committee Recommendation(s): This briefing memo provided an update to the committee on parking services.
Motion made by: Motion Seconded by: Item passed unanimously: Item passed on a divided vote: Item failed unanimously: Item failed on a divided vote:
8. Upcoming Agenda Item(s)
Presenter(s): Council Member Medrano, Chair Information Only:
Action Taken/Committee Recommendation(s): Upcoming draft addendum item B regarding the ILA with the City of Irving was deleted from the February 24, 2016 Council Agenda and will be placed on a future agenda. Council Member Gates and Council Member Greyson would like to see the finalized BWC policy. A motion was made to move forward to full council for approval with the following action item from staff: send the BWC policy to the committee prior to Wednesday’s voting agenda.
Motion made by: Council Member Gates Motion Seconded by: Council Member McGough, Vice Chair Item passed unanimously: Item passed on a divided vote: Item failed unanimously: Item failed on a divided vote:
APPROVED BY: ATTEST: ___________________________________ ___________________________________ Adam Medrano, Chair Crystal Lee, Coordinator Public Safety Committee Public Safety Committee


Dallas Police Department Crime Report
www.dallaspolice.netDavid O. BrownChief Of Police
Public Safety CommitteeMarch 28, 2016

2

3*Note: Report generated from preliminary data

4
Type 1
Type 2
Type 3
Type 4
Type 5
Emergency Calls Goal – 8 Minutes or Less
Ex. Shooting, Cutting, Disturbance Active Shooter Foot, Kidnapping in Progress
Prompt CallsGoal – 12 Minutes or Less
Ex. Robbery, Fire, Criminal Assault
General Services Calls Goal – 30 Minutes or Less
Missing Person, Intoxicated Person, Drug House, Burglary (recent)
Non-Critical CallsGoal – 60 Minutes or Less
Ex. Disturbance (Loud Music), Theft, Burglary (Unknown when occurred), Animal Complaints,
Criminal Mischief, Panhandling
Telephone Service Calls*Ex. Lost Property, Theft from Person or
Service, Criminal Mischief, Want to Locate or Non-Critical Missing Person

2016Response Time Report
5
Year ReportType
Priority 1Response Time
Priority 2 Response Time
Priority 3Response Time
Priority 4Response Time
Sworn Strength (Actual)
OfficersPer 1,000
Population
2016Year to DateJan. 1- March 24 7.52 16.34 45.39 59.39 3,490 2.67
2016Month to Date
March 1- 24 7.44 14.94 34.43 49.99 3,490 2.67
2016Daily
March 24 6.72 13.43 27.33 31.29 3,490 2.67
Year Priority 1 Response Time
Priority 2 Response Time
Priority 3 Response Time
Priority 4 Response Time
Sworn Strength (Actual)
OfficersPer 1,000
Population2001 8.07 15.57 - - 2,880 2.372002 8.24 16.27 28.22 55.22 2,900 2.342003 8.24 18.10 30.97 63.35 2,981 2.422004 8.40 19.11 32.48 67.97 2,964 2.412005 8.30 18.57 32.99 63.94 2,932 2.382006 8.32 18.53 30.74 52.82 2,972 2.382007 8.50 17.57 33.31 59.07 3,018 2.442008 7.25 13.91 27.90 43.46 3,186 2.502009 7.07 12.10 25.69 45.15 3,389 2.632010 6.32 10.54 21.75 34.62 3,597 3.002011 6.32 11.45 25.58 40.61 3,690 3.022012 6.80 12.44 31.32 48.35 3,511 2.832013 7.34 14.32 38.88 61.13 3,519 2.802014 7.63 16.55 52.42 78.21 3,496 2.752015 8.09 19.59 65.18 89.27 3,523 2.73
2001 – 2015Response Time Report

Questions?
6

Appendix
7

8
Lowest HomicideRates on Record
Year HomicideRate
1930 .077
2014 .091
1957 .104
2015 .106
2011 .109
2013 .114
1931 .114
1952 .117
1958 .121
1951 .123
1955 .123
Number of Homicides 2004 - 2015
Year Number ofHomicides
2004 248
2005 202
2006 187
2007 200
2008 170
2009 166
2010 148
2011 133
2012 154
2013 143
2014 116
2015 136

2014 Total Crime Uniform Crime Report
Rank City Overall Crime Per 1,000 Population
1 New York 21.99
2 San Diego 23.40
3 Los Angeles 26.19
4 Chicago 40.10
5 Dallas 42.546 Phoenix 42.96
7 Philadelphia 44.09
8 Houston 56.85
9 San Antonio 59.57
10 Detroit 68.06
9
Source: 2014 Uniform Crime Reports Comparison of total part 1 offenses for each year. According to the FBI, caution is advised comparing statistical data specific to each jurisdiction.

Texas
Rank City Total Crime % Change
1 DALLAS -52.84%
2 PLANO -41.50%
3 EL PASO -31.81%
4 ARLINGTON -29.69%
5 LAREDO -28.39%
6 CORPUS CHRISTI -28.18%
7 HOUSTON -12.35%
8 FT WORTH -12.17%
9 AUSTIN - 9.68%
10 SAN ANTONIO - 5.71%Source: 2014 Uniform Crime ReportAccording to the FBI, caution is advised comparing statistical data specific to each jurisdictionFort Worth data - fortworthpd.com
10
Nationwide
Rank City Total Crime % Change
Years Consecutive Reduction
1 DALLAS -52.84% 11
2 LOS ANGELES -44.58% 11
3 DETROIT -44.22% 7
4 SAN DIEGO -40.41% 6
5 CHICAGO -40.07% 4*
6 PHOENIX -38.89% 5
7 NEW YORK -21.13% 7
8 PHILADELPHIA -17.25% 2
9 HOUSTON -12.35% 2
10 SAN ANTONIO - 5.71% 3

Note: Criminal Trespassing Activity – Offenses where a criminal trespass warning has been issued and/or an offense has occurred. 11
Criminal Trespassing ActivityCouncilDistrict Councilmember 2016
YTD 2015
1 Griggs 17 116
2 Medrano 98 591
3 Thomas 12 110
4 King 35 229
5 Callahan 6 57
6 Alonzo 47 218
7 Young 48 198
8 Wilson 36 234
9 Clayton 22 121
10 McGough 22 127
11 Kleinman 29 66
12 Greyson 36 31
13 Gates 25 98
14 Kingston 82 277
Total 515 2,473
Panhandling Citations CouncilDistrict Councilmember 2016
YTD 2015
1 Griggs 10 33
2 Medrano 134 308
3 Thomas 4 36
4 King 8 73
5 Callahan 6 43
6 Alonzo 130 521
7 Young 49 275
8 Wilson 15 226
9 Clayton 66 143
10 McGough 87 184
11 Kleinman 12 57
12 Greyson 19 36
13 Gates 36 163
14 Kingston 82 198
Total 664 2,296Note: Panhandling Initiative began February 1, 2016
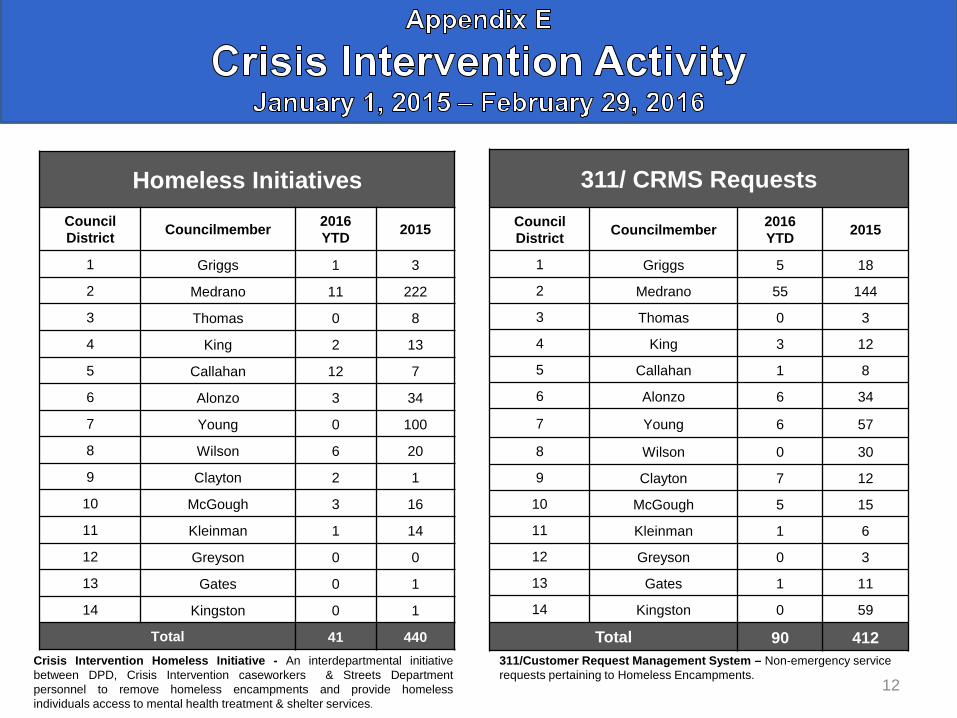
Crisis Intervention Homeless Initiative - An interdepartmental initiativebetween DPD, Crisis Intervention caseworkers & Streets Departmentpersonnel to remove homeless encampments and provide homelessindividuals access to mental health treatment & shelter services.
12
Homeless Initiatives CouncilDistrict Councilmember 2016
YTD 2015
1 Griggs 1 3
2 Medrano 11 222
3 Thomas 0 8
4 King 2 13
5 Callahan 12 7
6 Alonzo 3 34
7 Young 0 100
8 Wilson 6 20
9 Clayton 2 1
10 McGough 3 16
11 Kleinman 1 14
12 Greyson 0 0
13 Gates 0 1
14 Kingston 0 1
Total 41 440
311/ CRMS Requests CouncilDistrict Councilmember 2016
YTD 2015
1 Griggs 5 18
2 Medrano 55 144
3 Thomas 0 3
4 King 3 12
5 Callahan 1 8
6 Alonzo 6 34
7 Young 6 57
8 Wilson 0 30
9 Clayton 7 12
10 McGough 5 15
11 Kleinman 1 6
12 Greyson 0 3
13 Gates 1 11
14 Kingston 0 59
Total 90 412311/Customer Request Management System – Non-emergency service requests pertaining to Homeless Encampments.

13*Note - Data only reflects the number of cases worked, does not reflect additional activity such as inspections, citizen contact, etc.
2015CouncilDistrict Councilmember Open
CasesClosedCases
1 Griggs 1 1
2 Medrano 11 9
3 Thomas 2 1
4 King 5 8
5 Callahan 1 0
6 Alonzo 8 0
7 Young 16 12
8 Wilson 2 5
9 Clayton 4 3
10 McGough 5 4
11 Kleinman 8 1
12 Greyson 4 2
13 Gates 0 4
14 Kingston 5 0
Total 72 50
2016CouncilDistrict Councilmember Open
CasesClosedCases
1 Griggs 1 0
2 Medrano 2 0
3 Thomas 0 0
4 King 5 0
5 Callahan 0 0
6 Alonzo 3 0
7 Young 6 0
8 Wilson 4 0
9 Clayton 1 0
10 McGough 1 0
11 Kleinman 1 0
12 Greyson 0 0
13 Gates 0 0
14 Kingston 1 0
Total 25 0

14
Crisis Intervention Homeless Encampment Activity
CouncilDistrict Councilmember 2013 2014 2015 2016
YTD
1 Griggs 82 52 50 0
2 Medrano 71 52 65 2
3 Thomas 42 35 46 0
4 King 2 5 64 1
5 Callahan 47 39 99 1
6 Alonzo 28 40 64 7
7 Young 116 80 117 4
8 Wilson 64 67 64 2
9 Clayton 104 86 30 0
10 McGough 140 139 49 19
11 Kleinman 97 92 67 9
12 Greyson 201 175 4 1
13 Gates 116 117 42 0
14 Kingston 73 43 33 0
Total 1,183 1,022 794 46
Note: Gang Offenses are defined as involving any persons (complainant or suspect) who are listed in the Texas Gang database as a known Gang member.

15
Crisis Intervention Homeless Encampment Activity
Unit Activity 2010 2011 2012 2013 2014 20152016YTD
Arrest Assist N/A 170 479 209 154 86 33
City Arrest N/A 179 514 171 80 65 11
Felony Arrest 81 114 302 258 191 192 30
Investigative Arrest N/A 134 N/A 167 77 92 15
Search Warrant N/A 7 N/A 23 N/A 19 4
Calls N/A 302 1,044 1,083 579 889 84
Citations Hazard N/A 45 85 88 39 45 11
Citations Regular N/A 147 338 254 132 75 14
GangNet Entries N/A N/A N/A 904 332 209 33
Drugs N/A 102 249 126 67 90 37
Guns 99 86 168 54 25 101 13
Vehicles Seized 4 16 0 4 2 22 2
Cash Seized $75,000 $59,000 $153,000 $58,000 $680,000 $604,500 $21,000
Traffic Stops N/A 1068 3113 1419 541 419 91
Ped Stops N/A 754 3713 1806 1714 1385 186
Gang Cards 114 514 1929 976 579 453 86
Offenses Cleared 92 159 152 136 106 54 21
Cases Filed 101 155 83 92 83 68 21
Cases Assigned 272 199 118 211 205 164 45
Gang Offense Tracking System 2,471 1,807 1,464 882 650 430 83
Gang Unit Action Request 147 302 N/A 82 23 24 8
Warrants Filed N/A N/A N/A 0 27 12 5
School Contacts N/A 20 N/A N/A N/A 178 7
Statements Taken N/A N/A N/A N/A N/A 49 11

16
City of Dallas City of DallasCouncil District 1 Council District 2
Scott Griggs Adam Medrano
VIOLENT CRIMESYTD 2015
YTD 2014
YTD % CHANGE
6 YEAR% CHANGE
12 YEAR% CHANGE VIOLENT CRIMES
YTD 2015
YTD 2014
YTD % CHANGE
6 YEAR% CHANGE
12 YEAR % CHANGE
MURDER 7 4 75.00% -30.00% -56.25% MURDER 11 8 37.50% -45.00% -52.17%
*SEXUAL ASSAULT 38 40 -5.00% * * *SEXUAL ASSAULT 68 68 0.00% * *
BUSINESS ROBBERY 71 61 16.39% -36.04% -26.04% BUSINESS ROBBERY 79 49 61.22% -30.09% -52.12%
INDIVIDUAL ROBBERY 188 152 23.68% -35.62% -59.04% INDIVIDUAL ROBBERY 342 352 -2.84% -43.64% -70.27%TOTAL ROBBERY 259 213 21.60% -35.73% -53.33% TOTAL ROBBERY 421 401 4.99% -41.50% -67.99%
AGG. ASSLT-OTHER 127 151 -15.89% -39.91% -69.23% AGG. ASSLT-OTHER 213 253 -15.81% -30.62% -73.57%
AGG. ASSLT-FAM VIOL 73 75 -2.67% 18.03% -38.46% AGG. ASSLT-FAM VIOL 113 77 46.75% 29.89% -20.98%
TOTAL AGG ASSLT 200 226 -11.50% -27.01% -62.48% TOTAL AGG ASSLT 326 330 -1.21% -17.26% -65.65%TOTAL VIOLENT 504 483 4.35% -28.87% -54.63% TOTAL VIOLENT 826 807 2.35% -30.29% -64.83%PROPERTY CRIMES PROPERTY CRIMESBUSINESS BURGLARY 237 216 9.72% -0.83% -51.12% BUSINESS BURGLARY 352 389 -9.51% -8.46% -53.46%
RESIDENCE BURGLARY 377 403 -6.45% -51.48% -62.99% RESIDENCE BURGLARY 477 431 10.67% -26.56% -54.88%
TOTAL BURGLARY 614 619 -0.81% -39.47% -59.14% TOTAL BURGLARY 829 820 1.10% -19.81% -54.28%SHOPLIFT 118 131 -9.92% -70.79% -80.07% SHOPLIFT 191 255 -25.10% -58.13% -78.64%
BMV & AUTO ACC 908 863 5.21% -35.62% -44.65% BMV & AUTO ACC 1,535 1,581 -2.91% -36.48% -61.48%OTHER THEFT 416 470 -11.49% -31.26% -65.17% OTHER THEFT 909 1,024 -11.23% -19.19% -55.18%TOTAL THEFT 1,442 1,464 -1.50% -40.37% -57.93% TOTAL THEFT 2,635 2,860 -7.87% -33.98% -61.79%
AUTO THEFT 394 392 0.51% -31.49% -73.42% AUTO THEFT 774 673 15.01% -29.21% -61.56%TOTAL PROPERTY 2,450 2,475 -1.01% -38.87% -61.80% TOTAL PROPERTY 4,238 4,353 -2.64% -30.72% -60.47%TOTAL PART 1 CRIMES 2,954 2,958 -0.14% -37.35% -60.73% TOTAL PART 1 CRIMES 5,064 5,160 -1.86% -30.65% -61.26%

17
City of Dallas City of DallasCouncil District 3 Council District 4Casey Thomas II Carolyn King Arnold
VIOLENT CRIMESYTD 2015
YTD 2014
YTD % CHANGE
6 YEAR % CHANGE
12 YEAR % CHANGE VIOLENT CRIMES
YTD 2015
YTD 2014
YTD% CHANGE
6 YEAR % CHANGE
12 YEAR % CHANGE
MURDER 10 5 100.00% -9.09% 25.00% MURDER 12 12 0.00% -48.00% -56.67%
*SEXUAL ASSAULT 47 47 0.00% * * *SEXUAL ASSAULT 61 74 -17.57% * *
BUSINESS ROBBERY 48 46 4.35% -40.74% -41.46% BUSINESS ROBBERY 80 71 12.68% 6.67% -23.81%
INDIVIDUAL ROBBERY 176 147 19.73% -31.52% -28.46% INDIVIDUAL ROBBERY 339 320 5.94% -5.83% -29.08%
TOTAL ROBBERY 224 193 16.06% -33.73% -31.71% TOTAL ROBBERY 419 391 7.16% -3.68% -28.13%
AGG. ASSLT-OTHER 151 150 0.67% -6.79% -49.83% AGG. ASSLT-OTHER 303 301 0.66% -14.85% -54.76%
AGG. ASSLT-FAM VIOL 117 68 72.06% 40.96% 13.59% AGG. ASSLT-FAM VIOL 195 164 18.90% 18.18% -20.08%
TOTAL AGG ASSLT 268 218 22.94% 9.39% -33.66% TOTAL AGG ASSLT 498 465 7.10% -4.41% -45.52%
TOTAL VIOLENT 549 463 18.57% -10.53% -27.75% TOTAL VIOLENT 990 942 5.10% -2.91% -37.19%
PROPERTY CRIMES PROPERTY CRIMESBUSINESS BURGLARY 201 223 -9.87% -23.46% -43.79% BUSINESS BURGLARY 202 289 -30.10% -40.80% -65.78%
RESIDENCE BURGLARY 503 608 -17.27% -59.84% -48.83% RESIDENCE BURGLARY 658 785 -16.18% -49.27% -55.76%
TOTAL BURGLARY 704 831 -15.28% -53.60% -47.50% TOTAL BURGLARY 860 1,074 -19.93% -47.48% -58.64%
SHOPLIFT 63 65 -3.08% -69.90% -84.58% SHOPLIFT 196 207 -5.31% -26.97% -63.62%
BMV & AUTO ACC 973 902 7.87% -16.85% -30.51% BMV & AUTO ACC 826 720 14.72% -12.84% -35.16%
OTHER THEFT 399 435 -8.28% -27.77% -51.87% OTHER THEFT 589 595 -1.01% -31.70% -56.27%
TOTAL THEFT 1,435 1,402 2.35% -25.64% -45.53% TOTAL THEFT 1,611 1,522 5.85% -22.46% -48.97%
AUTO THEFT 560 576 -2.78% -35.07% -52.54% AUTO THEFT 509 515 -1.17% -22.81% -58.29%
TOTAL PROPERTY 2,699 2,809 -3.92% -37.31% -47.64% TOTAL PROPERTY 2,980 3,111 -4.21% -31.92% -53.86%
TOTAL PART 1 CRIMES 3,248 3,272 -0.73% -33.97% -45.08% TOTAL PART 1 CRIMES 3,970 4,053 -2.05% -26.40% -50.57%

18
City of Dallas City of DallasCouncil District 5 Council District 6
Rick Callahan Monica R. Alonzo
VIOLENT CRIMESYTD 2015
YTD2014
YTD % CHANGE
6 YEAR% CHANGE
12 YEAR % CHANGE VIOLENT CRIMES
YTD 2015
YTD 2014
YTD % CHANGE
6 YEAR% CHANGE
12 YEAR % CHANGE
MURDER 7 12 -41.67% -56.25% -36.36% MURDER 14 14 0.00% 75.00% -54.84%
*SEXUAL ASSAULT 36 53 -32.08% * * *SEXUAL ASSAULT 59 59 0.00% * *
BUSINESS ROBBERY 64 51 25.49% -29.67% -30.43% BUSINESS ROBBERY 71 70 1.43% -41.80% -51.37%
INDIVIDUAL ROBBERY 226 180 25.56% -23.05% -36.06% INDIVIDUAL ROBBERY 293 301 -2.66% -32.72% -54.63%
TOTAL ROBBERY 290 231 25.54% -24.61% -34.90% TOTAL ROBBERY 364 371 -1.89% -34.70% -54.03%
AGG. ASSLT-OTHER 184 135 36.30% 17.31% -51.84% AGG. ASSLT-OTHER 210 217 -3.23% -34.78% -71.31%
AGG. ASSLT-FAM VIOL 83 85 -2.35% -7.87% -26.79% AGG. ASSLT-FAM VIOL 107 76 40.79% 52.86% -40.22%
TOTAL AGG ASSLT 267 220 21.36% 8.16% -46.14% TOTAL AGG ASSLT 317 293 8.19% -19.13% -65.20%
TOTAL VIOLENT 600 516 16.28% -10.78% -38.62% TOTAL VIOLENT 754 737 2.31% -24.28% -57.44%
PROPERTY CRIMES PROPERTY CRIMESBUSINESS BURGLARY 215 275 -21.82% -14.40% -39.73% BUSINESS BURGLARY 441 438 0.68% -36.97% -62.70%
RESIDENCE BURGLARY 515 611 -15.71% -54.07% -51.72% RESIDENCE BURGLARY 470 453 3.75% -35.83% -36.35%
TOTAL BURGLARY 730 886 -17.61% -46.72% -48.68% TOTAL BURGLARY 911 891 2.24% -36.39% -52.61%
SHOPLIFT 72 121 -40.50% -84.71% -82.71% SHOPLIFT 253 353 -28.33% -70.29% -45.02%
BMV & AUTO ACC 671 783 -14.30% -38.60% -39.11% BMV & AUTO ACC 1,819 1,750 3.94% -33.63% -44.03%
OTHER THEFT 407 437 -6.86% -30.05% -54.53% OTHER THEFT 697 889 -21.60% -30.39% -61.20%
TOTAL THEFT 1,150 1,341 -14.24% -46.60% -52.53% TOTAL THEFT 2,769 2,992 -7.45% -39.71% -49.78%
AUTO THEFT 399 477 -16.35% -25.60% -54.54% AUTO THEFT 1,053 1,028 2.43% -35.07% -52.27%
TOTAL PROPERTY 2,279 2,704 -15.72% -43.87% -51.74% TOTAL PROPERTY 4,733 4,911 -3.62% -38.10% -50.92%
TOTAL PART 1 CRIMES 2,879 3,220 -10.59% -39.17% -49.49% TOTAL PART 1 CRIMES 5,487 5,648 -2.85% -36.50% -51.93%

19
City of Dallas City of DallasCouncil District 7 Council District 8Tiffinni A. Young Erik Wilson
VIOLENT CRIMESYTD 2015
YTD 2014
YTD % CHANGE
6 YEAR % CHANGE
12 YEAR% CHANGE VIOLENT CRIMES
YTD 2015
YTD 2014
YTD % CHANGE
6 YEAR % CHANGE
12 YEAR % CHANGE
MURDER 19 21 -9.52% -29.63% -55.81% MURDER 22 14 57.14% 29.41% 57.14%*SEXUAL ASSAULT 86 81 6.17% * * *SEXUAL ASSAULT 100 73 36.99% * *BUSINESS ROBBERY 75 80 -6.25% -27.88% -33.63% BUSINESS ROBBERY 48 55 -12.73% -36.84% -41.46%INDIVIDUAL ROBBERY 446 461 -3.25% -8.42% -47.96% INDIVIDUAL ROBBERY 318 291 9.28% 1.60% -5.09%
TOTAL ROBBERY 521 541 -3.70% -11.84% -46.29% TOTAL ROBBERY 366 346 5.78% -5.93% -12.26%AGG. ASSLT-OTHER 437 427 2.34% 8.40% -57.09% AGG. ASSLT-OTHER 317 290 9.31% -5.93% -32.70%AGG. ASSLT-FAM VIOL 268 204 31.37% 23.96% 1.13% AGG. ASSLT-FAM VIOL 196 199 -1.51% 31.54% 13.29%
TOTAL AGG ASSLT 705 631 11.73% 13.83% -45.07% TOTAL AGG ASSLT 513 489 4.91% 5.56% -20.34%TOTAL VIOLENT 1,331 1,274 4.47% 3.46% -43.06% TOTAL VIOLENT 1,001 922 8.57% 7.91% -10.47%
PROPERTY CRIMES PROPERTY CRIMESBUSINESS BURGLARY 304 342 -11.11% -31.32% -53.27% BUSINESS BURGLARY 230 276 -16.67% -38.44% -41.43%RESIDENCE BURGLARY 963 889 8.32% -37.58% -39.76% RESIDENCE BURGLARY 1,051 1,122 -6.33% -43.85% -14.15%
TOTAL BURGLARY 1,267 1,231 2.92% -36.18% -43.69% TOTAL BURGLARY 1,281 1,398 -8.37% -42.95% -20.76%SHOPLIFT 157 237 -33.76% -81.53% -88.21% SHOPLIFT 243 315 -22.86% -62.80% -65.19%
BMV & AUTO ACC 1,077 1,032 4.36% -27.05% -44.13% BMV & AUTO ACC 1,070 1,098 -2.55% -23.45% -17.68%OTHER THEFT 673 777 -13.38% -32.13% -59.86% OTHER THEFT 665 703 -5.41% -23.35% -45.11%TOTAL THEFT 1,907 2,046 -6.79% -42.65% -61.46% TOTAL THEFT 1,978 2,116 -6.52% -32.22% -38.41%
AUTO THEFT 620 728 -14.84% -28.27% -59.14% AUTO THEFT 682 814 -16.22% -12.10% -40.40%TOTAL PROPERTY 3,794 4,005 -5.27% -38.56% -56.46% TOTAL PROPERTY 3,941 4,328 -8.94% -33.64% -34.03%TOTAL PART 1 CRIMES 5,125 5,279 -2.92% -31.26% -53.61% TOTAL PART 1 CRIMES 4,942 5,250 -5.87% -27.99% -30.30%

20
City of Dallas City of DallasCouncil District 9 Council District 10
Mark Clayton B. Adam McGough
VIOLENT CRIMESYTD2015
YTD 2014
YTD% CHANGE
6 YEAR % CHANGE
12 YEAR % CHANGE VIOLENT CRIMES
YTD2015
YTD 2014
YTD% CHANGE
6 YEAR % CHANGE
12 YEAR % CHANGE
MURDER 4 4 0.00% -42.86% -33.33% MURDER 15 11 36.36% 50.00% 66.67%
*SEXUAL ASSAULT 35 33 6.06% * * *SEXUAL ASSAULT 55 50 10.00% * *
BUSINESS ROBBERY 36 28 28.57% -59.09% -59.55% BUSINESS ROBBERY 46 56 -17.86% -33.33% -57.80%
INDIVIDUAL ROBBERY 186 152 22.37% -16.96% -43.29% INDIVIDUAL ROBBERY 293 327 -10.40% -15.41% -40.97%
TOTAL ROBBERY 222 180 23.33% -28.85% -46.76% TOTAL ROBBERY 339 383 -11.49% -18.40% -44.02%
AGG. ASSLT-OTHER 86 78 10.26% -18.10% -58.25% AGG. ASSLT-OTHER 134 161 -16.77% -8.22% -61.60%
AGG. ASSLT-FAM VIOL 79 75 5.33% 31.15% 3.90% AGG. ASSLT-FAM VIOL 111 112 -0.89% 15.63% -29.75%
TOTAL AGG ASSLT 165 153 7.84% 0.00% -41.34% TOTAL AGG ASSLT 245 273 -10.26% 1.24% -51.68%
TOTAL VIOLENT 426 370 15.14% -13.94% -41.30% TOTAL VIOLENT 654 717 -8.79% -4.92% -43.85%
PROPERTY CRIMES PROPERTY CRIMESBUSINESS BURGLARY 150 200 -25.00% -42.26% -42.26% BUSINESS BURGLARY 155 149 4.03% -47.30% -53.57%
RESIDENCE BURGLARY 514 551 -6.72% -46.23% -54.83% RESIDENCE BURGLARY 694 656 5.79% -49.56% -55.68%
TOTAL BURGLARY 664 751 -11.58% -45.37% -52.46% TOTAL BURGLARY 849 805 5.47% -49.16% -55.31%
SHOPLIFT 139 121 14.88% -70.95% -73.83% SHOPLIFT 312 420 -25.71% -45.30% -5.71%
BMV & AUTO ACC 835 935 -10.70% -35.84% -52.90% BMV & AUTO ACC 805 806 -0.12% -41.51% -59.01%
OTHER THEFT 355 439 -19.13% -38.04% -65.35% OTHER THEFT 437 517 -15.47% -35.58% -63.53%
TOTAL THEFT 1,329 1,495 -11.10% -43.53% -60.11% TOTAL THEFT 1,554 1,743 -10.84% -40.77% -55.55%
AUTO THEFT 469 374 25.40% -5.42% -43.18% AUTO THEFT 445 388 14.69% -20.77% -60.87%
TOTAL PROPERTY 2,462 2,620 -6.03% -39.44% -55.67% TOTAL PROPERTY 2,848 2,936 -3.00% -41.32% -56.41%
TOTAL PART 1 CRIMES 2,888 2,990 -3.41% -36.65% -54.00% TOTAL PART 1 CRIMES 3,502 3,653 -4.13% -36.81% -54.51%

21
City of Dallas City of DallasCouncil District 11 Council District 12
Lee M. Kleinman Sandy Greyson
VIOLENT CRIMESYTD2015
YTD2014
YTD% CHANGE
6 YEAR % CHANGE
12 YEAR % CHANGE VIOLENT CRIMES
YTD2015
YTD 2014
YTD% CHANGE
6 YEAR % CHANGE
12 YEAR % CHANGE
MURDER 2 6 -66.67% -66.67% -66.67% MURDER 2 1 100.00% -33.33% -50.00%
*SEXUAL ASSAULT 42 25 68.00% * * *SEXUAL ASSAULT 19 25 -24.00% * *
BUSINESS ROBBERY 29 47 -38.30% -53.23% -50.85% BUSINESS ROBBERY 25 12 >100% -30.56% -7.41%
INDIVIDUAL ROBBERY 119 124 -4.03% -28.74% -54.23% INDIVIDUAL ROBBERY 82 53 54.72% 10.81% 9.33%
TOTAL ROBBERY 148 171 -13.45% -35.37% -53.61% TOTAL ROBBERY 107 65 64.62% -2.73% 4.90%
AGG. ASSLT-OTHER 76 58 31.03% -9.52% -63.29% AGG. ASSLT-OTHER 35 54 -35.19% -37.50% -67.29%
AGG. ASSLT-FAM VIOL 39 41 -4.88% -9.30% -29.09% AGG. ASSLT-FAM VIOL 30 34 -11.76% -6.25% -42.31%
TOTAL AGG ASSLT 115 99 16.16% -9.45% -56.11% TOTAL AGG ASSLT 65 88 -26.14% -26.14% -59.12%
TOTAL VIOLENT 307 301 1.99% -20.92% -49.59% TOTAL VIOLENT 193 179 7.82% -13.39% -32.87%
PROPERTY CRIMES PROPERTY CRIMESBUSINESS BURGLARY 173 153 13.07% -44.55% -41.75% BUSINESS BURGLARY 87 101 -13.86% -49.71% -24.35%
RESIDENCE BURGLARY 399 452 -11.73% -50.19% -46.75% RESIDENCE BURGLARY 404 316 27.85% -46.71% -20.74%
TOTAL BURGLARY 572 605 -5.45% -48.61% -45.33% TOTAL BURGLARY 491 417 17.75% -47.27% -21.41%
SHOPLIFT 356 417 -14.63% -41.94% -64.36% SHOPLIFT 105 102 2.94% -64.43% -64.31%
BMV & AUTO ACC 1,099 997 10.23% -42.47% -56.95% BMV & AUTO ACC 485 467 3.85% -53.36% -65.65%
OTHER THEFT 405 443 -8.58% -25.50% -61.13% OTHER THEFT 232 220 5.45% -46.54% -64.25%
TOTAL THEFT 1,860 1,857 0.16% -39.32% -59.52% TOTAL THEFT 822 789 4.18% -53.55% -65.10%
AUTO THEFT 367 290 26.55% -46.70% -61.75% AUTO THEFT 263 207 27.05% -14.97% -52.74%
TOTAL PROPERTY 2,799 2,752 1.71% -42.47% -57.59% TOTAL PROPERTY 1,576 1,413 11.54% -47.60% -55.43%
TOTAL PART 1 CRIMES 3,106 3,053 1.74% -40.87% -56.91% TOTAL PART 1 CRIMES 1,769 1,592 11.12% -45.24% -53.74%

22
City of Dallas City of DallasCouncil District 13 Council District 14
Jennifer Staubach Gates Philip T. Kingston
VIOLENT CRIMESYTD 2015
YTD2014
YTD % CHANGE
6 YEAR% CHANGE
12 YEAR% CHANGE VIOLENT CRIMES
YTD 2015
YTD 2014
YTD % CHANGE
6 YEAR% CHANGE
12 YEAR% CHANGE
MURDER 2 3 -33.33% n.c. -84.62% MURDER 3 6 -50.00% -25.00% -72.73%
*SEXUAL ASSAULT 22 26 -15.38% * * *SEXUAL ASSAULT 51 28 82.14% * *
BUSINESS ROBBERY 43 26 65.38% -20.37% -61.95% BUSINESS ROBBERY 65 46 41.30% -27.78% -51.13%
INDIVIDUAL ROBBERY 193 168 14.88% -17.52% -56.92% INDIVIDUAL ROBBERY 192 152 26.32% -26.25% -54.63%
TOTAL ROBBERY 236 194 21.65% -18.06% -57.93% TOTAL ROBBERY 257 198 29.80% -26.65% -53.79%
AGG. ASSLT-OTHER 81 101 -19.80% -11.83% -70.50% AGG. ASSLT-OTHER 92 84 9.52% -16.51% -70.83%
AGG. ASSLT-FAM VIOL 55 59 -6.78% 37.50% -36.05% AGG. ASSLT-FAM VIOL 31 29 6.90% 24.00% -27.91%
TOTAL AGG ASSLT 136 160 -15.00% 3.01% -62.36% TOTAL AGG ASSLT 123 113 8.85% -8.96% -65.63%
TOTAL VIOLENT 396 383 3.39% -9.91% -58.55% TOTAL VIOLENT 434 345 25.80% -14.57% -54.55%
PROPERTY CRIMES PROPERTY CRIMESBUSINESS BURGLARY 165 135 22.22% -43.21% -52.62% BUSINESS BURGLARY 344 326 5.52% -4.42% -43.37%
RESIDENCE BURGLARY 414 453 -8.61% -52.33% -54.21% RESIDENCE BURGLARY 376 452 -16.81% -43.96% -62.44%
TOTAL BURGLARY 579 588 -1.53% -50.09% -53.77% TOTAL BURGLARY 720 778 -7.46% -30.11% -55.21%
SHOPLIFT 606 703 -13.80% -26.11% -43.04% SHOPLIFT 239 253 -5.53% -75.98% -76.45%
BMV & AUTO ACC 1,188 898 32.29% -29.98% -51.41% BMV & AUTO ACC 1,903 1,903 0.00% -31.26% -54.44%
OTHER THEFT 458 529 -13.42% -26.86% -69.11% OTHER THEFT 1,010 1,087 -7.08% -11.71% -51.81%
TOTAL THEFT 2,252 2,130 5.73% -28.34% -54.90% TOTAL THEFT 3,152 3,243 -2.81% -35.72% -56.74%
AUTO THEFT 290 306 -5.23% -54.52% -70.45% AUTO THEFT 550 527 4.36% -23.72% -54.39%
TOTAL PROPERTY 3,121 3,024 3.21% -36.82% -56.81% TOTAL PROPERTY 4,422 4,548 -2.77% -33.56% -56.22%
TOTAL PART 1 CRIMES 3,517 3,407 3.23% -34.61% -57.02% TOTAL PART 1 CRIMES 4,856 4,893 -0.76% -32.21% -56.08%


Public Safety Committee
March 28, 2016
David O. Brown
Chief Of Policewww.dallaspolice.net
Community Policing 2.0
(CP 2.0)

Outline
• Historical background
• Overview
• Goals of Community Policing 2.0
• Officer Training
• Response Time
2

What is Community Policing 2.0?
• Implemented Fall 2011 and each year thereafter through 2013.
• DPD’s efforts to keep all officers connected to the community
through front line fundamental police work in the Patrol Bureau.
• Patrol Bureau receives additional officers and sergeants from
non-patrol bureau positions within the department to assist with
call answering.
• CP 2.0 officers work for two consecutive weeks at one of the
seven Patrol Bureau divisions which they select during the CP 2.0
bid process.
• Recent revision allows up to five officers to work the
Communications Division at the Phone Expeditor’s desk
addressing Priority 3 and 4 calls.
3

Community Policing 2.0 Goals
• To assist and improve all seven Patrol Bureau divisions’ response
times to Priority 1, 2, 3, and 4 calls.
• With 911 call loads managed more effectively (calls not pending to
be dispatched), current patrol officers have more time for
proactive/self-initiated enforcement work.
• Proactive enforcement activities focused on high crime areas
(typically TAAGs) is the most effective manner to reduce violent
and property crime.
4

Who Participates in CP 2.0?
• All non-patrol bureau officers at the rank of sergeant and below.
Current CP 2.0 bid exemptions:
• Light Duty Personnel
• Restricted Duty Personnel
• Narcotics Division
• Vice Unit (Limited)
• Love Field Unit
• Metro Unit
• Gang Unit
• Traffic Unit – Temporarily Exempt
5

When does CP 2.0 Occur?
• The first half of 2016, the two week CP 2.0 rotations were
scheduled to start February 8th, February 22nd, March 7th, March
21st, April 4th, April 18th, and May 2nd.
• CP 2.0 officers are scheduled to work 4:00 p.m. – 12:00 a.m.
• 3rd Watch hours are typically highest for 9-1-1 call load and violent
crime.
• The second half of 2016, May 16th – August 28th are under
consideration for rotation start dates.
6

Officer Training for CP 2.0
Patrol Duty Refresher Training 8 hours at the DPD Academy
• Message from the Chief
• Body Worn Camera & L3 Vehicle Dash Camera Refresher
• Patrol Procedures – Field Based Reporting (FBR)
• MDC, Report Writing, Arrest Procedures, Jail Procedures
• Reality Based Training - Rapid Rescue
• Family Violence Update PowerPoint
• Reality Based Training - De-escalation
• Blue Team (Use of Force Reporting) PowerPoint
7

CP 2.0
Response Time Comparison
8
March, 1 through 24
February, 1 through 29
Non-Critical 60.65
Non-Critical 49.99

Officers’ Activity
• Officers assigned to CP 2.0 perform a number of functions during
their assigned periods:
- 911 call response in the field
- Station security (allowing patrol officers to resume regular patrol duties)
- Paddy wagon (prisoner transport) duties
- Communications Division Phone Service Expeditor – working on
Priority 3 and 4 calls
- Communications Division Service Desk
• CP 2.0 officers responded to 5,128 calls for police service and
made 95 felony arrests through March 18, 2016.9

Summary• Recent analysis showed 54% of violent crime occurred during 3rd
watch hours.
• Violent crimes such as shootings, cuttings, family violence
assaults, and robberies of businesses and individuals require
more officers and time to address than other types of 911 calls.
• Manpower need is compounded by spikes in 911 call loads
during 3rd watch hours.
• CP 2.0 officers have provided a much needed boost to Patrol
Bureau manpower during critical 3rd watch hours.
• Going forward, the need to incorporate CP 2.0 officers into patrol
duties will remain in order to continue DPD’s effort to connect to
the community, reduce 911 call response times, and reduce
crime.
10

Questions?
11


Communications Operations Center (Handling Calls for Service)
Public Safety Committee
March 28, 2016

Overview
• Police Communications Services Section
• 911 Call for Service Process
• Response Time Facts
• Quality Customer Service
• Summary
2

Police Communications
Services Section
• Consist of 911 Operators, Police Dispatchers and Police
Report Representatives
• Act as liaisons between citizens calling for Police/Fire
services and patrol officers
• Prioritize 911 calls based on information provided by
caller and create calls for service
• Dispatch patrol officers to calls for service
• Provide officers with updated call information and
additional resources
3

Perception
4

The Process
Pick Up to Queue
911 Operator
Queue to Assign
Dispatcher Assign to Arrive
Patrol Officer
5
• The process of a 911 call for service is a concerted effort
by the:
• 911 Operator
• Police Dispatcher
• Responding Patrol Officer
• Calls are prioritized based on information provided at the
time of the call

6Priority 1
Priority 2
Priority 3
Priority 4
Priority 5
Emergency Calls Goal – 8 Minutes or Less
Ex. Shooting, Cutting, Disturbance Active Shooter Foot, Kidnapping in Progress
Prompt CallsGoal – 12 Minutes or Less
Ex. Robbery, Fire, Criminal Assault
General Services Calls Goal – 30 Minutes or Less
Missing Person, Intoxicated Person, Drug House, Burglary (recent)
Non-Critical CallsGoal – 60 Minutes or Less
Ex. Disturbance (Loud Music), Theft, Burglary (Unknown when occurred), Animal Complaints,
Criminal Mischief, Panhandling
Telephone Service Calls*Ex. Lost Property, Theft from Person or Service,
Criminal Mischief, Want to Locate or Non-Critical Missing Person
Call Priority System

911 Operator
7
Pick-Up to
Queue
• Receives and triages calls to determine call
priority
• Creates call sheet and inputs information
into Computer Aided Dispatch System
• Calls electronically routed to dispatch queue
• 911 Operator Constraints:
• Time spent gathering information
• Caller unintelligible
• Location unknown
• Type of Call – priority 1 calls are 2 part
• 2015 - 2,108,951 911 calls answered

Police Dispatcher
8
• Call sheet populated into dispatch queue
• Dispatch time starts
• Dispatcher locates and assigns available
patrol officer(s)
• Dispatcher Constraints:
• Officer(s) availability
• Number of officers needed based on type
of call (mental health calls, major
incidents)
• 2015 - 606,541 calls dispatched

9
• Acknowledges and responds to call(s)
• Travel time starts
• Travel Time Constraints:
• Traffic/Road Conditions/Time of day
• Weather
• Officer flagged down
• Officer diverted to higher priority call
Patrol Officer

Response Time Facts
• Providing estimated time of arrival (ETA) is a challenge
due to the consequences faced should the ETA not be
met
• No national standard for police response times, each
agency is unique based on geography, demographics and
strategic goals of the department
• DPD’s Response Time Goals were established in 2007
• DPD’s emphasis on crime reduction and quality customer
service has an unintended effect on response times to
911 calls
10
Customer Service
11
• While response times are important, quality of service
typically leaves a lasting, positive impression
• Officers are not rushing into critical incident calls (mental
health) - waiting on cover and utilizing training to handle
such calls
• Officers are spending more time on calls to provide a
better customer service experience
• The National Institute of Justice (NIJ) notes investigations,
problem solving and careful forensic evidence collection
contribute more to arresting suspects than initial response
times

Customer Service
• Results in more 911 calls for service (number of 911 calls
versus number of offenses)
• Results in fewer calls answered per officer and longer wait
times for officer response to 911 calls
12

Summary
• Quality or quantity?
• Slowing down instead of rushing into critical incident
scenarios promotes greater officer and citizen safety
• Critical incident calls require more manpower, which in
turn ties up more officers to handle each call
• Officers are called upon to answer more non-police calls
than in the past 24/7
• Response times can be improved with the addition of
police resources available to respond to calls13

Questions?
14

Memorandum
CITY OF DALLAS
DATE March 25, 2016
ro Honorable Members of the Public Safety Committee: Adam Medrano (Chair), B. Adam McGough (Vice Chair), Sandy Greyson, Tiffinni A. Young, Jennifer S. Gates, Philip T. Kingston
suBJEcT Administrative (Police) Reports
On Monday, March 28, 2016, you will be updated on police involved shooting investigations in the Internal Affairs Division by Deputy Chief Gilberto Garza of the Dallas Police Department. Currently there are no new investigations pending.
Below are completed investigations in which the Internal Affairs Division revealed that the officer(s) were justified in their use of deadly force.
A. Control #2014-044 B. Control #2014-045 C. Control#2014-107 D. Control #2014-138 E. Control #2014-209 F. Control #2014-229 G. Control #2014-230 H. Control #2014-255 I. Control #2014-281 J. Control #2014-282 K. Control #2014-283 L. Control #2014-284
Presented to PSC March 24, 2014 March 24, 2014 April 28, 2014 May 27, 2014
August25,2014 August 25, 2014 August25,2014
September 22, 2014 September 22, 2014 September 22, 2014 September 22, 2014 September 22, 2014
Please contact me if you have any questions or need additional information.
Eric D. Campbell Assistant City Manager
cc: Honorable Mayor and Members of the City Council A.C. Gonzalez, Manager Warren M.S. Ernst Attorney
D. Kinton, Rosa Rios. Daniel F. Administr·atlve Ryan S. Evans,
Together. We Do It Better


Executive Session
Jack Evans Security Enhancements
Pursuant to Section 551.076 of the Texas Open Meetings Act