Embed Size (px)
Citation preview
PUBLIC PERCEPTIONS ON DEMOCRACY AND GOVERNANCE IN TANZANIA
By Amon Chaligha, Bob Mattes and Annie Dzenga
May 2004
We are grateful to the Netherlands Ministry of Foreign Affairs for funding this project.
2
PUBLIC PERCEPTIONS ON DEMOCRACY AND GOVERNANCE IN TANZANIA
A REPORT BASED ON THE 2003 AFROBAROMETER SURVEY
EXECUTIVE SUMMARY There were no major political developments in Tanzania since the Round 1 Afrobarometer survey in 2001, except the Chama cha Mapinduzi (CCM) and the Civic United Front (CUF) political accord that made it possible to hold by-elections in 19 constituencies in Pemba.1 The CCM/CUF accord is particularly important for the people of Zanzibar for it has normalized the political situation and calmed down political tempers. This second round Afrobarometer Report, asked people’s opinions about democracy, markets and good governance. The report also compares the second round opinions with the first round in order to gauge and track differences in opinion if any. The main focus of this report is however on citizens’ perceptions of the quality of democracy in Tanzania. In order for democracy to nurture and sustain, there must be a clear citizen demand for democracy. Citizens must always be willing to demand for democratic institutions and practice while clearly rejecting non-democratic alternatives. The second Afrobarometer survey in Tanzania measured the demand for democracy in three different ways. First, by assessing the extent to which Tanzanians reject non-democratic alternatives for governing their country. Second, the demand for democracy is measured by examining popular support for democracy and finally by assessing the extent to which Tanzanians support key procedural elements of democracy. It can be discerned from the findings that most people reject one party rule with only about one third still nostalgic about the old days of single party rule that dominated the politics of Tanzania for close to three decades. Moreover, a big majority reject personalized rule, specifically rule by chiefs or elders. Furthermore, four in five Tanzanians reject military rule in Tanzania while four in five people reject one-man rule. These results can be translated to mean that there is a high demand for democracy and democratic institutions in Tanzania. Despite the high demand for democracy, there are worrying developments. It is particularly worrying that the number of people supporting democracy is declining in Tanzania. For example where as in 2001 eight in ten Tanzanians or 84 percent said democracy was the best form of government, in 2003 only close to two thirds (65 percent) of all respondents said that democracy is the best form of government. Respondents were also asked to choose between two statements: that political parties are divisive and should be ignored and that many political parties are needed (a choice between multipartism and no party). A substantial majority (67 percent) say that many political parties are needed. The Tanzanian constitution provides for a two-term presidency. However, there have been some voices (albeit weak and underground) demanding the constitution to be
1 After the 2000 presidential elections in Zanzibar the CUF disputed the results which culminated in clashes between the Police and CUF followers. At least 21 people lost their lives and the CUF boycotted the Parliament and the House of Representatives. To end the stalemate CUF and CCM leaders reached a political accord known in Tanzania as the ‘Mwafaka’.
3
amended to scrap the two-term limit for Tanzanian presidents. In this Afrobarometer Round we found it expedient to test the opinion of Tanzanians regarding this proposition. When faced with this choice of no term limits for president or two terms only for the Tanzanian President, nearly three quarters (74 percent) of all respondents said they supported limits for the presidency to two terms only. This may be a demand for limitations on absolute power, and insistence that the President respect the law and the constitution. Afrobarometer assessed citizen satisfaction with democracy in Tanzania by looking at extent of their participation, political freedoms and perceptions of rule of law. Thus, Tanzanians were asked to evaluate the extent of democracy by asking them how democratic Tanzania was. Overall, eight in ten Tanzanians (81 percent) said Tanzania was a democracy. However, they conceded that Tanzania was not a full democracy; with half the respondents (50 percent) saying Tanzania was a democracy with minor problems. Only 12 percent said Tanzania was a full democracy, while 19 percent said it was a democracy with major problems. A small minority (8 percent) said Tanzania was not a democracy. However, it may be noted that only 12 percent now believe that Tanzania is a full democracy compared to 17 percent in 2001 who by then believed that Tanzania was a full democracy. Democracy can only thrive and survive where citizens take an active role in the governance of their country. Indeed, the extent of democracy is reflected in their active participation in the governance of their country. Tanzanians have a high penchant for politics and this is indicated by the fact that a sizeable majority or about 67 percent of those interviewed said they discuss politics, with 36 percent saying they discuss politics a lot. Their activeness in politics is corroborated by the fact that over eight in ten (83 percent) of those interviewed said they attend community meetings, with nearly half (48 percent), reporting attending a community meeting several times. Moreover, a sizeable majority (84 percent) has interest in public affairs. The majority of those interviewed (76 percent) say that they can make elected representatives listen to them. This attitude is important for democracy because it means citizens believe they can make their elected leaders accountable. Another form of political participation is citizen contact of their leadership. The survey wanted to know the extent to which citizens consult their leadership. The findings indicate that Tanzanians are more likely to consult local government officials (42 percent) than central government officials (33 percent). This is an improvement when compared to 2001 when only 29 percent contacted local government officials. However, most Tanzanians (56 percent) would rather contact a religious leader than a political party leader (only 34 percent contacted a political party leader) or a traditional ruler (27 percent). Despite the upward trend in leadership consultations between 2001 and 2003, the Member of Parliament is still the least consulted public leader, with only 19 percent confirming contact with their parliamentarian. In 2001 only 12 percent consulted their Member of Parliament. A big majority (80 percent) never contacts their Member of Parliament. Of interest though is the increase of 15 percent more who reported consulting traditional leaders in 2003. There has also been more than a 50 percent rise in the citizen political party consultation jumping from 13 percent in 2001 to 34 percent in 2003.
4
To evaluate the extent of democracy in Tanzania, respondents were asked about their freedom of expression, freedom of association, arbitrary arrests, voting freedom and equality before the law. It may also be pointed out that 77 percent of the respondents feel that the condition of voting freedom is now better than in the past. Indeed a third thinks that voting freedom is now much better than under the one party system. However, less than half of those interviewed (48 percent) feel that their influence on government decisions is still limited. Only 35 percent say their influence on the government is better under the current regime than under the single party system. Despite the positive evaluation of free speech, freedom of association, and electoral freedoms, people appear to be worried. There has been a slight decline in the proportion of people who believe they can speak their mind as they wish, from 77 percent in 2001 to 76 in 2003. Whilst the same number (81 percent) of respondents still believe they can join any organization of their choice, a slightly lower number (77 percent) in 2003 believe that each person can freely choose who to vote for compared to 79 percent in 2001. Satisfaction with the political leadership may have a bearing on legitimacy and consequently support for democracy. A leadership that appears to listen and is willing to help solve the problems of their citizens is likely to gain their support. President Mkapa still enjoys a very high performance approval with 84 percent saying they are satisfied with his performance. This rating is however slightly lower than that of 2001 (90 percent). Nevertheless, the Tanzanian president still has much higher approval rates among the elected leaders. Levels of perceived corruption differ among public agencies and officials. About 44 percent of the Tanzanian respondents perceive the Police to be the most corrupt public institution in the country. This situation undermines the integrity and efficiency of the police force, tarnishing the image of the government among citizens. Unlike the police, the level of perceived corruption among the custodians of the law in 2003 is much higher than the level of perceived corruption of 64 percent recorded in 2001. Furthermore, there has also been a drop in the level of perceived corruption among civil servants from 82 percent in 2001 to 67 percent in 2003. It appears that popular opposition to non-democratic alternatives in Tanzania is waning in all options except that of one party rule which has stayed the same. However, it is worrying that support for some non-democratic alternatives is picking up especially support for traditional rule which has gone up. Rejection of military rule has also declined from 96 percent in 2001 to 87 percent and that of one man rule from 92 percent in 2001 to 86 percent in 2003. The sharp drop in support for democracy indicate that people are taking democracy for granted perhaps because of the domineering ruling party which has been in power for more than three decades. The lack of serious competition from the opposition parties seems to cultivate negative attitudes to democracy in Tanzania. These developments are worth noting and corrective measures should be taken, particularly by tackling those economic reforms that hurt people the most and level the ground for political party competition.
5
PUBLIC PERCEPTIONS ON DEMOCRACY AND GOVERNANCE IN TANZANIA
A REPORT BASED ON THE 2003 AFROBAROMETER SURVEY
Introduction Economic and political reforms can only be sustained if they are rooted in society. Often there are complaints that outsiders introduce from above and often through agitation reforms. Hence the intended beneficiaries of these changes would hesitate to support them because they were not consulted in the first place. The backbone of democracy, pluralist politics and a plural economy, can only be consolidated and sustained if there is a sizeable population, which demands and supports democratic ideals in any given society. Following the 2000 elections, one of the major stakeholders in the election in Zanzibar, the Civic United Front (CUF) disputed the results and in the ensuing protests almost 31 people lost their lives. In 2002 the CUF and Chama Cha Mapinduzi (CCM) had roundtable discussions that resulted in the political accord (Muafaka) which has brought back peace and harmony in Tanzania as a whole and Zanzibar in particular. There are no major political developments in Tanzania since the 1st Afrobarometer report in 2001, except the CCM and CUF political accord that made it possible to hold by-elections in 19 constituencies in Pemba. This second round Afrobarometer Report, the first after the accord, asked people’s opinions about democracy, markets and good governance. Hence the report also compares the second round opinions with the first round in order to gauge and track differences in opinion if any. This report analyzes the results of a second public opinion survey conducted in Tanzania in June 2003, both for Mainland Tanzania and for Zanzibar. The main focus of this report is however on citizens’ perceptions of the quality of democracy in Tanzania. Methodology A nationally representative sample of 1,223 Tanzanians (both mainland and Zanzibar) was interviewed between June and July in 2003. A random sample of this size allows a confidence level of 95 percent and a margin of error of plus or minus 3 percent. The survey was conducted in all the regions of the country with the number of interviewees in each region being proportional to the region’s population size (See Appendix 1). The survey targeted citizens above the age of 18 years and the sample was gender balanced with half male and half female respondents. Furthermore, 30 percent of the respondents were drawn from urban areas and the remaining 70 percent were drawn from rural areas. All the interviews were conducted in Kiswahili.
6
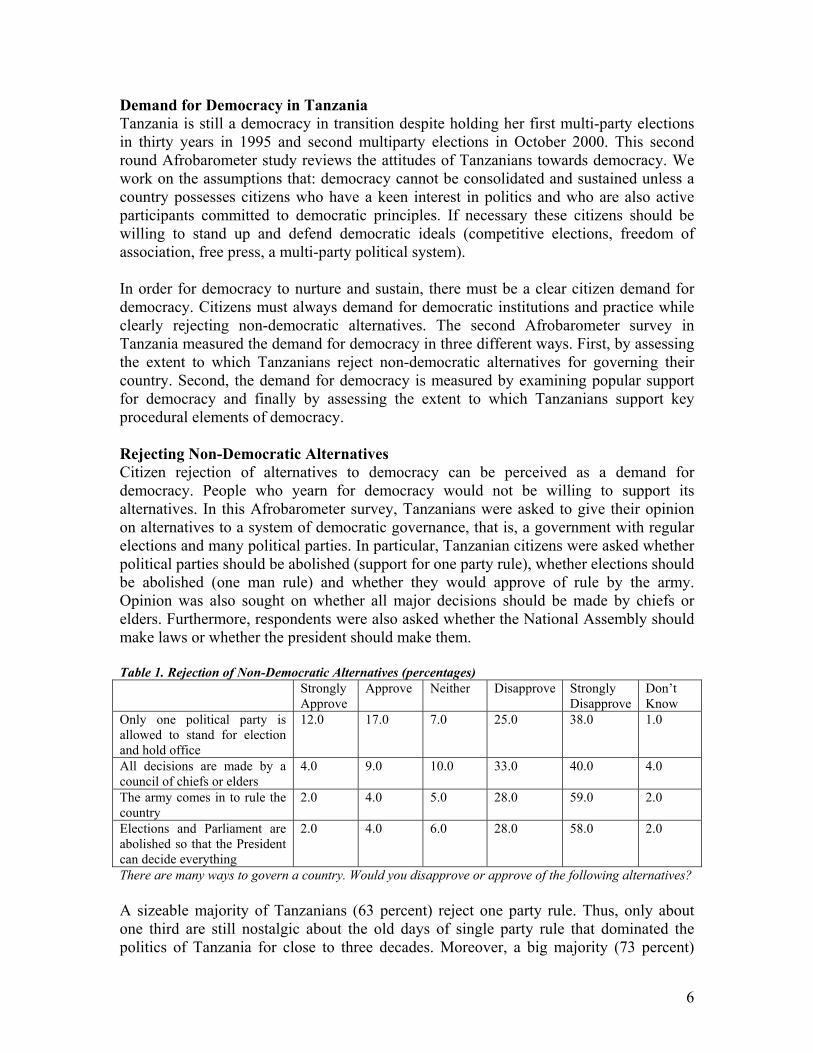
Demand for Democracy in Tanzania Tanzania is still a democracy in transition despite holding her first multi-party elections in thirty years in 1995 and second multiparty elections in October 2000. This second round Afrobarometer study reviews the attitudes of Tanzanians towards democracy. We work on the assumptions that: democracy cannot be consolidated and sustained unless a country possesses citizens who have a keen interest in politics and who are also active participants committed to democratic principles. If necessary these citizens should be willing to stand up and defend democratic ideals (competitive elections, freedom of association, free press, a multi-party political system). In order for democracy to nurture and sustain, there must be a clear citizen demand for democracy. Citizens must always demand for democratic institutions and practice while clearly rejecting non-democratic alternatives. The second Afrobarometer survey in Tanzania measured the demand for democracy in three different ways. First, by assessing the extent to which Tanzanians reject non-democratic alternatives for governing their country. Second, the demand for democracy is measured by examining popular support for democracy and finally by assessing the extent to which Tanzanians support key procedural elements of democracy. Rejecting Non-Democratic Alternatives Citizen rejection of alternatives to democracy can be perceived as a demand for democracy. People who yearn for democracy would not be willing to support its alternatives. In this Afrobarometer survey, Tanzanians were asked to give their opinion on alternatives to a system of democratic governance, that is, a government with regular elections and many political parties. In particular, Tanzanian citizens were asked whether political parties should be abolished (support for one party rule), whether elections should be abolished (one man rule) and whether they would approve of rule by the army. Opinion was also sought on whether all major decisions should be made by chiefs or elders. Furthermore, respondents were also asked whether the National Assembly should make laws or whether the president should make them. Table 1. Rejection of Non-Democratic Alternatives (percentages) Strongly
Approve Approve Neither Disapprove Strongly
Disapprove Don’t Know
Only one political party is allowed to stand for election and hold office
12.0 17.0 7.0 25.0 38.0 1.0
All decisions are made by a council of chiefs or elders
4.0 9.0 10.0 33.0 40.0 4.0
The army comes in to rule the country
2.0 4.0 5.0 28.0 59.0 2.0
Elections and Parliament are abolished so that the President can decide everything
2.0 4.0 6.0 28.0 58.0 2.0
There are many ways to govern a country. Would you disapprove or approve of the following alternatives? A sizeable majority of Tanzanians (63 percent) reject one party rule. Thus, only about one third are still nostalgic about the old days of single party rule that dominated the politics of Tanzania for close to three decades. Moreover, a big majority (73 percent)
7
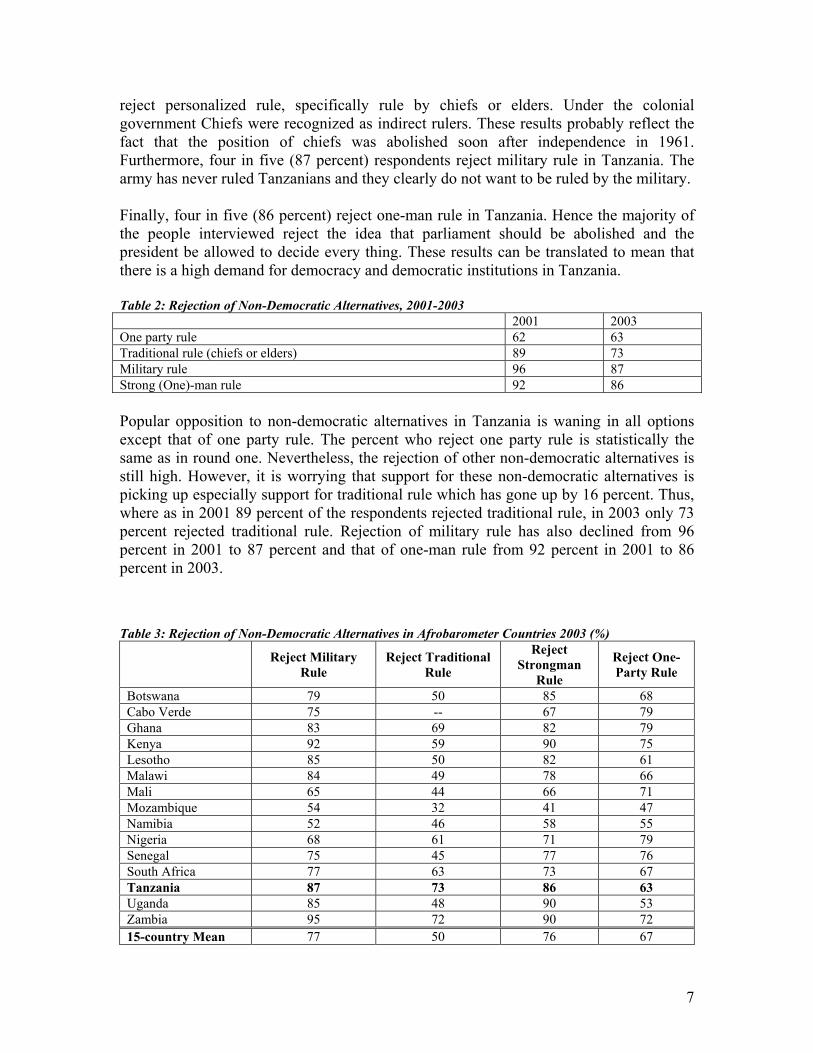
reject personalized rule, specifically rule by chiefs or elders. Under the colonial government Chiefs were recognized as indirect rulers. These results probably reflect the fact that the position of chiefs was abolished soon after independence in 1961. Furthermore, four in five (87 percent) respondents reject military rule in Tanzania. The army has never ruled Tanzanians and they clearly do not want to be ruled by the military. Finally, four in five (86 percent) reject one-man rule in Tanzania. Hence the majority of the people interviewed reject the idea that parliament should be abolished and the president be allowed to decide every thing. These results can be translated to mean that there is a high demand for democracy and democratic institutions in Tanzania. Table 2: Rejection of Non-Democratic Alternatives, 2001-2003 2001 2003 One party rule 62 63 Traditional rule (chiefs or elders) 89 73 Military rule 96 87 Strong (One)-man rule 92 86 Popular opposition to non-democratic alternatives in Tanzania is waning in all options except that of one party rule. The percent who reject one party rule is statistically the same as in round one. Nevertheless, the rejection of other non-democratic alternatives is still high. However, it is worrying that support for these non-democratic alternatives is picking up especially support for traditional rule which has gone up by 16 percent. Thus, where as in 2001 89 percent of the respondents rejected traditional rule, in 2003 only 73 percent rejected traditional rule. Rejection of military rule has also declined from 96 percent in 2001 to 87 percent and that of one-man rule from 92 percent in 2001 to 86 percent in 2003. Table 3: Rejection of Non-Democratic Alternatives in Afrobarometer Countries 2003 (%)
Reject Military Rule
Reject Traditional Rule
Reject Strongman
Rule
Reject One-Party Rule
Botswana 79 50 85 68 Cabo Verde 75 -- 67 79 Ghana 83 69 82 79 Kenya 92 59 90 75 Lesotho 85 50 82 61 Malawi 84 49 78 66 Mali 65 44 66 71 Mozambique 54 32 41 47 Namibia 52 46 58 55 Nigeria 68 61 71 79 Senegal 75 45 77 76 South Africa 77 63 73 67 Tanzania 87 73 86 63 Uganda 85 48 90 53 Zambia 95 72 90 72 15-country Mean 77 50 76 67
8
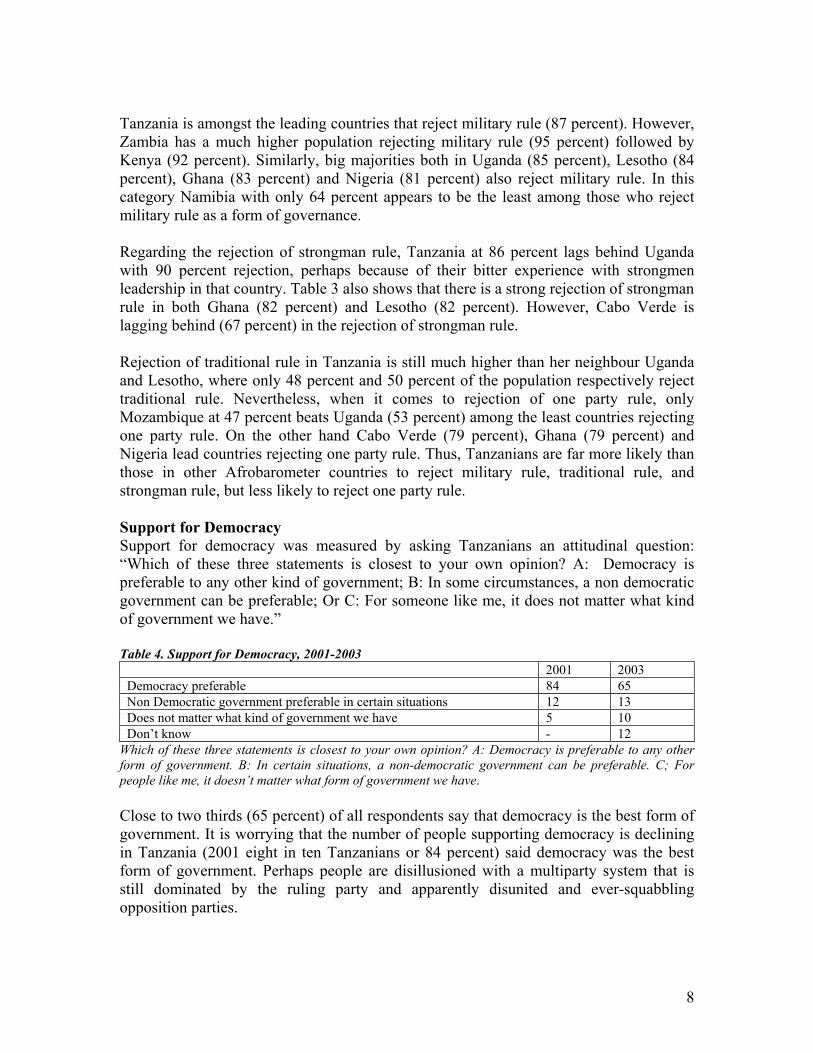
Tanzania is amongst the leading countries that reject military rule (87 percent). However, Zambia has a much higher population rejecting military rule (95 percent) followed by Kenya (92 percent). Similarly, big majorities both in Uganda (85 percent), Lesotho (84 percent), Ghana (83 percent) and Nigeria (81 percent) also reject military rule. In this category Namibia with only 64 percent appears to be the least among those who reject military rule as a form of governance. Regarding the rejection of strongman rule, Tanzania at 86 percent lags behind Uganda with 90 percent rejection, perhaps because of their bitter experience with strongmen leadership in that country. Table 3 also shows that there is a strong rejection of strongman rule in both Ghana (82 percent) and Lesotho (82 percent). However, Cabo Verde is lagging behind (67 percent) in the rejection of strongman rule. Rejection of traditional rule in Tanzania is still much higher than her neighbour Uganda and Lesotho, where only 48 percent and 50 percent of the population respectively reject traditional rule. Nevertheless, when it comes to rejection of one party rule, only Mozambique at 47 percent beats Uganda (53 percent) among the least countries rejecting one party rule. On the other hand Cabo Verde (79 percent), Ghana (79 percent) and Nigeria lead countries rejecting one party rule. Thus, Tanzanians are far more likely than those in other Afrobarometer countries to reject military rule, traditional rule, and strongman rule, but less likely to reject one party rule. Support for Democracy Support for democracy was measured by asking Tanzanians an attitudinal question: “Which of these three statements is closest to your own opinion? A: Democracy is preferable to any other kind of government; B: In some circumstances, a non democratic government can be preferable; Or C: For someone like me, it does not matter what kind of government we have.” Table 4. Support for Democracy, 2001-2003
2001 2003 Democracy preferable 84 65 Non Democratic government preferable in certain situations 12 13 Does not matter what kind of government we have 5 10 Don’t know - 12
Which of these three statements is closest to your own opinion? A: Democracy is preferable to any other form of government. B: In certain situations, a non-democratic government can be preferable. C; For people like me, it doesn’t matter what form of government we have. Close to two thirds (65 percent) of all respondents say that democracy is the best form of government. It is worrying that the number of people supporting democracy is declining in Tanzania (2001 eight in ten Tanzanians or 84 percent) said democracy was the best form of government. Perhaps people are disillusioned with a multiparty system that is still dominated by the ruling party and apparently disunited and ever-squabbling opposition parties.
9
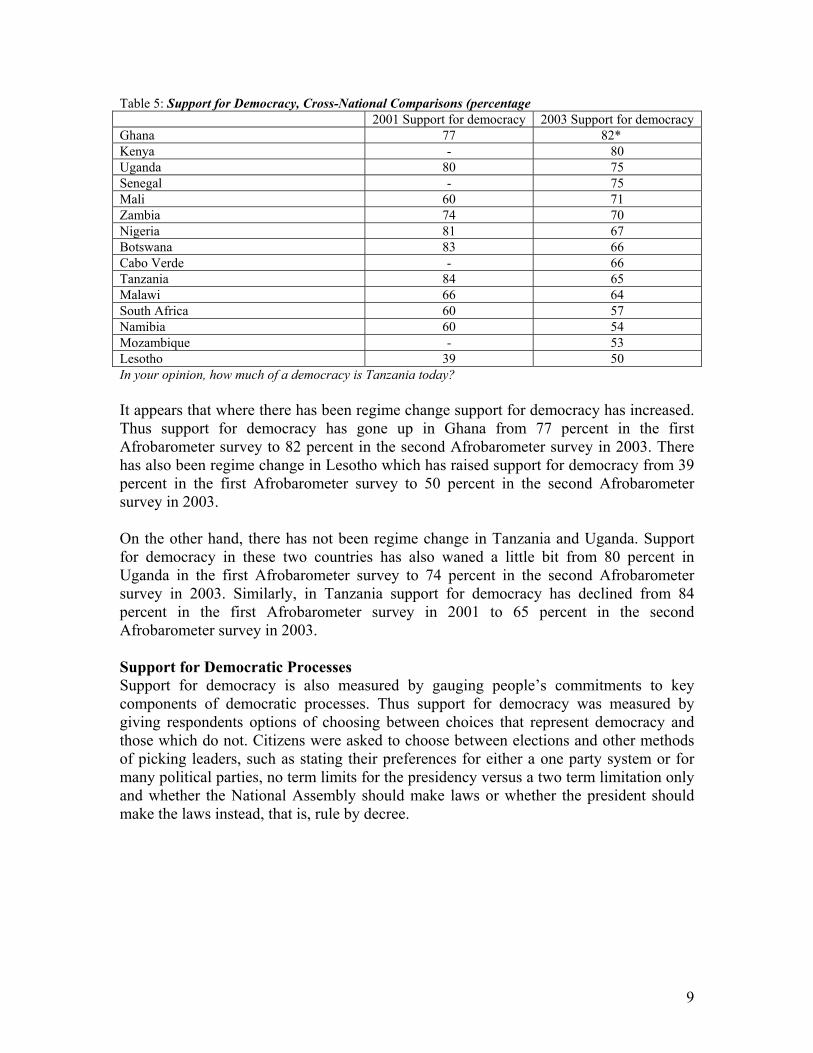
Table 5: Support for Democracy, Cross-National Comparisons (percentage 2001 Support for democracy 2003 Support for democracy Ghana 77 82* Kenya - 80 Uganda 80 75 Senegal - 75 Mali 60 71 Zambia 74 70 Nigeria 81 67 Botswana 83 66 Cabo Verde - 66 Tanzania 84 65 Malawi 66 64 South Africa 60 57 Namibia 60 54 Mozambique - 53 Lesotho 39 50 In your opinion, how much of a democracy is Tanzania today? It appears that where there has been regime change support for democracy has increased. Thus support for democracy has gone up in Ghana from 77 percent in the first Afrobarometer survey to 82 percent in the second Afrobarometer survey in 2003. There has also been regime change in Lesotho which has raised support for democracy from 39 percent in the first Afrobarometer survey to 50 percent in the second Afrobarometer survey in 2003. On the other hand, there has not been regime change in Tanzania and Uganda. Support for democracy in these two countries has also waned a little bit from 80 percent in Uganda in the first Afrobarometer survey to 74 percent in the second Afrobarometer survey in 2003. Similarly, in Tanzania support for democracy has declined from 84 percent in the first Afrobarometer survey in 2001 to 65 percent in the second Afrobarometer survey in 2003. Support for Democratic Processes Support for democracy is also measured by gauging people’s commitments to key components of democratic processes. Thus support for democracy was measured by giving respondents options of choosing between choices that represent democracy and those which do not. Citizens were asked to choose between elections and other methods of picking leaders, such as stating their preferences for either a one party system or for many political parties, no term limits for the presidency versus a two term limitation only and whether the National Assembly should make laws or whether the president should make the laws instead, that is, rule by decree.
10
Table 6. Choosing Democratic Alternatives (percentages) Strongly
Approve Approve Neither Disapprove Strongly
Disapprove Don’t Know
Choose leaders through elections vs. other methods
50.0 27.0 1.0 9.0 12.0 1.0
Many parties needed vs. Political parties divisive (not needed)
24.0 43.0 3.0 13.0 16.0 1.0
Two terms only vs. no term limits for president
49.0 25.0 4.0 10.0 11.0 1.0
National Assembly makes laws vs. president does
43.0 23.0 9.0 11.0 9.0 5.0
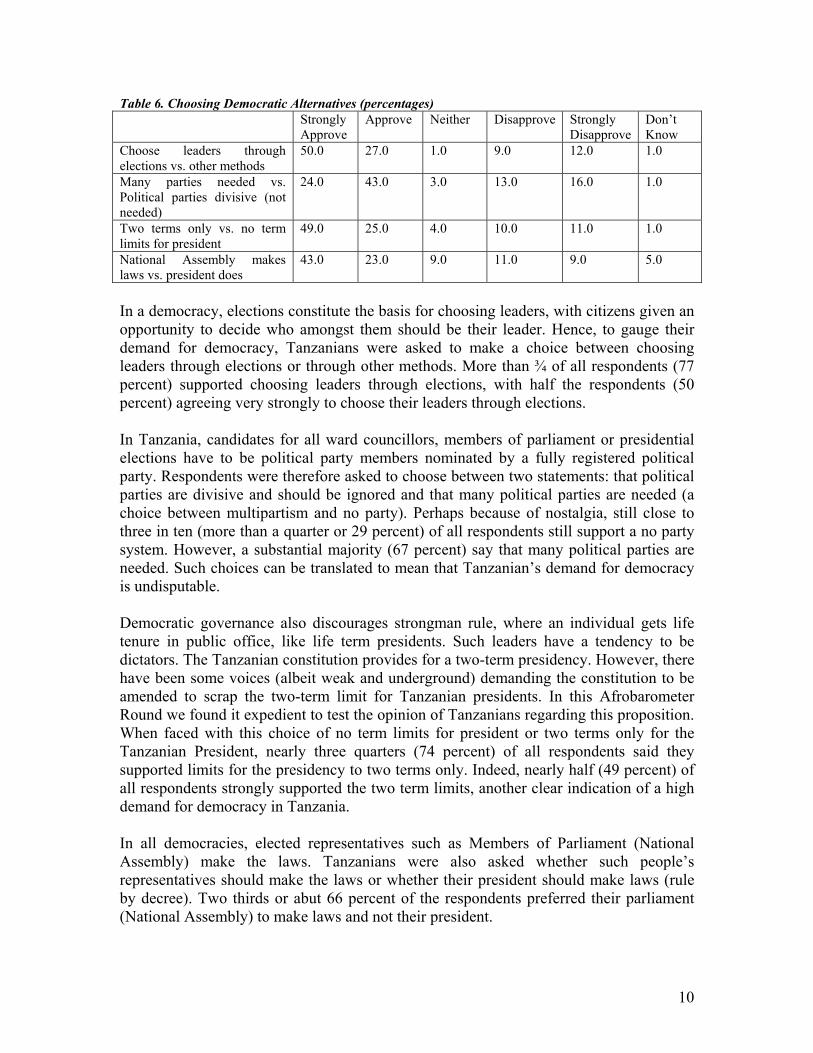
In a democracy, elections constitute the basis for choosing leaders, with citizens given an opportunity to decide who amongst them should be their leader. Hence, to gauge their demand for democracy, Tanzanians were asked to make a choice between choosing leaders through elections or through other methods. More than ¾ of all respondents (77 percent) supported choosing leaders through elections, with half the respondents (50 percent) agreeing very strongly to choose their leaders through elections. In Tanzania, candidates for all ward councillors, members of parliament or presidential elections have to be political party members nominated by a fully registered political party. Respondents were therefore asked to choose between two statements: that political parties are divisive and should be ignored and that many political parties are needed (a choice between multipartism and no party). Perhaps because of nostalgia, still close to three in ten (more than a quarter or 29 percent) of all respondents still support a no party system. However, a substantial majority (67 percent) say that many political parties are needed. Such choices can be translated to mean that Tanzanian’s demand for democracy is undisputable. Democratic governance also discourages strongman rule, where an individual gets life tenure in public office, like life term presidents. Such leaders have a tendency to be dictators. The Tanzanian constitution provides for a two-term presidency. However, there have been some voices (albeit weak and underground) demanding the constitution to be amended to scrap the two-term limit for Tanzanian presidents. In this Afrobarometer Round we found it expedient to test the opinion of Tanzanians regarding this proposition. When faced with this choice of no term limits for president or two terms only for the Tanzanian President, nearly three quarters (74 percent) of all respondents said they supported limits for the presidency to two terms only. Indeed, nearly half (49 percent) of all respondents strongly supported the two term limits, another clear indication of a high demand for democracy in Tanzania. In all democracies, elected representatives such as Members of Parliament (National Assembly) make the laws. Tanzanians were also asked whether such people’s representatives should make the laws or whether their president should make laws (rule by decree). Two thirds or abut 66 percent of the respondents preferred their parliament (National Assembly) to make laws and not their president.
11
Extent of Democracy in Tanzania Democracy is an imperative precursor for any country that struggles for sustained social, economic and political development. The more democracy a country enjoys the greater are the possibilities of realizing sustainable development. Hence democracy has to be institutionalized through political institutions, the Constitution and other laws of the land. Democracy should also be a lived experience by both citizens as well as political and other government leaders. Citizens have to be satisfied with the extent of democracy in their country in order for them to support and sustain it. Thus, the Afrobarometer assessed citizen satisfaction with democracy in Tanzania by looking at extent of their participation, political freedoms and perceptions of rule of law. Tanzanians were asked to evaluate the extent of democracy by asking them how democratic Tanzania was. Overall, eight in ten Tanzanians (81 percent) said Tanzania was a democracy. However, they conceded that Tanzania was not a full democracy; with half the respondents (50 percent) saying Tanzania was a democracy with minor problems. Only 12 percent said Tanzania was a full democracy, while 19 percent said it was a democracy with major problems. A small minority (8 percent) said Tanzania was not a democracy. Practicing democracy is indicative of support for democracy. Support for democracy can be discerned in various ways. When the survey asked: “How much of a democracy is Tanzania today?” About 81 percent believe that Tanzania is a democracy although hi-cups exist here and there. Only 8 percent say Tanzania is not a democracy. However, it may be noted that only 12 percent now believe that Tanzania is a full democracy compared to 17 percent in 2001 who by then believed that Tanzania was a full democracy. The extent of democracy was also measured by asking people whether they were satisfied with the supply of democracy in Tanzania. A sizeable majority (62 percent) said they were satisfied with democracy. However, only 18 percent were very satisfied compared to 44 percent who were only fairly satisfied. A rather high proportion, a quarter of the respondents (25 percent) were not satisfied with the supply of democracy in Tanzania. Political Freedom Political freedom expresses the extent to which democracy has taken root in a society. Limited freedoms indicate limited democracy. Likewise, if society enjoys wide varieties of freedoms, democracy also thrives. To evaluate the extent of democracy in Tanzania, respondents were asked about their freedom of expression, freedom of association, arbitrary arrests, voting freedom and equality before the law.
12
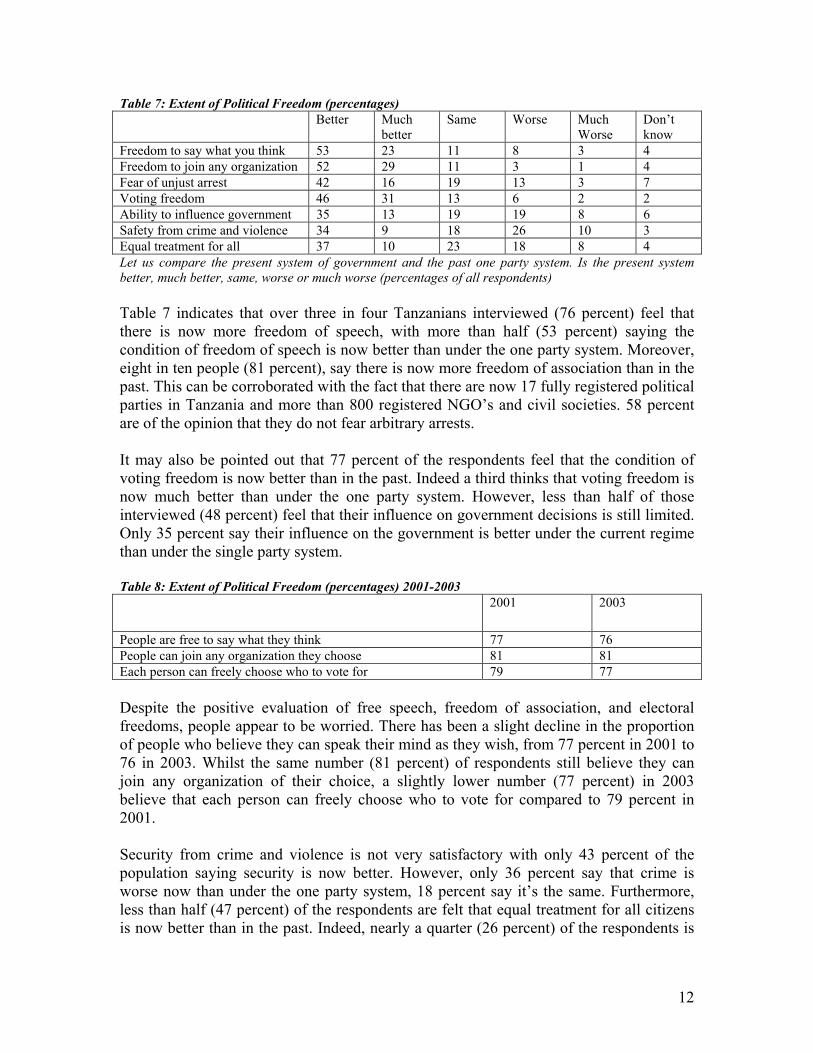
Table 7: Extent of Political Freedom (percentages) Better Much
better Same Worse Much
Worse Don’t know
Freedom to say what you think 53 23 11 8 3 4 Freedom to join any organization 52 29 11 3 1 4 Fear of unjust arrest 42 16 19 13 3 7 Voting freedom 46 31 13 6 2 2 Ability to influence government 35 13 19 19 8 6 Safety from crime and violence 34 9 18 26 10 3 Equal treatment for all 37 10 23 18 8 4 Let us compare the present system of government and the past one party system. Is the present system better, much better, same, worse or much worse (percentages of all respondents) Table 7 indicates that over three in four Tanzanians interviewed (76 percent) feel that there is now more freedom of speech, with more than half (53 percent) saying the condition of freedom of speech is now better than under the one party system. Moreover, eight in ten people (81 percent), say there is now more freedom of association than in the past. This can be corroborated with the fact that there are now 17 fully registered political parties in Tanzania and more than 800 registered NGO’s and civil societies. 58 percent are of the opinion that they do not fear arbitrary arrests. It may also be pointed out that 77 percent of the respondents feel that the condition of voting freedom is now better than in the past. Indeed a third thinks that voting freedom is now much better than under the one party system. However, less than half of those interviewed (48 percent) feel that their influence on government decisions is still limited. Only 35 percent say their influence on the government is better under the current regime than under the single party system. Table 8: Extent of Political Freedom (percentages) 2001-2003 2001
2003
People are free to say what they think 77 76 People can join any organization they choose 81 81 Each person can freely choose who to vote for 79 77 Despite the positive evaluation of free speech, freedom of association, and electoral freedoms, people appear to be worried. There has been a slight decline in the proportion of people who believe they can speak their mind as they wish, from 77 percent in 2001 to 76 in 2003. Whilst the same number (81 percent) of respondents still believe they can join any organization of their choice, a slightly lower number (77 percent) in 2003 believe that each person can freely choose who to vote for compared to 79 percent in 2001. Security from crime and violence is not very satisfactory with only 43 percent of the population saying security is now better. However, only 36 percent say that crime is worse now than under the one party system, 18 percent say it’s the same. Furthermore, less than half (47 percent) of the respondents are felt that equal treatment for all citizens is now better than in the past. Indeed, nearly a quarter (26 percent) of the respondents is
13
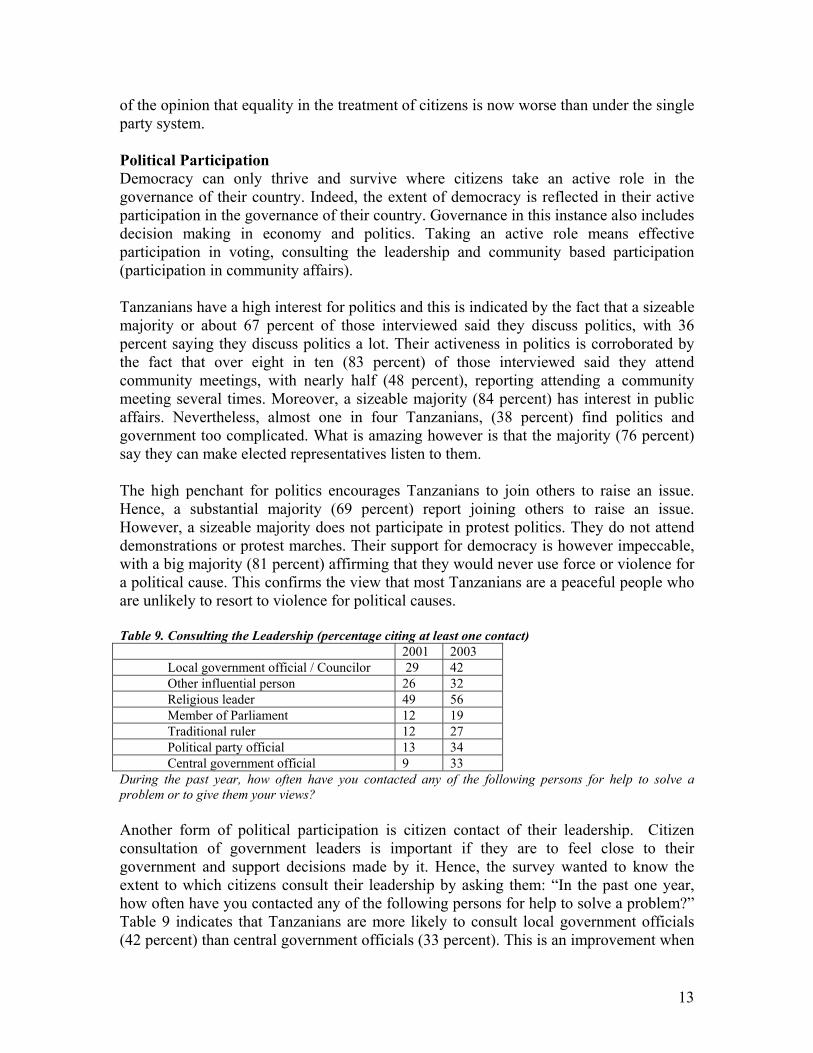
of the opinion that equality in the treatment of citizens is now worse than under the single party system. Political Participation Democracy can only thrive and survive where citizens take an active role in the governance of their country. Indeed, the extent of democracy is reflected in their active participation in the governance of their country. Governance in this instance also includes decision making in economy and politics. Taking an active role means effective participation in voting, consulting the leadership and community based participation (participation in community affairs). Tanzanians have a high interest for politics and this is indicated by the fact that a sizeable majority or about 67 percent of those interviewed said they discuss politics, with 36 percent saying they discuss politics a lot. Their activeness in politics is corroborated by the fact that over eight in ten (83 percent) of those interviewed said they attend community meetings, with nearly half (48 percent), reporting attending a community meeting several times. Moreover, a sizeable majority (84 percent) has interest in public affairs. Nevertheless, almost one in four Tanzanians, (38 percent) find politics and government too complicated. What is amazing however is that the majority (76 percent) say they can make elected representatives listen to them. The high penchant for politics encourages Tanzanians to join others to raise an issue. Hence, a substantial majority (69 percent) report joining others to raise an issue. However, a sizeable majority does not participate in protest politics. They do not attend demonstrations or protest marches. Their support for democracy is however impeccable, with a big majority (81 percent) affirming that they would never use force or violence for a political cause. This confirms the view that most Tanzanians are a peaceful people who are unlikely to resort to violence for political causes. Table 9. Consulting the Leadership (percentage citing at least one contact)
2001 2003 Local government official / Councilor 29 42 Other influential person 26 32 Religious leader 49 56 Member of Parliament 12 19 Traditional ruler 12 27 Political party official 13 34 Central government official 9 33
During the past year, how often have you contacted any of the following persons for help to solve a problem or to give them your views? Another form of political participation is citizen contact of their leadership. Citizen consultation of government leaders is important if they are to feel close to their government and support decisions made by it. Hence, the survey wanted to know the extent to which citizens consult their leadership by asking them: “In the past one year, how often have you contacted any of the following persons for help to solve a problem?” Table 9 indicates that Tanzanians are more likely to consult local government officials (42 percent) than central government officials (33 percent). This is an improvement when
14
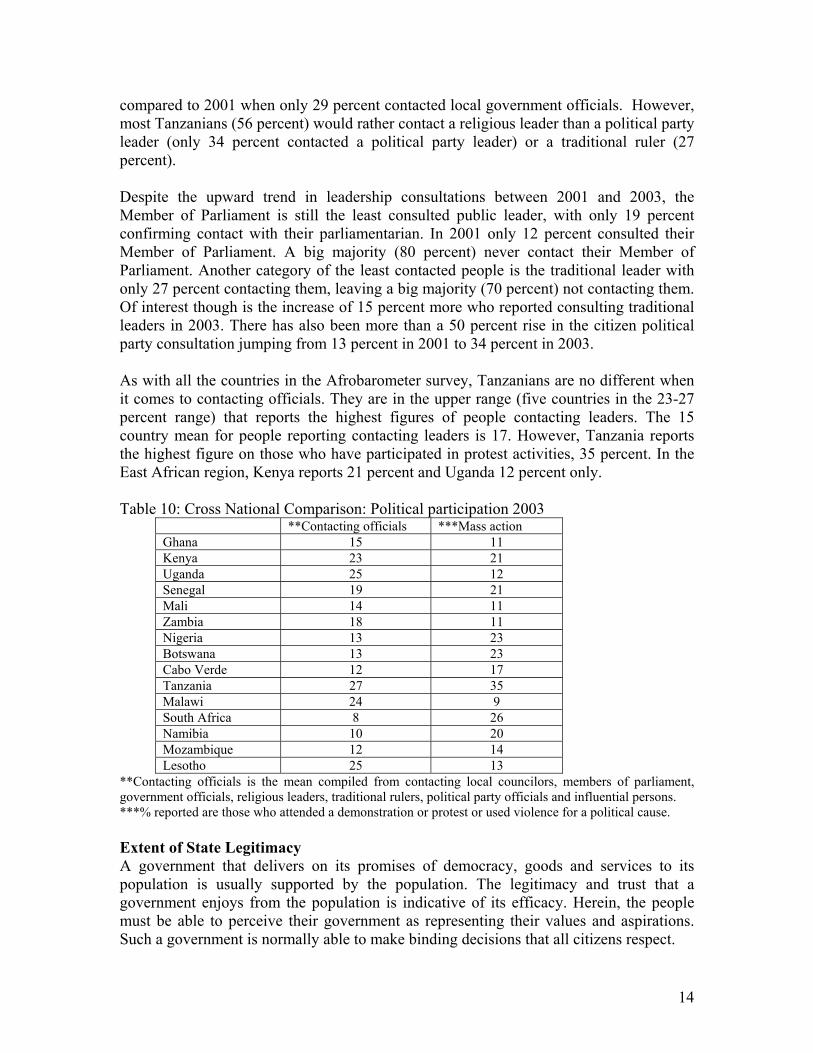
compared to 2001 when only 29 percent contacted local government officials. However, most Tanzanians (56 percent) would rather contact a religious leader than a political party leader (only 34 percent contacted a political party leader) or a traditional ruler (27 percent). Despite the upward trend in leadership consultations between 2001 and 2003, the Member of Parliament is still the least consulted public leader, with only 19 percent confirming contact with their parliamentarian. In 2001 only 12 percent consulted their Member of Parliament. A big majority (80 percent) never contact their Member of Parliament. Another category of the least contacted people is the traditional leader with only 27 percent contacting them, leaving a big majority (70 percent) not contacting them. Of interest though is the increase of 15 percent more who reported consulting traditional leaders in 2003. There has also been more than a 50 percent rise in the citizen political party consultation jumping from 13 percent in 2001 to 34 percent in 2003. As with all the countries in the Afrobarometer survey, Tanzanians are no different when it comes to contacting officials. They are in the upper range (five countries in the 23-27 percent range) that reports the highest figures of people contacting leaders. The 15 country mean for people reporting contacting leaders is 17. However, Tanzania reports the highest figure on those who have participated in protest activities, 35 percent. In the East African region, Kenya reports 21 percent and Uganda 12 percent only. Table 10: Cross National Comparison: Political participation 2003
**Contacting officials ***Mass action Ghana 15 11 Kenya 23 21 Uganda 25 12 Senegal 19 21 Mali 14 11 Zambia 18 11 Nigeria 13 23 Botswana 13 23 Cabo Verde 12 17 Tanzania 27 35 Malawi 24 9 South Africa 8 26 Namibia 10 20 Mozambique 12 14 Lesotho 25 13
**Contacting officials is the mean compiled from contacting local councilors, members of parliament, government officials, religious leaders, traditional rulers, political party officials and influential persons. ***% reported are those who attended a demonstration or protest or used violence for a political cause. Extent of State Legitimacy A government that delivers on its promises of democracy, goods and services to its population is usually supported by the population. The legitimacy and trust that a government enjoys from the population is indicative of its efficacy. Herein, the people must be able to perceive their government as representing their values and aspirations. Such a government is normally able to make binding decisions that all citizens respect.
15
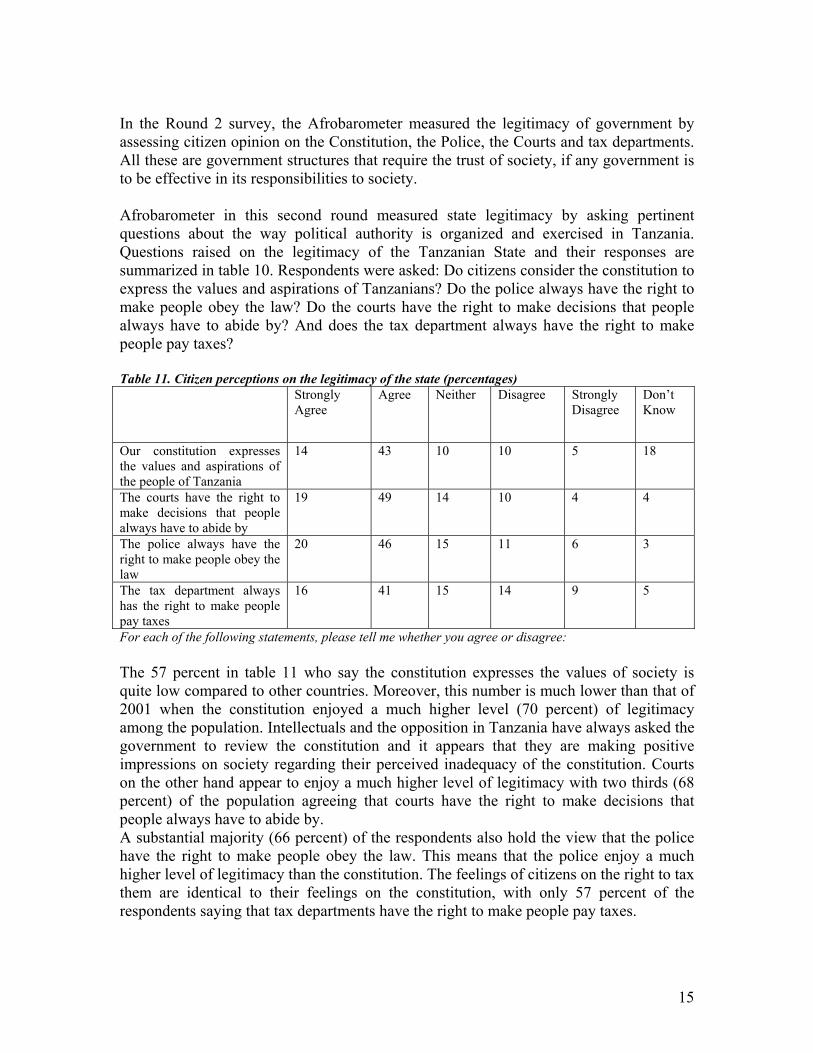
In the Round 2 survey, the Afrobarometer measured the legitimacy of government by assessing citizen opinion on the Constitution, the Police, the Courts and tax departments. All these are government structures that require the trust of society, if any government is to be effective in its responsibilities to society. Afrobarometer in this second round measured state legitimacy by asking pertinent questions about the way political authority is organized and exercised in Tanzania. Questions raised on the legitimacy of the Tanzanian State and their responses are summarized in table 10. Respondents were asked: Do citizens consider the constitution to express the values and aspirations of Tanzanians? Do the police always have the right to make people obey the law? Do the courts have the right to make decisions that people always have to abide by? And does the tax department always have the right to make people pay taxes? Table 11. Citizen perceptions on the legitimacy of the state (percentages) Strongly
Agree Agree Neither Disagree Strongly
Disagree Don’t Know
Our constitution expresses the values and aspirations of the people of Tanzania
14 43 10 10 5 18
The courts have the right to make decisions that people always have to abide by
19 49 14 10 4 4
The police always have the right to make people obey the law
20 46 15 11 6 3
The tax department always has the right to make people pay taxes
16 41 15 14 9 5
For each of the following statements, please tell me whether you agree or disagree: The 57 percent in table 11 who say the constitution expresses the values of society is quite low compared to other countries. Moreover, this number is much lower than that of 2001 when the constitution enjoyed a much higher level (70 percent) of legitimacy among the population. Intellectuals and the opposition in Tanzania have always asked the government to review the constitution and it appears that they are making positive impressions on society regarding their perceived inadequacy of the constitution. Courts on the other hand appear to enjoy a much higher level of legitimacy with two thirds (68 percent) of the population agreeing that courts have the right to make decisions that people always have to abide by. A substantial majority (66 percent) of the respondents also hold the view that the police have the right to make people obey the law. This means that the police enjoy a much higher level of legitimacy than the constitution. The feelings of citizens on the right to tax them are identical to their feelings on the constitution, with only 57 percent of the respondents saying that tax departments have the right to make people pay taxes.
16
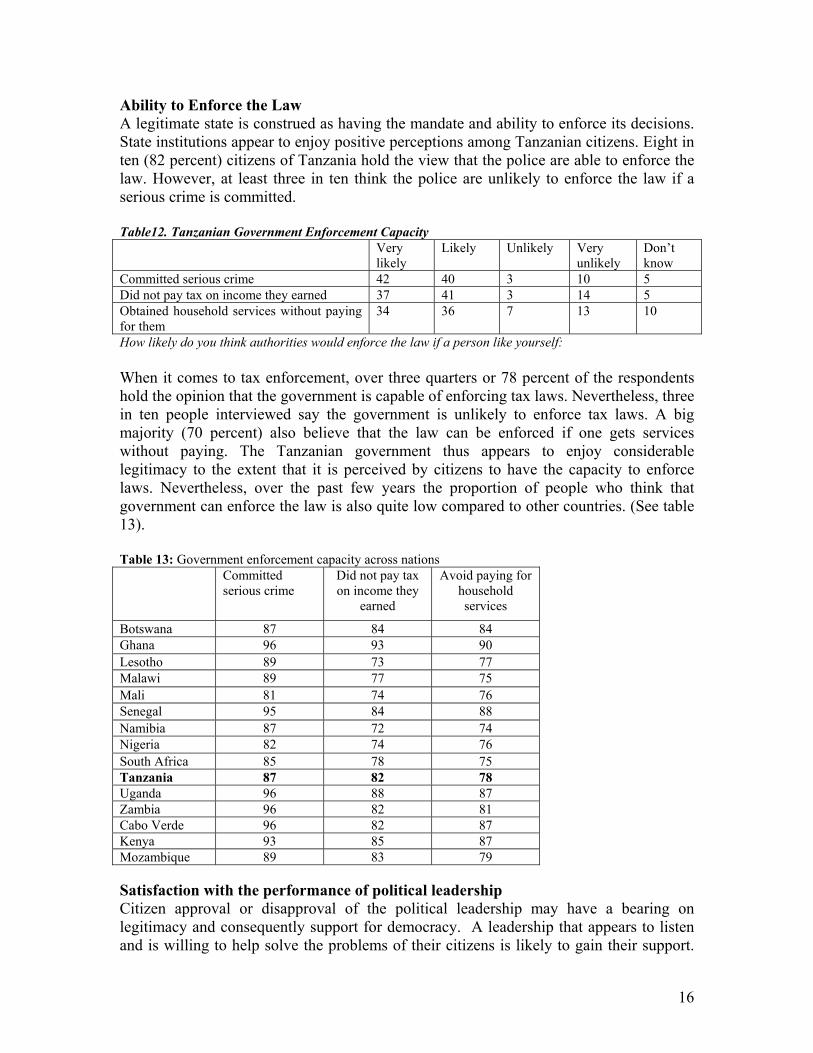
Ability to Enforce the Law A legitimate state is construed as having the mandate and ability to enforce its decisions. State institutions appear to enjoy positive perceptions among Tanzanian citizens. Eight in ten (82 percent) citizens of Tanzania hold the view that the police are able to enforce the law. However, at least three in ten think the police are unlikely to enforce the law if a serious crime is committed. Table12. Tanzanian Government Enforcement Capacity Very
likely Likely Unlikely Very
unlikely Don’t know
Committed serious crime 42 40 3 10 5 Did not pay tax on income they earned 37 41 3 14 5 Obtained household services without paying for them
34 36 7 13 10
How likely do you think authorities would enforce the law if a person like yourself: When it comes to tax enforcement, over three quarters or 78 percent of the respondents hold the opinion that the government is capable of enforcing tax laws. Nevertheless, three in ten people interviewed say the government is unlikely to enforce tax laws. A big majority (70 percent) also believe that the law can be enforced if one gets services without paying. The Tanzanian government thus appears to enjoy considerable legitimacy to the extent that it is perceived by citizens to have the capacity to enforce laws. Nevertheless, over the past few years the proportion of people who think that government can enforce the law is also quite low compared to other countries. (See table 13).
Table 13: Government enforcement capacity across nations
Committed serious crime
Did not pay tax on income they
earned
Avoid paying for household services
Botswana 87 84 84 Ghana 96 93 90 Lesotho 89 73 77 Malawi 89 77 75 Mali 81 74 76 Senegal 95 84 88 Namibia 87 72 74 Nigeria 82 74 76 South Africa 85 78 75 Tanzania 87 82 78 Uganda 96 88 87 Zambia 96 82 81 Cabo Verde 96 82 87 Kenya 93 85 87 Mozambique 89 83 79 Satisfaction with the performance of political leadership Citizen approval or disapproval of the political leadership may have a bearing on legitimacy and consequently support for democracy. A leadership that appears to listen and is willing to help solve the problems of their citizens is likely to gain their support.
17
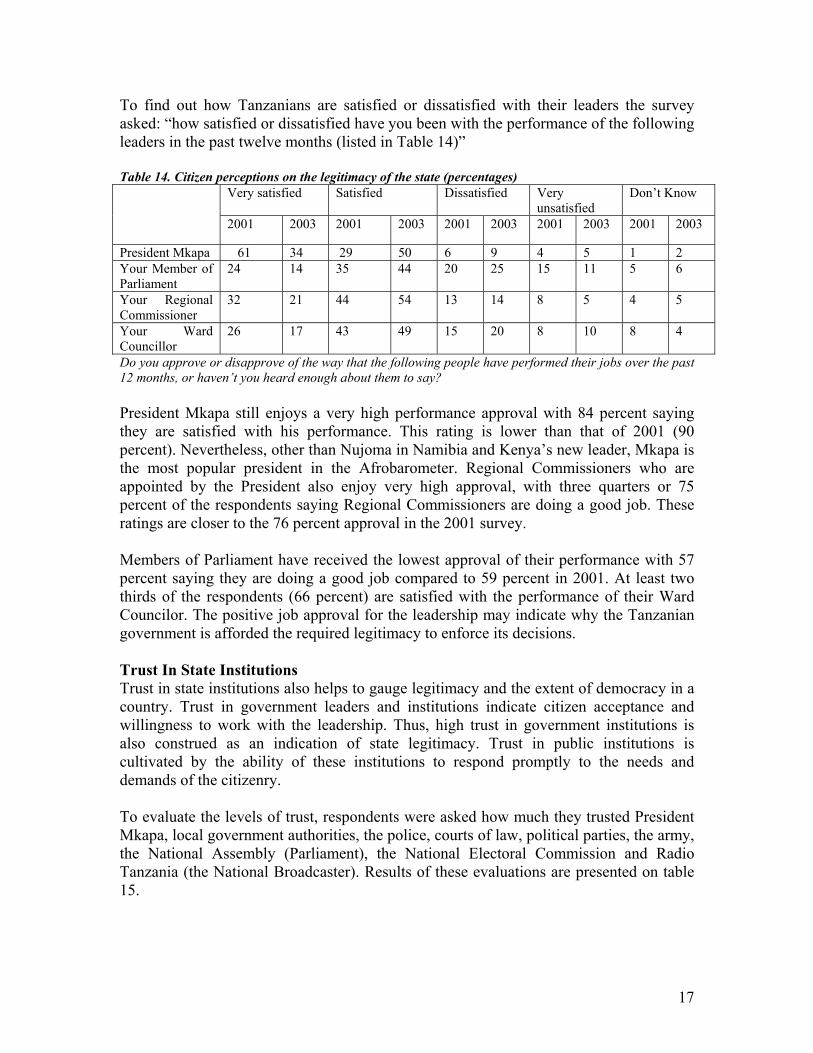
To find out how Tanzanians are satisfied or dissatisfied with their leaders the survey asked: “how satisfied or dissatisfied have you been with the performance of the following leaders in the past twelve months (listed in Table 14)” Table 14. Citizen perceptions on the legitimacy of the state (percentages)
Very satisfied Satisfied Dissatisfied Very unsatisfied
Don’t Know
2001 2003 2001 2003 2001 2003 2001 2003 2001 2003
President Mkapa 61 34 29 50 6 9 4 5 1 2 Your Member of Parliament
24 14 35 44 20 25 15 11 5 6
Your Regional Commissioner
32 21 44 54 13 14 8 5 4 5
Your Ward Councillor
26 17 43 49 15 20 8 10 8 4
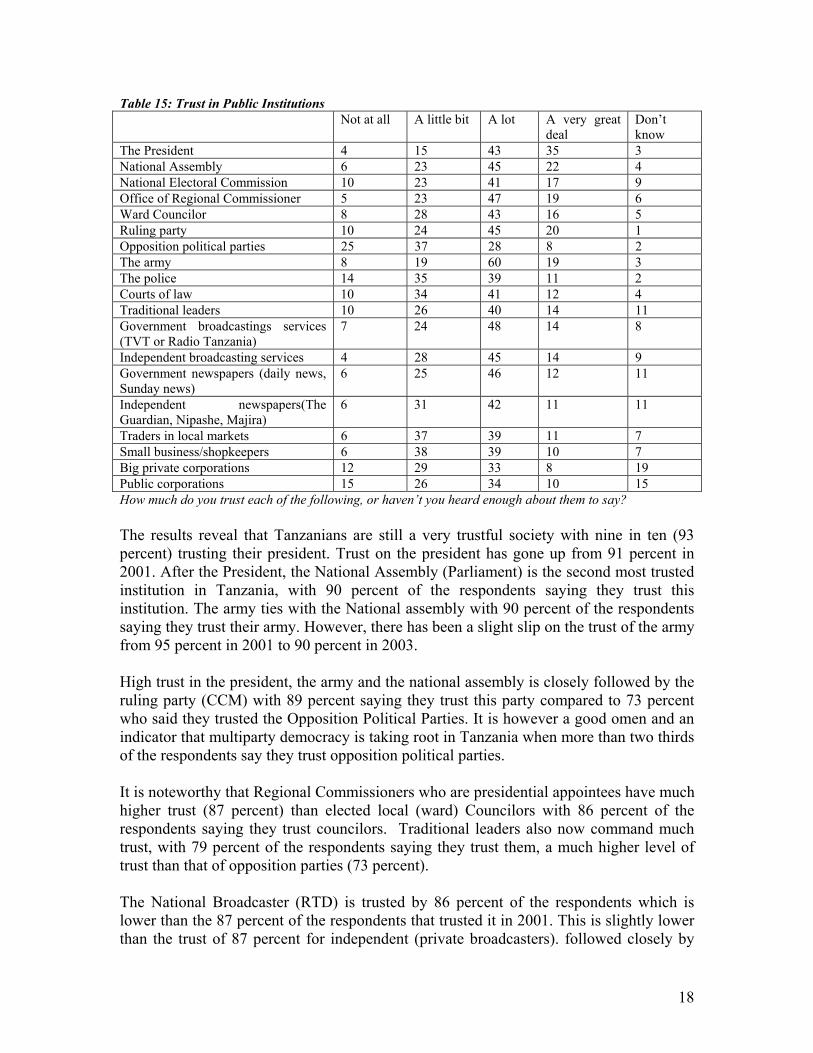
Do you approve or disapprove of the way that the following people have performed their jobs over the past 12 months, or haven’t you heard enough about them to say? President Mkapa still enjoys a very high performance approval with 84 percent saying they are satisfied with his performance. This rating is lower than that of 2001 (90 percent). Nevertheless, other than Nujoma in Namibia and Kenya’s new leader, Mkapa is the most popular president in the Afrobarometer. Regional Commissioners who are appointed by the President also enjoy very high approval, with three quarters or 75 percent of the respondents saying Regional Commissioners are doing a good job. These ratings are closer to the 76 percent approval in the 2001 survey. Members of Parliament have received the lowest approval of their performance with 57 percent saying they are doing a good job compared to 59 percent in 2001. At least two thirds of the respondents (66 percent) are satisfied with the performance of their Ward Councilor. The positive job approval for the leadership may indicate why the Tanzanian government is afforded the required legitimacy to enforce its decisions. Trust In State Institutions Trust in state institutions also helps to gauge legitimacy and the extent of democracy in a country. Trust in government leaders and institutions indicate citizen acceptance and willingness to work with the leadership. Thus, high trust in government institutions is also construed as an indication of state legitimacy. Trust in public institutions is cultivated by the ability of these institutions to respond promptly to the needs and demands of the citizenry. To evaluate the levels of trust, respondents were asked how much they trusted President Mkapa, local government authorities, the police, courts of law, political parties, the army, the National Assembly (Parliament), the National Electoral Commission and Radio Tanzania (the National Broadcaster). Results of these evaluations are presented on table 15.
18
Table 15: Trust in Public Institutions Not at all A little bit A lot A very great
deal Don’t know
The President 4 15 43 35 3 National Assembly 6 23 45 22 4 National Electoral Commission 10 23 41 17 9 Office of Regional Commissioner 5 23 47 19 6 Ward Councilor 8 28 43 16 5 Ruling party 10 24 45 20 1 Opposition political parties 25 37 28 8 2 The army 8 19 60 19 3 The police 14 35 39 11 2 Courts of law 10 34 41 12 4 Traditional leaders 10 26 40 14 11 Government broadcastings services (TVT or Radio Tanzania)
7 24 48 14 8
Independent broadcasting services 4 28 45 14 9 Government newspapers (daily news, Sunday news)
6 25 46 12 11
Independent newspapers(The Guardian, Nipashe, Majira)
6 31 42 11 11
Traders in local markets 6 37 39 11 7 Small business/shopkeepers 6 38 39 10 7 Big private corporations 12 29 33 8 19 Public corporations 15 26 34 10 15 How much do you trust each of the following, or haven’t you heard enough about them to say? The results reveal that Tanzanians are still a very trustful society with nine in ten (93 percent) trusting their president. Trust on the president has gone up from 91 percent in 2001. After the President, the National Assembly (Parliament) is the second most trusted institution in Tanzania, with 90 percent of the respondents saying they trust this institution. The army ties with the National assembly with 90 percent of the respondents saying they trust their army. However, there has been a slight slip on the trust of the army from 95 percent in 2001 to 90 percent in 2003. High trust in the president, the army and the national assembly is closely followed by the ruling party (CCM) with 89 percent saying they trust this party compared to 73 percent who said they trusted the Opposition Political Parties. It is however a good omen and an indicator that multiparty democracy is taking root in Tanzania when more than two thirds of the respondents say they trust opposition political parties. It is noteworthy that Regional Commissioners who are presidential appointees have much higher trust (87 percent) than elected local (ward) Councilors with 86 percent of the respondents saying they trust councilors. Traditional leaders also now command much trust, with 79 percent of the respondents saying they trust them, a much higher level of trust than that of opposition parties (73 percent). The National Broadcaster (RTD) is trusted by 86 percent of the respondents which is lower than the 87 percent of the respondents that trusted it in 2001. This is slightly lower than the trust of 87 percent for independent (private broadcasters). followed closely by
19
the National Electoral Commission with 82 percent of the respondents saying they trust the electoral authority. Trust in the National Electoral Commission has slightly declined from the 82 percent trust shown in 2001. It may also be pointed out that more people (87 percent) trust local traders and small businesses when compared to trust in big private businesses (69 percent). There has been an improvement in the trust in the police from 62 percent in 2001 to 85 percent in 2003. Big private business is now the least trusted institution (69 percent) in Tanzania followed by public corporations (70 percent). It may be observed further that the high trust accorded the president and other government leaders is corroborated by citizen perception that these leaders look after people’s interest. Thus, when asked whether government leaders look after people’s interests, over two thirds of the respondents (72 percent) are of the opinion that leaders do indeed look after people’s interests. Furthermore, a big majority (71 percent) think that government leaders listen to people. This may help to explain the high trust afforded to government leaders including the ruling party. Comparing Tanzania with other African countries, the Tanzanian president enjoys the highest levels of trust in (79 percent) the African countries surveyed in this round. He is followed by the Namibian and Mozambican presidents (76 and 75 percent respectively). Tanzania is one of the four countries that report moderate levels of trust (just over 33 percent) in the opposition parties. Its 36 percent is double the figure both its neighbours who average 16 percent. The ruling party is again highly trusted (66 percent) and the Kenyan ruling coalition enjoys just as much trust at 65 percent. In yet another important institution, the national electoral commission, Tanzania is again in the lead with 60 percent reporting that they trust it. Only two other countries, Kenya (60 percent) and Mozambique (51 percent) have at least half of the citizens trusting it. Honesty and Corruption in Government Legitimacy can also be promoted by perceived high sense of honesty and low level of corruption in government. Generally, trust on public officials and the legitimacy, which trusts afford the state, may be enhanced or inhibited by citizen perceptions of corruption among these officials. Corruption breeds bad governance, which undermines democracy as it eliminates accountability, transparency and equity in society. Corrupt officials have a tendency of being arrogant and are often prone to using their ill-earned wealth to trounce on the rights of the downtrodden citizens.
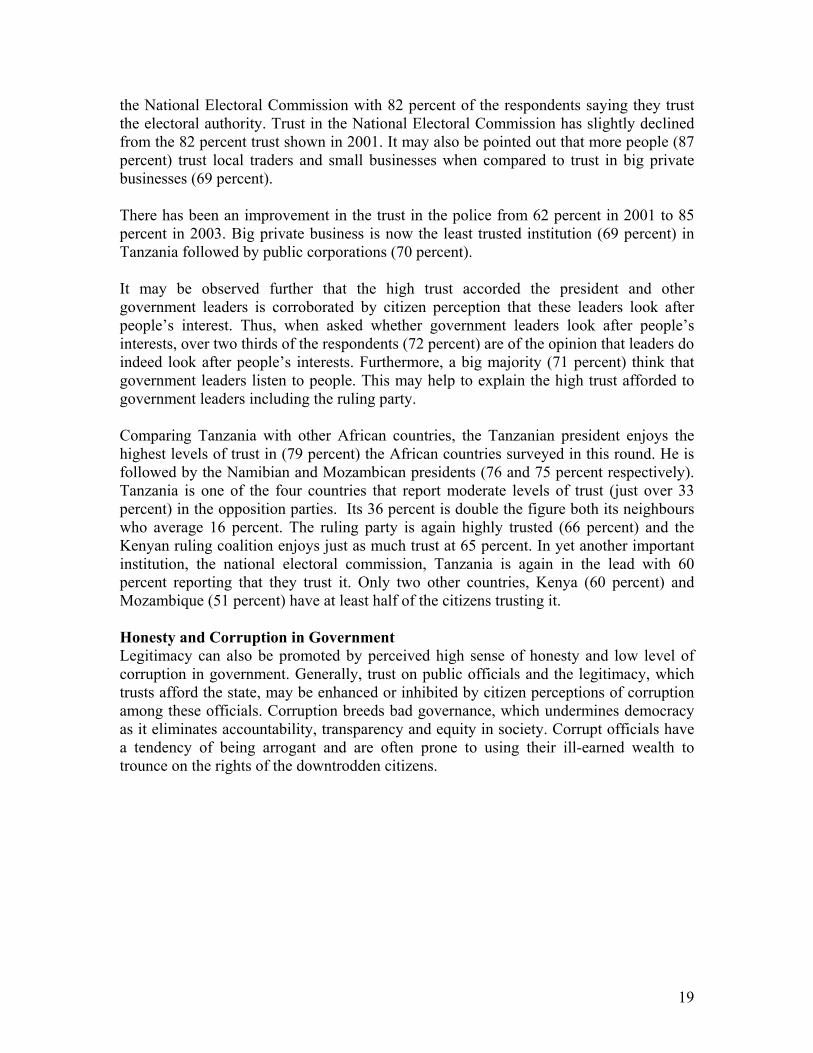
20
Table16: Public Perception on Corruption among Public Officials None Some of
them Most of them
All of them
Don’t Know
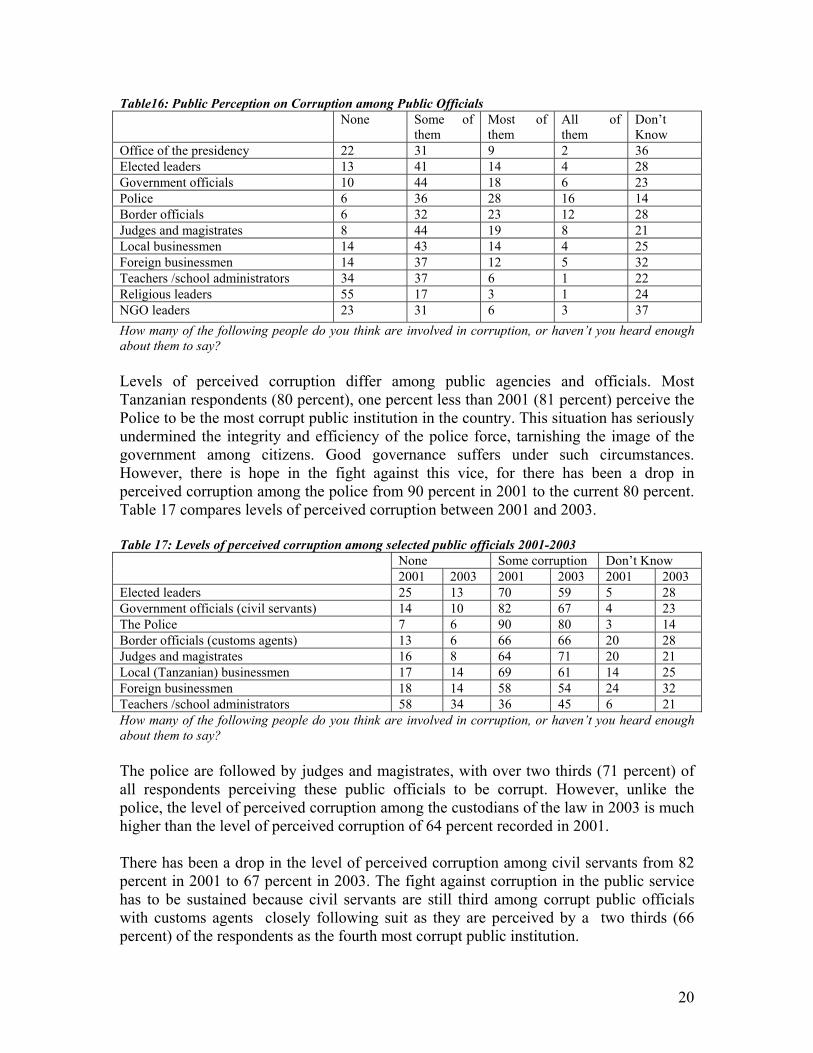
Office of the presidency 22 31 9 2 36 Elected leaders 13 41 14 4 28 Government officials 10 44 18 6 23 Police 6 36 28 16 14 Border officials 6 32 23 12 28 Judges and magistrates 8 44 19 8 21 Local businessmen 14 43 14 4 25 Foreign businessmen 14 37 12 5 32 Teachers /school administrators 34 37 6 1 22 Religious leaders 55 17 3 1 24 NGO leaders 23 31 6 3 37 How many of the following people do you think are involved in corruption, or haven’t you heard enough about them to say? Levels of perceived corruption differ among public agencies and officials. Most Tanzanian respondents (80 percent), one percent less than 2001 (81 percent) perceive the Police to be the most corrupt public institution in the country. This situation has seriously undermined the integrity and efficiency of the police force, tarnishing the image of the government among citizens. Good governance suffers under such circumstances. However, there is hope in the fight against this vice, for there has been a drop in perceived corruption among the police from 90 percent in 2001 to the current 80 percent. Table 17 compares levels of perceived corruption between 2001 and 2003. Table 17: Levels of perceived corruption among selected public officials 2001-2003
None Some corruption Don’t Know 2001 2003 2001 2003 2001 2003
Elected leaders 25 13 70 59 5 28 Government officials (civil servants) 14 10 82 67 4 23 The Police 7 6 90 80 3 14 Border officials (customs agents) 13 6 66 66 20 28 Judges and magistrates 16 8 64 71 20 21 Local (Tanzanian) businessmen 17 14 69 61 14 25 Foreign businessmen 18 14 58 54 24 32 Teachers /school administrators 58 34 36 45 6 21 How many of the following people do you think are involved in corruption, or haven’t you heard enough about them to say? The police are followed by judges and magistrates, with over two thirds (71 percent) of all respondents perceiving these public officials to be corrupt. However, unlike the police, the level of perceived corruption among the custodians of the law in 2003 is much higher than the level of perceived corruption of 64 percent recorded in 2001. There has been a drop in the level of perceived corruption among civil servants from 82 percent in 2001 to 67 percent in 2003. The fight against corruption in the public service has to be sustained because civil servants are still third among corrupt public officials with customs agents closely following suit as they are perceived by a two thirds (66 percent) of the respondents as the fourth most corrupt public institution.
21
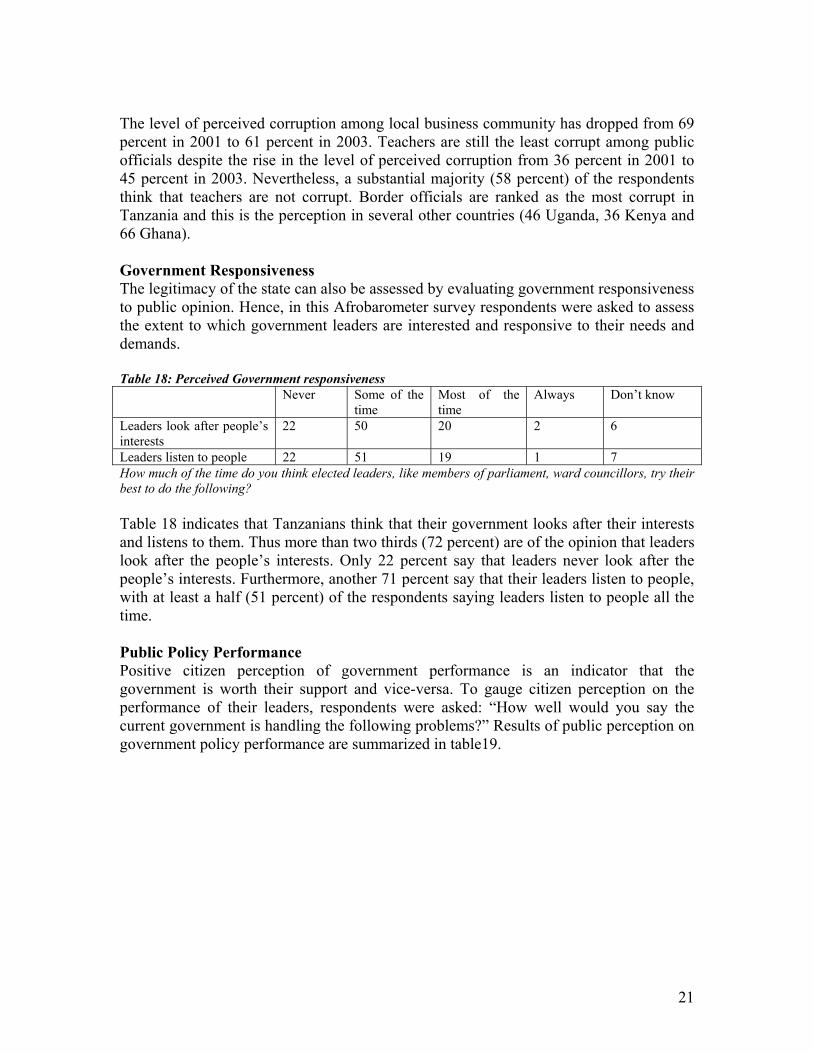
The level of perceived corruption among local business community has dropped from 69 percent in 2001 to 61 percent in 2003. Teachers are still the least corrupt among public officials despite the rise in the level of perceived corruption from 36 percent in 2001 to 45 percent in 2003. Nevertheless, a substantial majority (58 percent) of the respondents think that teachers are not corrupt. Border officials are ranked as the most corrupt in Tanzania and this is the perception in several other countries (46 Uganda, 36 Kenya and 66 Ghana). Government Responsiveness The legitimacy of the state can also be assessed by evaluating government responsiveness to public opinion. Hence, in this Afrobarometer survey respondents were asked to assess the extent to which government leaders are interested and responsive to their needs and demands. Table 18: Perceived Government responsiveness Never Some of the
time Most of the time
Always Don’t know
Leaders look after people’s interests
22 50 20 2 6
Leaders listen to people 22 51 19 1 7 How much of the time do you think elected leaders, like members of parliament, ward councillors, try their best to do the following? Table 18 indicates that Tanzanians think that their government looks after their interests and listens to them. Thus more than two thirds (72 percent) are of the opinion that leaders look after the people’s interests. Only 22 percent say that leaders never look after the people’s interests. Furthermore, another 71 percent say that their leaders listen to people, with at least a half (51 percent) of the respondents saying leaders listen to people all the time. Public Policy Performance Positive citizen perception of government performance is an indicator that the government is worth their support and vice-versa. To gauge citizen perception on the performance of their leaders, respondents were asked: “How well would you say the current government is handling the following problems?” Results of public perception on government policy performance are summarized in table19.
22
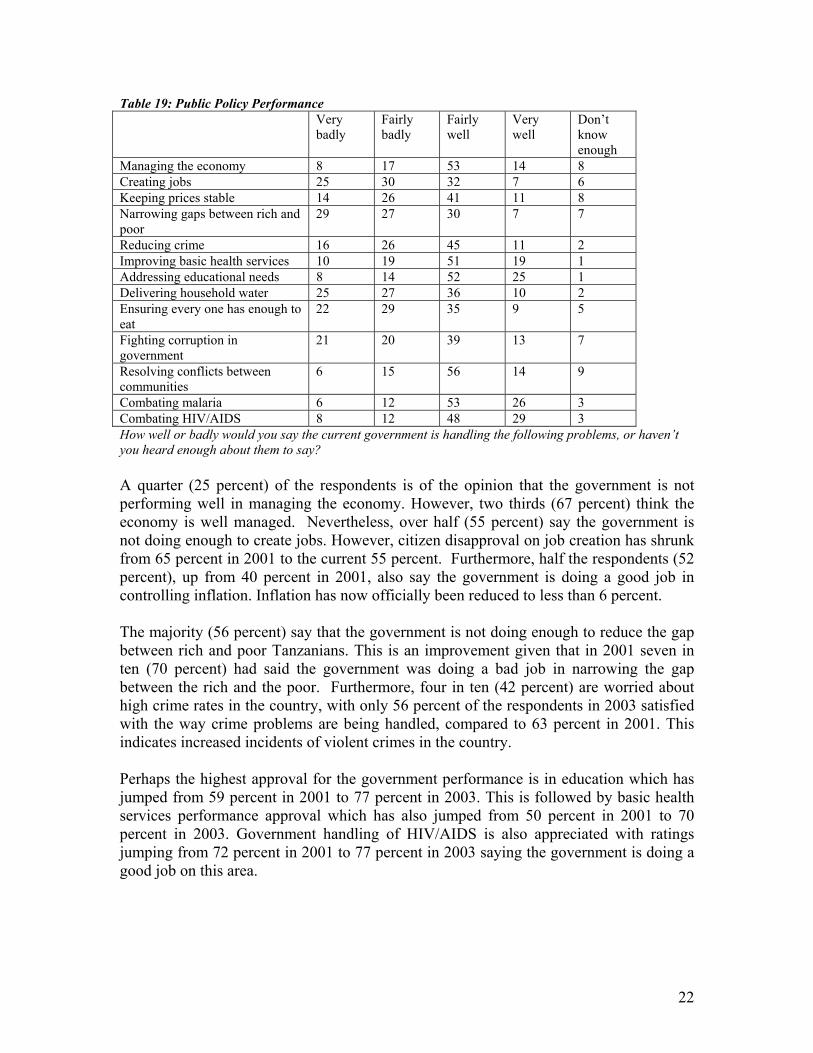
Table 19: Public Policy Performance Very
badly Fairly badly
Fairly well
Very well
Don’t know enough
Managing the economy 8 17 53 14 8 Creating jobs 25 30 32 7 6 Keeping prices stable 14 26 41 11 8 Narrowing gaps between rich and poor
29 27 30 7 7
Reducing crime 16 26 45 11 2 Improving basic health services 10 19 51 19 1 Addressing educational needs 8 14 52 25 1 Delivering household water 25 27 36 10 2 Ensuring every one has enough to eat
22 29 35 9 5
Fighting corruption in government
21 20 39 13 7
Resolving conflicts between communities
6 15 56 14 9
Combating malaria 6 12 53 26 3 Combating HIV/AIDS 8 12 48 29 3 How well or badly would you say the current government is handling the following problems, or haven’t you heard enough about them to say? A quarter (25 percent) of the respondents is of the opinion that the government is not performing well in managing the economy. However, two thirds (67 percent) think the economy is well managed. Nevertheless, over half (55 percent) say the government is not doing enough to create jobs. However, citizen disapproval on job creation has shrunk from 65 percent in 2001 to the current 55 percent. Furthermore, half the respondents (52 percent), up from 40 percent in 2001, also say the government is doing a good job in controlling inflation. Inflation has now officially been reduced to less than 6 percent. The majority (56 percent) say that the government is not doing enough to reduce the gap between rich and poor Tanzanians. This is an improvement given that in 2001 seven in ten (70 percent) had said the government was doing a bad job in narrowing the gap between the rich and the poor. Furthermore, four in ten (42 percent) are worried about high crime rates in the country, with only 56 percent of the respondents in 2003 satisfied with the way crime problems are being handled, compared to 63 percent in 2001. This indicates increased incidents of violent crimes in the country. Perhaps the highest approval for the government performance is in education which has jumped from 59 percent in 2001 to 77 percent in 2003. This is followed by basic health services performance approval which has also jumped from 50 percent in 2001 to 70 percent in 2003. Government handling of HIV/AIDS is also appreciated with ratings jumping from 72 percent in 2001 to 77 percent in 2003 saying the government is doing a good job on this area.
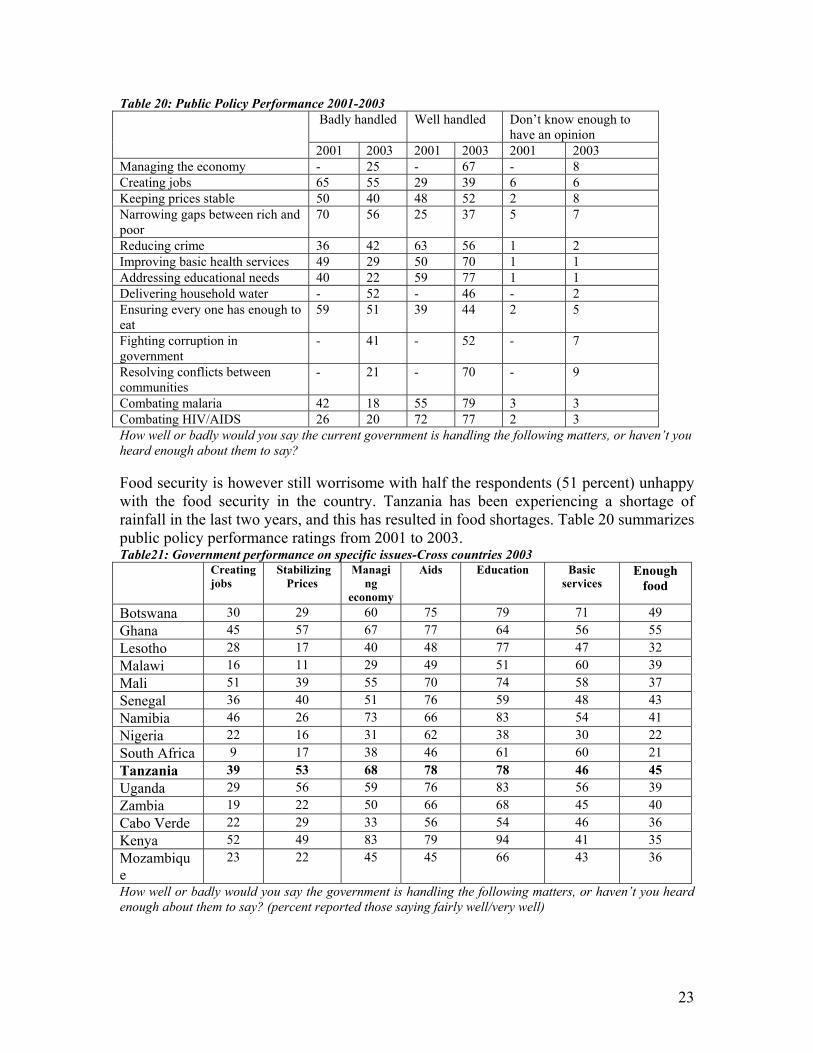
23
Table 20: Public Policy Performance 2001-2003 Badly handled Well handled Don’t know enough to
have an opinion
2001 2003 2001 2003 2001 2003 Managing the economy - 25 - 67 - 8 Creating jobs 65 55 29 39 6 6 Keeping prices stable 50 40 48 52 2 8 Narrowing gaps between rich and poor
70 56 25 37 5 7
Reducing crime 36 42 63 56 1 2 Improving basic health services 49 29 50 70 1 1 Addressing educational needs 40 22 59 77 1 1 Delivering household water - 52 - 46 - 2 Ensuring every one has enough to eat
59 51 39 44 2 5
Fighting corruption in government
- 41 - 52 - 7
Resolving conflicts between communities
- 21 - 70 - 9
Combating malaria 42 18 55 79 3 3 Combating HIV/AIDS 26 20 72 77 2 3 How well or badly would you say the current government is handling the following matters, or haven’t you heard enough about them to say? Food security is however still worrisome with half the respondents (51 percent) unhappy with the food security in the country. Tanzania has been experiencing a shortage of rainfall in the last two years, and this has resulted in food shortages. Table 20 summarizes public policy performance ratings from 2001 to 2003. Table21: Government performance on specific issues-Cross countries 2003 Creating
jobs Stabilizing
Prices Managi
ng economy
Aids Education Basic services
Enough food
Botswana 30 29 60 75 79 71 49 Ghana 45 57 67 77 64 56 55 Lesotho 28 17 40 48 77 47 32 Malawi 16 11 29 49 51 60 39 Mali 51 39 55 70 74 58 37 Senegal 36 40 51 76 59 48 43 Namibia 46 26 73 66 83 54 41 Nigeria 22 16 31 62 38 30 22 South Africa 9 17 38 46 61 60 21 Tanzania 39 53 68 78 78 46 45 Uganda 29 56 59 76 83 56 39 Zambia 19 22 50 66 68 45 40 Cabo Verde 22 29 33 56 54 46 36 Kenya 52 49 83 79 94 41 35 Mozambique
23 22 45 45 66 43 36
How well or badly would you say the government is handling the following matters, or haven’t you heard enough about them to say? (percent reported those saying fairly well/very well)
24
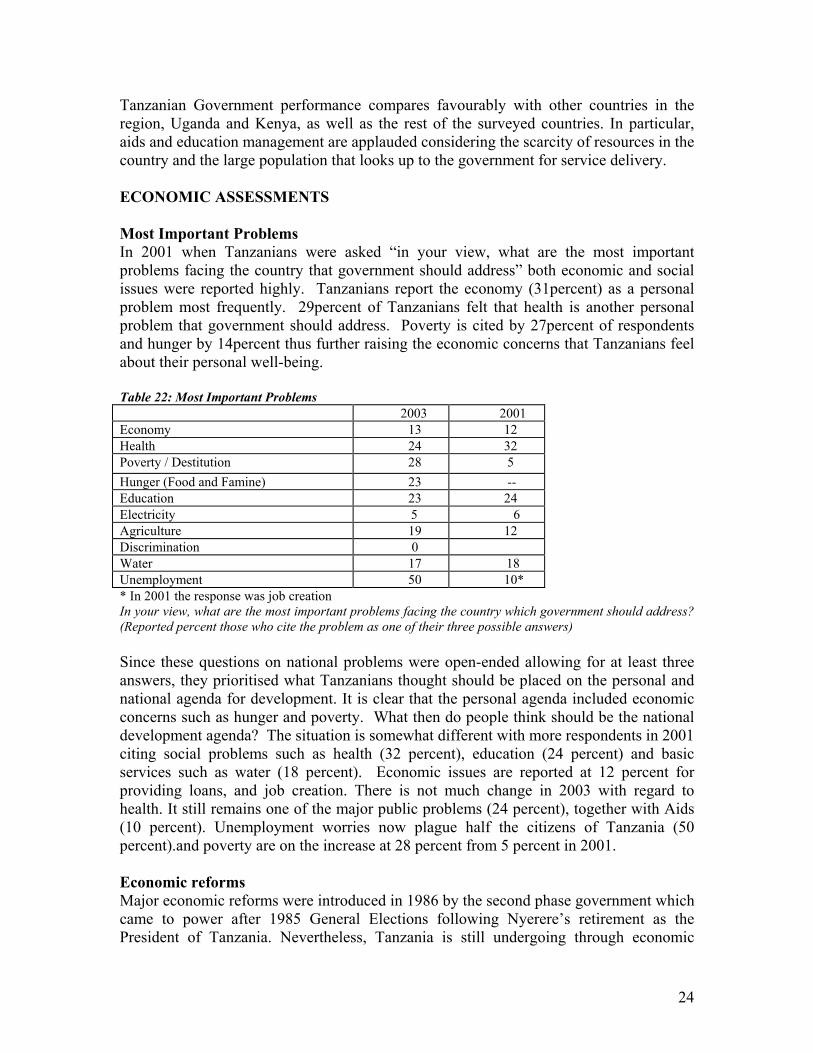
Tanzanian Government performance compares favourably with other countries in the region, Uganda and Kenya, as well as the rest of the surveyed countries. In particular, aids and education management are applauded considering the scarcity of resources in the country and the large population that looks up to the government for service delivery. ECONOMIC ASSESSMENTS Most Important Problems In 2001 when Tanzanians were asked “in your view, what are the most important problems facing the country that government should address” both economic and social issues were reported highly. Tanzanians report the economy (31percent) as a personal problem most frequently. 29percent of Tanzanians felt that health is another personal problem that government should address. Poverty is cited by 27percent of respondents and hunger by 14percent thus further raising the economic concerns that Tanzanians feel about their personal well-being. Table 22: Most Important Problems
2003 2001 Economy 13 12 Health 24 32 Poverty / Destitution 28 5 Hunger (Food and Famine) 23 -- Education 23 24 Electricity 5 6 Agriculture 19 12 Discrimination 0 Water 17 18 Unemployment 50 10* * In 2001 the response was job creation In your view, what are the most important problems facing the country which government should address? (Reported percent those who cite the problem as one of their three possible answers) Since these questions on national problems were open-ended allowing for at least three answers, they prioritised what Tanzanians thought should be placed on the personal and national agenda for development. It is clear that the personal agenda included economic concerns such as hunger and poverty. What then do people think should be the national development agenda? The situation is somewhat different with more respondents in 2001 citing social problems such as health (32 percent), education (24 percent) and basic services such as water (18 percent). Economic issues are reported at 12 percent for providing loans, and job creation. There is not much change in 2003 with regard to health. It still remains one of the major public problems (24 percent), together with Aids (10 percent). Unemployment worries now plague half the citizens of Tanzania (50 percent).and poverty are on the increase at 28 percent from 5 percent in 2001. Economic reforms Major economic reforms were introduced in 1986 by the second phase government which came to power after 1985 General Elections following Nyerere’s retirement as the President of Tanzania. Nevertheless, Tanzania is still undergoing through economic
25
reforms such as trade liberalization, privatization, and deregulation. The government is also still grappling with political reforms in the manner of competition for public office through a multi-party political system. Economic choices and freedoms have to be matched by political choices and freedoms. Given the importance of economic reforms in the democratization process, Afrobarometer also assesses the way people perceive these economic reforms. Successful economic reforms are a good omen for successful democratic reforms. Choices in a free market economy also translate into demand for political choices and rights. Afrobarometer asked Tanzanians whether they prefer market or government-run economy. In the 2003 survey over half (54 percent) of the respondents support a market economy than government run economy. Furthermore, over two thirds (72 percent) of the respondents think that individuals should decide on their own what to produce, buy and sell. In addition, more people (55 percent), support user fees in exchange for quality education. Eight in ten (84 percent) of all respondents say the government should respect property rights (a cornerstone of market economy). Only 12 percent give the government the right to seize property. Despite some support for market reforms, citizens also appear to reject those reforms which hurt them. More respondents (51 percent) for example do not support layoffs to reduce costs, but prefer civil servants to keep their jobs. This may be explained by the extended family system with a lot of families depending on incomes from their employed kith and keen. Hence, the majority (69 percent) support the idea of more jobs, even if it means paying low wages for public workers. Furthermore, slightly over a half of the respondents (54 percent) favor protectionist tariffs. In this survey, more people (57 percent) would rather accept economic hardships than abandon the reforms because they deliver. Indeed, nearly three quarters or 74 percent of the respondents say there is now better availability of goods compared to the period before the reforms. Furthermore, nearly half (49 percent) of the respondents say that their living standards are now better than before the reforms. Policy makers in the government should however worry about the directions the reforms are taking because there are numerous problems which make citizens unhappy. Job creation is worrying most people with a majority (62 percent) saying that it is now more difficult to find a job than in the past (worse job opportunities now). Moreover, over half of the people (57 percent) perceive that the gap between the rich and the poor is getting worse. These are economic problems that can have a bearing on the democratization process. Economic Satisfaction Overall, Tanzanians were pessimistic about their economic situation in 2001. Only three-in-ten said that they were satisfied with their personal economic conditions. Less than a third (22 percent) indicated that they are satisfied with the general situation in the country in 2001 compared to 33 percent in 2003. Compared to the other countries surveyed, Tanzanians seemed to outscore only Lesotho and Zimbabwe when asked about how
26
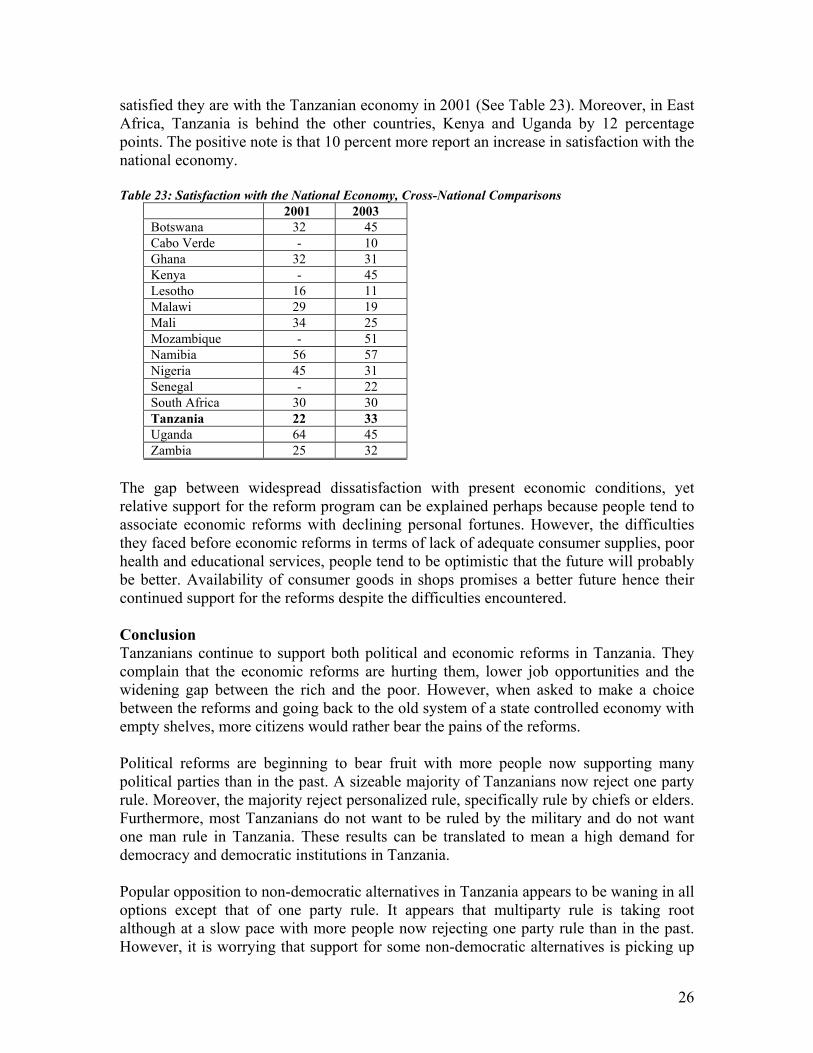
satisfied they are with the Tanzanian economy in 2001 (See Table 23). Moreover, in East Africa, Tanzania is behind the other countries, Kenya and Uganda by 12 percentage points. The positive note is that 10 percent more report an increase in satisfaction with the national economy.
Table 23: Satisfaction with the National Economy, Cross-National Comparisons
2001 2003 Botswana 32 45 Cabo Verde - 10 Ghana 32 31 Kenya - 45 Lesotho 16 11 Malawi 29 19 Mali 34 25 Mozambique - 51 Namibia 56 57 Nigeria 45 31 Senegal - 22 South Africa 30 30 Tanzania 22 33 Uganda 64 45 Zambia 25 32
The gap between widespread dissatisfaction with present economic conditions, yet relative support for the reform program can be explained perhaps because people tend to associate economic reforms with declining personal fortunes. However, the difficulties they faced before economic reforms in terms of lack of adequate consumer supplies, poor health and educational services, people tend to be optimistic that the future will probably be better. Availability of consumer goods in shops promises a better future hence their continued support for the reforms despite the difficulties encountered. Conclusion Tanzanians continue to support both political and economic reforms in Tanzania. They complain that the economic reforms are hurting them, lower job opportunities and the widening gap between the rich and the poor. However, when asked to make a choice between the reforms and going back to the old system of a state controlled economy with empty shelves, more citizens would rather bear the pains of the reforms. Political reforms are beginning to bear fruit with more people now supporting many political parties than in the past. A sizeable majority of Tanzanians now reject one party rule. Moreover, the majority reject personalized rule, specifically rule by chiefs or elders. Furthermore, most Tanzanians do not want to be ruled by the military and do not want one man rule in Tanzania. These results can be translated to mean a high demand for democracy and democratic institutions in Tanzania. Popular opposition to non-democratic alternatives in Tanzania appears to be waning in all options except that of one party rule. It appears that multiparty rule is taking root although at a slow pace with more people now rejecting one party rule than in the past. However, it is worrying that support for some non-democratic alternatives is picking up
27
especially support for traditional rule which has gone up. Rejection of military rule has also declined from 96 percent in 2001 to 87 percent and that of one man rule from 92 percent in 2001 to 86 percent in 2003. These developments are worth noting and corrective measures should be taken, particularly by tackling those economic reforms that hurt people the most. The fight against corruption is still a difficult one. Most respondents still perceive a high level of corruption in the public sector, especially among the police and the judges and magistrates. However, there has been a drop in the level of perceived corruption among civil servants from 82 percent in 2001 to 67 percent in 2003. Nevertheless, the fight against corruption in the public service has to be sustained because civil servants are still perceived by citizens as the third most corrupt public institution.
28
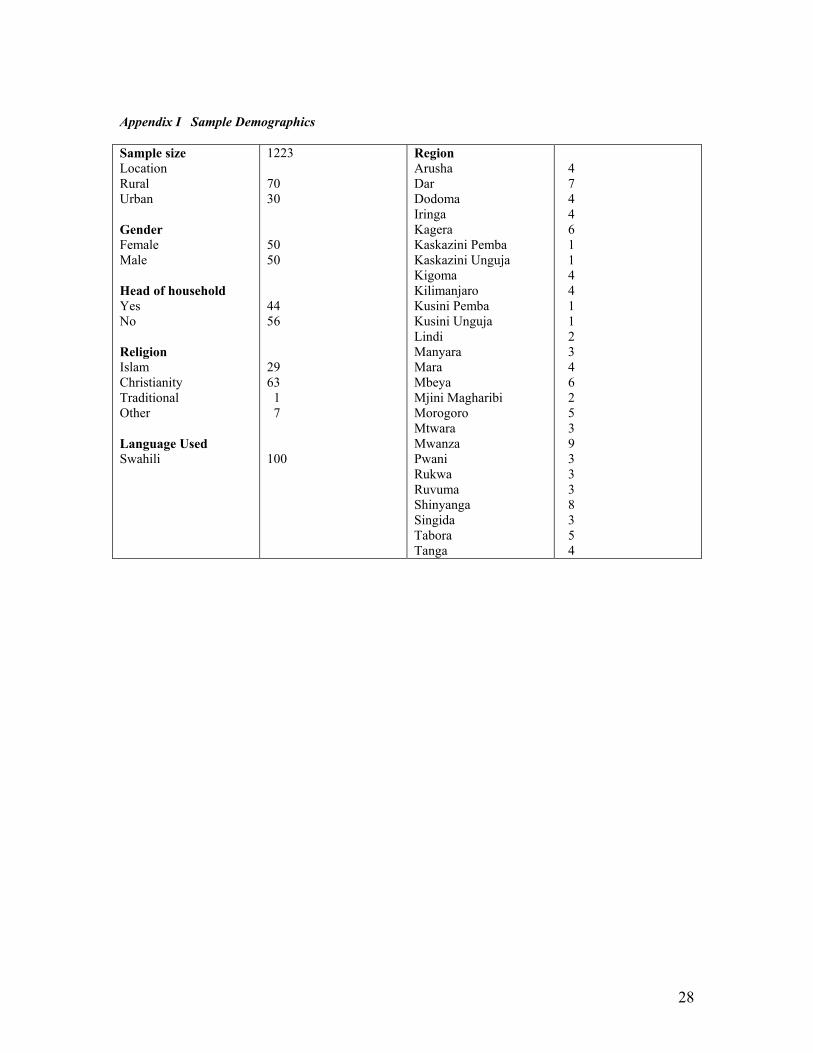
Appendix I Sample Demographics Sample size Location Rural Urban Gender Female Male Head of household Yes No Religion Islam Christianity Traditional Other Language Used Swahili
1223 70 30 50 50 44 56 29 63 1 7 100
Region Arusha Dar Dodoma Iringa Kagera Kaskazini Pemba Kaskazini Unguja Kigoma Kilimanjaro Kusini Pemba Kusini Unguja Lindi Manyara Mara Mbeya Mjini Magharibi Morogoro Mtwara Mwanza Pwani Rukwa Ruvuma Shinyanga Singida Tabora Tanga
4 7 4 4 6 1 1 4 4 1 1 2 3 4 6 2 5 3 9 3 3 3 8 3 5 4
29
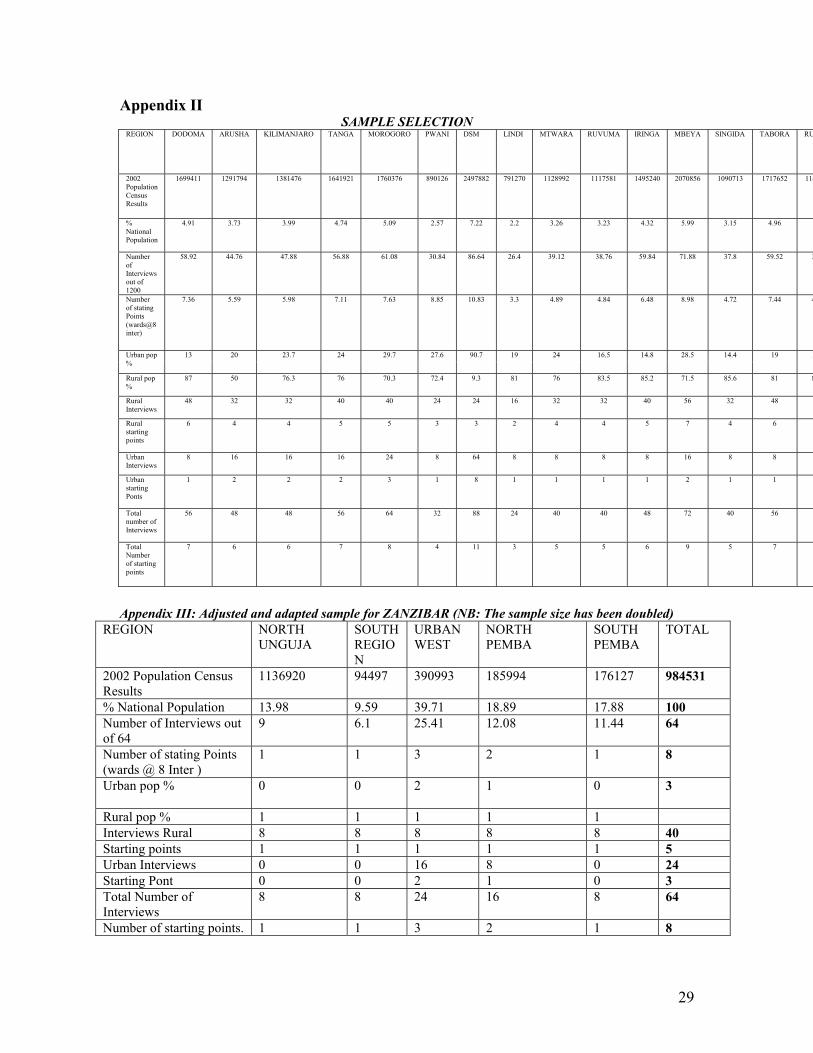
Appendix II SAMPLE SELECTION
REGION DODOMA ARUSHA KILIMANJARO TANGA MOROGORO PWANI DSM LINDI MTWARA RUVUMA IRINGA MBEYA SINGIDA TABORA RU
2002 Population Census Results
1699411 1291794 1381476 1641921 1760376 890126 2497882 791270 1128992 1117581 1495240 2070856 1090713 1717652 114
% National Population
4.91 3.73 3.99 4.74 5.09 2.57 7.22 2.2 3.26 3.23 4.32 5.99 3.15 4.96 3
Number of Interviews out of 1200
58.92 44.76 47.88 56.88 61.08 30.84 86.64 26.4 39.12 38.76 59.84 71.88 37.8 59.52 3
Number of stating Points (wards@8 inter)
7.36 5.59 5.98 7.11 7.63 8.85 10.83 3.3 4.89 4.84 6.48 8.98 4.72 7.44 4
Urban pop %
13 20 23.7 24 29.7 27.6 90.7 19 24 16.5 14.8 28.5 14.4 19 1
Rural pop %
87 50 76.3 76 70.3 72.4 9.3 81 76 83.5 85.2 71.5 85.6 81 8
Rural Interviews
48 32 32 40 40 24 24 16 32 32 40 56 32 48
Rural starting points
6 4 4 5 5 3 3 2 4 4 5 7 4 6
Urban Interviews
8 16 16 16 24 8 64 8 8 8 8 16 8 8
Urban starting Ponts
1 2 2 2 3 1 8 1 1 1 1 2 1 1
Total number of Interviews
56 48 48 56 64 32 88 24 40 40 48 72 40 56
Total Number of starting points
7 6 6 7 8 4 11 3 5 5 6 9 5 7
Appendix III: Adjusted and adapted sample for ZANZIBAR (NB: The sample size has been doubled)
REGION NORTH UNGUJA
SOUTH REGION
URBAN WEST
NORTH PEMBA
SOUTH PEMBA
TOTAL
2002 Population Census Results
1136920 94497 390993 185994 176127 984531
% National Population 13.98 9.59 39.71 18.89 17.88 100 Number of Interviews out of 64
9 6.1 25.41 12.08 11.44 64
Number of stating Points (wards @ 8 Inter )
1 1 3 2 1 8
Urban pop %
0 0 2 1 0 3
Rural pop % 1 1 1 1 1 Interviews Rural 8 8 8 8 8 40 Starting points 1 1 1 1 1 5 Urban Interviews 0 0 16 8 0 24 Starting Pont 0 0 2 1 0 3 Total Number of Interviews
8 8 24 16 8 64
Number of starting points. 1 1 3 2 1 8
30
Notes The adjusted Afrobarometer sample for Zanzibar Zanzibar Comprises of two islands, Unguja and Pemba as part of the United Republic of Tanzania. The total population is only 2.85% of the total population of the URT according to the 2002 census. This implies that the sampling framework outline above would give about 32 interviews for Zanzibar. This is fairly small given that the case of Zanzibar is politically interesting and the fact that the Islands have been always regarded to be autonomous in many aspects. To draw an effective sample, just like in the previous Afrobarometer survey, we have proposed to double the sample from 32 to 64 interviews. The adjusted sampling framework for Zanzibar is summarized in Table 2.