Embed Size (px)
Citation preview

Public Perceptions of Agricultural Biotechnology:A Survey of New Jersey Residents
William K. Hallman, Ph.D.Department of Human Ecology
Cook College
Jennifer Metcalfe, M.Sc.Division of Tropical Crops and Pastures
CSIRO, Australia
The Food Policy InstituteCook College
Rutgers, The State University of New Jersey

For additional copies send requests to:
Dr. William K. HallmanFood Policy InstituteCook CollegeRutgers, The State University of New JerseyASB III, 3 Rutgers PlazaNew Brunswick, NJ 08903-0231
Telephone: (732) 932-1966Fax: (732) 932 -9544E-mail: [email protected],org

Biotechnology attitudes survey - New Jersey, 1993iii
Table of Contents
Table of Tables . . . . . . . . . . . . . . . . . . . . . . . . . . . . . . . . . . . . . . . . . . . . . . . . . . . . . . . . . . . . . . iv
Acknowledgments . . . . . . . . . . . . . . . . . . . . . . . . . . . . . . . . . . . . . . . . . . . . . . . . . . . . . . . . . . . . . v
Executive Summary . . . . . . . . . . . . . . . . . . . . . . . . . . . . . . . . . . . . . . . . . . . . . . . . . . . . . . . . . . . . 1
Introduction . . . . . . . . . . . . . . . . . . . . . . . . . . . . . . . . . . . . . . . . . . . . . . . . . . . . . . . . . . . . . . . . . . 7
Previous surveys . . . . . . . . . . . . . . . . . . . . . . . . . . . . . . . . . . . . . . . . . . . . . . . . . . . . . . . . . . . . . . 8
Public Perceptions of Agricultural Biotechnology: A Survey of New Jersey Residents . . . . . . . . . . . . . . . . . . . . . . . . . . . . . . . . . . . . . . . 10
Questionnaire development . . . . . . . . . . . . . . . . . . . . . . . . . . . . . . . . . . . . . . . . . 10Sample selection and weighting . . . . . . . . . . . . . . . . . . . . . . . . . . . . . . . . . . . . . 11Data collection . . . . . . . . . . . . . . . . . . . . . . . . . . . . . . . . . . . . . . . . . . . . . . . . . . . 11Sample demographics . . . . . . . . . . . . . . . . . . . . . . . . . . . . . . . . . . . . . . . . . . . . . 12
Understanding of science and technology . . . . . . . . . . . . . . . . . . . . . . . . . . . . . . . . . . . . 14Awareness of genetic engineering . . . . . . . . . . . . . . . . . . . . . . . . . . . . . . . . . . . . . . . . . . 15Images of genetic engineering . . . . . . . . . . . . . . . . . . . . . . . . . . . . . . . . . . . . . . . . . . . . . 16Knowledge about food production . . . . . . . . . . . . . . . . . . . . . . . . . . . . . . . . . . . . . . . . . . 17Morality and approval of traditional cross-breeding and biotechnology . . . . . . . . . . . . . 17Turning the clock back? . . . . . . . . . . . . . . . . . . . . . . . . . . . . . . . . . . . . . . . . . . . . . . . . . . 21Acceptance of genetically engineered products . . . . . . . . . . . . . . . . . . . . . . . . . . . . . . . . 25Consumer attitudes . . . . . . . . . . . . . . . . . . . . . . . . . . . . . . . . . . . . . . . . . . . . . . . . . . . . . 26
Consumer profile . . . . . . . . . . . . . . . . . . . . . . . . . . . . . . . . . . . . . . . . . . . . . . . . 26Organic maybe, but not natural. . . . . . . . . . . . . . . . . . . . . . . . . . . . . . . . . . . . . . . 27Label that produce . . . . . . . . . . . . . . . . . . . . . . . . . . . . . . . . . . . . . . . . . . . . . . . . 28
Quality of life . . . . . . . . . . . . . . . . . . . . . . . . . . . . . . . . . . . . . . . . . . . . . . . . . . . . . . . . . . 29Job creation . . . . . . . . . . . . . . . . . . . . . . . . . . . . . . . . . . . . . . . . . . . . . . . . . . . . . . . . . . . 30Perceived risks . . . . . . . . . . . . . . . . . . . . . . . . . . . . . . . . . . . . . . . . . . . . . . . . . . . . . . . . . 31Concern about regulation of biotechnology . . . . . . . . . . . . . . . . . . . . . . . . . . . . . . . . . . . 31Environment . . . . . . . . . . . . . . . . . . . . . . . . . . . . . . . . . . . . . . . . . . . . . . . . . . . . . . . . . . . 32Siting of research . . . . . . . . . . . . . . . . . . . . . . . . . . . . . . . . . . . . . . . . . . . . . . . . . . . . . . . 33Credibility of "expert" sources of information . . . . . . . . . . . . . . . . . . . . . . . . . . . . . . . . 33Support for genetic engineering research . . . . . . . . . . . . . . . . . . . . . . . . . . . . . . . . . . . . 34Conclusions . . . . . . . . . . . . . . . . . . . . . . . . . . . . . . . . . . . . . . . . . . . . . . . . . . . . . . . . . . . 35
Methodology . . . . . . . . . . . . . . . . . . . . . . . . . . . . . . . . . . . . . . . . . . . . . . . . . . . . . . . . . . . . . . . . 38
Biotechnology Survey . . . . . . . . . . . . . . . . . . . . . . . . . . . . . . . . . . . . . . . . . . . . . . . . . . . . . . . . . 39
Biotechnology attitudes survey - New Jersey, 1993iv
Table of Tables
Table 1: Understanding of science and technology . . . . . . . . . . . . . . . . . . . . . . . . . . . . . . . . . . . 15Table 2: Awareness of genetic engineering . . . . . . . . . . . . . . . . . . . . . . . . . . . . . . . . . . . . . . . . . 16Table 3a: Support for genetic engineering techniques of plants . . . . . . . . . . . . . . . . . . . . . . . . . 20Table 3b: Support for genetic engineering techniques of animals . . . . . . . . . . . . . . . . . . . . . . . . 21Table 4a: It would be better if we didn't know about genetic engineering . . . . . . . . . . . . . . . . . 23Table 4b: We have no business meddling with nature . . . . . . . . . . . . . . . . . . . . . . . . . . . . . . . . 24Table 5: Comparison of opinions about genetic engineering and meddling with nature . . . . . . 25Table 6: Opinions about the applications of genetic engineering . . . . . . . . . . . . . . . . . . . . . . . . 26Table 7: Consumer opinions about specific genetically engineered agricultural products . . . . 29Table 8: Genetic engineering and the quality of life . . . . . . . . . . . . . . . . . . . . . . . . . . . . . . . . . . 30Table 9: Support of strict regulations on genetic engineering . . . . . . . . . . . . . . . . . . . . . . . . . . . 32Table 10: Credibility of sources of statements about genetic engineering . . . . . . . . . . . . . . . . . 34Table 11: Support for genetic engineering research . . . . . . . . . . . . . . . . . . . . . . . . . . . . . . . . . . 35

Biotechnology attitudes survey - New Jersey, 1993v
Acknowledgments
Dr. Hallman would like to thank the many experts from Rutgers University involved inthe design, execution, and report of this study. These included: Dr. Laura Meagher, Center forAgricultural Molecular Biology; Caron Chess, Director of the Center for EnvironmentalCommunication; Ms. Janice Ballou, Director of the Center for Public Interest Polling of theEagleton Institute of Politics at Rutgers University; Dr. Mark Lapping, Dean, Edward J. Bloustein School of Planning and Public Policy; Dr. Daniel Rossi, Assistant Dean, CookCollege; Dr. Donald Schaffner, Food Safety Specialist, Rutgers Cooperative Extension Service;Ms. Clare Liptak, Extension Specialist, Rutgers Cooperative Extension Service of SomersetCounty, Mr. Daniel Strombom, Extension Specialist, Rutgers Cooperative Extension Service ofCape May County. Thanks also to Dr. James Laughlin of the Department of Psychology of theUniversity of South Carolina, who helped to answer questions about using inferential statistics onweighted data. A special note of thanks to Dr. Roger Wyse, former Dean of the New JerseyAgricultural Experiment Station and Dr. Mark Lapping, Dean of the Edward J. Bloustein Schoolof Planning and Public Policy who were both instrumental in securing the funding for this study.

1
Biotechnology attitudes survey - New Jersey, 1993
Executive SummaryBiotechnology is expected to produce significant economic and environmental benefits as
a result of the development of new varieties of plants and animals and improved agriculturalproductivity. Seen by many as a key technology for the 21st century, and as an economicstimulus for the State of New Jersey and for the Nation, biotechnology has been the subject ofintense scientific and public debate. Yet, while experts and activists continue to argue, geneticengineering techniques are already leading to agricultural products that may soon be onsupermarket shelves.
Despite the imminent introduction of genetically engineered agricultural products into themarketplace, little published research has detailed how American consumers actually feel aboutbiotechnology or its products. To assess public perceptions in New Jersey about bothbiotechnology and potential agricultural products created through biotechnology, a telephonesurvey was commissioned by Rutgers University in May 1993. The survey was conducted with arandom sample of 604 New Jersey residents, through the services of the Center for PublicInterest Polling of the Eagleton Institute of Politics at Rutgers University. The key objective ofthe survey was to examine the beliefs, attitudes and intentions of New Jersey residents towardagricultural biotechnology and its products. This paper provides a brief summary of relevantprior studies; presents the data obtained from the present survey; and explores some policyimplications of the survey's findings. When interpreting the results of the survey, it should benoted that the sampling error associated with a statewide sample of 600 people is approximately±4.0 percent at a 95 percent confidence interval.
The survey found that one quarter of New Jersey's citizens (25 percent) rate theirunderstanding of science and technology as "very good" and an additional 55 percent say thattheir understanding is "adequate." New Jersey's residents rate their understanding of scienceand technology much higher than respondents in national surveys. For example, in anational survey carried out by the Office of Technology Assessment (OTA) in 1986, only aboutone in six Americans (16 percent) rated their basic understanding of science and technology as"very good."
The survey found that awareness of biotechnology among New Jersey's residents isslightly higher than that found in national surveys. Nearly half the New Jersey population(48 percent) had heard or read "some," or "a great deal," about genetic engineering. Awarenesswas greater among men, people with more education, and those who think they have a very goodunderstanding of science and technology. Statistical analysis showed, not surprisingly,respondents who work as scientists or engineers, or who belong to a scientific group ororganization, were more likely to have heard or read about genetic engineering. Similarly, thosewho said that they belonged to environmental or consumer groups were more likely to have heardof genetic engineering. However, medical professionals and those whose jobs involve growingfood were no more likely to have heard of genetic engineering than other respondents. Thosewhose jobs involve preparing or selling food were less likely to have heard of geneticengineering than other respondents.
When asked to report their first thoughts or images upon thinking about genetic
2
Biotechnology attitudes survey - New Jersey, 1993
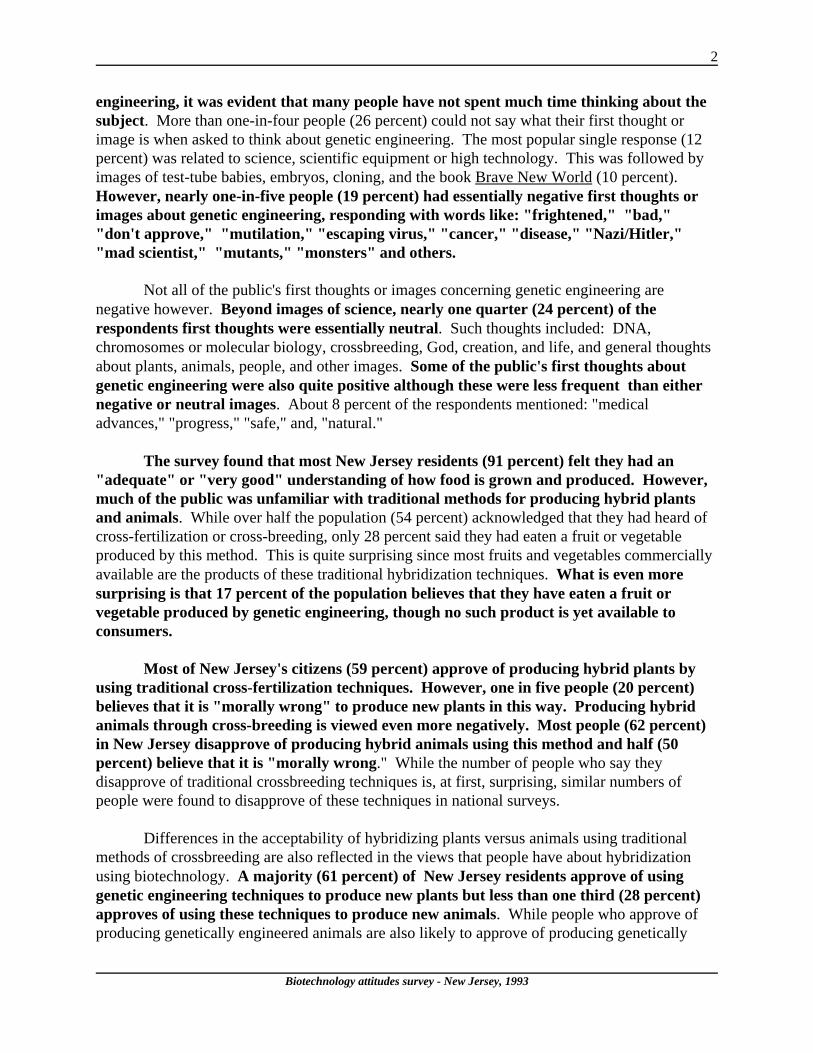
engineering, it was evident that many people have not spent much time thinking about thesubject. More than one-in-four people (26 percent) could not say what their first thought orimage is when asked to think about genetic engineering. The most popular single response (12percent) was related to science, scientific equipment or high technology. This was followed byimages of test-tube babies, embryos, cloning, and the book Brave New World (10 percent). However, nearly one-in-five people (19 percent) had essentially negative first thoughts orimages about genetic engineering, responding with words like: "frightened," "bad," "don't approve," "mutilation," "escaping virus," "cancer," "disease," "Nazi/Hitler,""mad scientist," "mutants," "monsters" and others.
Not all of the public's first thoughts or images concerning genetic engineering arenegative however. Beyond images of science, nearly one quarter (24 percent) of therespondents first thoughts were essentially neutral. Such thoughts included: DNA,chromosomes or molecular biology, crossbreeding, God, creation, and life, and general thoughtsabout plants, animals, people, and other images. Some of the public's first thoughts aboutgenetic engineering were also quite positive although these were less frequent than eithernegative or neutral images. About 8 percent of the respondents mentioned: "medicaladvances," "progress," "safe," and, "natural."
The survey found that most New Jersey residents (91 percent) felt they had an"adequate" or "very good" understanding of how food is grown and produced. However,much of the public was unfamiliar with traditional methods for producing hybrid plantsand animals. While over half the population (54 percent) acknowledged that they had heard ofcross-fertilization or cross-breeding, only 28 percent said they had eaten a fruit or vegetableproduced by this method. This is quite surprising since most fruits and vegetables commerciallyavailable are the products of these traditional hybridization techniques. What is even moresurprising is that 17 percent of the population believes that they have eaten a fruit orvegetable produced by genetic engineering, though no such product is yet available toconsumers.
Most of New Jersey's citizens (59 percent) approve of producing hybrid plants byusing traditional cross-fertilization techniques. However, one in five people (20 percent)believes that it is "morally wrong" to produce new plants in this way. Producing hybridanimals through cross-breeding is viewed even more negatively. Most people (62 percent)in New Jersey disapprove of producing hybrid animals using this method and half (50percent) believe that it is "morally wrong." While the number of people who say theydisapprove of traditional crossbreeding techniques is, at first, surprising, similar numbers ofpeople were found to disapprove of these techniques in national surveys.
Differences in the acceptability of hybridizing plants versus animals using traditionalmethods of crossbreeding are also reflected in the views that people have about hybridizationusing biotechnology. A majority (61 percent) of New Jersey residents approve of usinggenetic engineering techniques to produce new plants but less than one third (28 percent)approves of using these techniques to produce new animals. While people who approve ofproducing genetically engineered animals are also likely to approve of producing genetically

3
Biotechnology attitudes survey - New Jersey, 1993
engineered plants, the reverse is not true. Almost half (49 percent) of the people who approve ofthe use of genetic engineering for plants do not approve of using it for animals.
People's views concerning the hybridization of plants and animals were relativelyconsistent, whatever the techniques used to bring it about. People who approve of traditionalcross-breeding methods for producing hybrid plants are also likely to approve of producinghybrid plants through genetic engineering. The same is true for producing hybrid animals. Objections to producing hybrid organisms appear to lie more with the organisms involved(manipulation of plants or animals) rather than the process involved.
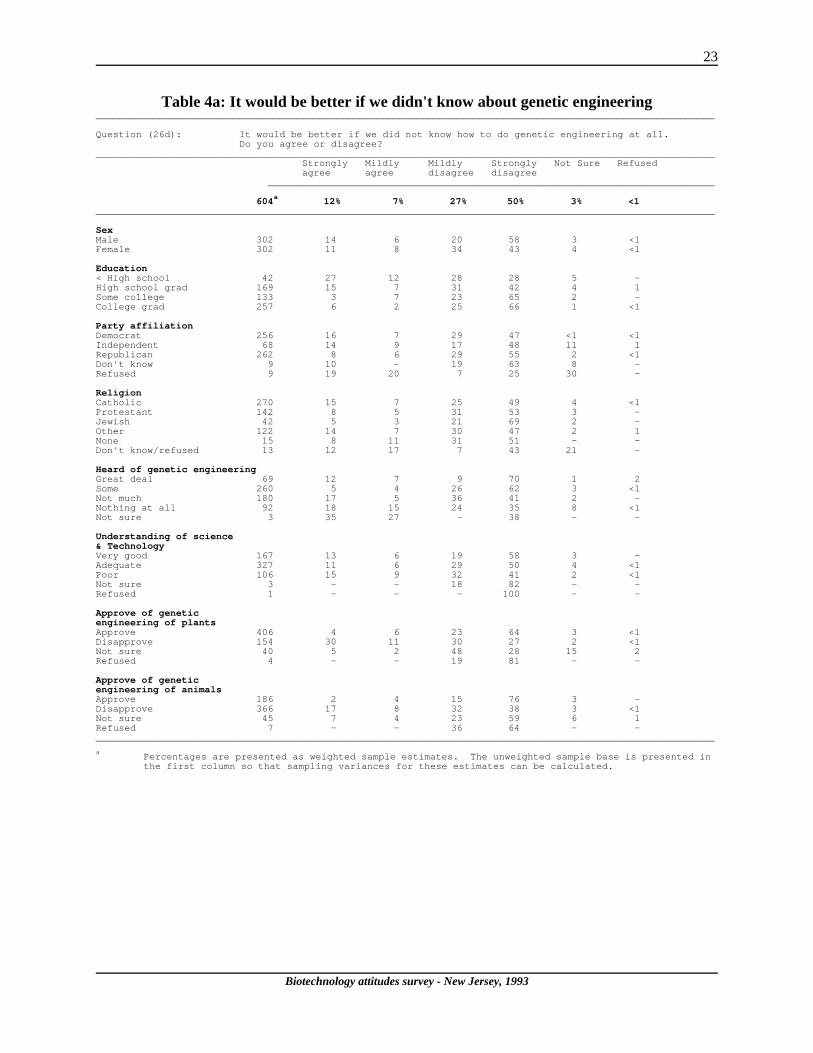
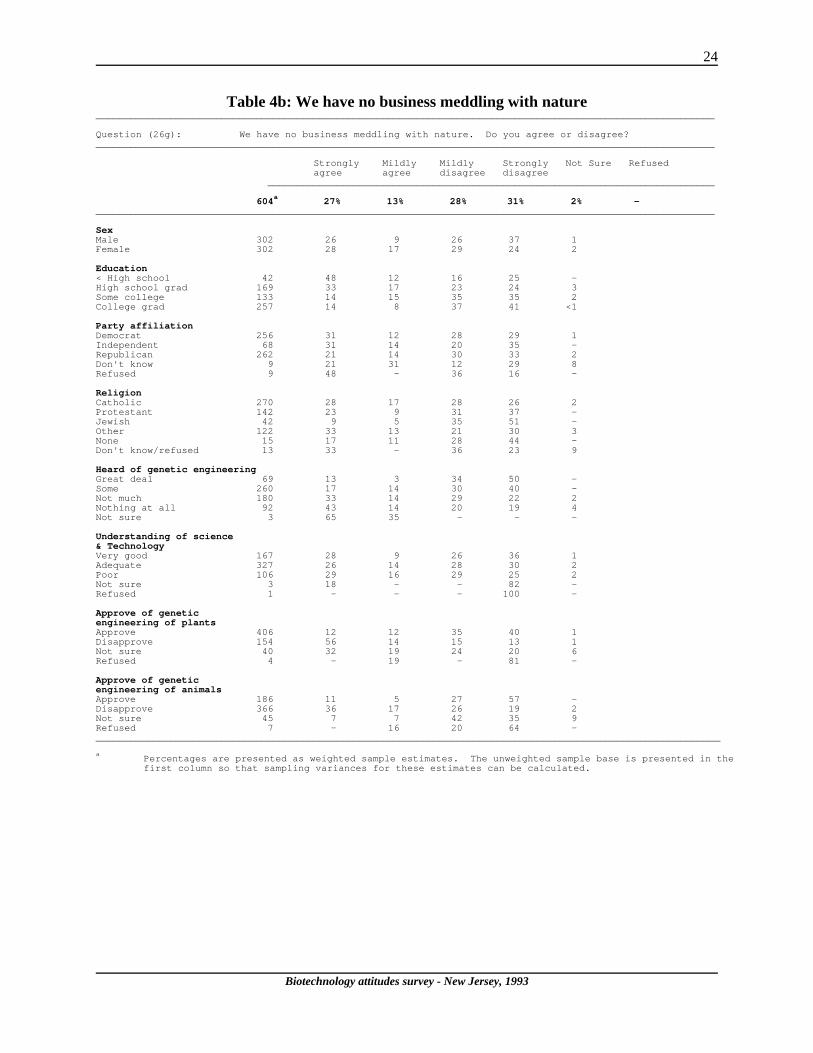
Most people in New Jersey do not want to turn the clock back on biotechnology. Only 19 percent of those surveyed agreed either strongly (12 percent) or mildly (7 percent) that itwould be better if we did not know how to do genetic engineering at all. A sizable majority (58percent) of the public in New Jersey also disagreed with the statement,"we have no businessmeddling with nature."
Most of New Jersey's citizens seem to be in the initial stages of making up theirminds about this new technology and have not decided that products of agriculturalbiotechnology are universally acceptable or unacceptable. The survey examined whetherpublic acceptance of the application of biotechnology differs with respect to specific products. Most respondents supported ten of the twelve products asked about. Support was given forgenetically engineered products related to: human health and welfare, saving money ortime, and the environment. The strongest support was given to items regarding human health. For example, most of the New Jersey population "strongly" (81 percent) approves of creatingnew drugs to cure human diseases. A similar proportion of the population supports the creationof hormones like insulin that help those with diabetes. There is also strong support (68 percent)for genetically engineering "more nutritious grain that could feed people in poor countries." NewJersey's residents would also welcome genetically engineered bacteria that can help clean up oilspills. However, most of the population in New Jersey is against developing geneticallyengineered hormones that can either help cows produce more milk or help cows producemore beef. About four out of ten New Jersey residents strongly oppose the development of suchhormones using genetic engineering.
Acceptance of genetically engineered products does not appear to be clearlydetermined by feelings of morality. For example, 62 percent of people who stronglydisapprove of producing bacteria to clean up oil spills do not think it is morally wrong togenetically engineer plants. On the other hand, more than four-in-ten (42 percent) who approveof producing a hormone to help diabetics also believe it is morally wrong to genetically engineerplants. There are similar results for approval of a new grass that does not need to be mown sooften, approval of new drugs to cure disease, and approval of more nutritious grain to feed peoplein poor countries. Clearly, people's views about genetic engineering may vary when a specificproduct is described. People appear to be far more focused on the characteristics ofproducts than the process used to create those products. People may be willing to overlooktheir objections to genetic engineering if its products produce specific benefits.
4
Biotechnology attitudes survey - New Jersey, 1993
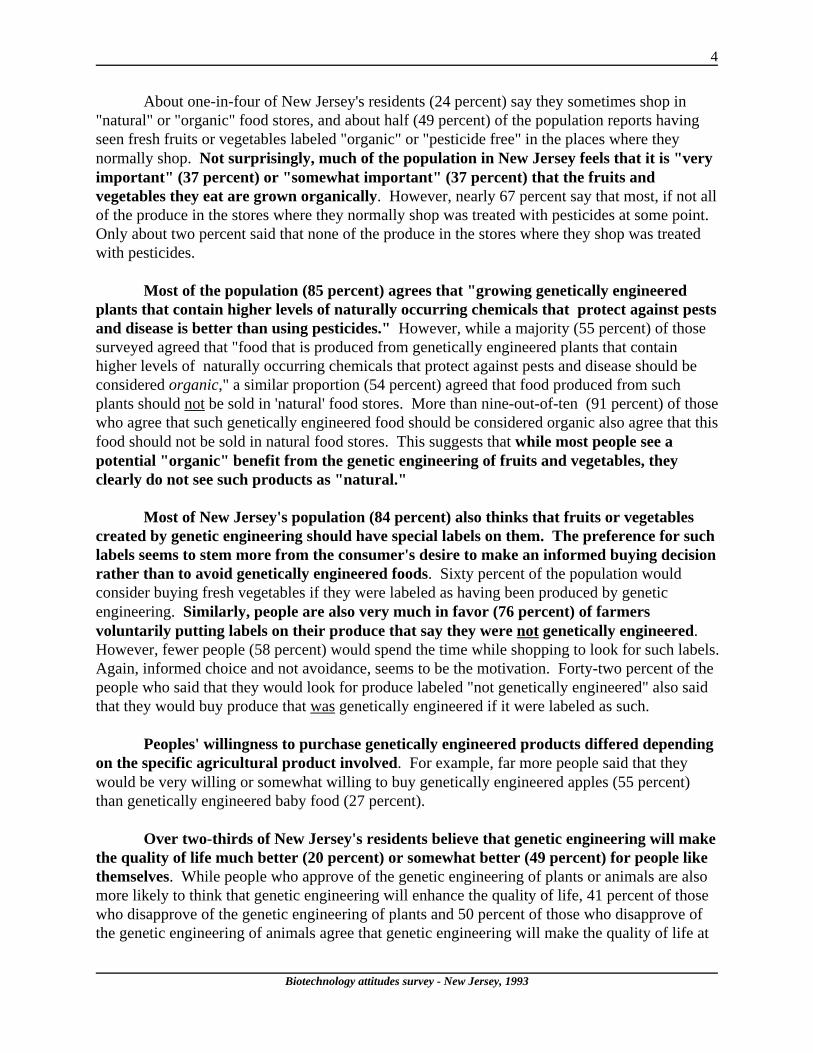
About one-in-four of New Jersey's residents (24 percent) say they sometimes shop in"natural" or "organic" food stores, and about half (49 percent) of the population reports havingseen fresh fruits or vegetables labeled "organic" or "pesticide free" in the places where theynormally shop. Not surprisingly, much of the population in New Jersey feels that it is "veryimportant" (37 percent) or "somewhat important" (37 percent) that the fruits andvegetables they eat are grown organically. However, nearly 67 percent say that most, if not allof the produce in the stores where they normally shop was treated with pesticides at some point. Only about two percent said that none of the produce in the stores where they shop was treatedwith pesticides.
Most of the population (85 percent) agrees that "growing genetically engineeredplants that contain higher levels of naturally occurring chemicals that protect against pestsand disease is better than using pesticides." However, while a majority (55 percent) of thosesurveyed agreed that "food that is produced from genetically engineered plants that containhigher levels of naturally occurring chemicals that protect against pests and disease should beconsidered organic," a similar proportion (54 percent) agreed that food produced from suchplants should not be sold in 'natural' food stores. More than nine-out-of-ten (91 percent) of thosewho agree that such genetically engineered food should be considered organic also agree that thisfood should not be sold in natural food stores. This suggests that while most people see apotential "organic" benefit from the genetic engineering of fruits and vegetables, theyclearly do not see such products as "natural."
Most of New Jersey's population (84 percent) also thinks that fruits or vegetablescreated by genetic engineering should have special labels on them. The preference for suchlabels seems to stem more from the consumer's desire to make an informed buying decisionrather than to avoid genetically engineered foods. Sixty percent of the population wouldconsider buying fresh vegetables if they were labeled as having been produced by geneticengineering. Similarly, people are also very much in favor (76 percent) of farmersvoluntarily putting labels on their produce that say they were not genetically engineered. However, fewer people (58 percent) would spend the time while shopping to look for such labels. Again, informed choice and not avoidance, seems to be the motivation. Forty-two percent of thepeople who said that they would look for produce labeled "not genetically engineered" also saidthat they would buy produce that was genetically engineered if it were labeled as such.
Peoples' willingness to purchase genetically engineered products differed dependingon the specific agricultural product involved. For example, far more people said that theywould be very willing or somewhat willing to buy genetically engineered apples (55 percent)than genetically engineered baby food (27 percent).
Over two-thirds of New Jersey's residents believe that genetic engineering will makethe quality of life much better (20 percent) or somewhat better (49 percent) for people likethemselves. While people who approve of the genetic engineering of plants or animals are alsomore likely to think that genetic engineering will enhance the quality of life, 41 percent of thosewho disapprove of the genetic engineering of plants and 50 percent of those who disapprove ofthe genetic engineering of animals agree that genetic engineering will make the quality of life at

5
Biotechnology attitudes survey - New Jersey, 1993
least somewhat better for people such as themselves. However, one-in-seven New Jerseyresidents was unsure what effect genetic engineering would have on the quality of their lives.
Almost three-out-of-four residents also "mildly" (37 percent) or "strongly" (36percent) agree that genetic engineering will create jobs in New Jersey. However, believingthat genetic engineering will create jobs does not necessarily lead people to approve of thetechnology. Of those who agree that the technology will create jobs in New Jersey, 19 percentdisapprove of the genetic engineering of plants and 61 percent disapprove of the geneticengineering of animals.
About half of New Jersey's residents agree that the risks of genetic engineering havebeen greatly exaggerated. However, a third of the people who rated their understanding ofscience and technology as "very good" also disagreed that genetic engineering risks had beenexaggerated. A similar proportion of the people who approve of the genetic engineering of plantsor animals also believe the risks have not been exaggerated. Some people (15 percent) said thatthey were not sure about whether risks had been exaggerated or not.
Although most of the population in New Jersey is accepting of biotechnologyresearch and some of its potential products, they are also clearly in favor of closegovernment control over this research. Almost two-thirds of the population "strongly" agrees(44 percent) or mildly agrees (21 percent) that "the potential danger from genetic engineering isso great that strict regulations are necessary." Only 28 percent either mildly or strongly disagreewith this statement. Most people (57 percent) also agree that "unjustified fears about geneticengineering have seriously blocked the development of beneficial foods," yet even 71 percent ofthese people also call for strict regulation.
Almost two-thirds of the population (63 percent) disagreed that "scientists in thiscountry know what they are doing, so only moderate regulations on genetic engineering areprobably necessary." Interestingly, scientists, engineers, and those who said that they belongedto scientific organizations, were no more likely to agree with this statement than non-scientists. Those in consumer and environmental groups were no more likely to disagree with thisstatement.
Concerns about possible risks to the environment are fairly polarized. About 40 percentof the population believes that new genetically engineered plants or animals could pose alikely threat to the environment if they could reproduce. However, a slightly greaterproportion of people (46 percent) do not think such a threat is likely.
The survey showed that most of New Jersey's residents approved of a new geneticengineering laboratory or farm test-site no matter where it would be located. However, thecloser a laboratory or farm test site was to the local community, the less support there was. Interestingly, there was little difference in the rates of approval or disapproval, whether theresearch facility was a relatively closed laboratory or relatively open field testing on a farm.
The survey found that the credibility of expert sources of information about
6
Biotechnology attitudes survey - New Jersey, 1993
biotechnology varies significantly. Scientists were seen as the most credible and companiesthat make genetically engineered products seen as the least credible sources of informationabout biotechnology. Local farmers and environmental groups are also far more likely to bebelieved than state or federal government agencies. This apparent lack of belief in governmentagencies could prove problematic in future debates about the regulation of biotechnology.
Most of New Jersey's population believes that research into genetic engineeringshould be continued. Almost eight-out-of-ten people say that research into geneticengineering should be continued at the same level (44 percent) or increased (34 percent). Only 9 percent of the New Jersey public feels that genetic research should be stopped altogether,and another 9 percent believe it should be decreased.

7
Biotechnology attitudes survey - New Jersey, 1993
IntroductionBiotechnology is expected to produce significant economic and environmental benefits as
the result of the development of new varieties of plants and animals and improved agriculturalproductivity. Seen by many as a key technology for the 21st century and as an economicstimulus for the State of New Jersey and for the Nation, biotechnology has been the subject ofintense scientific and public debate.
Proponents of biotechnology argue that the techniques are safe, following hundreds ofyears of producing hybrid plants and animals through cross-breeding and cross-pollination. Theymaintain that biotechnology's major innovation is that genes from very different organisms canbe joined. For example, genes from a fish, such as flounder, may make sugar cane frost resistantor tomatoes stay ripe longer. Biotech methods can also produce new hybrids with specificcharacteristics in a much shorter time and with greater precision than with traditionalcrossbreeding. Many assert that biotechnology will lead to a second "green revolution," resultingin a greater variety of foods and other agricultural products that are more plentiful, are producedmore efficiently, with less waste, with fewer pesticides, and with fewer negative effects on theenvironment.
Opponents of biotechnology suggest that not enough is known about the safety of thesetechniques or their products and that "playing God" is a dangerous game. They contend that genesplicing could convey lethal allergens to new foods, and that radioactive markers used to trackthe transfer of gene segments are potentially dangerous. Some also argue that splicing animalgenes into plants violates "natural law" and could be offensive to vegetarians, and those withreligious dietary restrictions. Many worry that accidental releases of genetically engineeredorganisms will create environmental mayhem. They call for increased governmental regulation,strict labeling of genetically engineered products, and for consumer boycotts of geneticallyengineered foods served in restaurants and sold in supermarkets.
Whatever their interpretations of the costs and benefits of biotechnology, both proponentsand opponents agree that biotechnology has the potential to fundamentally change how food isproduced in the future. Yet, while experts and activists continue to debate, genetic engineeringtechniques are already leading to agricultural products that may soon be on supermarket shelves. The U.S. Food and Drug Administration has ruled that it will not treat genetically engineeredfoods differently than other foods and will not require special testing or labeling, unless majormodifications have been made or foreign genes have been inserted into plants. In addition, theU.S. Department of Agriculture has decided that it will no longer require permits, onlynotification, for most field trials of certain genetically engineered organisms, since the hundredsof field trials already conducted have not caused any environmental problems.
Despite the imminent introduction of genetically engineered agricultural products into themarketplace, little published research has detailed how American consumers actually feel aboutbiotechnology or its products. To help remedy this, a telephone survey was commissioned byRutgers University in May 1993 to assess public perceptions in New Jersey about bothbiotechnology and potential agricultural products created using biotechnology. The survey wasconducted with a random sample of 604 New Jersey residents, under the direction of the Center
8
1Office of Technology Assessment (1987). New Directions in Biotechnology- Background Paper: Public Perceptions of Biotechnology. Washington DC: U.S. Government Printing Office.
2Hoban, T.J. & Kendall, P.A. (1992). Consumer Attitudes About the Use ofBiotechnology in Agriculture and Food Production. Raleigh, NC: North CarolinaState University.
Biotechnology attitudes survey - New Jersey, 1993
for Public Interest Polling of the Eagleton Institute of Politics at Rutgers University. The keyobjective of the survey was to examine the beliefs, attitudes and intentions of New Jerseyresidents toward agricultural biotechnology and its products. This background paper provides abrief summary of relevant prior studies and presents the data obtained from the present survey. The paper also briefly explores some policy implications of the survey's findings.
Previous surveysWhile many "in-house" studies about consumer acceptance of particular biotech products
were probably conducted by private concerns in the last decade, there have only been two majorstudies of public attitudes concerning biotechnology that were national in scope, and generallyavailable to the academic community. The first was conducted by Louis Harris and Associatesfor the Office of Technology Assessment (OTA) of the U.S. Congress1. For the survey, 1,273adults were randomly selected from a probability sample based on a distribution of the adultpopulation of the United States. Conducted by telephone in the Autumn of 1986, the surveyfocused on "public knowledge and opinion on science and technology issues in general, andgenetic engineering and biotechnology in particular." While it did not focus on agriculturalbiotechnology per se, the survey did reveal important details about Americans' general attitudestoward biotechnology.
A second study, focusing more specifically on consumer attitudes about the use ofagricultural biotechnology in the production of food was conducted by Dr. Thomas Hoban ofNorth Carolina State University and Dr. Patricia Kendall of Colorado State University2. In thisstudy, 1228 adults were randomly selected from across the nation and interviewed by telephoneduring the Spring of 1992.
The results of both studies suggest that public awareness and understanding ofbiotechnology is relatively moderate but increasing. The OTA study found that a little more thanone third (35 percent) had heard or read a fair amount about genetic engineering in 1986. In1992, Hoban and Kendall found that a similar proportion (38 percent) had heard or read "some"or "alot" about biotechnology.
Both studies also suggest that while people report that they have heard or read little aboutbiotechnology, the majority recognize some potential benefits and risks of the new technologyand are generally supportive of it. In the OTA study, only about one-in-five Americans (19percent) reported that they had heard about any potential dangers of genetically engineeredproducts. Nonetheless, about half (52 percent) thought that these products could present aserious danger to people or to the environment. Six years later, Hoban and Kendall found that 65
9
Biotechnology attitudes survey - New Jersey, 1993
percent could name at least one potential negative effect of biotechnology. Despite therecognition of the potential risks of biotechnology, the OTA study found that two-thirds of thepublic (66 percent) thinks that genetic engineering will make life better for all people. Answering a more specific question, over two-thirds of the respondents in the Hoban andKendall study agreed that biotechnology would personally benefit people like themselves in thenext five years and almost three quarters believe that biotechnology will positively affect foodquality and nutrition. As a result, two-thirds of the respondents said that they supported the useof biotechnology in agriculture and food production.
While both studies report that most of the American people favor biotechnology, suchsupport is certainly not universal. Both studies suggest that people who consider themselves religious had less favorable attitudes toward biotechnology. Support for biotechnology in bothstudies was associated with more formal education, more interest in science and technology, andmore awareness of biotechnology. Those most supportive also tended to be younger, male, andin the Hoban and Kendall study, had higher incomes. Interestingly, Hoban and Kendall found noage-related differences in support for biotechnology nor associations between support andpolitical philosophy or having a farm background.
Support for biotechnology also depends on the organisms involved. Both studies foundthat the public is much more supportive of the genetic engineering of plants and microorganismsthan they are of animals. In addition, Hoban and Kendall found that transfers of genes withinspecies was viewed as more acceptable than genetic transfers across species. Both studies alsofound significant moral objections to biotechnology. The OTA study reported that nearly one-fourth (24 percent) of the population who have heard about the use of genetic engineering tocreate hybrid plants and animals feel that it is morally wrong. Asked more specific questions, 24percent of the respondents in the Hoban and Kendall study reported moral objections to usingbiotechnology to change plants and 53 percent reported moral objections to using biotechnologyto change animals.
Both studies also point to a strong desire for adequate regulation of biotechnology. However, the studies also suggest a fairly low level of confidence in the government to assess thepotential risks of biotechnology (OTA) or to effectively regulate biotechnology (Hoban andKendall).

10
Biotechnology attitudes survey - New Jersey, 1993
Public Perceptions of Agricultural Biotechnology: A Survey of New Jersey Residents
Questionnaire developmentThe questionnaire was initially developed in consultation with a team of Rutgers
researchers representing a range of disciplines and expertise. These invaluable experts included:Dr. William Hallman, Project Leader, Department of Human Ecology, Dr. Laura Meagher,Center for Agricultural Molecular Biology; Ms. Caron Chess, Director of the Center forEnvironmental Communication; Dr. Mark Lapping, Dean, Edward J. Bloustein School ofPlanning and Public Policy; Dr. Daniel Rossi, Assistant Dean, Cook College; Dr. DonaldSchaffner, Food Safety Specialist, Rutgers Cooperative Extension Service; Ms. Clare Liptak,Extension Specialist, Rutgers Cooperative Extension Service of Somerset County, Mr. DanielStrombom, Extension Specialist, Rutgers Cooperative Extension Service of Cape May County. The questionnaire was designed to extend what is known about public perceptions ofbiotechnology. For comparison purposes, many questions measure concepts originally probed inthe national surveys already described.
Considerable discussion occurred over what terminology should be used throughout thequestionnaire to refer to the use of recombinant DNA. Technically, the term biotechnology is abroad one, encompassing not only the use of recombinant DNA, but other techniques as well. These include monoclonal antibody technology and a variety of cell and tissue culturetechnologies. The term "genetic engineering", while sometimes misused, generally refers to thealteration of genetic material of living organisms, using recombinant DNA techniques. Whilesomewhat more specific, the term genetic engineering has some negative images attached to it,some of which are catalogued in the results section of this survey. While the term biotechnologyis less specific, and probably has fewer negative images attached to it, the research team decidedthat it was probably a less familiar term to non-scientists, a focus group composed of collegestudents confirmed this. The phrase genetic engineering has been used in mass circulationpublications since the 1970's. Popular newspapers and magazines continue to use the phrase, asdo most of the opponents of biotechnology. Finally, the term genetic engineering was chosenafter subjects in the focus group complained that using the term biotechnology seemed to theman effort to trick respondents into answering questions about genetic engineering without callingit that. Thus, to be completely aboveboard, the term genetic engineering was used throughout thesurvey, despite its negative connotations.
Four drafts of the telephone questionnaire, which was expected to last approximatelytwenty minutes, were circulated among the Rutgers experts. A fifth draft was prepared inconsultation with Ms. Janice Ballou, Director of the Center for Public Interest Polling of theEagleton Institute of Politics at Rutgers University. This draft was pretested using a team ofprofessional telephone interviewers. It was modified based on the results of this pretest,debriefing of the telephone interviewers, and taped recordings of pretest interviews. The sixthand final draft of the survey instrument is included at the end of this report. The final version ofthe survey instrument was programmed into a CATI (Computer Assisted Telephone Interviews)system.
11
Biotechnology attitudes survey - New Jersey, 1993
Sample selection and weightingA random proportional probability sample was used to select the 604 New Jersey
residents eighteen years of age and older who were contacted to participate in this study. Thesample was designed to ensure that each of the state's twenty-one counties was proportionallyrepresented and that an equal number of men and women were interviewed. The three digitexchanges were used to match telephone numbers with geographic areas. The remaining fourdigits were randomly selected. This procedure insures that those with unlisted or new telephonenumbers are included in the sample. More information about the sample selection is included atthe end of this report. Each working telephone number was called a minimum of three times, atdifferent times of the week, to reach people who were infrequently at home.
Ideally, those who are interviewed in a survey have the same characteristics as thepopulation they represent. Unfortunately, many samples of respondents under-represent groupsthat are more difficult to contact or to interview, such as the elderly or those with less than a highschool education. To compensate for this under-representation, the statistical technique knownas weighting is used. The weighting procedure compares the number of respondents in thesample that fall into specific categories of age and education with the number of people onewould expect to interview in those categories, based on census figures for the State of NewJersey. When there is a significant difference between the number of interviews expected and thenumber obtained, the sample is weighted so that it more accurately reflects the characteristics ofthe population of the State. For example, if census figures show that 39 percent of NewJerseyans, aged eighteen and older have a high school education, and only 32 percent of thoseinterviewed have high school educations, each of these respondents would be counted as 1.21persons to adjust for the difference.
The percentages reported in this survey are estimates of what the distribution of responseswould be if the entire population of the State of New Jersey had been interviewed. "SamplingError" describes the probable difference between interviewing everyone in a particular populationand a sample drawn from that population. The sampling error associated with a statewide sampleof 600 people is approximately ±4.0 percent at a 95 percent confidence interval. Thus, if 35percent of those interviewed agree with a particular statement, the number of people in the Stateof New Jersey who would agree is between 31 percent and 39 percent (35 ± 4.0), ninety-five outof one hundred times.
Readers should note that sampling error increases as the sample size is reduced. Forexample, if percentages are based on a sample size of 300 people, the sampling error is ±8.0percent. This fact should be kept in mind when comparing the responses of different groupswithin the sample, such as the responses of men compared to those of women. It should also benoted that estimates of sampling error do not consider other sources of error intrinsic to studies ofpublic opinion.
Data collectionA total of 604 CATI interviews were conducted with a random probability sample of New
Jersey residents eighteen years old and older. Each interview lasted an average of 20.5 minutes. The interviews were conducted between June 7 and 20, 1993 by experienced professional
12
Biotechnology attitudes survey - New Jersey, 1993
interviewers from the market research firm, Schulman, Ronca, and Buculavalas. Theinterviewers were trained and monitored by the research staff of the Center for Public InterestPolling, of the Eagleton Institute of Politics. Of those contacted and qualified to complete thesurvey, 75 percent responded.
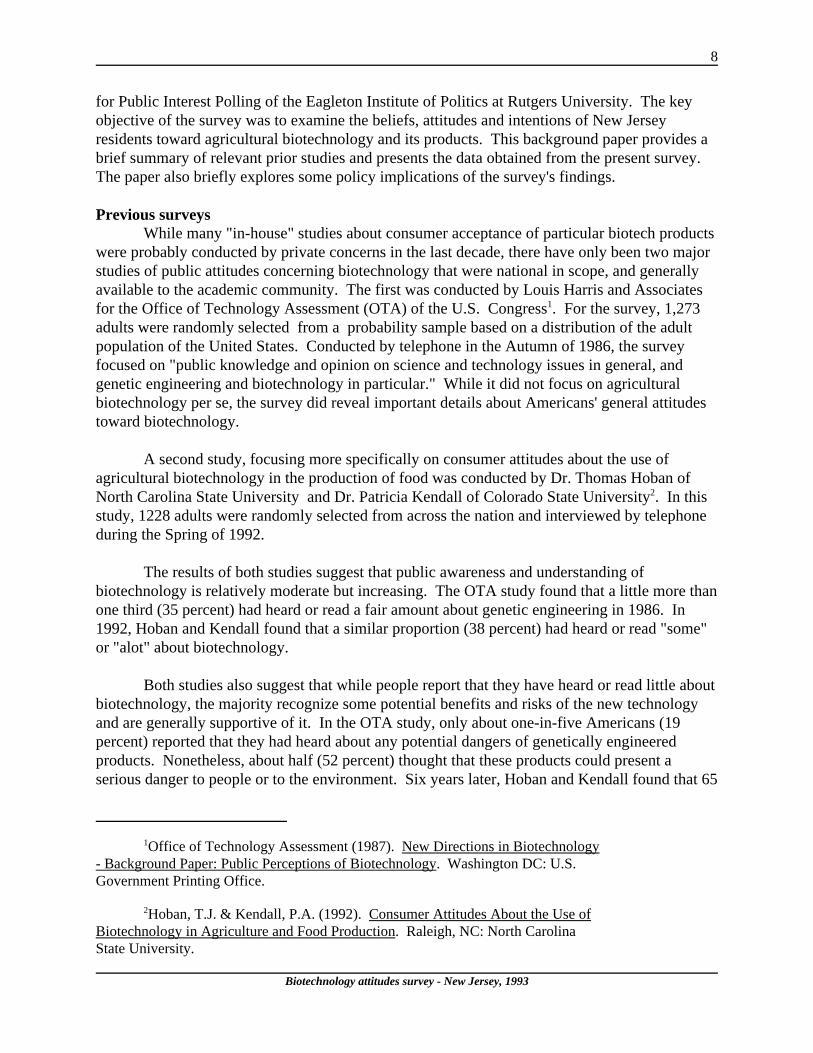
Sample demographicsBy design, half the respondents
to the survey were male and half werefemale. Also by design, to correspondwith the known population densitieswithin the state, 50 percent of thoseinterviewed were from Northern NewJersey, 22 percent were drawn fromCentral New Jersey and 28 percent werefrom the southern part of the state (SeeFigure 1).
Respondents' ages ranged fromeighteen to ninety-two, with a medianage of forty-three. Thirty-five percenthad children under the age of twenty-one. Seventeen percent had childrenunder the age of six.
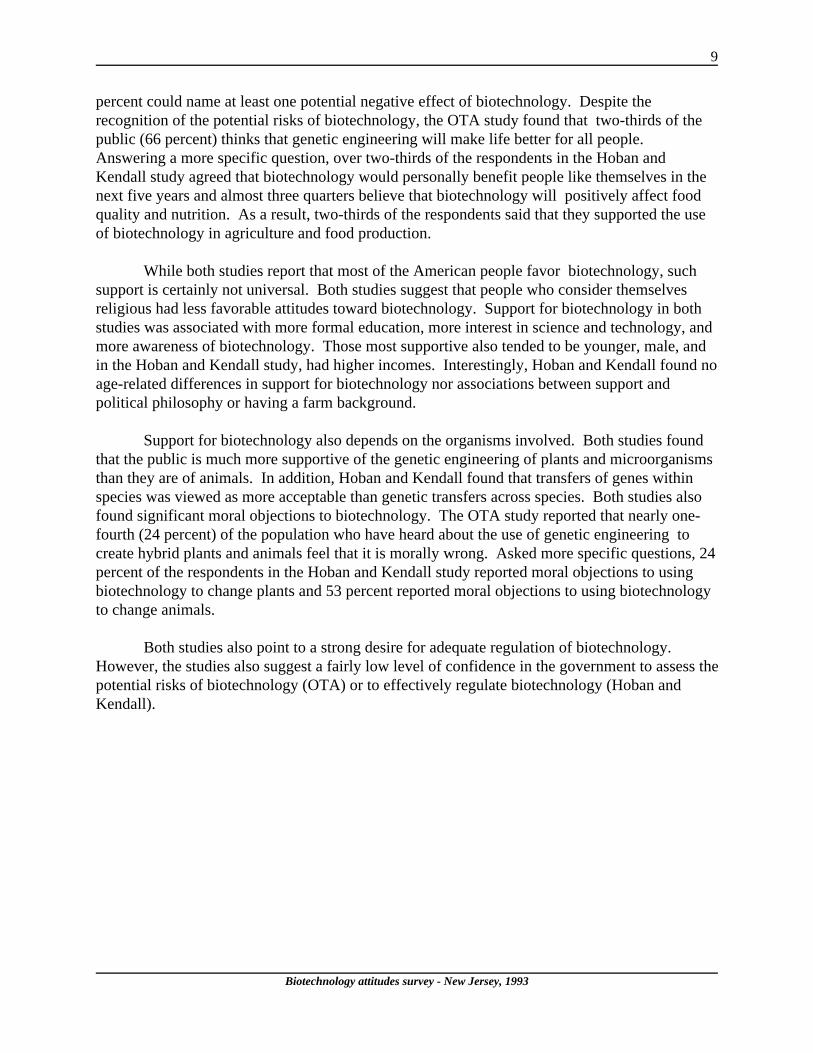
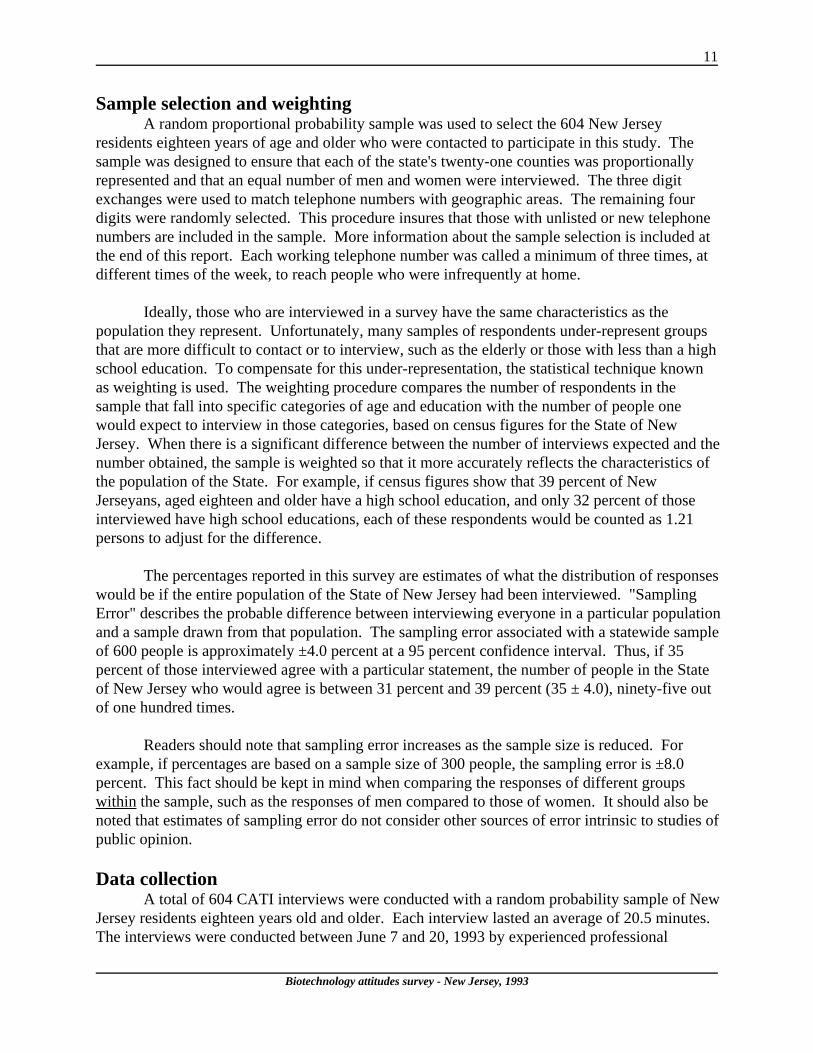
Median income was between $30,000 and $50,000 (See Figure 2). A little more than onequarter of those interviewed had graduated from college. About one-in-five had not graduatedfrom high school. (See Figure 3).

13
Biotechnology attitudes survey - New Jersey, 1993
About half (52 percent) said that they tend to be politically conservative, about four-in-ten(39 percent) politically liberal, and about 8 percent said that their political ideology is somewherein between (See Figure 4). Whatever their political ideology, nearly one third (31 percent) of therespondents said that they are Democrats and an additional 13 percent said that they lean towardthe Democratic Party. One quarter of the respondents (25 percent) said that they are Republicansand an additional 15 percent said that they lean toward the Republican Party. About 12 percentsaid that they are Independents (See Figure 5).
Forty-five percent of the respondents said that they considered themselves Catholics, 22percent consider themselves Protestants, 5 percent consider themselves Jewish. Nearly onequarter (24 percent) consider themselves to have a religious affiliation other than Catholic,Protestant, or Jewish. The remaining 5 percent say that they have no religious affiliation, don'tknow or refused to answer (See Figure 6). No matter their religious affiliation, more than halfthe respondents (52 percent) say that they attend a church, synagogue or other house of worshipat least once or twice a month (See Figure 7).
14
Biotechnology attitudes survey - New Jersey, 1993
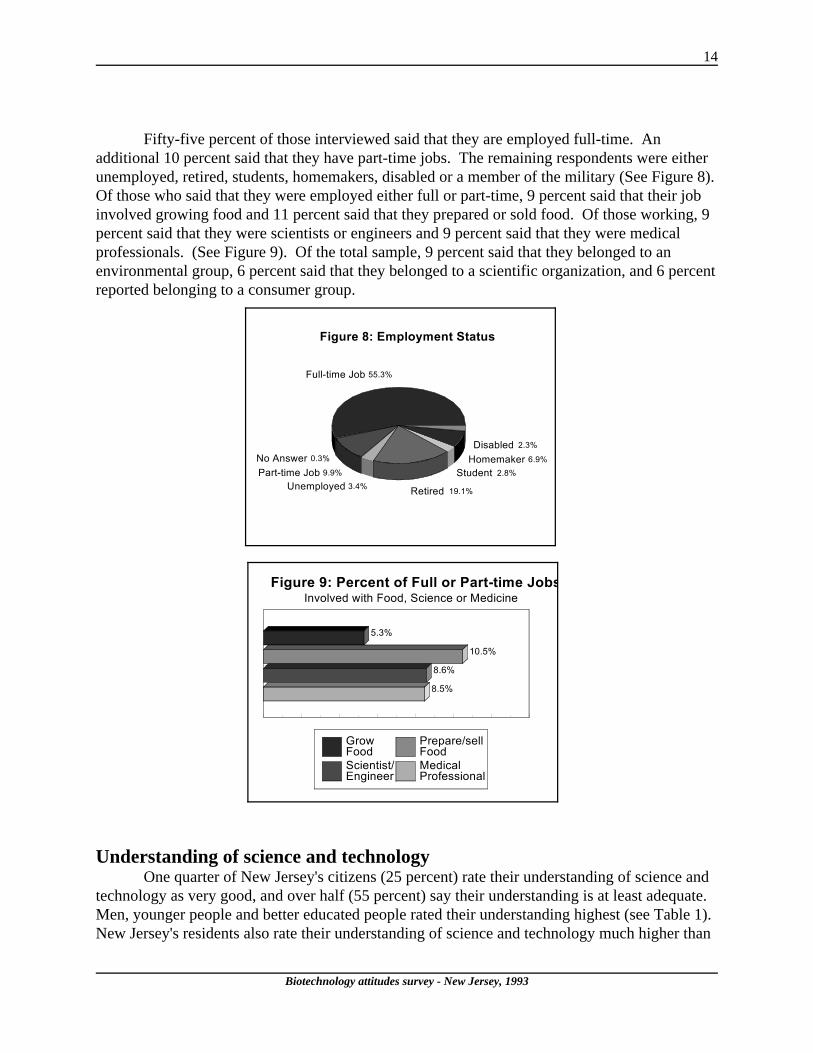
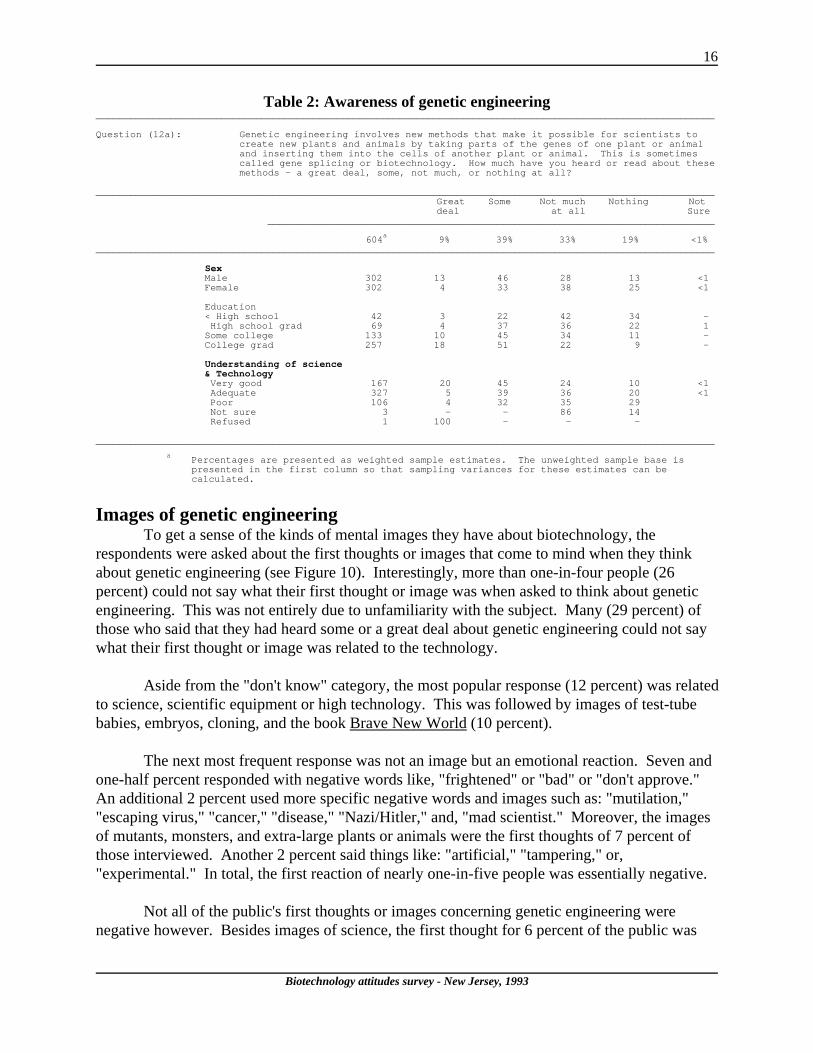
Fifty-five percent of those interviewed said that they are employed full-time. Anadditional 10 percent said that they have part-time jobs. The remaining respondents were eitherunemployed, retired, students, homemakers, disabled or a member of the military (See Figure 8). Of those who said that they were employed either full or part-time, 9 percent said that their jobinvolved growing food and 11 percent said that they prepared or sold food. Of those working, 9percent said that they were scientists or engineers and 9 percent said that they were medicalprofessionals. (See Figure 9). Of the total sample, 9 percent said that they belonged to anenvironmental group, 6 percent said that they belonged to a scientific organization, and 6 percentreported belonging to a consumer group.
Understanding of science and technology
One quarter of New Jersey's citizens (25 percent) rate their understanding of science andtechnology as very good, and over half (55 percent) say their understanding is at least adequate. Men, younger people and better educated people rated their understanding highest (see Table 1). New Jersey's residents also rate their understanding of science and technology much higher than

15
Biotechnology attitudes survey - New Jersey, 1993
respondents in national surveys. For example, in a national survey carried out by the Office ofTechnology Assessment (OTA) in 1986, only about one-in-six Americans (16 percent) rated theirbasic understanding of science and technology as very good.
Table 1: Understanding of science and technology____________________________________________________________________________________________________________Question (2): Would you rate your own basic understanding of science and technology as very good,
adequate or poor?____________________________________________________________________________________________________________
Very good Adequate Poor Not sure______________________________________________________________________________
604a 25% 55% 20% <1%____________________________________________________________________________________________________________
SexMale 302 30 57 12 <1Female 302 19 53 28 1
Age18-24 76 29 62 10 -25-29 61 31 55 14 -30-39 108 26 52 20 240-49 113 24 60 15 <150-59 89 20 54 25 1
60+ 144 21 51 28 -
Education< High school 42 10 63 25 2High school grad 169 20 52 28 -Some college 133 35 50 15 <1College grad 257 33 56 11 <1
____________________________________________________________________________________________________________
aPercentages are presented as weighted sample estimates. The unweighted sample base is presented inthe first column so that sampling variances for these estimates can be calculated.
Awareness of genetic engineeringThe survey found that awareness of biotechnology among New Jersey's residents is
slightly higher than that found in recent national surveys. Nearly half the New Jersey population(48 percent) had heard or read some or a great deal about genetic engineering. Earlier Nationalsurveys found that only about four-out-of-ten Americans (38 percent) were equally aware ofbiotechnology (OTA, 1987; Hoban & Kendall, 1992). It is unclear whether the greater awarenessrecorded in this survey represents geographical or temporal factors. That is, people in New Jerseymay be more aware than other U.S. citizens, or, awareness may be greater across the nation dueto the fact that biotechnology has recieved a great deal of news coverage since 1992.
In New Jersey, awareness was greatest among men, people with more education and thosewho think they have a very good understanding of science and technology (see Table 2). Ananalysis of variance found that, not surprisingly, respondents who work as scientists or engineers,or who belong to a scientific group or organization, were more likely to have heard or read aboutgenetic engineering. Similarly, those who said that they belonged to an environmental orconsumer group or organization were more likely to have heard of genetic engineering. However, medical professionals, and those whose jobs involve growing food were no more likelyto have heard of genetic engineering than other respondents. Those whose jobs involvepreparing or selling food were less likely to have heard of genetic engineering than otherrespondents.
16
Biotechnology attitudes survey - New Jersey, 1993
Table 2: Awareness of genetic engineering____________________________________________________________________________________________________________
Question (12a): Genetic engineering involves new methods that make it possible for scientists tocreate new plants and animals by taking parts of the genes of one plant or animaland inserting them into the cells of another plant or animal. This is sometimescalled gene splicing or biotechnology. How much have you heard or read about thesemethods - a great deal, some, not much, or nothing at all?
____________________________________________________________________________________________________________Great Some Not much Nothing Notdeal at all Sure
______________________________________________________________________________
604a
9% 39% 33% 19% <1%____________________________________________________________________________________________________________
SexMale 302 13 46 28 13 <1Female 302 4 33 38 25 <1
Education< High school 42 3 22 42 34 -High school grad 69 4 37 36 22 1Some college 133 10 45 34 11 -College grad 257 18 51 22 9 -
Understanding of science& TechnologyVery good 167 20 45 24 10 <1Adequate 327 5 39 36 20 <1Poor 106 4 32 35 29Not sure 3 - - 86 14Refused 1 100 - - -
____________________________________________________________________________________________________________
aPercentages are presented as weighted sample estimates. The unweighted sample base ispresented in the first column so that sampling variances for these estimates can becalculated.
Images of genetic engineeringTo get a sense of the kinds of mental images they have about biotechnology, the
respondents were asked about the first thoughts or images that come to mind when they thinkabout genetic engineering (see Figure 10). Interestingly, more than one-in-four people (26percent) could not say what their first thought or image was when asked to think about geneticengineering. This was not entirely due to unfamiliarity with the subject. Many (29 percent) ofthose who said that they had heard some or a great deal about genetic engineering could not saywhat their first thought or image was related to the technology.
Aside from the "don't know" category, the most popular response (12 percent) was relatedto science, scientific equipment or high technology. This was followed by images of test-tubebabies, embryos, cloning, and the book Brave New World (10 percent).
The next most frequent response was not an image but an emotional reaction. Seven andone-half percent responded with negative words like, "frightened" or "bad" or "don't approve." An additional 2 percent used more specific negative words and images such as: "mutilation,""escaping virus," "cancer," "disease," "Nazi/Hitler," and, "mad scientist." Moreover, the imagesof mutants, monsters, and extra-large plants or animals were the first thoughts of 7 percent ofthose interviewed. Another 2 percent said things like: "artificial," "tampering," or,"experimental." In total, the first reaction of nearly one-in-five people was essentially negative.
Not all of the public's first thoughts or images concerning genetic engineering werenegative however. Besides images of science, the first thought for 6 percent of the public was

17
Biotechnology attitudes survey - New Jersey, 1993
DNA, chromosomes or molecular biology. Other essentially neutral thoughts concernedcrossbreeding (4 percent), God, creation, and life (4 percent), and general thoughts about plants(4 percent), animals (3 percent), people (2 percent), and other images (3 percent).
Some of the public's first thoughts about genetic engineering were also quite positive. Medical advances were mentioned by 4 percent. Ideas of "progress," "safe," and, "natural" werethe responses of an additional 4 percent of the public.
Knowledge about food productionThe survey found that most New Jersey residents (91 percent) felt that they had an
adequate or very good understanding of how food is grown and produced. However, much of thepublic was unfamiliar with traditional methods for producing hybrid plants and animals. Whileover half the population (54 percent) acknowledged that they had heard of cross-fertilization orcross-breeding, only 28 percent said they had eaten a fruit or vegetable produced by this method. This is quite surprising since nearly all fruits and vegetables commercially available are theproducts of these traditional hybridization techniques. What is even more surprising is that 17percent of the population believes that they have eaten a fruit or vegetable produced by geneticengineering, though no such product is yet available to consumers. Interestingly, people who saythey have heard or read a "great deal" or "some" about genetic engineering were more likely tosay they have eaten a genetically engineered product than those who have read or heard "notmuch" or "nothing at all."
Morality and approval of traditional cross-breeding and biotechnology Most of New Jersey's citizens (59 percent) approve of producing hybrid plants by using
traditional cross-fertilization techniques. Not surprisingly, those who said that they had heard ofthe techniques were most likely to approve. However, one-in-five people (20 percent) believes

18
Biotechnology attitudes survey - New Jersey, 1993
that it is morally wrong to produce new plants in this way. Producing hybrid animals throughcross-breeding is viewed even more negatively. Most people (62 percent) in New Jerseydisapprove of producing hybrid animals using this method and half (50 percent) believe that it ismorally wrong. While the number of people who say they disapprove of traditionalcrossbreeding techniques is at first a little surprising, similar numbers of people were found todisapprove of these techniques in national surveys. In the 1987 OTA report, 26 percent of thosewho had heard of traditional cross-breeding disapproved of it. Similarly, Hoban and Kendall(1992) found that 20 percent of their respondents disapproved of cross-breeding plants and 44percent disapproved of cross-breeding animals.
Thinking that the relatively low number of people who said that they had heard of, andapproved of traditional crossbreeding was the result of the definition of crossbreeding given inthe surveys, several new definitions were pretested. Crossbreeding is a basic scientific conceptnow taught in the sixth grade, and hybrid plants are advertised in seed catalogs and are staples inthe garden. Yet, several variations in the definition presented in the survey failed to evoke anymore of a glint of recognition than that presented in the survey's final form. Whether oneapproves or disapproves of biotechnology, the fact that half the population is unaware of currentmethods to improve plants and animals must be considered a serious deficiency in publicscientific literacy.
Differences in the acceptability of hybridizing plants versus animals using traditionalmethods of crossbreeding are also reflected in the views that people have about hybridizationusing biotechnology. A majority (61 percent) of New Jersey residents approve of using geneticengineering techniques to produce new plants but less than one third (28 percent) approves ofusing these techniques to produce new animals. While people who approve of producinggenetically engineered animals are also likely to approve of producing genetically engineeredplants, the reverse is not true. Almost half (49 percent) of the people who approve of the use ofgenetic engineering for plants do not approve of using it for animals.
Approval of using genetic engineering on either plants or animals increases witheducation, awareness of genetic engineering techniques, and understanding of science andtechnology (see Table 3a and 3b). Interestingly, Republicans are more likely to support geneticengineering of plants than Democrats or Independents while Independents give more support forgenetic engineering of animals than either Republicans or Democrats. People who considerthemselves to be Jewish are more supportive of genetic engineering than Catholics, Protestants,or those reporting other religious affiliations (see Table 3a and 3b). People with children underage five were also less likely to approve of the genetic engineering of plants, but no more likelyto disapprove of the genetic engineering of animals.
Scientists, engineers, medical professionals, and those who said that they belonged to anenvironmental or consumer group were statistically no more or less likely to approve of thegenetic engineering of either plants or animals. However, those who said that they belonged toscientific groups or organizations were more likely to approve of the genetic engineering ofplants but not animals. Those whose jobs involve growing food were more likely to approve ofthe genetic engineering of animals, but no more likely to approve or disapprove of the genetic
19
Biotechnology attitudes survey - New Jersey, 1993
engineering of plants. The reverse was true for those whose job involves preparing or sellingfood. They were more likely to disapprove of the genetic engineering of plants, but no morelikely to approve or disapprove of the genetic engineering of animals.
People's views concerning the hybridization of plants and animals were relativelyconsistent despite the techniques used to bring it about. A comparison of the approval ratings forthe two technologies shows a strong degree of internal agreement. People who approve oftraditional cross-breeding methods for producing hybrid plants are also likely to approve of producing hybrid plants through genetic engineering. The same is true for producing hybridanimals. Objections to producing hybrid organisms appear to lie more with the organismsinvolved (manipulation of plants or animals) rather than the process involved.

20
Biotechnology attitudes survey - New Jersey, 1993
Table 3a: Support for genetic engineering techniques of plants____________________________________________________________________________________________________________
Question (16a): In general, do you approve or disapprove of creating hybrid plants using geneticengineering?___________________________________________________________________________________________
Approve Disapprove Not sure Refused______________________________________________________________________________
604a
61% 31% 7% <1%____________________________________________________________________________________________________________
SexMale 302 66 31 2 <1Female 302 57 31 12 <1
Education< High school 42 34 58 7 -High school grad 169 54 35 10 <1Some college 133 78 18 4 -College grad 257 77 17 5 1
Party affiliationDemocrat 256 53 39 8 <1Independent 68 60 29 9 <1Republican 262 71 23 6 <1Don't know 9 58 42 - -Refused 9 71 29 - -
ReligionCatholic 270 62 31 7 <1Protestant 142 69 22 9 <1Jewish 42 85 11 5 -Other 122 53 42 6 -None 15 37 59 - 4Don't know/refused 13 52 36 13 -
Heard of genetic engineeringGreat deal 69 81 19 - -Some 260 74 20 5 1Not much 180 52 39 9 -Nothing at all 92 45 43 11 <1Not sure 3 - 100 - -
Understanding of science& TechnologyVery good 167 68 27 5 <1Adequate 327 63 32 5 <1Poor 106 52 36 12 -Not sure 3 - - 86 14Refused 1 100 - - -
OccupationFood Grower 19 70 30 - -Food Preparer/Seller 35 51 48 1 -Scientist/Engineer 46 77 21 2 -Medical Professional 44 72 27 1 -
Belongs to:Environmental group 62 62 32 4 1Scientific organization 51 85 11 5 -Consumer group 41 59 39 2 -
_________________________________________________________________________________________________________a
Percentages are presented as weighted sample estimates. The unweighted sample base is presented inthe first column so that sampling variances for these estimates can be calculated.

21
Biotechnology attitudes survey - New Jersey, 1993
Table 3b: Support for genetic engineering techniques of animals____________________________________________________________________________________________________________
Question (16c): In general, do you approve or disapprove of creating hybrid animals using geneticengineering?___________________________________________________________________________________________
Approve Disapprove Not sure Refused______________________________________________________________________________
604a
28% 65% 7% <1%____________________________________________________________________________________________________________
SexMale 302 37 56 6 1Female 302 19 73 8 <1
Education< High school 42 15 83 3 -High school grad 169 20 68 10 <1Some college 133 38 56 5 -College grad 257 39 52 7 2
Party affiliationDemocrat 256 22 74 4 <1Independent 68 41 51 6 2Republican 262 33 57 10 1Don't know 9 11 73 15 -Refused 9 6 81 13 -
ReligionCatholic 270 22 72 5 <1Protestant 142 34 57 8 1Jewish 42 53 32 11 5Other 122 30 63 7 <1None 15 14 73 13 -Don't know/refused 13 26 57 17 -
Heard of genetic engineeringGreat deal 69 43 44 13 -Some 260 36 57 6 1Not much 180 24 71 5 <1Nothing at all 92 11 78 9 1Not sure 3 38 62 - -
Understanding of science& TechnologyVery good 167 34 57 9 <1Adequate 327 27 66 7 <1Poor 106 24 71 4 <1Not sure 3 - 86 - 14Refused 1 100 - - -
OccupationFood Grower 19 57 39 4 -Food Preparer/Seller 35 32 68 - -Scientist/Engineer 46 37 58 5 -Medical Professional 44 31 63 5 2
Belongs to:Environmental group 62 32 65 3 -Scientific organization 51 36 58 6 -Consumer group 41 31 66 4 -
_____________________________________________________________________________________________________________
aPercentages are presented as weighted sample estimates. The unweighted sample base is presented in thefirst column so that sampling variances for these estimates can be calculated.
Turning the clock back?Most people in New Jersey do not want to turn the clock back on biotechnology. Only 19
percent of those surveyed agreed either strongly (12 percent) or mildly (7 percent) that it would bebetter if we did not know how to do genetic engineering at all. Moreover, half the populationstrongly disagreed with this view. This is in contrast to the results of the 1987 OTA national surveywhere a third (33 percent) of the public reported that they would prefer to turn the clock back ongenetic engineering and only 31 percent of the population strongly disagreed with this statement.
22
Biotechnology attitudes survey - New Jersey, 1993
A sizable majority (58 percent) of the public in New Jersey also disagreed with thestatement,"we have no business meddling with nature." Yet, opinion was polarized on this issuewith 27 percent strongly agreeing that we have no business meddling with nature and 31 percentstrongly disagreeing with this statement.
People most likely to disagree with both statements were men, those with more education,those who consider themselves to be Jewish, Protestants, or Republicans, those who have heardmore about genetic engineering, people who think they have a good understanding of science andtechnology, and people who approve of genetic engineering to produce hybrid plants or animals(see Tables 4a and 4b). While these relationships are interesting, it should be noted that feeling thatwe have no business meddling with nature and that it would be better if we did not know how to dogenetic engineering is not necessarily a function of a lack of understanding of science, technologyor biotechnology. People who had heard or read a great deal about genetic engineering were noless likely than others to agree that "it would be better if we could not do genetic engineering." Similarly, 28 percent of people who said they had a very good understanding of science andtechnology strongly agreed that we have "no business meddling with nature."
Only about 15 percent of the public agree that we have no business meddling with natureand that it would be better if we did not know about genetic engineering (Table 5). Over half thepeople in New Jersey (56 percent) disagree with both statements. Interestingly, almost one-in-fivepeople agrees that "we have no business meddling with nature" but disagreed that "it would bebetter if we did not know how to do genetic engineering at all" (see Table 5).
23
Biotechnology attitudes survey - New Jersey, 1993
Table 4a: It would be better if we didn't know about genetic engineering____________________________________________________________________________________________________________
Question (26d): It would be better if we did not know how to do genetic engineering at all.Do you agree or disagree?
____________________________________________________________________________________________________________Strongly Mildly Mildly Strongly Not Sure Refusedagree agree disagree disagree
______________________________________________________________________________
604a
12% 7% 27% 50% 3% <1____________________________________________________________________________________________________________
SexMale 302 14 6 20 58 3 <1Female 302 11 8 34 43 4 <1
Education< High school 42 27 12 28 28 5 -High school grad 169 15 7 31 42 4 1Some college 133 3 7 23 65 2 -College grad 257 6 2 25 66 1 <1
Party affiliationDemocrat 256 16 7 29 47 <1 <1Independent 68 14 9 17 48 11 1Republican 262 8 6 29 55 2 <1Don't know 9 10 - 19 63 8 -Refused 9 19 20 7 25 30 -
ReligionCatholic 270 15 7 25 49 4 <1Protestant 142 8 5 31 53 3 -Jewish 42 5 3 21 69 2 -Other 122 14 7 30 47 2 1None 15 8 11 31 51 - -Don't know/refused 13 12 17 7 43 21 -
Heard of genetic engineeringGreat deal 69 12 7 9 70 1 2Some 260 5 4 26 62 3 <1Not much 180 17 5 36 41 2 -Nothing at all 92 18 15 24 35 8 <1Not sure 3 35 27 - 38 - -
Understanding of science& TechnologyVery good 167 13 6 19 58 3 -Adequate 327 11 6 29 50 4 <1Poor 106 15 9 32 41 2 <1Not sure 3 - - 18 82 - -Refused 1 - - - 100 - -
Approve of geneticengineering of plantsApprove 406 4 6 23 64 3 <1Disapprove 154 30 11 30 27 2 <1Not sure 40 5 2 48 28 15 2Refused 4 - - 19 81 - -
Approve of geneticengineering of animalsApprove 186 2 4 15 76 3 -Disapprove 366 17 8 32 38 3 <1Not sure 45 7 4 23 59 6 1Refused 7 - - 36 64 - -____________________________________________________________________________________________________________
aPercentages are presented as weighted sample estimates. The unweighted sample base is presented inthe first column so that sampling variances for these estimates can be calculated.
24
Biotechnology attitudes survey - New Jersey, 1993
Table 4b: We have no business meddling with nature____________________________________________________________________________________________________________
Question (26g): We have no business meddling with nature. Do you agree or disagree?____________________________________________________________________________________________________________
Strongly Mildly Mildly Strongly Not Sure Refusedagree agree disagree disagree
______________________________________________________________________________
604a
27% 13% 28% 31% 2% -____________________________________________________________________________________________________________
SexMale 302 26 9 26 37 1Female 302 28 17 29 24 2
Education< High school 42 48 12 16 25 -High school grad 169 33 17 23 24 3Some college 133 14 15 35 35 2College grad 257 14 8 37 41 <1
Party affiliationDemocrat 256 31 12 28 29 1Independent 68 31 14 20 35 -Republican 262 21 14 30 33 2Don't know 9 21 31 12 29 8Refused 9 48 - 36 16 -
ReligionCatholic 270 28 17 28 26 2Protestant 142 23 9 31 37 -Jewish 42 9 5 35 51 -Other 122 33 13 21 30 3None 15 17 11 28 44 -Don't know/refused 13 33 - 36 23 9
Heard of genetic engineeringGreat deal 69 13 3 34 50 -Some 260 17 14 30 40 -Not much 180 33 14 29 22 2Nothing at all 92 43 14 20 19 4Not sure 3 65 35 - - -
Understanding of science& TechnologyVery good 167 28 9 26 36 1Adequate 327 26 14 28 30 2Poor 106 29 16 29 25 2Not sure 3 18 - - 82 -Refused 1 - - - 100 -
Approve of geneticengineering of plantsApprove 406 12 12 35 40 1Disapprove 154 56 14 15 13 1Not sure 40 32 19 24 20 6Refused 4 - 19 - 81 -
Approve of geneticengineering of animalsApprove 186 11 5 27 57 -Disapprove 366 36 17 26 19 2Not sure 45 7 7 42 35 9Refused 7 - 16 20 64 -_____________________________________________________________________________________________________________
aPercentages are presented as weighted sample estimates. The unweighted sample base is presented in thefirst column so that sampling variances for these estimates can be calculated.

25
Biotechnology attitudes survey - New Jersey, 1993
Table 5: Comparison of opinions about genetic engineering and meddling with natureQuestion (26d): It would be better if we did not know how to dogenetic engineering at all________________________________________________________________
Agree Disagree____________________________________________________________________________________________________Question (26g): We have no businessmeddling with nature______________________________________
Agree 15 24
Disagree 5 56____________________________________________________________________________________________________Based on weighted data
Acceptance of genetically engineered productsThe survey also examined whether public acceptance of the application of biotechnology
differs with regard to specific products. Twelve potential uses of genetic engineering werepresented to survey participants in random order. In each case respondents were asked: Based onwhat you know, do you approve or disapprove of scientists using genetic engineering to create(ITEM)?
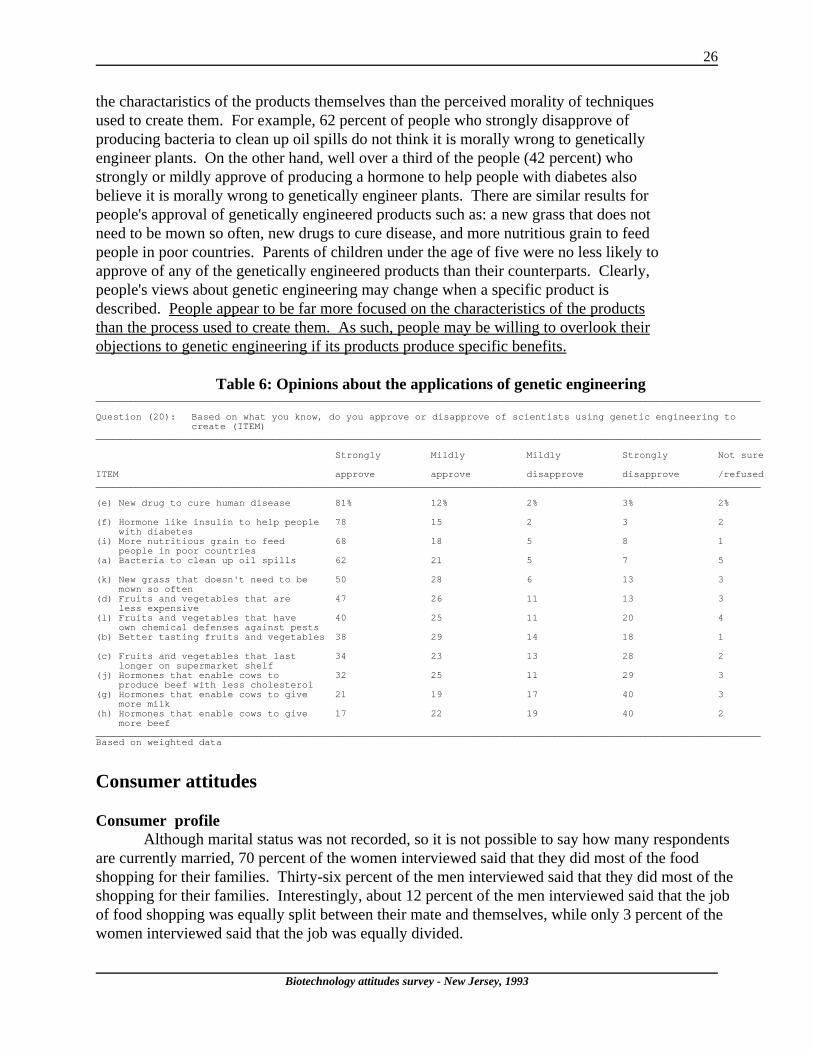
As indicated in Table 6 there was majority support for ten of the twelve items. Support was givenfor products related to:
! human health and welfare (items b, e, f, i, j),! saving money or time (items c, d, k), or ! the environment (items a, l).
The strongest support was given to items regarding human health. For example,most of the population of New Jersey strongly (81 percent) or mildly (12 percent)approves of creating new drugs to cure human diseases. A similar proportion of thepopulation supports the creation of hormones like insulin that help people with diabetes. There is also strong support (68 percent) for genetically engineering "more nutritiousgrain that could feed people in poor countries." New Jersey's residents would alsowelcome genetically engineered bacteria that can help clean up oil spills.
However, most of the population in New Jersey is against developing geneticallyengineered hormones that can help cows produce more milk or beef. In fact, about fourout of every ten New Jersey residents strongly oppose the development of such hormonesusing genetic engineering. This may indicate concern about the effect of these hormoneson human health or the disapproval of any manipulation of animals. The population'sambivalence about genetically engineering a hormone to produce beef with lesscholesterol (item j) may reflect both concerns about health (less cholesterol in one's diet)and concerns about the perceived risks to food safety associated with injecting cows witha hormone. There also was a polarization of views (as indicated in Table 6) with peopleeither strongly approving or disapproving of a particular product. Acceptance of differentbiotechnology products appears to be influenced both by considerations of personalbenefits or risks (especially food safety) and humanitarian goals.
Acceptance of genetically engineered products appears to be influenced more by
26
Biotechnology attitudes survey - New Jersey, 1993
the charactaristics of the products themselves than the perceived morality of techniquesused to create them. For example, 62 percent of people who strongly disapprove ofproducing bacteria to clean up oil spills do not think it is morally wrong to geneticallyengineer plants. On the other hand, well over a third of the people (42 percent) whostrongly or mildly approve of producing a hormone to help people with diabetes alsobelieve it is morally wrong to genetically engineer plants. There are similar results forpeople's approval of genetically engineered products such as: a new grass that does notneed to be mown so often, new drugs to cure disease, and more nutritious grain to feedpeople in poor countries. Parents of children under the age of five were no less likely toapprove of any of the genetically engineered products than their counterparts. Clearly,people's views about genetic engineering may change when a specific product isdescribed. People appear to be far more focused on the characteristics of the productsthan the process used to create them. As such, people may be willing to overlook theirobjections to genetic engineering if its products produce specific benefits.
Table 6: Opinions about the applications of genetic engineering____________________________________________________________________________________________________________________
Question (20): Based on what you know, do you approve or disapprove of scientists using genetic engineering tocreate (ITEM)
____________________________________________________________________________________________________________________
Strongly Mildly Mildly Strongly Not sure
ITEM approve approve disapprove disapprove /refused____________________________________________________________________________________________________________________
(e) New drug to cure human disease 81% 12% 2% 3% 2%
(f) Hormone like insulin to help people 78 15 2 3 2with diabetes
(i) More nutritious grain to feed 68 18 5 8 1people in poor countries
(a) Bacteria to clean up oil spills 62 21 5 7 5
(k) New grass that doesn't need to be 50 28 6 13 3mown so often
(d) Fruits and vegetables that are 47 26 11 13 3less expensive
(l) Fruits and vegetables that have 40 25 11 20 4own chemical defenses against pests
(b) Better tasting fruits and vegetables 38 29 14 18 1
(c) Fruits and vegetables that last 34 23 13 28 2longer on supermarket shelf
(j) Hormones that enable cows to 32 25 11 29 3produce beef with less cholesterol
(g) Hormones that enable cows to give 21 19 17 40 3more milk
(h) Hormones that enable cows to give 17 22 19 40 2more beef
____________________________________________________________________________________________________________________Based on weighted data
Consumer attitudes
Consumer profileAlthough marital status was not recorded, so it is not possible to say how many respondents
are currently married, 70 percent of the women interviewed said that they did most of the foodshopping for their families. Thirty-six percent of the men interviewed said that they did most of theshopping for their families. Interestingly, about 12 percent of the men interviewed said that the jobof food shopping was equally split between their mate and themselves, while only 3 percent of thewomen interviewed said that the job was equally divided.

27
Biotechnology attitudes survey - New Jersey, 1993
Thirty-five percent of those interviewed said that they had children under the age oftwenty-one. Seventeen percent said that they had at least one child under the age of five. One-in-five (20 percent) of the respondents said that someone in their family had a food allergy.
Nearly 6 percent of the population reports belonging to a consumer organization. Thosemost likely to belong to such organizations were both better educated and in either the 25-29 or the50-59 age ranges. Similarly, about 9 percent report belonging to an environmental organization. Contrary to popular stereotypes, those who reported belonging to these organizations were morelikely to be in their 40's and 50's rather than in their 20's and 30's.
About one-in-four of New Jersey's residents (24 percent) say they sometimes shop in"natural" or "organic" food stores, and about half (49 percent) of the population reports having seenfresh fruits or vegetables labeled "organic" or "pesticide free" in the places where they normallyshop. Not surprisingly, most of the population in New Jersey feels that it is very important (37percent) or somewhat important (37 percent) that the fruits and vegetables they eat are grownorganically. However, nearly 67 percent say that most, if not all of the produce in the stores wherethey normally shop has been treated with pesticides at some point. Only two and one-half percentsaid that none of the produce in the stores where they shop was treated with pesticides.
Organic maybe, but not natural.Given the apparent interest in organically grown fruits and vegetables, responses to
statements about whether genetically engineered food could be considered "organic" or "natural"are particularly interesting. Most of the population (85 percent) agrees that "growing geneticallyengineered plants that contain higher levels of naturally occurring chemicals that protect againstpests and disease is better than using pesticides." However, while a majority (55 percent) of thosesurveyed agreed that "food that is produced from genetically engineered plants that contain higherlevels of naturally occurring chemicals that protect against pests and disease should be consideredorganic," a similar proportion (54 percent) agreed that food produced from such plants should notbe sold in 'natural' food stores. More than nine out of ten (91 percent) of those who agree that suchgenetically engineered food should be considered organic also agree that this food should not besold in natural food stores. This suggests that while most people see potential "organic" benefitsfrom the genetic engineering of fruits and vegetables, they clearly do not see such products as"natural." Further research may identify which attribute, "natural" or "organic" is most important toconsumers.
There is an interesting relationship between the importance of organic produce to peopleand whether they think genetically engineered plants that resist pests are better than plants exposedto pesticides. The less important organic produce is to people, the more likely they are to agree thatgenetic engineering is better than pesticides in protecting plants against pests. For example, 91percent of those who said that organic produce was not at all important to them agreed that geneticengineering was better than using pesticides. In comparison, only 79 percent of those who saidorganic produce was very important to them felt the same way. This trend was reflected in whetherpeople thought genetically engineered food could be considered organic or whether it should besold in natural food stores. The less important that organic food was to people, the more likely theywere to see genetically engineered food as organic and the less likely they were to agree that this
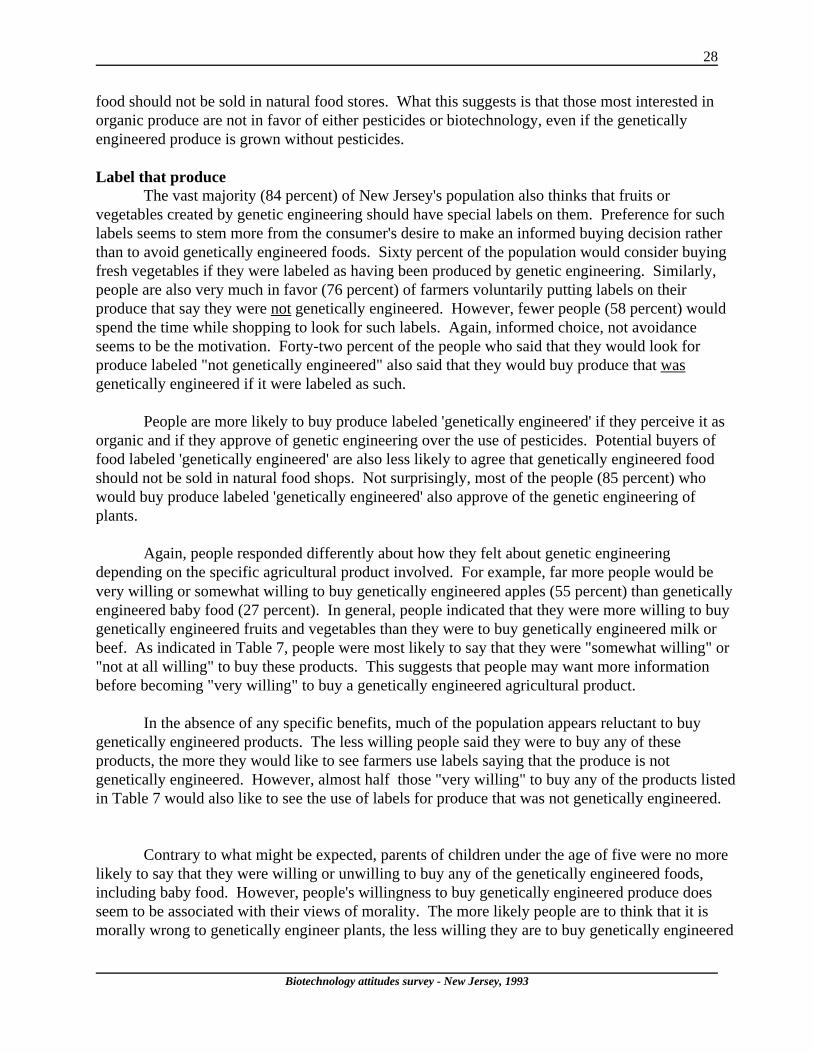
28
Biotechnology attitudes survey - New Jersey, 1993
food should not be sold in natural food stores. What this suggests is that those most interested inorganic produce are not in favor of either pesticides or biotechnology, even if the geneticallyengineered produce is grown without pesticides.
Label that produceThe vast majority (84 percent) of New Jersey's population also thinks that fruits or
vegetables created by genetic engineering should have special labels on them. Preference for suchlabels seems to stem more from the consumer's desire to make an informed buying decision ratherthan to avoid genetically engineered foods. Sixty percent of the population would consider buyingfresh vegetables if they were labeled as having been produced by genetic engineering. Similarly,people are also very much in favor (76 percent) of farmers voluntarily putting labels on theirproduce that say they were not genetically engineered. However, fewer people (58 percent) wouldspend the time while shopping to look for such labels. Again, informed choice, not avoidanceseems to be the motivation. Forty-two percent of the people who said that they would look forproduce labeled "not genetically engineered" also said that they would buy produce that wasgenetically engineered if it were labeled as such.
People are more likely to buy produce labeled 'genetically engineered' if they perceive it asorganic and if they approve of genetic engineering over the use of pesticides. Potential buyers offood labeled 'genetically engineered' are also less likely to agree that genetically engineered foodshould not be sold in natural food shops. Not surprisingly, most of the people (85 percent) whowould buy produce labeled 'genetically engineered' also approve of the genetic engineering ofplants.
Again, people responded differently about how they felt about genetic engineeringdepending on the specific agricultural product involved. For example, far more people would bevery willing or somewhat willing to buy genetically engineered apples (55 percent) than geneticallyengineered baby food (27 percent). In general, people indicated that they were more willing to buygenetically engineered fruits and vegetables than they were to buy genetically engineered milk orbeef. As indicated in Table 7, people were most likely to say that they were "somewhat willing" or"not at all willing" to buy these products. This suggests that people may want more informationbefore becoming "very willing" to buy a genetically engineered agricultural product.
In the absence of any specific benefits, much of the population appears reluctant to buygenetically engineered products. The less willing people said they were to buy any of theseproducts, the more they would like to see farmers use labels saying that the produce is notgenetically engineered. However, almost half those "very willing" to buy any of the products listedin Table 7 would also like to see the use of labels for produce that was not genetically engineered.
Contrary to what might be expected, parents of children under the age of five were no morelikely to say that they were willing or unwilling to buy any of the genetically engineered foods,including baby food. However, people's willingness to buy genetically engineered produce doesseem to be associated with their views of morality. The more likely people are to think that it ismorally wrong to genetically engineer plants, the less willing they are to buy genetically engineered
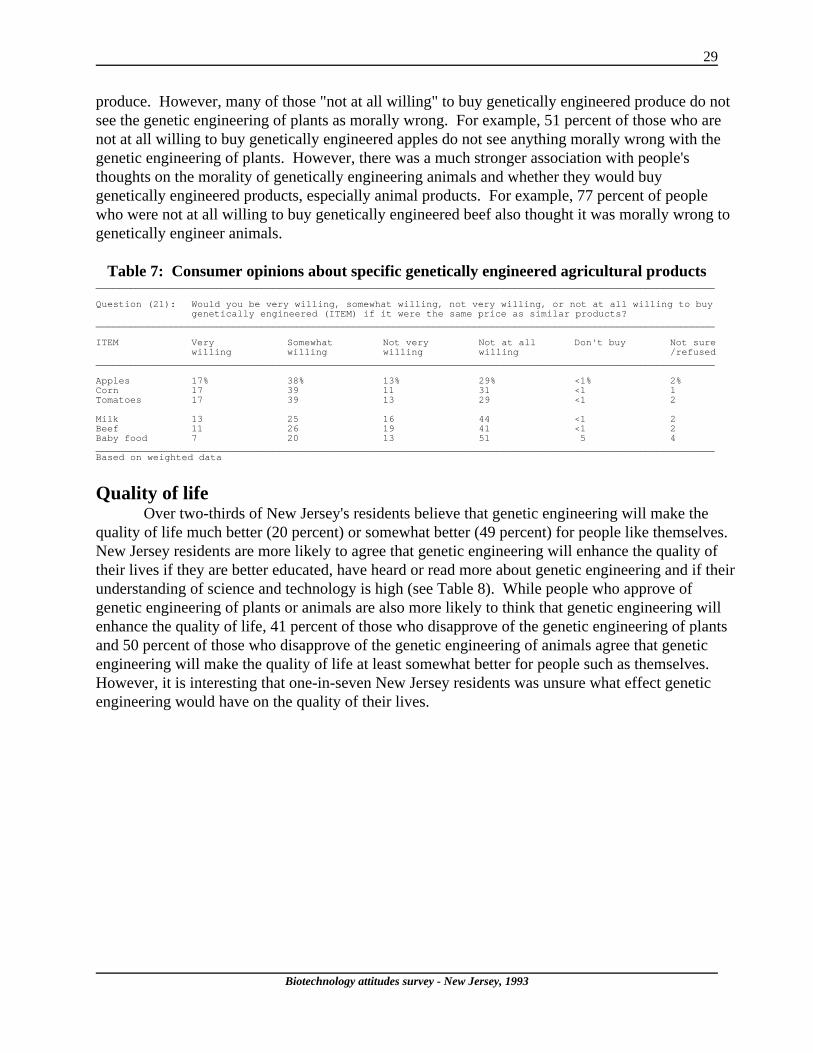
29
Biotechnology attitudes survey - New Jersey, 1993
produce. However, many of those "not at all willing" to buy genetically engineered produce do notsee the genetic engineering of plants as morally wrong. For example, 51 percent of those who arenot at all willing to buy genetically engineered apples do not see anything morally wrong with thegenetic engineering of plants. However, there was a much stronger association with people'sthoughts on the morality of genetically engineering animals and whether they would buygenetically engineered products, especially animal products. For example, 77 percent of peoplewho were not at all willing to buy genetically engineered beef also thought it was morally wrong togenetically engineer animals.
Table 7: Consumer opinions about specific genetically engineered agricultural products____________________________________________________________________________________________________________
Question (21): Would you be very willing, somewhat willing, not very willing, or not at all willing to buygenetically engineered (ITEM) if it were the same price as similar products?
____________________________________________________________________________________________________________
ITEM Very Somewhat Not very Not at all Don't buy Not surewilling willing willing willing /refused
____________________________________________________________________________________________________________
Apples 17% 38% 13% 29% <1% 2%Corn 17 39 11 31 <1 1Tomatoes 17 39 13 29 <1 2
Milk 13 25 16 44 <1 2Beef 11 26 19 41 <1 2Baby food 7 20 13 51 5 4____________________________________________________________________________________________________________Based on weighted data
Quality of lifeOver two-thirds of New Jersey's residents believe that genetic engineering will make the
quality of life much better (20 percent) or somewhat better (49 percent) for people like themselves. New Jersey residents are more likely to agree that genetic engineering will enhance the quality oftheir lives if they are better educated, have heard or read more about genetic engineering and if theirunderstanding of science and technology is high (see Table 8). While people who approve ofgenetic engineering of plants or animals are also more likely to think that genetic engineering willenhance the quality of life, 41 percent of those who disapprove of the genetic engineering of plantsand 50 percent of those who disapprove of the genetic engineering of animals agree that geneticengineering will make the quality of life at least somewhat better for people such as themselves. However, it is interesting that one-in-seven New Jersey residents was unsure what effect geneticengineering would have on the quality of their lives.
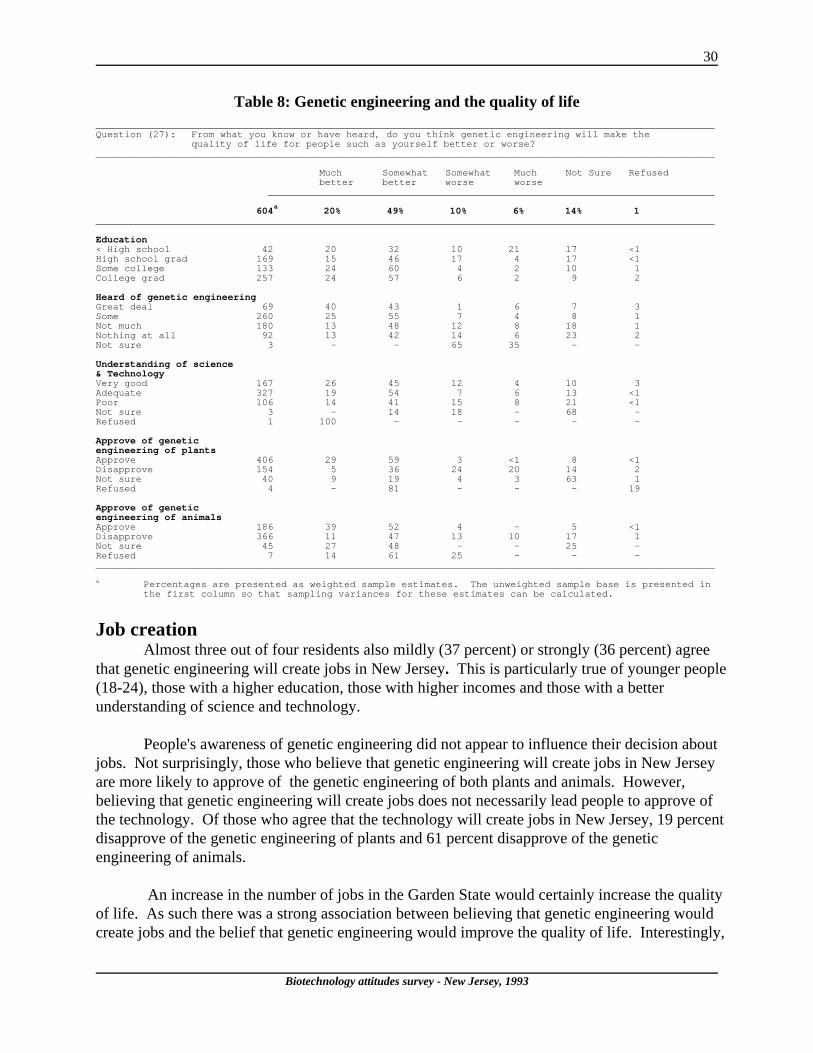
30
Biotechnology attitudes survey - New Jersey, 1993
Table 8: Genetic engineering and the quality of life____________________________________________________________________________________________________________Question (27): From what you know or have heard, do you think genetic engineering will make the
quality of life for people such as yourself better or worse?____________________________________________________________________________________________________________
Much Somewhat Somewhat Much Not Sure Refusedbetter better worse worse
______________________________________________________________________________
604a
20% 49% 10% 6% 14% 1____________________________________________________________________________________________________________
Education< High school 42 20 32 10 21 17 <1High school grad 169 15 46 17 4 17 <1Some college 133 24 60 4 2 10 1College grad 257 24 57 6 2 9 2
Heard of genetic engineeringGreat deal 69 40 43 1 6 7 3Some 260 25 55 7 4 8 1Not much 180 13 48 12 8 18 1Nothing at all 92 13 42 14 6 23 2Not sure 3 - - 65 35 - -
Understanding of science& TechnologyVery good 167 26 45 12 4 10 3Adequate 327 19 54 7 6 13 <1Poor 106 14 41 15 8 21 <1Not sure 3 - 14 18 - 68 -Refused 1 100 - - - - -
Approve of geneticengineering of plantsApprove 406 29 59 3 <1 8 <1Disapprove 154 5 36 24 20 14 2Not sure 40 9 19 4 3 63 1Refused 4 - 81 - - - 19
Approve of geneticengineering of animalsApprove 186 39 52 4 - 5 <1Disapprove 366 11 47 13 10 17 1Not sure 45 27 48 - - 25 -Refused 7 14 61 25 - - -____________________________________________________________________________________________________________
a Percentages are presented as weighted sample estimates. The unweighted sample base is presented inthe first column so that sampling variances for these estimates can be calculated.
Job creationAlmost three out of four residents also mildly (37 percent) or strongly (36 percent) agree
that genetic engineering will create jobs in New Jersey. This is particularly true of younger people(18-24), those with a higher education, those with higher incomes and those with a betterunderstanding of science and technology.
People's awareness of genetic engineering did not appear to influence their decision aboutjobs. Not surprisingly, those who believe that genetic engineering will create jobs in New Jerseyare more likely to approve of the genetic engineering of both plants and animals. However,believing that genetic engineering will create jobs does not necessarily lead people to approve ofthe technology. Of those who agree that the technology will create jobs in New Jersey, 19 percentdisapprove of the genetic engineering of plants and 61 percent disapprove of the geneticengineering of animals.
An increase in the number of jobs in the Garden State would certainly increase the qualityof life. As such there was a strong association between believing that genetic engineering wouldcreate jobs and the belief that genetic engineering would improve the quality of life. Interestingly,
31
Biotechnology attitudes survey - New Jersey, 1993
there was no association between the belief that genetic engineering would create jobs in the Stateand income or political ideology or party affiliation.
Perceived risksAbout half of New Jersey's residents mildly or strongly agree that the risks of genetic
engineering have been greatly exaggerated. This is particularly true for younger people (18-24),better educated people, those with higher incomes, people who have read or heard more aboutgenetic engineering and those with a greater understanding of science and technology. However, athird of the people who rated their understanding of science and technology as very good alsodisagreed that the risks of genetic engineering had been exaggerated. A similar proportion of thosewho approve of the genetic engineering of plants or animals do not believe the risks have beenexaggerated. Many people (15 percent) said that they were not sure whether the risks had beenexaggerated or not.
Concern about regulation of biotechnologyAlthough most of the population in New Jersey is accepting of biotechnology research and
some of its potential products, they are also clearly in favor of close government control over thisresearch. This concern regarding likely food products may be related to a general concern about theuse of science and technology in producing food. More than eight in ten people are very concerned(40 percent) or somewhat concerned (41 percent) about government regulations of science andtechnology in producing food. Those most likely to be "very concerned" are women, those withless education, and people who consider themselves politically to be moderates. Almost two-thirdsof the population strongly agrees (44 percent) or mildly agrees (21 percent) that "the potentialdanger from genetic engineering is so great that strict regulations are necessary." Only 28 percenteither mildly or strongly disagree with this statement.
Almost two-thirds of the population (63 percent) also disagreed with the statement that"scientists in this country know what they are doing, so only moderate regulations on geneticengineering are probably necessary." Interestingly, scientists, engineers and those who said thatthey belonged to scientific organizations were no more likely to agree with this statement than non-scientists. Those in consumer and environmental groups were no more likely to disagree with thisstatement.
Clearly, there is general support for regulation of biotechnology. Even 63 percent of thosewho believe that the risks of genetic engineering have been exaggerated also believe that strictregulations are necessary. People most likely to support strict regulations are both younger (18-24)and older (60+) people, those with less education, people with a liberal political ideology, thosewho disapprove of genetic engineering of either plants or animals, and people who have heard agreat deal about genetic engineering (see Table 9). Interestingly, 58 percent of the people whoagreed that "scientists in this country know what they are doing, so only moderate regulations ongenetic engineering are necessary," also agreed that strict regulations of genetic engineering arenecessary.
While people are clearly in favor of government regulation, there is also majority agreement(57 percent) with the statement "unjustified fears about genetic engineering have seriously blocked
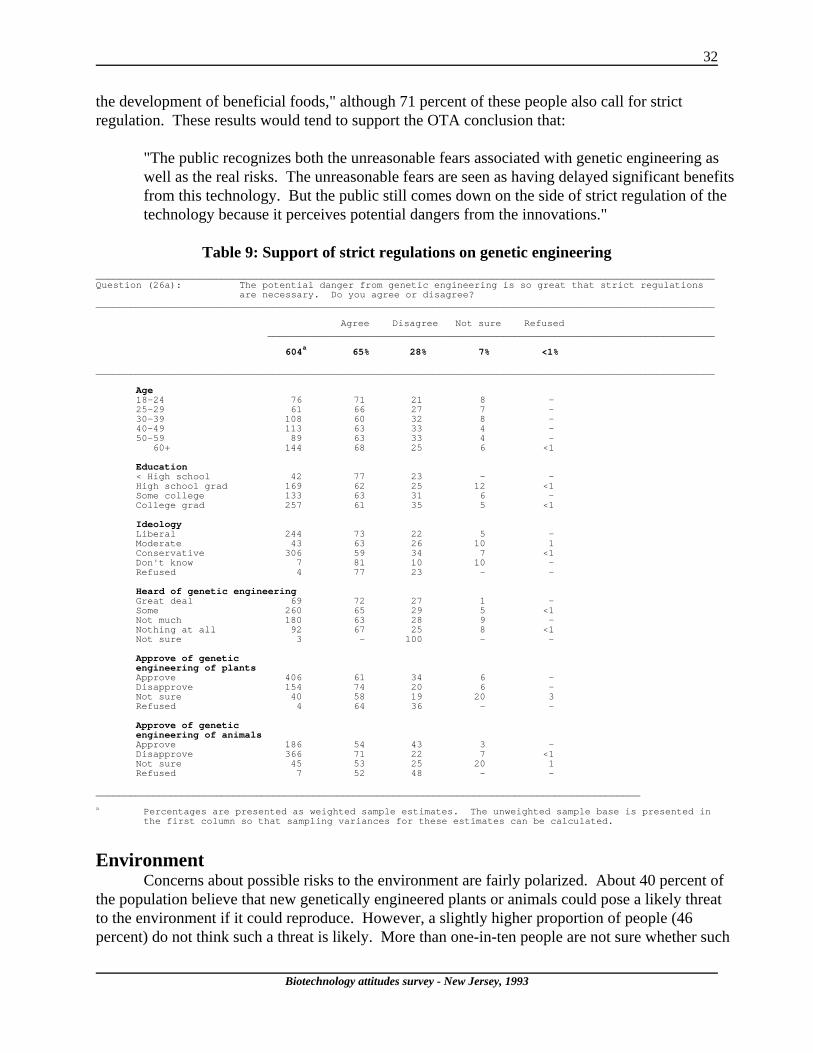
32
Biotechnology attitudes survey - New Jersey, 1993
the development of beneficial foods," although 71 percent of these people also call for strictregulation. These results would tend to support the OTA conclusion that:
"The public recognizes both the unreasonable fears associated with genetic engineering aswell as the real risks. The unreasonable fears are seen as having delayed significant benefitsfrom this technology. But the public still comes down on the side of strict regulation of thetechnology because it perceives potential dangers from the innovations."
Table 9: Support of strict regulations on genetic engineering____________________________________________________________________________________________________________Question (26a): The potential danger from genetic engineering is so great that strict regulations
are necessary. Do you agree or disagree?____________________________________________________________________________________________________________
Agree Disagree Not sure Refused______________________________________________________________________________
604a
65% 28% 7% <1%
____________________________________________________________________________________________________________
Age18-24 76 71 21 8 -25-29 61 66 27 7 -30-39 108 60 32 8 -40-49 113 63 33 4 -50-59 89 63 33 4 -
60+ 144 68 25 6 <1
Education< High school 42 77 23 - -High school grad 169 62 25 12 <1Some college 133 63 31 6 -College grad 257 61 35 5 <1
IdeologyLiberal 244 73 22 5 -Moderate 43 63 26 10 1Conservative 306 59 34 7 <1Don't know 7 81 10 10 -Refused 4 77 23 - -
Heard of genetic engineeringGreat deal 69 72 27 1 -Some 260 65 29 5 <1Not much 180 63 28 9 -Nothing at all 92 67 25 8 <1Not sure 3 - 100 - -
Approve of geneticengineering of plantsApprove 406 61 34 6 -Disapprove 154 74 20 6 -Not sure 40 58 19 20 3Refused 4 64 36 - -
Approve of geneticengineering of animalsApprove 186 54 43 3 -Disapprove 366 71 22 7 <1Not sure 45 53 25 20 1Refused 7 52 48 - -
_______________________________________________________________________________________________
a Percentages are presented as weighted sample estimates. The unweighted sample base is presented inthe first column so that sampling variances for these estimates can be calculated.
EnvironmentConcerns about possible risks to the environment are fairly polarized. About 40 percent of
the population believe that new genetically engineered plants or animals could pose a likely threatto the environment if it could reproduce. However, a slightly higher proportion of people (46percent) do not think such a threat is likely. More than one-in-ten people are not sure whether such

33
Biotechnology attitudes survey - New Jersey, 1993
a threat is likely or not likely, suggesting they would like further information before deciding.
Those who belong to environmental groups believe that the threat to the environment fromgenetically engineered plants or animals is more likely than those not affiliated with such groups. This was not true of those who belong to consumer or scientific groups, however. Similarly, thosewhose occupation involves growing food or the medical profession did not think the threat to theenvironment is any more or less likely than those not in those professions. However, those whoprepare or sell food believe that such a threat is more likely and those who are scientists orengineers believe that such a threat is less likely than those who are not members of theseprofessions.
Siting of researchOne interesting test of how
people really feel about the dangers ofbiotechnology research is reflected inwhat people would think if it were donein their community. As mentionedpreviously, most people think thatgenetic engineering will create jobs (65percent) and improve the quality of life(69 percent). It follows then, that mostpeople would be likely to favor a newgenetic engineering laboratory or farmtest site in their local community. Thesurvey showed that most of New Jersey'sresidents approved of such facilities nomatter where they were located (seeFigure 11). However, the closer alaboratory or farm test site was to the local community, the less support there was. Interestingly,there was little difference in the rates of approval or disapproval, whether the research facility was arelatively closed laboratory or relatively open field testing on a farm.
Credibility of "expert" sources of informationThe nature and degree of risk in applying new technology is rarely agreed upon. With
increasing debate about the issues surrounding new biotechnology, the public frequently wonderswho can be believed or trusted. The 1987 OTA survey found that the public is most likely tobelieve risk statements made by university scientists and less inclined to believe statements madeby federal agencies, public interest groups, local officials, companies making the product or newsmedia. The results of this survey backs up these results (see Table 10) with scientists being themost credible and companies that make genetically engineered products being the least credible. Local farmers and environmental groups are also far more likely to be believed than state or federalgovernment agencies. This apparent lack of belief in government agencies could prove problematicin future debates about the regulation of biotechnology.
Scientists and engineers are more likely to believe statements made by university scientists
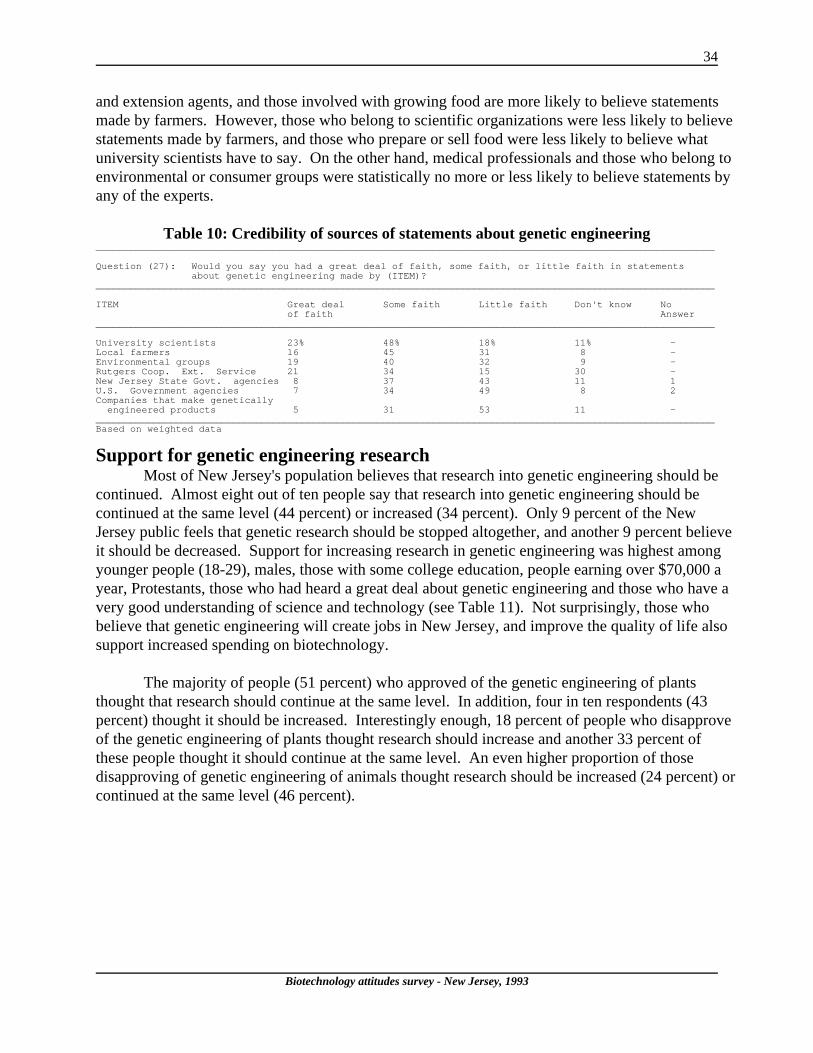
34
Biotechnology attitudes survey - New Jersey, 1993
and extension agents, and those involved with growing food are more likely to believe statementsmade by farmers. However, those who belong to scientific organizations were less likely to believestatements made by farmers, and those who prepare or sell food were less likely to believe whatuniversity scientists have to say. On the other hand, medical professionals and those who belong toenvironmental or consumer groups were statistically no more or less likely to believe statements byany of the experts.
Table 10: Credibility of sources of statements about genetic engineering____________________________________________________________________________________________________________
Question (27): Would you say you had a great deal of faith, some faith, or little faith in statementsabout genetic engineering made by (ITEM)?
____________________________________________________________________________________________________________
ITEM Great deal Some faith Little faith Don't know Noof faith Answer
____________________________________________________________________________________________________________
University scientists 23% 48% 18% 11% -Local farmers 16 45 31 8 -Environmental groups 19 40 32 9 -Rutgers Coop. Ext. Service 21 34 15 30 -New Jersey State Govt. agencies 8 37 43 11 1U.S. Government agencies 7 34 49 8 2Companies that make geneticallyengineered products 5 31 53 11 -
____________________________________________________________________________________________________________Based on weighted data
Support for genetic engineering researchMost of New Jersey's population believes that research into genetic engineering should be
continued. Almost eight out of ten people say that research into genetic engineering should becontinued at the same level (44 percent) or increased (34 percent). Only 9 percent of the NewJersey public feels that genetic research should be stopped altogether, and another 9 percent believeit should be decreased. Support for increasing research in genetic engineering was highest amongyounger people (18-29), males, those with some college education, people earning over $70,000 ayear, Protestants, those who had heard a great deal about genetic engineering and those who have avery good understanding of science and technology (see Table 11). Not surprisingly, those whobelieve that genetic engineering will create jobs in New Jersey, and improve the quality of life alsosupport increased spending on biotechnology.
The majority of people (51 percent) who approved of the genetic engineering of plantsthought that research should continue at the same level. In addition, four in ten respondents (43percent) thought it should be increased. Interestingly enough, 18 percent of people who disapproveof the genetic engineering of plants thought research should increase and another 33 percent ofthese people thought it should continue at the same level. An even higher proportion of thosedisapproving of genetic engineering of animals thought research should be increased (24 percent) orcontinued at the same level (46 percent).
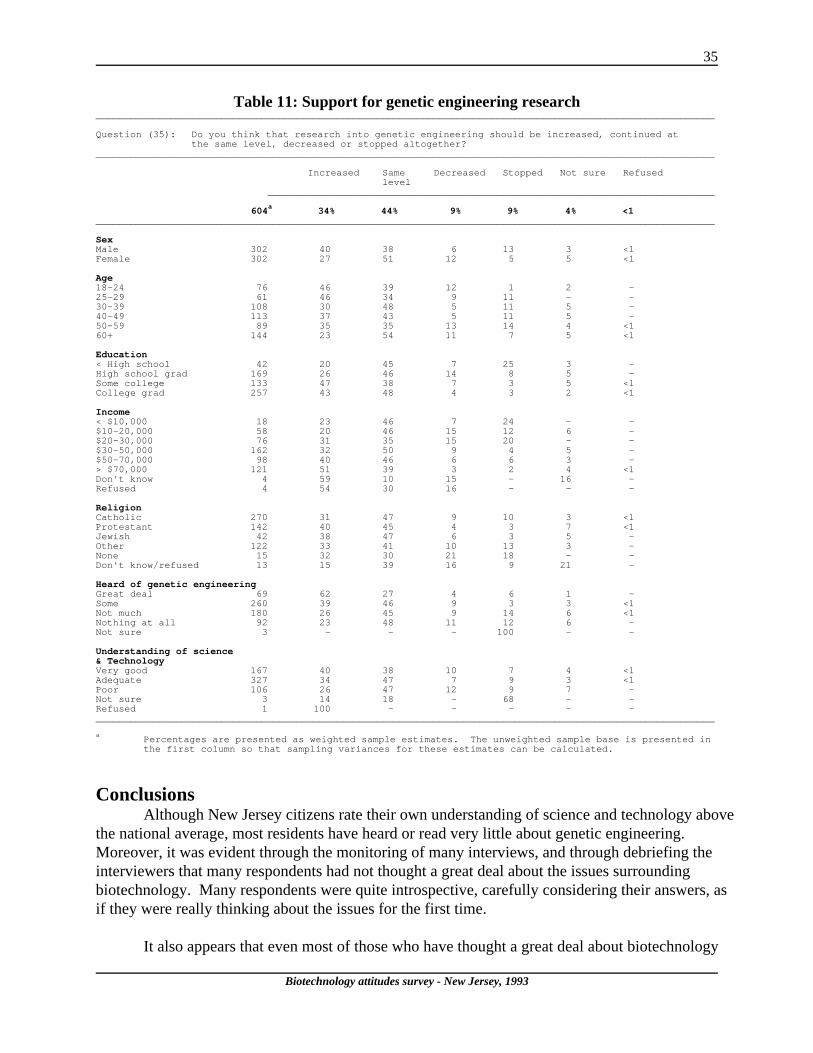
35
Biotechnology attitudes survey - New Jersey, 1993
Table 11: Support for genetic engineering research____________________________________________________________________________________________________________
Question (35): Do you think that research into genetic engineering should be increased, continued atthe same level, decreased or stopped altogether?
____________________________________________________________________________________________________________
Increased Same Decreased Stopped Not sure Refusedlevel
______________________________________________________________________________
604a
34% 44% 9% 9% 4% <1____________________________________________________________________________________________________________
SexMale 302 40 38 6 13 3 <1Female 302 27 51 12 5 5 <1
Age18-24 76 46 39 12 1 2 -25-29 61 46 34 9 11 - -30-39 108 30 48 5 11 5 -40-49 113 37 43 5 11 5 -50-59 89 35 35 13 14 4 <160+ 144 23 54 11 7 5 <1
Education< High school 42 20 45 7 25 3 -High school grad 169 26 46 14 8 5 -Some college 133 47 38 7 3 5 <1College grad 257 43 48 4 3 2 <1
Income< $10,000 18 23 46 7 24 - -$10-20,000 58 20 46 15 12 6 -$20-30,000 76 31 35 15 20 - -$30-50,000 162 32 50 9 4 5 -$50-70,000 98 40 46 6 6 3 -> $70,000 121 51 39 3 2 4 <1Don't know 4 59 10 15 - 16 -Refused 4 54 30 16 - - -
ReligionCatholic 270 31 47 9 10 3 <1Protestant 142 40 45 4 3 7 <1Jewish 42 38 47 6 3 5 -Other 122 33 41 10 13 3 -None 15 32 30 21 18 - -Don't know/refused 13 15 39 16 9 21 -
Heard of genetic engineeringGreat deal 69 62 27 4 6 1 -Some 260 39 46 9 3 3 <1Not much 180 26 45 9 14 6 <1Nothing at all 92 23 48 11 12 6 -Not sure 3 - - - 100 - -
Understanding of science& TechnologyVery good 167 40 38 10 7 4 <1Adequate 327 34 47 7 9 3 <1Poor 106 26 47 12 9 7 -Not sure 3 14 18 - 68 - -Refused 1 100 - - - - -____________________________________________________________________________________________________________
aPercentages are presented as weighted sample estimates. The unweighted sample base is presented inthe first column so that sampling variances for these estimates can be calculated.
ConclusionsAlthough New Jersey citizens rate their own understanding of science and technology above
the national average, most residents have heard or read very little about genetic engineering. Moreover, it was evident through the monitoring of many interviews, and through debriefing theinterviewers that many respondents had not thought a great deal about the issues surroundingbiotechnology. Many respondents were quite introspective, carefully considering their answers, asif they were really thinking about the issues for the first time.
It also appears that even most of those who have thought a great deal about biotechnology
36
Biotechnology attitudes survey - New Jersey, 1993
did not approach the issues in the survey ideologically, but rather individually. For example, manywho disapproved of genetic engineering in the abstract did approve of specific agricultural productscreated through biotechnology. In short, most citizens seem to be in the initial stages of making uptheir minds about this new technology and have not decided that products of agriculturalbiotechnology are universally acceptable or unacceptable.
Much of this suggests that while the battle over biotechnology has raged between experts,most of the shots have passed over the heads of the noncombatants. This will undoubtedly changesoon. As agricultural products developed using biotechnology reach the supermarket, consumerswill be faced with making decisions about real products, not just abstract ideas. Since agriculturalbiotechnology will ultimately survive or perish in the marketplace, both opponents and supportersof biotechnology are expected to intensify their efforts to educate and to influence consumers.
The results of this survey suggest that much education remains to be done and that bothsides in the debate may face difficulties in their efforts. For example, arguments that geneticengineering is the logical extension of traditional crossbreeding techniques will probably be lost onall but the 28 percent of the population who are aware that they have ever eaten a fruit or vegetableproduced through crossbreeding. Similarly, opponents of biotechnology may have difficultyconvincing the 17 percent of the population who believe they are already eating geneticallyengineered produce, that it has had any harmful effect on them.
Proponents may also have a difficult time getting past very negative images evoked by theterm "genetic engineering." They will also have to deal with much of the uncertainty concerningthe safety of biotechnological products and processes. Opponents may have difficulty with peoples'willingness to consider genetically engineered produce as "natural," and their apparent willingnessto buy the products of biotechnology even if they morally object to the process used to create them.
Despite their lack of awareness, most New Jersey residents appear to support geneticengineering research, if it is related to plants or medicine. The majority also believe that geneticengineering will increase the number of jobs in the state and improve the quality of life for peoplelike themselves. The more people had heard or read about genetic engineering, and the greater theirunderstanding of science and technology, the more they supported biotechnology. While it istempting to draw the conclusion from this that more education about science, technology andgenetic engineering would lead to greater consumer acceptance, correlation does not implycausation. That is, people with greater education overall may be more willing to entertain newideas and technologies, and that providing people with specific information about biotechnologymay not have the same effect.
In terms of providing information about biotechnology, New Jersey residents are far moreinclined to believe scientists, local farmers and environmental groups than government agencies orbiotechnology companies. The lack of trust in the two institutions with the greatest resources andresponsibilities for ensuring the safety of agricultural biotechnology must be seen as an importantobstacle to honest discussions about the merits of this new technology. It suggests that governmentagencies and commercial concerns need to take a more proactive role in community discussionsand debates about genetic engineering, especially as they relate to consumer fears and preferences.

37
Biotechnology attitudes survey - New Jersey, 1993
If these institutions are to be perceived as credible concerning biotechnology in the long run, theymust be consistently credible on the issues in the short run.
About half the population believes that the risks of genetic engineering have beenexaggerated, and the majority think that unjustified fears of biotechnology have blocked thedevelopment of beneficial foods. Most would like to see genetic engineering research continued atthe same level or increased. Most would also not object to having a biotechnology researchlaboratory or a field test in their community. Despite this, and their lack of trust in informationprovided by the government, many people are quite uncertain about the risks posed bybiotechnology, and most feel that strict regulations are necessary to ensure the safety ofbiotechnology research.
Most of New Jersey's residents are very opposed to any sort of genetic manipulation ofanimals, either through traditional cross-breeding or genetic engineering. Even many of those whosupport the genetic engineering of plants oppose using biotechnology on animals. This has clearimplications for the introduction of agricultural products produced through genetic engineering. Ifthe general strategy of companies involved in agricultural biotechnology is to achieve initialconsumer acceptance of genetically engineered products, they may achieve greater success if theirfirst offerings appear in the produce section of the supermarket rather than the meat counter.
Wherever the products of agricultural biotechnology appear in the supermarket, most NewJersey consumers want them labeled. Whatever their position on biotechnology, most consumersfavor label information indicating whether a food is the product of biotechnology or not. Consumerchoice seems to be the main motivating factor. Many of those who approve of genetic engineering,and said that they would be willing to buy biotech products thought that providing special labelswould be a good idea. Issues of practicality aside, encouraging such labels would probably bepolitically popular with consumers.
Finally, it appears that most people have not made up their minds about agriculturalbiotechnology. While most people are relatively optimistic about the benefits of the newtechnology, many are quite unsure about its potential risks. As such, they would like strictgovernment controls, to keep such risks in check. They would also like special labels on theproducts of biotechnology, to give consumers more immediate control over their exposure to anypotential risks.
Based on the results of this survey, it appears that many people may ultimately approve of,and perhaps even buy agricultural products produced through biotechnology. But what people saythey believe, and what they will do is not always a reliable measure of what actions people willactually take. Public perceptions of agricultural biotechnology will continue to change, especiallyas genetically engineered products make their way to market. As such, this survey must be seen asa snapshot. It provides some insight, but many unanswered questions. As events unfold, newstudies must be undertaken to help understand and interpret public opinion.
38
Biotechnology attitudes survey - New Jersey, 1993
Survey Methodology
Selection of the Sample
The sample was drawn from the noninstitutionalized civilian population of adults (aged 18and older) in New Jersey. A statewide sample was developed by the Eagleton Poll using thefollowing steps.
The initial stage of sample construction starts with a complete list of all the residentialtelephone exchanges that are in use throughout the State. The list notes the "exchange area" servedby each three-digit telephone exchange, designated by the name of a municipality. All of theexchanges and their associated municipality are arrayed by each of the twenty-one New Jerseycounties, along with the number of residential and business lines currently active for each.
Quotas are then established to decide how many interviews should come from each countyto make up the total sample size. These quotas are equivalent to the county's contribution to thetotal number of New Jersey residents who are aged eighteen or older. The proportions used tocalculate the numerical quotas are based on U.S. census figures.
In the next step, a sample of 600 telephone exchanges is selected, stratified by county. Foreach county, each exchange (or cluster of exchanges) is examined to decide what proportion of allof the county's residential telephone lines go to that exchange. This proportion is used to determinehow many people should be sampled from each exchange to make up the total county quota.
After the sample of three digit telephone exchanges was selected, the remaining four digitswere selected. To accomplish this, for each exchange selected, the current telephone directorylisting that exchange was consulted. A page was then randomly selected from the directory, and thefirst residential phone number beginning with the selected exchange was located. The last twodigits from the last four in that telephone number are used to increase the changes of calling aworking set of numbers in that particular exchange. To randomly complete the number, the last twodigits from the number immediately following on the page are used, whatever its exchange.
When this process is completed, a sample of 600 base numbers is drawn. New samples arecreated by adding one to the last digit in each phone number, generating 600 new numbers. Usingthis process, only the last two digits of the phone number are altered, resulting in a maximum ofninety-nine additional samples.
In the field, interviewers begin with one number. If that number is not workable forwhatever reason, they use their original number generate a new number by adding a one to the thirddigit from the right. This results in a maximum of nine additional numbers that can be tried. If allten of the numbers turn out not to be workable, a new base number is generated using the processoutlined above.
39
Biotechnology attitudes survey - New Jersey, 1993
Study: Biotechnology SurveyMay 11 Draft 6
Interviewer: Date:
Telephone No.: S))))))))))))))))))))))))))))))))))))))))))))))))))))))))))))))))Hello, I'm (first and last name). I'm on the staff of the Eagleton Poll, an I'm taking a public opinion surveyof New Jersey Adults for Rutgers University
1. To begin with, would you rate your own basic understanding of how food is grown and produced as:
Very good . . . . . . . . . . . . . . . . . . . . . . . . . . . . . . . . . . . . . . . . . (01( -1Adequate . . . . . . . . . . . . . . . . . . . . . . . . . . . . . . . . . . . . . . . . . . . . -2Poor . . . . . . . . . . . . . . . . . . . . . . . . . . . . . . . . . . . . . . . . . . . . . . . . -3Not sure . . . . . . . . . . . . . . . . . . . . . . . . . . . . . . . . . . . . . . . . . . . . . -4Refused/No answer . . . . . . . . . . . . . . . . . . . . . . . . . . . . . . . . . . . . -5
2. Would you rate your own basic understanding of science and technology as:
Very good . . . . . . . . . . . . . . . . . . . . . . . . . . . . . . . . . . . . . . . . . (02( -1Adequate . . . . . . . . . . . . . . . . . . . . . . . . . . . . . . . . . . . . . . . . . . . . -2Poor . . . . . . . . . . . . . . . . . . . . . . . . . . . . . . . . . . . . . . . . . . . . . . . . -3Not sure . . . . . . . . . . . . . . . . . . . . . . . . . . . . . . . . . . . . . . . . . . . . . -4Refused/No answer . . . . . . . . . . . . . . . . . . . . . . . . . . . . . . . . . . . . -5
3. How concerned are you about government regulations concerning the use of science and technology in producingfood -- are you very, somewhat, not very, or not concerned at all?
Very concerned . . . . . . . . . . . . . . . . . . . . . . . . . . . . . . . . . . . . (03( -1Somewhat concerned . . . . . . . . . . . . . . . . . . . . . . . . . . . . . . . . . . . -2Not very concerned . . . . . . . . . . . . . . . . . . . . . . . . . . . . . . . . . . . . -3Not at all concerned . . . . . . . . . . . . . . . . . . . . . . . . . . . . . . . . . . . . -4Not sure . . . . . . . . . . . . . . . . . . . . . . . . . . . . . . . . . . . . . . . . . . . . . -5Refused/No answer . . . . . . . . . . . . . . . . . . . . . . . . . . . . . . . . . . . . -6
3a. Is anyone in your family allergic to particular foods?
Yes . . . . . . . . . . . . . . . . . . . . . . . . . . . . . . . . . . . . . . . . . . . . . . (04( -1No . . . . . . . . . . . . . . . . . . . . . . . . . . . . . . . . . . . . . . . . . . . . . . . . . . -2Not sure . . . . . . . . . . . . . . . . . . . . . . . . . . . . . . . . . . . . . . . . . . . . . -3Refused/No answer . . . . . . . . . . . . . . . . . . . . . . . . . . . . . . . . . . . . -4
4a Do you ever shop in "natural" or "organic" food stores?
Yes . . . . . . . . . . . . . . . . . . . . . . . . . . . . . . . . . . . . . . . . . . . . . . (04( -1No . . . . . . . . . . . . . . . . . . . . . . . . . . . . . . . . . . . . . . . . . . . . . . . . . . -2Not sure . . . . . . . . . . . . . . . . . . . . . . . . . . . . . . . . . . . . . . . . . . . . . -3Refused/No answer . . . . . . . . . . . . . . . . . . . . . . . . . . . . . . . . . . . . -4

40
Biotechnology attitudes survey - New Jersey, 1993
4. Have you ever seen fresh fruits or vegetables labeled "organic" or "pesticide free" in the places where younormally shop?
Yes . . . . . . . . . . . . . . . . . . . . . . . . . . . . . . . . . . . . . . . . . . . . . . (04( -1No . . . . . . . . . . . . . . . . . . . . . . . . . . . . . . . . . . . . . . . . . . . . . . . . . . -2Not sure . . . . . . . . . . . . . . . . . . . . . . . . . . . . . . . . . . . . . . . . . . . . . -3Refused/No answer . . . . . . . . . . . . . . . . . . . . . . . . . . . . . . . . . . . . -4
5. In the places where you normally shop, how many of the fresh fruits and vegetables would you say were treatedwith chemicals at some point. Would you say:
All of them . . . . . . . . . . . . . . . . . . . . . . . . . . . . . . . . . . . . . . . . (05( -1Most of them . . . . . . . . . . . . . . . . . . . . . . . . . . . . . . . . . . . . . . . . . -2Some of them . . . . . . . . . . . . . . . . . . . . . . . . . . . . . . . . . . . . . . . . . -3None of them . . . . . . . . . . . . . . . . . . . . . . . . . . . . . . . . . . . . . . . . -4
Not sure . . . . . . . . . . . . . . . . . . . . . . . . . . . . . . . . . . . . . . . . . . . . . -5Refused/No answer . . . . . . . . . . . . . . . . . . . . . . . . . . . . . . . . . . . . -6
6. How important is it that the fruits and vegetables you eat are grown organically, -- is it:
Very important . . . . . . . . . . . . . . . . . . . . . . . . . . . . . . . . . . . . . (06( -1Somewhat important . . . . . . . . . . . . . . . . . . . . . . . . . . . . . . . . . . . -2Not very important . . . . . . . . . . . . . . . . . . . . . . . . . . . . . . . . . . . . . -3Not at all important . . . . . . . . . . . . . . . . . . . . . . . . . . . . . . . . . . . . -4
Not sure . . . . . . . . . . . . . . . . . . . . . . . . . . . . . . . . . . . . . . . . . . . . . -5Refused/No answer . . . . . . . . . . . . . . . . . . . . . . . . . . . . . . . . . . . . -6
10a. To create hybrid plants, the pollen of one variety of plant is used to cross-fertilize another variety. A similarmethod is used to cross-breed varieties of chickens or varieties of cows or varieties of other animals. Have youheard about these methods?
Yes . . . . . . . . . . . . . . . . . . . . . . . . . . . . . . . . . . . . . . . . . . . . . . (17( -1
No . . . . . . . . . . . . . . . . . . . . . . . . . . . . . . . . . . . . . . . . . . . . . . . . . . -2Not sure . . . . . . . . . . . . . . . . . . . . . . . . . . . . . . . . . . . . . . . . . . . . . -3Refused/No answer . . . . . . . . . . . . . . . . . . . . . . . . . . . . . . . . . . . . -4
10b. As far as you know, have you ever eaten a fruit or vegetable created using these methods?
Yes . . . . . . . . . . . . . . . . . . . . . . . . . . . . . . . . . . . . . . . . . . . . . . (18( -1
No . . . . . . . . . . . . . . . . . . . . . . . . . . . . . . . . . . . . . . . . . . . . . . . . . . -2Not sure . . . . . . . . . . . . . . . . . . . . . . . . . . . . . . . . . . . . . . . . . . . . . -3Refused/No answer . . . . . . . . . . . . . . . . . . . . . . . . . . . . . . . . . . . . -4
10c. In general, do you approve or disapprove of creating hybrid plants using these methods?
Approve . . . . . . . . . . . . . . . . . . . . . . . . . . . . . . . . . . . . . . . . . . (19( -1Disapprove . . . . . . . . . . . . . . . . . . . . . . . . . . . . . . . . . . . . . . . . . . . -2Not sure . . . . . . . . . . . . . . . . . . . . . . . . . . . . . . . . . . . . . . . . . . . . . -3Refused/No answer . . . . . . . . . . . . . . . . . . . . . . . . . . . . . . . . . . . . -4
10d. Do you believe that creating hybrid plants using these methods is morally wrong or not?
41
Biotechnology attitudes survey - New Jersey, 1993
Morally wrong . . . . . . . . . . . . . . . . . . . . . . . . . . . . . . . . . . . . . (20( -1Not wrong . . . . . . . . . . . . . . . . . . . . . . . . . . . . . . . . . . . . . . . . . . . -2Depends (Vol.) . . . . . . . . . . . . . . . . . . . . . . . . . . . . . . . . . . . . . . . . -3Not sure . . . . . . . . . . . . . . . . . . . . . . . . . . . . . . . . . . . . . . . . . . . . . -4Refused/No answer . . . . . . . . . . . . . . . . . . . . . . . . . . . . . . . . . . . . -5
10e. In general, do you approve or disapprove of creating hybrid animals using these methods?
Approve . . . . . . . . . . . . . . . . . . . . . . . . . . . . . . . . . . . . . . . . . . (19( -1Disapprove . . . . . . . . . . . . . . . . . . . . . . . . . . . . . . . . . . . . . . . . . . . -2Not sure . . . . . . . . . . . . . . . . . . . . . . . . . . . . . . . . . . . . . . . . . . . . . -3Refused/No answer . . . . . . . . . . . . . . . . . . . . . . . . . . . . . . . . . . . . -4
10f. Do you believe that creating hybrid animals using these methods is morally wrong or not?
Morally wrong . . . . . . . . . . . . . . . . . . . . . . . . . . . . . . . . . . . . . (20( -1Not wrong . . . . . . . . . . . . . . . . . . . . . . . . . . . . . . . . . . . . . . . . . . . -2Depends (Vol.) . . . . . . . . . . . . . . . . . . . . . . . . . . . . . . . . . . . . . . . . -3Not sure . . . . . . . . . . . . . . . . . . . . . . . . . . . . . . . . . . . . . . . . . . . . . -4Refused/No answer . . . . . . . . . . . . . . . . . . . . . . . . . . . . . . . . . . . . -5
11. My next question involves word association. For example, when I mention the word baseball, you might think ofthe World Series, Babe Ruth, summertime, or even hot dogs. Today, I am interested in the first thoughts orimages that come to mind when you think of genetic engineering.
11a. When you think about genetic engineering, what is the first thought or image that comes to mind?(21(
12a. Genetic engineering involves new methods that make it possible for scientists to create new plants and animals bytaking parts of the genes of one plant or animal and inserting them into the cells of another plant or animal. Thisis sometimes called gene splicing or biotechnology. How much have you heard or read about these methods?
A great deal . . . . . . . . . . . . . . . . . . . . . . . . . . . . . . . . . . . . . . . (24( -1Some . . . . . . . . . . . . . . . . . . . . . . . . . . . . . . . . . . . . . . . . . . . . . . . . -2Not much . . . . . . . . . . . . . . . . . . . . . . . . . . . . . . . . . . . . . . . . . . . . -3Nothing at all . . . . . . . . . . . . . . . . . . . . . . . . . . . . . . . . . . . . . . . . . -4Not sure . . . . . . . . . . . . . . . . . . . . . . . . . . . . . . . . . . . . . . . . . . . . . -5Refused/No answer . . . . . . . . . . . . . . . . . . . . . . . . . . . . . . . . . . . . -6
12b. As far as you know, have you ever eaten a fruit or vegetable created using genetic engineering methods?
Yes . . . . . . . . . . . . . . . . . . . . . . . . . . . . . . . . . . . . . . . . . . . . . . (25( -1
No . . . . . . . . . . . . . . . . . . . . . . . . . . . . . . . . . . . . . . . . . . . . . . . . . . -2Not sure . . . . . . . . . . . . . . . . . . . . . . . . . . . . . . . . . . . . . . . . . . . . . -3Refused/No answer . . . . . . . . . . . . . . . . . . . . . . . . . . . . . . . . . . . . -4
42
Biotechnology attitudes survey - New Jersey, 1993
12c. Do you think that fruits or vegetables or other foods created through genetic engineering should have speciallabels on them?
Yes . . . . . . . . . . . . . . . . . . . . . . . . . . . . . . . . . . . . . . . . . . . . . . (26( -1
No . . . . . . . . . . . . . . . . . . . . . . . . . . . . . . . . . . . . . . . . . . . . . . . . . . -2Not sure . . . . . . . . . . . . . . . . . . . . . . . . . . . . . . . . . . . . . . . . . . . . . -3Refused/No answer . . . . . . . . . . . . . . . . . . . . . . . . . . . . . . . . . . . . -4
13. If you were shopping for fresh vegetables and you saw some that were labeled as having been produced usinggenetic engineering, would you consider buying them or not?
Yes, would consider buying . . . . . . . . . . . . . . . . . . . . . . . . . . . (28( -1
No, would not consider buying . . . . . . . . . . . . . . . . . . . . . . . . . . . -2Not sure . . . . . . . . . . . . . . . . . . . . . . . . . . . . . . . . . . . . . . . . . . . . . -3Refused/No answer . . . . . . . . . . . . . . . . . . . . . . . . . . . . . . . . . . . . -4
14. Some farmers might voluntarily start putting labels on their produce that says that the fruits and vegetables werenot genetically engineered. Would you like to have these labels?
Yes . . . . . . . . . . . . . . . . . . . . . . . . . . . . . . . . . . . . . . . . . . . . . . (29( -1No . . . . . . . . . . . . . . . . . . . . . . . . . . . . . . . . . . . . . . . . . . . . . . . . . . -2Not sure . . . . . . . . . . . . . . . . . . . . . . . . . . . . . . . . . . . . . . . . . . . . . -3Refused/No answer . . . . . . . . . . . . . . . . . . . . . . . . . . . . . . . . . . . . -4
15. When you are shopping would you take the time to look for fruits and vegetables that carried labels stating thatthey were not genetically engineered?
Yes . . . . . . . . . . . . . . . . . . . . . . . . . . . . . . . . . . . . . . . . . . . . . . (30( -1
No . . . . . . . . . . . . . . . . . . . . . . . . . . . . . . . . . . . . . . . . . . . . . . . . . . -2Not sure . . . . . . . . . . . . . . . . . . . . . . . . . . . . . . . . . . . . . . . . . . . . . -3Refused/No answer . . . . . . . . . . . . . . . . . . . . . . . . . . . . . . . . . . . . -4
16a. In general, do you approve or disapprove of creating hybrid plants using genetic engineering?
Approve . . . . . . . . . . . . . . . . . . . . . . . . . . . . . . . . . . . . . . . . . . (19( -1Disapprove . . . . . . . . . . . . . . . . . . . . . . . . . . . . . . . . . . . . . . . . . . . -2Not sure . . . . . . . . . . . . . . . . . . . . . . . . . . . . . . . . . . . . . . . . . . . . . -3Refused/No answer . . . . . . . . . . . . . . . . . . . . . . . . . . . . . . . . . . . . -4
16b. Do you believe that creating hybrid plants using these methods is morally wrong or not?
Morally wrong . . . . . . . . . . . . . . . . . . . . . . . . . . . . . . . . . . . . . (20( -1Not wrong . . . . . . . . . . . . . . . . . . . . . . . . . . . . . . . . . . . . . . . . . . . -2Depends (Vol.) . . . . . . . . . . . . . . . . . . . . . . . . . . . . . . . . . . . . . . . . -3Not sure . . . . . . . . . . . . . . . . . . . . . . . . . . . . . . . . . . . . . . . . . . . . . -4Refused/No answer . . . . . . . . . . . . . . . . . . . . . . . . . . . . . . . . . . . . -5
16c. In general, do you approve or disapprove of creating hybrid animals using genetic engineering?
43
Biotechnology attitudes survey - New Jersey, 1993
ROTATE
Approve . . . . . . . . . . . . . . . . . . . . . . . . . . . . . . . . . . . . . . . . . . (19( -1Disapprove . . . . . . . . . . . . . . . . . . . . . . . . . . . . . . . . . . . . . . . . . . . -2Not sure . . . . . . . . . . . . . . . . . . . . . . . . . . . . . . . . . . . . . . . . . . . . . -3Refused/No answer . . . . . . . . . . . . . . . . . . . . . . . . . . . . . . . . . . . . -4
16d. Do you believe that creating hybrid animals using these methods is morally wrong or not?
Morally wrong . . . . . . . . . . . . . . . . . . . . . . . . . . . . . . . . . . . . . (20( -1Not wrong . . . . . . . . . . . . . . . . . . . . . . . . . . . . . . . . . . . . . . . . . . . -2Depends (Vol.) . . . . . . . . . . . . . . . . . . . . . . . . . . . . . . . . . . . . . . . . -3Not sure . . . . . . . . . . . . . . . . . . . . . . . . . . . . . . . . . . . . . . . . . . . . . -4Refused/No answer . . . . . . . . . . . . . . . . . . . . . . . . . . . . . . . . . . . . -5
18. If the new plant or animal produced by genetic engineering could reproduce itself, do you think it would be verylikely, somewhat likely, somewhat unlikely or very unlikely to pose a danger to the environment?
Very likely . . . . . . . . . . . . . . . . . . . . . . . . . . . . . . . . . . . . . . . . (33( -1Somewhat likely . . . . . . . . . . . . . . . . . . . . . . . . . . . . . . . . . . . . . . . -2Somewhat unlikely . . . . . . . . . . . . . . . . . . . . . . . . . . . . . . . . . . . . . -3Very unlikely . . . . . . . . . . . . . . . . . . . . . . . . . . . . . . . . . . . . . . . . . -4Not sure . . . . . . . . . . . . . . . . . . . . . . . . . . . . . . . . . . . . . . . . . . . . . -5Refused/No answer . . . . . . . . . . . . . . . . . . . . . . . . . . . . . . . . . . . . -6
19. How much faith would you have in statements about genetic engineering made by {Read item} ? Wouldyou say: a great deal of faith, some faith, or little faith? If you don't feel you know enough about the agency, justsay you don't know.
.
Great Don't Refused/Deal Some Little Know Answer
a. U.S. Government agencies . . . . . . . . . . . . . . . . (35( -1 -2 -3 -4 -5
d. New Jersey State Government agencies . . . . . . . . . . . (38( -1 -2 -3 -4 -5
e. The Rutgers Cooperative Extension Service . . . . . . . . (39( -1 -2 -3 -4 -5
f. University scientists . . . . . . . . . . . . . . . . (40( -1 -2 -3 -4 -5
g. Local farmers . . . . . . . . . . . . . . . . (41( -1 -2 -3 -4 -5
i. Companies that make genetically engineered products (42( -1 -2 -3 -4 -5
j. Environmental groups . . . . . . . . . . . . . . . . (43( -1 -2 -3 -4 -5

44
Biotechnology attitudes survey - New Jersey, 1993
ROTATE
20. Based on what you know, do you approve or disapprove of scientists using genetic engineering methods to create (READ ITEM) -- PROBE: do you
Strongly Somewhat Somewhat Strongly Not Refused/Approve Approve Disapprove Disapprove Sure No Answer
a. bacteria to clean up oil spills (44( -1 -2 -3 -4 -5 -6
b. better tasting fruits and vegetables (45( -1 -2 -3 -4 -5 -6
c. fruits and vegetables that last longer on a supermarket shelf (46( -1 -2 -3 -4 -5 -6
d. fruits and vegetables that are less expensive (47( -1 -2 -3 -4 -5 -6
e. new drugs to cure human disease (48( -1 -2 -3 -4 -5 -6
f. hormones like insulin that help people with diabetes (49( -1 -2 -3 -4 -5 -6
g. hormones that enable cows to give more milk (50( -1 -2 -3 -4 -5 -6
h. hormones that enable cows to produce more beef (51( -1 -2 -3 -4 -5 -6
i. more nutritious grain that could feed people in poor countries (52( -1 -2 -3 -4 -5 -6
i. hormones that enable cows to produce beef with less cholesterol (53( -1 -2 -3 -4 -5 -6
j. new types of grass that don't need to be mown as often (54( -1 -2 -3 -4 -5 -6
k. fruits and vegetables that have their own chemical defenses against insects (55( -1 -2 -3 -4 -5 -6

45
Biotechnology attitudes survey - New Jersey, 1993
ROTATE
ROTATE
21. How willing would you be to buy genetically engineered {Read Item} if it were the same price as similar products?
Very Somewhat Not Very Not at all Don't Refused/Willing Willing Willing Willing BuyNo Answer Answer
a. Apples (72( -1 -2 -3 -4 -5 -6
b. Corn (73( -1 -2 -3 -4 -5 -6
c. Milk (74( -1 -2 -3 -4 -5 -6
d. Tomatoes (75( -1 -2 -3 -4 -5 -6
e. Beef (76( -1 -2 -3 -4 -5 -6
e. Baby food (76( -1 -2 -3 -4 -5 -6
22. All plants, whether they are genetically engineered or not, contain natural chemicals that help protect them from some pestsand diseases. Using genetic engineering, scientists can grow plants that contain more of those chemicals, so farmers don't have touse as many pesticides. Please tell me whether you tend to agree or disagree with each of the following statements about thesekinds of plants. (READ EACH STATEMENT)
Refused/Agree Disagree Not Sure No Answer
a. Growing genetically engineered plants that contain higher levels of naturally occurring chemicals that protect against pests and disease is better than using pesticides . . . . . . . . . . . . . . . . . . (64( -1 -2 -3 -4
b. Food that is produced from genetically engineered plants that contain higher levels of naturally occurring chemicals that protect against pests and disease should be considered "organic" . . . . . (65( -1 -2 -3 -4
c. Food that is produced from genetically engineered plants that contain higher levelsof naturally occurring chemicals that protect against pests and disease should not be sold in "natural" food stores . . . . . . . . . . . (66( -1 -2 -3 -4
ROTATE Q23 AND Q24 (but maintain order within questions).
23. From what you know about genetic engineering would you approve, or disapprove of a new laboratory that does geneticengineering on plants somewhere in [READ ITEM]
Not Refused/Approve Disapprove Sure no answer
a. The Midwest (67( -1 -2 -5 -6
b. The Northeast (68( -1 -2 -5 -6
c. New Jersey (69( -1 -2 -5 -6
d. Your County (70( -1 -2 -5 -6
e. Your Community (71( -1 -2 -5 -6
24. As part of their research on new plants created using genetic engineering methods, scientists must test them on farms. All
46
Biotechnology attitudes survey - New Jersey, 1993
ROTATE
tests must first be approved by the government and are closely monitored. From what you know about genetic engineering,would you strongly approve, somewhat approve, somewhat disapprove or strongly disapprove if the tests were done on a farmsomewhere in [READ ITEM]
Not Refused/Approve Disapprove Sure no answer
a. The Midwest (72( -1 -2 -5 -6
b. The Northeast (73( -1 -2 -5 -6
c. New Jersey (74( -1 -2 -5 -6
d. Your County (75( -1 -2 -5 -6
e. Your Community (76( -1 -2 -5 -6
26. Now I will read you a few statements. For each, please tell me whether you agree strongly, agree somewhat, disagreesomewhat, or disagree strongly [READ EACH ITEM]
Agree Agree Disagree Disagree Not Refused/Strongly Somewhat Somewhat Strongly Sure No Answer
a. The potential danger from genetic engineering is so great that strict regulations are necessary . . . . . . . . . . . . . . . . (78( -1 -2 -3 -4 -5 -6
b. The risks of genetic engineering have been greatly exaggerated . . . . . . . . . . . . . . . . . (79( -1 -2 -3 -4 -5 -6
c. Genetic engineering will create jobs in our state . . . . . . . . . . . . . . . . . . . . . . . . . . . . (80( -1 -2 -3 -4 -5 -6
d. It would be better if we did not know how to do genetic engineering at all . . . . . . . . . . . . . . . . . . . . . . . . . . . . . . . . . (81( -1 -2 -3 -4 -5 -6
e. Scientists in this country know what they are doing, so only moderate regulations on genetic engineering are probably necessary . .(82( -1 -2 -3 -4 -5 -6
f. Unjustified fears about genetic engineering have seriously blocked the development of beneficial foods (83( -1 -2 -3 -4 -5 -6
g. We have no business meddling with nature (84( -1 -2 -3 -4 -5 -6
27. From what you know or have heard, do you think genetic engineering will make the quality of life for people such as yourself better or worse? Probe:
47
Biotechnology attitudes survey - New Jersey, 1993
Much better . . . . . . . . . . . . . . . . . . . . . . . . . . . . . . . . . . . . . . (85( -1Somewhat better . . . . . . . . . . . . . . . . . . . . . . . . . . . . . . . . . . . . . . . -2Somewhat worse . . . . . . . . . . . . . . . . . . . . . . . . . . . . . . . . . . . . . . -3Much worse . . . . . . . . . . . . . . . . . . . . . . . . . . . . . . . . . . . . . . . . . . -4
Refused/No answer . . . . . . . . . . . . . . . . . . . . . . . . . . . . . . . . . . . . -5
28. Do you think that research into genetic engineering should be increased, continued at the same level, decreased or stoppedaltogether?
Increased . . . . . . . . . . . . . . . . . . . . . . . . . . . . . . . . . . . . . . . . (86( -1Continued at the same level . . . . . . . . . . . . . . . . . . . . . . . . . . . . . . -2Decreased . . . . . . . . . . . . . . . . . . . . . . . . . . . . . . . . . . . . . . . . . . . . -3Stopped altogether . . . . . . . . . . . . . . . . . . . . . . . . . . . . . . . . . . . . . -4
Refused/No answer . . . . . . . . . . . . . . . . . . . . . . . . . . . . . . . . . . . . -5
29. Some reports in the media have suggested that as much as one third of the chicken in U.S. supermarkets may contain bacteriathat can cause food poisoning. Food scientists have developed a way to kill these bacteria using very low levels of radiation. Would you strongly approve, somewhat approve, somewhat disapprove or strongly disapprove of using radiation to killbacteria on chickens?
Strongly approve . . . . . . . . . . . . . . . . . . . . . . . . . . . . . . . . . . (87( -1Somewhat approve . . . . . . . . . . . . . . . . . . . . . . . . . . . . . . . . . . . . . -2Somewhat disapprove . . . . . . . . . . . . . . . . . . . . . . . . . . . . . . . . . . -3Strongly disapprove . . . . . . . . . . . . . . . . . . . . . . . . . . . . . . . . . . . . -3Not sure . . . . . . . . . . . . . . . . . . . . . . . . . . . . . . . . . . . . . . . . . . . . . -4Refused/No answer . . . . . . . . . . . . . . . . . . . . . . . . . . . . . . . . . . . . -5
Now, I'd like to ask you a series of questions for classification purposes.
30. How old are you? (88( years of age
31. What is the last year or grade of school you completed?
No formal schooling . . . . . . . . . . . . . . . . . . . . . . . . . . . . . . . . (89( -1First through 7th grade . . . . . . . . . . . . . . . . . . . . . . . . . . . . . . . . . . -28th grade . . . . . . . . . . . . . . . . . . . . . . . . . . . . . . . . . . . . . . . . . . . . . -3Some high school . . . . . . . . . . . . . . . . . . . . . . . . . . . . . . . . . . . . . . -4High school graduate . . . . . . . . . . . . . . . . . . . . . . . . . . . . . . . . . . . -5Some college . . . . . . . . . . . . . . . . . . . . . . . . . . . . . . . . . . . . . . . . . -6Four-year college graduate . . . . . . . . . . . . . . . . . . . . . . . . . . . . . . . -7Post graduate . . . . . . . . . . . . . . . . . . . . . . . . . . . . . . . . . . . . . . . . . -8Refused/No answer . . . . . . . . . . . . . . . . . . . . . . . . . . . . . . . . . . . . -9

48
Biotechnology attitudes survey - New Jersey, 1993
32. Are you presently employed full time, part time, in the military, unemployed, retired and not working, a student, ahomemaker, or are you disabled or too ill to work?
Employed full time . . . . . . . . . . . . . . . . . . . . . . . . . . . . . . . . . (90( -1Employed part time . . . . . . . . . . . . . . . . . . . . . . . . . . . . . . . . . . . . -2In the military . . . . . . . . . . . . . . . . . . . . . . . . . . . . . . . . . . . . . . . . . -3 Unemployed . . . . . . . . . . . . . . . . . . . . . . . . . . . . . . . . . . . . . . . . . . -4Retired . . . . . . . . . . . . . . . . . . . . . . . . . . . . . . . . . . . . . . . . . . . . . . -5Student . . . . . . . . . . . . . . . . . . . . . . . . . . . . . . . . . . . . . . . . . . . . . . -6Homemaker . . . . . . . . . . . . . . . . . . . . . . . . . . . . . . . . . . . . . . . . . . -7Disabled/too ill to work . . . . . . . . . . . . . . . . . . . . . . . . . . . . . . . . . -8Refused/No answer . . . . . . . . . . . . . . . . . . . . . . . . . . . . . . . . . . . . -9
(If 4,5,6,7,8,9 SKIP to Q34)
33. Does your job involve:
a. Growing, or processing food?
Yes . . . . . . . . . . . . . . . . . . . . . . . . . . . . . . . . . . . . . . . . . . . . . (91( -1No . . . . . . . . . . . . . . . . . . . . . . . . . . . . . . . . . . . . . . . . . . . . . . . . . . -2Not sure . . . . . . . . . . . . . . . . . . . . . . . . . . . . . . . . . . . . . . . . . . . . . -3Refused/No answer . . . . . . . . . . . . . . . . . . . . . . . . . . . . . . . . . . . . -4
b. Preparing or selling food?
Yes . . . . . . . . . . . . . . . . . . . . . . . . . . . . . . . . . . . . . . . . . . . . . (92( -1No . . . . . . . . . . . . . . . . . . . . . . . . . . . . . . . . . . . . . . . . . . . . . . . . . . -2Not sure . . . . . . . . . . . . . . . . . . . . . . . . . . . . . . . . . . . . . . . . . . . . . -3Refused/No answer . . . . . . . . . . . . . . . . . . . . . . . . . . . . . . . . . . . . -4
c. Are you a scientist or engineer?Yes . . . . . . . . . . . . . . . . . . . . . . . . . . . . . . . . . . . . . . . . . . . . . (93( -1No . . . . . . . . . . . . . . . . . . . . . . . . . . . . . . . . . . . . . . . . . . . . . . . . . . -2Not sure . . . . . . . . . . . . . . . . . . . . . . . . . . . . . . . . . . . . . . . . . . . . . -3Refused/No answer . . . . . . . . . . . . . . . . . . . . . . . . . . . . . . . . . . . . -4
d. Are you a medical professional?Yes . . . . . . . . . . . . . . . . . . . . . . . . . . . . . . . . . . . . . . . . . . . . . (94( -1No . . . . . . . . . . . . . . . . . . . . . . . . . . . . . . . . . . . . . . . . . . . . . . . . . . -2Not sure . . . . . . . . . . . . . . . . . . . . . . . . . . . . . . . . . . . . . . . . . . . . . -3Refused/No answer . . . . . . . . . . . . . . . . . . . . . . . . . . . . . . . . . . . . -4
34. Are you a member of (READ ITEM)? Refused/Yes No Not Sure No answer
a. Environmental groups or organizations . . . . . . . . . . . . . . . . . . . . (95( -1 -2 -3 -4
b. Scientific groups or organizations . . . . . . . . . . . . . . . . . . . . . . . . . (96( -1 -2 -3 -4
c. Consumer groups or organizations . . . . . . . . . . . . . . . . . . . . . . . . (97( -1 -2 -3 -4

49
Biotechnology attitudes survey - New Jersey, 1993
35. Do you do most of the food shopping for your household?
Yes . . . . . . . . . . . . . . . . . . . . . . . (98( -1No . . . . . . . . . . . . . . . . . . . . . . . . . . . . -2No, equally divided . . . . . . . . . . . . . . -3
Not sure . . . . . . . . . . . . . . . . . . . . . . . -3Refused/No answer . . . . . . . . . . . . . . -4
36. Do you have any children who are younger than 21 years old?
Yes . . . . . . . . . . . . . . . . . . . . . . . (99( -1No . . . . . . . . . . . . . . . . . . . . . . . . . . . . -2Don't Know . . . . . . . . . . . . . . . . . . . . -3
If YES to Q3637. How many of your children are:
a. Age 5 or under? . . . . . . . (100(
b. Between 6 and 10? . . . . (101(
c. Between 11 and 15? . . . . . (102(
d. Between 16 and 21? . . . . . (103(
38. During the past year, did you attend a church or synagogue or other house of worship?
Yes, about once a week or more . . . . . . . . (105( -1Yes, about one or twice a month . . . . . . . . -2Yes, less than once a month but more than once or twice a year . . . . . . . . . . . . . . . . -3Yes, once or twice a year . . . . . . . . . . . . . . -4Not at all in the past year . . . . . . . . . . . . . . -5Refused/No answer . . . . . . . . . . . . . . . . . . -6
39. In politics as of today, do you consider yourself a Democrat, Republican, Independent, or something else?
Democrat . . . . . . . . . . . . . . . . . (106( -1Republican . . . . . . . . . . . . . . . . . . . . . -2Independent . . . . . . . . . . . . . . . . . . . . -3Something else/Other . . . . . . . . . . . . . -4Don't know / No opinion . . . . . . . . . . -9
(If #3, 4 or 9 to Q39, ASK:
Do you lean more toward the Democratic Party or more toward the Republican Party?
Democratic Party . . . . . . . . . . . (106( -1Republican Party . . . . . . . . . . . . . . . . -2Other Party . . . . . . . . . . . . . . . . . . . . . -3Neither . . . . . . . . . . . . . . . . . . . . . . . . -4Don't know / No opinion . . . . . . . . . . -9
40. Regardless of the political party you might favor, do you consider yourself to be a liberal, conservative, orsomewhere in between?

50
Biotechnology attitudes survey - New Jersey, 1993
Liberal . . . . . . . . . . . . . . . . . . . (107( -1Conservative . . . . . . . . . . . . . . . . . . . . -2
Somewhere in between . . . . . . . . . . . -3Don't know/ no opinion . . . . . . . . . . . -9
(IF #3 or #9 to Q40 ASK:
Do you lean more toward the liberal side or more toward the conservative side?
Liberal . . . . . . . . . . . . . . . . . . . (107( -1Conservative . . . . . . . . . . . . . . . . . . . . -2Other/Neither . . . . . . . . . . . . . . . . . . . -3Don't know/ no opinion . . . . . . . . . . . -9
41. Do you consider yourself to be Catholic, Protestant, Jewish, or something else?
Catholic . . . . . . . . . . . . . . . . . . (108( -1Protestant . . . . . . . . . . . . . . . . . . . . . . -2Jewish . . . . . . . . . . . . . . . . . . . . . . . . . -3None/Atheist/Agnostic . . . . . . . . . . . . -4Other . . . . . . . . . . . . . . . . . . . . . . . . . . -5Don't know/ refused . . . . . . . . . . . . . . -6
42. Which of the following income categories best described your total income last year? Was it (READ EACH ITEM)?
$7,500 or less . . . . . . . . . . . . . . (108( -1$7,501 to $15,000 . . . . . . . . . . . . . . . . -2$15,001 to $25,000 . . . . . . . . . . . . . . . -3$25,001 to $35,000 . . . . . . . . . . . . . . . -4$35,001 to $45,000 . . . . . . . . . . . . . . . -5$45,001 to $55,000 . . . . . . . . . . . . . . -6$55,001 to $65,000 . . . . . . . . . . . . . . . -7$65,001 to $75,000 . . . . . . . . . . . . . . . -8$75,001 and over . . . . . . . . . . . . . . . . -9
Not sure/refused . . . . . . . . . . . . . . . . . -0
RECORD SEX (DO NOT ASK)
Male . . . . . . . . . . . . . . . . . . . . . . (109( -1Female . . . . . . . . . . . . . . . . . . . . . . . . -2