Embed Size (px)
Citation preview
i
PUBLIC PERCEPTIONS AND CONCERN ABOUT RUNOFF POLLUTION
SUMMARY FINDINGS FOR THE
SOUTH CAROLINA DEPARTMENT OF HEALTH AND ENVIRONMENTAL CONTROL
i
TABLE OF CONTENTS
Background ................................................................................................................ 1 Opinions on Environmental Issues ............................................................................. 2 Table 1. Awareness of Sources of Runoff Pollution ...................................... 3 Environmental Behaviors ......................................................................................…. 7 Lawn Fertilization .......................................................................................... 7 Table 2. Lawn Fertilization ........................................................................... 8 Disposal of Yard Clippings ............................................................................ 9 Table 3. Fertilized Lawn in the Past 12 Months by Demographic Characteristics ................................................................................. 10 Pesticide Use .................................................................................................. 11 Table 4. Disposal of Yard Clippings ............................................................. 12 Table 5. Pesticide Use ................................................................................... 13 Table 6. Used Pesticides in the Past 12 Months by Demographic Characteristics ................................................................................. 14 Disposal of Hazardous Chemical Products ..................................................... 15 Table 7. Disposal of Products Such as Paints, Paint Thinners, Cleaners, Pesticides, and Varnishes ................................................................ 17 Table 8. Disposal of Hazardous Chemical Products by Demographic Characteristics ................................................................................. 18 Septic System ................................................................................................. 19 Table 9. Septic System Use and Behaviors in South Carolina ....................... 20
Table 10. Home Served by a Septic System by Demographic Characteristics 21 Dog Waste Disposal ....................................................................................... 23 Table 11. Dog Ownership and Behaviors in South Carolina ............................... 24
ii
TABLE OF CONTENTS - (cont.) - Methods for Getting Information About Protecting Water Quality .............................. 25 Table 12. Methods for Getting Information About Protecting Water Quality.. 27 Summary ................................................................................................................... 29
1
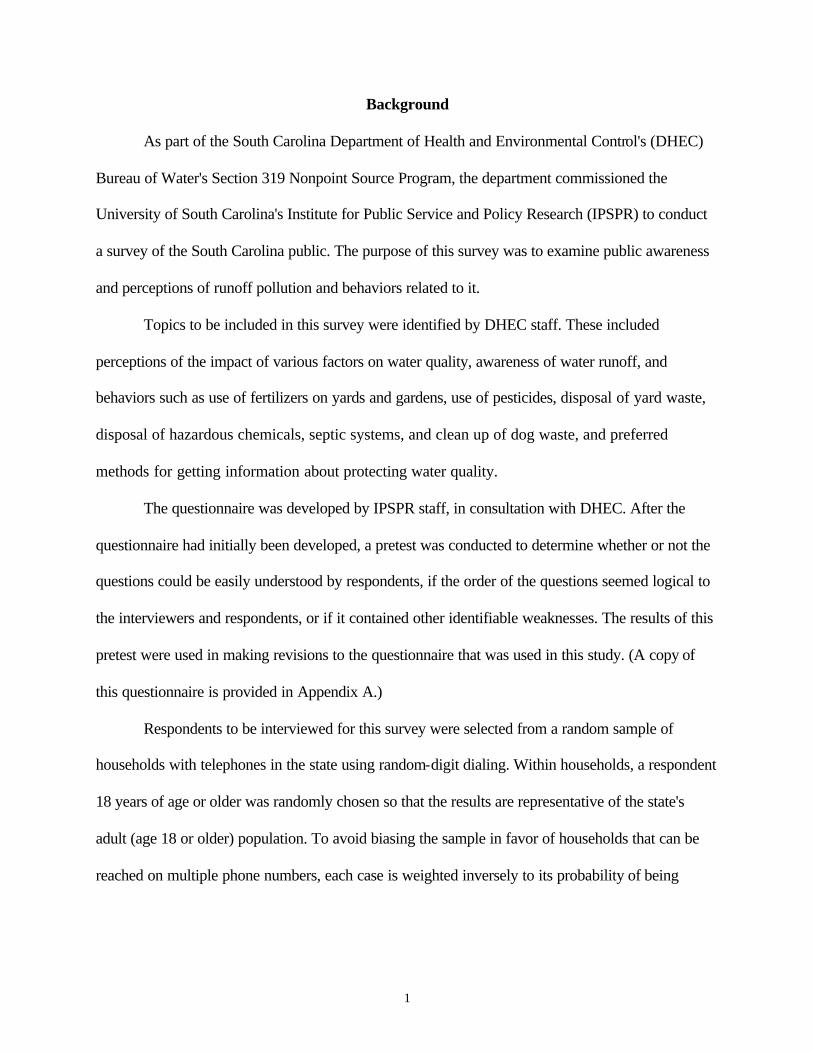
Background
As part of the South Carolina Department of Health and Environmental Control's (DHEC)
Bureau of Water's Section 319 Nonpoint Source Program, the department commissioned the
University of South Carolina's Institute for Public Service and Policy Research (IPSPR) to conduct
a survey of the South Carolina public. The purpose of this survey was to examine public awareness
and perceptions of runoff pollution and behaviors related to it.
Topics to be included in this survey were identified by DHEC staff. These included
perceptions of the impact of various factors on water quality, awareness of water runoff, and
behaviors such as use of fertilizers on yards and gardens, use of pesticides, disposal of yard waste,
disposal of hazardous chemicals, septic systems, and clean up of dog waste, and preferred
methods for getting information about protecting water quality.
The questionnaire was developed by IPSPR staff, in consultation with DHEC. After the
questionnaire had initially been developed, a pretest was conducted to determine whether or not the
questions could be easily understood by respondents, if the order of the questions seemed logical to
the interviewers and respondents, or if it contained other identifiable weaknesses. The results of this
pretest were used in making revisions to the questionnaire that was used in this study. (A copy of
this questionnaire is provided in Appendix A.)
Respondents to be interviewed for this survey were selected from a random sample of
households with telephones in the state using random-digit dialing. Within households, a respondent
18 years of age or older was randomly chosen so that the results are representative of the state's
adult (age 18 or older) population. To avoid biasing the sample in favor of households that can be
reached on multiple phone numbers, each case is weighted inversely to its probability of being
2
included in the sample. The data are also weighted to correct any potential biases in the sample on
the basis of age, race, sex, and number of adults in the household (see Appendix A, Note 1).
Interviewing for this study was conducted between November 14 and December 18, 2002.
A total of 503 fully completed interviews and 10 partially completed interviews were conducted.
The response rate for this survey was 57.5%.
This survey has a potential for sampling error due to the fact that not all residents of the
state were interviewed. For all questions that were answered by five hundred (500) or so
respondents the potential for error is +/- 4.4%. Results for questions answered by significantly
fewer than 500 respondents and results for subgroups of the population have a potential for
larger variation than those for the entire sample.
This report provides a summary of the findings for this survey. In addition to providing
the major findings for the complete sample, comparisons across demographic subgroups – sex,
race, age, education, income, type of area in which respondents live, and region of the state – are
presented in order to identify significant differences on these questions. As part of this survey
respondents were asked whether they lived next to a body of water; 23.9% of those interviewed
reported they lived next to a body of water; in this report, this variable is treated as a background
characteristic to examine its effect on polluted runoff awareness and related behaviors.
Significant differences across subgroups (determined as p<.05) are highlighted in bold in the
tables.
Opinions on Environmental Issues
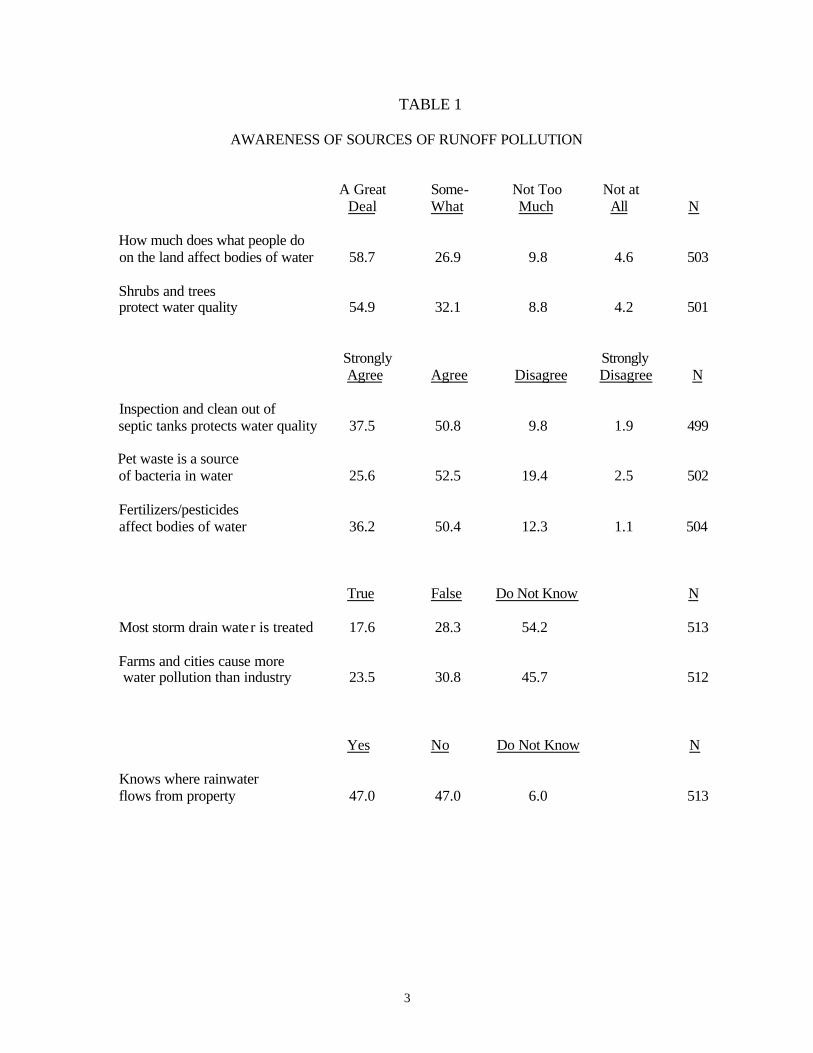
The first questions in this survey assessed the public’s awareness of sources of
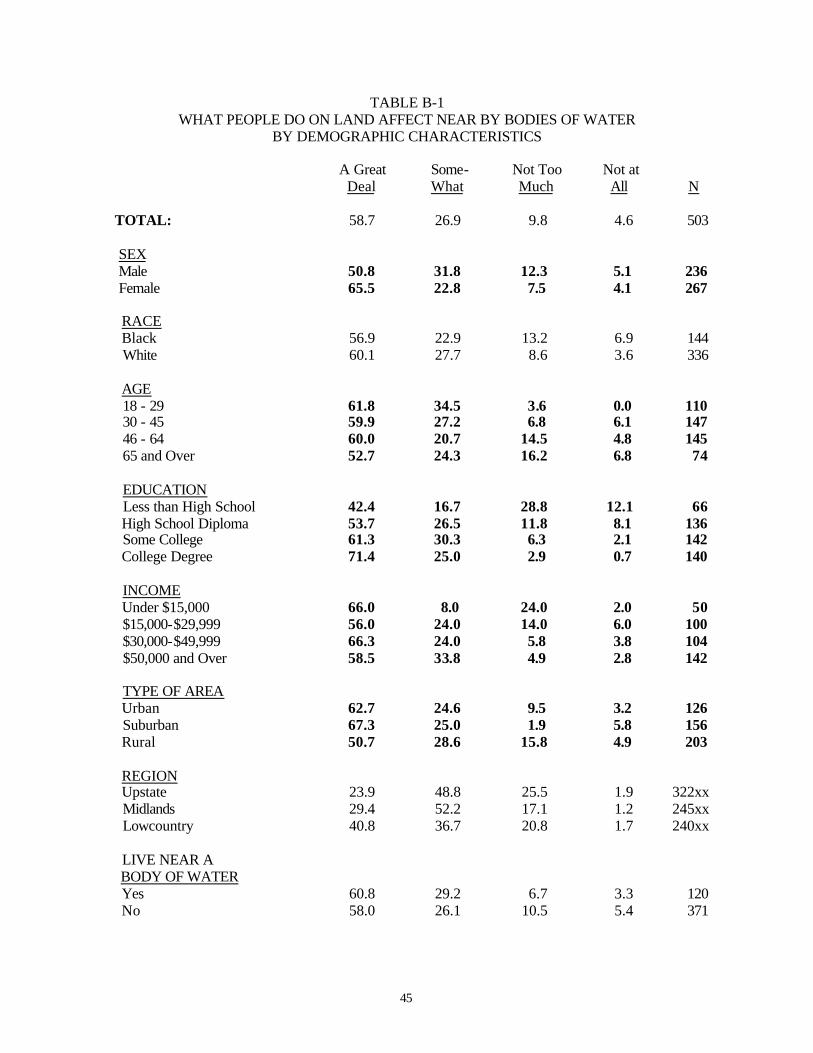
wastewater pollution (Table 1). The majority of South Carolinians believe that what people do
on land affects nearby bodies of water; 58.7% thought it had a great deal of effect and 26.9%
3
TABLE 1
AWARENESS OF SOURCES OF RUNOFF POLLUTION
A Great Some- Not Too Not at Deal What Much All N
How much does what people do on the land affect bodies of water 58.7 26.9 9.8 4.6 503 Shrubs and trees protect water quality 54.9 32.1 8.8 4.2 501
Strongly Strongly Agree Agree Disagree Disagree N
Inspection and clean out of septic tanks protects water quality 37.5 50.8 9.8 1.9 499 Pet waste is a source of bacteria in water 25.6 52.5 19.4 2.5 502 Fertilizers/pesticides affect bodies of water 36.2 50.4 12.3 1.1 504
True False Do Not Know N
Most storm drain water is treated 17.6 28.3 54.2 513 Farms and cities cause more water pollution than industry 23.5 30.8 45.7 512
Yes No Do Not Know N
Knows where rainwater flows from property 47.0 47.0 6.0 513
4
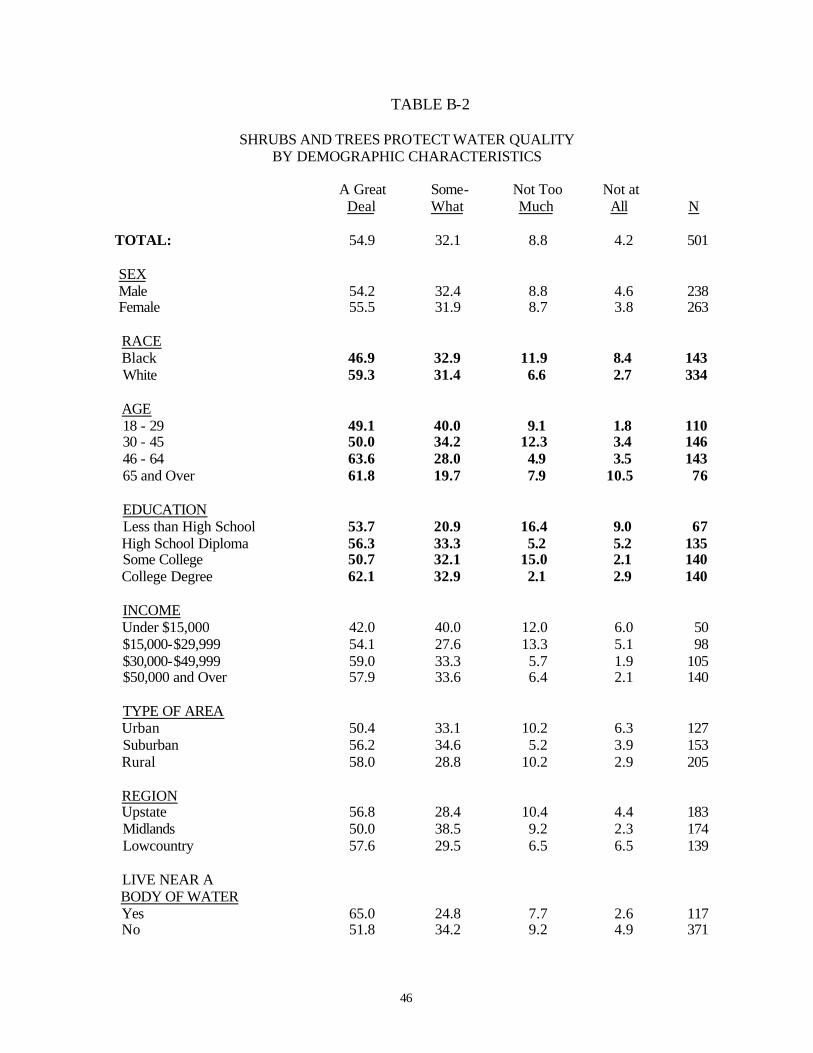
felt people's actions affected the water somewhat. There is also general consensus that shrubs
and trees protect water quality, with 54.9% believing they provide a great deal of protection and
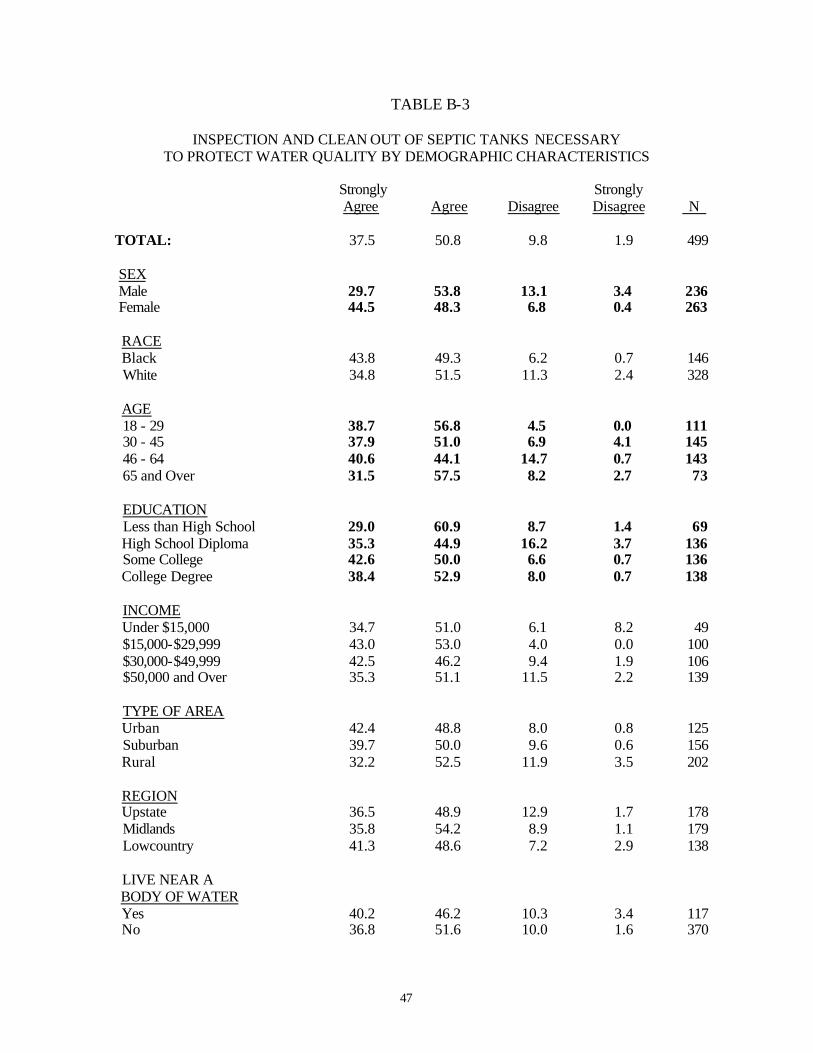
32.1% feeling that trees and shrubs protect water quality somewhat. Most South Carolina adults
(88.3%) also agree or strongly agree that regular inspection and clean out of septic tanks protects
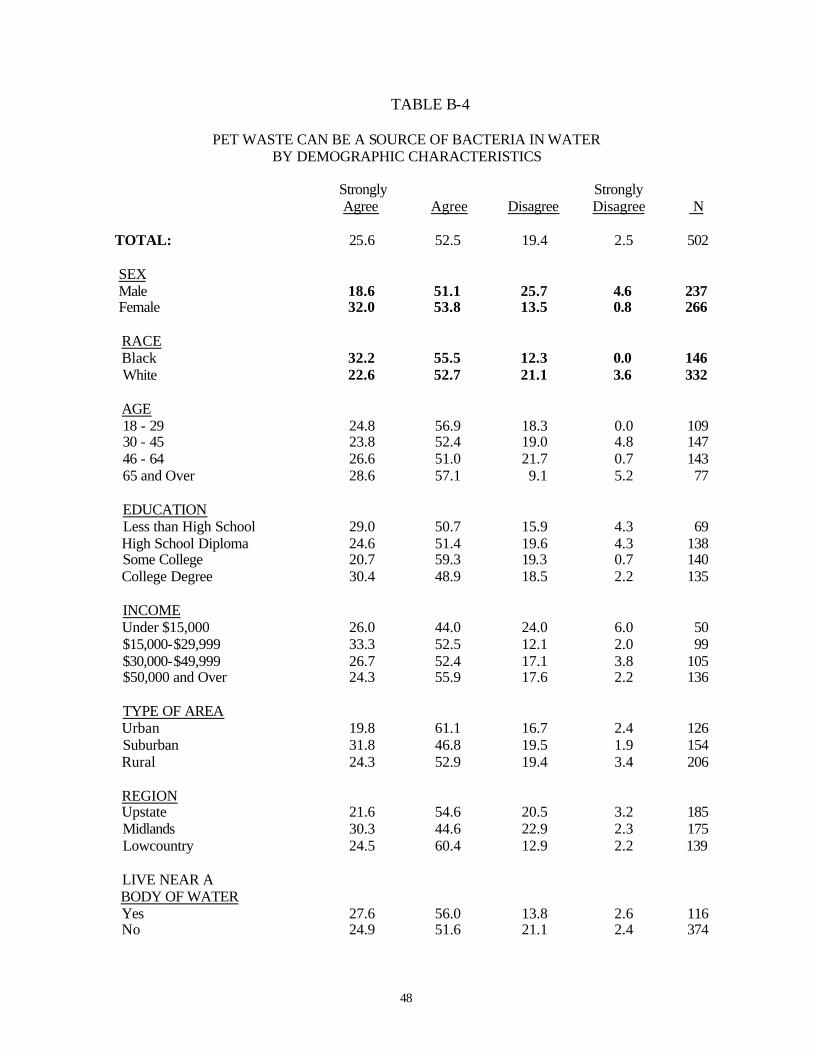
water quality. Pet waste is recognized by the majority of those surveyed as a source of bacteria in
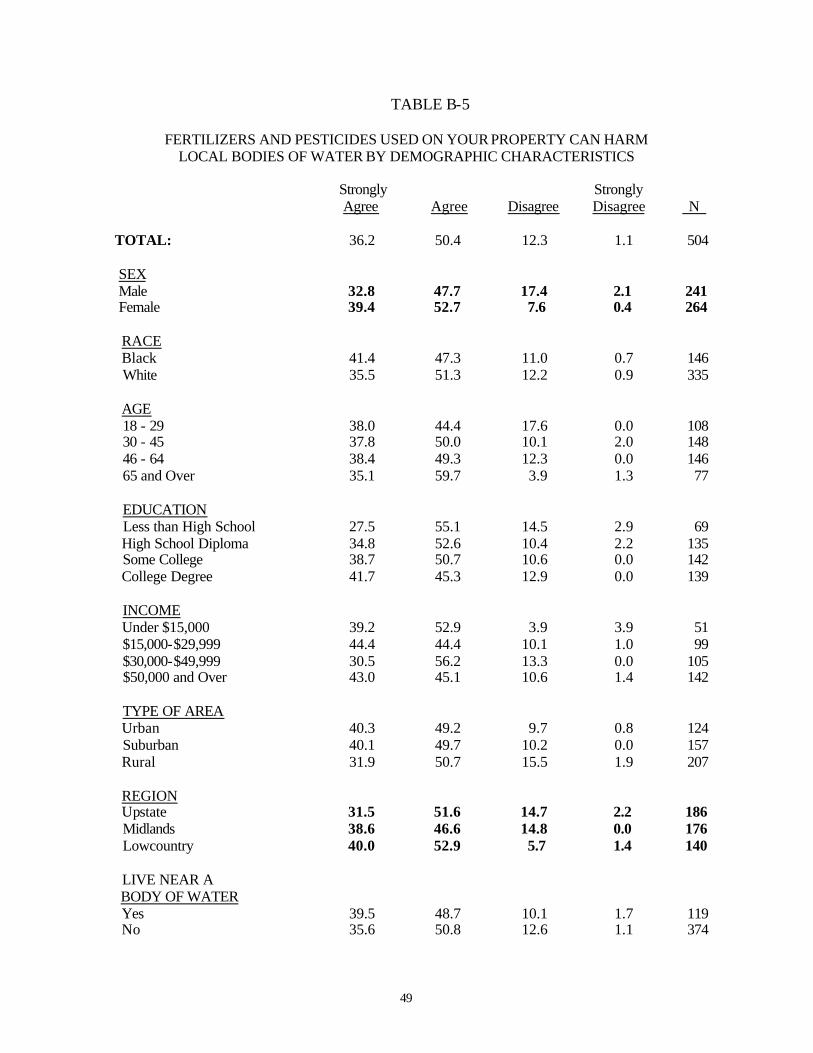
water (25.6% strongly agree; 52.5% agree). Use of fertilizers and pesticides is also thought to be
a significant source of wastewater pollution by most South Carolinians, with 36.2% strongly
agreeing that such use can harm local bodies of water and another 50.4% agreeing with this
statement.
While South Carolinians generally agree that activities on land impact water quality, they
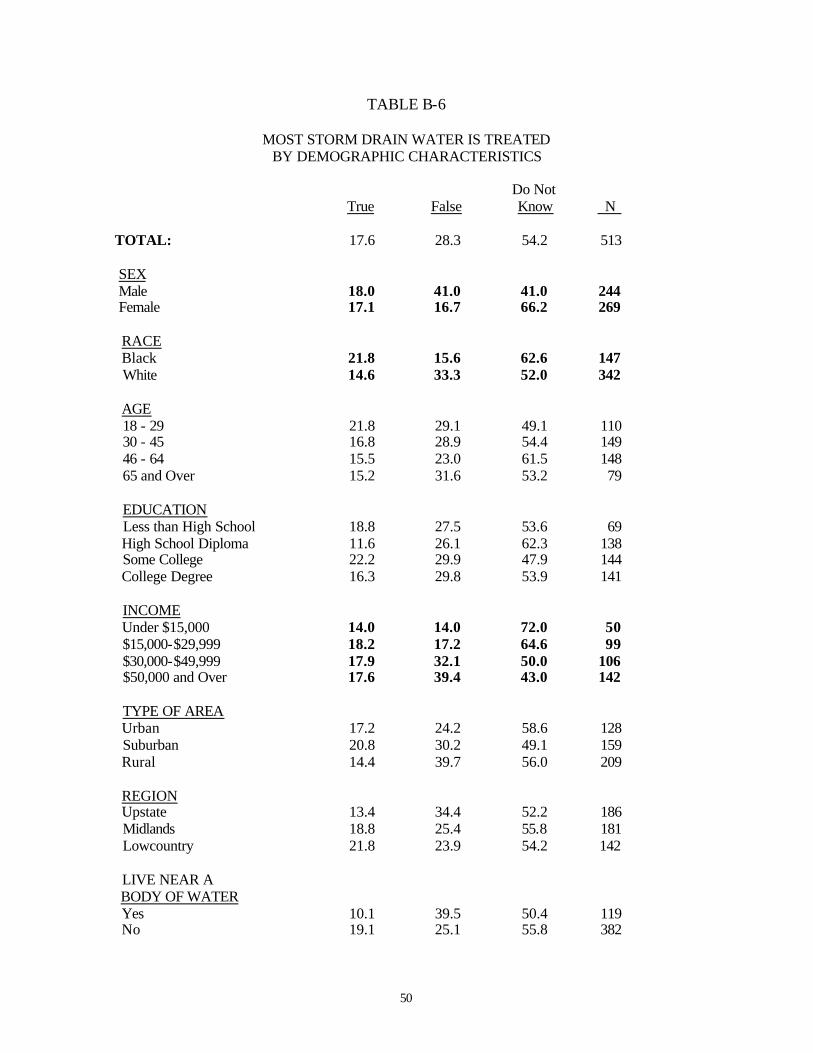
are less knowledgeable about specific actions that might have an impact on water quality. When
asked if most water that goes down storm drains is treated before it is released into the nearest
river, over half of the respondents said they did not know, 28.3% said it is not treated and 17.6%
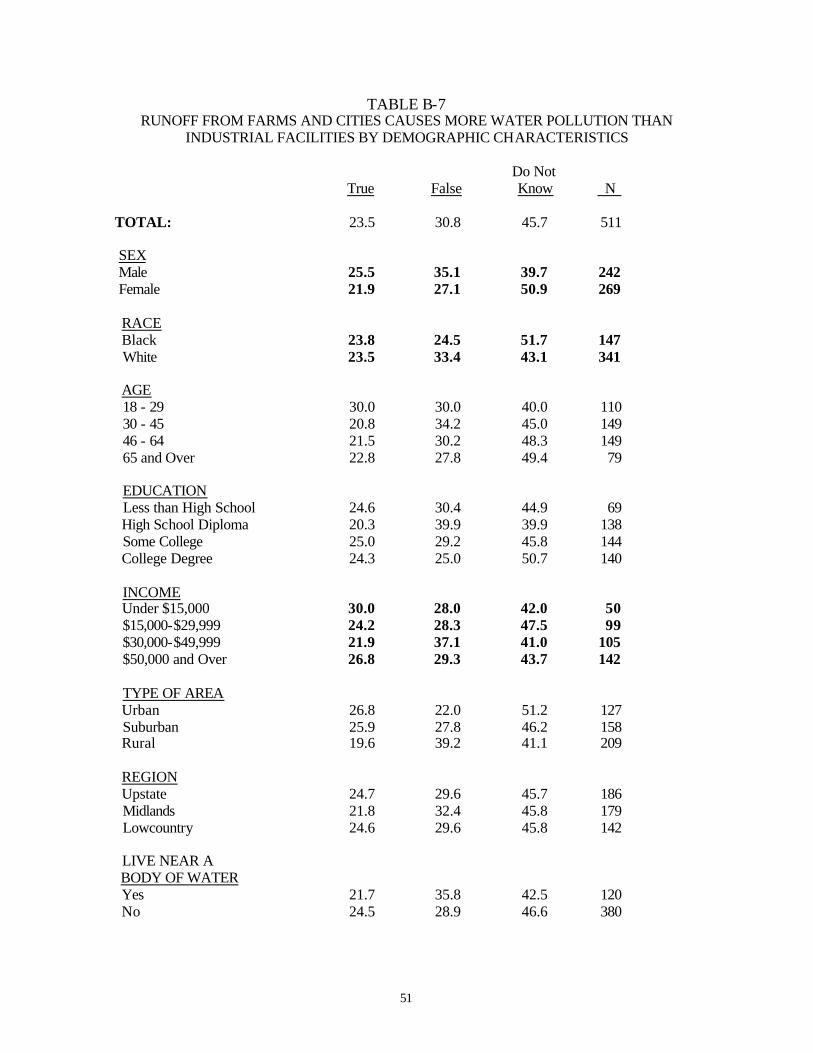
believed that storm drain water is treated. On the question of whether runoff from farms and
cities causes more water pollution than industrial facilities, 45.7% did not know, 23.5% believed
it was true that farms and cities create more water pollution than industrial facilities, and 30.8%
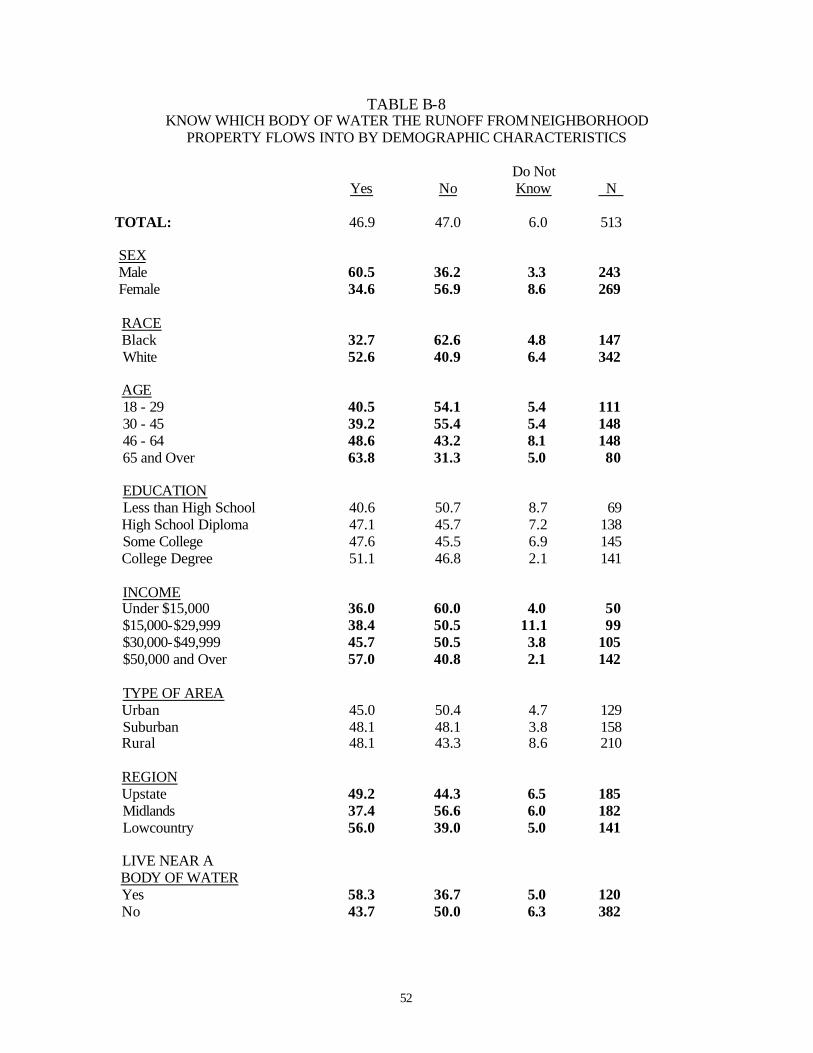
said this was false. Almost half of the respondents to this survey said they knew into which body
of water the rain runoff from their property flows.
There were a number of significant differences among demographic groups in their
opinions on these questions (see Appendix B, Tables B-1 to B-8 for complete breakdowns). The
largest differences on these items were between men and women. Females were more likely than
males to believe what people do on land affects nearby bodies of water a great deal (65.5% to
50.8%). Women were also more likely than men to strongly agree that inspection and clean out
5
of septic tanks is necessary to protect water quality (44.5% to 29.7%) and that pet waste can be a
source of bacteria in water (32.0% to 18.6%), and to agree (92.0% to 80.5%) that fertilizers and
pesticides can harm local bodies of water. Women were also significantly more likely than men
to say that they did not know if stormwater is treated (66.2% to 41.0%) or if farms and cities are
a more significant source of water pollution than industrial facilities (50.9% to 39.7%). A much
higher percentage of men than women (60.5% to 34.6%) reported they knew the body of water
into which runoff from rainwater in their neighborhood flowed.
Blacks and whites also differed significantly on several of these questions. Whites were
much more likely than blacks to believe that shrubs and trees along waterways protect water
quality "a great deal" (59.3% to 46.9%), while a much higher percentage of blacks than whites
strongly agreed that pet waste can be a source of bacteria for nearby streams and bodies of water
(32.2% to 22.6%). A higher percentage of blacks than whites said they did not know if
stormwater was treated (62.6% to 52.0%) or if runoff from farms cities causes more water
pollution than industrial facilities (51.7% to 43.1%). Whites were more likely to believe that
stormwater is not treated before it is released and that runoff from farms and cities does not
cause more water pollution than industrial facilities. Slightly more than half of white respondents
knew the body of water into which runoff from their neighborhood flowed, while 67.3% of
blacks did not.
There were fewer and less consistent differences on these items across age groups.
Younger respondents were more likely to believe that what people do on land has somewhat or a
great deal of effect on nearby bodies of water. On the other hand, those age 46 or older were
significantly more likely than younger respondents to believe that shrubs and trees along
waterways protect water quality. Age groups differences on the question of the impact of
6
inspection and cleaning of septic tanks were also significant, with the views of those ages 46 to
64 distinct from those in other age groups. The oldest respondents (65 and over) were also much
more likely than those in the younger age groups to report knowing the body of water into which
runoff from their neighborhood flows.
Level of education also has a significant influence on South Carolina residents’
knowledge about wastewater pollution and its sources. The vast majority of those with a college
degree (96.4%) believed that what people do on land has an effect on nearby bodies of water,
compared to 59.1% of those with less than a high school diploma. Those with a college degree
were also more likely to think that shrubs and trees along waterways can protect water quality.
Across income groups, respondents with family incomes under $30,000 were more likely
to feel that what people do on land affects nearby bodies of water "not too much" or "not at all."
In addition, a higher percentage of respondents from lower income families did not know
whether stormwater was treated before being released. Respondents from higher income families
were more likely than those with lower incomes to know the body of water into which runoff
from their neighborhood flows.
Across regions of the state, those living in the Lowcountry were the least likely to
disagree or strongly disagree with the statement "…fertilizers and pesticides used on your
property can harm local bodies of water." Lowcountry residents (56.0%) were also more likely
than from the Upstate (49.2%) or the Midlands (37.4%) to know the body of water into which
runoff from their neighborhood flowed.
There was only one significant difference by type of area in which respondents lived.
Residents in suburban (67.3%) or urban (62.7%) areas are significantly more likely than those
7
from rural areas (50.7%) to believe what people do on land has a great effect on nearby bodies of
water.
Living near a body of water also made a significant difference on one of these items. As
might be expected, those who live near a body of water were more likely to know the body of
water into which runoff from their property flowed (58.3% to 43.7%).
Environmental Behaviors
In addition to their perceptions of stormwater runoff pollution and awareness of factors
that contribute to it, respondents were asked about behaviors related to runoff pollution,
including use of fertilizers on yards and gardens, disposing of yard clippings, use of pesticides,
ownership of a septic system, and cleaning up of pet waste. This section describes the
experiences of the South Carolina population in these areas.
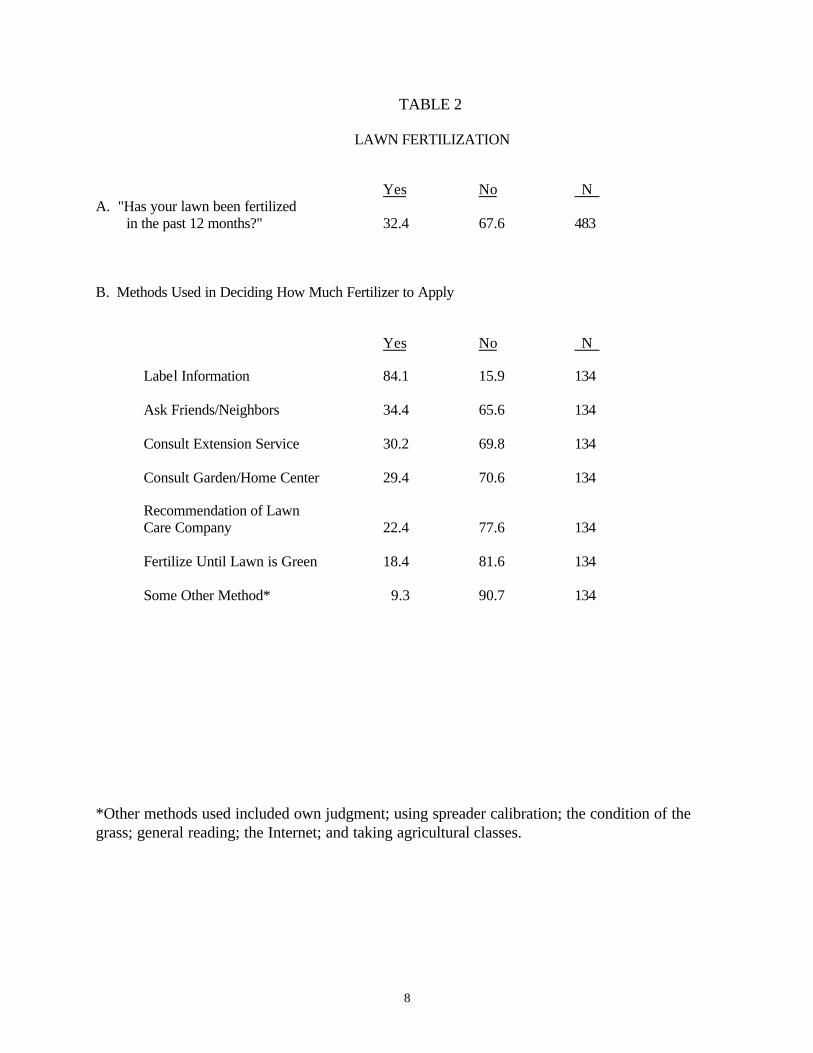
Lawn Fertilization. Table 2 presents the results for the questions related to lawn
fertilization. Approximately one-third of South Carolina residents reported having fertilized their
lawn in the past 12 months; on average, those who fertilize their lawn do so slightly less than
twice a year. Those who fertilize their lawn were also asked what methods they used to
determine how much fertilizer to apply. The most frequent method reported was reading the
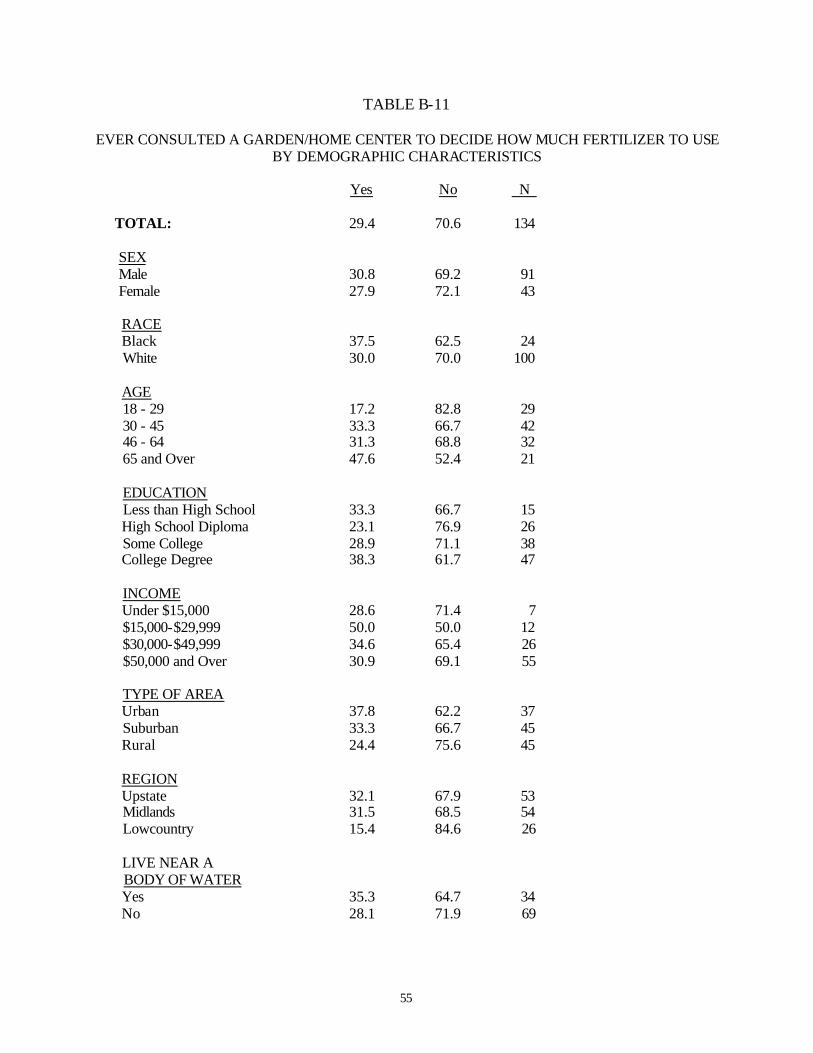
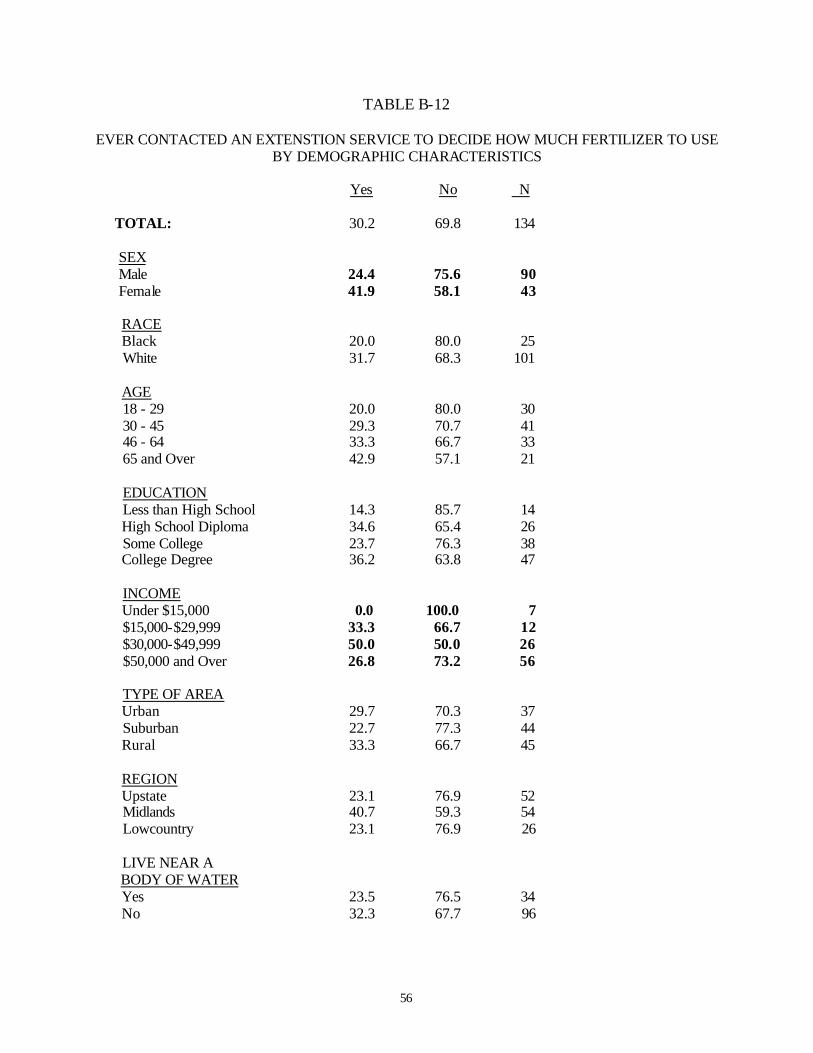
label information on the fertilizer (84.1%). Approximately 30% of respondents asked their
friends and neighbors, contacted the extension service, or consulted with a garden or home center
in deciding how much fertilizer to apply. Slightly more than one-fifth of the respondents said
they had gotten recommendations of a lawn care company, while slightly less than 20% reported
"fertilizing their lawn until it is green." About 10% said they used some other method to
determine how much fertilizer to use, including their own judgment, using the fertilizer spreader
calibration, general reading, searching the Internet and taking agricultural classes.
8
TABLE 2
LAWN FERTILIZATION
Yes No N A. "Has your lawn been fertilized in the past 12 months?" 32.4 67.6 483 B. Methods Used in Deciding How Much Fertilizer to Apply Yes No N Label Information 84.1 15.9 134 Ask Friends/Neighbors 34.4 65.6 134 Consult Extension Service 30.2 69.8 134 Consult Garden/Home Center 29.4 70.6 134 Recommendation of Lawn
Care Company 22.4 77.6 134 Fertilize Until Lawn is Green 18.4 81.6 134 Some Other Method* 9.3 90.7 134 *Other methods used included own judgment; using spreader calibration; the condition of the grass; general reading; the Internet; and taking agricultural classes.
9
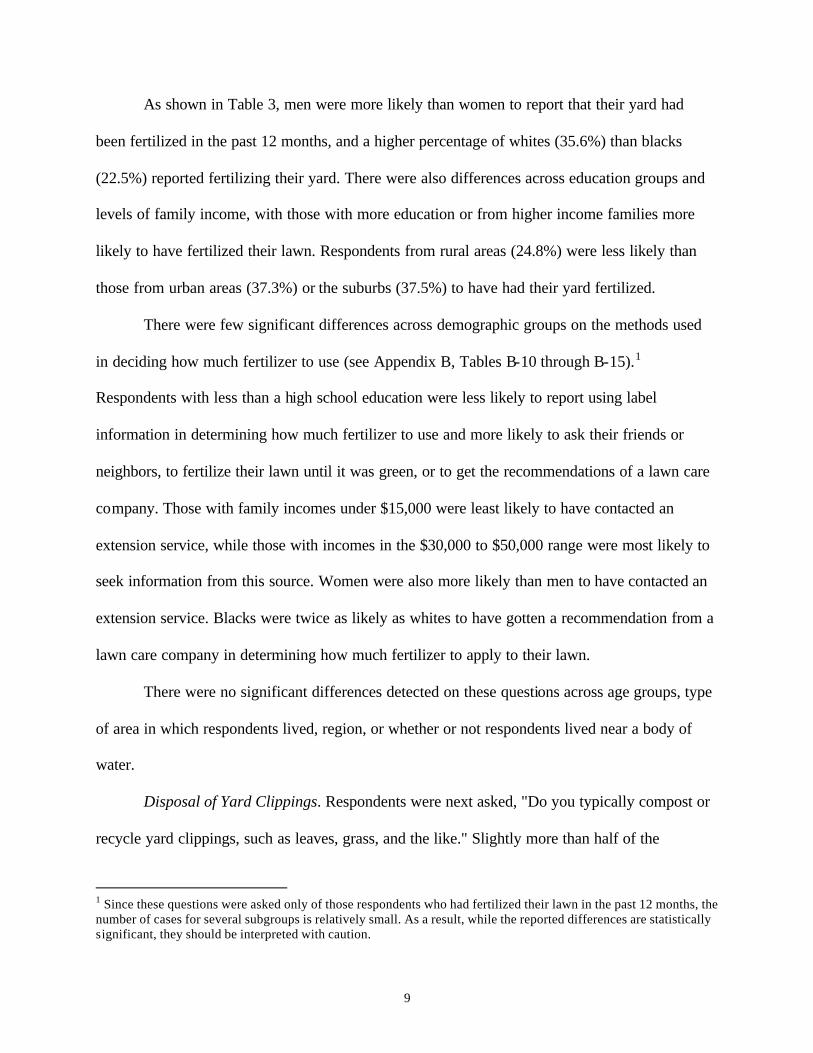
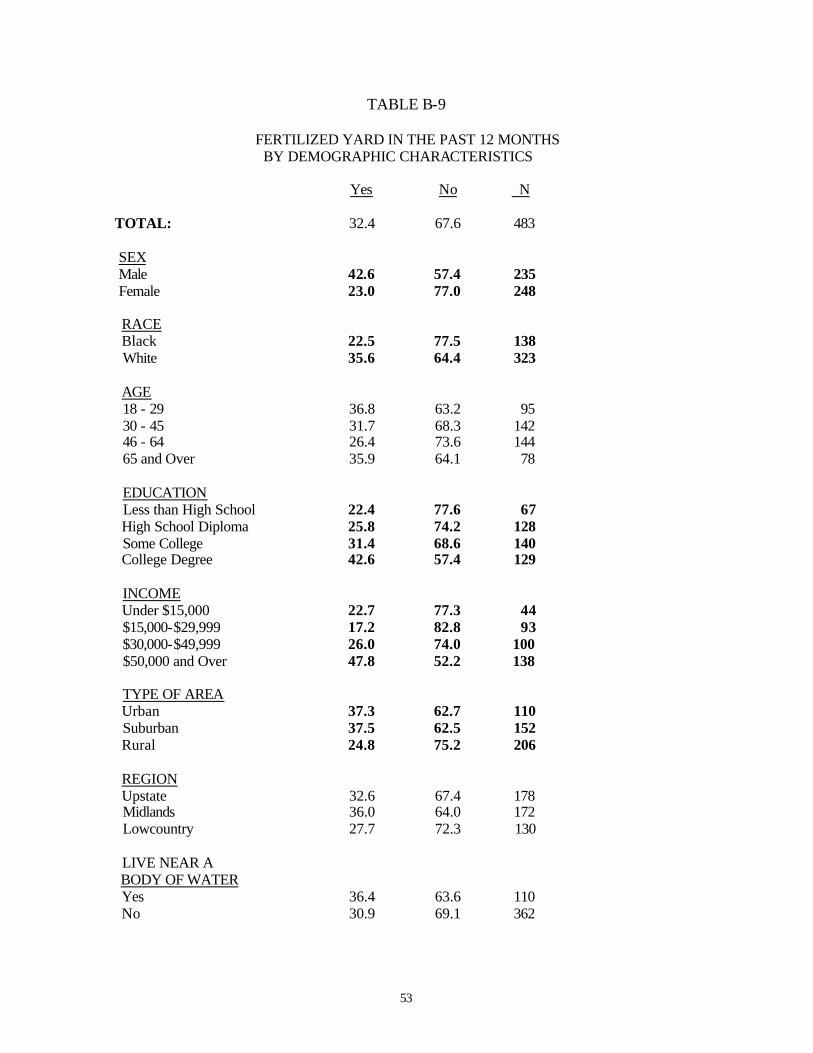
As shown in Table 3, men were more likely than women to report that their yard had
been fertilized in the past 12 months, and a higher percentage of whites (35.6%) than blacks
(22.5%) reported fertilizing their yard. There were also differences across education groups and
levels of family income, with those with more education or from higher income families more
likely to have fertilized their lawn. Respondents from rural areas (24.8%) were less likely than
those from urban areas (37.3%) or the suburbs (37.5%) to have had their yard fertilized.
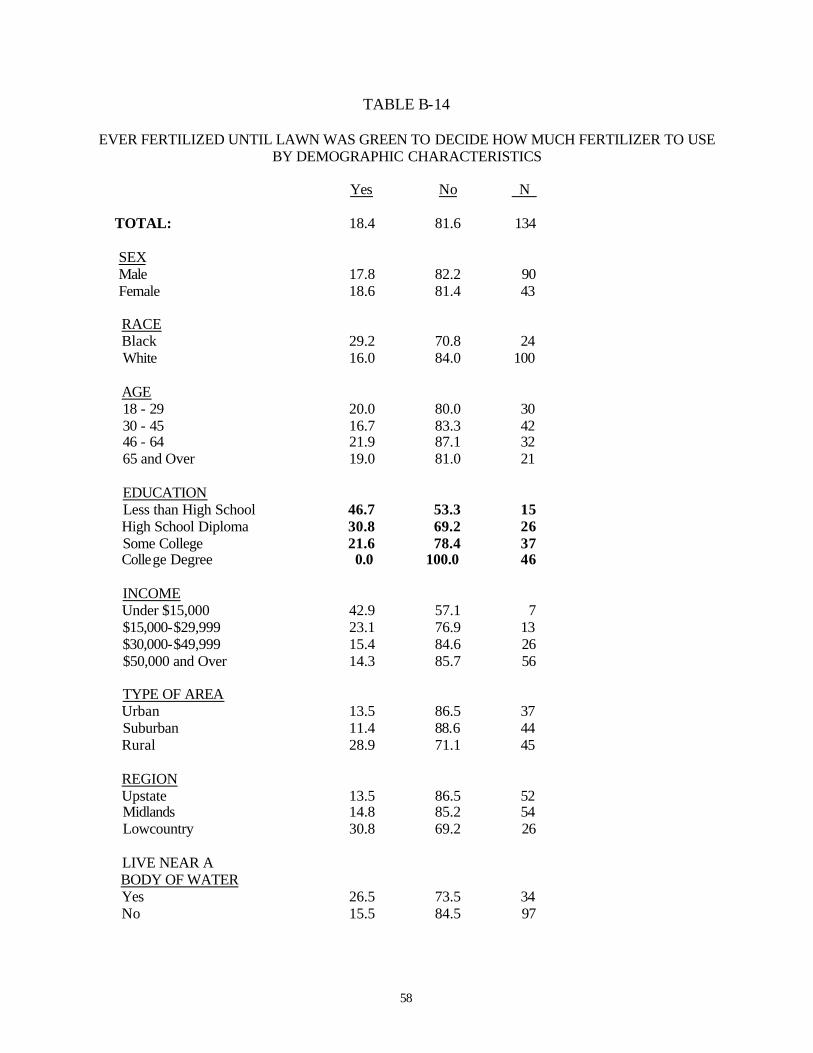
There were few significant differences across demographic groups on the methods used
in deciding how much fertilizer to use (see Appendix B, Tables B-10 through B-15).1
Respondents with less than a high school education were less likely to report using label
information in determining how much fertilizer to use and more likely to ask their friends or
neighbors, to fertilize their lawn until it was green, or to get the recommendations of a lawn care
company. Those with family incomes under $15,000 were least likely to have contacted an
extension service, while those with incomes in the $30,000 to $50,000 range were most likely to
seek information from this source. Women were also more likely than men to have contacted an
extension service. Blacks were twice as likely as whites to have gotten a recommendation from a
lawn care company in determining how much fertilizer to apply to their lawn.
There were no significant differences detected on these questions across age groups, type
of area in which respondents lived, region, or whether or not respondents lived near a body of
water.
Disposal of Yard Clippings. Respondents were next asked, "Do you typically compost or
recycle yard clippings, such as leaves, grass, and the like." Slightly more than half of the
1 Since these questions were asked only of those respondents who had fertilized their lawn in the past 12 months, the number of cases for several subgroups is relatively small. As a result, while the reported differences are statistically significant, they should be interpreted with caution.

10
TABLE 3
FERTILIZED YARD IN THE PAST 12 MONTHS BY DEMOGRAPHIC CHARACTERISTICS
Yes No N
TOTAL: 32.4 67.6 483 SEX Male 42.6 57.4 235 Female 23.0 77.0 248 RACE Black 22.5 77.5 138 White 35.6 64.4 323 AGE 18 - 29 36.8 63.2 95 30 - 45 31.7 68.3 142 46 - 64 26.4 73.6 144 65 and Over 35.9 64.1 78 EDUCATION Less than High School 22.4 77.6 67 High School Diploma 25.8 74.2 128 Some College 31.4 68.6 140 College Degree 42.6 57.4 129 INCOME Under $15,000 22.7 77.3 44 $15,000-$29,999 17.2 82.8 93 $30,000-$49,999 26.0 74.0 100 $50,000 and Over 47.8 52.2 138 TYPE OF AREA Urban 37.3 62.7 110 Suburban 37.5 62.5 152 Rural 24.8 75.2 206 REGION Upstate 32.6 67.4 178 Midlands 36.0 64.0 172 Lowcountry 27.7 72.3 130 LIVE NEAR A BODY OF WATER Yes 36.4 63.6 110 No 30.9 69.1 362
11
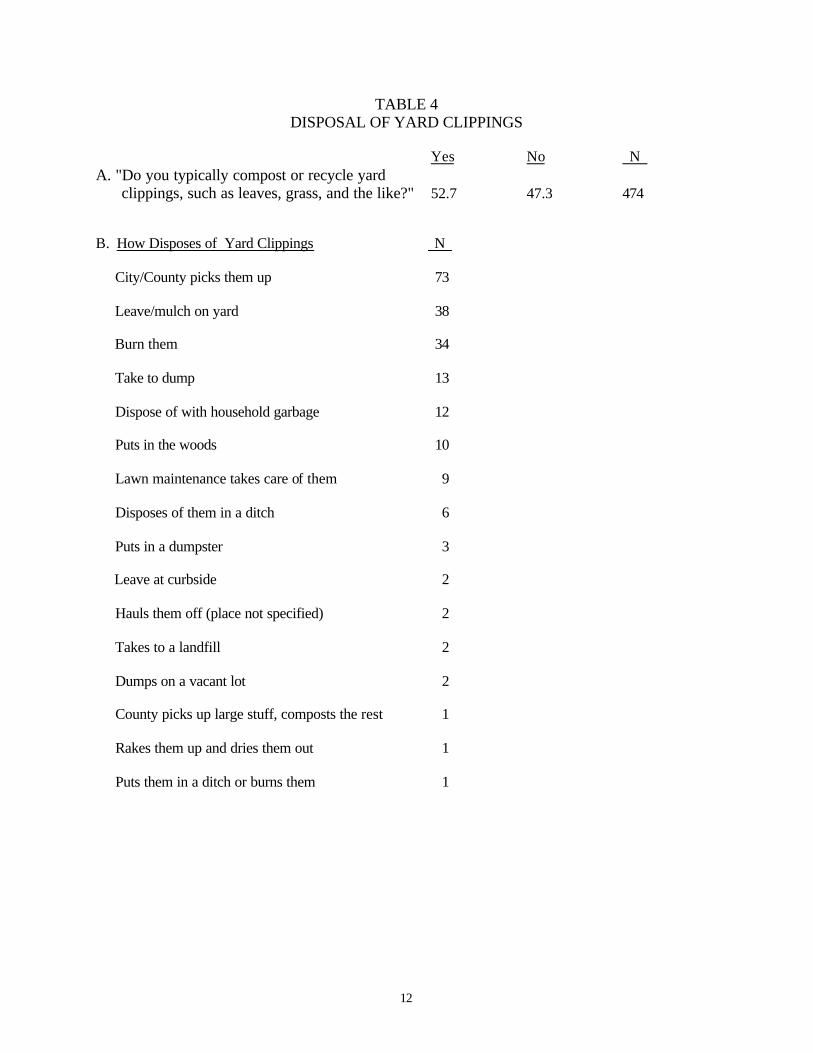
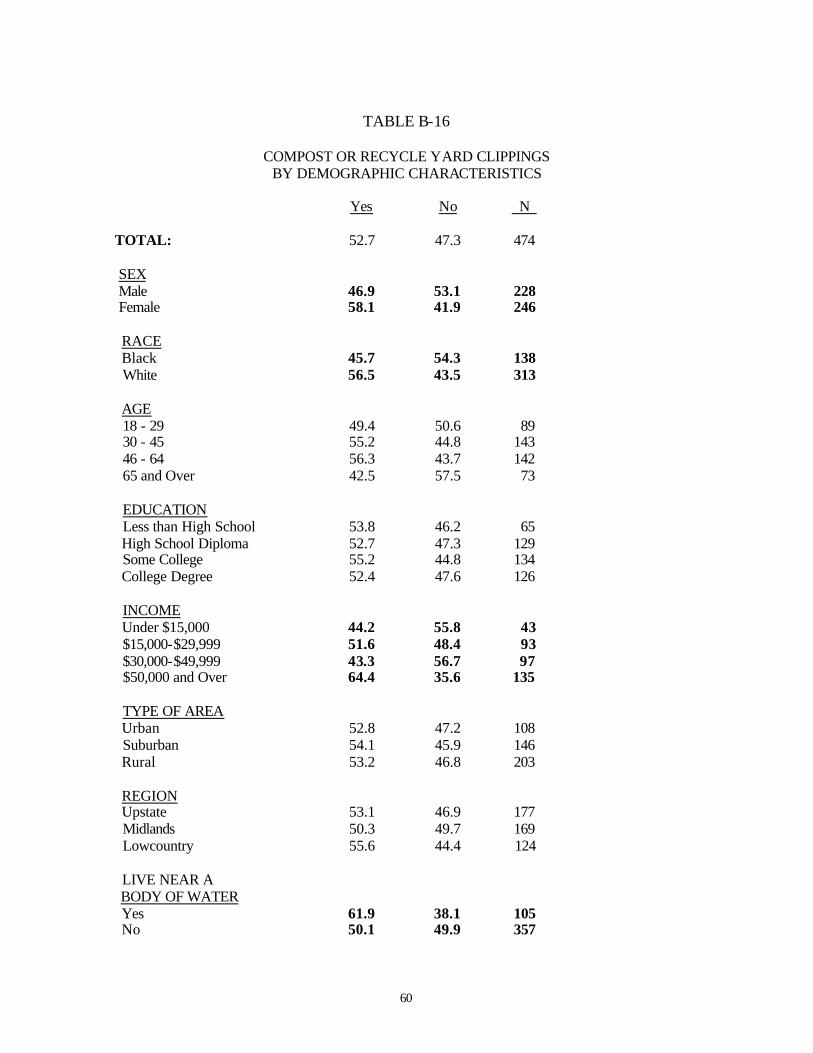
respondents to this survey reported composting or recycling yard clippings (Table 4). Females,
whites, those with incomes of $50,000 or more, and respondents living near a body of water
were significantly more likely to say they compost or recycle their yard clippings (Appendix B,
Table B-16).
Respondents who said they did not compost or recycle their yard clippings were asked
how they disposed of them. As indicated in Table 4, South Carolina residents dispose of yard
clippings in a number of ways. Among those who do not compost or recycle, the most frequent
method of disposing of yard clippings is that the city or county picks them up. A number of
households report that they leave clippings on the yard as mulch, and a roughly equal number
burn them. Other methods of disposal include taking them to the dump, disposing them with the
household garbage, and putting them in the woods. A complete listing of responses to this item is
provided in Table 4.
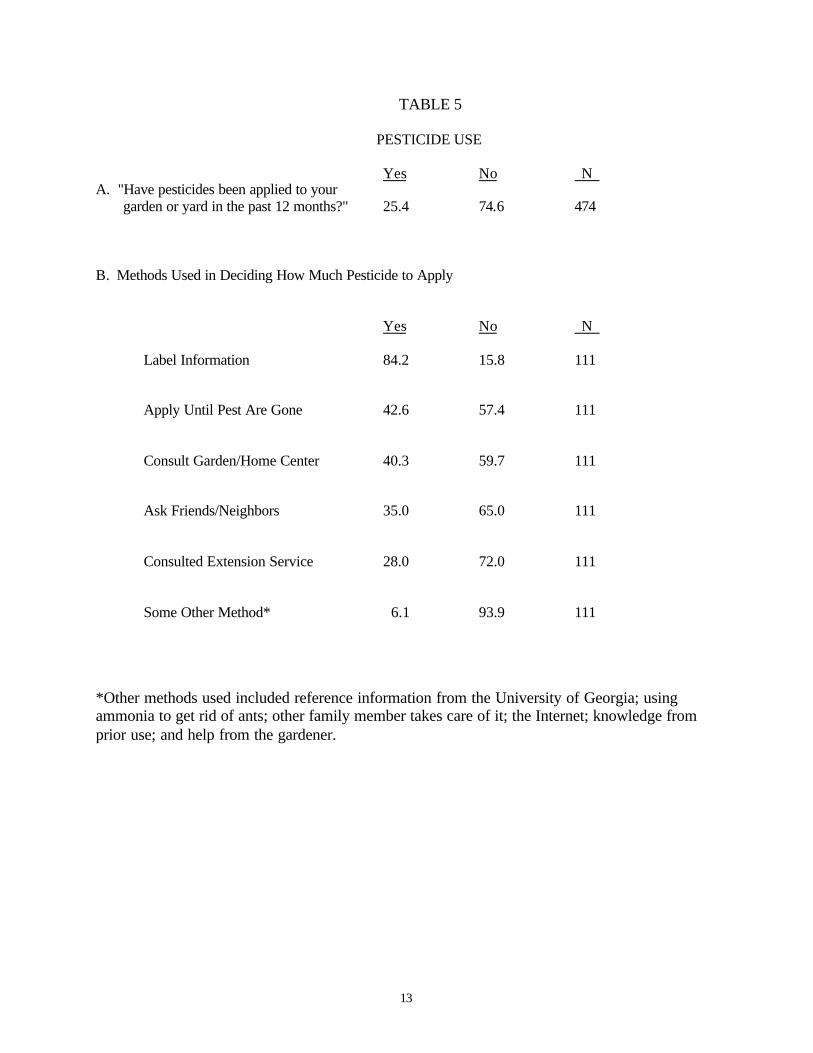
Pesticide Use. Twenty-five percent of South Carolinians report that pesticides have been
applied to their lawn or garden in the past 12 months (Table 5). As was the case with fertilizer
use, the most frequently used method for deciding how much pesticide to apply is to read the
label information (84.2%). About 40% said they had applied pesticides until the pests were gone
and a similar percentage consulted with a garden or home center. Another method was to ask
friends or neighbors (used by 35.0%), and 28.0% sought the recommendations of the extension
service; 6.1% used some other method to determine how much pesticide to apply.
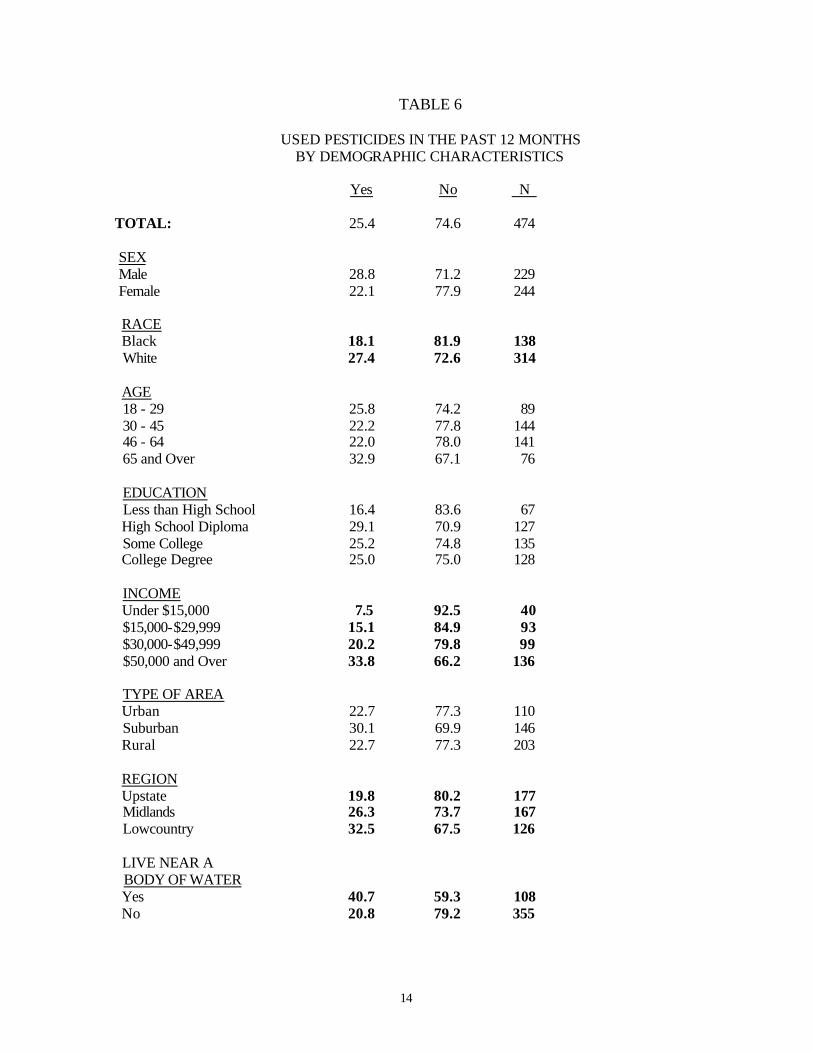
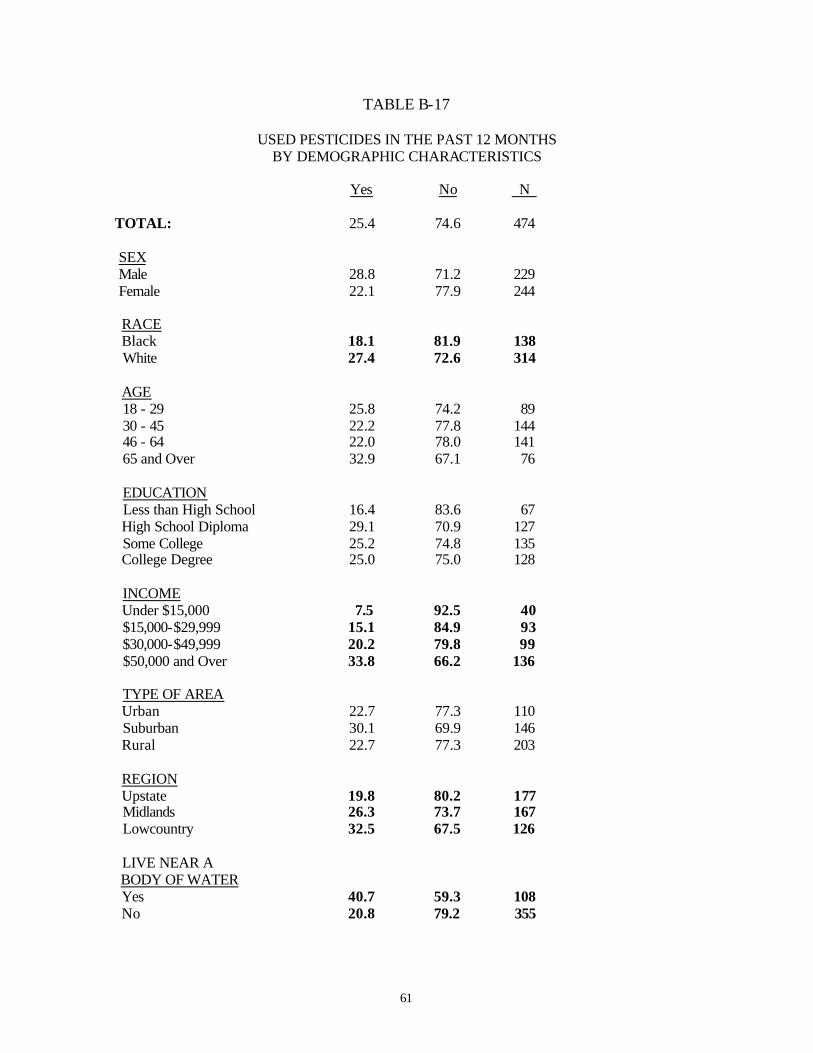
There were several group differences in the use of pesticides, the largest of which was
across income groups (see Table 6). Only 7.5% of those with family incomes under $15,000
reported applying pesticides to their yard; this percentage increased to 15.1% among those with
incomes in the $15,000 to $30,000 range, 20.2% for those with incomes from $30,000 to
12
TABLE 4 DISPOSAL OF YARD CLIPPINGS
Yes No N A. "Do you typically compost or recycle yard clippings, such as leaves, grass, and the like?" 52.7 47.3 474 B. How Disposes of Yard Clippings N
City/County picks them up 73 Leave/mulch on yard 38 Burn them 34 Take to dump 13 Dispose of with household garbage 12 Puts in the woods 10 Lawn maintenance takes care of them 9 Disposes of them in a ditch 6 Puts in a dumpster 3 Leave at curbside 2 Hauls them off (place not specified) 2 Takes to a landfill 2 Dumps on a vacant lot 2 County picks up large stuff, composts the rest 1 Rakes them up and dries them out 1 Puts them in a ditch or burns them 1
13
TABLE 5
PESTICIDE USE
Yes No N A. "Have pesticides been applied to your garden or yard in the past 12 months?" 25.4 74.6 474 B. Methods Used in Deciding How Much Pesticide to Apply
Yes No N Label Information 84.2 15.8 111 Apply Until Pest Are Gone 42.6 57.4 111 Consult Garden/Home Center 40.3 59.7 111 Ask Friends/Neighbors 35.0 65.0 111 Consulted Extension Service 28.0 72.0 111 Some Other Method* 6.1 93.9 111 *Other methods used included reference information from the University of Georgia; using ammonia to get rid of ants; other family member takes care of it; the Internet; knowledge from prior use; and help from the gardener.
14
TABLE 6
USED PESTICIDES IN THE PAST 12 MONTHS BY DEMOGRAPHIC CHARACTERISTICS
Yes No N
TOTAL: 25.4 74.6 474 SEX Male 28.8 71.2 229 Female 22.1 77.9 244 RACE Black 18.1 81.9 138 White 27.4 72.6 314 AGE 18 - 29 25.8 74.2 89 30 - 45 22.2 77.8 144 46 - 64 22.0 78.0 141 65 and Over 32.9 67.1 76 EDUCATION Less than High School 16.4 83.6 67 High School Diploma 29.1 70.9 127 Some College 25.2 74.8 135 College Degree 25.0 75.0 128 INCOME Under $15,000 7.5 92.5 40 $15,000-$29,999 15.1 84.9 93 $30,000-$49,999 20.2 79.8 99 $50,000 and Over 33.8 66.2 136 TYPE OF AREA Urban 22.7 77.3 110 Suburban 30.1 69.9 146 Rural 22.7 77.3 203 REGION Upstate 19.8 80.2 177 Midlands 26.3 73.7 167 Lowcountry 32.5 67.5 126 LIVE NEAR A BODY OF WATER Yes 40.7 59.3 108 No 20.8 79.2 355
15
$50,000, and 33.8% among those with incomes of $50,000 or more. In addition to these
distinctions across income groups, there were also differences between blacks and whites, across
regions of the state, and by whether respondents lived near a body of water. A higher percentage
of whites (27.4%) than blacks (18.1%) had pesticides applied to their yard in the past twelve
months. Respondents from the Lowcountry (32.5%) were more likely than those from the
Midlands (26.3%) or the Upstate (19.8%) to have used pesticides, while a higher percentage of
those who lived near a body of water (40.7%) than those who did not (20.8%) reported pesticide
use.
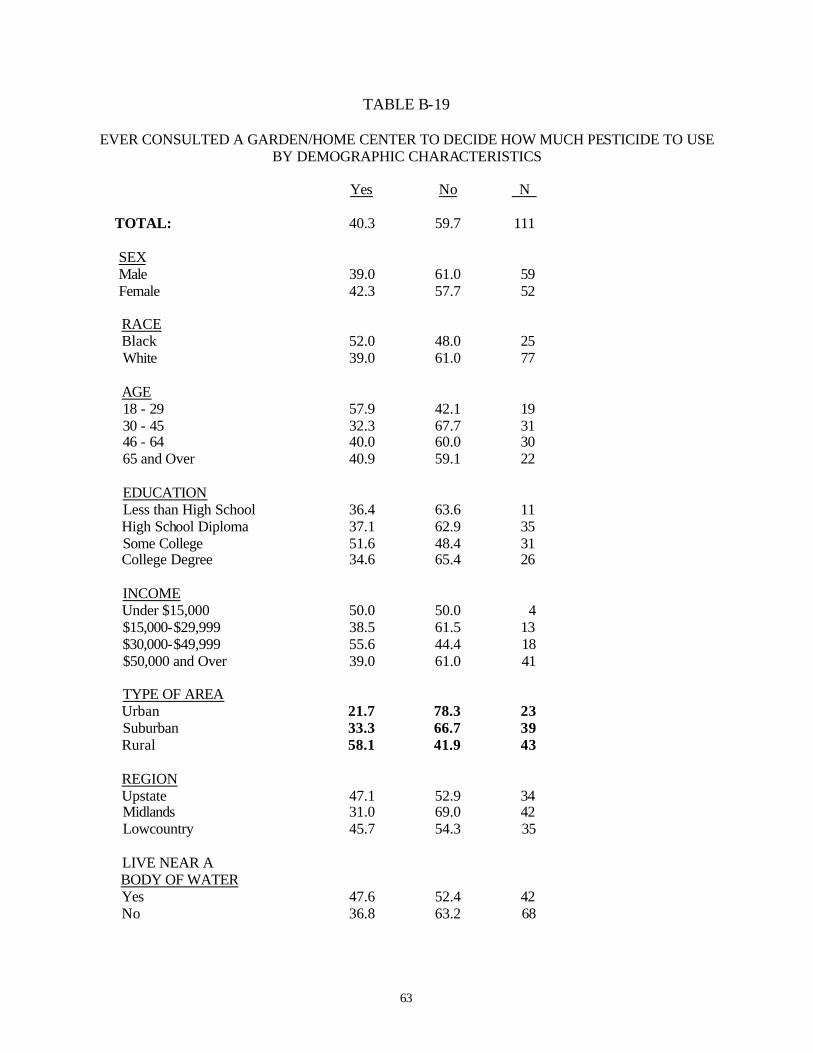
There were few significant differences among various demographic groups as to where
they got information on how much pesticide to use.2 Those ages 18 to 29 were less likely than
those in other age groups to use label information and more likely to ask their friends or
neighbors for advice on pesticide use. Respondents with less than a high school education were
also less likely to read the label in determining how much pesticide to apply. Respondents from
rural areas (58.1%) were much more likely than those from urban (21.7%) or suburban (33.3%)
areas to have consulted a garden or home center for advice on pesticide use. Close to 40% of
those from rural areas contacted the extension service concerning pesticide use, compared to
only 15.4% of those from the suburbs.
Disposal of Hazardous Chemical Products. The next environmentally-related behavior
about which respondents to this survey were questioned was disposal of hazardous chemical
products. Those interviewed were asked, "How do you dispose of products such as paints, paint
thinners, cleaners, pesticides, and varnishes ... Do you pour them down the drain, pour them on
the ground, pour them in a ditch, pour them down a storm drain, pour them in the street, put them 2 As was the case for the group comparisons on fertilizer user, the number of cases for several subgroups is relatively small and, consequently, reported differences should be interpreted with caution.
16
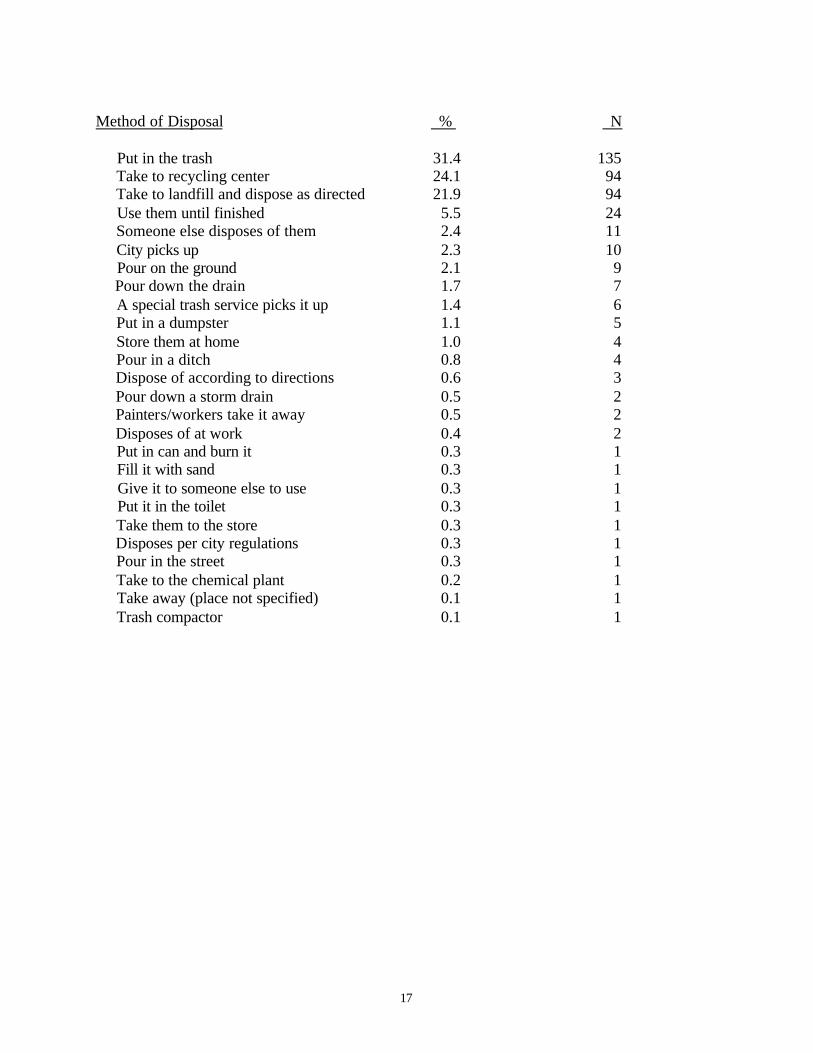
in the trash, or do you dispose of such substances in some other way?" Responses to this item are
presented in Table 7.
As these figures demonstrate, close to one-third of South Carolinians say they dispose of
such substances by putting them in the trash, approximately one-fourth take them to a recycling
center, and 21.9% take such products to the landfill and dispose of them as directed. Beyond
these three predominant ways of disposing hazardous chemicals, South Carolinians report
disposing of these substances in a number of other ways. Slightly more than 5% indicated that
they did not dispose of these products, but rather used them until they were finished, and 2.4%
replied that someone else disposed of such products for their household. Among other ways of
disposing of hazardous chemicals, 2.3% reported that the city picks them up, 2.1% pour such
products out on the ground, 1.7% pour them down the drain, 1.4% have a special trash service
that picks them up, and 1.1% put them in a dumpster. Other responses to this question included
storing them at home (1.0%), pouring them in a ditch (0.8%), pouring down a storm drain
(0.5%), putting them in the toilet (0.3%), and pouring them in the street (0.3%).
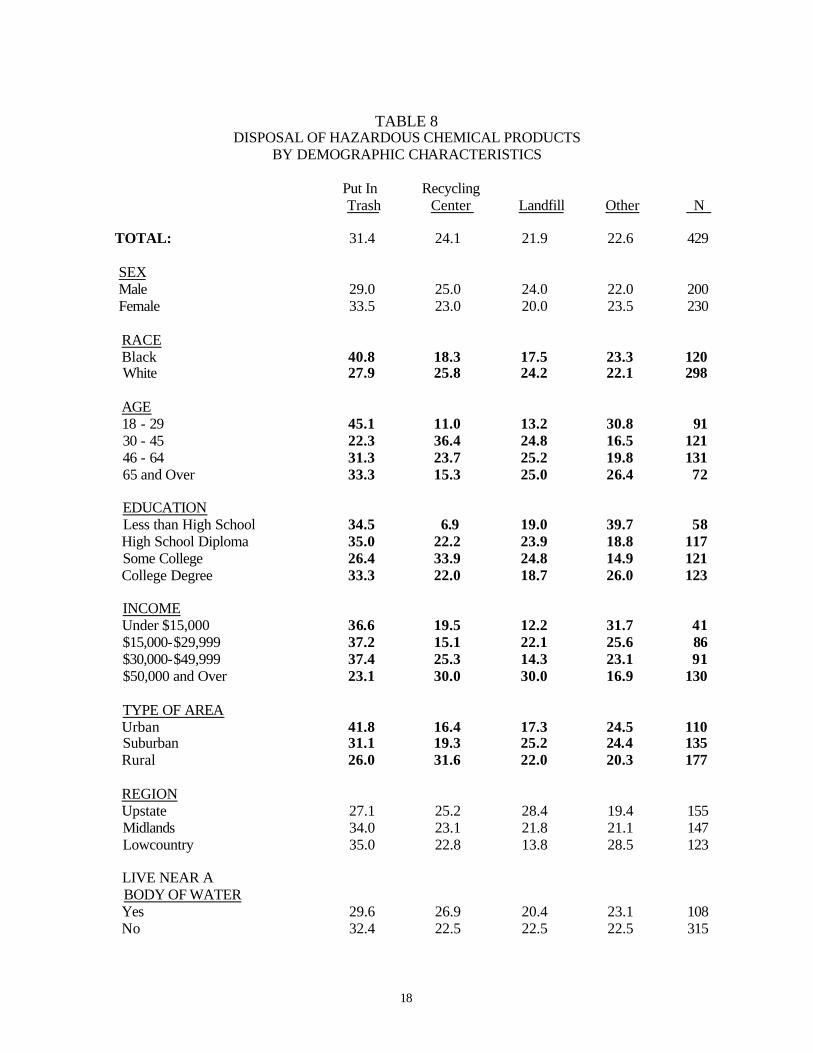
The data presented in Table 8 demonstrate that there are several differences among
subgroups in the way they dispose of these products. One of the largest differences is across age
groups. Those ages 18 to 29 are more likely to report disposing of such products in the trash or in
some other way; this youngest group is much less likely to dispose of such products in a landfill
or to recycle them.
A much higher percentage of black than white respondents (40.8% to 27.9%) put such
products in the trash, while whites were more likely to either take such products to a landfill or to
TABLE 7
DISPOSAL OF PRODUCTS SUCH AS PAINTS, PAINT THINNERS, CLEANERS, PESTICIDES, AND VARNISHES
17
Method of Disposal % N Put in the trash 31.4 135 Take to recycling center 24.1 94 Take to landfill and dispose as directed 21.9 94 Use them until finished 5.5 24 Someone else disposes of them 2.4 11 City picks up 2.3 10 Pour on the ground 2.1 9 Pour down the drain 1.7 7 A special trash service picks it up 1.4 6 Put in a dumpster 1.1 5 Store them at home 1.0 4 Pour in a ditch 0.8 4 Dispose of according to directions 0.6 3 Pour down a storm drain 0.5 2 Painters/workers take it away 0.5 2 Disposes of at work 0.4 2 Put in can and burn it 0.3 1 Fill it with sand 0.3 1 Give it to someone else to use 0.3 1 Put it in the toilet 0.3 1 Take them to the store 0.3 1 Disposes per city regulations 0.3 1 Pour in the street 0.3 1 Take to the chemical plant 0.2 1 Take away (place not specified) 0.1 1 Trash compactor 0.1 1
18
TABLE 8
DISPOSAL OF HAZARDOUS CHEMICAL PRODUCTS BY DEMOGRAPHIC CHARACTERISTICS
Put In Recycling Trash Center Landfill Other N
TOTAL: 31.4 24.1 21.9 22.6 429 SEX Male 29.0 25.0 24.0 22.0 200 Female 33.5 23.0 20.0 23.5 230 RACE Black 40.8 18.3 17.5 23.3 120 White 27.9 25.8 24.2 22.1 298 AGE 18 - 29 45.1 11.0 13.2 30.8 91 30 - 45 22.3 36.4 24.8 16.5 121 46 - 64 31.3 23.7 25.2 19.8 131 65 and Over 33.3 15.3 25.0 26.4 72 EDUCATION Less than High School 34.5 6.9 19.0 39.7 58 High School Diploma 35.0 22.2 23.9 18.8 117 Some College 26.4 33.9 24.8 14.9 121 College Degree 33.3 22.0 18.7 26.0 123 INCOME Under $15,000 36.6 19.5 12.2 31.7 41 $15,000-$29,999 37.2 15.1 22.1 25.6 86 $30,000-$49,999 37.4 25.3 14.3 23.1 91 $50,000 and Over 23.1 30.0 30.0 16.9 130 TYPE OF AREA Urban 41.8 16.4 17.3 24.5 110 Suburban 31.1 19.3 25.2 24.4 135 Rural 26.0 31.6 22.0 20.3 177 REGION Upstate 27.1 25.2 28.4 19.4 155 Midlands 34.0 23.1 21.8 21.1 147 Lowcountry 35.0 22.8 13.8 28.5 123 LIVE NEAR A BODY OF WATER Yes 29.6 26.9 20.4 23.1 108 No 32.4 22.5 22.5 22.5 315
19
recycle them. Similarly, respondents who lived in urban areas were more likely to dispose of
these products by putting them in the trash. Respondents with family incomes of $50,000 or
more were more likely to recycle such products or to take them to a landfill, while across
education groups, it was those with some college education who were less likely to dispose of
these products by putting them in the trash and more likely to recycle them of take them to a
landfill.
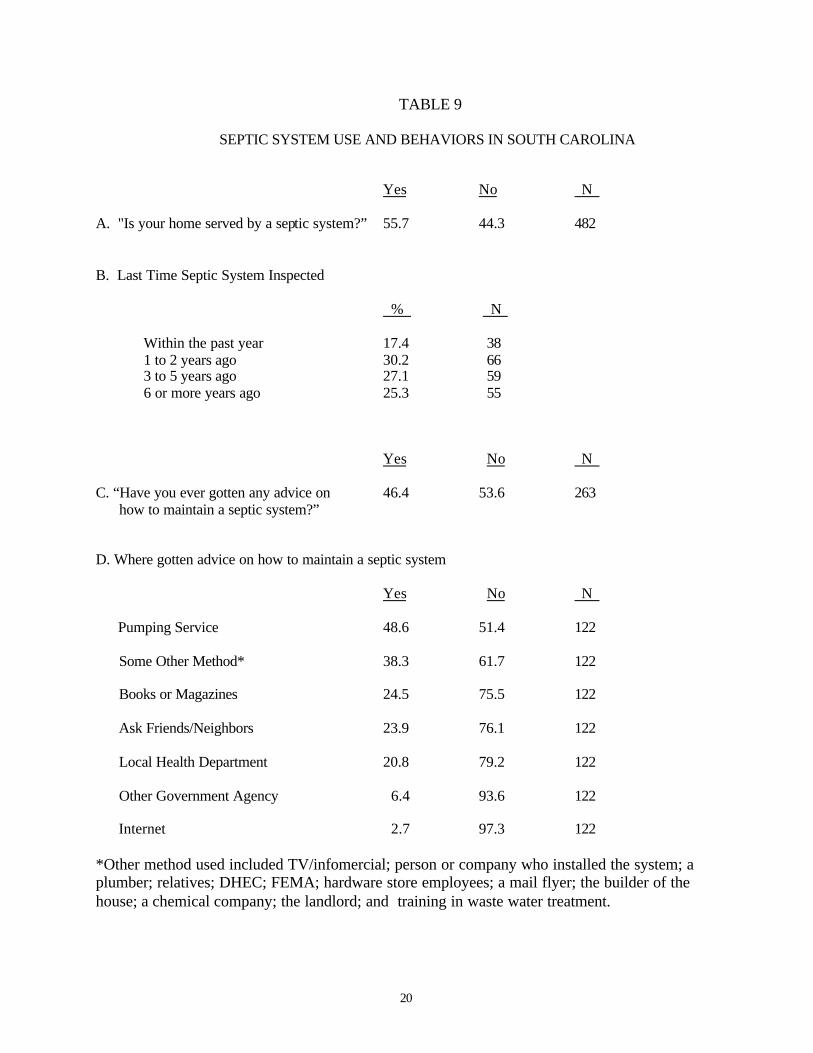
Septic System. As the data displayed in Table 9 indicate, more than half of South
Carolinians live in a residence served by a septic system. Of those with septic systems, 17.4%
reported that their system has been inspected within the past year, 30.2% within the past 1 to 2
years, 27.1% within the past 3 to 5 years, and 25.3% last had their septic system inspected six or
more years ago.
When asked if they had ever gotten any advice on how to maintain their septic system,
slightly less than half indicated that they had. Of those who have gotten information on
maintaining their septic system, almost half have received advice from a pumping service, 24.5%
consulted books or magazines, 23.9% asked friends or neighbors, 20.8% contacted their local
health department, 6.4% got advice from another governmental agency, and 2.7% got
information over the Internet. In addition, a large percentage of those who had gotten advice on
how to maintain a septic system – 38.3% – reported getting information on septic system
maintenance from some other source. These included TV or infomercials (12); the person or
company that installed the system (9); a plumber (6); relatives (3); DHEC (3); FEMA (2); and a
hardware store (2).
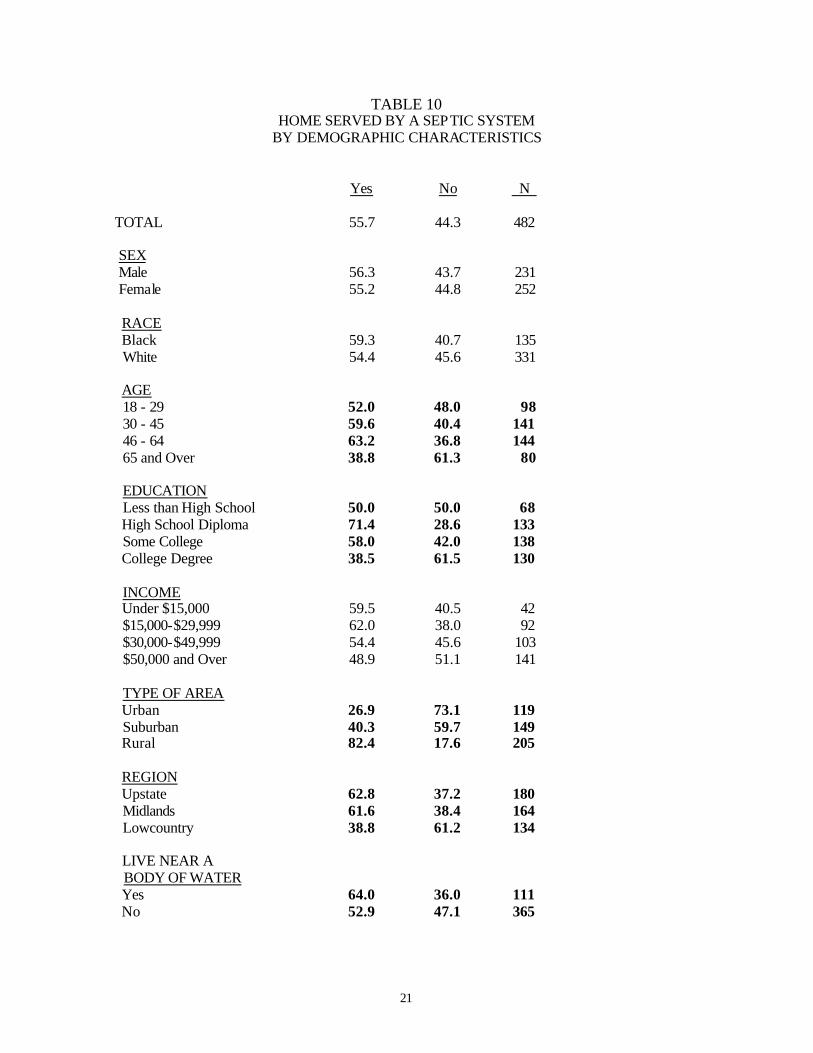
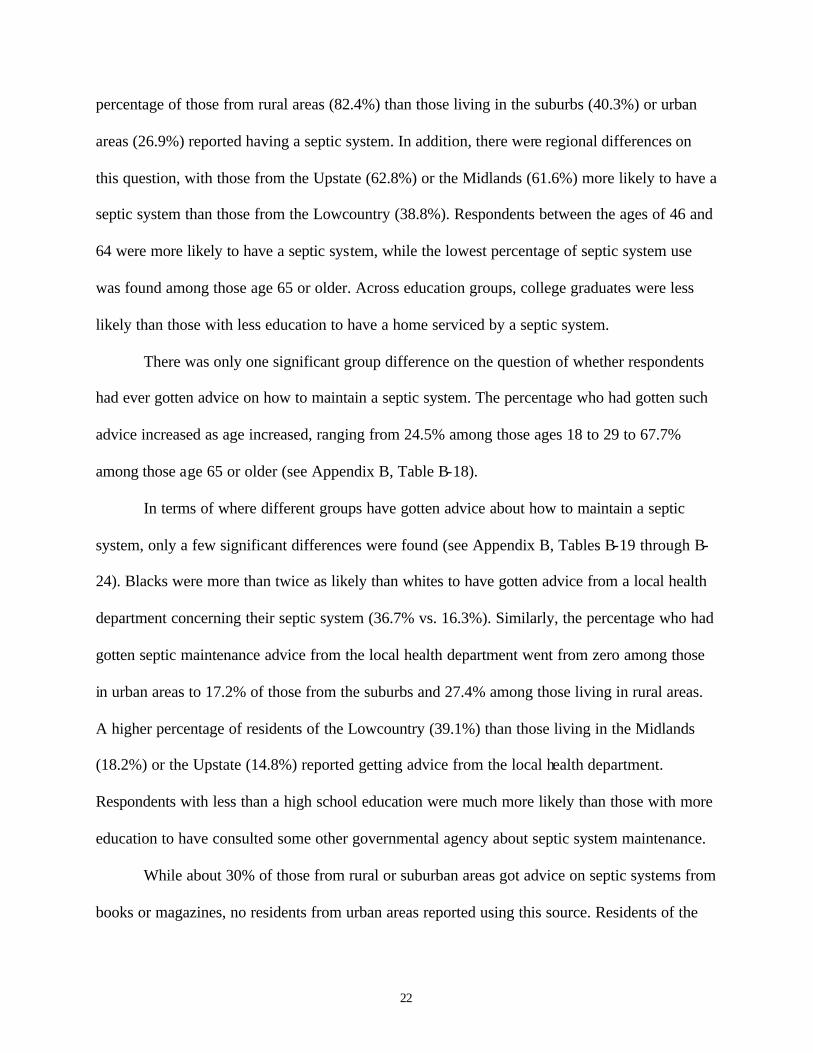
There were a several differences in the types of demographic groups whose homes were
served by a septic system (see Table 10). As would be expected, a considerably higher
20
TABLE 9
SEPTIC SYSTEM USE AND BEHAVIORS IN SOUTH CAROLINA
Yes No N A. "Is your home served by a septic system?” 55.7 44.3 482 B. Last Time Septic System Inspected
% N
Within the past year 17.4 38 1 to 2 years ago 30.2 66 3 to 5 years ago 27.1 59 6 or more years ago 25.3 55
Yes No N C. “Have you ever gotten any advice on 46.4 53.6 263 how to maintain a septic system?” D. Where gotten advice on how to maintain a septic system Yes No N Pumping Service 48.6 51.4 122 Some Other Method* 38.3 61.7 122 Books or Magazines 24.5 75.5 122 Ask Friends/Neighbors 23.9 76.1 122 Local Health Department 20.8 79.2 122 Other Government Agency 6.4 93.6 122 Internet 2.7 97.3 122 *Other method used included TV/infomercial; person or company who installed the system; a plumber; relatives; DHEC; FEMA; hardware store employees; a mail flyer; the builder of the house; a chemical company; the landlord; and training in waste water treatment.
21
TABLE 10 HOME SERVED BY A SEPTIC SYSTEM
BY DEMOGRAPHIC CHARACTERISTICS
Yes No N
TOTAL 55.7 44.3 482 SEX Male 56.3 43.7 231 Female 55.2 44.8 252 RACE Black 59.3 40.7 135 White 54.4 45.6 331 AGE 18 - 29 52.0 48.0 98 30 - 45 59.6 40.4 141 46 - 64 63.2 36.8 144 65 and Over 38.8 61.3 80 EDUCATION Less than High School 50.0 50.0 68 High School Diploma 71.4 28.6 133 Some College 58.0 42.0 138 College Degree 38.5 61.5 130 INCOME Under $15,000 59.5 40.5 42 $15,000-$29,999 62.0 38.0 92 $30,000-$49,999 54.4 45.6 103 $50,000 and Over 48.9 51.1 141 TYPE OF AREA Urban 26.9 73.1 119 Suburban 40.3 59.7 149 Rural 82.4 17.6 205 REGION Upstate 62.8 37.2 180 Midlands 61.6 38.4 164 Lowcountry 38.8 61.2 134 LIVE NEAR A BODY OF WATER Yes 64.0 36.0 111 No 52.9 47.1 365
22
percentage of those from rural areas (82.4%) than those living in the suburbs (40.3%) or urban
areas (26.9%) reported having a septic system. In addition, there were regional differences on
this question, with those from the Upstate (62.8%) or the Midlands (61.6%) more likely to have a
septic system than those from the Lowcountry (38.8%). Respondents between the ages of 46 and
64 were more likely to have a septic system, while the lowest percentage of septic system use
was found among those age 65 or older. Across education groups, college graduates were less
likely than those with less education to have a home serviced by a septic system.
There was only one significant group difference on the question of whether respondents
had ever gotten advice on how to maintain a septic system. The percentage who had gotten such
advice increased as age increased, ranging from 24.5% among those ages 18 to 29 to 67.7%
among those age 65 or older (see Appendix B, Table B-18).
In terms of where different groups have gotten advice about how to maintain a septic
system, only a few significant differences were found (see Appendix B, Tables B-19 through B-
24). Blacks were more than twice as likely than whites to have gotten advice from a local health
department concerning their septic system (36.7% vs. 16.3%). Similarly, the percentage who had
gotten septic maintenance advice from the local health department went from zero among those
in urban areas to 17.2% of those from the suburbs and 27.4% among those living in rural areas.
A higher percentage of residents of the Lowcountry (39.1%) than those living in the Midlands
(18.2%) or the Upstate (14.8%) reported getting advice from the local health department.
Respondents with less than a high school education were much more likely than those with more
education to have consulted some other governmental agency about septic system maintenance.
While about 30% of those from rural or suburban areas got advice on septic systems from
books or magazines, no residents from urban areas reported using this source. Residents of the
23
Lowcountry were significantly more likely than those from the Midlands or the Upstate to report
having gotten such advice on maintaining a septic system from a pumping service. South
Carolinians who live near a body of water were much more likely to report using the Internet to
find information about their septic system (8.3%) than were those who do not live near water
(1.2%)..
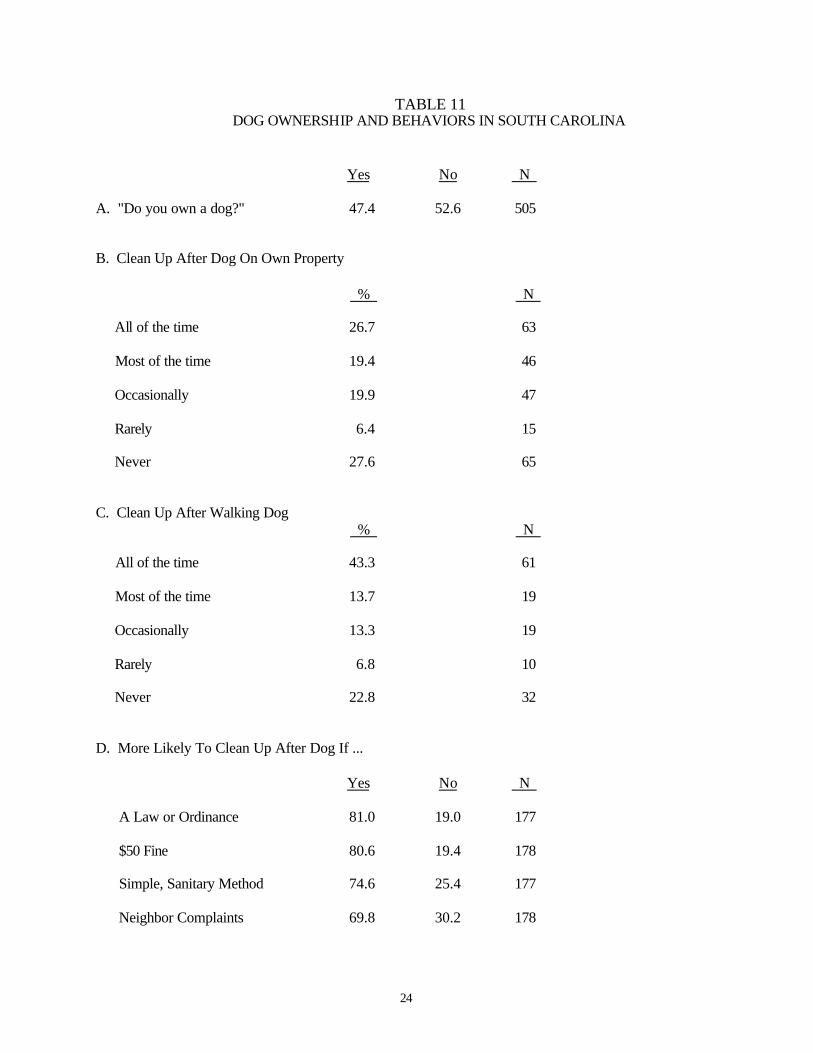
Dog Waste Disposal. About half of South Carolina adults own a dog. Among dog
owners, slightly more than one-fourth claim that they always clean up dog waste on their own
property and a similar number reported that they never clean up after their dog. Approximately
20% said they clean up after their dog on their own property most of the time, a similar
percentage said they clean up occasionally, and 6.4% do so rarely. A larger percentage of South
Carolina dog owners report cleaning up after their dog on walks, with 43.3% reporting cleaning
up dog waste on walks all of the time, 13.7% most of the time, 13.3% occasionally, 6.8% rarely,
and 22.8% never (Table 11).
Among demographic groups, whites, rural residents and those residing in the Upstate
were significantly more likely to report they never clean up dog waste on their own property (see
Appendix B, Table B-25). A higher percentage of females and residents of the Lowcountry
reported that they always clean up after their dog when walking them (see Append ix B, Table B-
26).
When asked whether various methods would increase the likelihood that they would
clean up after their dog, a majority of dog owners said that they each of the five alternatives
asked about would make it more likely that they would clean up after their pet (Table 11).
Approximately 80% said that a law or ordinance requiring clean-up would make it more likely
they would do so, and a similar percentage reported that a $50 fine would increase the likelihood
24
TABLE 11 DOG OWNERSHIP AND BEHAVIORS IN SOUTH CAROLINA
Yes No N A. "Do you own a dog?" 47.4 52.6 505 B. Clean Up After Dog On Own Property % N All of the time 26.7 63 Most of the time 19.4 46 Occasionally 19.9 47 Rarely 6.4 15 Never 27.6 65 C. Clean Up After Walking Dog % N All of the time 43.3 61 Most of the time 13.7 19 Occasionally 13.3 19 Rarely 6.8 10 Never 22.8 32 D. More Likely To Clean Up After Dog If ...
Yes No N A Law or Ordinance 81.0 19.0 177 $50 Fine 80.6 19.4 178 Simple, Sanitary Method 74.6 25.4 177 Neighbor Complaints 69.8 30.2 178

25
Convenient Disposal Locations 67.6 32.4 176
26
of clean-up. Three-fourths of dog owners say having a simple and sanitary method of pet waste
disposal would increase the likelihood they would clean up after their dogs, and almost 70% said
neighbor complaints or convenient disposal locations would affect their decision as to whether or
not to clean up after their pet.
There were few statistically significant differences among demographic subgroups as to
what would be effective in increasing the likelihood a respondent would clean up after their dog.
There was a significant difference among age groups on the impact of a $50 fine, with the
percentage who felt this would make them more likely to pick up after their dog ranging from
95.0% among those ages 18 to 29 to 66.7% of those age 65 or older. Respondents with less
education were more likely than those with some college education or more to feel that having
convenient disposal locations would increase their likelihood of picking up their dog’s waste.
Similarly, a higher percentage of residents of the Lowcountry (82.4%) than those from the
Upstate (70.1%) or Midlands (56.9%) thought that convenient disposal locations would increase
their likelihood of cleaning up after their dog. While the large majority of dog owners said that a
law or ordinance requiring clean up would lead them to do so, this was more evident among
those from the suburbs (92.2%) than those from urban (85.7%) or rural (75.8%) areas. (Appendix
B, Tables B-27 through B-31 provide the breakdowns of the responses to these items by
demographic characteristics).
Methods for Getting Information About Protecting Water Quality
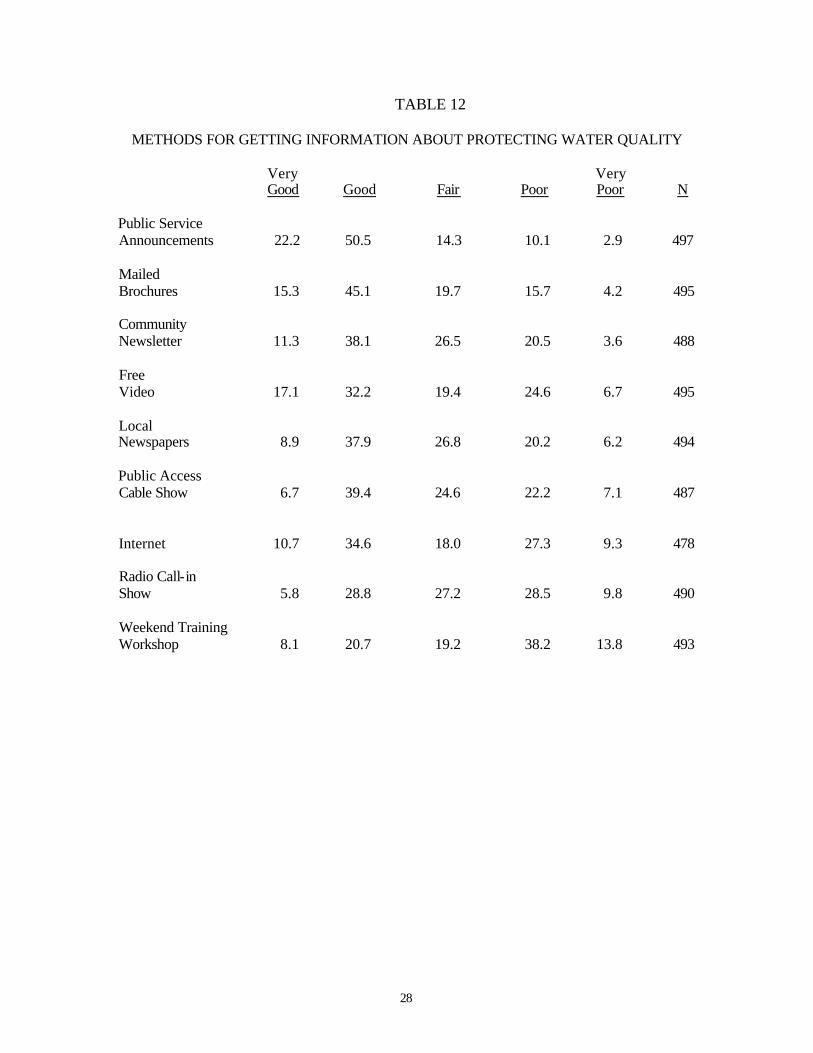
The last series of questions in this survey asked respondents to rate a variety of methods
that could be used to disseminate information to residents of South Carolina about protecting
water quality. Of the nine proposed methods, the most popular was public service
announcements (PSAs) with over seventy percent rating PSAs as being a very good or good
27
method for getting information about protecting water quality (see Table 12). A mailed brochure
was the second highest rated method (60.4% very good or good) and almost half of the
respondents felt community newsletters or free videos were very good or good ways to
disseminate information on this topic. Less popular methods included local newspapers (46.8%
very good or good), public access cable shows (46.1%), the Internet (45.3%), radio call- in shows
(34.6%), or a weekend training workshop (28.8%).
There were a number of significant differences among subgroups in their views of the
effectiveness of various ways for disseminating information about protecting water quality (see
Appendix B, Tables B-32 through B-40). Among the most important of these were the
differences between men and women. Females were significantly more likely than males to feel
that distributing information on protecting water quality through mailed brochures, community
newsletters, local newspapers, or the Internet would be effective. Significantly more male than
female respondents rated public cable access television shows as a poor or very poor way idea to
distribute information on this topic.
A significantly higher percentage of blacks than whites thought that several of these
methods would be effective in providing this information. Combining the very good and good
responses, the following percentages of blacks and whites thought that different methods were
good ways of getting this information to the public: public service announcements (blacks,
77.7%; whites, 70.3%); free videos (61.2%; 44.5%); local newspapers (54.1%; 43.0%); public
access cable shows (53.9%; 42.8%); the Internet (56.8%; 40.7%); and week-end training
workshops (41.0%; 23.7%).
In general, South Carolinians with a college degree were less likely than those with less
education to believe that these suggested methods were good ways of distributing information
28
TABLE 12
METHODS FOR GETTING INFORMATION ABOUT PROTECTING WATER QUALITY
Very Very Good Good Fair Poor Poor N Public Service Announcements 22.2 50.5 14.3 10.1 2.9 497 Mailed Brochures 15.3 45.1 19.7 15.7 4.2 495 Community Newsletter 11.3 38.1 26.5 20.5 3.6 488 Free Video 17.1 32.2 19.4 24.6 6.7 495 Local Newspapers 8.9 37.9 26.8 20.2 6.2 494 Public Access Cable Show 6.7 39.4 24.6 22.2 7.1 487 Internet 10.7 34.6 18.0 27.3 9.3 478 Radio Call-in Show 5.8 28.8 27.2 28.5 9.8 490 Weekend Training Workshop 8.1 20.7 19.2 38.2 13.8 493
29
about preventing water pollution. This was particularly the case for methods such as week-end
training workshops, mailed brochures, public access cable television, radio call- in shows, and
free videos.
Respondents under age 30 were least likely to think that mailed brochures were a very
good way to distribute this information, while younger people were more likely to believe that
the Internet was a good way to let the public know about preventing water pollution.
Respondents in different income groups had varying opinions concerning the best ways
to disseminate information about protecting water quality. Those in the lower income brackets
(under $30,000) were significantly more likely than wealthier respondents to feel local
newspapers would be a good or very good method of information distribution on this topic.
Almost a quarter of those with household incomes of less than $15,000 rated distributing free
videos as a very poor option, while less than 6% of the respondents in higher income brackets
gave this option the lowest rating. Low-income respondents were also more likely than those
with higher incomes to feel that public service announcements were a very poor technique to
distribute such information. On the other hand, these respondents in the lowest income category
were significantly more positive about receiving information on water pollution prevention via
the Internet, with 25% rating this option as very good compared to 12.9% of those with incomes
of $15,000 to $29,999, 5.8% of those with incomes in the $30,000 to $49,999 range, and 12.1%
of those with incomes of $50,000 or more. Those in the highest income bracket ($50,000 or
more) were the most likely to rate weekend trainings was a poor or very poor idea. A radio call-
in program on protecting water quality was rated more positively by those with incomes between
$15,000 and $29,999 than those with incomes of less than $15,000 or $30,000 or more.
30
Summary
The results of this survey demonstrate that South Carolinians generally acknowledge that
what people do on land can have a significant affect on nearby bodies of water. They also believe
that septic tank inspections can protect water quality, that fertilizers and pesticides can harm
water quality, that pet waste can be a source of bacteria in bodies of water, and that shrubs and
trees along banks can protect water quality.
They are less aware as to whether or not storm drain water is treated before being
released into rivers or whether cities and farms are more significant sources of water pollution
than industrial facilities. About half of South Carolina adults said they knew the body of water
into which runoff water from their neighborhood flowed.
A third of South Carolina residents report having fertilized their lawns in the past 12
months and approximately one-fourth had used pesticides on their yards or gardens. Slightly
more than half say they typically compost or recycle yard clippings.
About one-third of South Carolinians say that they dispose of products such as paints,
paint thinners, cleaners, pesticides, and varnishes by putting them in the trash; approximately
one-fourth take such items to a recycling center and 21.9% say they take these types of products
to a landfill and dispose of them as directed. Blacks, younger people, those with family incomes
under $50,000 and those from urban areas were more likely to report disposing of such products
by putting them in the trash.
About half of South Carolina residents own a dog. Approximately one-fourth of them
clean up after their dog all of the time on their own property, and 43.3% say they clean up all the
time when they walk their dog. A large majority of dog owners felt that each of five strategies
31
for encouraging them to clean up after their dog – particularly a law or ordinance requiring it or a
$50 fine – would increase the likelihood they would do so.
South Carolinians generally believe that there are a number of good methods for getting
information to the public about protecting water quality. Public service announcements were
thought to be the most effective means of providing such information, followed by mailed
brochures, community newsletters, and free videos. Weekend training workshops and radio call-
in shows were least likely to be rated as good or very good ways of distributing such information
to the public.
32
Appendix A
Field Version of Questionnaire
Note 1: Weighting Used in Analysis
Note 2: Counties Used in Regional Analyses
33
SURVEY RESEARCH LABORATORY
PUBLIC PERCEPTIONS AND CONCERN ABOUT RUNOFF POLLUTION Field Version 11/14/02
"Hello, this is ______________________ calling for the University of South Carolina. This month the University is conducting a confidential study of public opinion in South Carolina and we'd really appreciate your help and cooperation." "First, let me make sure I've dialed the correct phone number ... “Is this ________________?" "My first questions are about environmental issues." 1. "In your opinion, how much does what people do on the land affect nearby bodies of water ... a great deal, somewhat, not too much, or not at all?"
1. GREAT DEAL 2. SOMEWHAT 3. NOT TOO MUCH 4. NOT AT ALL 5. DON'T KNOW (PROBE: "In general ...")
2. "How much do shrubs and trees left along the banks of creeks, streams and lakes protect water quality... a great deal, somewhat, not too much, or not at all?"
1. GREAT DEAL 2. SOMEWHAT 3. NOT TOO MUCH 4. NOT AT ALL 5. DON'T KNOW (PROBE: "In general ...")
3. “Inspection and routine clean out of septic tanks is necessary to protect the water quality of nearby bodies of water. Do you ..." (READ 1 THRU 4)
1. strongly agree,
2. agree, 3. disagree, or 4. strongly disagree 5. DON'T KNOW (PROBE: "In general ...")
34
4. "Pet waste can be a source of bacteria for nearby streams and bodies of water. Do you ..." (READ 1 THRU 4)
1. strongly agree,
2. agree, 3. disagree, or 4. strongly disagree 5. DON'T KNOW (PROBE: "In general ...")
5. "Even if you don’t live right next to a creek, river or lake, fertilizers and pesticides used on your property can harm local bodies of water. Do you ..." (READ 1 THRU 4)
1. strongly agree,
2. agree, 3. disagree, or 4. strongly disagree 5. DON'T KNOW (PROBE: "In general ...")
"The next two questions are true or false questions." 6. "In most cities and towns in South Carolina, water that goes down storm drains is treated at water treatment plants before it is released into the nearest river ... is this true, false, or are you not sure about this?" 1. TRUE 2. FALSE 3. DON'T KNOW (DO NOT PROBE) 7. "In South Carolina, runoff from farms and cities causes more water pollution than industrial facilities ... is this true, false, or are you not sure about this?"
1. TRUE 2. FALSE 3. DON'T KNOW (DO NOT PROBE) 8. "When it rains in your neighborhood, do you know which body of water the runoff from rainwater flows into?
1. YES 2. NO 3. DON'T KNOW (DO NOT PROBE)
35
9. "Has your yard been fertilized in the past twelve months?"
1. YES 2. NO -------------- GO TO Q.12 3. DON'T KNOW (PROBE: "Has it been fertilized even once?") -- GO TO Q.12
4. DOESN'T HAVE A YARD (VOLUNTEERED) ------------------ GO TO Q.16 10. "How many times (has your yard been fertilized in the past twelve months)?" _____ _____ RECORD NUMBER 98. DON'T KNOW (PROBE: "Just approximately ...") 11. "Have you ever used any of the following in deciding how much fertilizer to apply to your yard?" a. "label information" 1. YES 2. NO 3. DON'T KNOW (PROBE: "Have you ever used this to decide?") 4. DOES NOT MAKE DECISION (E.G., OTHER FAMILY MEMBER/ SOMEONE ELSE RESPONSIBLE) ----------------- GO TO Q.12 5. LAWN CARE SERVICE RESPONSIBLE --------- GO TO Q.12 YES NO DK
b. "consulting with the garden or home center" 1 2 3 c. "the recommendations of the extension service" 1 2 3 d. "asking your friends or neighbors" 1 2 3
e. "fertilizing until your lawn is green" 1 2 3 f. "the recommendations of a lawn care company" 1 2 3
g. "do you use some other method to decide how much fertilizer to apply to your yard" 1 2 3 SPECIFY: _______________________________
12. "Do you typically compost or recycle yard clippings, such as leaves, grass, and the like?"
1. YES --------------------------------------------------- GO TO Q.14 2. NO
3. DON'T KNOW (PROBE: "Do you usually compost or recycle?") – GO TO Q.14 4. NO YARD/NOT RESPONSIBLE FOR YARD CLIPPINGS (VOL) – GO TO Q.14
36
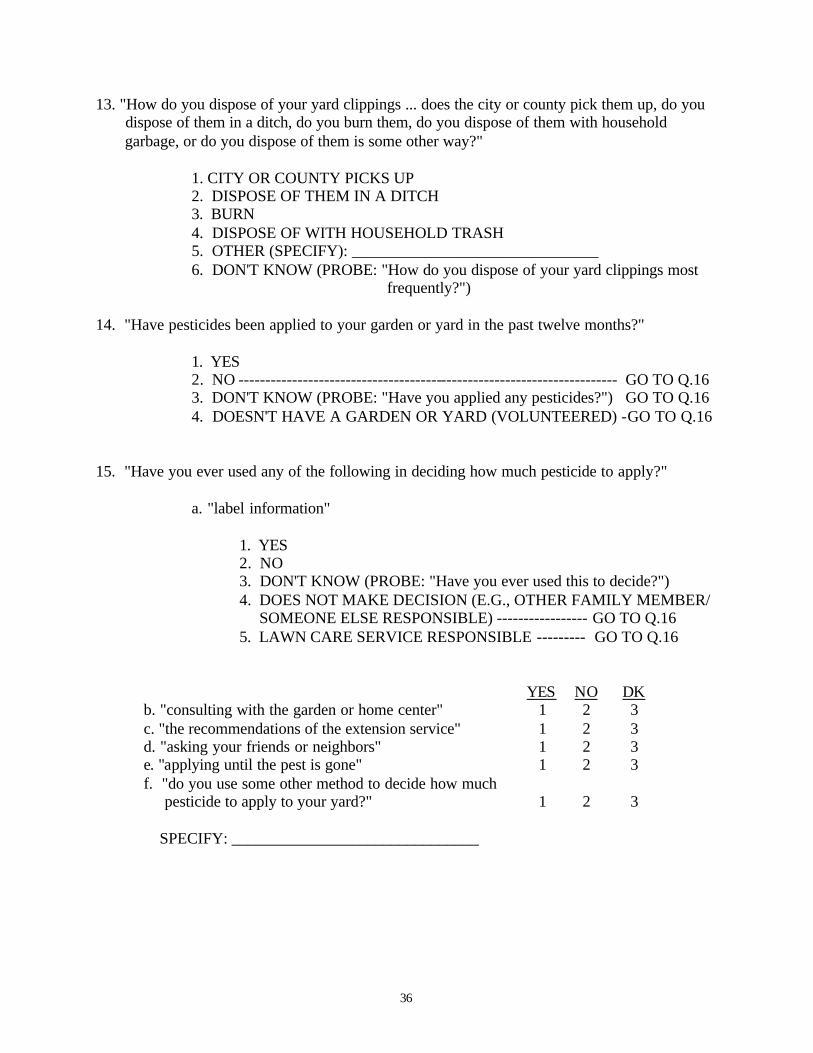
13. "How do you dispose of your yard clippings ... does the city or county pick them up, do you dispose of them in a ditch, do you burn them, do you dispose of them with household garbage, or do you dispose of them is some other way?" 1. CITY OR COUNTY PICKS UP 2. DISPOSE OF THEM IN A DITCH 3. BURN 4. DISPOSE OF WITH HOUSEHOLD TRASH 5. OTHER (SPECIFY): _______________________________ 6. DON'T KNOW (PROBE: "How do you dispose of your yard clippings most frequently?") 14. "Have pesticides been applied to your garden or yard in the past twelve months?"
1. YES 2. NO ----------------------------------------------------------------------- GO TO Q.16 3. DON'T KNOW (PROBE: "Have you applied any pesticides?") GO TO Q.16 4. DOESN'T HAVE A GARDEN OR YARD (VOLUNTEERED) -GO TO Q.16
15. "Have you ever used any of the following in deciding how much pesticide to apply?"
a. "label information" 1. YES 2. NO 3. DON'T KNOW (PROBE: "Have you ever used this to decide?") 4. DOES NOT MAKE DECISION (E.G., OTHER FAMILY MEMBER/ SOMEONE ELSE RESPONSIBLE) ----------------- GO TO Q.16 5. LAWN CARE SERVICE RESPONSIBLE --------- GO TO Q.16 YES NO DK
b. "consulting with the garden or home center" 1 2 3 c. "the recommendations of the extension service" 1 2 3 d. "asking your friends or neighbors" 1 2 3
e. "applying until the pest is gone" 1 2 3 f. "do you use some other method to decide how much pesticide to apply to your yard?" 1 2 3 SPECIFY: _______________________________
37
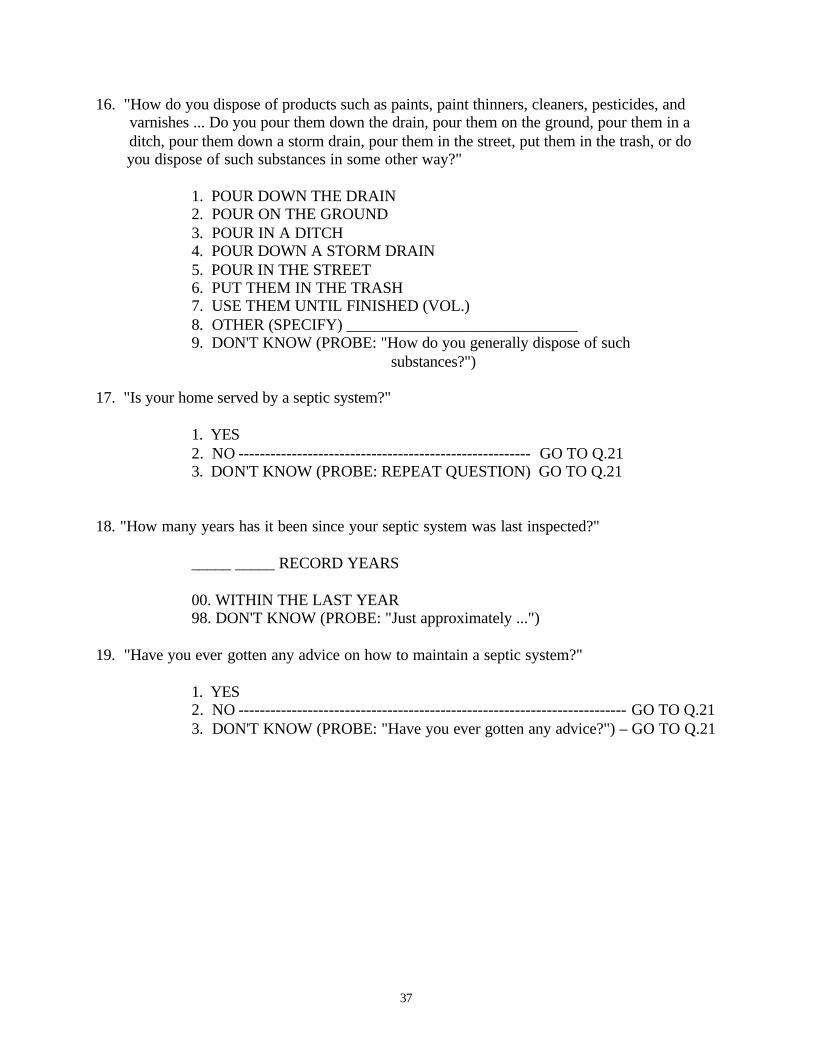
16. "How do you dispose of products such as paints, paint thinners, cleaners, pesticides, and varnishes ... Do you pour them down the drain, pour them on the ground, pour them in a ditch, pour them down a storm drain, pour them in the street, put them in the trash, or do you dispose of such substances in some other way?" 1. POUR DOWN THE DRAIN 2. POUR ON THE GROUND 3. POUR IN A DITCH 4. POUR DOWN A STORM DRAIN 5. POUR IN THE STREET 6. PUT THEM IN THE TRASH 7. USE THEM UNTIL FINISHED (VOL.) 8. OTHER (SPECIFY) _____________________________
9. DON'T KNOW (PROBE: "How do you generally dispose of such substances?")
17. "Is your home served by a septic system?"
1. YES 2. NO ------------------------------------------------------- GO TO Q.21 3. DON'T KNOW (PROBE: REPEAT QUESTION) GO TO Q.21
18. "How many years has it been since your septic system was last inspected?" _____ _____ RECORD YEARS 00. WITHIN THE LAST YEAR 98. DON'T KNOW (PROBE: "Just approximately ...") 19. "Have you ever gotten any advice on how to maintain a septic system?"
1. YES 2. NO ------------------------------------------------------------------------- GO TO Q.21 3. DON'T KNOW (PROBE: "Have you ever gotten any advice?") – GO TO Q.21
38
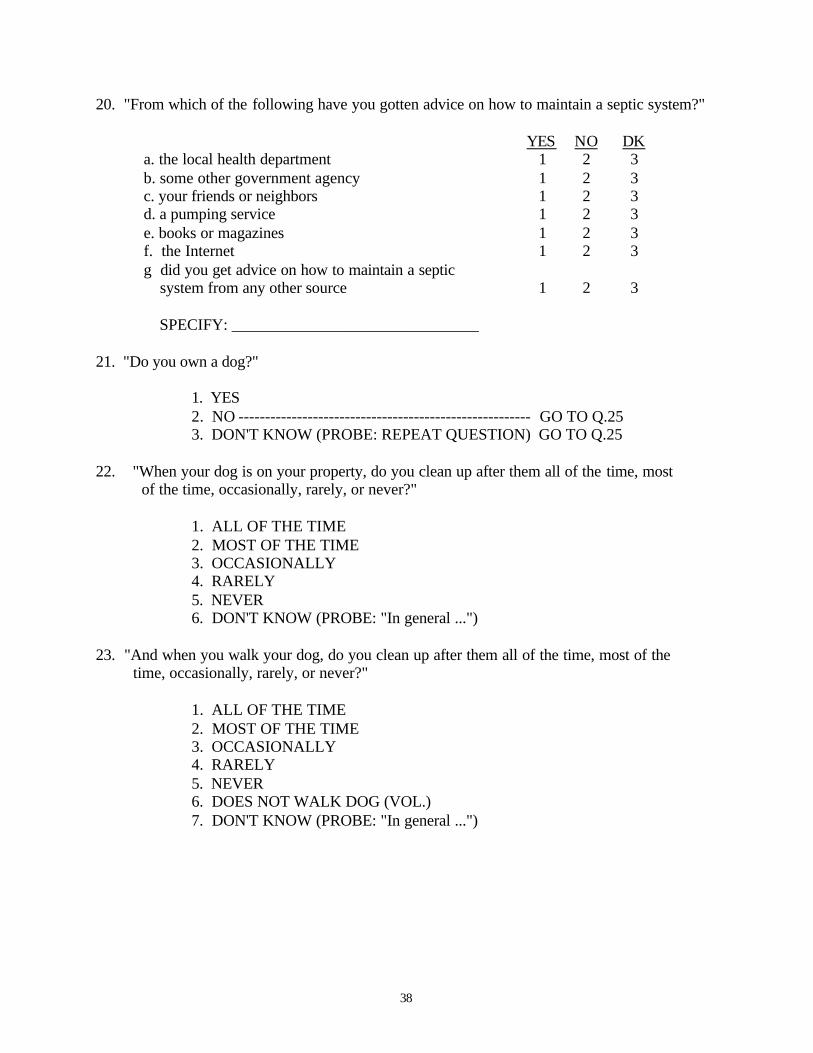
20. "From which of the following have you gotten advice on how to maintain a septic system?" YES NO DK
a. the local health department 1 2 3 b. some other government agency 1 2 3 c. your friends or neighbors 1 2 3 d. a pumping service 1 2 3
e. books or magazines 1 2 3 f. the Internet 1 2 3
g did you get advice on how to maintain a septic system from any other source 1 2 3 SPECIFY: _______________________________
21. "Do you own a dog?"
1. YES 2. NO ------------------------------------------------------- GO TO Q.25 3. DON'T KNOW (PROBE: REPEAT QUESTION) GO TO Q.25
22. "When your dog is on your property, do you clean up after them all of the time, most of the time, occasionally, rarely, or never?" 1. ALL OF THE TIME 2. MOST OF THE TIME 3. OCCASIONALLY 4. RARELY 5. NEVER 6. DON'T KNOW (PROBE: "In general ...") 23. "And when you walk your dog, do you clean up after them all of the time, most of the time, occasionally, rarely, or never?" 1. ALL OF THE TIME 2. MOST OF THE TIME 3. OCCASIONALLY 4. RARELY 5. NEVER 6. DOES NOT WALK DOG (VOL.) 7. DON'T KNOW (PROBE: "In general ...")
39
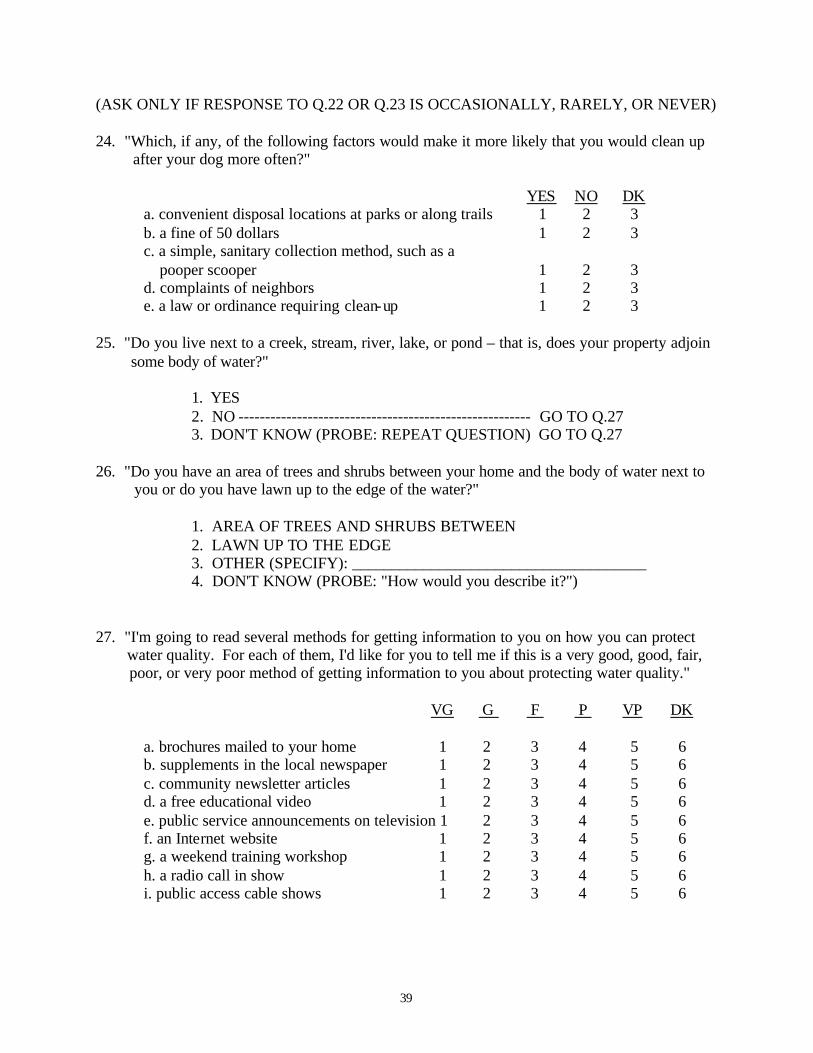
(ASK ONLY IF RESPONSE TO Q.22 OR Q.23 IS OCCASIONALLY, RARELY, OR NEVER) 24. "Which, if any, of the following factors would make it more likely that you would clean up after your dog more often?"
YES NO DK a. convenient disposal locations at parks or along trails 1 2 3 b. a fine of 50 dollars 1 2 3 c. a simple, sanitary collection method, such as a pooper scooper 1 2 3 d. complaints of neighbors 1 2 3
e. a law or ordinance requiring clean-up 1 2 3
25. "Do you live next to a creek, stream, river, lake, or pond – that is, does your property adjoin some body of water?"
1. YES 2. NO ------------------------------------------------------- GO TO Q.27 3. DON'T KNOW (PROBE: REPEAT QUESTION) GO TO Q.27
26. "Do you have an area of trees and shrubs between your home and the body of water next to you or do you have lawn up to the edge of the water?" 1. AREA OF TREES AND SHRUBS BETWEEN 2. LAWN UP TO THE EDGE 3. OTHER (SPECIFY): _____________________________________ 4. DON'T KNOW (PROBE: "How would you describe it?") 27. "I'm going to read several methods for getting information to you on how you can protect water quality. For each of them, I'd like for you to tell me if this is a very good, good, fair, poor, or very poor method of getting information to you about protecting water quality." VG G F P VP DK
a. brochures mailed to your home 1 2 3 4 5 6 b. supplements in the local newspaper 1 2 3 4 5 6 c. community newsletter articles 1 2 3 4 5 6 d. a free educational video 1 2 3 4 5 6 e. public service announcements on television 1 2 3 4 5 6 f. an Internet website 1 2 3 4 5 6 g. a weekend training workshop 1 2 3 4 5 6 h. a radio call in show 1 2 3 4 5 6 i. public access cable shows 1 2 3 4 5 6
40
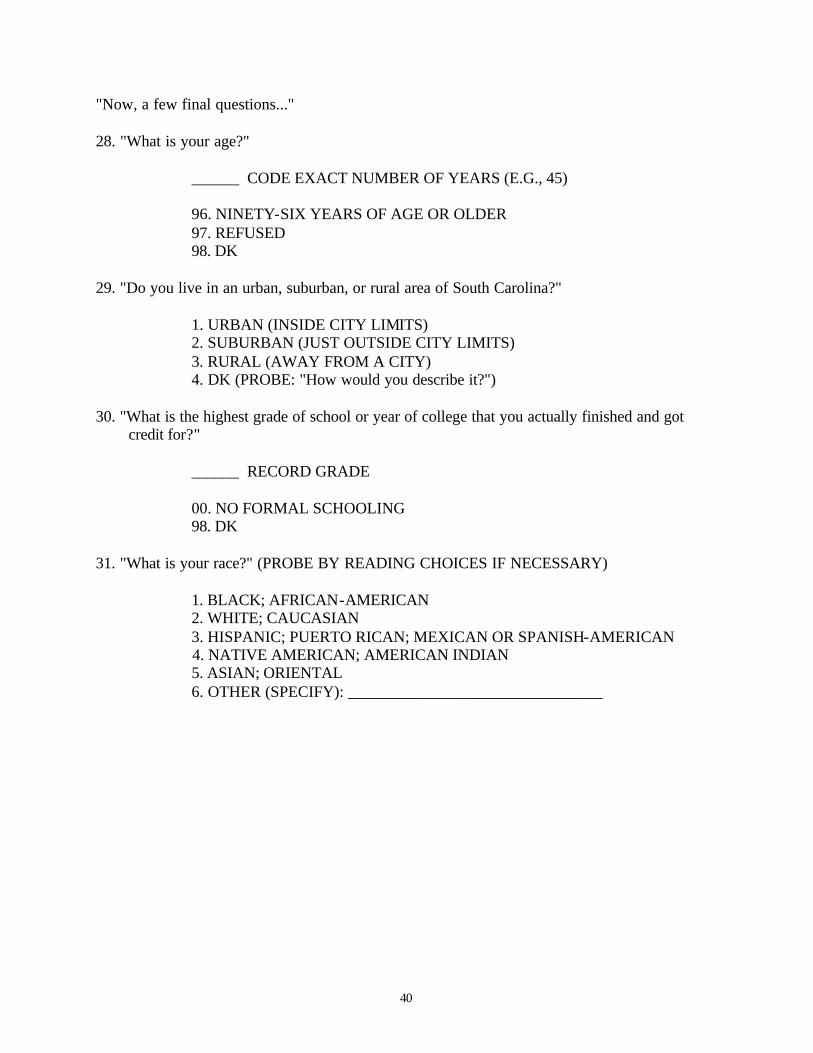
"Now, a few final questions..." 28. "What is your age?" ______ CODE EXACT NUMBER OF YEARS (E.G., 45) 96. NINETY-SIX YEARS OF AGE OR OLDER 97. REFUSED 98. DK 29. "Do you live in an urban, suburban, or rural area of South Carolina?" 1. URBAN (INSIDE CITY LIMITS) 2. SUBURBAN (JUST OUTSIDE CITY LIMITS) 3. RURAL (AWAY FROM A CITY) 4. DK (PROBE: "How would you describe it?") 30. "What is the highest grade of school or year of college that you actually finished and got credit for?" ______ RECORD GRADE 00. NO FORMAL SCHOOLING 98. DK 31. "What is your race?" (PROBE BY READING CHOICES IF NECESSARY) 1. BLACK; AFRICAN-AMERICAN 2. WHITE; CAUCASIAN 3. HISPANIC; PUERTO RICAN; MEXICAN OR SPANISH-AMERICAN 4. NATIVE AMERICAN; AMERICAN INDIAN 5. ASIAN; ORIENTAL 6. OTHER (SPECIFY): ________________________________
41
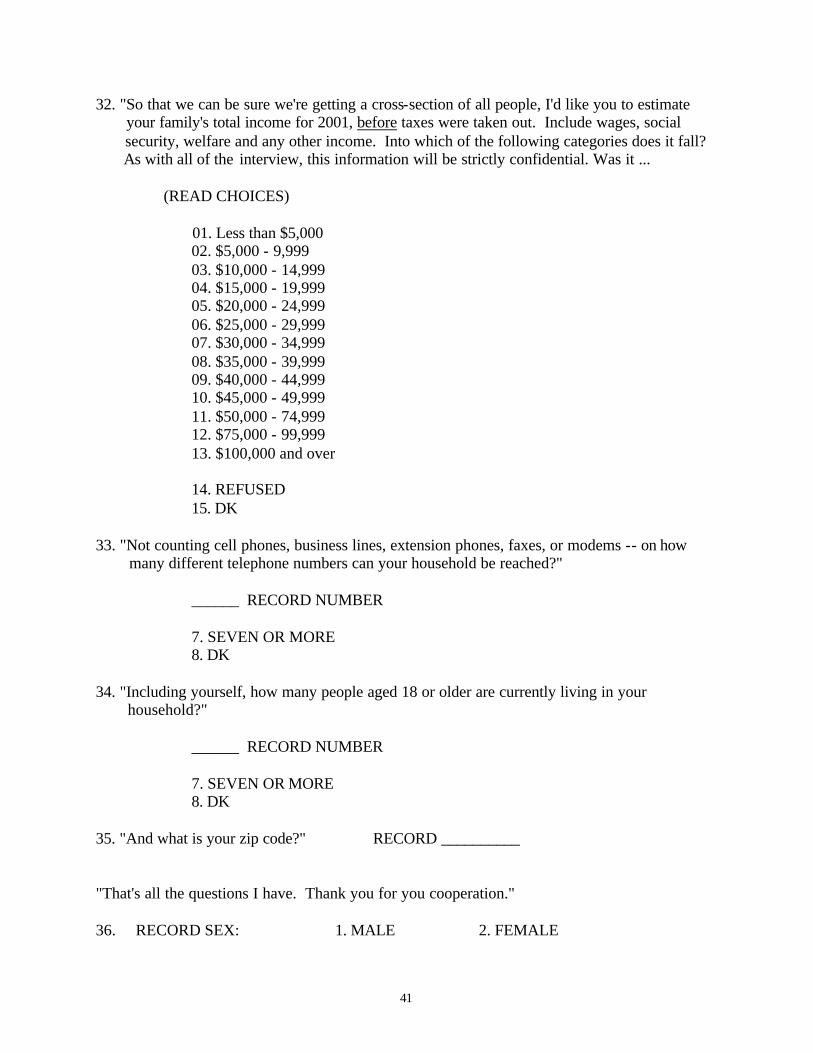
32. "So that we can be sure we're getting a cross-section of all people, I'd like you to estimate your family's total income for 2001, before taxes were taken out. Include wages, social security, welfare and any other income. Into which of the following categories does it fall? As with all of the interview, this information will be strictly confidential. Was it ... (READ CHOICES) 01. Less than $5,000 02. $5,000 - 9,999 03. $10,000 - 14,999 04. $15,000 - 19,999 05. $20,000 - 24,999 06. $25,000 - 29,999 07. $30,000 - 34,999 08. $35,000 - 39,999 09. $40,000 - 44,999 10. $45,000 - 49,999 11. $50,000 - 74,999 12. $75,000 - 99,999 13. $100,000 and over 14. REFUSED 15. DK 33. "Not counting cell phones, business lines, extension phones, faxes, or modems -- on how many different telephone numbers can your household be reached?" ______ RECORD NUMBER 7. SEVEN OR MORE 8. DK 34. "Including yourself, how many people aged 18 or older are currently living in your household?" ______ RECORD NUMBER 7. SEVEN OR MORE 8. DK 35. "And what is your zip code?" RECORD __________ "That's all the questions I have. Thank you for you cooperation." 36. RECORD SEX: 1. MALE 2. FEMALE
42
Note 1 Weights Used in Analysis
Several weight ing variables for the Polluted Runoff Awareness and Behavior Survey
data have been created and added to the data file. The first is a weight to adjust for households that
can be reached on more than one telephone number. This weight has been developed so that such
households are not overrepresented in the sample. This weight should be applied to the data
whenever households are the desired unit of analysis.
The second weighting variable adjusts for the fact that the sampling unit in the survey was
the household rather than the individual respondent. It also adjusts for multiple telephone
households. When the individual is the appropriate unit of analysis rather than the household, this
weight should be used.
The third weighting variable makes additional adjustments to the individual weight for
underrepresentation of various demographic groups in the population due to either nonresponse
or to the fact that certain households do not have a telephone. The degree of underrepresentation
is assessed by comparing the demographic data from the survey with population estimates
provided by the U.S. Census Bureau. This weight should always be used to ensure that a
representative sample for making estimates of the true population figures for South Carolina.
43
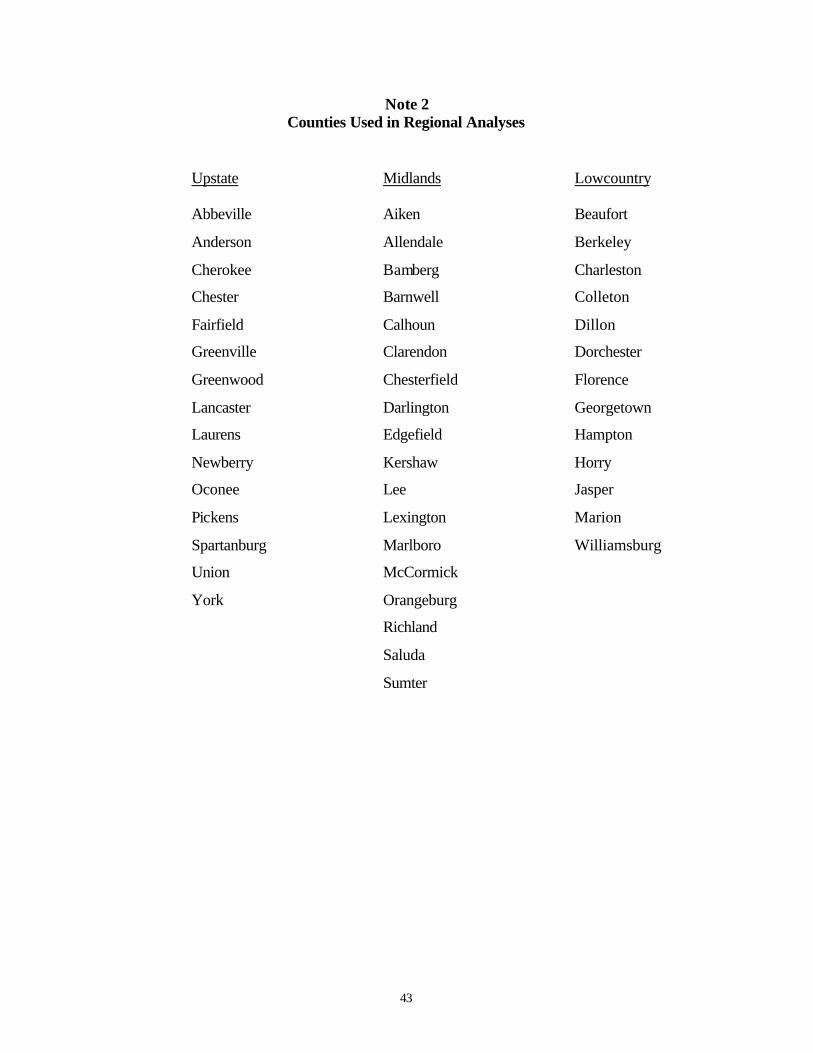
Note 2 Counties Used in Regional Analyses
Upstate Midlands Lowcountry Abbeville Aiken Beaufort
Anderson Allendale Berkeley
Cherokee Bamberg Charleston
Chester Barnwell Colleton
Fairfield Calhoun Dillon
Greenville Clarendon Dorchester
Greenwood Chesterfield Florence
Lancaster Darlington Georgetown
Laurens Edgefield Hampton
Newberry Kershaw Horry
Oconee Lee Jasper
Pickens Lexington Marion
Spartanburg Marlboro Williamsburg
Union McCormick
York Orangeburg
Richland
Saluda
Sumter
44
Appendix B
Breakdowns by Demographic Characterisics
45
TABLE B-1 WHAT PEOPLE DO ON LAND AFFECT NEAR BY BODIES OF WATER
BY DEMOGRAPHIC CHARACTERISTICS
A Great Some- Not Too Not at Deal What Much All N
TOTAL: 58.7 26.9 9.8 4.6 503 SEX Male 50.8 31.8 12.3 5.1 236 Female 65.5 22.8 7.5 4.1 267 RACE Black 56.9 22.9 13.2 6.9 144 White 60.1 27.7 8.6 3.6 336 AGE 18 - 29 61.8 34.5 3.6 0.0 110 30 - 45 59.9 27.2 6.8 6.1 147 46 - 64 60.0 20.7 14.5 4.8 145 65 and Over 52.7 24.3 16.2 6.8 74 EDUCATION Less than High School 42.4 16.7 28.8 12.1 66 High School Diploma 53.7 26.5 11.8 8.1 136 Some College 61.3 30.3 6.3 2.1 142 College Degree 71.4 25.0 2.9 0.7 140 INCOME Under $15,000 66.0 8.0 24.0 2.0 50 $15,000-$29,999 56.0 24.0 14.0 6.0 100 $30,000-$49,999 66.3 24.0 5.8 3.8 104 $50,000 and Over 58.5 33.8 4.9 2.8 142 TYPE OF AREA Urban 62.7 24.6 9.5 3.2 126 Suburban 67.3 25.0 1.9 5.8 156 Rural 50.7 28.6 15.8 4.9 203 REGION Upstate 23.9 48.8 25.5 1.9 322xx Midlands 29.4 52.2 17.1 1.2 245xx Lowcountry 40.8 36.7 20.8 1.7 240xx LIVE NEAR A BODY OF WATER Yes 60.8 29.2 6.7 3.3 120 No 58.0 26.1 10.5 5.4 371
46
TABLE B-2
SHRUBS AND TREES PROTECT WATER QUALITY BY DEMOGRAPHIC CHARACTERISTICS
A Great Some- Not Too Not at Deal What Much All N
TOTAL: 54.9 32.1 8.8 4.2 501 SEX Male 54.2 32.4 8.8 4.6 238 Female 55.5 31.9 8.7 3.8 263 RACE Black 46.9 32.9 11.9 8.4 143 White 59.3 31.4 6.6 2.7 334 AGE 18 - 29 49.1 40.0 9.1 1.8 110 30 - 45 50.0 34.2 12.3 3.4 146 46 - 64 63.6 28.0 4.9 3.5 143 65 and Over 61.8 19.7 7.9 10.5 76 EDUCATION Less than High School 53.7 20.9 16.4 9.0 67 High School Diploma 56.3 33.3 5.2 5.2 135 Some College 50.7 32.1 15.0 2.1 140 College Degree 62.1 32.9 2.1 2.9 140 INCOME Under $15,000 42.0 40.0 12.0 6.0 50 $15,000-$29,999 54.1 27.6 13.3 5.1 98 $30,000-$49,999 59.0 33.3 5.7 1.9 105 $50,000 and Over 57.9 33.6 6.4 2.1 140 TYPE OF AREA Urban 50.4 33.1 10.2 6.3 127 Suburban 56.2 34.6 5.2 3.9 153 Rural 58.0 28.8 10.2 2.9 205 REGION Upstate 56.8 28.4 10.4 4.4 183 Midlands 50.0 38.5 9.2 2.3 174 Lowcountry 57.6 29.5 6.5 6.5 139 LIVE NEAR A BODY OF WATER Yes 65.0 24.8 7.7 2.6 117 No 51.8 34.2 9.2 4.9 371
47
TABLE B-3
INSPECTION AND CLEAN OUT OF SEPTIC TANKS NECESSARY TO PROTECT WATER QUALITY BY DEMOGRAPHIC CHARACTERISTICS
Strongly Strongly Agree Agree Disagree Disagree N
TOTAL: 37.5 50.8 9.8 1.9 499 SEX Male 29.7 53.8 13.1 3.4 236 Female 44.5 48.3 6.8 0.4 263 RACE Black 43.8 49.3 6.2 0.7 146 White 34.8 51.5 11.3 2.4 328 AGE 18 - 29 38.7 56.8 4.5 0.0 111 30 - 45 37.9 51.0 6.9 4.1 145 46 - 64 40.6 44.1 14.7 0.7 143 65 and Over 31.5 57.5 8.2 2.7 73 EDUCATION Less than High School 29.0 60.9 8.7 1.4 69 High School Diploma 35.3 44.9 16.2 3.7 136 Some College 42.6 50.0 6.6 0.7 136 College Degree 38.4 52.9 8.0 0.7 138 INCOME Under $15,000 34.7 51.0 6.1 8.2 49 $15,000-$29,999 43.0 53.0 4.0 0.0 100 $30,000-$49,999 42.5 46.2 9.4 1.9 106 $50,000 and Over 35.3 51.1 11.5 2.2 139 TYPE OF AREA Urban 42.4 48.8 8.0 0.8 125 Suburban 39.7 50.0 9.6 0.6 156 Rural 32.2 52.5 11.9 3.5 202 REGION Upstate 36.5 48.9 12.9 1.7 178 Midlands 35.8 54.2 8.9 1.1 179 Lowcountry 41.3 48.6 7.2 2.9 138 LIVE NEAR A BODY OF WATER Yes 40.2 46.2 10.3 3.4 117 No 36.8 51.6 10.0 1.6 370
48
TABLE B-4
PET WASTE CAN BE A SOURCE OF BACTERIA IN WATER BY DEMOGRAPHIC CHARACTERISTICS
Strongly Strongly Agree Agree Disagree Disagree N
TOTAL: 25.6 52.5 19.4 2.5 502 SEX Male 18.6 51.1 25.7 4.6 237 Female 32.0 53.8 13.5 0.8 266 RACE Black 32.2 55.5 12.3 0.0 146 White 22.6 52.7 21.1 3.6 332 AGE 18 - 29 24.8 56.9 18.3 0.0 109 30 - 45 23.8 52.4 19.0 4.8 147 46 - 64 26.6 51.0 21.7 0.7 143 65 and Over 28.6 57.1 9.1 5.2 77 EDUCATION Less than High School 29.0 50.7 15.9 4.3 69 High School Diploma 24.6 51.4 19.6 4.3 138 Some College 20.7 59.3 19.3 0.7 140 College Degree 30.4 48.9 18.5 2.2 135 INCOME Under $15,000 26.0 44.0 24.0 6.0 50 $15,000-$29,999 33.3 52.5 12.1 2.0 99 $30,000-$49,999 26.7 52.4 17.1 3.8 105 $50,000 and Over 24.3 55.9 17.6 2.2 136 TYPE OF AREA Urban 19.8 61.1 16.7 2.4 126 Suburban 31.8 46.8 19.5 1.9 154 Rural 24.3 52.9 19.4 3.4 206 REGION Upstate 21.6 54.6 20.5 3.2 185 Midlands 30.3 44.6 22.9 2.3 175 Lowcountry 24.5 60.4 12.9 2.2 139 LIVE NEAR A BODY OF WATER Yes 27.6 56.0 13.8 2.6 116 No 24.9 51.6 21.1 2.4 374
49
TABLE B-5
FERTILIZERS AND PESTICIDES USED ON YOUR PROPERTY CAN HARM LOCAL BODIES OF WATER BY DEMOGRAPHIC CHARACTERISTICS
Strongly Strongly Agree Agree Disagree Disagree N
TOTAL: 36.2 50.4 12.3 1.1 504 SEX Male 32.8 47.7 17.4 2.1 241 Female 39.4 52.7 7.6 0.4 264 RACE Black 41.4 47.3 11.0 0.7 146 White 35.5 51.3 12.2 0.9 335 AGE 18 - 29 38.0 44.4 17.6 0.0 108 30 - 45 37.8 50.0 10.1 2.0 148 46 - 64 38.4 49.3 12.3 0.0 146 65 and Over 35.1 59.7 3.9 1.3 77 EDUCATION Less than High School 27.5 55.1 14.5 2.9 69 High School Diploma 34.8 52.6 10.4 2.2 135 Some College 38.7 50.7 10.6 0.0 142 College Degree 41.7 45.3 12.9 0.0 139 INCOME Under $15,000 39.2 52.9 3.9 3.9 51 $15,000-$29,999 44.4 44.4 10.1 1.0 99 $30,000-$49,999 30.5 56.2 13.3 0.0 105 $50,000 and Over 43.0 45.1 10.6 1.4 142 TYPE OF AREA Urban 40.3 49.2 9.7 0.8 124 Suburban 40.1 49.7 10.2 0.0 157 Rural 31.9 50.7 15.5 1.9 207 REGION Upstate 31.5 51.6 14.7 2.2 186 Midlands 38.6 46.6 14.8 0.0 176 Lowcountry 40.0 52.9 5.7 1.4 140 LIVE NEAR A BODY OF WATER Yes 39.5 48.7 10.1 1.7 119 No 35.6 50.8 12.6 1.1 374
50
TABLE B-6
MOST STORM DRAIN WATER IS TREATED BY DEMOGRAPHIC CHARACTERISTICS
Do Not
True False Know N
TOTAL: 17.6 28.3 54.2 513 SEX Male 18.0 41.0 41.0 244 Female 17.1 16.7 66.2 269 RACE Black 21.8 15.6 62.6 147 White 14.6 33.3 52.0 342 AGE 18 - 29 21.8 29.1 49.1 110 30 - 45 16.8 28.9 54.4 149 46 - 64 15.5 23.0 61.5 148 65 and Over 15.2 31.6 53.2 79 EDUCATION Less than High School 18.8 27.5 53.6 69 High School Diploma 11.6 26.1 62.3 138 Some College 22.2 29.9 47.9 144 College Degree 16.3 29.8 53.9 141 INCOME Under $15,000 14.0 14.0 72.0 50 $15,000-$29,999 18.2 17.2 64.6 99 $30,000-$49,999 17.9 32.1 50.0 106 $50,000 and Over 17.6 39.4 43.0 142 TYPE OF AREA Urban 17.2 24.2 58.6 128 Suburban 20.8 30.2 49.1 159 Rural 14.4 39.7 56.0 209 REGION Upstate 13.4 34.4 52.2 186 Midlands 18.8 25.4 55.8 181 Lowcountry 21.8 23.9 54.2 142 LIVE NEAR A BODY OF WATER Yes 10.1 39.5 50.4 119 No 19.1 25.1 55.8 382
51
TABLE B-7 RUNOFF FROM FARMS AND CITIES CAUSES MORE WATER POLLUTION THAN
INDUSTRIAL FACILITIES BY DEMOGRAPHIC CHARACTERISTICS
Do Not True False Know N
TOTAL: 23.5 30.8 45.7 511 SEX Male 25.5 35.1 39.7 242 Female 21.9 27.1 50.9 269 RACE Black 23.8 24.5 51.7 147 White 23.5 33.4 43.1 341 AGE 18 - 29 30.0 30.0 40.0 110 30 - 45 20.8 34.2 45.0 149 46 - 64 21.5 30.2 48.3 149 65 and Over 22.8 27.8 49.4 79 EDUCATION Less than High School 24.6 30.4 44.9 69 High School Diploma 20.3 39.9 39.9 138 Some College 25.0 29.2 45.8 144 College Degree 24.3 25.0 50.7 140 INCOME Under $15,000 30.0 28.0 42.0 50 $15,000-$29,999 24.2 28.3 47.5 99 $30,000-$49,999 21.9 37.1 41.0 105 $50,000 and Over 26.8 29.3 43.7 142 TYPE OF AREA Urban 26.8 22.0 51.2 127 Suburban 25.9 27.8 46.2 158 Rural 19.6 39.2 41.1 209 REGION Upstate 24.7 29.6 45.7 186 Midlands 21.8 32.4 45.8 179 Lowcountry 24.6 29.6 45.8 142 LIVE NEAR A BODY OF WATER Yes 21.7 35.8 42.5 120 No 24.5 28.9 46.6 380
52
TABLE B-8 KNOW WHICH BODY OF WATER THE RUNOFF FROM NEIGHBORHOOD
PROPERTY FLOWS INTO BY DEMOGRAPHIC CHARACTERISTICS
Do Not Yes No Know N
TOTAL: 46.9 47.0 6.0 513 SEX Male 60.5 36.2 3.3 243 Female 34.6 56.9 8.6 269 RACE Black 32.7 62.6 4.8 147 White 52.6 40.9 6.4 342 AGE 18 - 29 40.5 54.1 5.4 111 30 - 45 39.2 55.4 5.4 148 46 - 64 48.6 43.2 8.1 148 65 and Over 63.8 31.3 5.0 80 EDUCATION Less than High School 40.6 50.7 8.7 69 High School Diploma 47.1 45.7 7.2 138 Some College 47.6 45.5 6.9 145 College Degree 51.1 46.8 2.1 141 INCOME Under $15,000 36.0 60.0 4.0 50 $15,000-$29,999 38.4 50.5 11.1 99 $30,000-$49,999 45.7 50.5 3.8 105 $50,000 and Over 57.0 40.8 2.1 142 TYPE OF AREA Urban 45.0 50.4 4.7 129 Suburban 48.1 48.1 3.8 158 Rural 48.1 43.3 8.6 210 REGION Upstate 49.2 44.3 6.5 185 Midlands 37.4 56.6 6.0 182 Lowcountry 56.0 39.0 5.0 141 LIVE NEAR A BODY OF WATER Yes 58.3 36.7 5.0 120 No 43.7 50.0 6.3 382
53
TABLE B-9
FERTILIZED YARD IN THE PAST 12 MONTHS BY DEMOGRAPHIC CHARACTERISTICS
Yes No N
TOTAL: 32.4 67.6 483 SEX Male 42.6 57.4 235 Female 23.0 77.0 248 RACE Black 22.5 77.5 138 White 35.6 64.4 323 AGE 18 - 29 36.8 63.2 95 30 - 45 31.7 68.3 142 46 - 64 26.4 73.6 144 65 and Over 35.9 64.1 78 EDUCATION Less than High School 22.4 77.6 67 High School Diploma 25.8 74.2 128 Some College 31.4 68.6 140 College Degree 42.6 57.4 129 INCOME Under $15,000 22.7 77.3 44 $15,000-$29,999 17.2 82.8 93 $30,000-$49,999 26.0 74.0 100 $50,000 and Over 47.8 52.2 138 TYPE OF AREA Urban 37.3 62.7 110 Suburban 37.5 62.5 152 Rural 24.8 75.2 206 REGION Upstate 32.6 67.4 178 Midlands 36.0 64.0 172 Lowcountry 27.7 72.3 130 LIVE NEAR A BODY OF WATER Yes 36.4 63.6 110 No 30.9 69.1 362

54
TABLE B-10
EVER USED LABEL INFORMATION TO DECIDE HOW MUCH FERTILIZER TO USE BY DEMOGRAPHIC CHARACTERISTICS
Yes No N
TOTAL: 84.1 15.9 134 SEX Male 82.4 17.6 91 Female 88.4 11.6 43 RACE Black 79.2 20.8 24 White 85.0 15.0 100 AGE 18 - 29 72.4 27.6 29 30 - 45 90.5 9.5 42 46 - 64 78.1 21.9 32 65 and Over 95.2 4.8 21 EDUCATION Less than High School 53.3 46.7 15 High School Diploma 80.8 19.2 26 Some College 89.5 10.5 38 College Degree 89.4 10.6 47 INCOME Under $15,000 85.7 14.3 7 $15,000-$29,999 75.0 25.0 12 $30,000-$49,999 96.2 3.8 26 $50,000 and Over 85.5 14.5 55 TYPE OF AREA Urban 86.5 13.5 37 Suburban 88.9 11.1 45 Rural 77.8 22.2 45 REGION Upstate 90.4 9.6 52 Midlands 83.3 16.7 54 Lowcountry 73.1 26.9 26 LIVE NEAR A BODY OF WATER Yes 82.4 17.6 34 No 84.5 15.5 97
55
TABLE B-11
EVER CONSULTED A GARDEN/HOME CENTER TO DECIDE HOW MUCH FERTILIZER TO USE BY DEMOGRAPHIC CHARACTERISTICS
Yes No N
TOTAL: 29.4 70.6 134 SEX Male 30.8 69.2 91 Female 27.9 72.1 43 RACE Black 37.5 62.5 24 White 30.0 70.0 100 AGE 18 - 29 17.2 82.8 29 30 - 45 33.3 66.7 42 46 - 64 31.3 68.8 32 65 and Over 47.6 52.4 21 EDUCATION Less than High School 33.3 66.7 15 High School Diploma 23.1 76.9 26 Some College 28.9 71.1 38 College Degree 38.3 61.7 47 INCOME Under $15,000 28.6 71.4 7 $15,000-$29,999 50.0 50.0 12 $30,000-$49,999 34.6 65.4 26 $50,000 and Over 30.9 69.1 55 TYPE OF AREA Urban 37.8 62.2 37 Suburban 33.3 66.7 45 Rural 24.4 75.6 45 REGION Upstate 32.1 67.9 53 Midlands 31.5 68.5 54 Lowcountry 15.4 84.6 26 LIVE NEAR A BODY OF WATER Yes 35.3 64.7 34 No 28.1 71.9 69
56
TABLE B-12
EVER CONTACTED AN EXTENSTION SERVICE TO DECIDE HOW MUCH FERTILIZER TO USE BY DEMOGRAPHIC CHARACTERISTICS
Yes No N
TOTAL: 30.2 69.8 134 SEX Male 24.4 75.6 90 Female 41.9 58.1 43 RACE Black 20.0 80.0 25 White 31.7 68.3 101 AGE 18 - 29 20.0 80.0 30 30 - 45 29.3 70.7 41 46 - 64 33.3 66.7 33 65 and Over 42.9 57.1 21 EDUCATION Less than High School 14.3 85.7 14 High School Diploma 34.6 65.4 26 Some College 23.7 76.3 38 College Degree 36.2 63.8 47 INCOME Under $15,000 0.0 100.0 7 $15,000-$29,999 33.3 66.7 12 $30,000-$49,999 50.0 50.0 26 $50,000 and Over 26.8 73.2 56 TYPE OF AREA Urban 29.7 70.3 37 Suburban 22.7 77.3 44 Rural 33.3 66.7 45 REGION Upstate 23.1 76.9 52 Midlands 40.7 59.3 54 Lowcountry 23.1 76.9 26 LIVE NEAR A BODY OF WATER Yes 23.5 76.5 34 No 32.3 67.7 96

57
TABLE B-13
EVER ASKED FRIENDS OR NEIGHBORS TO DECIDE HOW MUCH FERTILIZER TO USE BY DEMOGRAPHIC CHARACTERISTICS
Yes No N
TOTAL: 34.4 65.6 134 SEX Male 36.3 63.7 91 Female 30.2 69.8 43 RACE Black 48.0 52.0 25 White 30.7 69.3 101 AGE 18 - 29 41.4 58.6 29 30 - 45 41.5 58.5 41 46 - 64 18.2 81.8 33 65 and Over 42.9 57.1 21 EDUCATION Less than High School 64.3 35.7 14 High School Diploma 42.3 57.7 26 Some College 26.3 73.7 38 College Degree 26.1 73.9 46 INCOME Under $15,000 42.9 57.1 7 $15,000-$29,999 41.7 58.3 12 $30,000-$49,999 26.9 73.1 26 $50,000 and Over 32.7 67.3 55 TYPE OF AREA Urban 29.7 70.3 37 Suburban 29.9 71.1 45 Rural 40.9 59.1 44 REGION Upstate 26.9 73.1 52 Midlands 35.8 64.2 53 Lowcountry 46.2 53.8 26 LIVE NEAR A BODY OF WATER Yes 47.1 52.9 34 No 30.2 69.8 96
58
TABLE B-14
EVER FERTILIZED UNTIL LAWN WAS GREEN TO DECIDE HOW MUCH FERTILIZER TO USE BY DEMOGRAPHIC CHARACTERISTICS
Yes No N
TOTAL: 18.4 81.6 134 SEX Male 17.8 82.2 90 Female 18.6 81.4 43 RACE Black 29.2 70.8 24 White 16.0 84.0 100 AGE 18 - 29 20.0 80.0 30 30 - 45 16.7 83.3 42 46 - 64 21.9 87.1 32 65 and Over 19.0 81.0 21 EDUCATION Less than High School 46.7 53.3 15 High School Diploma 30.8 69.2 26 Some College 21.6 78.4 37 College Degree 0.0 100.0 46 INCOME Under $15,000 42.9 57.1 7 $15,000-$29,999 23.1 76.9 13 $30,000-$49,999 15.4 84.6 26 $50,000 and Over 14.3 85.7 56 TYPE OF AREA Urban 13.5 86.5 37 Suburban 11.4 88.6 44 Rural 28.9 71.1 45 REGION Upstate 13.5 86.5 52 Midlands 14.8 85.2 54 Lowcountry 30.8 69.2 26 LIVE NEAR A BODY OF WATER Yes 26.5 73.5 34 No 15.5 84.5 97

59
TABLE B-15
RECOMMENDATION FROM LAWN CARE COMPANY TO DECIDE HOW MUCH FERTILIZER TO USE BY DEMOGRAPHIC CHARACTERISTICS
Yes No N
TOTAL: 22.4 77.6 134 SEX Male 26.4 73.6 91 Female 14.0 86.0 43 RACE Black 41.7 58.3 24 White 19.8 80.2 101 AGE 18 - 29 41.4 58.6 29 30 - 45 26.2 73.8 42 46 - 64 15.2 84.8 33 65 and Over 14.3 85.7 21 EDUCATION Less than High School 46.7 53.3 15 High School Diploma 7.7 92.3 26 Some College 23.7 76.3 38 College Degree 27.7 72.3 47 INCOME Under $15,000 0.0 100.0 7 $15,000-$29,999 41.7 58.3 12 $30,000-$49,999 23.1 76.9 26 $50,000 and Over 25.5 74.5 55 TYPE OF AREA Urban 18.9 81.1 37 Suburban 25.0 75.0 44 Rural 24.4 75.6 45 REGION Upstate 20.8 79.2 53 Midlands 22.2 77.8 54 Lowcountry 29.6 70.4 27 LIVE NEAR A BODY OF WATER Yes 32.4 67.6 34 No 19.6 80.4 97
60
TABLE B-16
COMPOST OR RECYCLE YARD CLIPPINGS BY DEMOGRAPHIC CHARACTERISTICS
Yes No N
TOTAL: 52.7 47.3 474 SEX Male 46.9 53.1 228 Female 58.1 41.9 246 RACE Black 45.7 54.3 138 White 56.5 43.5 313 AGE 18 - 29 49.4 50.6 89 30 - 45 55.2 44.8 143 46 - 64 56.3 43.7 142 65 and Over 42.5 57.5 73 EDUCATION Less than High School 53.8 46.2 65 High School Diploma 52.7 47.3 129 Some College 55.2 44.8 134 College Degree 52.4 47.6 126 INCOME Under $15,000 44.2 55.8 43 $15,000-$29,999 51.6 48.4 93 $30,000-$49,999 43.3 56.7 97 $50,000 and Over 64.4 35.6 135 TYPE OF AREA Urban 52.8 47.2 108 Suburban 54.1 45.9 146 Rural 53.2 46.8 203 REGION Upstate 53.1 46.9 177 Midlands 50.3 49.7 169 Lowcountry 55.6 44.4 124 LIVE NEAR A BODY OF WATER Yes 61.9 38.1 105 No 50.1 49.9 357
61
TABLE B-17
USED PESTICIDES IN THE PAST 12 MONTHS BY DEMOGRAPHIC CHARACTERISTICS
Yes No N
TOTAL: 25.4 74.6 474 SEX Male 28.8 71.2 229 Female 22.1 77.9 244 RACE Black 18.1 81.9 138 White 27.4 72.6 314 AGE 18 - 29 25.8 74.2 89 30 - 45 22.2 77.8 144 46 - 64 22.0 78.0 141 65 and Over 32.9 67.1 76 EDUCATION Less than High School 16.4 83.6 67 High School Diploma 29.1 70.9 127 Some College 25.2 74.8 135 College Degree 25.0 75.0 128 INCOME Under $15,000 7.5 92.5 40 $15,000-$29,999 15.1 84.9 93 $30,000-$49,999 20.2 79.8 99 $50,000 and Over 33.8 66.2 136 TYPE OF AREA Urban 22.7 77.3 110 Suburban 30.1 69.9 146 Rural 22.7 77.3 203 REGION Upstate 19.8 80.2 177 Midlands 26.3 73.7 167 Lowcountry 32.5 67.5 126 LIVE NEAR A BODY OF WATER Yes 40.7 59.3 108 No 20.8 79.2 355

62
TABLE B-18
EVER USED LABEL INFORMATION TO DECIDE HOW MUCH PESTICIDE TO USE BY DEMOGRAPHIC CHARACTERISTICS
Yes No N
TOTAL: 84.2 15.8 111 SEX Male 79.7 20.3 59 Female 90.2 9.8 51 RACE Black 88.0 12.0 25 White 85.7 14.3 77 AGE 18 - 29 61.1 38.9 18 30 - 45 93.5 6.5 31 46 - 64 90.0 10.0 30 65 and Over 90.9 9.1 22 EDUCATION Less than High School 54.5 45.5 11 High School Diploma 82.9 17.1 35 Some College 90.6 9.4 32 College Degree 92.6 7.4 27 INCOME Under $15,000 75.0 25.0 4 $15,000-$29,999 92.9 7.1 14 $30,000-$49,999 88.9 11.1 18 $50,000 and Over 90.2 9.8 41 TYPE OF AREA Urban 87.0 13.0 23 Suburban 92.1 7.9 38 Rural 81.4 18.6 43 REGION Upstate 88.2 11.8 34 Midlands 86.0 14.0 43 Lowcountry 76.5 23.5 34 LIVE NEAR A BODY OF WATER Yes 85.4 14.6 41 No 82.4 17.6 68
63
TABLE B-19
EVER CONSULTED A GARDEN/HOME CENTER TO DECIDE HOW MUCH PESTICIDE TO USE BY DEMOGRAPHIC CHARACTERISTICS
Yes No N
TOTAL: 40.3 59.7 111 SEX Male 39.0 61.0 59 Female 42.3 57.7 52 RACE Black 52.0 48.0 25 White 39.0 61.0 77 AGE 18 - 29 57.9 42.1 19 30 - 45 32.3 67.7 31 46 - 64 40.0 60.0 30 65 and Over 40.9 59.1 22 EDUCATION Less than High School 36.4 63.6 11 High School Diploma 37.1 62.9 35 Some College 51.6 48.4 31 College Degree 34.6 65.4 26 INCOME Under $15,000 50.0 50.0 4 $15,000-$29,999 38.5 61.5 13 $30,000-$49,999 55.6 44.4 18 $50,000 and Over 39.0 61.0 41 TYPE OF AREA Urban 21.7 78.3 23 Suburban 33.3 66.7 39 Rural 58.1 41.9 43 REGION Upstate 47.1 52.9 34 Midlands 31.0 69.0 42 Lowcountry 45.7 54.3 35 LIVE NEAR A BODY OF WATER Yes 47.6 52.4 42 No 36.8 63.2 68

64
TABLE B-20
EVER CONTACTED AN EXTENSTION SERVICE TO DECIDE HOW MUCH PESTICIDE TO USE BY DEMOGRAPHIC CHARACTERISTICS
Yes No N
TOTAL: 28.0 72.0 111 SEX Male 27.1 72.9 59 Female 29.4 70.6 51 RACE Black 20.0 80.0 25 White 32.1 67.9 78 AGE 18 - 29 22.2 77.8 18 30 - 45 12.9 87.1 31 46 - 64 30.0 70.0 30 65 and Over 45.5 54.5 22 EDUCATION Less than High School 0.0 100.0 11 High School Diploma 37.1 62.9 35 Some College 29.0 71.0 31 College Degree 23.1 76.9 26 INCOME Under $15,000 33.3 66.7 3 $15,000-$29,999 21.4 78.6 14 $30,000-$49,999 50.0 50.0 18 $50,000 and Over 22.0 78.0 41 TYPE OF AREA Urban 30.4 69.6 23 Suburban 15.4 84.6 39 Rural 39.5 60.5 43 REGION Upstate 18.2 81.8 33 Midlands 31.0 69.0 42 Lowcountry 32.4 67.6 34 LIVE NEAR A BODY OF WATER Yes 31.7 68.3 41 No 26.5 73.5 68
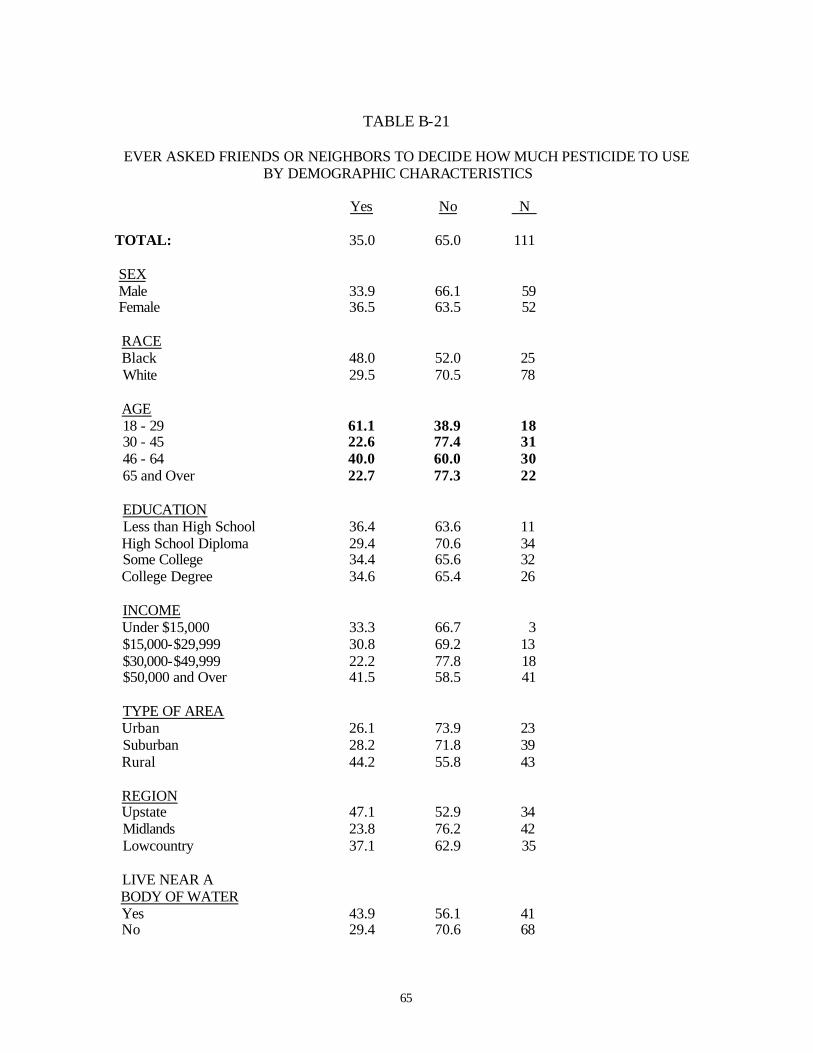
65
TABLE B-21
EVER ASKED FRIENDS OR NEIGHBORS TO DECIDE HOW MUCH PESTICIDE TO USE BY DEMOGRAPHIC CHARACTERISTICS
Yes No N
TOTAL: 35.0 65.0 111 SEX Male 33.9 66.1 59 Female 36.5 63.5 52 RACE Black 48.0 52.0 25 White 29.5 70.5 78 AGE 18 - 29 61.1 38.9 18 30 - 45 22.6 77.4 31 46 - 64 40.0 60.0 30 65 and Over 22.7 77.3 22 EDUCATION Less than High School 36.4 63.6 11 High School Diploma 29.4 70.6 34 Some College 34.4 65.6 32 College Degree 34.6 65.4 26 INCOME Under $15,000 33.3 66.7 3 $15,000-$29,999 30.8 69.2 13 $30,000-$49,999 22.2 77.8 18 $50,000 and Over 41.5 58.5 41 TYPE OF AREA Urban 26.1 73.9 23 Suburban 28.2 71.8 39 Rural 44.2 55.8 43 REGION Upstate 47.1 52.9 34 Midlands 23.8 76.2 42 Lowcountry 37.1 62.9 35 LIVE NEAR A BODY OF WATER Yes 43.9 56.1 41 No 29.4 70.6 68

66
TABLE B-22
EVER APPLIED PESTICIDES UNTIL THE PESTS WERE GONE TO DECIDE HOW MUCH PESTICIDE TO USE BY DEMOGRAPHIC CHARACTERISTICS
Yes No N
TOTAL: 42.6 57.4 111 SEX Male 37.3 62.7 59 Female 48.1 51.9 52 RACE Black 52.0 48.0 25 White 42.3 57.7 78 AGE 18 - 29 16.7 83.3 18 30 - 45 48.4 51.6 31 46 - 64 46.7 53.3 30 65 and Over 54.5 45.5 22 EDUCATION Less than High School 27.3 72.7 11 High School Diploma 51.4 48.6 35 Some College 53.1 46.9 32 College Degree 30.8 69.2 26 INCOME Under $15,000 50.0 50.0 4 $15,000-$29,999 42.9 57.1 14 $30,000-$49,999 44.4 55.6 18 $50,000 and Over 34.1 65.9 41 TYPE OF AREA Urban 58.3 41.7 24 Suburban 35.9 64.1 39 Rural 46.5 53.5 43 REGION Upstate 52.9 47.1 34 Midlands 30.2 69.8 43 Lowcountry 47.1 52.9 34 LIVE NEAR A BODY OF WATER Yes 53.7 46.3 41 No 36.8 63.2 68
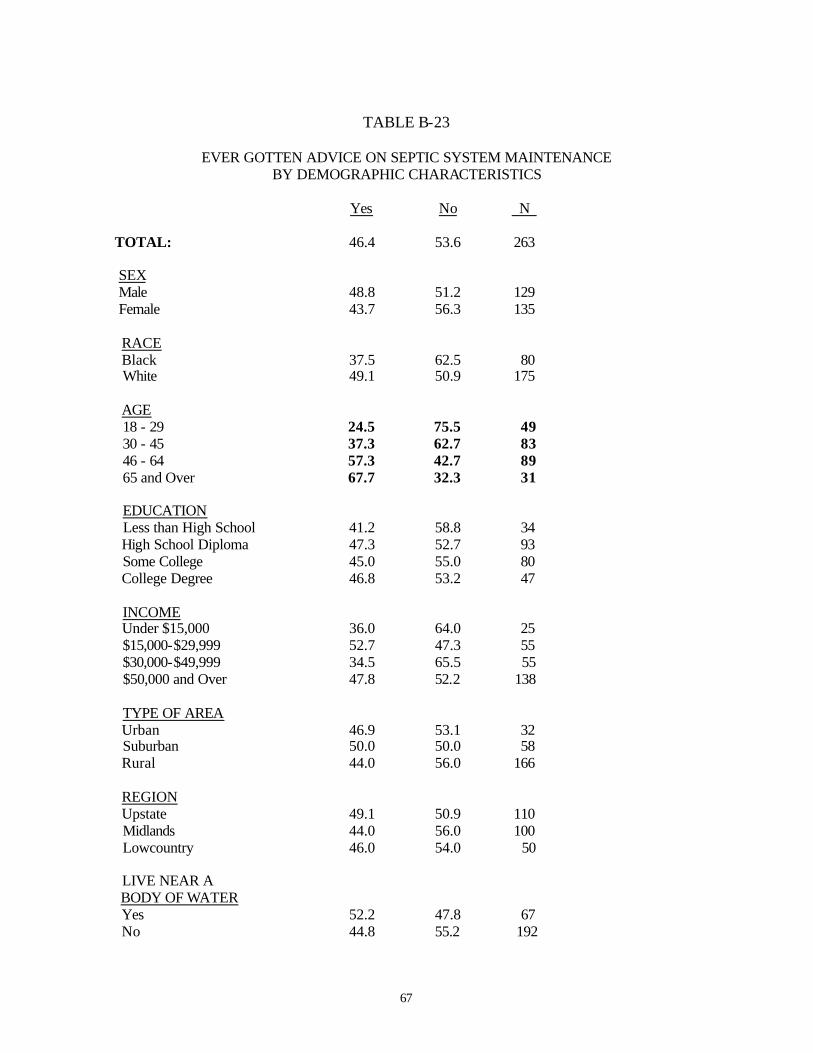
67
TABLE B-23
EVER GOTTEN ADVICE ON SEPTIC SYSTEM MAINTENANCE BY DEMOGRAPHIC CHARACTERISTICS
Yes No N
TOTAL: 46.4 53.6 263 SEX Male 48.8 51.2 129 Female 43.7 56.3 135 RACE Black 37.5 62.5 80 White 49.1 50.9 175 AGE 18 - 29 24.5 75.5 49 30 - 45 37.3 62.7 83 46 - 64 57.3 42.7 89 65 and Over 67.7 32.3 31 EDUCATION Less than High School 41.2 58.8 34 High School Diploma 47.3 52.7 93 Some College 45.0 55.0 80 College Degree 46.8 53.2 47 INCOME Under $15,000 36.0 64.0 25 $15,000-$29,999 52.7 47.3 55 $30,000-$49,999 34.5 65.5 55 $50,000 and Over 47.8 52.2 138 TYPE OF AREA Urban 46.9 53.1 32 Suburban 50.0 50.0 58 Rural 44.0 56.0 166 REGION Upstate 49.1 50.9 110 Midlands 44.0 56.0 100 Lowcountry 46.0 54.0 50 LIVE NEAR A BODY OF WATER Yes 52.2 47.8 67 No 44.8 55.2 192
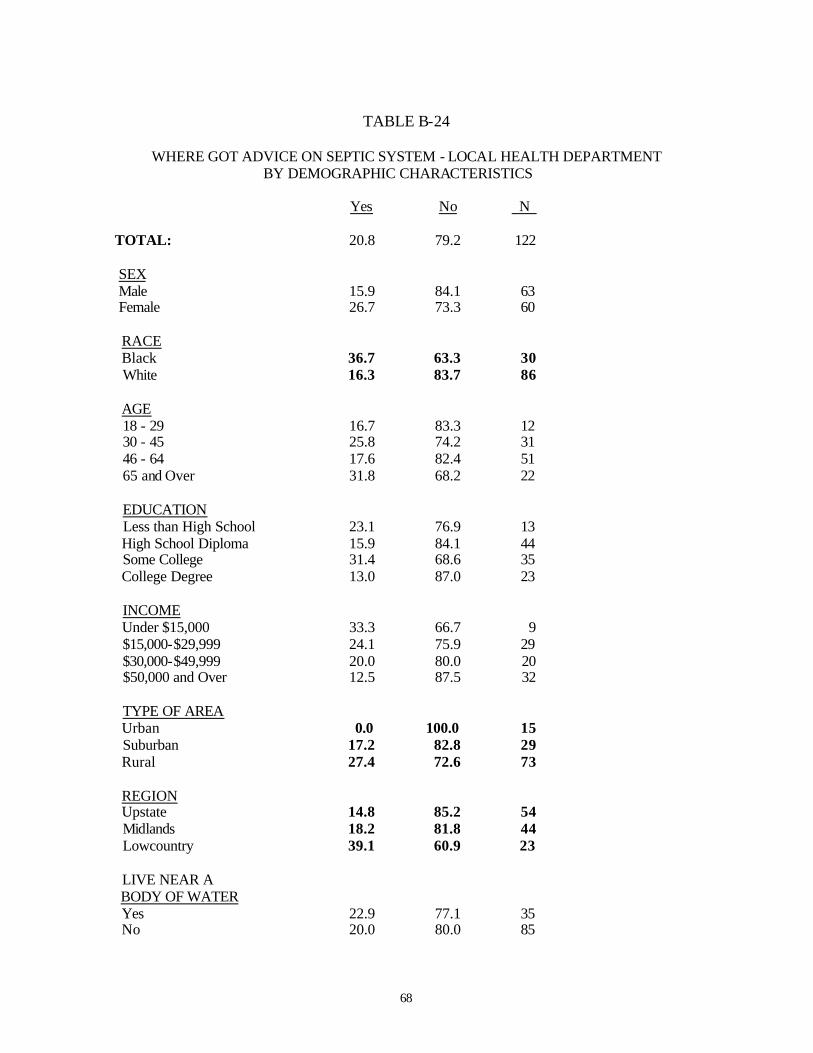
68
TABLE B-24
WHERE GOT ADVICE ON SEPTIC SYSTEM - LOCAL HEALTH DEPARTMENT BY DEMOGRAPHIC CHARACTERISTICS
Yes No N
TOTAL: 20.8 79.2 122 SEX Male 15.9 84.1 63 Female 26.7 73.3 60 RACE Black 36.7 63.3 30 White 16.3 83.7 86 AGE 18 - 29 16.7 83.3 12 30 - 45 25.8 74.2 31 46 - 64 17.6 82.4 51 65 and Over 31.8 68.2 22 EDUCATION Less than High School 23.1 76.9 13 High School Diploma 15.9 84.1 44 Some College 31.4 68.6 35 College Degree 13.0 87.0 23 INCOME Under $15,000 33.3 66.7 9 $15,000-$29,999 24.1 75.9 29 $30,000-$49,999 20.0 80.0 20 $50,000 and Over 12.5 87.5 32 TYPE OF AREA Urban 0.0 100.0 15 Suburban 17.2 82.8 29 Rural 27.4 72.6 73 REGION Upstate 14.8 85.2 54 Midlands 18.2 81.8 44 Lowcountry 39.1 60.9 23 LIVE NEAR A BODY OF WATER Yes 22.9 77.1 35 No 20.0 80.0 85

69
TABLE B-25
WHERE GOT ADVICE ON SEPTIC SYSTEM – OTHER GOVERNMENTAL AGENCY BY DEMOGRAPHIC CHARACTERISTICS
Yes No N
TOTAL: 6.4 93.6 122 SEX Male 9.5 90.5 63 Female 3.4 96.6 59 RACE Black 3.4 96.6 29 White 7.1 92.9 85 AGE 18 - 29 8.3 91.7 12 30 - 45 6.5 93.5 31 46 - 64 7.8 92.2 51 65 and Over 9.5 90.5 21 EDUCATION Less than High School 28.6 71.4 14 High School Diploma 0.0 100.0 44 Some College 5.6 94.4 36 College Degree 4.5 95.5 22 INCOME Under $15,000 0.0 100.0 9 $15,000-$29,999 10.3 89.7 29 $30,000-$49,999 5.3 94.7 19 $50,000 and Over 6.3 93.8 32 TYPE OF AREA Urban 6.7 93.3 15 Suburban 6.9 93.1 29 Rural 8.2 91.8 73 REGION Upstate 12.7 87.3 55 Midlands 2.3 97.7 44 Lowcountry 0.0 100.0 23 LIVE NEAR A BODY OF WATER Yes 8.6 91.4 35 No 4.7 95.3 85

70
TABLE B-26
WHERE GOT ADVICE ON SEPTIC SYSTEM – FRIENDS/NEIGHBORS BY DEMOGRAPHIC CHARACTERISTICS
Yes No N
TOTAL: 23.9 76.1 122 SEX Male 30.2 69.8 63 Female 16.9 83.1 59 RACE Black 36.7 63.3 30 White 19.8 80.2 86 AGE 18 - 29 8.3 91.7 12 30 - 45 25.8 74.2 31 46 - 64 25.5 74.5 51 65 and Over 28.6 71.4 21 EDUCATION Less than High School 30.8 69.2 13 High School Diploma 22.7 77.3 44 Some College 25.7 74.3 35 College Degree 18.2 81.8 22 INCOME Under $15,000 44.4 55.6 9 $15,000-$29,999 31.0 69.0 29 $30,000-$49,999 26.3 73.7 19 $50,000 and Over 18.8 81.3 32 TYPE OF AREA Urban 20.0 80.0 15 Suburban 10.3 89.7 29 Rural 30.1 69.9 73 REGION Upstate 20.4 79.6 54 Midlands 27.3 72.7 44 Lowcountry 25.0 75.0 24 LIVE NEAR A BODY OF WATER Yes 25.7 74.3 35 No 23.3 76.7 86

71
TABLE B-27
WHERE GOT ADVICE ON SEPTIC SYSTEM – PUMPING SERVICE BY DEMOGRAPHIC CHARACTERISTICS
Yes No N
TOTAL: 48.6 51.4 122 SEX Male 46.0 54.0 63 Female 51.7 48.3 60 RACE Black 43.3 56.7 30 White 52.3 47.7 86 AGE 18 - 29 50.0 50.0 12 30 - 45 45.2 54.8 31 46 - 64 58.8 41.2 51 65 and Over 33.3 66.7 21 EDUCATION Less than High School 53.8 46.2 13 High School Diploma 46.5 53.5 43 Some College 48.6 51.4 35 College Degree 59.1 40.9 22 INCOME Under $15,000 44.4 55.6 9 $15,000-$29,999 57.1 42.9 28 $30,000-$49,999 47.4 52.6 19 $50,000 and Over 46.9 53.1 32 TYPE OF AREA Urban 64.3 35.7 14 Suburban 55.2 44.8 29 Rural 45.2 54.8 73 REGION Upstate 38.9 61.1 54 Midlands 47.7 52.3 44 Lowcountry 73.9 26.1 23 LIVE NEAR A BODY OF WATER Yes 45.7 54.3 35 No 50.6 49.4 85
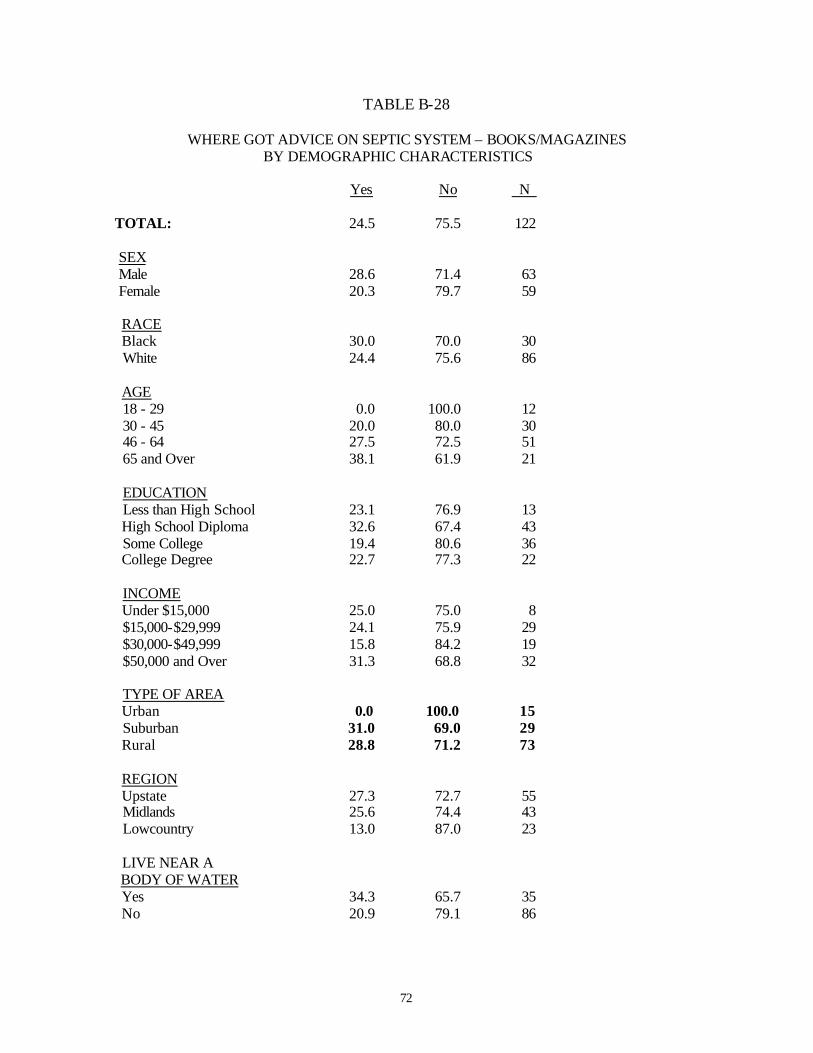
72
TABLE B-28
WHERE GOT ADVICE ON SEPTIC SYSTEM – BOOKS/MAGAZINES BY DEMOGRAPHIC CHARACTERISTICS
Yes No N
TOTAL: 24.5 75.5 122 SEX Male 28.6 71.4 63 Female 20.3 79.7 59 RACE Black 30.0 70.0 30 White 24.4 75.6 86 AGE 18 - 29 0.0 100.0 12 30 - 45 20.0 80.0 30 46 - 64 27.5 72.5 51 65 and Over 38.1 61.9 21 EDUCATION Less than High School 23.1 76.9 13 High School Diploma 32.6 67.4 43 Some College 19.4 80.6 36 College Degree 22.7 77.3 22 INCOME Under $15,000 25.0 75.0 8 $15,000-$29,999 24.1 75.9 29 $30,000-$49,999 15.8 84.2 19 $50,000 and Over 31.3 68.8 32 TYPE OF AREA Urban 0.0 100.0 15 Suburban 31.0 69.0 29 Rural 28.8 71.2 73 REGION Upstate 27.3 72.7 55 Midlands 25.6 74.4 43 Lowcountry 13.0 87.0 23 LIVE NEAR A BODY OF WATER Yes 34.3 65.7 35 No 20.9 79.1 86
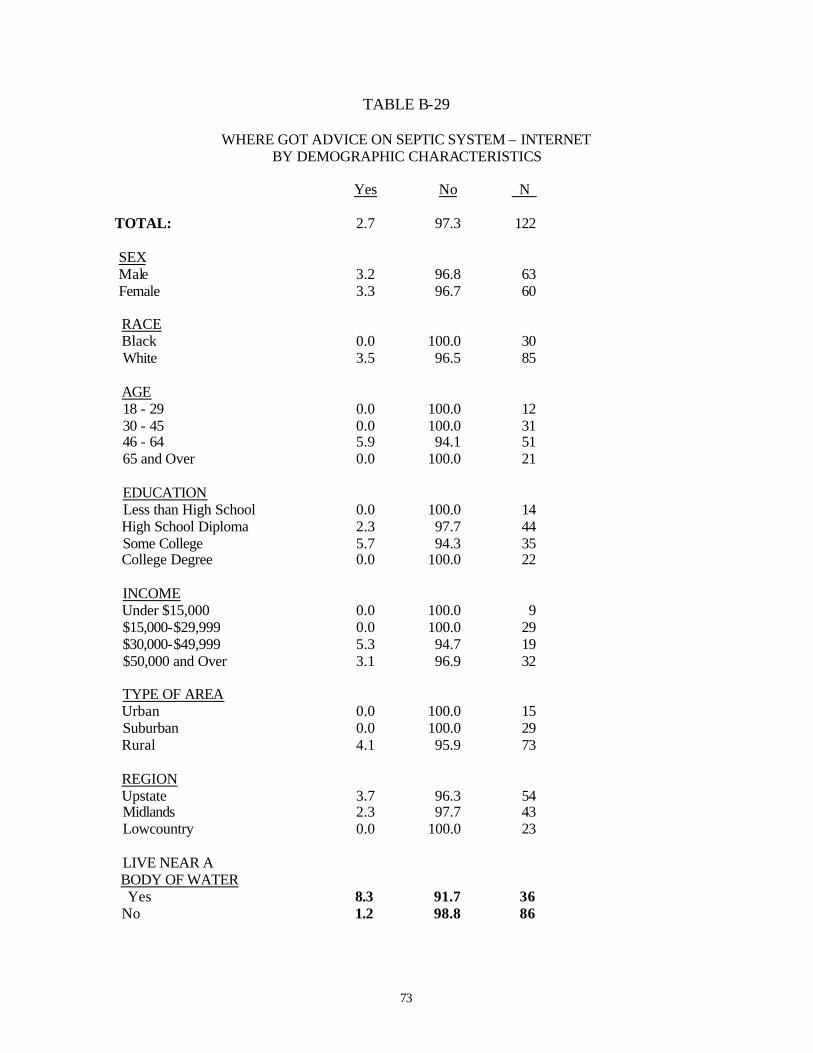
73
TABLE B-29
WHERE GOT ADVICE ON SEPTIC SYSTEM – INTERNET BY DEMOGRAPHIC CHARACTERISTICS
Yes No N
TOTAL: 2.7 97.3 122 SEX Male 3.2 96.8 63 Female 3.3 96.7 60 RACE Black 0.0 100.0 30 White 3.5 96.5 85 AGE 18 - 29 0.0 100.0 12 30 - 45 0.0 100.0 31 46 - 64 5.9 94.1 51 65 and Over 0.0 100.0 21 EDUCATION Less than High School 0.0 100.0 14 High School Diploma 2.3 97.7 44 Some College 5.7 94.3 35 College Degree 0.0 100.0 22 INCOME Under $15,000 0.0 100.0 9 $15,000-$29,999 0.0 100.0 29 $30,000-$49,999 5.3 94.7 19 $50,000 and Over 3.1 96.9 32 TYPE OF AREA Urban 0.0 100.0 15 Suburban 0.0 100.0 29 Rural 4.1 95.9 73 REGION Upstate 3.7 96.3 54 Midlands 2.3 97.7 43 Lowcountry 0.0 100.0 23 LIVE NEAR A BODY OF WATER Yes 8.3 91.7 36 No 1.2 98.8 86
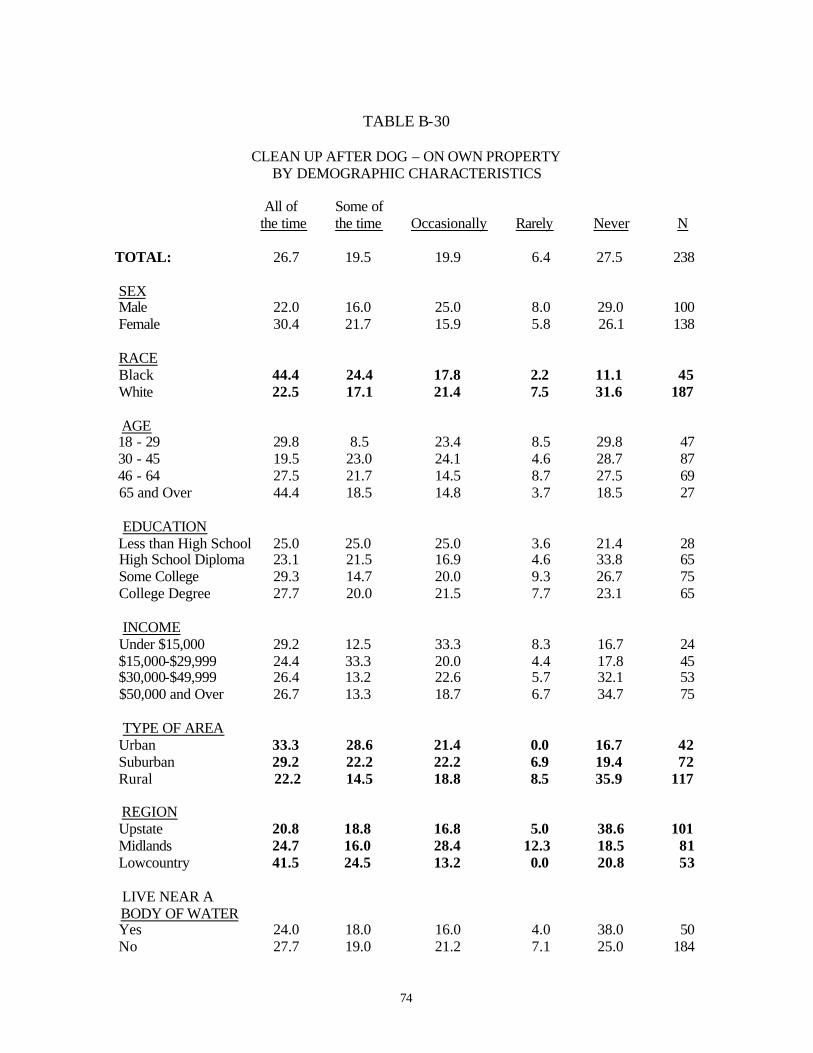
74
TABLE B-30
CLEAN UP AFTER DOG – ON OWN PROPERTY BY DEMOGRAPHIC CHARACTERISTICS
All of Some of the time the time Occasionally Rarely Never N TOTAL: 26.7 19.5 19.9 6.4 27.5 238 SEX Male 22.0 16.0 25.0 8.0 29.0 100 Female 30.4 21.7 15.9 5.8 26.1 138 RACE Black 44.4 24.4 17.8 2.2 11.1 45 White 22.5 17.1 21.4 7.5 31.6 187 AGE 18 - 29 29.8 8.5 23.4 8.5 29.8 47 30 - 45 19.5 23.0 24.1 4.6 28.7 87 46 - 64 27.5 21.7 14.5 8.7 27.5 69 65 and Over 44.4 18.5 14.8 3.7 18.5 27 EDUCATION Less than High School 25.0 25.0 25.0 3.6 21.4 28 High School Diploma 23.1 21.5 16.9 4.6 33.8 65 Some College 29.3 14.7 20.0 9.3 26.7 75 College Degree 27.7 20.0 21.5 7.7 23.1 65 INCOME Under $15,000 29.2 12.5 33.3 8.3 16.7 24 $15,000-$29,999 24.4 33.3 20.0 4.4 17.8 45 $30,000-$49,999 26.4 13.2 22.6 5.7 32.1 53 $50,000 and Over 26.7 13.3 18.7 6.7 34.7 75 TYPE OF AREA Urban 33.3 28.6 21.4 0.0 16.7 42 Suburban 29.2 22.2 22.2 6.9 19.4 72 Rural 22.2 14.5 18.8 8.5 35.9 117 REGION Upstate 20.8 18.8 16.8 5.0 38.6 101 Midlands 24.7 16.0 28.4 12.3 18.5 81 Lowcountry 41.5 24.5 13.2 0.0 20.8 53 LIVE NEAR A BODY OF WATER Yes 24.0 18.0 16.0 4.0 38.0 50 No 27.7 19.0 21.2 7.1 25.0 184
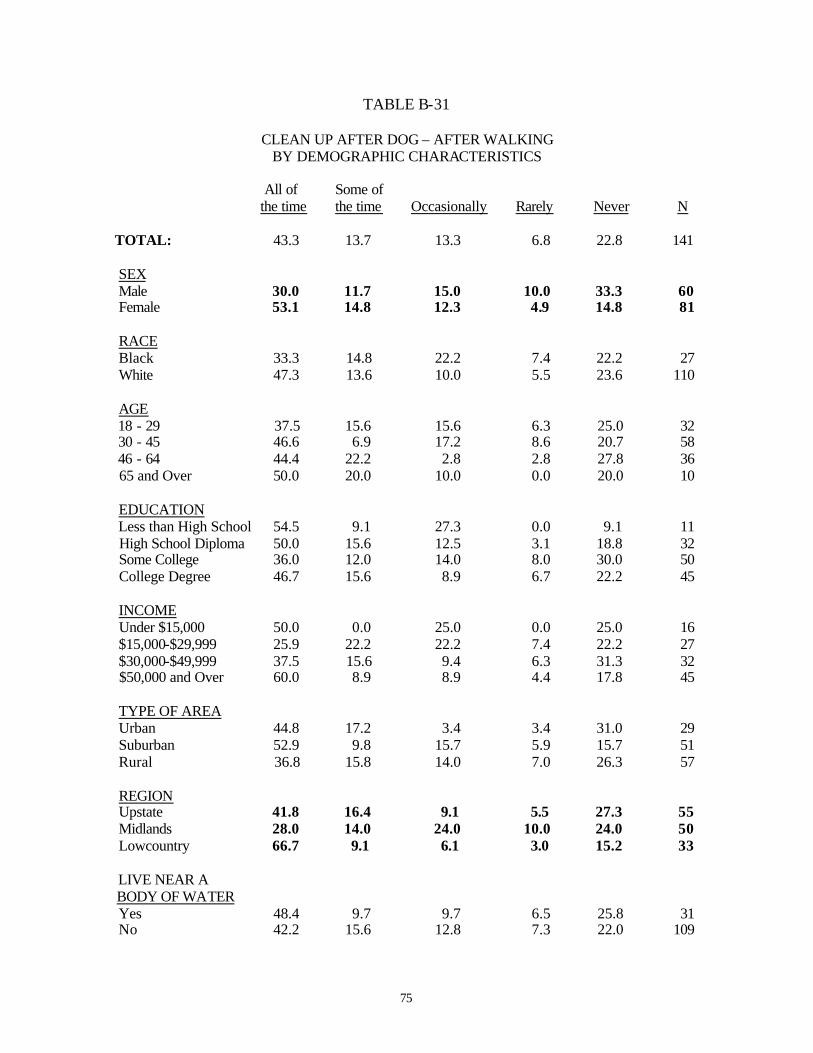
75
TABLE B-31
CLEAN UP AFTER DOG – AFTER WALKING BY DEMOGRAPHIC CHARACTERISTICS
All of Some of the time the time Occasionally Rarely Never N TOTAL: 43.3 13.7 13.3 6.8 22.8 141 SEX Male 30.0 11.7 15.0 10.0 33.3 60 Female 53.1 14.8 12.3 4.9 14.8 81 RACE Black 33.3 14.8 22.2 7.4 22.2 27 White 47.3 13.6 10.0 5.5 23.6 110 AGE 18 - 29 37.5 15.6 15.6 6.3 25.0 32 30 - 45 46.6 6.9 17.2 8.6 20.7 58 46 - 64 44.4 22.2 2.8 2.8 27.8 36 65 and Over 50.0 20.0 10.0 0.0 20.0 10 EDUCATION Less than High School 54.5 9.1 27.3 0.0 9.1 11 High School Diploma 50.0 15.6 12.5 3.1 18.8 32 Some College 36.0 12.0 14.0 8.0 30.0 50 College Degree 46.7 15.6 8.9 6.7 22.2 45 INCOME Under $15,000 50.0 0.0 25.0 0.0 25.0 16 $15,000-$29,999 25.9 22.2 22.2 7.4 22.2 27 $30,000-$49,999 37.5 15.6 9.4 6.3 31.3 32 $50,000 and Over 60.0 8.9 8.9 4.4 17.8 45 TYPE OF AREA Urban 44.8 17.2 3.4 3.4 31.0 29 Suburban 52.9 9.8 15.7 5.9 15.7 51 Rural 36.8 15.8 14.0 7.0 26.3 57 REGION Upstate 41.8 16.4 9.1 5.5 27.3 55 Midlands 28.0 14.0 24.0 10.0 24.0 50 Lowcountry 66.7 9.1 6.1 3.0 15.2 33 LIVE NEAR A BODY OF WATER Yes 48.4 9.7 9.7 6.5 25.8 31 No 42.2 15.6 12.8 7.3 22.0 109
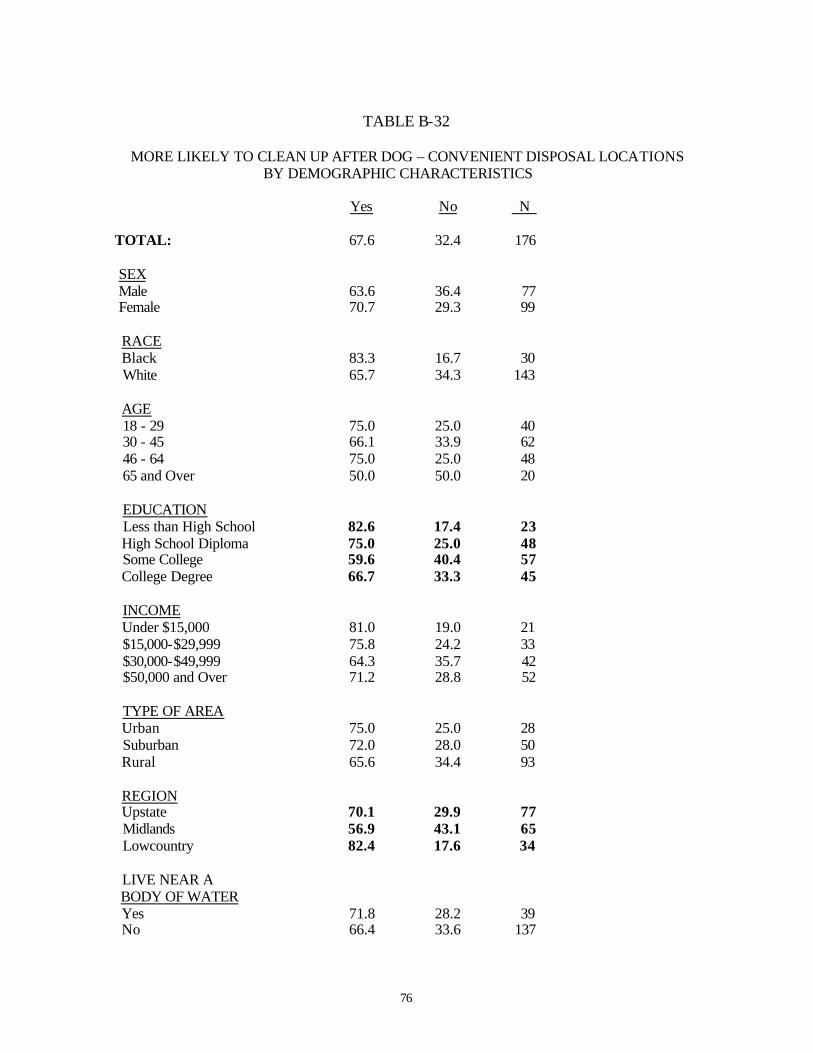
76
TABLE B-32
MORE LIKELY TO CLEAN UP AFTER DOG – CONVENIENT DISPOSAL LOCATIONS BY DEMOGRAPHIC CHARACTERISTICS
Yes No N
TOTAL: 67.6 32.4 176 SEX Male 63.6 36.4 77 Female 70.7 29.3 99 RACE Black 83.3 16.7 30 White 65.7 34.3 143 AGE 18 - 29 75.0 25.0 40 30 - 45 66.1 33.9 62 46 - 64 75.0 25.0 48 65 and Over 50.0 50.0 20 EDUCATION Less than High School 82.6 17.4 23 High School Diploma 75.0 25.0 48 Some College 59.6 40.4 57 College Degree 66.7 33.3 45 INCOME Under $15,000 81.0 19.0 21 $15,000-$29,999 75.8 24.2 33 $30,000-$49,999 64.3 35.7 42 $50,000 and Over 71.2 28.8 52 TYPE OF AREA Urban 75.0 25.0 28 Suburban 72.0 28.0 50 Rural 65.6 34.4 93 REGION Upstate 70.1 29.9 77 Midlands 56.9 43.1 65 Lowcountry 82.4 17.6 34 LIVE NEAR A BODY OF WATER Yes 71.8 28.2 39 No 66.4 33.6 137
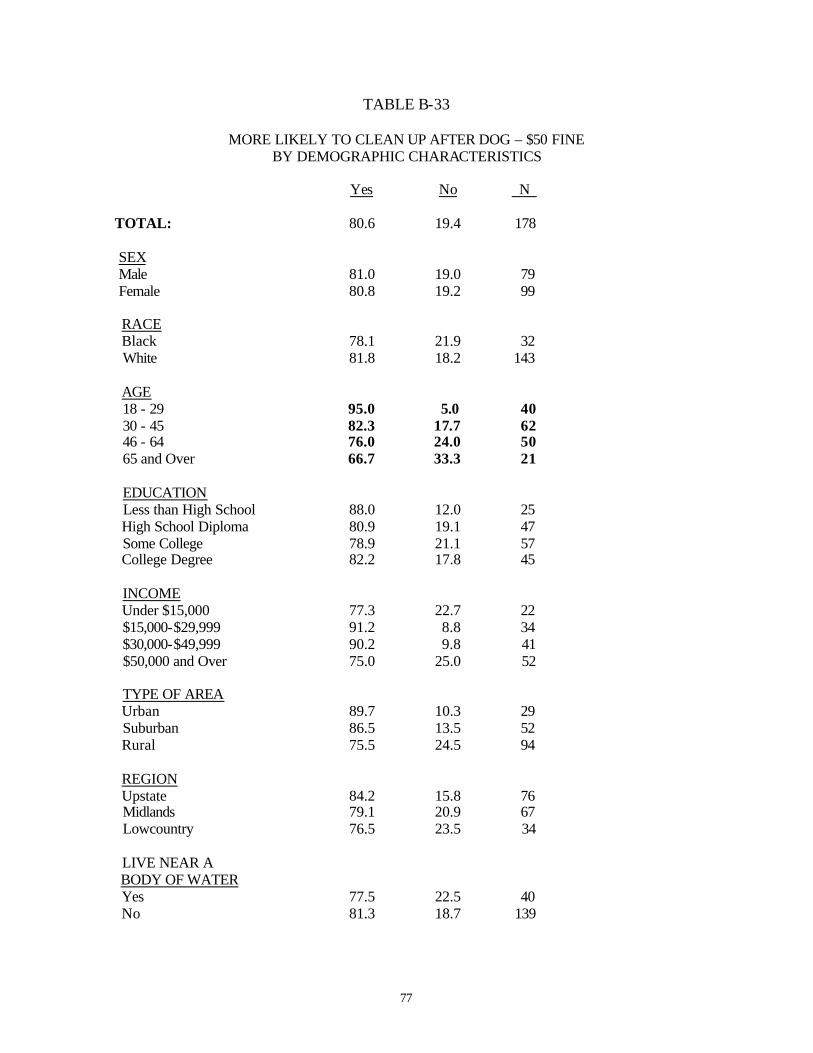
77
TABLE B-33
MORE LIKELY TO CLEAN UP AFTER DOG – $50 FINE BY DEMOGRAPHIC CHARACTERISTICS
Yes No N
TOTAL: 80.6 19.4 178 SEX Male 81.0 19.0 79 Female 80.8 19.2 99 RACE Black 78.1 21.9 32 White 81.8 18.2 143 AGE 18 - 29 95.0 5.0 40 30 - 45 82.3 17.7 62 46 - 64 76.0 24.0 50 65 and Over 66.7 33.3 21 EDUCATION Less than High School 88.0 12.0 25 High School Diploma 80.9 19.1 47 Some College 78.9 21.1 57 College Degree 82.2 17.8 45 INCOME Under $15,000 77.3 22.7 22 $15,000-$29,999 91.2 8.8 34 $30,000-$49,999 90.2 9.8 41 $50,000 and Over 75.0 25.0 52 TYPE OF AREA Urban 89.7 10.3 29 Suburban 86.5 13.5 52 Rural 75.5 24.5 94 REGION Upstate 84.2 15.8 76 Midlands 79.1 20.9 67 Lowcountry 76.5 23.5 34 LIVE NEAR A BODY OF WATER Yes 77.5 22.5 40 No 81.3 18.7 139
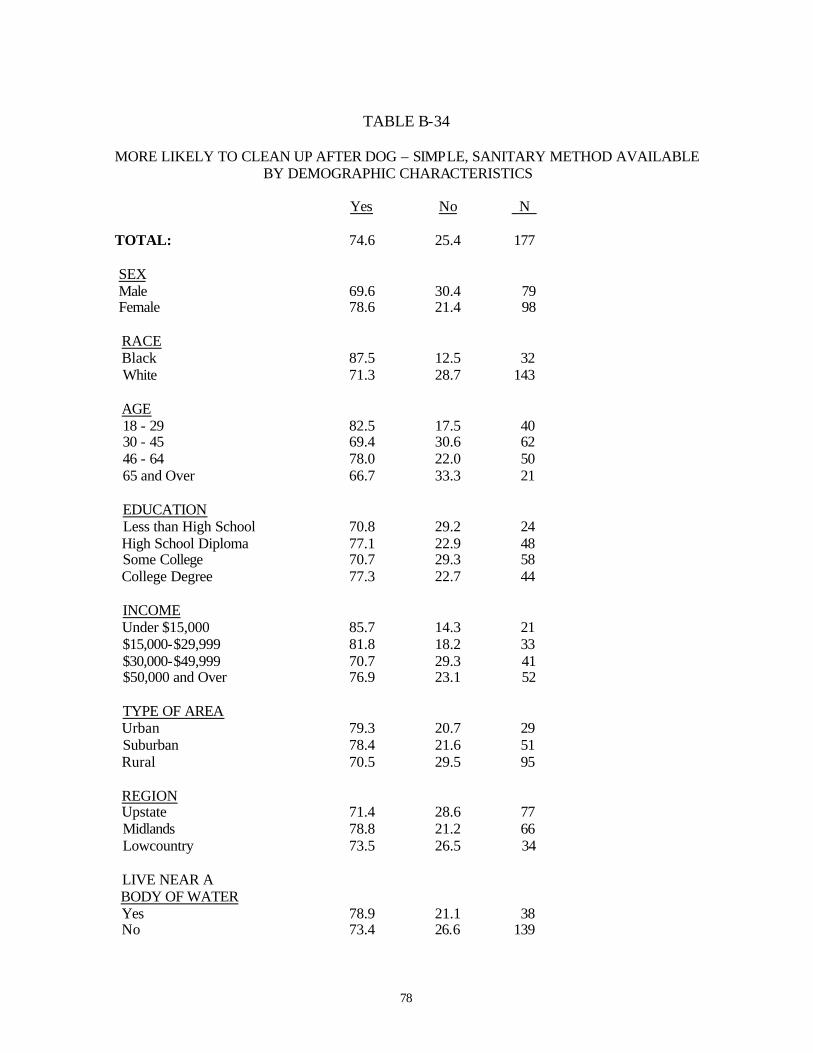
78
TABLE B-34
MORE LIKELY TO CLEAN UP AFTER DOG – SIMPLE, SANITARY METHOD AVAILABLE BY DEMOGRAPHIC CHARACTERISTICS
Yes No N
TOTAL: 74.6 25.4 177 SEX Male 69.6 30.4 79 Female 78.6 21.4 98 RACE Black 87.5 12.5 32 White 71.3 28.7 143 AGE 18 - 29 82.5 17.5 40 30 - 45 69.4 30.6 62 46 - 64 78.0 22.0 50 65 and Over 66.7 33.3 21 EDUCATION Less than High School 70.8 29.2 24 High School Diploma 77.1 22.9 48 Some College 70.7 29.3 58 College Degree 77.3 22.7 44 INCOME Under $15,000 85.7 14.3 21 $15,000-$29,999 81.8 18.2 33 $30,000-$49,999 70.7 29.3 41 $50,000 and Over 76.9 23.1 52 TYPE OF AREA Urban 79.3 20.7 29 Suburban 78.4 21.6 51 Rural 70.5 29.5 95 REGION Upstate 71.4 28.6 77 Midlands 78.8 21.2 66 Lowcountry 73.5 26.5 34 LIVE NEAR A BODY OF WATER Yes 78.9 21.1 38 No 73.4 26.6 139
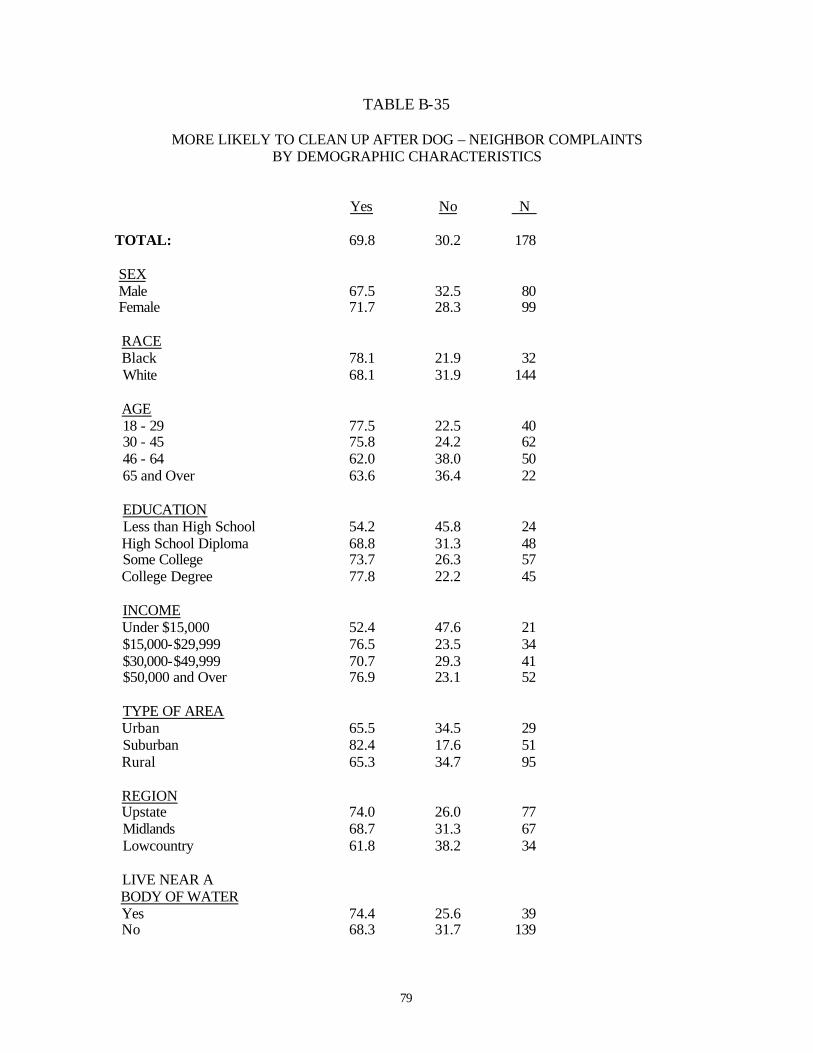
79
TABLE B-35
MORE LIKELY TO CLEAN UP AFTER DOG – NEIGHBOR COMPLAINTS BY DEMOGRAPHIC CHARACTERISTICS
Yes No N
TOTAL: 69.8 30.2 178 SEX Male 67.5 32.5 80 Female 71.7 28.3 99 RACE Black 78.1 21.9 32 White 68.1 31.9 144 AGE 18 - 29 77.5 22.5 40 30 - 45 75.8 24.2 62 46 - 64 62.0 38.0 50 65 and Over 63.6 36.4 22 EDUCATION Less than High School 54.2 45.8 24 High School Diploma 68.8 31.3 48 Some College 73.7 26.3 57 College Degree 77.8 22.2 45 INCOME Under $15,000 52.4 47.6 21 $15,000-$29,999 76.5 23.5 34 $30,000-$49,999 70.7 29.3 41 $50,000 and Over 76.9 23.1 52 TYPE OF AREA Urban 65.5 34.5 29 Suburban 82.4 17.6 51 Rural 65.3 34.7 95 REGION Upstate 74.0 26.0 77 Midlands 68.7 31.3 67 Lowcountry 61.8 38.2 34 LIVE NEAR A BODY OF WATER Yes 74.4 25.6 39 No 68.3 31.7 139
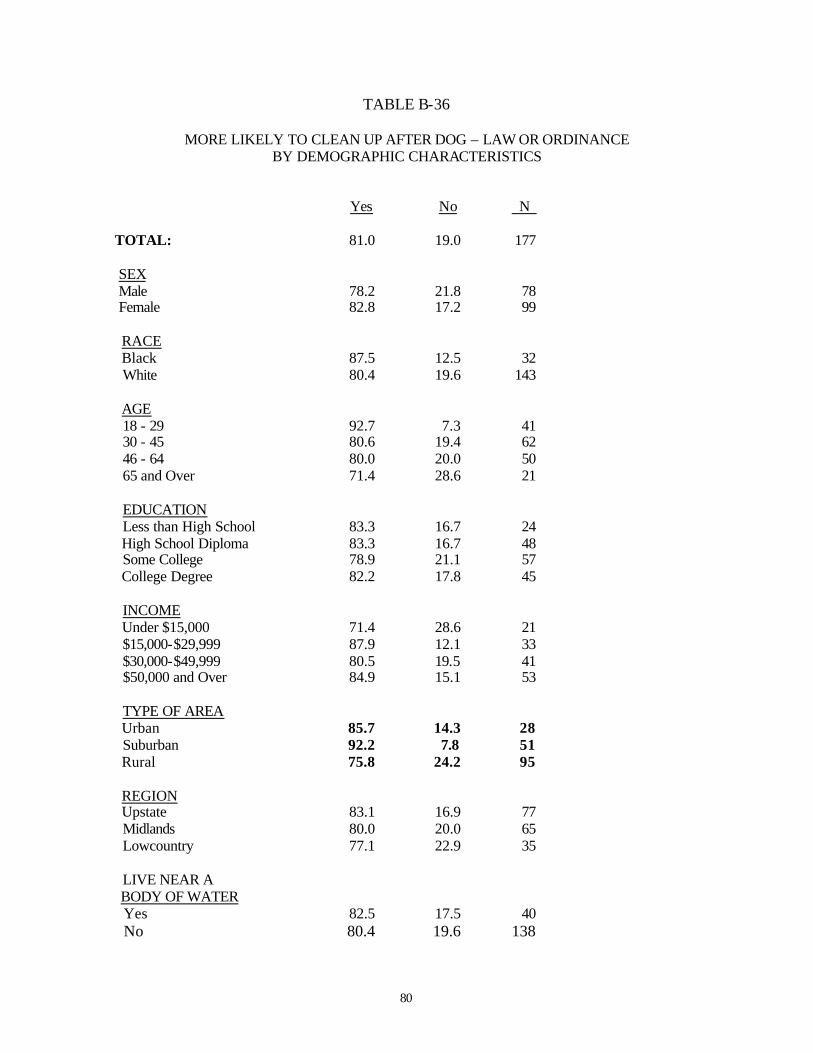
80
TABLE B-36
MORE LIKELY TO CLEAN UP AFTER DOG – LAW OR ORDINANCE BY DEMOGRAPHIC CHARACTERISTICS
Yes No N
TOTAL: 81.0 19.0 177 SEX Male 78.2 21.8 78 Female 82.8 17.2 99 RACE Black 87.5 12.5 32 White 80.4 19.6 143 AGE 18 - 29 92.7 7.3 41 30 - 45 80.6 19.4 62 46 - 64 80.0 20.0 50 65 and Over 71.4 28.6 21 EDUCATION Less than High School 83.3 16.7 24 High School Diploma 83.3 16.7 48 Some College 78.9 21.1 57 College Degree 82.2 17.8 45 INCOME Under $15,000 71.4 28.6 21 $15,000-$29,999 87.9 12.1 33 $30,000-$49,999 80.5 19.5 41 $50,000 and Over 84.9 15.1 53 TYPE OF AREA Urban 85.7 14.3 28 Suburban 92.2 7.8 51 Rural 75.8 24.2 95 REGION Upstate 83.1 16.9 77 Midlands 80.0 20.0 65 Lowcountry 77.1 22.9 35 LIVE NEAR A BODY OF WATER Yes 82.5 17.5 40 No 80.4 19.6 138
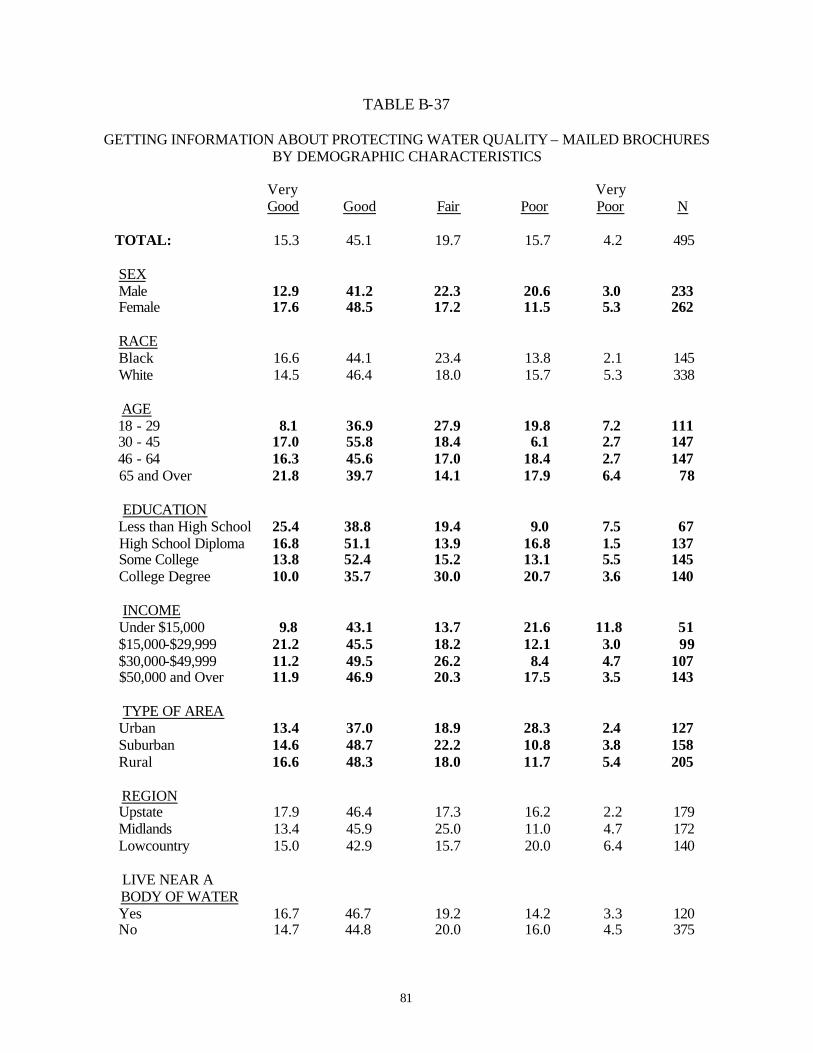
81
TABLE B-37
GETTING INFORMATION ABOUT PROTECTING WATER QUALITY – MAILED BROCHURES BY DEMOGRAPHIC CHARACTERISTICS
Very Very Good Good Fair Poor Poor N TOTAL: 15.3 45.1 19.7 15.7 4.2 495 SEX Male 12.9 41.2 22.3 20.6 3.0 233 Female 17.6 48.5 17.2 11.5 5.3 262 RACE Black 16.6 44.1 23.4 13.8 2.1 145 White 14.5 46.4 18.0 15.7 5.3 338 AGE 18 - 29 8.1 36.9 27.9 19.8 7.2 111 30 - 45 17.0 55.8 18.4 6.1 2.7 147 46 - 64 16.3 45.6 17.0 18.4 2.7 147 65 and Over 21.8 39.7 14.1 17.9 6.4 78 EDUCATION Less than High School 25.4 38.8 19.4 9.0 7.5 67 High School Diploma 16.8 51.1 13.9 16.8 1.5 137 Some College 13.8 52.4 15.2 13.1 5.5 145 College Degree 10.0 35.7 30.0 20.7 3.6 140 INCOME Under $15,000 9.8 43.1 13.7 21.6 11.8 51 $15,000-$29,999 21.2 45.5 18.2 12.1 3.0 99 $30,000-$49,999 11.2 49.5 26.2 8.4 4.7 107 $50,000 and Over 11.9 46.9 20.3 17.5 3.5 143 TYPE OF AREA Urban 13.4 37.0 18.9 28.3 2.4 127 Suburban 14.6 48.7 22.2 10.8 3.8 158 Rural 16.6 48.3 18.0 11.7 5.4 205 REGION Upstate 17.9 46.4 17.3 16.2 2.2 179 Midlands 13.4 45.9 25.0 11.0 4.7 172 Lowcountry 15.0 42.9 15.7 20.0 6.4 140 LIVE NEAR A BODY OF WATER Yes 16.7 46.7 19.2 14.2 3.3 120 No 14.7 44.8 20.0 16.0 4.5 375
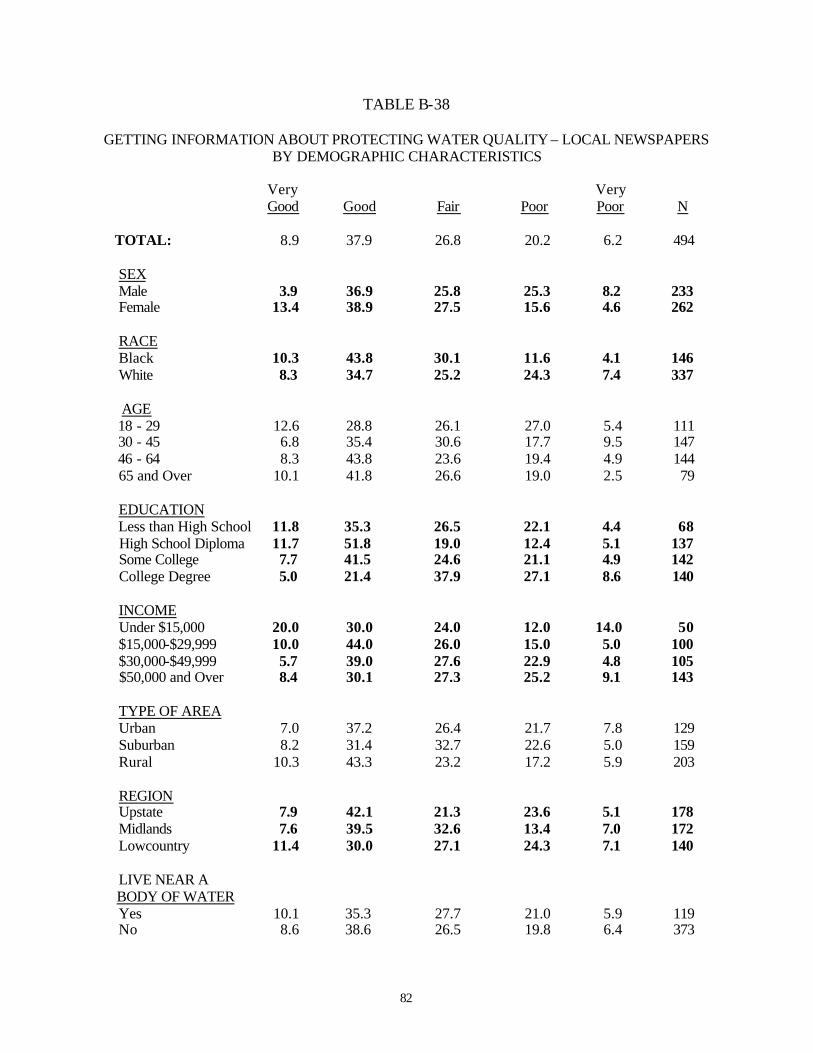
82
TABLE B-38
GETTING INFORMATION ABOUT PROTECTING WATER QUALITY – LOCAL NEWSPAPERS BY DEMOGRAPHIC CHARACTERISTICS
Very Very Good Good Fair Poor Poor N TOTAL: 8.9 37.9 26.8 20.2 6.2 494 SEX Male 3.9 36.9 25.8 25.3 8.2 233 Female 13.4 38.9 27.5 15.6 4.6 262 RACE Black 10.3 43.8 30.1 11.6 4.1 146 White 8.3 34.7 25.2 24.3 7.4 337 AGE 18 - 29 12.6 28.8 26.1 27.0 5.4 111 30 - 45 6.8 35.4 30.6 17.7 9.5 147 46 - 64 8.3 43.8 23.6 19.4 4.9 144 65 and Over 10.1 41.8 26.6 19.0 2.5 79 EDUCATION Less than High School 11.8 35.3 26.5 22.1 4.4 68 High School Diploma 11.7 51.8 19.0 12.4 5.1 137 Some College 7.7 41.5 24.6 21.1 4.9 142 College Degree 5.0 21.4 37.9 27.1 8.6 140 INCOME Under $15,000 20.0 30.0 24.0 12.0 14.0 50 $15,000-$29,999 10.0 44.0 26.0 15.0 5.0 100 $30,000-$49,999 5.7 39.0 27.6 22.9 4.8 105 $50,000 and Over 8.4 30.1 27.3 25.2 9.1 143 TYPE OF AREA Urban 7.0 37.2 26.4 21.7 7.8 129 Suburban 8.2 31.4 32.7 22.6 5.0 159 Rural 10.3 43.3 23.2 17.2 5.9 203 REGION Upstate 7.9 42.1 21.3 23.6 5.1 178 Midlands 7.6 39.5 32.6 13.4 7.0 172 Lowcountry 11.4 30.0 27.1 24.3 7.1 140 LIVE NEAR A BODY OF WATER Yes 10.1 35.3 27.7 21.0 5.9 119 No 8.6 38.6 26.5 19.8 6.4 373
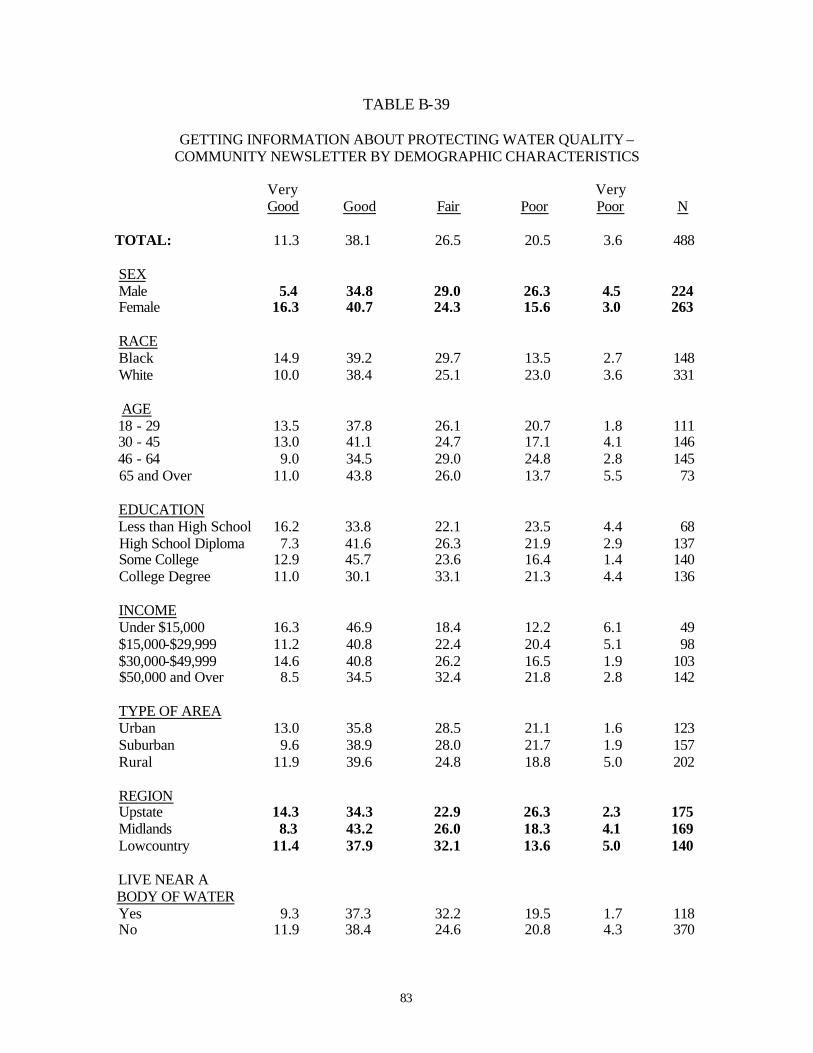
83
TABLE B-39
GETTING INFORMATION ABOUT PROTECTING WATER QUALITY – COMMUNITY NEWSLETTER BY DEMOGRAPHIC CHARACTERISTICS
Very Very Good Good Fair Poor Poor N TOTAL: 11.3 38.1 26.5 20.5 3.6 488 SEX Male 5.4 34.8 29.0 26.3 4.5 224 Female 16.3 40.7 24.3 15.6 3.0 263 RACE Black 14.9 39.2 29.7 13.5 2.7 148 White 10.0 38.4 25.1 23.0 3.6 331 AGE 18 - 29 13.5 37.8 26.1 20.7 1.8 111 30 - 45 13.0 41.1 24.7 17.1 4.1 146 46 - 64 9.0 34.5 29.0 24.8 2.8 145 65 and Over 11.0 43.8 26.0 13.7 5.5 73 EDUCATION Less than High School 16.2 33.8 22.1 23.5 4.4 68 High School Diploma 7.3 41.6 26.3 21.9 2.9 137 Some College 12.9 45.7 23.6 16.4 1.4 140 College Degree 11.0 30.1 33.1 21.3 4.4 136 INCOME Under $15,000 16.3 46.9 18.4 12.2 6.1 49 $15,000-$29,999 11.2 40.8 22.4 20.4 5.1 98 $30,000-$49,999 14.6 40.8 26.2 16.5 1.9 103 $50,000 and Over 8.5 34.5 32.4 21.8 2.8 142 TYPE OF AREA Urban 13.0 35.8 28.5 21.1 1.6 123 Suburban 9.6 38.9 28.0 21.7 1.9 157 Rural 11.9 39.6 24.8 18.8 5.0 202 REGION Upstate 14.3 34.3 22.9 26.3 2.3 175 Midlands 8.3 43.2 26.0 18.3 4.1 169 Lowcountry 11.4 37.9 32.1 13.6 5.0 140 LIVE NEAR A BODY OF WATER Yes 9.3 37.3 32.2 19.5 1.7 118 No 11.9 38.4 24.6 20.8 4.3 370
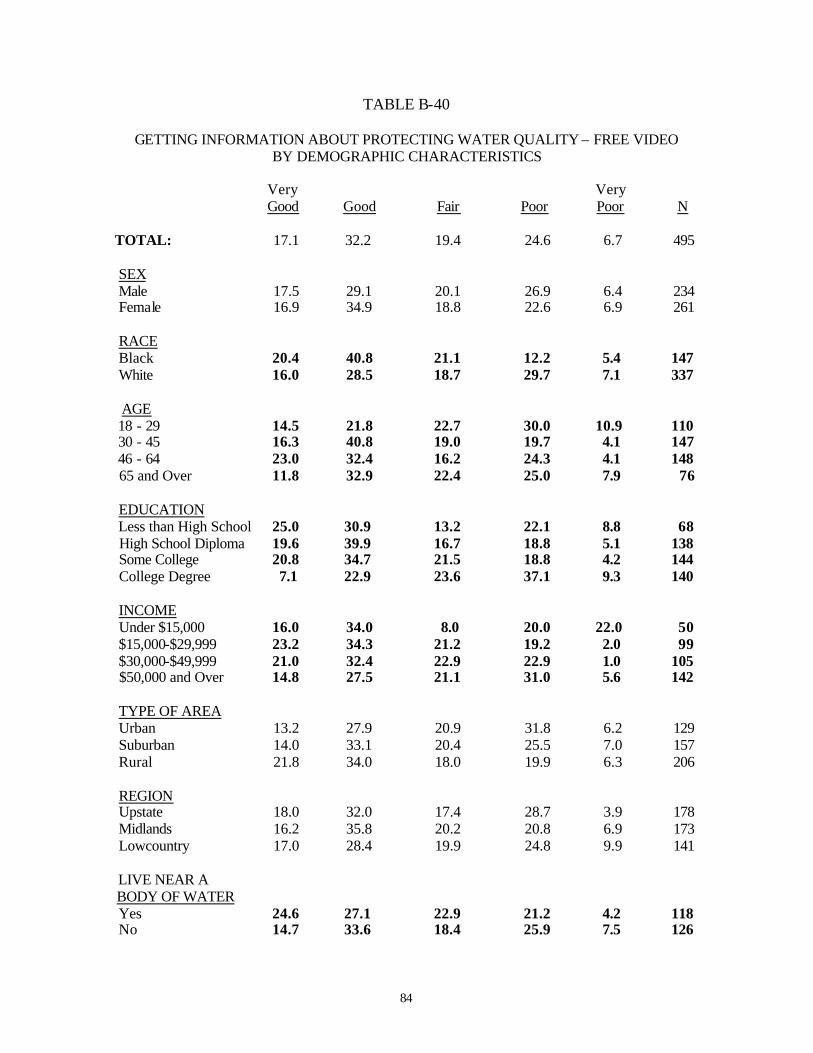
84
TABLE B-40
GETTING INFORMATION ABOUT PROTECTING WATER QUALITY – FREE VIDEO BY DEMOGRAPHIC CHARACTERISTICS
Very Very Good Good Fair Poor Poor N TOTAL: 17.1 32.2 19.4 24.6 6.7 495 SEX Male 17.5 29.1 20.1 26.9 6.4 234 Female 16.9 34.9 18.8 22.6 6.9 261 RACE Black 20.4 40.8 21.1 12.2 5.4 147 White 16.0 28.5 18.7 29.7 7.1 337 AGE 18 - 29 14.5 21.8 22.7 30.0 10.9 110 30 - 45 16.3 40.8 19.0 19.7 4.1 147 46 - 64 23.0 32.4 16.2 24.3 4.1 148 65 and Over 11.8 32.9 22.4 25.0 7.9 76 EDUCATION Less than High School 25.0 30.9 13.2 22.1 8.8 68 High School Diploma 19.6 39.9 16.7 18.8 5.1 138 Some College 20.8 34.7 21.5 18.8 4.2 144 College Degree 7.1 22.9 23.6 37.1 9.3 140 INCOME Under $15,000 16.0 34.0 8.0 20.0 22.0 50 $15,000-$29,999 23.2 34.3 21.2 19.2 2.0 99 $30,000-$49,999 21.0 32.4 22.9 22.9 1.0 105 $50,000 and Over 14.8 27.5 21.1 31.0 5.6 142 TYPE OF AREA Urban 13.2 27.9 20.9 31.8 6.2 129 Suburban 14.0 33.1 20.4 25.5 7.0 157 Rural 21.8 34.0 18.0 19.9 6.3 206 REGION Upstate 18.0 32.0 17.4 28.7 3.9 178 Midlands 16.2 35.8 20.2 20.8 6.9 173 Lowcountry 17.0 28.4 19.9 24.8 9.9 141 LIVE NEAR A BODY OF WATER Yes 24.6 27.1 22.9 21.2 4.2 118 No 14.7 33.6 18.4 25.9 7.5 126
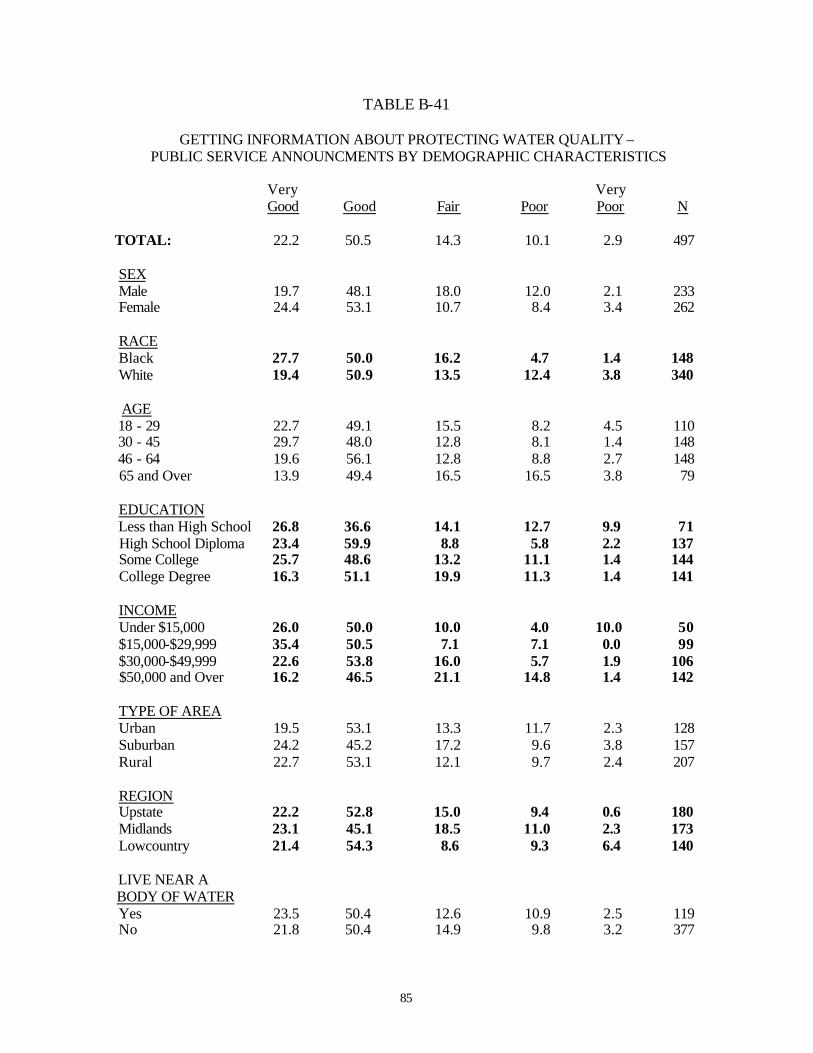
85
TABLE B-41
GETTING INFORMATION ABOUT PROTECTING WATER QUALITY – PUBLIC SERVICE ANNOUNCMENTS BY DEMOGRAPHIC CHARACTERISTICS
Very Very Good Good Fair Poor Poor N TOTAL: 22.2 50.5 14.3 10.1 2.9 497 SEX Male 19.7 48.1 18.0 12.0 2.1 233 Female 24.4 53.1 10.7 8.4 3.4 262 RACE Black 27.7 50.0 16.2 4.7 1.4 148 White 19.4 50.9 13.5 12.4 3.8 340 AGE 18 - 29 22.7 49.1 15.5 8.2 4.5 110 30 - 45 29.7 48.0 12.8 8.1 1.4 148 46 - 64 19.6 56.1 12.8 8.8 2.7 148 65 and Over 13.9 49.4 16.5 16.5 3.8 79 EDUCATION Less than High School 26.8 36.6 14.1 12.7 9.9 71 High School Diploma 23.4 59.9 8.8 5.8 2.2 137 Some College 25.7 48.6 13.2 11.1 1.4 144 College Degree 16.3 51.1 19.9 11.3 1.4 141 INCOME Under $15,000 26.0 50.0 10.0 4.0 10.0 50 $15,000-$29,999 35.4 50.5 7.1 7.1 0.0 99 $30,000-$49,999 22.6 53.8 16.0 5.7 1.9 106 $50,000 and Over 16.2 46.5 21.1 14.8 1.4 142 TYPE OF AREA Urban 19.5 53.1 13.3 11.7 2.3 128 Suburban 24.2 45.2 17.2 9.6 3.8 157 Rural 22.7 53.1 12.1 9.7 2.4 207 REGION Upstate 22.2 52.8 15.0 9.4 0.6 180 Midlands 23.1 45.1 18.5 11.0 2.3 173 Lowcountry 21.4 54.3 8.6 9.3 6.4 140 LIVE NEAR A BODY OF WATER Yes 23.5 50.4 12.6 10.9 2.5 119 No 21.8 50.4 14.9 9.8 3.2 377
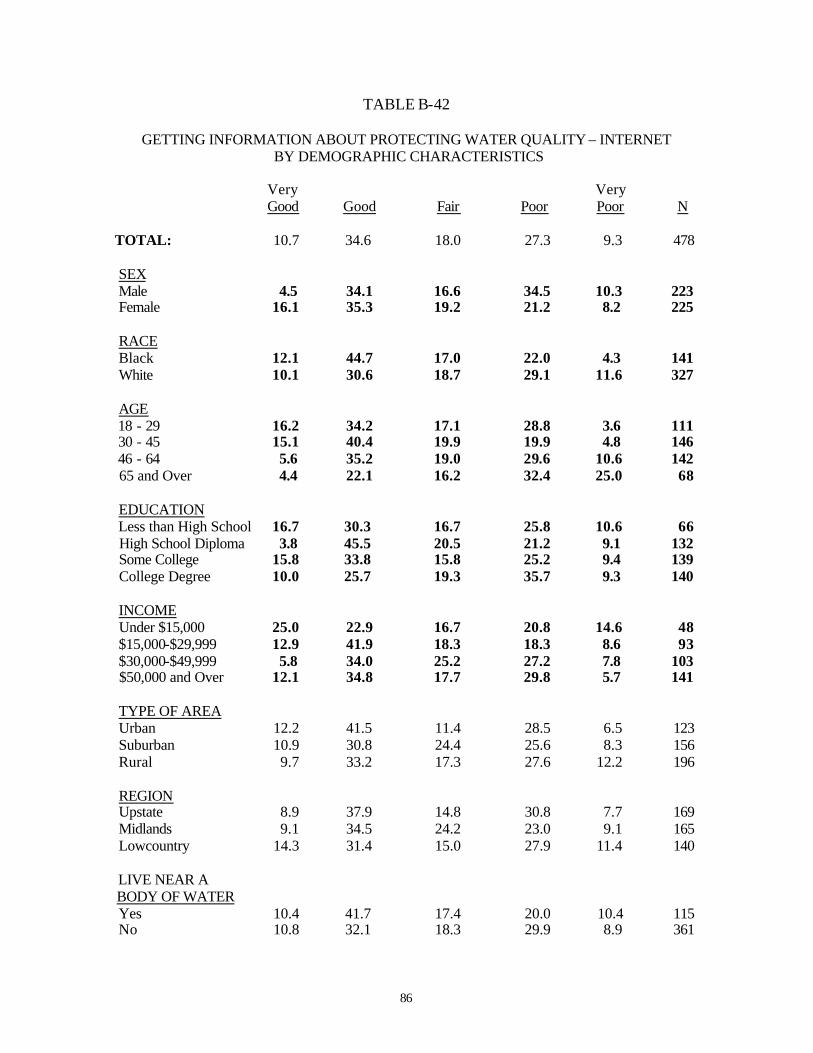
86
TABLE B-42
GETTING INFORMATION ABOUT PROTECTING WATER QUALITY – INTERNET BY DEMOGRAPHIC CHARACTERISTICS
Very Very Good Good Fair Poor Poor N TOTAL: 10.7 34.6 18.0 27.3 9.3 478 SEX Male 4.5 34.1 16.6 34.5 10.3 223 Female 16.1 35.3 19.2 21.2 8.2 225 RACE Black 12.1 44.7 17.0 22.0 4.3 141 White 10.1 30.6 18.7 29.1 11.6 327 AGE 18 - 29 16.2 34.2 17.1 28.8 3.6 111 30 - 45 15.1 40.4 19.9 19.9 4.8 146 46 - 64 5.6 35.2 19.0 29.6 10.6 142 65 and Over 4.4 22.1 16.2 32.4 25.0 68 EDUCATION Less than High School 16.7 30.3 16.7 25.8 10.6 66 High School Diploma 3.8 45.5 20.5 21.2 9.1 132 Some College 15.8 33.8 15.8 25.2 9.4 139 College Degree 10.0 25.7 19.3 35.7 9.3 140 INCOME Under $15,000 25.0 22.9 16.7 20.8 14.6 48 $15,000-$29,999 12.9 41.9 18.3 18.3 8.6 93 $30,000-$49,999 5.8 34.0 25.2 27.2 7.8 103 $50,000 and Over 12.1 34.8 17.7 29.8 5.7 141 TYPE OF AREA Urban 12.2 41.5 11.4 28.5 6.5 123 Suburban 10.9 30.8 24.4 25.6 8.3 156 Rural 9.7 33.2 17.3 27.6 12.2 196 REGION Upstate 8.9 37.9 14.8 30.8 7.7 169 Midlands 9.1 34.5 24.2 23.0 9.1 165 Lowcountry 14.3 31.4 15.0 27.9 11.4 140 LIVE NEAR A BODY OF WATER Yes 10.4 41.7 17.4 20.0 10.4 115 No 10.8 32.1 18.3 29.9 8.9 361
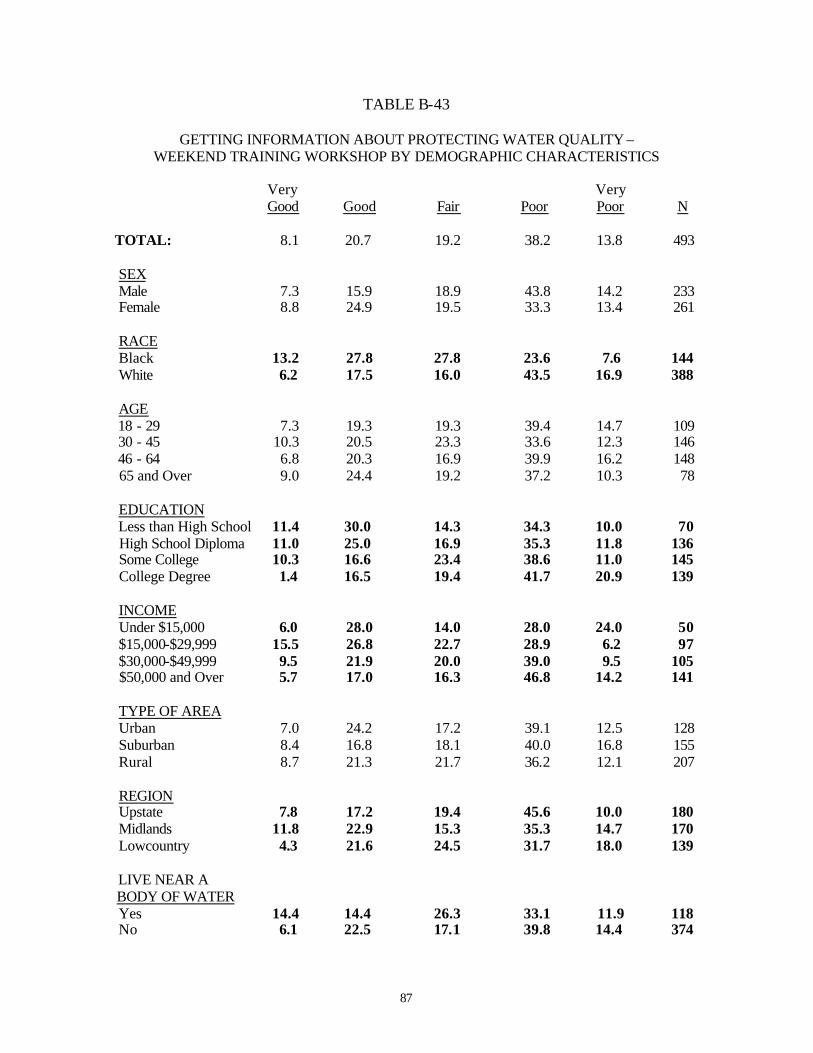
87
TABLE B-43
GETTING INFORMATION ABOUT PROTECTING WATER QUALITY – WEEKEND TRAINING WORKSHOP BY DEMOGRAPHIC CHARACTERISTICS
Very Very Good Good Fair Poor Poor N TOTAL: 8.1 20.7 19.2 38.2 13.8 493 SEX Male 7.3 15.9 18.9 43.8 14.2 233 Female 8.8 24.9 19.5 33.3 13.4 261 RACE Black 13.2 27.8 27.8 23.6 7.6 144 White 6.2 17.5 16.0 43.5 16.9 388 AGE 18 - 29 7.3 19.3 19.3 39.4 14.7 109 30 - 45 10.3 20.5 23.3 33.6 12.3 146 46 - 64 6.8 20.3 16.9 39.9 16.2 148 65 and Over 9.0 24.4 19.2 37.2 10.3 78 EDUCATION Less than High School 11.4 30.0 14.3 34.3 10.0 70 High School Diploma 11.0 25.0 16.9 35.3 11.8 136 Some College 10.3 16.6 23.4 38.6 11.0 145 College Degree 1.4 16.5 19.4 41.7 20.9 139 INCOME Under $15,000 6.0 28.0 14.0 28.0 24.0 50 $15,000-$29,999 15.5 26.8 22.7 28.9 6.2 97 $30,000-$49,999 9.5 21.9 20.0 39.0 9.5 105 $50,000 and Over 5.7 17.0 16.3 46.8 14.2 141 TYPE OF AREA Urban 7.0 24.2 17.2 39.1 12.5 128 Suburban 8.4 16.8 18.1 40.0 16.8 155 Rural 8.7 21.3 21.7 36.2 12.1 207 REGION Upstate 7.8 17.2 19.4 45.6 10.0 180 Midlands 11.8 22.9 15.3 35.3 14.7 170 Lowcountry 4.3 21.6 24.5 31.7 18.0 139 LIVE NEAR A BODY OF WATER Yes 14.4 14.4 26.3 33.1 11.9 118 No 6.1 22.5 17.1 39.8 14.4 374
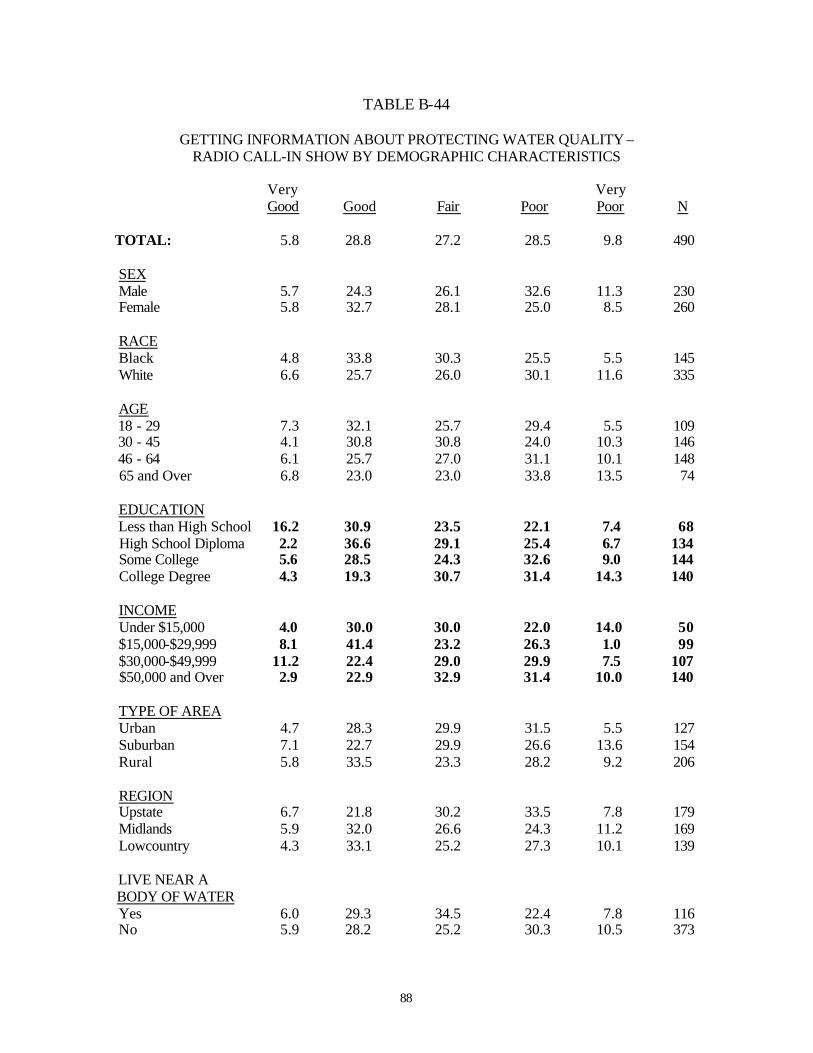
88
TABLE B-44
GETTING INFORMATION ABOUT PROTECTING WATER QUALITY – RADIO CALL-IN SHOW BY DEMOGRAPHIC CHARACTERISTICS
Very Very Good Good Fair Poor Poor N TOTAL: 5.8 28.8 27.2 28.5 9.8 490 SEX Male 5.7 24.3 26.1 32.6 11.3 230 Female 5.8 32.7 28.1 25.0 8.5 260 RACE Black 4.8 33.8 30.3 25.5 5.5 145 White 6.6 25.7 26.0 30.1 11.6 335 AGE 18 - 29 7.3 32.1 25.7 29.4 5.5 109 30 - 45 4.1 30.8 30.8 24.0 10.3 146 46 - 64 6.1 25.7 27.0 31.1 10.1 148 65 and Over 6.8 23.0 23.0 33.8 13.5 74 EDUCATION Less than High School 16.2 30.9 23.5 22.1 7.4 68 High School Diploma 2.2 36.6 29.1 25.4 6.7 134 Some College 5.6 28.5 24.3 32.6 9.0 144 College Degree 4.3 19.3 30.7 31.4 14.3 140 INCOME Under $15,000 4.0 30.0 30.0 22.0 14.0 50 $15,000-$29,999 8.1 41.4 23.2 26.3 1.0 99 $30,000-$49,999 11.2 22.4 29.0 29.9 7.5 107 $50,000 and Over 2.9 22.9 32.9 31.4 10.0 140 TYPE OF AREA Urban 4.7 28.3 29.9 31.5 5.5 127 Suburban 7.1 22.7 29.9 26.6 13.6 154 Rural 5.8 33.5 23.3 28.2 9.2 206 REGION Upstate 6.7 21.8 30.2 33.5 7.8 179 Midlands 5.9 32.0 26.6 24.3 11.2 169 Lowcountry 4.3 33.1 25.2 27.3 10.1 139 LIVE NEAR A BODY OF WATER Yes 6.0 29.3 34.5 22.4 7.8 116 No 5.9 28.2 25.2 30.3 10.5 373
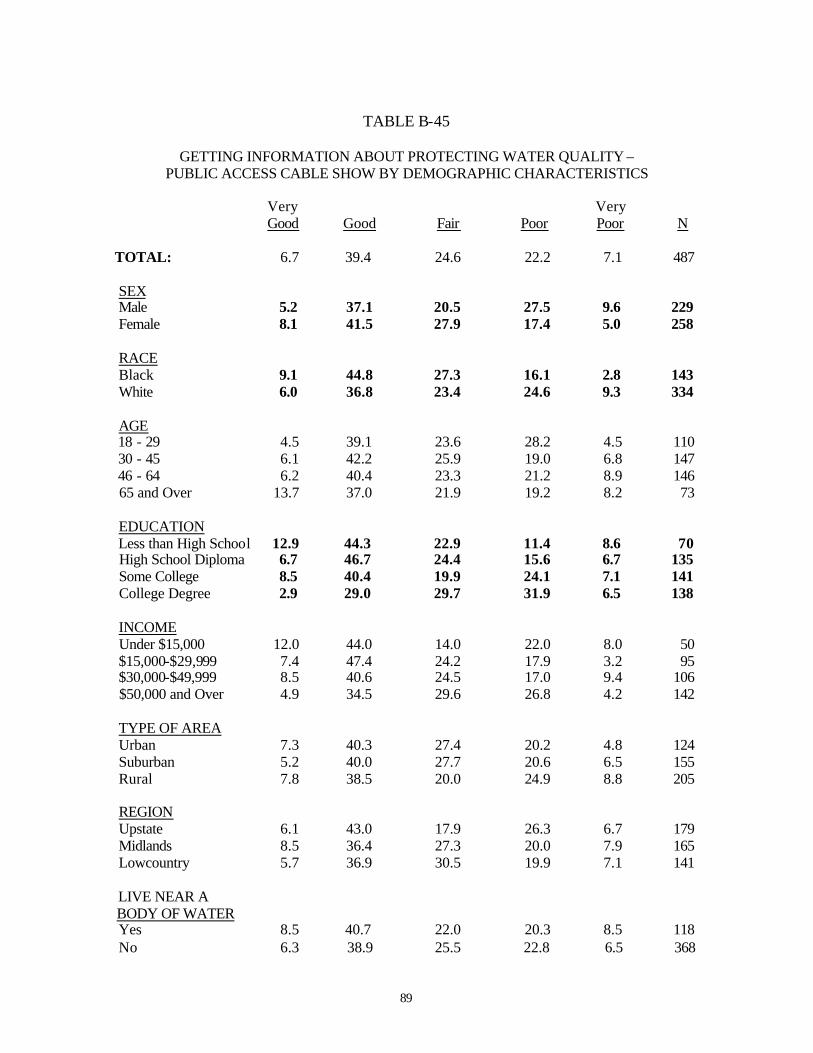
89
TABLE B-45
GETTING INFORMATION ABOUT PROTECTING WATER QUALITY – PUBLIC ACCESS CABLE SHOW BY DEMOGRAPHIC CHARACTERISTICS
Very Very Good Good Fair Poor Poor N TOTAL: 6.7 39.4 24.6 22.2 7.1 487 SEX Male 5.2 37.1 20.5 27.5 9.6 229 Female 8.1 41.5 27.9 17.4 5.0 258 RACE Black 9.1 44.8 27.3 16.1 2.8 143 White 6.0 36.8 23.4 24.6 9.3 334 AGE 18 - 29 4.5 39.1 23.6 28.2 4.5 110 30 - 45 6.1 42.2 25.9 19.0 6.8 147 46 - 64 6.2 40.4 23.3 21.2 8.9 146 65 and Over 13.7 37.0 21.9 19.2 8.2 73 EDUCATION Less than High School 12.9 44.3 22.9 11.4 8.6 70 High School Diploma 6.7 46.7 24.4 15.6 6.7 135 Some College 8.5 40.4 19.9 24.1 7.1 141 College Degree 2.9 29.0 29.7 31.9 6.5 138 INCOME Under $15,000 12.0 44.0 14.0 22.0 8.0 50 $15,000-$29,999 7.4 47.4 24.2 17.9 3.2 95 $30,000-$49,999 8.5 40.6 24.5 17.0 9.4 106 $50,000 and Over 4.9 34.5 29.6 26.8 4.2 142 TYPE OF AREA Urban 7.3 40.3 27.4 20.2 4.8 124 Suburban 5.2 40.0 27.7 20.6 6.5 155 Rural 7.8 38.5 20.0 24.9 8.8 205 REGION Upstate 6.1 43.0 17.9 26.3 6.7 179 Midlands 8.5 36.4 27.3 20.0 7.9 165 Lowcountry 5.7 36.9 30.5 19.9 7.1 141 LIVE NEAR A BODY OF WATER Yes 8.5 40.7 22.0 20.3 8.5 118 No 6.3 38.9 25.5 22.8 6.5 368

90
APPENDIX C
LIVE NEAR BODY OF WATER
BY DEMOGRAPHIC CHARACTERISTICS
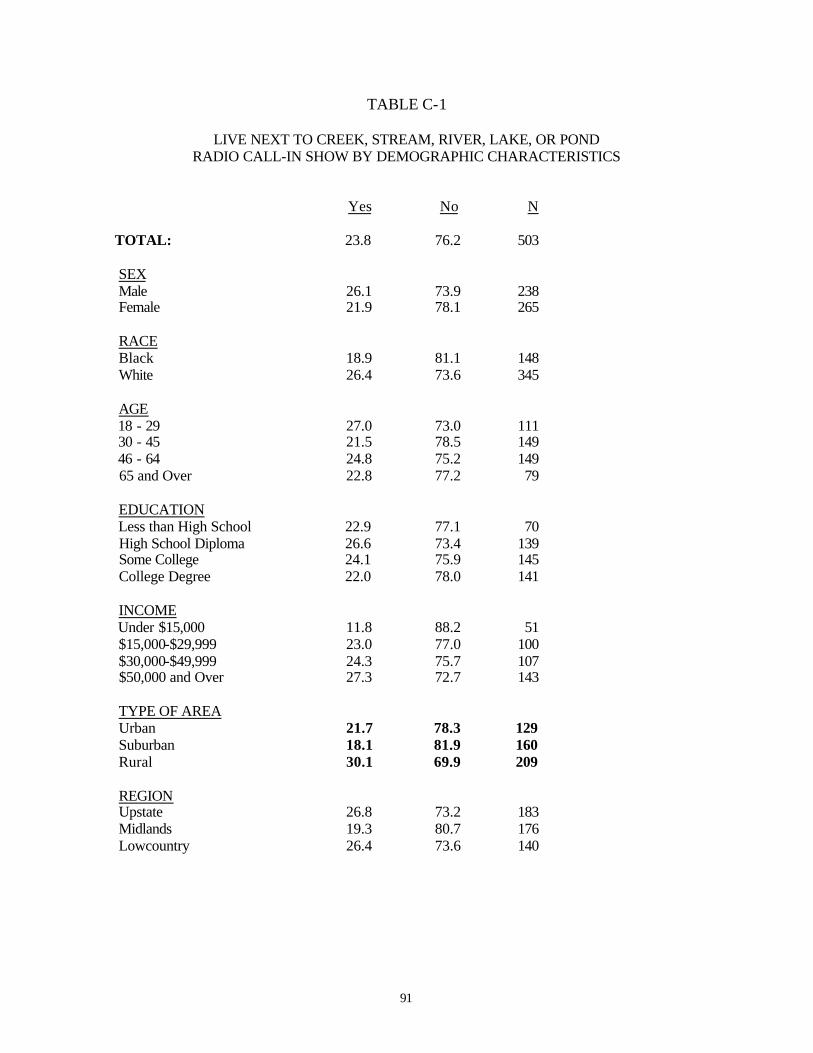
91
TABLE C-1
LIVE NEXT TO CREEK, STREAM, RIVER, LAKE, OR POND RADIO CALL-IN SHOW BY DEMOGRAPHIC CHARACTERISTICS
Yes No N TOTAL: 23.8 76.2 503 SEX Male 26.1 73.9 238 Female 21.9 78.1 265 RACE Black 18.9 81.1 148 White 26.4 73.6 345 AGE 18 - 29 27.0 73.0 111 30 - 45 21.5 78.5 149 46 - 64 24.8 75.2 149 65 and Over 22.8 77.2 79 EDUCATION Less than High School 22.9 77.1 70 High School Diploma 26.6 73.4 139 Some College 24.1 75.9 145 College Degree 22.0 78.0 141 INCOME Under $15,000 11.8 88.2 51 $15,000-$29,999 23.0 77.0 100 $30,000-$49,999 24.3 75.7 107 $50,000 and Over 27.3 72.7 143 TYPE OF AREA Urban 21.7 78.3 129 Suburban 18.1 81.9 160 Rural 30.1 69.9 209 REGION Upstate 26.8 73.2 183 Midlands 19.3 80.7 176 Lowcountry 26.4 73.6 140
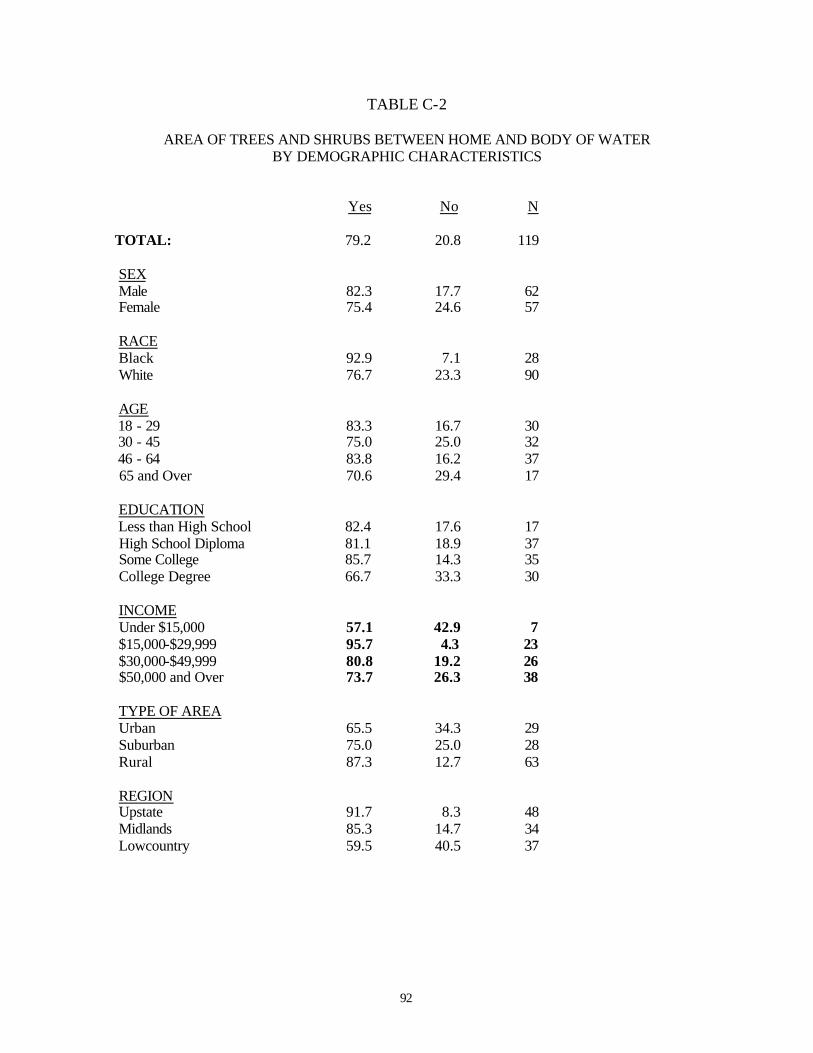
92
TABLE C-2
AREA OF TREES AND SHRUBS BETWEEN HOME AND BODY OF WATER BY DEMOGRAPHIC CHARACTERISTICS
Yes No N TOTAL: 79.2 20.8 119 SEX Male 82.3 17.7 62 Female 75.4 24.6 57 RACE Black 92.9 7.1 28 White 76.7 23.3 90 AGE 18 - 29 83.3 16.7 30 30 - 45 75.0 25.0 32 46 - 64 83.8 16.2 37 65 and Over 70.6 29.4 17 EDUCATION Less than High School 82.4 17.6 17 High School Diploma 81.1 18.9 37 Some College 85.7 14.3 35 College Degree 66.7 33.3 30 INCOME Under $15,000 57.1 42.9 7 $15,000-$29,999 95.7 4.3 23 $30,000-$49,999 80.8 19.2 26 $50,000 and Over 73.7 26.3 38 TYPE OF AREA Urban 65.5 34.3 29 Suburban 75.0 25.0 28 Rural 87.3 12.7 63 REGION Upstate 91.7 8.3 48 Midlands 85.3 14.7 34 Lowcountry 59.5 40.5 37


![Unit Hydrograph (UNIT-HG) Model · RUNOFF#0 – RUNOFF#N Where N= RUNOFF_UNIT Units for RUNOFF State Variables [mm or in] Sample States File: RUNOFF#0=0.0 RUNOFF#1=0.0 RUNOFF#2=9.0](https://img.pdfslide.us/doc/110x75/5ece307d6bbfcd2591178fc8/unit-hydrograph-unit-hg-model-runoff0-a-runoffn-where-n-runoffunit-units.jpg)