Embed Size (px)
Citation preview
Public Participatory GIS (ppgis), training & webGIS
in Mare Nostrum
Anna Spiteri, IRMCo
Haifa, Israel, 5th March 2013
What is ppgis? Why do we need it? Who participates? Where do we do it? When do we do it? What can we do with it? How do we do it?
Ppgis is a visualization tool that taps local knowledge that cannot be tapped otherwise… through “perception mapping”
“perception mapping” helps to identify, understand & address issues of spatial relationships of land & coastal ownership on the ground & approach spatial conflicts with a different perspective
What is ppgis? Why do we need it? Who participates? Where do we do it? When do we do it? What can we do with it? How do we do it?

Ppgis will open doors for various stakeholders & local communities… to actively participate in coastal management issues and raise specific socio-economic-cultural questions in a local context

Ppgis encourages people to think spatially, read & draw maps & create local perception maps of the desired future of the local coastline
Thus it is an empowering tool that can convey one’s own vision to various decision makers!

What is ppgis? Why do we need it? Who participates? Where do we do it? When do we do it? What can we do with it? How do we do it?
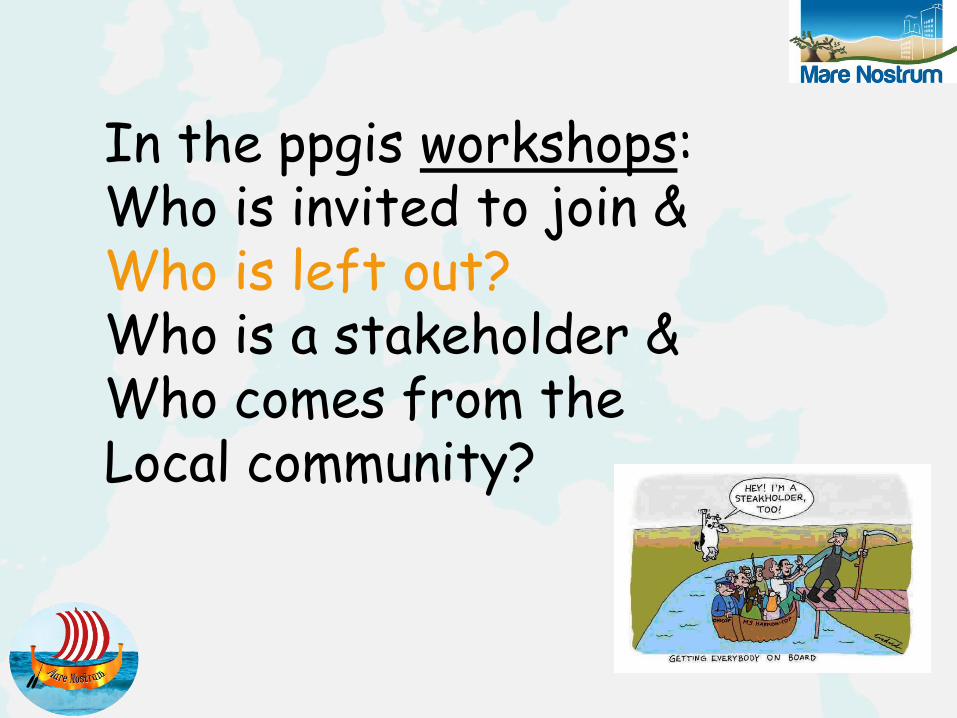
In the ppgis workshops: Who is invited to join & Who is left out? Who is a stakeholder & Who comes from the Local community?
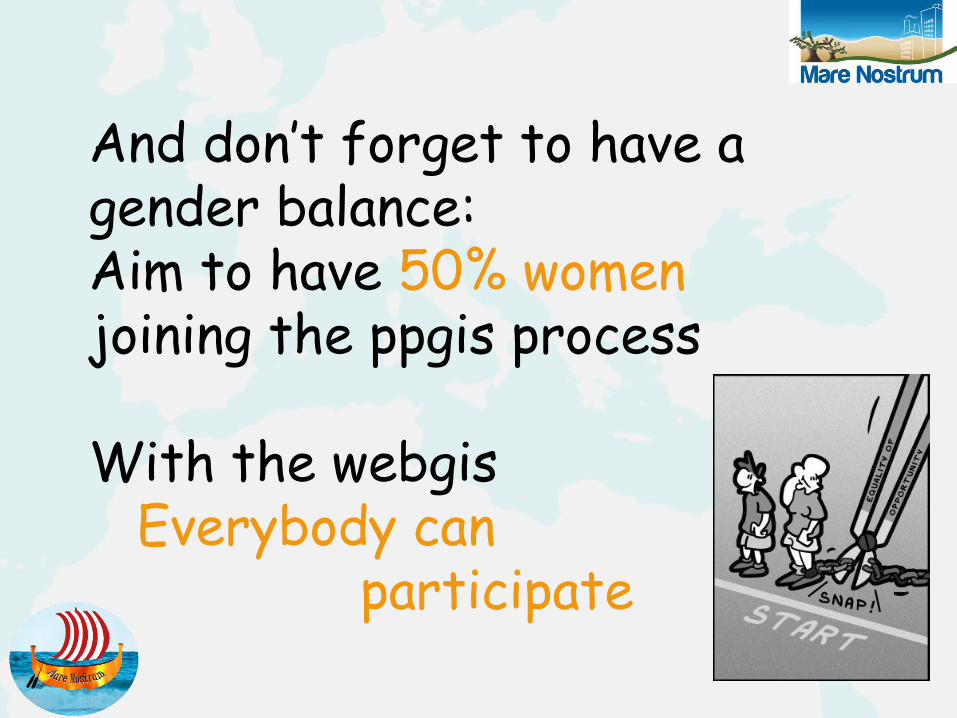
And don’t forget to have a gender balance: Aim to have 50% women joining the ppgis process With the webgis Everybody can participate
What is ppgis? Why do we need it? Who participates? Where do we do it? When do we do it? What can we do with it? How do we do it?
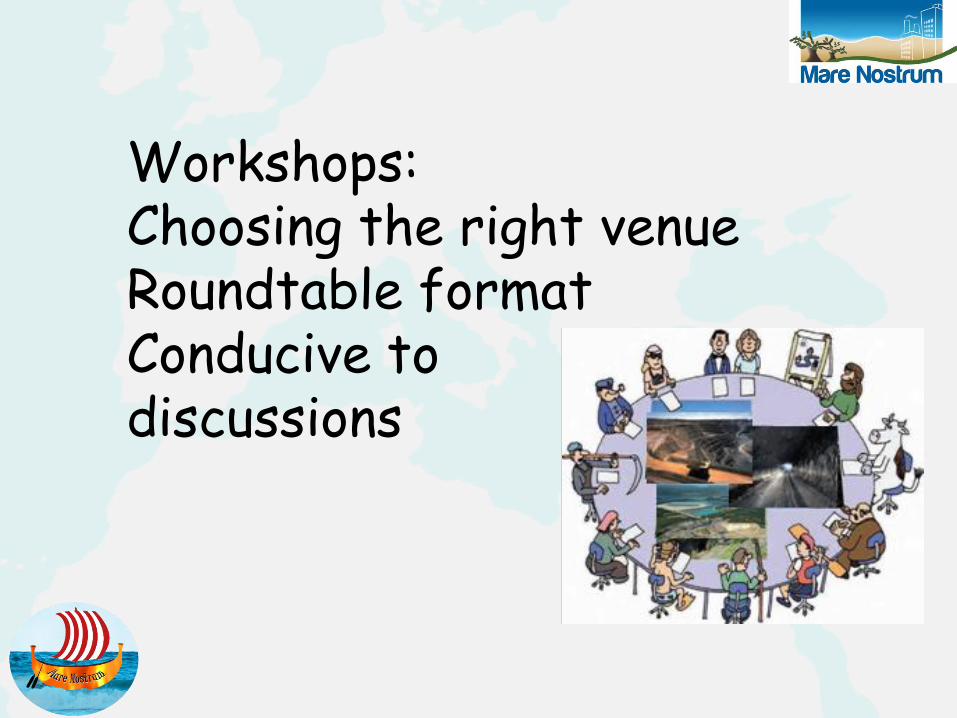
Workshops: Choosing the right venue Roundtable format Conducive to discussions

What is ppgis? Why do we need it? Who participates? Where do we do it? When do we do it? What can we do with it? How do we do it?
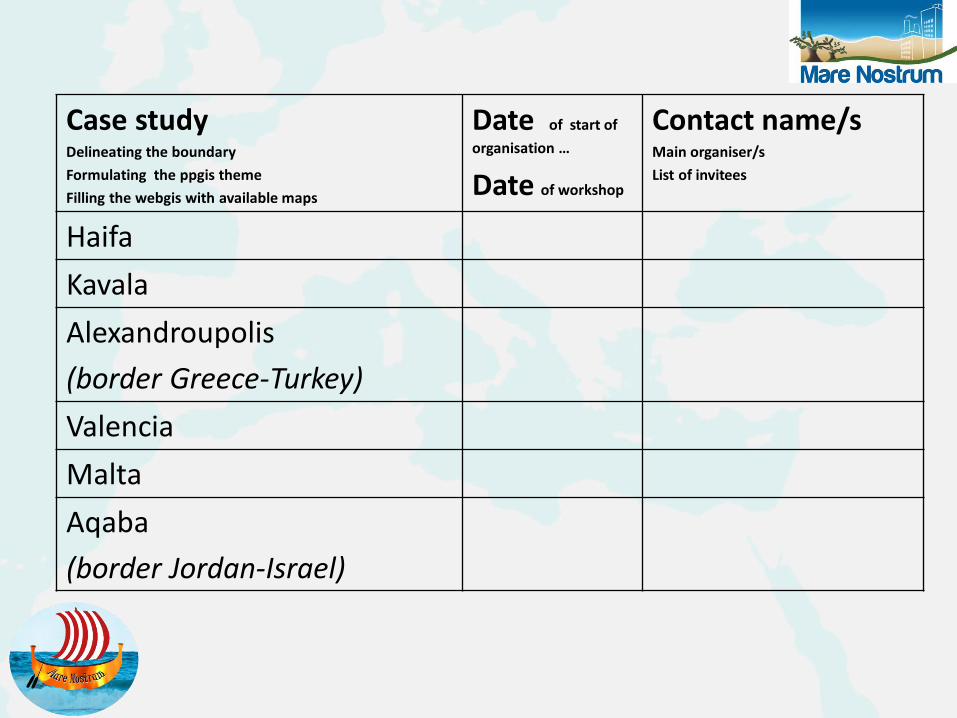
Case study Delineating the boundary
Formulating the ppgis theme
Filling the webgis with available maps
Date of start of
organisation …
Date of workshop
Contact name/s Main organiser/s
List of invitees
Haifa
Kavala
Alexandroupolis
(border Greece-Turkey)
Valencia
Malta
Aqaba
(border Jordan-Israel)
What is ppgis? Why do we need it? Who participates? Where do we do it? When do we do it? What can we do with it? How do we do it?

Some examples from another project
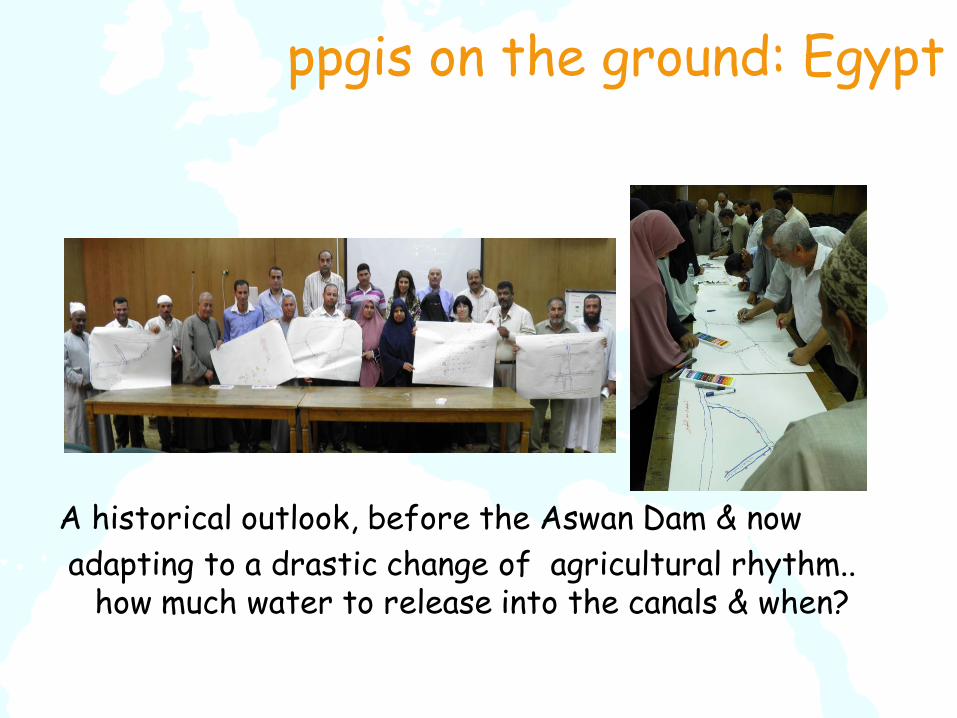
ppgis on the ground: Egypt
A historical outlook, before the Aswan Dam & now
adapting to a drastic change of agricultural rhythm.. how much water to release into the canals & when?
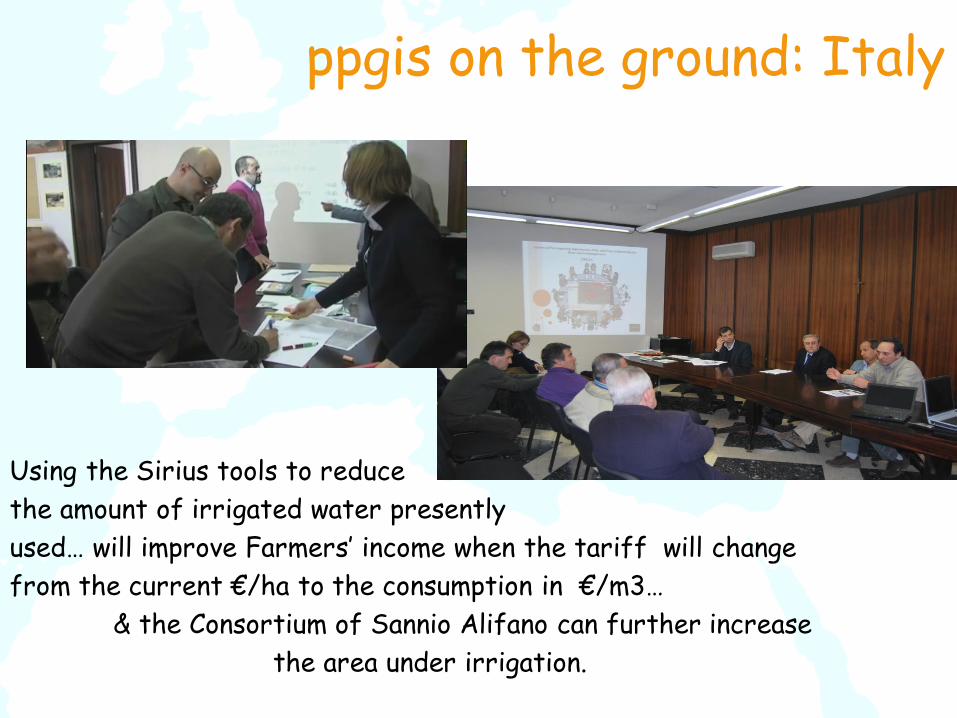
ppgis on the ground: Italy
Using the Sirius tools to reduce
the amount of irrigated water presently
used… will improve Farmers’ income when the tariff will change
from the current €/ha to the consumption in €/m3…
& the Consortium of Sannio Alifano can further increase
the area under irrigation.
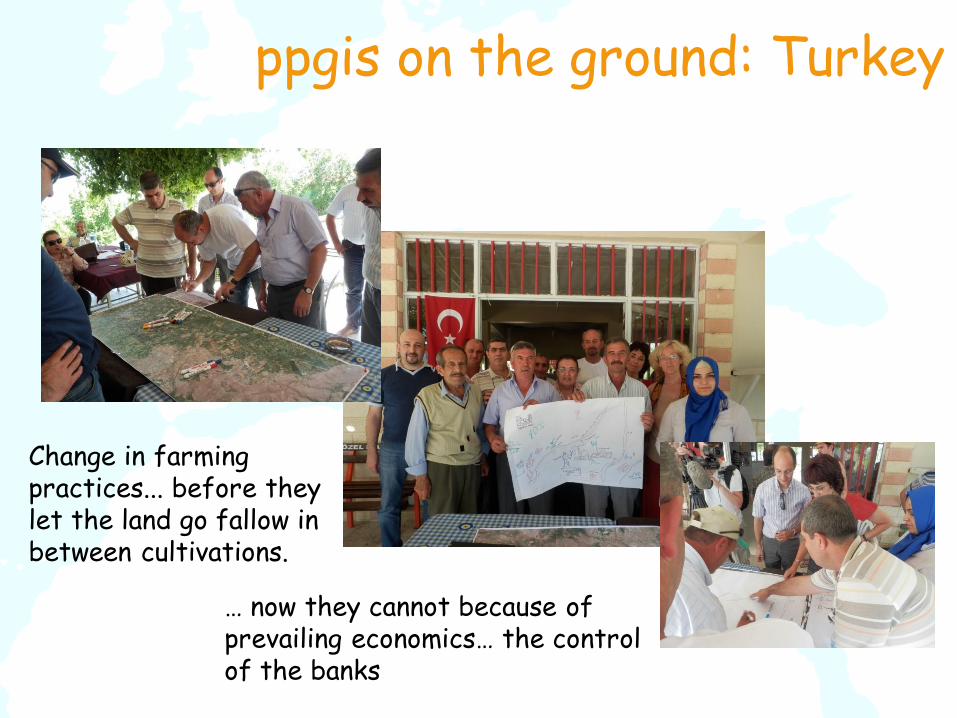
ppgis on the ground: Turkey
… now they cannot because of prevailing economics… the control of the banks
Change in farming practices... before they let the land go fallow in between cultivations.
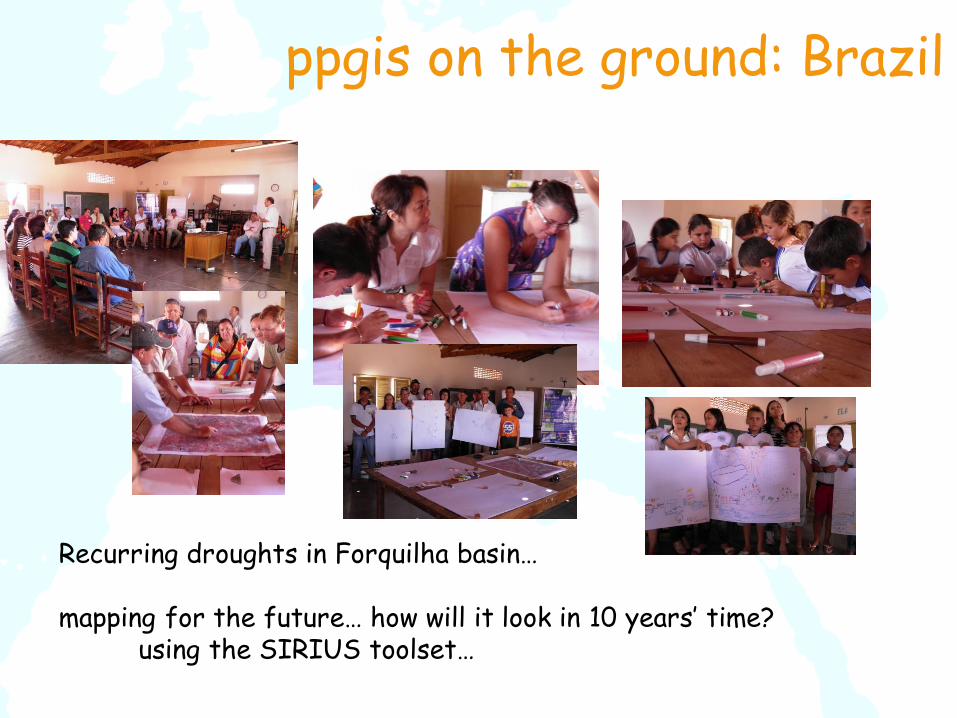
ppgis on the ground: Brazil
Recurring droughts in Forquilha basin… mapping for the future… how will it look in 10 years’ time? using the SIRIUS toolset…
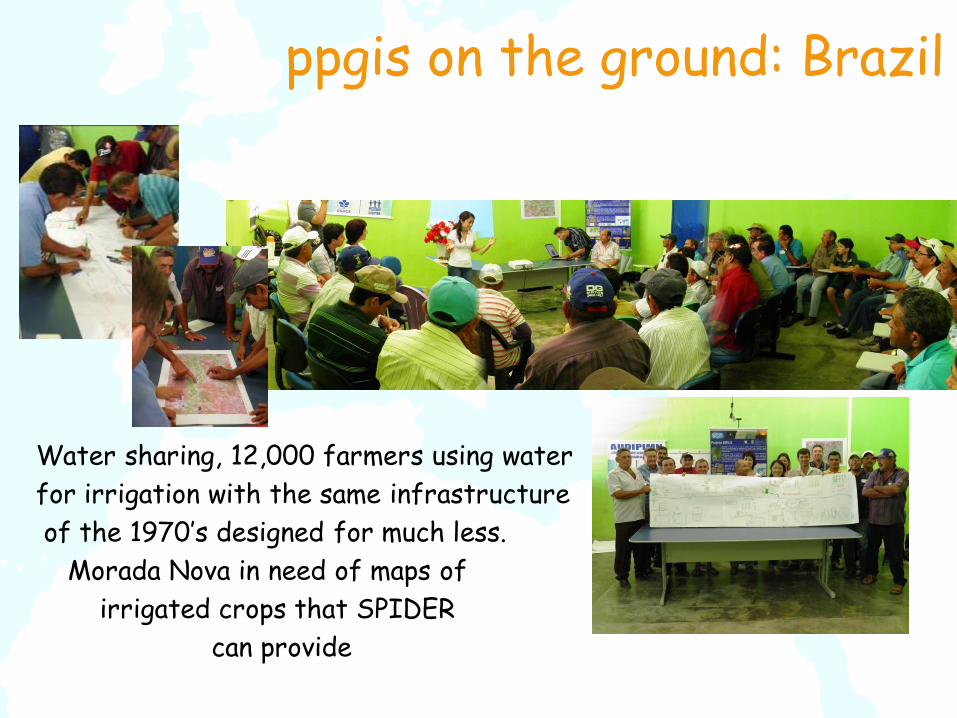
Water sharing, 12,000 farmers using water
for irrigation with the same infrastructure
of the 1970’s designed for much less.
Morada Nova in need of maps of
irrigated crops that SPIDER
can provide
ppgis on the ground: Brazil
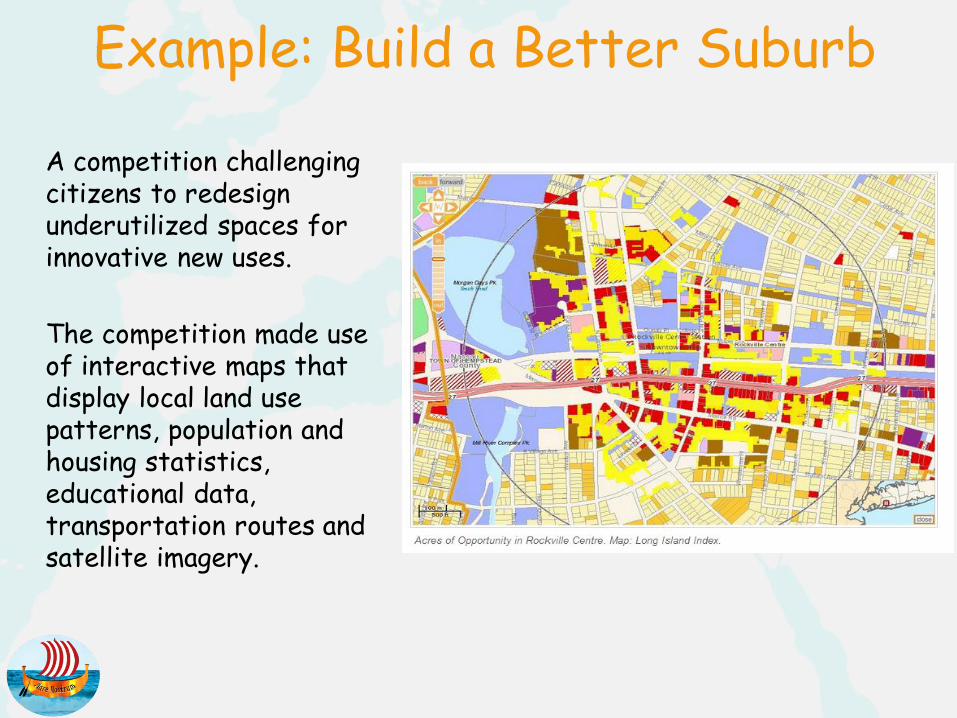
Example: Build a Better Suburb
A competition challenging citizens to redesign underutilized spaces for innovative new uses.
The competition made use of interactive maps that display local land use patterns, population and housing statistics, educational data, transportation routes and satellite imagery.
What is ppgis? Why do we need it? Who participates? Where do we do it? When do we do it? What can we do with it? How do we do it?

Put ourselves in a real time situation…… A developer submitted an application for a yacht marina of 200 berths to the Planning Authority… which approved the first stage & went to the second stage of public consultation.
Ppgis & role playing…our roles: •The Planning authority planner;
•The developer + architect willing to invest millions;
•Ministry of tourism promoting the development;
•Ministry of transport ready to widen the coastal road into 4 lane;
•Ministry of environment who also approved the first stage;
•Maritime Authority who will manage the marina;
•Local fishermen earning a living or owning a boat for leisure;
•Local community who enjoy a family friendly promenade & swimming and do not want to loose their recreational space;
•NGO who engaged a socio-anthropologist to study the impact of the development on the local community;
•The local council…

Keep in mind the policies we heard yesterday…
…adopt a long term perspective, i.e. long term impacts…, setback of 100 metres Etc, etc……
We will draw a perception map of how we all desire the coast to look like! But also be prepared to compromise….?
We stop for a few minutes to visualise the coastline …… … we start by drawing up a legend

The third part…..the web GIS
A practical guide for the use of ppgis (& webgis) for ICZM in
the Mediterranean will be ready by M12

ppgis as a means to generate participatory involvement can be done on paper & can also be done directly in digital format using a tablet
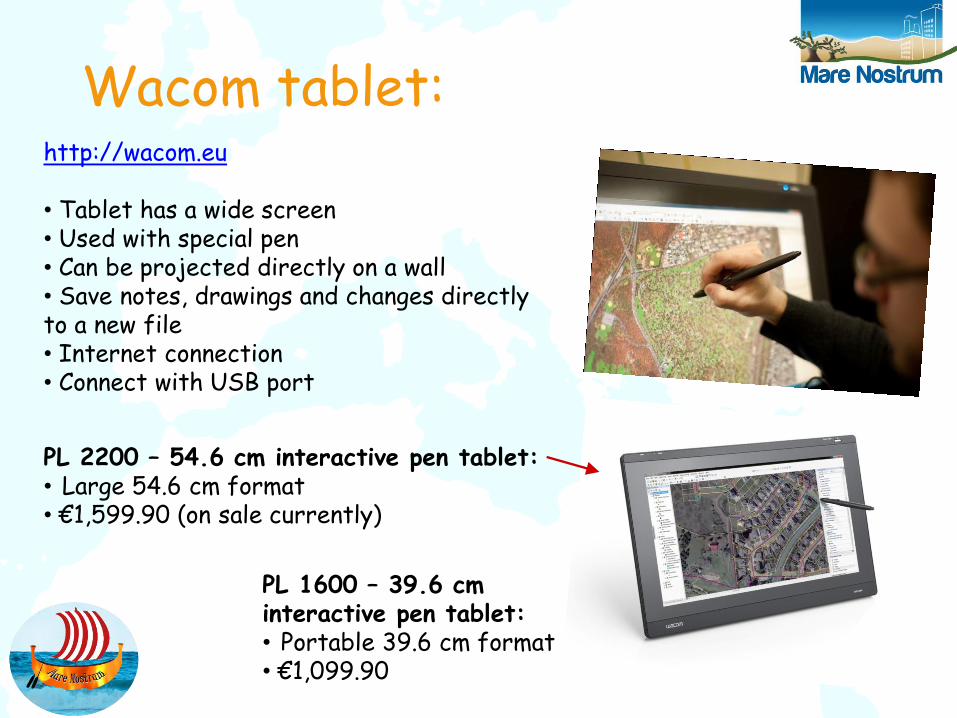
Wacom tablet:
PL 1600 – 39.6 cm interactive pen tablet: • Portable 39.6 cm format • €1,099.90
http://wacom.eu • Tablet has a wide screen • Used with special pen • Can be projected directly on a wall • Save notes, drawings and changes directly to a new file • Internet connection • Connect with USB port
PL 2200 – 54.6 cm interactive pen tablet: • Large 54.6 cm format • €1,599.90 (on sale currently)
How to make perception maps accessible online… ? We start building a webGIS
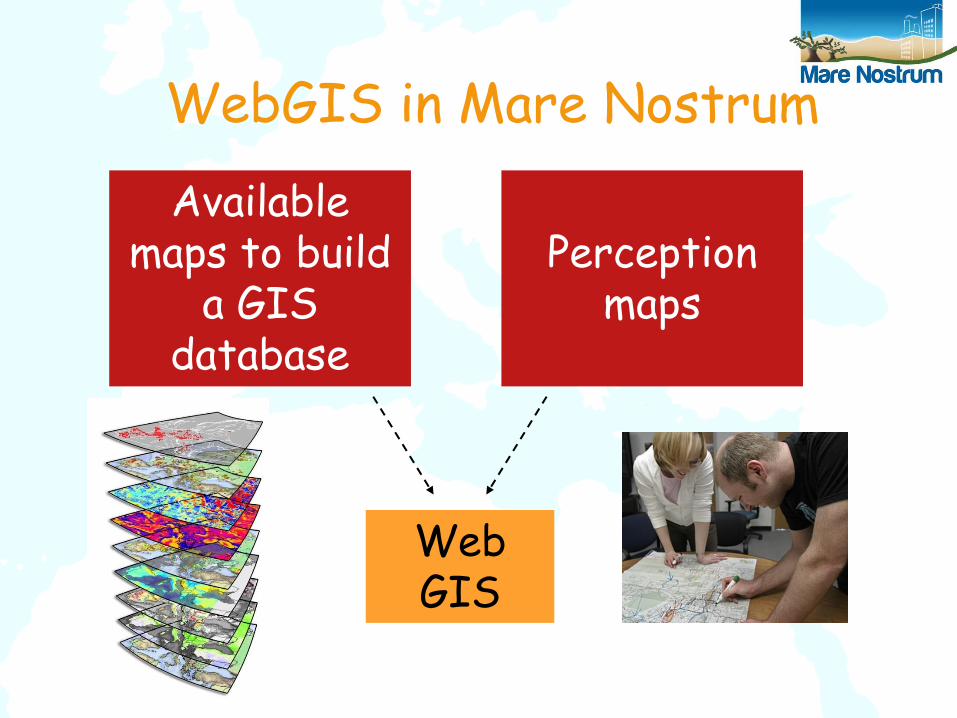
Web GIS
Available maps to build
a GIS database
Perception
maps
WebGIS in Mare Nostrum
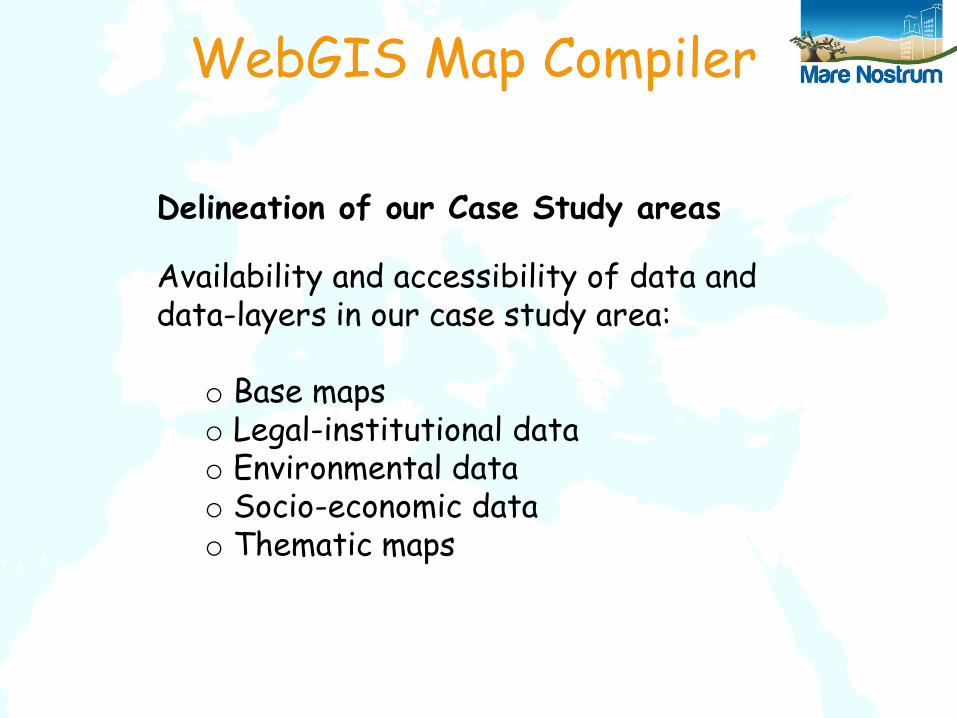
Delineation of our Case Study areas
Availability and accessibility of data and data-layers in our case study area:
o Base maps o Legal-institutional data o Environmental data o Socio-economic data o Thematic maps
WebGIS Map Compiler

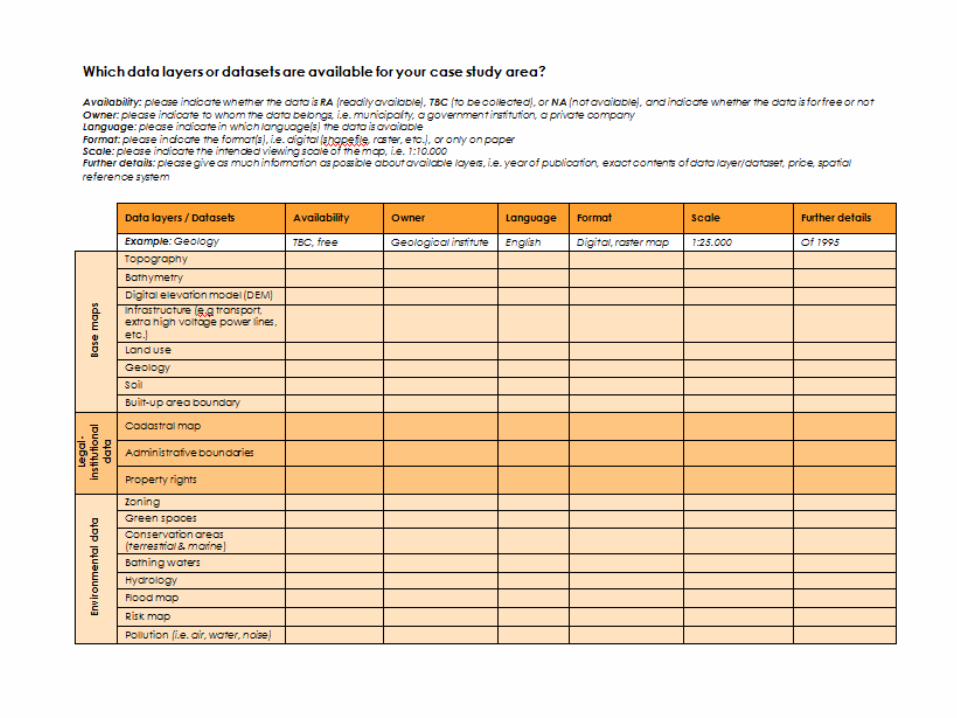


A selection of data layers of each case study area will be presented in the webGIS, e.g.:
Geology
Land cover Population
density
to be used in the stakeholder workshops to spark discussion: the maps provide information and serve as a reference for the drawing of
local perception maps
Online webGIS
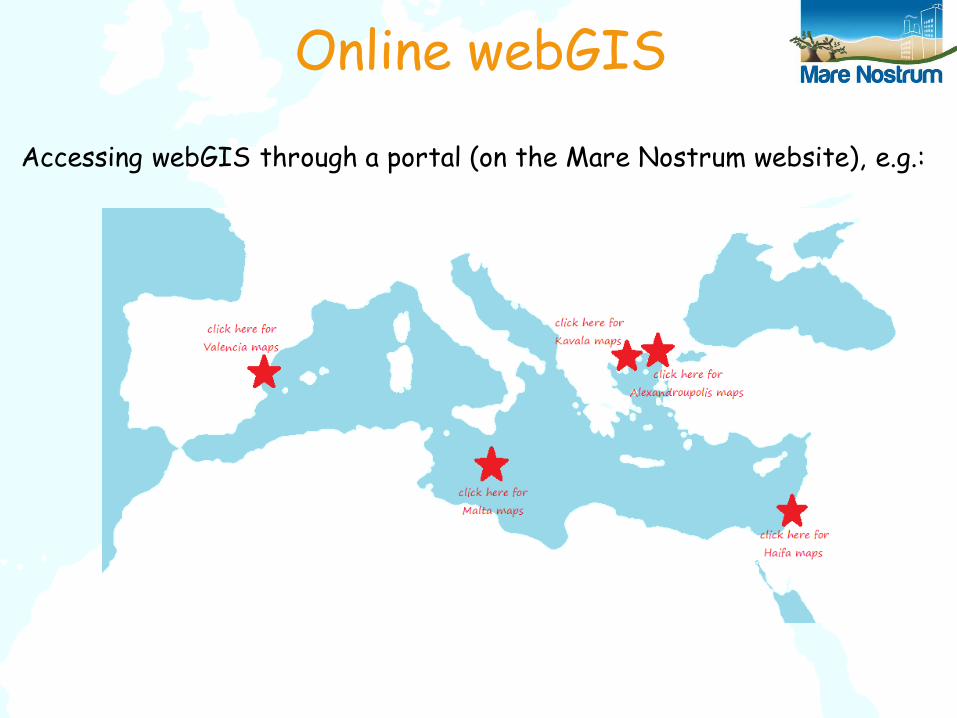
Accessing webGIS through a portal (on the Mare Nostrum website), e.g.:
Online webGIS
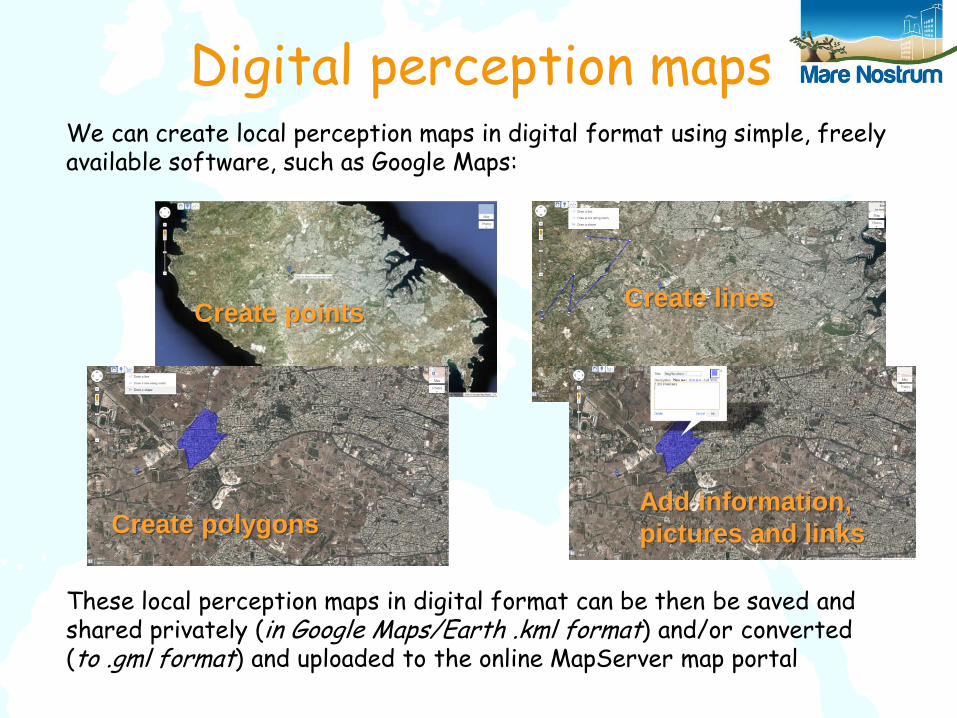
We can create local perception maps in digital format using simple, freely available software, such as Google Maps:
These local perception maps in digital format can be then be saved and shared privately (in Google Maps/Earth .kml format) and/or converted (to .gml format) and uploaded to the online MapServer map portal
Create points Create lines
Create polygons Add information,
pictures and links
Digital perception maps
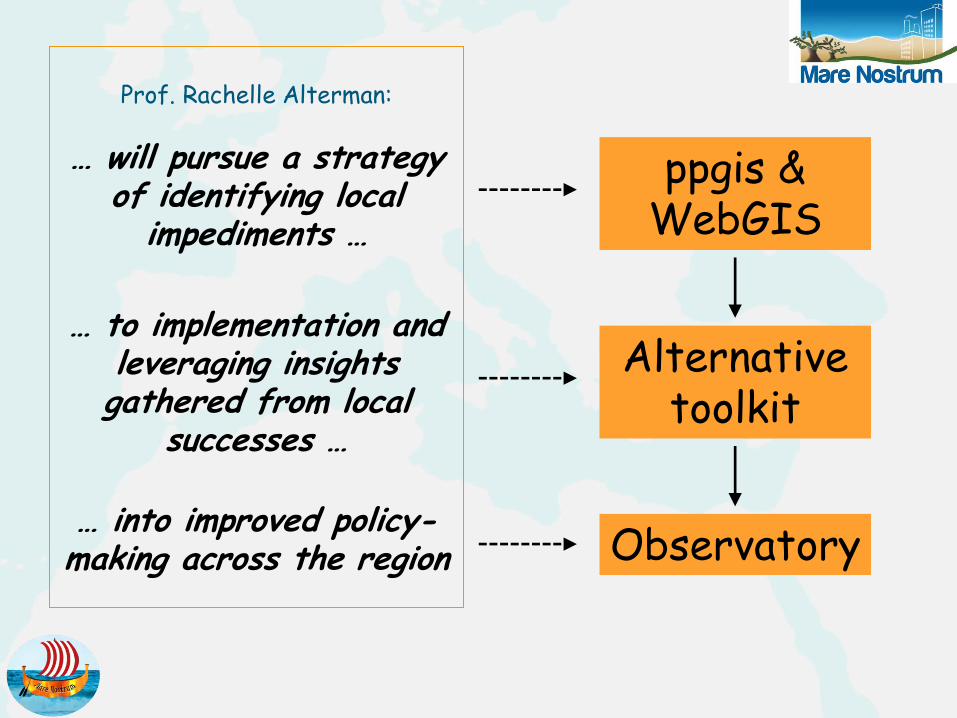
ppgis & WebGIS
Alternative toolkit
Observatory