Embed Size (px)
Citation preview
Supplementary InformationEAST HAMPSHIRE DISTRICT COUNCIL
GOVERNANCE, AUDIT AND SCRUTINY COMMITTEE29 July 2019
Dear Councillor
I am now able to enclose, for consideration at next meeting of the Governance, Audit and Scrutiny Committee, to be held on 29 July 2019 the following supplementary information that was unavailable when the agenda was printed.
Agenda No Item
5 Statement of Accounts and Letter of Representation 2018/19 (Pages 1 - 106)

NON EXEMPT
EAST HAMPSHIRE DISTRICT COUNCIL
Governance, Audit and Scrutiny Committee 29th July 2019
STATEMENT OF ACCOUNTS 2018/19 AND LETTER OF REPRESENTATION – EAST HAMPSHIRE DISTRICT COUNCIL
Chief Finance Officer
FOR INFORMATION
Portfolio: Portfolio Holder for Finance Cllr Charles Louisson
Key Decision: No
1.0 Purpose of Report
1.1 To present the audited Statement of Accounts 2018/19 for noting and signing.
1.2 To present the Council’s Letter of Representation for noting and signing.
2.0 Recommendation
2.1 That the Committee agree the Statement of Accounts for 2018/19, that the Chairman certifies the approval by signing page 18 of the accounts and the s151 Officer certify the approval of the Accounts by signing pages 5, 18 and 26 of the Accounts.
2.2 That the Committee agree the Letter of Representation, and the Chairman of the Committee and s151 Officer sign the letter.
2.3 That the Committee delegates to the s151 Officer, in consultation with the Chairman of the Committee, the power to make any necessary changes to the signed Statement of Accounts prior to the statutory deadline.
3.0 Executive Summary
3.1 The Council is required to approve the audited Statement of Accounts for the financial year ending 31st March 2019 for publication on or before the 31st July 2019.
3.2 The Council is also required to respond formally to the Audit Results Report as issued by the external auditors, this response is provided within the Letter of Representation.
4.0 Additional Budgetary Implications
4.1 None.
5.0 Background
5.1 The Accounts and Audit Regulations 2015 require the Chief Finance Officer to first sign the accounts no later than the 31st May and certify that they present a true and fair view of the financial position of the Council at the end of the year to which it relates and its income and expenditure for that year. The Chief Finance Officer is required to rectify the presentation of the accounts for approval by the Governance, Audit and Scrutiny Committee.
5.2 The accounts have been audited by KPMG and their conclusions have been presented to the Committee. The Audit report outlines the findings of the audit and corrections which were required.
5.3 The Letter of Representation is the Council’s formal response to the Audit Results report. It outlines how the Council has complied with its statutory duties.
5.4 The draft Letter of Representation is attached as Appendix B to this report.
6.0 Resource Implications
6.1 Financial Implications – None.
6.2 Human Resources Implications – None.
7.0 Legal Implications
7.1 If the Annual Audit Report and Statutory Accounts are not noted and agreed, the Council will not meet its statutory obligations to publish audited accounts on or before the 31st July 2019.
8.0 Communication
8.1 The Annual Audit Report and Statutory Accounts will be made public on or before 31st July 2019.
9.0 Appendices
Appendix A: Statement of Accounts 2018/19Appendix B: Draft Letter of Representation
Agreed and signed off by:
Monitoring Officer: S151 Officer: Portfolio Holder:
Contact Officer: Andrew ClarkeJob Title: Deputy Section 151 OfficerTelephone: 02392 446602E-Mail: [email protected]

1
Appendix A
EAST HAMPSHIRE DISTRICT COUNCILSTATEMENT OF ACCOUNTS
2018 – 2019
2
CONTENTS
CONTENTS ................................................................................................................................................................................2
NARRATIVE STATEMENT.....................................................................................................................................................4
STATEMENT OF RESPONSIBILITIES FOR THE STATEMENT OF ACCOUNTS ....................................................18
INDEPENDENT AUDITORS’ REPORT TO THE MEMBERS OF EAST HAMPSHIRE DISTRICT COUNCIL .......20
MOVEMENT IN RESERVES STATEMENT ......................................................................................................................21
EXPENDITURE & FUNDING ANALYSIS...........................................................................................................................23
COMPREHENSIVE INCOME AND EXPENDITURE STATEMENT ..............................................................................25
BALANCE SHEET..................................................................................................................................................................26
CASH FLOW STATEMENT ..................................................................................................................................................27
NOTES TO THE CORE FINANCIAL STATEMENTS.......................................................................................................28
1. Accounting Policies ...............................................................................................................................................28
2. Accounting Standards that have been issued but have not yet been adopted .....................................43
3. Critical Judgements in applying accounting policies ...................................................................................44
4. Assumptions made about the future and other major sources of estimation uncertainty .................45
5. Notes to the Expenditure and funding analysis .............................................................................................46
6. Exceptional items....................................................................................................................................................48
7. Material Items of Income and Expense .............................................................................................................48
8. Adjustments between the accounting basis and funding basis under regulations .............................49
9. Transfers to/from earmarked reserves..............................................................................................................51
10. Other Operating Expenditure ..........................................................................................................................51
11. Financing and Investment Income and Expenditure ................................................................................52
12. Taxation and non-specific grant income......................................................................................................52
13. Property, plant and equipment........................................................................................................................53
14. Investment Properties .......................................................................................................................................56
15. Intangible Assets ................................................................................................................................................56
16. Financial Instruments ........................................................................................................................................57
17. Inventories ............................................................................................................................................................58
18. Debtors ..................................................................................................................................................................59
19. Cash and cash equivalents ..............................................................................................................................59
20. Creditors................................................................................................................................................................60
21. Provisions .............................................................................................................................................................60
22. Usable reserves...................................................................................................................................................62
23. Unusable reserves..............................................................................................................................................62
24. Net cash flow from operating activities ........................................................................................................67
25. Net cash flow from investing activities.........................................................................................................68
26. Net cash flow from financing activities ........................................................................................................68
27. Agency services..................................................................................................................................................68
28. Members’ Allowances........................................................................................................................................69
3
29. Officers’ Remuneration .....................................................................................................................................69
30. External audit costs ...........................................................................................................................................71
31. Grant Income........................................................................................................................................................71
32. Related Parties ....................................................................................................................................................73
33. Interests in other entities..................................................................................................................................73
34. Capital Expenditure and Capital Financing .................................................................................................76
35. Leases....................................................................................................................................................................77
36. Impairment losses ..............................................................................................................................................80
37. Termination Benefits..........................................................................................................................................80
38. Defined benefit pension schemes..................................................................................................................80
39. Contingent liabilities and contingent assets...............................................................................................85
40. Nature and extent of risks arising from financial instruments...............................................................86
41. Events after the Balance Sheet Date .............................................................................................................88
42. Authorisation of the statement of accounts................................................................................................88
COLLECTION FUND STATEMENT ....................................................................................................................................89
NOTES TO THE COLLECTION FUND ..............................................................................................................................90
1. Calculation of the council tax base ....................................................................................................................90
2. Non-Domestic Rateable Value and Rate Multiplier ........................................................................................90
NOTES TO THE COLLECTION FUND ..............................................................................................................................91
3. Precepts and Demands on the Collection Fund .............................................................................................91
GLOSSARY OF TERMS .......................................................................................................................................................92
Enquiries regarding the contents of this report should be made to:
The Finance Department,East Hampshire District Council,
Penns Place,Petersfield,
Hants.GU31 4EX
Telephone: (01749 341270)
This report and further details of the Council’s finances can also be viewed on the Council's website
(http://www.easthants.gov.uk)
4
NARRATIVE STATEMENT
Introduction to East Hampshire District Council The Statutory Accounts have been prepared in accordance with the requirements of the Chartered Institute of Public Finance Accountancy (CIPFA). It aims to provide information to the public, including electors, residents and businesses of East Hampshire, Council Members, partners and other stakeholders of East Hampshire District Council.
The Statutory Accounts aim to provide:
An understanding of the overarching financial position of the Council
Confidence that the public funds entrusted to the Council have been accounted for appropriately
Assurance that the financial position of the Council is robust.
Structure of the Narrative Statement
The Narrative Statement is structured into:
Performance against Business Plans & Council Strategy Overall Financial Position Key facts about East Hampshire District Council Financial Performance and Capital Summary Medium Term Financial Strategy Explanation of Core Statements The Council’s Responsibilities and Certification of the Accounts
Key facts about East Hampshire District Council
East Hampshire District Council is responsible for services such as waste
5
collection and recycling, council tax collection, leisure services, planning, housing, building control, environmental health, car parking and economic development. Policies and strategies are developed and determined by our 44 councillors1. The Council employs 305 full time equivalent staff and serves a population of 119,900 and 5,000 businesses.
Our ambition continues to focus on improving people’s lives by providing excellent public services that represent good value for money and meet our communities’ needs whilst managing the significant financial pressures arising from the wider national economic context including the Government’s austerity measures to address these which has resulted in grants to local authorities being reduced annually2. 2018/19 was the first financial year that East Hampshire District Council did not receive any funding by way of the Revenue Support Grant.
Our aim is to reduce over time the reliance on national funding grants by driving forward service transformations and sales of our services, innovation and an investment strategy. In 2018/19 56% of our funding was achieved through these means. Overall Financial Position
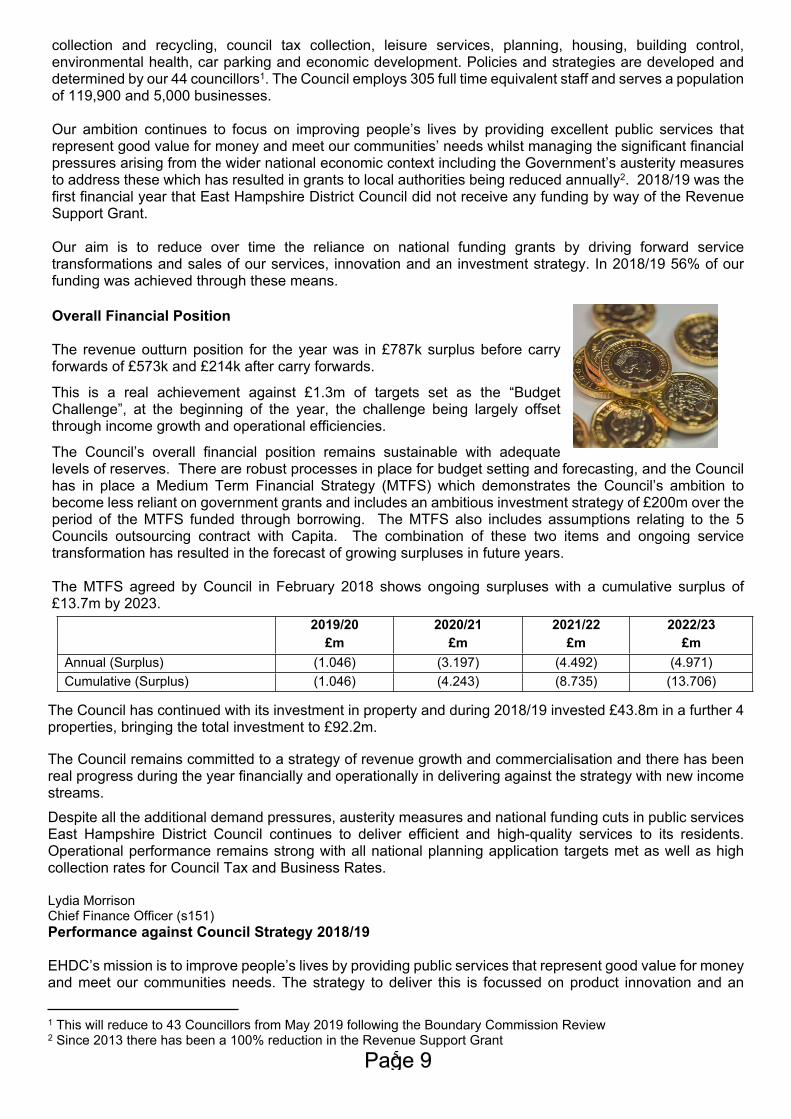
The revenue outturn position for the year was in £787k surplus before carry forwards of £573k and £214k after carry forwards.
This is a real achievement against £1.3m of targets set as the “Budget Challenge”, at the beginning of the year, the challenge being largely offset through income growth and operational efficiencies. The Council’s overall financial position remains sustainable with adequate levels of reserves. There are robust processes in place for budget setting and forecasting, and the Council has in place a Medium Term Financial Strategy (MTFS) which demonstrates the Council’s ambition to become less reliant on government grants and includes an ambitious investment strategy of £200m over the period of the MTFS funded through borrowing. The MTFS also includes assumptions relating to the 5 Councils outsourcing contract with Capita. The combination of these two items and ongoing service transformation has resulted in the forecast of growing surpluses in future years.
The MTFS agreed by Council in February 2018 shows ongoing surpluses with a cumulative surplus of £13.7m by 2023.
2019/20 2020/21 2021/22 2022/23£m £m £m £m
Annual (Surplus) (1.046) (3.197) (4.492) (4.971)Cumulative (Surplus) (1.046) (4.243) (8.735) (13.706)
The Council has continued with its investment in property and during 2018/19 invested £43.8m in a further 4 properties, bringing the total investment to £92.2m.
The Council remains committed to a strategy of revenue growth and commercialisation and there has been real progress during the year financially and operationally in delivering against the strategy with new income streams.
Despite all the additional demand pressures, austerity measures and national funding cuts in public services East Hampshire District Council continues to deliver efficient and high-quality services to its residents. Operational performance remains strong with all national planning application targets met as well as high collection rates for Council Tax and Business Rates.
Lydia MorrisonChief Finance Officer (s151)Performance against Council Strategy 2018/19
EHDC’s mission is to improve people’s lives by providing public services that represent good value for money and meet our communities needs. The strategy to deliver this is focussed on product innovation and an
1 This will reduce to 43 Councillors from May 2019 following the Boundary Commission Review2 Since 2013 there has been a 100% reduction in the Revenue Support Grant
6
entrepreneurial approach to ensuring the council is financially independent of all government funding.
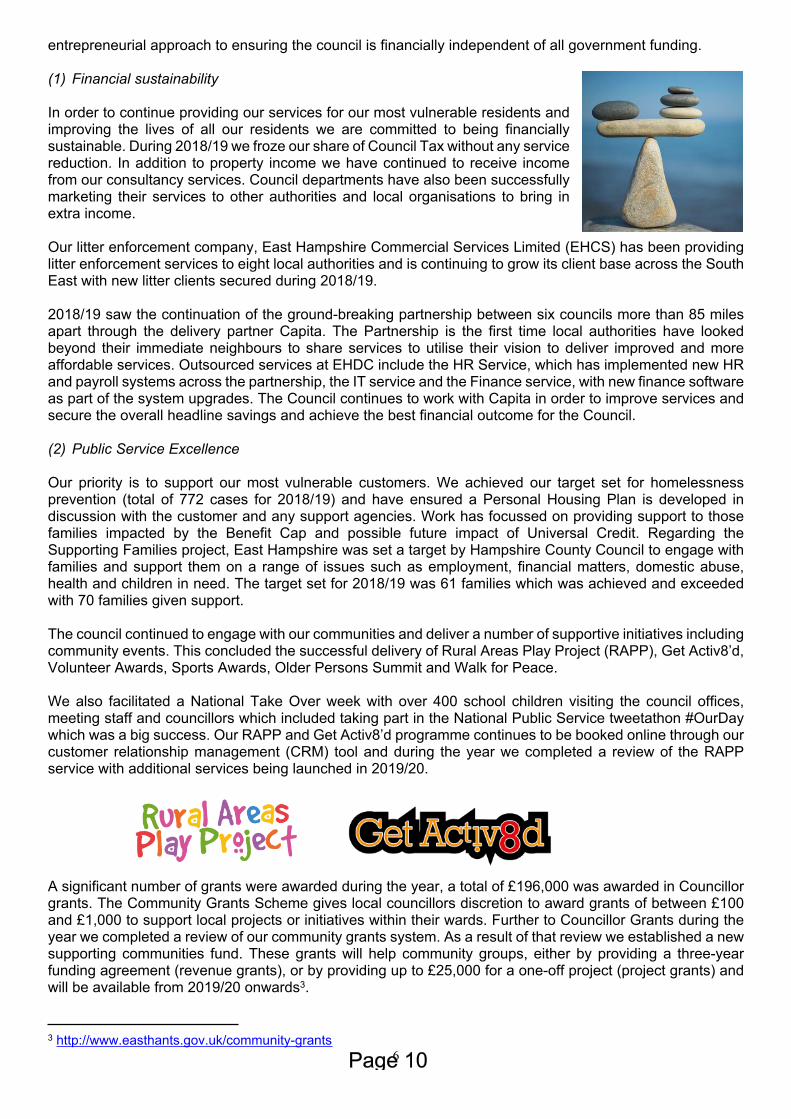
(1) Financial sustainability
In order to continue providing our services for our most vulnerable residents and improving the lives of all our residents we are committed to being financially sustainable. During 2018/19 we froze our share of Council Tax without any service reduction. In addition to property income we have continued to receive income from our consultancy services. Council departments have also been successfully marketing their services to other authorities and local organisations to bring in extra income.
Our litter enforcement company, East Hampshire Commercial Services Limited (EHCS) has been providing litter enforcement services to eight local authorities and is continuing to grow its client base across the South East with new litter clients secured during 2018/19.
2018/19 saw the continuation of the ground-breaking partnership between six councils more than 85 miles apart through the delivery partner Capita. The Partnership is the first time local authorities have looked beyond their immediate neighbours to share services to utilise their vision to deliver improved and more affordable services. Outsourced services at EHDC include the HR Service, which has implemented new HR and payroll systems across the partnership, the IT service and the Finance service, with new finance software as part of the system upgrades. The Council continues to work with Capita in order to improve services and secure the overall headline savings and achieve the best financial outcome for the Council.
(2) Public Service Excellence
Our priority is to support our most vulnerable customers. We achieved our target set for homelessness prevention (total of 772 cases for 2018/19) and have ensured a Personal Housing Plan is developed in discussion with the customer and any support agencies. Work has focussed on providing support to those families impacted by the Benefit Cap and possible future impact of Universal Credit. Regarding the Supporting Families project, East Hampshire was set a target by Hampshire County Council to engage with families and support them on a range of issues such as employment, financial matters, domestic abuse, health and children in need. The target set for 2018/19 was 61 families which was achieved and exceeded with 70 families given support.
The council continued to engage with our communities and deliver a number of supportive initiatives including community events. This concluded the successful delivery of Rural Areas Play Project (RAPP), Get Activ8’d, Volunteer Awards, Sports Awards, Older Persons Summit and Walk for Peace.
We also facilitated a National Take Over week with over 400 school children visiting the council offices, meeting staff and councillors which included taking part in the National Public Service tweetathon #OurDay which was a big success. Our RAPP and Get Activ8’d programme continues to be booked online through our customer relationship management (CRM) tool and during the year we completed a review of the RAPP service with additional services being launched in 2019/20.
A significant number of grants were awarded during the year, a total of £196,000 was awarded in Councillor grants. The Community Grants Scheme gives local councillors discretion to award grants of between £100 and £1,000 to support local projects or initiatives within their wards. Further to Councillor Grants during the year we completed a review of our community grants system. As a result of that review we established a new supporting communities fund. These grants will help community groups, either by providing a three-year funding agreement (revenue grants), or by providing up to £25,000 for a one-off project (project grants) and will be available from 2019/20 onwards3.
3 http://www.easthants.gov.uk/community-grants
7
(3) Creativity and Innovation
East Hampshire District Council is an exciting and vibrant organisation to work for. The Council provides community leadership and is at the cutting edge of innovation and best practice. A change of culture remains central to a high performing Council. There are now four specific workstreams dedicated to an area of change and supported by staff volunteers in the areas of Wellbeing, Performance and Productivity, Good Governance and Communications and Engagement. Our EHDC website, designed to make priority services easy to find has continued to grow as well as our social media presence. When compared to the last quarter from last year (2017/18), the number of website visits has increased by 56% (up from 137,487 to 214,993). The website usage continues to increase and is becoming the default place to access council services and information with more users visiting the site every year.
During the year the Council was shortlisted for the Entrepreneurial Council of the Year award by the Local Government Chronicle. The council’s entry focused on property investment, income from consultancy and minimising the financial burden on the district’s taxpayers and reflected the Council’s strategy to be more business-like.
We are committed to developing and supporting all our colleagues. We continued to develop a modern and effective employment package for our staff. Heads of Service and Team Leaders have completed a comprehensive HR skills programme and staff talent matrix. This has included information on policies and procedures in addition to appropriate decision making in respect of people management matters. We have continued our quarterly You’re a Star staff awards, and our annual staff awards took place in December 2018, recognising individual and team achievements. We also held a Leadership Conference for our current and future leaders.
Our Councillors have also been involved in a Councillor Development pilot and were successfully awarded National Councillor Charter status accreditation during the year. Work continues to embed councillor development.
Our Place Shaping work
(4) Economic growth
During 2018/19 we continued to work towards the goals set out in our business strategy with the aim of becoming the most business friendly council in the UK. Through the Invest for Growth initiative, grant funding from the Enterprise M3 Local Enterprise Partnership was used to develop 20,000 sq. ft. new business premises with rental income to be re-invested in local economic development initiatives. Construction began in April 2017 with completion in May 2019. The site, previously the Army Ordnance Supply Unit (OSU), on Midhurst Road, in Liphook, contains two office buildings and a terrace of three light industrial units. The facility has attracted significant interest from businesses with two hi-tech, high-growth companies being the first to move in during the year. Our apprenticeship scheme (Get East Hants working) continues to grow. Since its launch is 2013, 60 apprenticeships have been created at 33 businesses within the district. The council scheme boosts apprenticeship wages and contributes towards training and transport costs, making it a positive experience for employer and employee. In addition, during the year more than 200 youngsters and parents were brought together with local employers to explore apprenticeship opportunities at an event arranged by East Hampshire District Council and Horndean Technology College. Businesses continue to be supported across the district and during the year we established our new Business Buddies programme. The scheme partners local firms which want to make a difference in their own community with organisations providing vital services in the area including EHDC staff who can take two days volunteer leave each year.
(5) Regeneration
Our involvement in the long-term regeneration programme in Whitehill & Bordon continued throughout 2018/19, transforming public sector land into thriving communities with new homes, jobs and facilities. During the
8
year work was completed on the relief road, with Skanska commissioned by Hampshire County Council to build the final stage of the relief road (following the collapse of Carillion). During the year a total of 283 new homes were completed across the town with construction continuing on the new secondary school and construction beginning on the new leisure centre. Delivery of the new town centre for Whitehill & Bordon took major strides forward during 2018/19, when the development plans were granted planning consent and the first major occupiers and operators were confirmed. The town centre is expected to open in stages between late Autumn 2020 and Easter 2021. The approved plans include a six-screen cinema, an indoor market and pop-up stalls, an arts and heritage centre, offices, around 20 shops and restaurants, a new food store and 170 residential units. There will also be up to 1,085 car parking spaces, and over 7,000 square meters of public open space areas, including a town park, upper and lower town squares and an arrival square. Work continues to maximise employment and funding opportunities through the Future Skills Centre and Business Enterprise Centre. Office occupancy at BASE was 83% by the end of the year with 26 businesses working in the building. In addition, 45 apprenticeship jobs have been created and 442 jobs created in the town to end of 2018/19. During the year, in recognition of the work to date the Whitehill & Bordon partnership was shortlisted at the Planning Awards.
In total the project will deliver 3,350 new homes, 5,500 new jobs and create nearly 100,000 sqm of new commercial, retail and leisure floor space. The town has also been chosen by NHS England as a Healthy New Town, designing towns in this way will help prevent illness, encourage healthy lifestyle choices and enable residents to remain independent to a much later age than at present. The town will be the blueprint for how other communities across the country can become healthier and more vibrant.
A total of 1,033 new homes were completed across East Hampshire (47 within the South Downs National Park and 986 outside the National Park).
(6) Local Plan
Our Local Plan review continued during 2018/19. Under new Government planning rules all Local Plans must be reviewed every five years, meaning EHDC’s current local plan will be out of date by the middle of 2019. As a result, work commenced to gather evidence on the future needs for homes, community facilities, employment sites and more. The council’s new Local Plan will map out the future development of the area outside of the South Downs National Park. The plan will set out what development can go where
and find sites for the minimum number of homes the Government expects East Hampshire to provide. During the year a consultation on the Local Plan was launched with over 1,000 responses received from the public.
During the consultation residents could have their say on policies covering housing, employment, infrastructure and the environment. The plan will be updated and put out for consultation again before being submitted to the government for final examination during 2019/20.
(7) Environmental sustainability
NARRATIVE STATEMENT
9
The Council’s Energy Strategy promotes a low carbon and economically vibrant future for the district with a focus on increasing the amount of renewable energy generation and reduce energy usage and heat requirement across the district. We have developed a Statement of Intent to access ECO funding and continued to provide COSY loans to support retrofitting of residents’ homes. Within our major regeneration project at Whitehill & Bordon we have advised on sustainability, green measures and energy performance to ensure that development of new homes exceeds building regulations by 10% in terms of energy performance. More than £76,000 has been made available for residents of Whitehill & Bordon to make their homes more energy-efficient.
NARRATIVE STATEMENT
Financial performance and capital summary
2018/19 Revenue Outturn
10
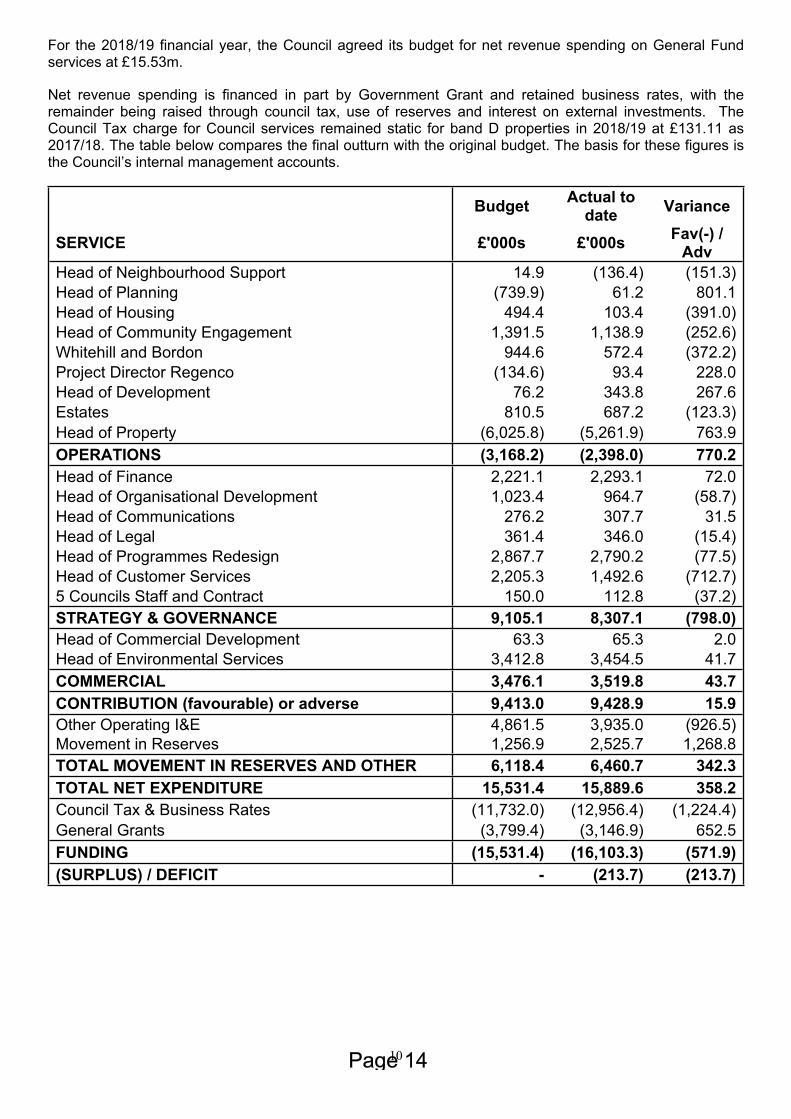
For the 2018/19 financial year, the Council agreed its budget for net revenue spending on General Fund services at £15.53m.
Net revenue spending is financed in part by Government Grant and retained business rates, with the remainder being raised through council tax, use of reserves and interest on external investments. The Council Tax charge for Council services remained static for band D properties in 2018/19 at £131.11 as 2017/18. The table below compares the final outturn with the original budget. The basis for these figures is the Council’s internal management accounts.
Budget Actual to date Variance
SERVICE £'000s £'000s Fav(-) / Adv
Head of Neighbourhood Support 14.9 (136.4) (151.3)Head of Planning (739.9) 61.2 801.1Head of Housing 494.4 103.4 (391.0)Head of Community Engagement 1,391.5 1,138.9 (252.6)Whitehill and Bordon 944.6 572.4 (372.2)Project Director Regenco (134.6) 93.4 228.0Head of Development 76.2 343.8 267.6Estates 810.5 687.2 (123.3)Head of Property (6,025.8) (5,261.9) 763.9OPERATIONS (3,168.2) (2,398.0) 770.2Head of Finance 2,221.1 2,293.1 72.0Head of Organisational Development 1,023.4 964.7 (58.7)Head of Communications 276.2 307.7 31.5Head of Legal 361.4 346.0 (15.4)Head of Programmes Redesign 2,867.7 2,790.2 (77.5)Head of Customer Services 2,205.3 1,492.6 (712.7)5 Councils Staff and Contract 150.0 112.8 (37.2)STRATEGY & GOVERNANCE 9,105.1 8,307.1 (798.0)Head of Commercial Development 63.3 65.3 2.0Head of Environmental Services 3,412.8 3,454.5 41.7COMMERCIAL 3,476.1 3,519.8 43.7CONTRIBUTION (favourable) or adverse 9,413.0 9,428.9 15.9Other Operating I&E 4,861.5 3,935.0 (926.5)Movement in Reserves 1,256.9 2,525.7 1,268.8TOTAL MOVEMENT IN RESERVES AND OTHER 6,118.4 6,460.7 342.3TOTAL NET EXPENDITURE 15,531.4 15,889.6 358.2Council Tax & Business Rates (11,732.0) (12,956.4) (1,224.4)General Grants (3,799.4) (3,146.9) 652.5FUNDING (15,531.4) (16,103.3) (571.9)(SURPLUS) / DEFICIT - (213.7) (213.7)
11
NARRATIVE STATEMENT
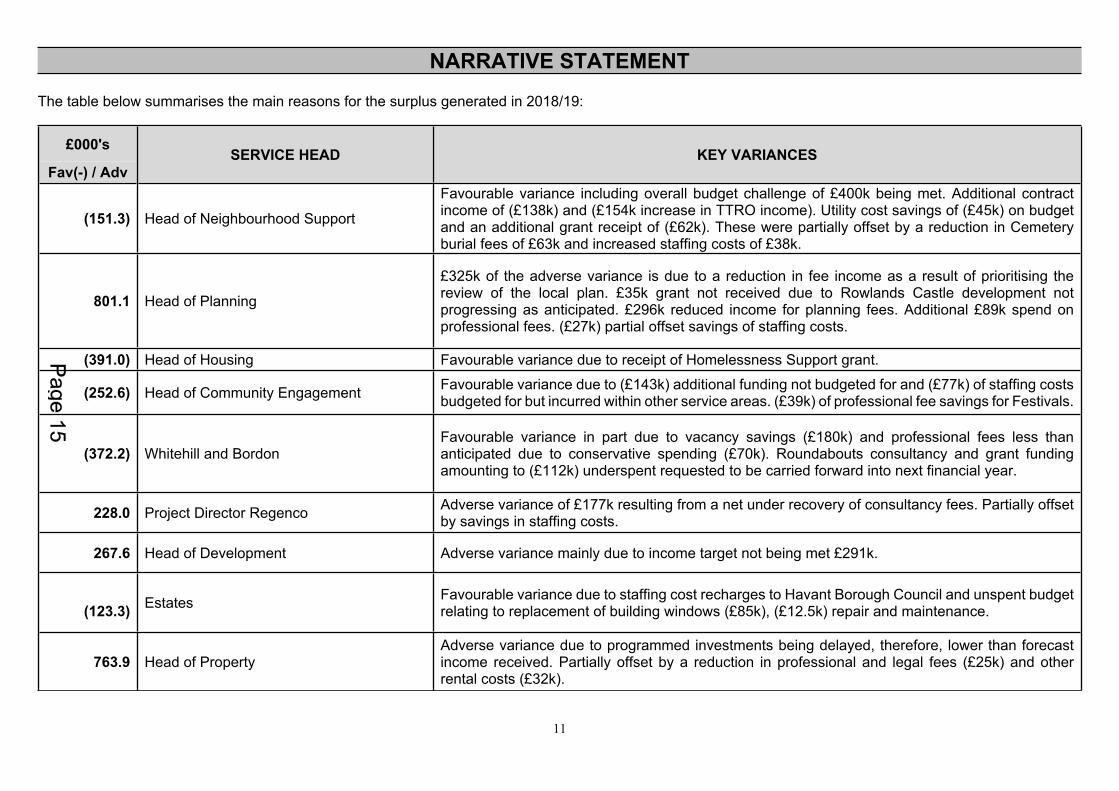
The table below summarises the main reasons for the surplus generated in 2018/19:
£000's
Fav(-) / AdvSERVICE HEAD KEY VARIANCES
(151.3) Head of Neighbourhood Support
Favourable variance including overall budget challenge of £400k being met. Additional contract income of (£138k) and (£154k increase in TTRO income). Utility cost savings of (£45k) on budget and an additional grant receipt of (£62k). These were partially offset by a reduction in Cemetery burial fees of £63k and increased staffing costs of £38k.
801.1 Head of Planning
£325k of the adverse variance is due to a reduction in fee income as a result of prioritising the review of the local plan. £35k grant not received due to Rowlands Castle development not progressing as anticipated. £296k reduced income for planning fees. Additional £89k spend on professional fees. (£27k) partial offset savings of staffing costs.
(391.0) Head of Housing Favourable variance due to receipt of Homelessness Support grant.
(252.6) Head of Community Engagement Favourable variance due to (£143k) additional funding not budgeted for and (£77k) of staffing costs budgeted for but incurred within other service areas. (£39k) of professional fee savings for Festivals.
(372.2) Whitehill and BordonFavourable variance in part due to vacancy savings (£180k) and professional fees less than anticipated due to conservative spending (£70k). Roundabouts consultancy and grant funding amounting to (£112k) underspent requested to be carried forward into next financial year.
228.0 Project Director Regenco Adverse variance of £177k resulting from a net under recovery of consultancy fees. Partially offset by savings in staffing costs.
267.6 Head of Development Adverse variance mainly due to income target not being met £291k.
(123.3) Estates Favourable variance due to staffing cost recharges to Havant Borough Council and unspent budget relating to replacement of building windows (£85k), (£12.5k) repair and maintenance.
763.9 Head of PropertyAdverse variance due to programmed investments being delayed, therefore, lower than forecast income received. Partially offset by a reduction in professional and legal fees (£25k) and other rental costs (£32k).
12
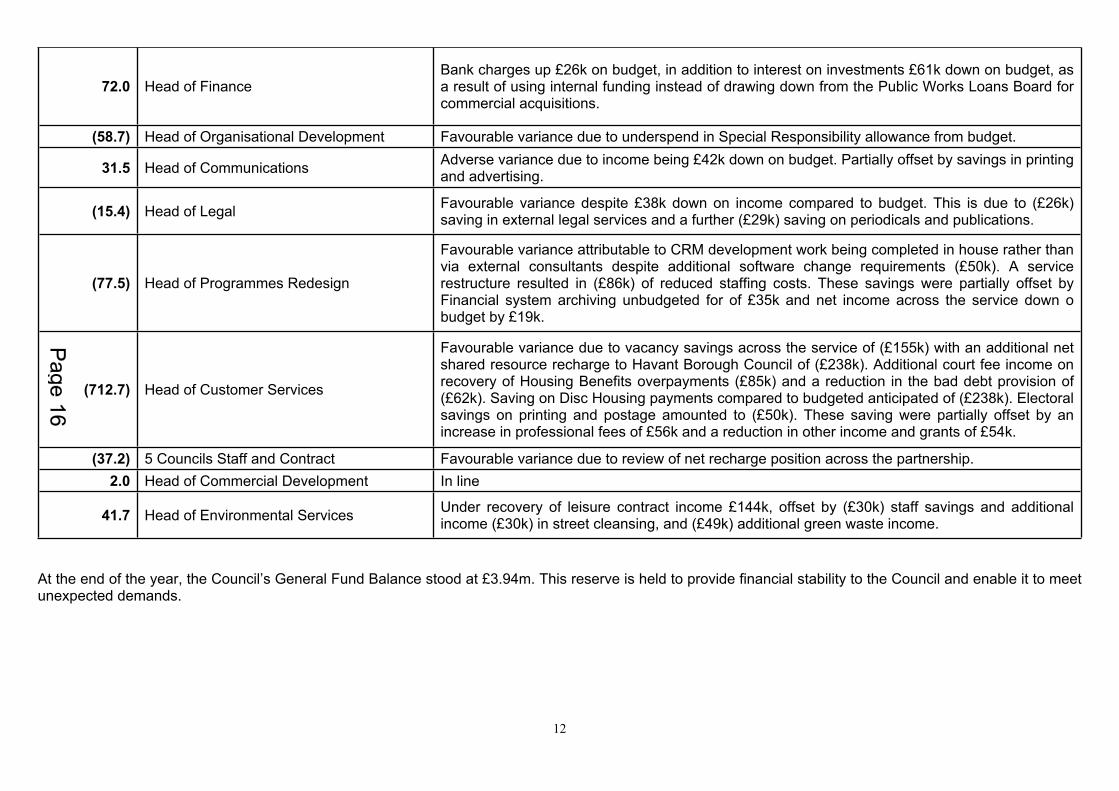
72.0 Head of FinanceBank charges up £26k on budget, in addition to interest on investments £61k down on budget, as a result of using internal funding instead of drawing down from the Public Works Loans Board for commercial acquisitions.
(58.7) Head of Organisational Development Favourable variance due to underspend in Special Responsibility allowance from budget.
31.5 Head of Communications Adverse variance due to income being £42k down on budget. Partially offset by savings in printing and advertising.
(15.4) Head of Legal Favourable variance despite £38k down on income compared to budget. This is due to (£26k) saving in external legal services and a further (£29k) saving on periodicals and publications.
(77.5) Head of Programmes Redesign
Favourable variance attributable to CRM development work being completed in house rather than via external consultants despite additional software change requirements (£50k). A service restructure resulted in (£86k) of reduced staffing costs. These savings were partially offset by Financial system archiving unbudgeted for of £35k and net income across the service down o budget by £19k.
(712.7) Head of Customer Services
Favourable variance due to vacancy savings across the service of (£155k) with an additional net shared resource recharge to Havant Borough Council of (£238k). Additional court fee income on recovery of Housing Benefits overpayments (£85k) and a reduction in the bad debt provision of (£62k). Saving on Disc Housing payments compared to budgeted anticipated of (£238k). Electoral savings on printing and postage amounted to (£50k). These saving were partially offset by an increase in professional fees of £56k and a reduction in other income and grants of £54k.
(37.2) 5 Councils Staff and Contract Favourable variance due to review of net recharge position across the partnership.2.0 Head of Commercial Development In line
41.7 Head of Environmental Services Under recovery of leisure contract income £144k, offset by (£30k) staff savings and additional income (£30k) in street cleansing, and (£49k) additional green waste income.
At the end of the year, the Council’s General Fund Balance stood at £3.94m. This reserve is held to provide financial stability to the Council and enable it to meet unexpected demands.
13
NARRATIVE STATEMENT
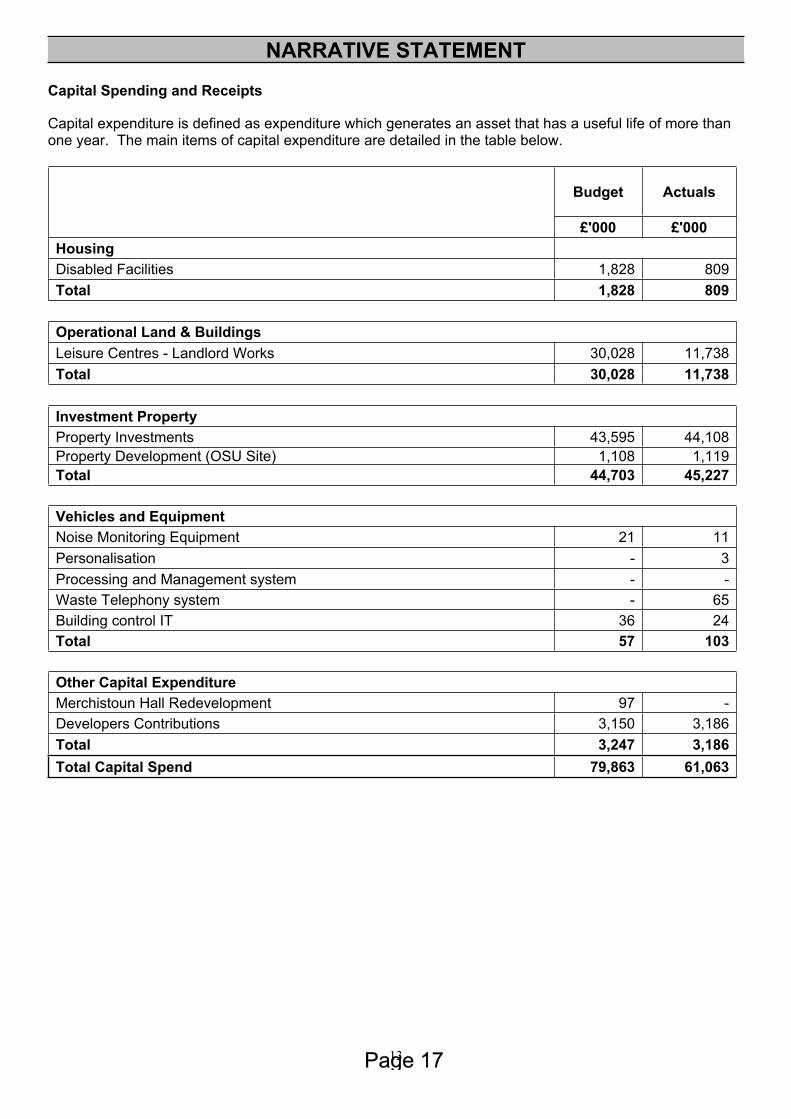
Capital Spending and Receipts
Capital expenditure is defined as expenditure which generates an asset that has a useful life of more than one year. The main items of capital expenditure are detailed in the table below.
Budget Actuals
£'000 £'000Housing Disabled Facilities 1,828 809Total 1,828 809 Operational Land & BuildingsLeisure Centres - Landlord Works 30,028 11,738Total 30,028 11,738 Investment PropertyProperty Investments 43,595 44,108Property Development (OSU Site) 1,108 1,119Total 44,703 45,227 Vehicles and EquipmentNoise Monitoring Equipment 21 11Personalisation - 3Processing and Management system - -Waste Telephony system - 65Building control IT 36 24Total 57 103 Other Capital ExpenditureMerchistoun Hall Redevelopment 97 - Developers Contributions 3,150 3,186Total 3,247 3,186Total Capital Spend 79,863 61,063
14
NARRATIVE STATEMENT
The Capital programme for 2018/19 was funded as follows:
Financed by Budget£’000
Actuals£’000
Increase in Capital Financing Requirement due to Investment Properties 73,623 56,965Capital Receipts 1,262 103Release of Developers Contributions 4,978 3,995Total Capital Funding 79,863 61,063
Whitehill and Bordon Regeneration
The Council has been awarded significant funding towards the regeneration of Whitehill and Bordon, following the withdrawal of the Army from the town in 2015. The table below outlines the funding and expenditure since the original project plan was agreed by Council on 24th February 2010.
Capital Revenue Total £000 £000 £000Initial Grant award (8,186) (3,709) (11,895)Department of Environment and Climate Change Funding (311) - (311)Homes and Communities Agency (960) (60) (1,020)Louisburg Barracks Capacity Funding - (661) (661)Linking Environment and Farming Fund - (33) (33)Local Authority Business Growth Incentive Fund - (14) (14)Green Deal Funding - (12) (12)EHDC Funding 2010-2015/16 - (3,241) (3,241)EHDC 2016/17 - (667) (667)Green Deal Funding Grant (2,945) - (2,945)Large scale sites resource grant (562) - (562)Quebec Developer Contribution (725) - (725)DECC HEAT Networks Grant (137) - (137)NHS England - (450) (450)Total Funding (13,826) (8,847) (22,673)Capital Expenditure 2009-2015 8,561 - 8,561Capital Expenditure 2015/16 2,121 - 2,121Capital Expenditure 2016/17 1,075 - 1,075Capital Expenditure 2017/18Capital Expenditure 2018/19
27626 - 276
26Revenue Expenditure 2009-2015 - 5,609 5,609Revenue Expenditure 2015/16 - 1,662 1,662Revenue Expenditure 2016/17 - 767 767Revenue Expenditure 2017/18Revenue Expenditure 2018/19 - 103
356103356
Remaining Funding (1,767) (350) (2,117)
15
NARRATIVE STATEMENT
Business Rates Retention Scheme
The principle behind the scheme is that local authorities retain a share of Business Rates collected from their local businesses. Authorities retain a share of growth in the business base, giving councils incentive to invest in local infrastructure.
The government announced the continuation of a number of Business Rate reliefs throughout 2018/19. The impact of these reliefs was to reduce collectible business rates, and this has been offset by cash grants paid to the Council.
The surplus or deficit on business rates will be redistributed between the Government, East Hampshire District Council, Hampshire County Council, and Hampshire Fire and Rescue during 2018/19. The budget calculations for 2018/19 take into account this redistribution.
The table below demonstrates how the Council estimated its collectable business rates, how this is split between the participating authorities, the split of the 2018/19 deficit, and the impact on the General Fund in 2018/19, compared to actual performance in the year.
Budget Outturn £'000 £’000
Business Rates Yield Base Yield 32,869 31,264Provision for backdated appeals - (1,117)Cost of Collection (155) (155)Adjustment for provision for bad debt - (282)Transitional protection payment 968 957Business Rates Yield 33,682 30,667DistributionCentral Government (50%) 16,841 17,467Hampshire County Council (9%) 3,031 3,144Hampshire Fire (1%) 337 349East Hampshire District Council baseline (40%) 13,473 13,973Total Distribution 33,682 34,933Collection Fund (Surplus)/Deficit B/Fwd 110 4,250Reallocation of prior year balance – EHDC (44) (828)Reallocation of prior year balance – Other (66) (1,243)Collection Fund (Surplus)/Deficit in year - (1,798)Collection Fund (Surplus)/Deficit C/fwd - 381
Allocation of (Surplus)/Deficit Government Share (50%) - 191EHDC Share (40%) - 152Hampshire CC Share (9%) - 34Hampshire Fire (1%) - 4Total - 381East Hampshire District Council Retained Business Rates Budget Actual £’000 £’000Non-Domestic Rating income 13,473 12,190S31 Grant Income 1,623 1,368Tariff paid to Central Government (10,275) (10,195)Levy/ safety net paid to/by Central Government (1,525) (692)Payment of prior year’s estimated surplus / (deficit) (44) (828)Total 2018/19 business rates income 3,252 1,843
16
NARRATIVE STATEMENT
Medium Term Financial Strategy
The Council agreed its Medium Term Financial Strategy as part of its budget setting process for 2019/20. The summary projections demonstrate the Council’s ambitions for maintaining council tax at current levels and generating income.
2019/20 2020/21 2021/22 2022/23 2023/24 £M £M £M £M £MDirector of Regeneration & Place Head of Planning 1.074 1.176 1.283 1.395 1.513 Head of Environmental Services 4.620 4.647 4.688 4.719 4.764 Head of Regenco (0.297) (0.324) (0.309) (0.329) (0.312) Director of Operations & Neighbourhoods Head of Commercial Development 0.011 0.024 0.038 0.053 0.068 Head of Community Engagement 1.062 1.086 1.111 1.138 1.166 Head of Development (0.015) 0.015 0.051 0.085 0.125 Head of Housing 0.453 0.476 0.501 0.527 0.554 Head of Neighbourhood Support (0.216) (0.163) (0.029) 0.034 0.181 Whitehill & Bordon 0.392 0.407 0.422 0.438 0.455 Director of Corporate Services 5 Councils Staff and Contract 0.150 0.030 0.030 0.030 0.030 Head of Communications 0.338 0.355 0.371 0.388 0.406 Head of Customer Services 2.458 2.646 2.771 2.899 3.037 Head of Finance 0.706 0.741 0.753 0.766 0.780 Head of Legal 0.261 0.274 0.284 0.294 0.305 Head of Organisational Development 0.989 1.038 1.053 1.069 1.086 Head of Programmes Redesign 2.795 2.927 2.971 3.009 3.057 Head of Property 0.910 0.925 0.941 0.958 0.975 Investment Income (10.080) (15.612) (19.362) (19.362) (19.362) Capital Financing Costs - MRP & Interest 4.961 8.908 11.158 11.158 11.158Contribution (Surplus) / Deficit 10.572 9.576 8.726 9.269 9.986 Corporate Pension Costs 0.887 0.887 0.887 0.887 0.887 Movement in Reserves (0.361) (0.684) (0.684) (0.684) (0.684)TOTAL NET EXPENDITURE 11.098 9.779 8.929 9.472 10.189 Council Tax (6.612) (6.682) (6.749) (6.817) (6.885) Business Rates Income (1.872) (2.187) (2.138) (2.091) (2.048) New Homes Bonus (2.614) (1.918) (1.530) (0.920) 0.000TOTAL FUNDING (11.098) (10.787) (10.417) (9.828) (8.933) BUDGET (SURPLUS)/DEFICIT - (1.008) (1.488) (0.356) 1.256
17
NARRATIVE STATEMENT
Explanation of Core Statements
The Statement of Accounts for 2018/19 has been prepared in accordance with the Code of Practice on Local Authority Accounting in the United Kingdom. The purpose of the published Statement of Accounts is to give electors, local taxpayers, Councillors and other interested parties clear information about the Council’s finances. The statements inform readers of the cost of services provided by the Council in the year 2018/19, how services were paid for and the Council’s assets and liabilities at the year-end date of 31 March 2019.
The following key statements are included:
The Movements in Reserves Statement
The Movements in Reserves Statement reconciles the balance on the Comprehensive Income and Expenditure Statement to the movement on the Council’s reserves, both usable and unusable.
The Expenditure & Funding Analysis
The Expenditure & Funding Analysis is designed to show how annual expenditure is used and funded from resources, including Government Grants, Council Tax and Business Rates, by local authorities, in comparison with those resources consumed or earned by authorities in accordance with generally accepted accounting practises. It also shows how this expenditure is allocated for decision making purposes between the Council’s Directorates and Service Heads. Income and expenditure, accounted for under generally accepted accounting practises is presented more fully in the Comprehensive Income and Expenditure Statement.
The Comprehensive Income & Expenditure Statement
This statement shows the accounting cost in the year of providing services in accordance with generally accepted accounting practices, rather than the amount to be funded from taxation. Authorities raise taxation to cover expenditure in accordance with regulations; this may be different from the accounting cost. The taxation position is shown in the Movement in Reserves Statement.
The Balance Sheet
The Balance Sheet shows the value as at the Balance Sheet date of the assets and liabilities of the Council.
The Cash Flow Statement
The Cash Flow Statement reconciles the movement in cash and cash equivalents to the surplus or deficit on the Provision of Services within the Comprehensive Income & Expenditure Statement.
Notes to the Core Financial Statements (including pensions disclosures)
The Collection Fund
This account records all transactions relating to Council Tax and Business Rates. The Council draws its share of Council Tax and Business Rates from the Fund. More information on Council Tax and Retained Business Rates can be found in the Review of the Year.
18
STATEMENT OF RESPONSIBILITIES FOR THE STATEMENT OF ACCOUNTS
The Council's Responsibilities:
The Council is required to:
make arrangements for the proper administration of its financial affairs and to secure that one of its officers has the responsibility for the administration of those affairs. In this authority, that officer is the chief finance officer.
manage its affairs to secure economic, efficient and effective use of resources and safeguard its assets, and
approve the Statement of Accounts
Responsibilities of the Section 151 Officer:
The chief financial officer is responsible for the preparation of the authority’s Statement of Accounts in accordance with proper practices as set out in the CIPFA/LASAAC Code of Practice on Local Authority Accounting in the United Kingdom (the Code).
In preparing this Statement of Accounts, the chief financial officer has: selected suitable accounting policies and then applied them consistently, made judgements and estimates that were reasonable and prudent, complied with the local authority Code.
The Section 151 Officer also:
has kept proper accounting records which were up to date.
has taken reasonable steps for the prevention and detection of fraud and other irregularities.
I certify that the Statement of Accounts give a true and fair view the financial position of the Authority and its income and expenditure for the year ended 31 March 2019.
Signed:
Lydia MorrisonSection 151 Officer
Date: 29 July 2019
19
STATEMENT OF RESPONSIBILITIES FOR THE STATEMENT OF ACCOUNTS
Certification of the Audited Statement of Accounts:
I confirm that the Statement of Accounts have been audited and, in accordance with the Accounts and Audit Regulations (amendment) 2015, I certify that the Audited Statement of Accounts give a true and fair view of the financial position of the Authority and its income and expenditure for the year ended 31 March 2019.
Signed:
Lydia MorrisonSection 151 Officer
Date: 29 July 2019
Certificate of approval by the Council:
I confirm that the Audited Statement of Accounts were approved at the Governance, Audit & Scrutiny Committee meeting of East Hants District Council on 29 July 2019.
Signed:
Cllr Jamie MatthewsChairman, Governance, Audit & Scrutiny Committee
Date: 29 July 2019
20
INDEPENDENT AUDITORS’ REPORT TO THE MEMBERS OF EAST HAMPSHIRE DISTRICT COUNCIL
INDEPENDENT AUDITOR’S REPORT TO THE MEMBERS OF EAST HAMPSHIRE DISTRICT COUNCILREPORT ON THE AUDIT OF THE FINANCIAL STATEMENTSOpinionWe have audited the financial statements of East Hampshire District Council (‘the Authority’) for the year ended 31 March 2019 which comprise the Authority Comprehensive Income and Expenditure Statement, the Authority Balance Sheet, the Authority Movement in Reserves Statement, the Authority Cash Flow Statement, the Collection Fund and the related notes, including the accounting policies in note 1.
In our opinion the financial statements:
give a true and fair view of the financial position of the Authority as at 31 March 2019 and of the Authority’s expenditure and income for the year then ended; and
have been properly prepared in accordance with the CIPFA/LASAAC Code of Practice on Local Authority Accounting in the United Kingdom 2018/19.
Basis for opinion We conducted our audit in accordance with International Standards on Auditing (UK) (“ISAs (UK)”) and applicable law. Our responsibilities are described below. We have fulfilled our ethical responsibilities under, and are independent of the Authority in accordance with, UK ethical requirements including the FRC Ethical Standard. We believe that the audit evidence we have obtained is a sufficient and appropriate basis for our opinion. Going concern The Chief Finance Officer has prepared the financial statements under the going concern basis of accounting in accordance with the CIPFA/LASAAC Code of Practice on Local Authority Accounting in the United Kingdom 2018/19 on the basis that the functions of the Authority will continue in operational existence for the foreseeable future. The Chief Finance Officer has also concluded that there are no material uncertainties that could cast significant doubt over the ability of the Authority to continue as a going concern for at least a year from the date of approval of the financial statements (“the going concern period”).We are required to report to you if we have concluded that the use of the going concern basis of accounting is inappropriate or there is an undisclosed material uncertainty that may cast significant doubt over the use of that basis for a period of at least a year from the date of approval of the financial statements. In our evaluation of the Chief Finance Officer’s conclusions we considered the inherent risks to the Authority’s operations, including the impact of Brexit, and analysed how these risks might affect the Authority’s financial resources, or ability to continue its operations over the going concern period. We have nothing to report in these respects.However, as we cannot predict all future events or conditions and as subsequent events may result in outcomes that are inconsistent with judgements that were reasonable at the time they were made, the absence of reference to a material uncertainty in this auditor's report is not a guarantee that the Authority will continue in operation.
Other information published with the financial statements The Chief Finance Officer is responsible for the other information published with the financial statements, including the Narrative Statement and the Annual Governance Statement. Our opinion on the financial statements does not cover the other information and, accordingly, we do not express an audit opinion or, except as explicitly stated below, any form of assurance conclusion thereon. Our responsibility is to read the other information and, in doing so, consider whether, based on our financial statements audit work, the information therein is materially misstated or inconsistent with the financial statements or our audit knowledge. Based solely on that work we have not identified material misstatements in the other information. In our opinion the other information published with the financial statements for the financial year is consistent with the financial statements. Chief Financial Officer’s responsibilitiesAs explained more fully in the statement set out on page [A], the Chief Financial Officer is responsible for: the preparation of the Authority’s financial statements in accordance with proper practices as set out in the CIPFA/LASAAC Code of Practice on Local Authority Accounting in the United Kingdom 2018/19. They are
21
also responsible for such internal control as they determine is necessary to enable the preparation of financial statements that are free from material misstatement, whether due to fraud or error; assessing the Authority’s ability to continue as a going concern, disclosing, as applicable, matters related to going concern; and using the going concern basis of accounting on the assumption that the functions of the Authority will continue in operational existence for the foreseeable future. Auditor’s responsibilities Our objectives are to obtain reasonable assurance about whether the financial statements as a whole are free from material misstatement, whether due to fraud or error, and to issue our opinion in an auditor’s report. Reasonable assurance is a high level of assurance, but does not guarantee that an audit conducted in accordance with ISAs (UK) will always detect a material misstatement when it exists. Misstatements can arise from fraud or error and are considered material if, individually or in aggregate, they could reasonably be expected to influence the economic decisions of users taken on the basis of the financial statements. A fuller description of our responsibilities is provided on the FRC’s website at www.frc.org.uk/auditorsresponsibilities
REPORT ON OTHER LEGAL AND REGULATORY MATTERSReport on the Authority’s arrangements for securing economy, efficiency and effectiveness in its use of resources Conclusion
On the basis of our work, having regard to the guidance issued by the Comptroller and Auditor General in November 2017, we are satisfied that, in all significant respects, East Hampshire District Council put in place proper arrangements to secure economy, efficiency and effectiveness in its use of resources for the year ended 31 March 2019.Respective responsibilities in respect of our review of arrangements for securing economy, efficiency and effectiveness in the use of resources The Authority is responsible for putting in place proper arrangements to secure economy, efficiency and effectiveness in its use of resources, to ensure proper stewardship and governance, and to review regularly the adequacy and effectiveness of these arrangements.
We are required under Section 20(1) (c) of the Local Audit and Accountability Act 2014 to satisfy ourselves that the Authority has made proper arrangements for securing economy, efficiency and effectiveness in its use of resources. We report if significant matters have come to our attention which prevent us from concluding that the Authority has put in place proper arrangements for securing economy, efficiency and effectiveness in its use of resources. We are not required to consider, nor have we considered, whether all aspects of the Authority’s arrangements for securing economy, efficiency and effectiveness in its use of resources are operating effectively.
We have undertaken our review in accordance with the Code of Audit Practice, having regard to the guidance on the specified criterion issued by the Comptroller and Auditor General in November 2017, as to whether East Hampshire District Council had proper arrangements to ensure it took properly informed decisions and deployed resources to achieve planned and sustainable outcomes for taxpayers and local people. The Comptroller and Auditor General determined this criterion as that necessary for us to consider under the Code of Audit Practice in satisfying ourselves whether East Hampshire District Council put in place proper arrangements for securing economy, efficiency and effectiveness in its use of resources for the year ended 31 March 2019.
Statutory reporting matters The Code of Audit Practice requires us to report to you if:
any matters have been reported in the public interest under Section 24 of the Local Audit and Accountability Act 2014 in the course of, or at the conclusion of, the audit;
any recommendations have been made under Section 24 of the Local Audit and Accountability Act 2014;
an application has been made to the court for a declaration that an item of account is contrary to law under Section 28 of the Local Audit and Accountability Act 2014;
an advisory notice has been issued under Section 29 of the Local Audit and Accountability Act 2014; an application for judicial review has been made under Section 31 of the Local Audit and Accountability
Act 2014.
22
We have nothing to report in these respects
THE PURPOSE OF OUR AUDIT WORK AND TO WHOM WE OWE OUR RESPONSIBILITIES This report is made solely to the members of the Authority, as a body, in accordance with Part 5 of the Local Audit and Accountability Act 2014. Our audit work has been undertaken so that we might state to the members of the Authority, as a body, those matters we are required to state to them in an auditor’s report and for no other purpose. To the fullest extent permitted by law, we do not accept or assume responsibility to anyone other than the members of the Authority, as a body, for our audit work, for this report, or for the opinions we have formed.
CERTIFICATE OF COMPLETION OF THE AUDITWe certify that we have completed the audit of the financial statements of East Hampshire District Council in accordance with the requirements of the Local Audit and Accountability Act 2014 and the Code of Audit Practice.
Rees Batleyfor and on behalf of KPMG LLPChartered Accountants66 Queen SquareBristolBS1 4BE
29 July 2019
23
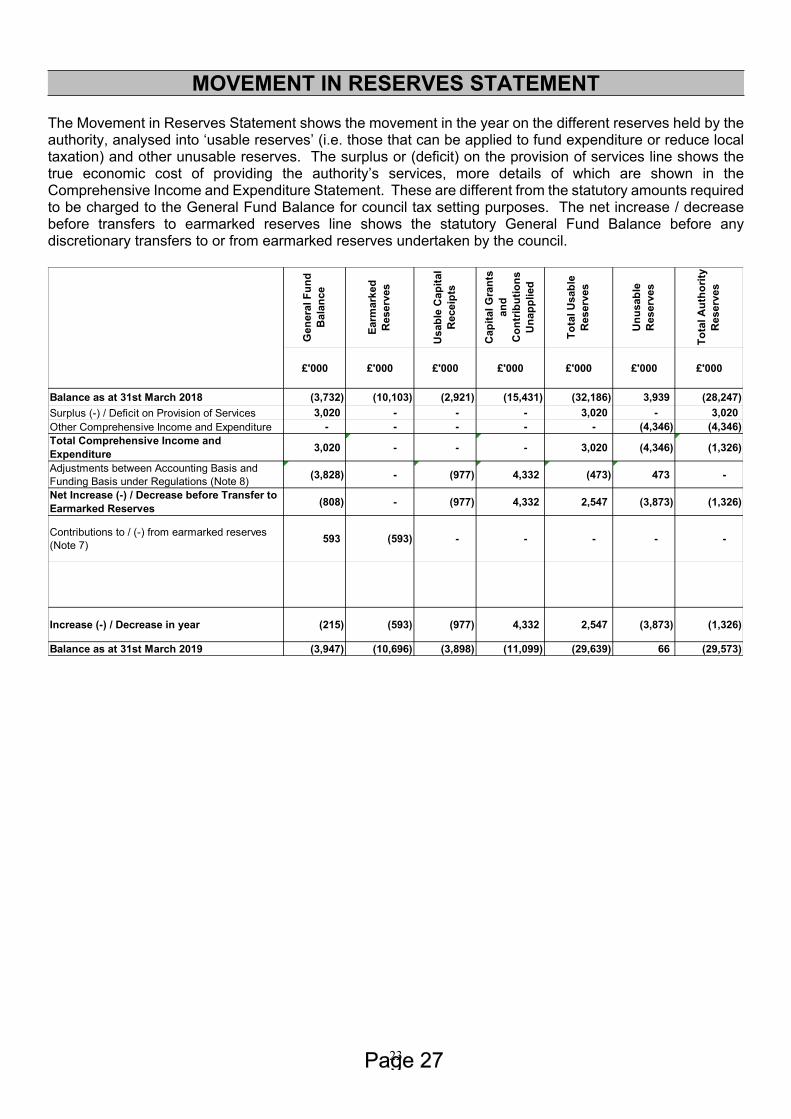
MOVEMENT IN RESERVES STATEMENT
The Movement in Reserves Statement shows the movement in the year on the different reserves held by the authority, analysed into ‘usable reserves’ (i.e. those that can be applied to fund expenditure or reduce local taxation) and other unusable reserves. The surplus or (deficit) on the provision of services line shows the true economic cost of providing the authority’s services, more details of which are shown in the Comprehensive Income and Expenditure Statement. These are different from the statutory amounts required to be charged to the General Fund Balance for council tax setting purposes. The net increase / decrease before transfers to earmarked reserves line shows the statutory General Fund Balance before any discretionary transfers to or from earmarked reserves undertaken by the council.
Gen
eral
Fun
d B
alan
ce
Earm
arke
d R
eser
ves
Usa
ble
Cap
ital
Rec
eipt
s
Cap
ital G
rant
s an
d C
ontr
ibut
ions
U
napp
lied
Tota
l Usa
ble
Res
erve
s
Unu
sabl
e R
eser
ves
Tota
l Aut
horit
y R
eser
ves
£'000 £'000 £'000 £'000 £'000 £'000 £'000
Balance as at 31st March 2018 (3,732) (10,103) (2,921) (15,431) (32,186) 3,939 (28,247) Surplus (-) / Deficit on Provision of Services 3,020 - - - 3,020 - 3,020 Other Comprehensive Income and Expenditure - - - - - (4,346) (4,346) Total Comprehensive Income and Expenditure 3,020 - - - 3,020 (4,346) (1,326)
Adjustments between Accounting Basis and Funding Basis under Regulations (Note 8) (3,828) - (977) 4,332 (473) 473 -
Net Increase (-) / Decrease before Transfer to Earmarked Reserves (808) - (977) 4,332 2,547 (3,873) (1,326)
Contributions to / (-) from earmarked reserves (Note 7) 593 (593) - - - - -
Increase (-) / Decrease in year (215) (593) (977) 4,332 2,547 (3,873) (1,326)
Balance as at 31st March 2019 (3,947) (10,696) (3,898) (11,099) (29,639) 66 (29,573)
24
MOVEMENT IN RESERVES STATEMENT
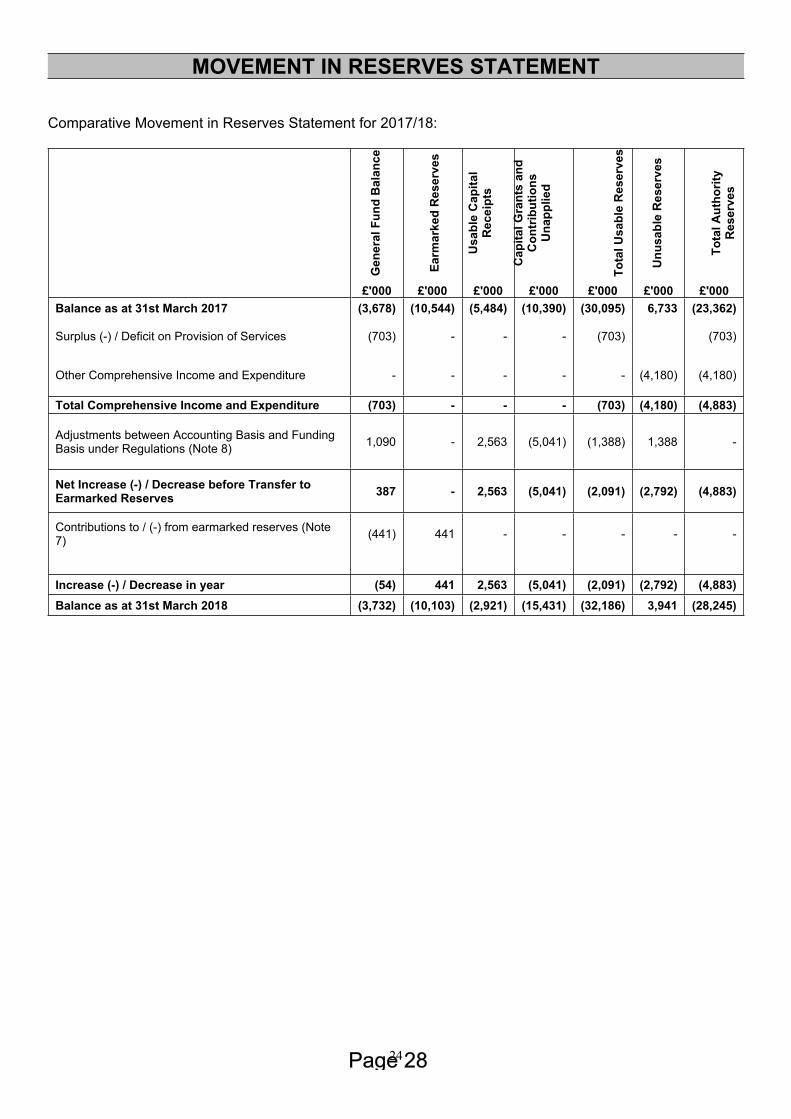
Comparative Movement in Reserves Statement for 2017/18:
Gen
eral
Fun
d B
alan
ce
Earm
arke
d R
eser
ves
Usa
ble
Cap
ital
Rec
eipt
s
Cap
ital G
rant
s an
d C
ontr
ibut
ions
U
napp
lied
Tota
l Usa
ble
Res
erve
s
Unu
sabl
e R
eser
ves
Tota
l Aut
horit
y R
eser
ves
£'000 £'000 £'000 £'000 £'000 £'000 £'000Balance as at 31st March 2017 (3,678) (10,544) (5,484) (10,390) (30,095) 6,733 (23,362)
Surplus (-) / Deficit on Provision of Services (703) - - - (703) (703)
Other Comprehensive Income and Expenditure - - - - - (4,180) (4,180)
Total Comprehensive Income and Expenditure (703) - - - (703) (4,180) (4,883)
Adjustments between Accounting Basis and Funding Basis under Regulations (Note 8) 1,090 - 2,563 (5,041) (1,388) 1,388 -
Net Increase (-) / Decrease before Transfer to Earmarked Reserves 387 - 2,563 (5,041) (2,091) (2,792) (4,883)
Contributions to / (-) from earmarked reserves (Note 7) (441) 441 - - - - -
Increase (-) / Decrease in year (54) 441 2,563 (5,041) (2,091) (2,792) (4,883)Balance as at 31st March 2018 (3,732) (10,103) (2,921) (15,431) (32,186) 3,941 (28,245)
25
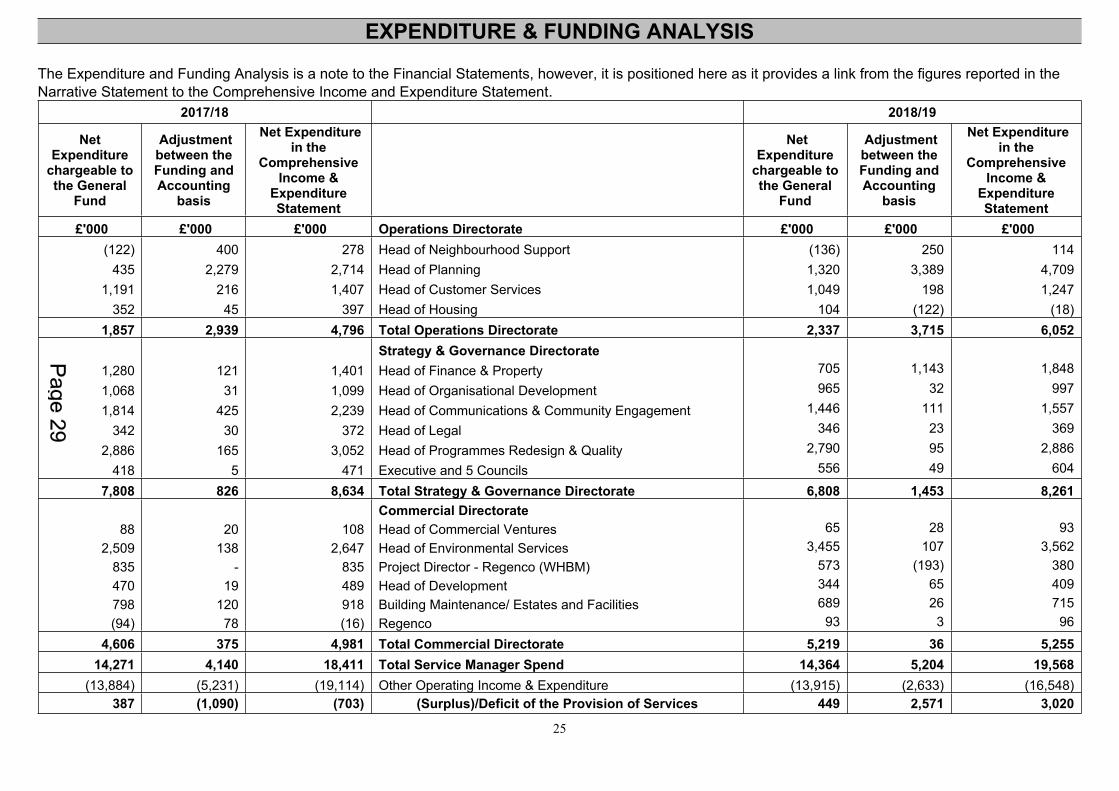
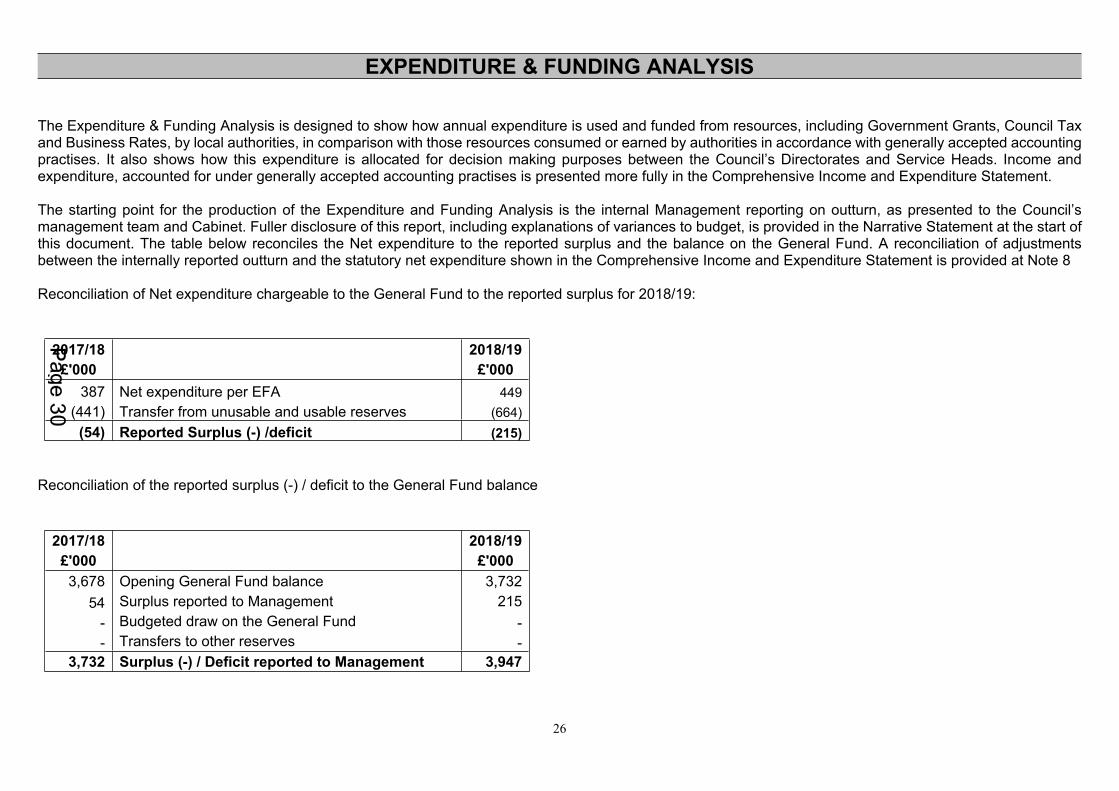
EXPENDITURE & FUNDING ANALYSIS
The Expenditure and Funding Analysis is a note to the Financial Statements, however, it is positioned here as it provides a link from the figures reported in the Narrative Statement to the Comprehensive Income and Expenditure Statement.
2017/18 2018/19
Net Expenditure
chargeable to the General
Fund
Adjustment between the Funding and Accounting
basis
Net Expenditure in the
Comprehensive Income &
Expenditure Statement
Net Expenditure
chargeable to the General
Fund
Adjustment between the Funding and Accounting
basis
Net Expenditure in the
Comprehensive Income &
Expenditure Statement
£'000 £'000 £'000 Operations Directorate £'000 £'000 £'000 (122) 400 278 Head of Neighbourhood Support (136) 250 114
435 2,279 2,714 Head of Planning 1,320 3,389 4,7091,191 216 1,407 Head of Customer Services 1,049 198 1,247
352 45 397 Head of Housing 104 (122) (18)1,857 2,939 4,796 Total Operations Directorate 2,337 3,715 6,052
Strategy & Governance Directorate 1,280 121 1,401 Head of Finance & Property 705 1,143 1,848
1,068 31 1,099 Head of Organisational Development 965 32 997
1,814 425 2,239 Head of Communications & Community Engagement 1,446 111 1,557
342 30 372 Head of Legal 346 23 369
2,886 165 3,052 Head of Programmes Redesign & Quality 2,790 95 2,886
418 5 471 Executive and 5 Councils 556 49 604
7,808 826 8,634 Total Strategy & Governance Directorate 6,808 1,453 8,261 Commercial Directorate
88 20 108 Head of Commercial Ventures 65 28 932,509 138 2,647 Head of Environmental Services 3,455 107 3,562
835 - 835 Project Director - Regenco (WHBM) 573 (193) 380470 19 489 Head of Development 344 65 409798 120 918 Building Maintenance/ Estates and Facilities 689 26 715(94) 78 (16) Regenco 93 3 96
4,606 375 4,981 Total Commercial Directorate 5,219 36 5,25514,271 4,140 18,411 Total Service Manager Spend 14,364 5,204 19,568
(13,884) (5,231) (19,114) Other Operating Income & Expenditure (13,915) (2,633) (16,548)387 (1,090) (703) (Surplus)/Deficit of the Provision of Services 449 2,571 3,020
26
EXPENDITURE & FUNDING ANALYSIS
The Expenditure & Funding Analysis is designed to show how annual expenditure is used and funded from resources, including Government Grants, Council Tax and Business Rates, by local authorities, in comparison with those resources consumed or earned by authorities in accordance with generally accepted accounting practises. It also shows how this expenditure is allocated for decision making purposes between the Council’s Directorates and Service Heads. Income and expenditure, accounted for under generally accepted accounting practises is presented more fully in the Comprehensive Income and Expenditure Statement.
The starting point for the production of the Expenditure and Funding Analysis is the internal Management reporting on outturn, as presented to the Council’s management team and Cabinet. Fuller disclosure of this report, including explanations of variances to budget, is provided in the Narrative Statement at the start of this document. The table below reconciles the Net expenditure to the reported surplus and the balance on the General Fund. A reconciliation of adjustments between the internally reported outturn and the statutory net expenditure shown in the Comprehensive Income and Expenditure Statement is provided at Note 8
Reconciliation of Net expenditure chargeable to the General Fund to the reported surplus for 2018/19:
2017/18 2018/19£'000 £'000
387 Net expenditure per EFA 449(441) Transfer from unusable and usable reserves (664)
(54) Reported Surplus (-) /deficit (215)
Reconciliation of the reported surplus (-) / deficit to the General Fund balance
2017/18 2018/19£'000 £'0003,678 Opening General Fund balance 3,732
54 Surplus reported to Management 215- Budgeted draw on the General Fund - - Transfers to other reserves -
3,732 Surplus (-) / Deficit reported to Management 3,947
27
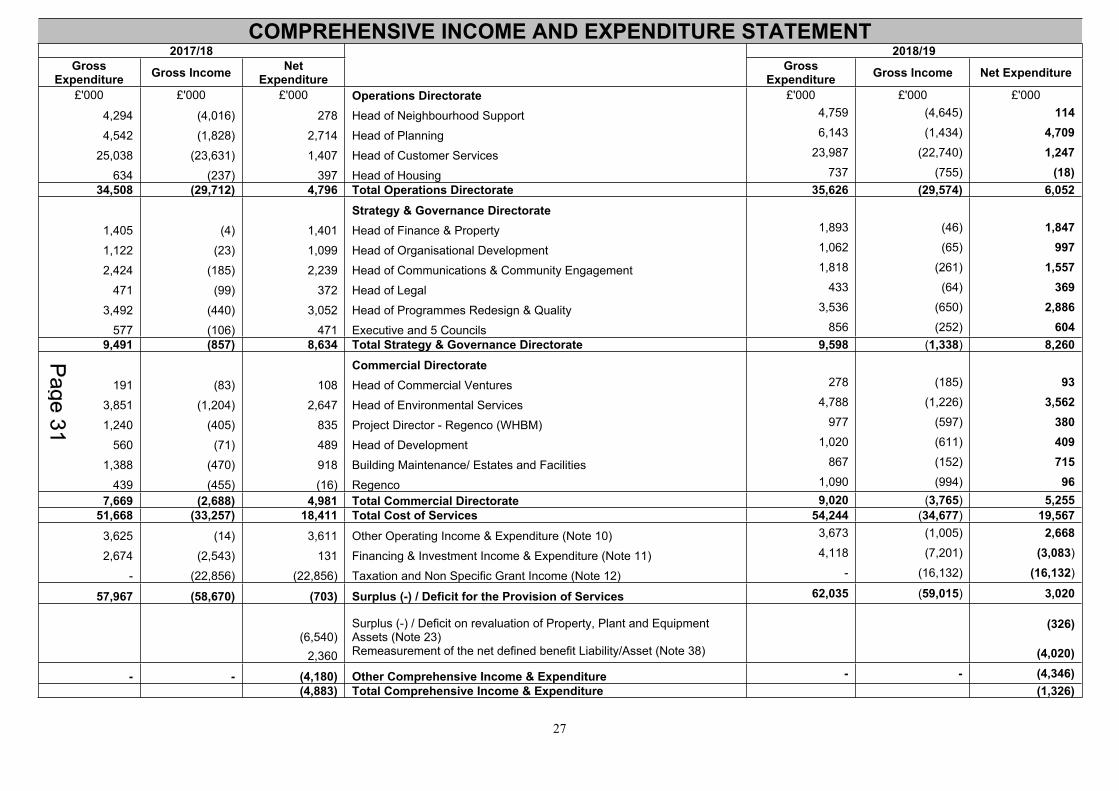
COMPREHENSIVE INCOME AND EXPENDITURE STATEMENT2017/18 2018/19
Gross Expenditure Gross Income Net
Expenditure Gross Expenditure Gross Income Net Expenditure
£'000 £'000 £'000 Operations Directorate £'000 £'000 £'000
4,294 (4,016) 278 Head of Neighbourhood Support 4,759 (4,645) 114
4,542 (1,828) 2,714 Head of Planning 6,143 (1,434) 4,709
25,038 (23,631) 1,407 Head of Customer Services 23,987 (22,740) 1,247
634 (237) 397 Head of Housing 737 (755) (18)34,508 (29,712) 4,796 Total Operations Directorate 35,626 (29,574) 6,052
Strategy & Governance Directorate
1,405 (4) 1,401 Head of Finance & Property 1,893 (46) 1,847
1,122 (23) 1,099 Head of Organisational Development 1,062 (65) 997
2,424 (185) 2,239 Head of Communications & Community Engagement 1,818 (261) 1,557
471 (99) 372 Head of Legal 433 (64) 369
3,492 (440) 3,052 Head of Programmes Redesign & Quality 3,536 (650) 2,886
577 (106) 471 Executive and 5 Councils 856 (252) 6049,491 (857) 8,634 Total Strategy & Governance Directorate 9,598 (1,338) 8,260
Commercial Directorate
191 (83) 108 Head of Commercial Ventures 278 (185) 93
3,851 (1,204) 2,647 Head of Environmental Services 4,788 (1,226) 3,562
1,240 (405) 835 Project Director - Regenco (WHBM) 977 (597) 380
560 (71) 489 Head of Development 1,020 (611) 409
1,388 (470) 918 Building Maintenance/ Estates and Facilities 867 (152) 715
439 (455) (16) Regenco 1,090 (994) 967,669 (2,688) 4,981 Total Commercial Directorate 9,020 (3,765) 5,255
51,668 (33,257) 18,411 Total Cost of Services 54,244 (34,677) 19,5673,625 (14) 3,611 Other Operating Income & Expenditure (Note 10) 3,673 (1,005) 2,668
2,674 (2,543) 131 Financing & Investment Income & Expenditure (Note 11) 4,118 (7,201) (3,083)
- (22,856) (22,856) Taxation and Non Specific Grant Income (Note 12) - (16,132) (16,132)
57,967 (58,670) (703) Surplus (-) / Deficit for the Provision of Services 62,035 (59,015) 3,020
(6,540)Surplus (-) / Deficit on revaluation of Property, Plant and Equipment Assets (Note 23)
(326)
2,360 Remeasurement of the net defined benefit Liability/Asset (Note 38) (4,020)
- - (4,180) Other Comprehensive Income & Expenditure - - (4,346) (4,883) Total Comprehensive Income & Expenditure (1,326)
28
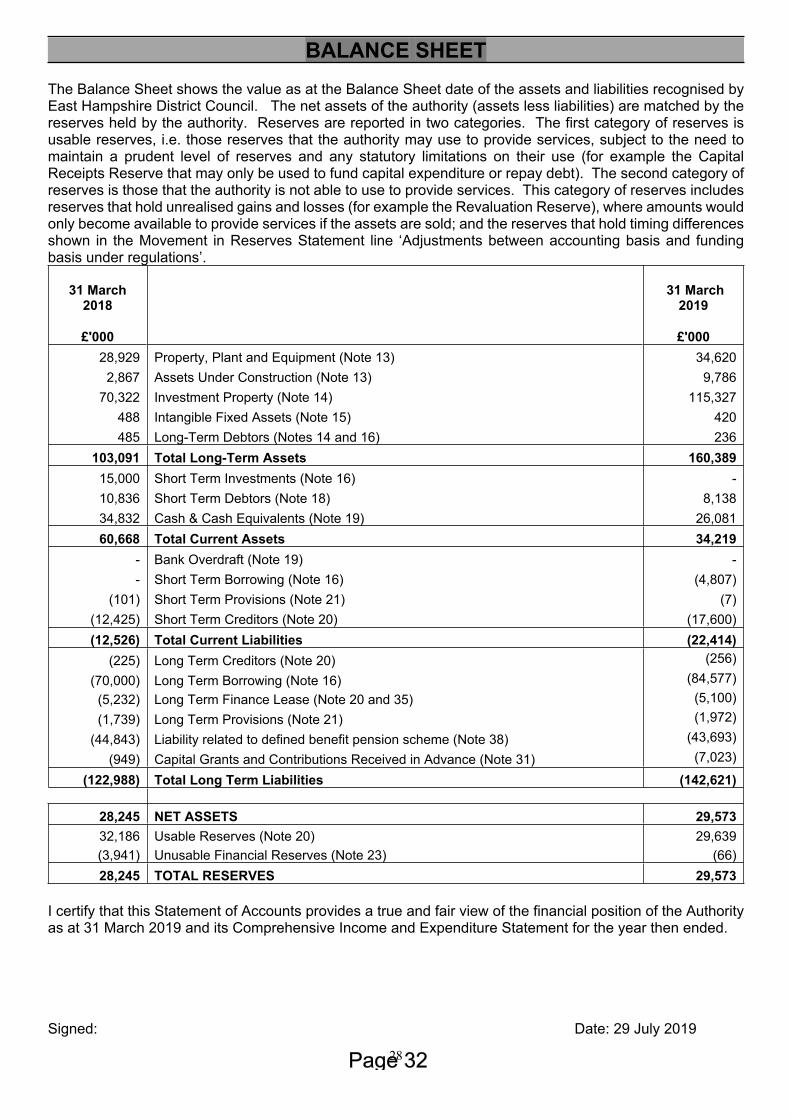
BALANCE SHEETThe Balance Sheet shows the value as at the Balance Sheet date of the assets and liabilities recognised by East Hampshire District Council. The net assets of the authority (assets less liabilities) are matched by the reserves held by the authority. Reserves are reported in two categories. The first category of reserves is usable reserves, i.e. those reserves that the authority may use to provide services, subject to the need to maintain a prudent level of reserves and any statutory limitations on their use (for example the Capital Receipts Reserve that may only be used to fund capital expenditure or repay debt). The second category of reserves is those that the authority is not able to use to provide services. This category of reserves includes reserves that hold unrealised gains and losses (for example the Revaluation Reserve), where amounts would only become available to provide services if the assets are sold; and the reserves that hold timing differences shown in the Movement in Reserves Statement line ‘Adjustments between accounting basis and funding basis under regulations’.
31 March 2018
31 March 2019
£'000
£'00028,929 Property, Plant and Equipment (Note 13) 34,620
2,867 Assets Under Construction (Note 13) 9,78670,322 Investment Property (Note 14) 115,327
488 Intangible Fixed Assets (Note 15) 420485 Long-Term Debtors (Notes 14 and 16) 236
103,091 Total Long-Term Assets 160,38915,000 Short Term Investments (Note 16) - 10,836 Short Term Debtors (Note 18) 8,13834,832 Cash & Cash Equivalents (Note 19) 26,08160,668 Total Current Assets 34,219
- Bank Overdraft (Note 19) - - Short Term Borrowing (Note 16) (4,807)
(101) Short Term Provisions (Note 21) (7)(12,425) Short Term Creditors (Note 20) (17,600)(12,526) Total Current Liabilities (22,414)
(225) Long Term Creditors (Note 20) (256)
(70,000) Long Term Borrowing (Note 16) (84,577)(5,232) Long Term Finance Lease (Note 20 and 35) (5,100)(1,739) Long Term Provisions (Note 21) (1,972)
(44,843) Liability related to defined benefit pension scheme (Note 38) (43,693)
(949) Capital Grants and Contributions Received in Advance (Note 31) (7,023)
(122,988) Total Long Term Liabilities (142,621)
28,245 NET ASSETS 29,57332,186 Usable Reserves (Note 20) 29,639(3,941) Unusable Financial Reserves (Note 23) (66)28,245 TOTAL RESERVES 29,573
I certify that this Statement of Accounts provides a true and fair view of the financial position of the Authority as at 31 March 2019 and its Comprehensive Income and Expenditure Statement for the year then ended.
Signed: Date: 29 July 2019
29
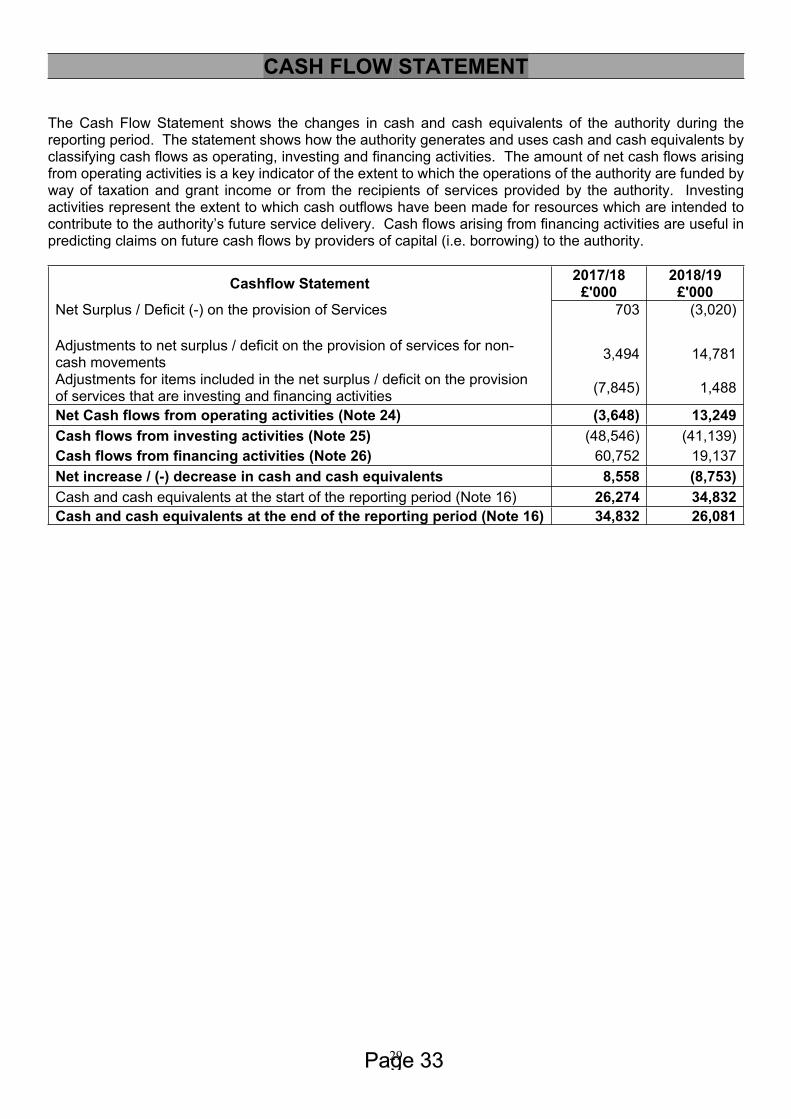
CASH FLOW STATEMENT
The Cash Flow Statement shows the changes in cash and cash equivalents of the authority during the reporting period. The statement shows how the authority generates and uses cash and cash equivalents by classifying cash flows as operating, investing and financing activities. The amount of net cash flows arising from operating activities is a key indicator of the extent to which the operations of the authority are funded by way of taxation and grant income or from the recipients of services provided by the authority. Investing activities represent the extent to which cash outflows have been made for resources which are intended to contribute to the authority’s future service delivery. Cash flows arising from financing activities are useful in predicting claims on future cash flows by providers of capital (i.e. borrowing) to the authority.
2017/18 2018/19Cashflow Statement £'000 £'000Net Surplus / Deficit (-) on the provision of Services 703 (3,020) Adjustments to net surplus / deficit on the provision of services for non-cash movements 3,494 14,781
Adjustments for items included in the net surplus / deficit on the provision of services that are investing and financing activities (7,845) 1,488
Net Cash flows from operating activities (Note 24) (3,648) 13,249Cash flows from investing activities (Note 25) (48,546) (41,139)Cash flows from financing activities (Note 26) 60,752 19,137Net increase / (-) decrease in cash and cash equivalents 8,558 (8,753)Cash and cash equivalents at the start of the reporting period (Note 16) 26,274 34,832Cash and cash equivalents at the end of the reporting period (Note 16) 34,832 26,081
30
NOTES TO THE CORE FINANCIAL STATEMENTS
1. Accounting Policies
i. General Principles
The Statement of Accounts summarises the Authority’s transactions for the 2018/19 financial year and its position at the year-end of 31 March 2019. The Authority is required to prepare an annual Statement of Accounts by the Accounts and Audit Regulations 2003, as amended in 2015, which require it to be prepared in accordance with proper accounting practices. These practices primarily comprise the Code of Practice on Local Authority Accounting in the United Kingdom 2018/19 and the Service Reporting Code of Practice 2018/19, supported by International Financial Reporting Standards (IFRS) and statutory guidance issued under section 12 of the 2003 Act.
The accounting convention adopted in the Statement of Accounts is principally historical cost, modified by the revaluation of certain categories of non-current assets and financial instruments.
ii. Accruals of Income and Expenditure
Activity is accounted for in the year that it takes place, not simply when cash payments are made or received. In particular:
- Revenue from contracts with service recipients, whether for services or the provision of goods, is recognised when (or as) the goods or services are transferred to the service recipient in accordance with the performance obligations in the contract.
- Revenue from the provision of services is recognised when the Authority can measure reliably the percentage of completion of the transaction and it is probable that economic benefits or service potential associated with the transaction will flow to the Authority.
- Supplies are recorded as expenditure when they are consumed – where there is a gap between the date supplies are received and their consumption, they are carried as inventories on the Balance Sheet. Inventories below £10,000 are considered immaterial and are expensed.
- Expenses in relation to services received (including services provided by employees) are recorded as expenditure when the services are received rather than when payments are made.
- Interest receivable on investments and payable on borrowings is accounted for respectively as income and expenditure on the basis of the effective interest rate for the relevant financial instrument rather than the cash flows fixed or determined by the contract.
- Where revenue and expenditure have been recognised but cash has not been received or paid, a debtor or creditor for the relevant amount is recorded in the Balance Sheet. Where debts may not be settled, the balance of debtors is written down and a charge made to revenue for the income that might not be collected.
iii. Cash and Cash Equivalents
Cash is represented by cash in hand and deposits with financial institutions repayable without penalty on notice of not more than 24 hours. Cash equivalents are investments that mature in three months from the date of acquisition and that are readily convertible to known amounts of cash with insignificant risk of change in value.
In the Cash Flow Statement, cash and cash equivalents are shown net of bank overdrafts that are repayable on demand and form an integral part of the Authority’s cash management.
iv. Prior Period Adjustments, Changes in Accounting Policies and Estimates and Errors
Prior period adjustments may arise as a result of a change in accounting policies or to correct a material error. Changes in accounting estimates are accounted for prospectively, i.e. in the current and future years affected by the change and do not give rise to a prior period adjustment.
31
NOTES TO THE CORE FINANCIAL STATEMENTS
Changes in accounting policies are only made when required by proper accounting practices or the change provides more reliable or relevant information about the effect of transactions, other events and conditions on the Authority’s financial position or financial performance. Where a change is made, it is applied retrospectively (unless stated otherwise) by adjusting opening balances and comparative amounts for the prior period as if the new policy had always been applied.
Material errors discovered in prior period figures are corrected retrospectively by amending opening balances and comparative amounts for the prior period.
v. Charges to Revenue for Non-Current Assets
Services and support services are debited with the following amounts to record the cost of holding fixed assets during the year:
- depreciation attributable to the assets used by the relevant service- revaluation and impairment losses on assets used by the service where there is no accumulated gain in
the Revaluation Reserve against which the losses can be written off- amortisation of intangible fixed assets attributable to the service.
The Authority is not required to raise council tax to fund depreciation, revaluation and impairment losses or amortisations. However, it is required to make an annual contribution from revenue towards the reduction in its overall borrowing requirement equal to an amount calculated on a prudent basis determined by the authority in accordance with statutory guidance (England and Wales). Depreciation, revaluation and impairment losses and amortisations are therefore replaced by the contribution in the General Fund Balance [MRP], by way of an adjusting transaction with the Capital Adjustment Account in the Movement in Reserves Statement for the difference between the two.
vi. Employee Benefits
Benefits Payable During Employment
Short-term employee benefits are those due to be settled within 12 months of the year-end. They include such benefits as wages and salaries, paid annual leave and paid sick leave, bonuses and non-monetary benefits for current employees and are recognised as an expense for services in the year in which employees render service to the Authority. An accrual is estimated for the cost of holiday entitlements earned by employees but not taken before the year-end which employees can carry forward into the next financial year. The accrual is made at the wage and salary rates applicable in the following accounting year, being the period in which the employee takes the benefit. The accrual is charged to Surplus or Deficit on the Provision of Services, but then reversed out through the Movement in Reserves Statement so that holiday benefits are charged to revenue in the financial year in which the holiday absence occurs.
Termination Benefits
Termination benefits are amounts payable as a result of a decision by the Authority to terminate an officer’s employment before the normal retirement date or an officer’s decision to accept voluntary redundancy and are charged on an accruals basis to the relevant service line in the Comprehensive Income and Expenditure Statement when the Authority is demonstrably committed to the termination of the employment of an officer or group of officers or making an offer to encourage voluntary redundancy. Where termination benefits involve the enhancement of pensions, statutory provisions require the General Fund balance to be charged with the amount payable by the Authority to the pension fund in the year, not the amount calculated according to the relevant accounting standards. In the Movement in Reserves Statement, appropriations are required to and from the Pensions Reserve to remove the notional debits and credits for pension enhancement termination benefits and replace them with debits for the cash paid to the pension fund and pensioners and any such amounts payable but unpaid at the year-end.
32
NOTES TO THE CORE FINANCIAL STATEMENTS
Post Employment Benefits
Employees of the Authority can be members of the Local Government Pension Scheme, administered by Hampshire County Council. The scheme provides defined benefits to members (retirement lump sums and pensions), earned as employees work for the authority.
The liabilities of the Hampshire County Council pension fund attributable to the authority are included in the balance sheet on an actuarial basis using the projected unit method – i.e. an assessment of the future payments that will be made in relation to retirement benefits earned to date by employees, based on assumptions about mortality rates, employee turnover rates, etc, and projections of earnings for current employees.
Liabilities are discounted to their value at current prices using a discount rate based on the indicative rate of return on AA corporate bonds.
The assets of the pension fund attributable to the Authority are included in the Balance Sheet at their fair value:
- quoted securities – current bid price- unquoted securities – professional estimate- unitised securities – current bid price- property – market value
The change in the net pensions liability is analysed into seven components:
- current service cost – the increase in liabilities as a result of years of service earned this year – allocated in the Comprehensive Income and Expenditure Statement to the services for which the employees worked
- past service cost – the increase in liabilities arising from current year decisions whose effect relates to years of service earned in earlier years – debited to the Surplus or Deficit on the Provision of Services in the Comprehensive Income and Expenditure Statement.
- interest cost – the expected increase in the present value of liabilities during the year as they move one year closer to being paid – debited to the Financing and Investment Income and Expenditure line in the Comprehensive Income and Expenditure Statement
- expected return on assets – the annual investment return on the fund assets attributable to the Authority, based on an average of the expected long-term return – credited to the Financing and Investment Income and Expenditure line in the Comprehensive Income and Expenditure Statement
- gains or losses on settlements and curtailments – the result of actions to relieve the Authority of liabilities or events that reduce the expected future service or accrual of benefits of employees – debited or credited to the Surplus or Deficit on the Provision of Services in the Comprehensive Income and Expenditure Statement.
- actuarial gains and losses – changes in the net pensions liability that arise because events have not coincided with assumptions made at the last actuarial valuation or because the actuaries have updated their assumptions – debited to the Pensions Reserve
- contributions paid to the Hampshire County Council pension fund – cash paid as employer’s contributions to the pension fund in settlement of liabilities; not accounted for as an expense.
In relation to retirement benefits, statutory provisions require the General Fund balance to be charged with the amount payable by the Authority to the pension fund in the year, not the amount calculated
33
NOTES TO THE CORE FINANCIAL STATEMENTS
according to the relevant accounting standards. In the Movement in Reserves Statement, this means that there are appropriations to and from the Pensions Reserve to remove the notional debits and credits for retirement benefits and replace them with debits for the cash paid to the pension fund and any such amounts payable but unpaid at the year-end. The negative balance that arises on the Pensions Reserve thereby measures the beneficial impact to the General Fund of being required to account for retirement benefits on the basis of cash flows rather than as benefits are earned by employees.
Discretionary Benefits
The Authority also has restricted powers to make discretionary awards of retirement benefits in the event of early retirements. Any liabilities estimated to arise as a result of an award to any member of staff are accrued in the year of the decision to make the award and accounted for using the same policies as are applied to the Local Government Pension Scheme.
vii. Events after the Balance Sheet Date
Events after the Balance Sheet date are those events, both favourable and unfavourable, that occur between the end of the reporting period and the date when the Statement of Accounts is authorised for issue. Two types of events can be identified:
- those that provide evidence of conditions that existed at the end of the reporting period – the Statement of Accounts is adjusted to reflect such events
- those that are indicative of conditions that arose after the reporting period – the Statement of Accounts is not adjusted to reflect such events, but where a category of events would have a material effect, disclosure is made in the notes of the nature of the events and their estimated financial effect.
Events taking place after the date of authorisation for issue are not reflected in the Statement of Accounts.
viii. Financial Instruments
Financial Instruments. A financial instrument is a contract that gives rise to a financial asset of one entity and a financial liability or equity instrument of another entity. Non-exchange transactions, such as those relating to taxes, benefits and government grants, do not give rise to financial instruments. Financial Liabilities A financial liability is an obligation to transfer economic benefits controlled by the Council and can be represented by a contractual obligation to deliver cash or financial assets or an obligation to exchange financial assets and liabilities with another entity that is potentially unfavourable to the Council. Loans and receivables are recognised on the Balance Sheet when the Council becomes a party to the contractual provisions of a financial instrument. Financial Assets A financial asset is a right to future economic benefits controlled by the Council that is represented by cash, equity instruments or a contractual right to receive cash or another financial asset or a right to exchange financial assets and liabilities with another entity that is potentially favourable to the Council. Offsetting Financial Assets and Liabilities Financial assets and liabilities are set off against each other where the Council has a legally enforceable right to set off and it intends to settle on a net basis, or to realise the asset and settle the liability simultaneously. Classification and Measurement of Financial Assets Financial assets are classified based on a classification and measurement approach that reflects the business model for holding the financial assets and their cashflow characteristics. There are three main classes of financial assets measured at:
amortised cost fair value through profit or loss (FVPL), and fair value through other comprehensive income (FVOCI)
34
The authority’s business model is to hold investments to collect contractual cash flows. Financial assets are therefore classified as amortised cost, except for those whose contractual payments are not solely payment of principal and interest (i.e. where the cash flows do not take the form of a basic debt instrument). Financial assets measured at amortised cost are recognised on the Balance Sheet when the authority becomes a party to the contractual provisions of a financial instrument and are initially measured at fair value. They are subsequently measured at their amortised cost. Annual credits to the Financing and Investment Income and Expenditure line in the Comprehensive Income and Expenditure Statement (CIES) for interest receivable are based on the carrying amount of the asset multiplied by the effective rate of interest for the instrument. For most of the financial assets held by the authority, this means that the amount presented in the Balance Sheet is the outstanding principal receivable (plus accrued interest) and interest credited to the CIES is the amount receivable for the year in the loan agreement.
Expected Credit Loss Model Expected credit losses for all of financial assets held at amortised cost are recognised either on a 12-month or lifetime basis. The expected credit loss model also applies to lease receivables, and contract assets and trade receivables with a significant financing component. Impairment losses are calculated to reflect the expectation that the future cash flows might not take place because the borrower could default on their obligations. Credit risk plays a crucial part in assessing losses. Where risk has increased significantly since an instrument was initially recognised, losses are assessed on a lifetime basis. Where risk has not increased significantly or remains low, losses are assessed on the basis of 12-month expected losses. For trade and contract receivables without a significant financing component the Council has applied a simplified approach consistently to calculate expected credit losses, under which impairment losses are automatically based on lifetime expected credit losses, removing the need to consider changes in credit risk since initial recognition In accordance with the Code of Accounting Practice, no impairment loss allowance is recognised for monies owed by Central and Local Government bodies. Fair Values Fair values are split by their level in the fair value hierarchy:
Level 1 – fair value is only derived from quoted prices in active markets for identical assets or liabilities
o For the Council’s investments in externally managed pooled funds, fund values published by the fund manager have been used as these represent the prices in the principal market within which the Council would normally enter into a transaction to sell the asset.
o For the Stable or Low Volatility Net Asset Value money market funds, the valuation used assumes that, for each £1 for every of principal invested, the fund will return £1 of principal on withdrawal by the Council, plus interest.
Level 2 – fair value is calculated from inputs other than quoted prices that are observable for the asset or liability, e.g. interest rates or yields for similar instruments.
Level 3 – fair value is determined using unobservable inputs, e.g. non-market data such as cash flow forecasts or estimated creditworthiness
Financial instruments classified at amortised cost are carried in the Balance Sheet at amortised cost. Their fair values have been estimated by calculating the net present value of the remaining contractual cash flows at 31st March 2019, using the following methods and assumptions:
The fair values of other long-term loans and investments have been discounted at the market rates for similar instruments with similar remaining terms to maturity on 31st March.
The fair values of finance lease assets and liabilities have been calculated by discounting the contractual cash flows (excluding service charge elements) at the appropriate corporate bond yield, except where it is judged that this is not appropriate.
The fair value of short-term instruments, including trade payables and receivables, is assumed to approximate to the carrying amount given the low and stable interest rate environment.

35
The Council has not to date designated any Financial Assets as FVOCI.
ix. Government Grants and Contributions
Whether paid on account, by instalments or in arrears, government grants and third-party contributions and donations are recognised as due to the Authority when there is reasonable assurance that:
- the Authority will comply with the conditions attached to the payments, and- the grants or contributions will be received.
Amounts recognised as due to the Council are not credited to the Comprehensive Income and Expenditure Statement until conditions attached to the grant or contribution have been satisfied. Conditions are stipulations that specify that the future economic benefits or service potential embodied in the asset acquired using the grant or contribution are required to be consumed by the recipient as specified, or future economic benefits or service potential must be returned to the transferor.
36
NOTES TO THE CORE FINANCIAL STATEMENTS
Monies advanced as grants and contributions for which conditions have not been satisfied are carried in the Balance Sheet as creditors. When conditions are satisfied, the grant or contribution is credited to the relevant service line (attributable revenue grants and contributions) or Taxation and Non-Specific Grant Income (non-ring fenced revenue grants and all capital grants) in the Comprehensive Income and Expenditure Statement.
Where capital grants are credited to the Comprehensive Income and Expenditure Statement, they are reversed out of the General Fund Balance in the Movement in Reserves Statement. Where the grant has yet to be used to finance capital expenditure, it is posted to the Capital Grants Unapplied Reserve. Where it has been applied, it is posted to the Capital Adjustment Account. Amounts in the Capital Grants Unapplied Reserve are transferred to the Capital Adjustment Account once they have been applied to fund capital expenditure.
Non-ring fenced government grants are general grants allocated by central government directly to local authorities as additional revenue funding. These grants are credited to Taxation and Non-Specific Grant Income in the Comprehensive Income and Expenditure Statement.
The authority has elected to charge a Community Infrastructure Levy (CIL). The levy will be charged on new builds (chargeable developments for the authority) with appropriate planning consent. The Council charges for and collects the levy, which is a planning charge. The income from the levy will be used to fund a number of infrastructure projects (these include transport, flood defences and schools) to support the development of the area. CIL is received without outstanding conditions; it is therefore recognised at the commencement date of the chargeable development in the Comprehensive Income and Expenditure Statement in accordance with the accounting policy for government grants and contributions set out above. CIL charges will be largely used to fund capital expenditure. However, a small proportion of the charges may be used to fund revenue expenditure.
x. Heritage Assets
Heritage assets are defined as those assets that are held specifically to increase the knowledge, understanding and appreciation of the Authority’s history and local area. Heritage Assets are recognised and measured (including the treatment of revaluation gains and losses) in accordance with the Authority’s accounting policies on property, plant and equipment. However, some of the measurement rules may be relaxed in relation to heritage assets, where no reliable market value is available. The Authority currently has no asset meeting the definition of a heritage asset.
xi. Intangible Assets
Expenditure on non-monetary assets that do not have physical substance but are controlled by the Authority as a result of past events (e.g. software licences) is capitalised when it is expected that future economic benefits or service potential will flow from the intangible asset to the Authority.
Internally generated assets are capitalised where it is demonstrable that the project is technically feasible and is intended to be completed (with adequate resources being available) and the Authority will be able to generate future economic benefits or deliver service potential by being able to sell or use the asset. Expenditure is capitalised where it can be measured reliably as attributable to the asset and is restricted to that incurred during the development phase (research expenditure cannot be capitalised). Expenditure on the development of websites is not capitalised if the website is solely or primarily intended to promote or advertise the Authority’s goods or services.
Intangible assets are measured initially at cost. Amounts are only revalued where the fair value of the assets held by the Authority can be determined by reference to an active market. In practice, no intangible asset held by the Authority meets this criterion, and they are therefore carried at amortised cost. The depreciable amount of an intangible asset is amortised over its useful life to the relevant service lines in the Comprehensive Income and Expenditure Statement. An asset is tested for impairment whenever there is an indication that the asset might be impaired – any losses recognised are posted to the relevant service
37
NOTES TO THE CORE FINANCIAL STATEMENTS
lines in the Comprehensive Income and Expenditure Statement. Any gain or loss arising on the disposal or abandonment of an intangible asset is posted to the Other Operating Expenditure line in the Comprehensive Income and Expenditure Statement.
Where expenditure on intangible assets qualifies as capital expenditure for statutory purposes, amortisation, impairment losses and disposal gains and losses are not permitted to have an impact on the General Fund Balance. The gains and losses are therefore reversed out of the General Fund Balance in the Movement in Reserves Statement and posted to the Capital Adjustment Account and the Capital Receipts Reserve.
xii. Inventories
Stocks and stores held in the Council's depot and Tourist Information Centre stock at the year-end are included in the balance sheet at the latest purchase price. Inventories are included in the Balance Sheet at the lower of cost and net realisable value.
xiii. Investment Property
Investment properties are those that are used solely to earn rentals and/or for capital appreciation. The definition is not met if the property is used in any way to facilitate the delivery of services or production of goods or is held for sale.
Investment properties are measured initially at cost and subsequently at fair value, based on the amount at which the asset could be exchanged between knowledgeable parties at arm’s-length. As a non-financial asset, investment properties are measured at highest and best use. Properties are not depreciated but are revalued annually according to market conditions at the year-end. Gains and losses on revaluation are posted to the Financing and Investment Income and Expenditure line in the Comprehensive Income and Expenditure Statement. The same treatment is applied to gains and losses on disposal.
All valuations are carried out externally by the independent valuers, Vail Williams LLP. Valuations were carried out in accordance with the methodologies and bases for estimation set out in the professional standards of the Royal Institution of Chartered Surveyors,
Rentals received in relation to investment properties are credited to the Financing and Investment Income line and result in a gain for the General Fund Balance. However, revaluation and disposal gains and losses are not permitted by statutory arrangements to have an impact on the General Fund Balance. The gains and losses are therefore reversed out of the General Fund Balance in the Movement in Reserves Statement and posted to the Capital Receipts Reserve.
xiv. Interests in Companies and Other Entities
Local authorities are required to consider all their interests and to prepare a full set of group financial statements where they have material interests in subsidiaries, associates or joint ventures. In order to assess whether the Council has interests relevant to group accounts, consideration has been given to involvement with companies, partnerships, voluntary organisations and other public bodies to determine whether:
the authority has a formal interest in a body which gives it access to economic benefits or service potential and that the body is an identifiable entity carrying on a trade or business of its own.
the interest constitutes control over the majority of equity capital or voting rights or over rights to appoint the majority of the governing body or the interest involves it exercising, or having the right to exercise, dominant influence over the entity, such that the entity is classified as a subsidiary of the authority.

38
if the authority does not have control, whether its interest involves it being able to exercise a significant influence over the entity without support from other participants, such that the entity is classified as an associate of the authority.
39
NOTES TO THE CORE FINANCIAL STATEMENTS
if the authority does not have control, whether its interest allows it to direct the operating and financial policies in conjunction and with the consent of the other participants in the entity, such that the entity is classified as a joint venture for the authority.
Consideration has been given to the relationship with all potential entities and the following disclosures have been made:
interests in other entities as shown in Note 33 to the Core Financial StatementsThe relationship with the body disclosed is not material and therefore there is no entity where the Council’s interest is such that it would give rise to the requirement to prepare group accounts.
This position will be reviewed and updated on an annual basis.
xv. Leases
Leases are classified as finance leases where the terms of the lease transfer substantially all the risks and rewards incidental to ownership of the property, plant or equipment from the lessor to the lessee. All other leases are classified as operating leases.
Where a lease covers both land and buildings, the land and buildings elements are considered separately for classification.
Arrangements that do not have the legal status of a lease but convey a right to use an asset in return for payment are accounted for under this policy where fulfilment of the arrangement is dependent on the use of specific assets.
The Authority as Lessee
Finance Leases
Property, plant and equipment held under finance leases is recognised on the Balance Sheet at the commencement of the lease at its fair value measured at the lease’s inception (or the present value of the minimum lease payments, if lower). The asset recognised is matched by a liability for the obligation to pay the lessor. Initial direct costs of the Authority are added to the carrying amount of the asset. Premiums paid on entry into a lease are applied to writing down the lease liability. Contingent rents are charged as expenses in the periods in which they are incurred.
Lease payments are apportioned between:
- a charge for the acquisition of the interest in the property, plant or equipment – applied to write down the lease liability, and
- a finance charge (debited to the Financing and Investment Income and Expenditure line in the Comprehensive Income and Expenditure Statement).
Property, Plant and Equipment recognised under finance leases is accounted for using the policies applied generally to such assets, subject to depreciation being charged over the lease term if this is shorter than the asset’s estimated useful life (where ownership of the asset does not transfer to the authority at the end of the lease period).
The Authority is not required to raise council tax to cover depreciation or revaluation and impairment losses arising on leased assets. Instead, a prudent annual contribution is made from revenue funds towards the deemed capital investment in accordance with statutory requirements. Depreciation and revaluation and impairment losses are therefore substituted by a revenue contribution in the General Fund Balance, by way of an adjusting transaction with the Capital Adjustment Account in the Movement in Reserves Statement for the difference between the two.
40
NOTES TO THE CORE FINANCIAL STATEMENTS
Operating Leases
Rentals paid under operating leases are charged to the Comprehensive Income and Expenditure Statement as an expense of the services benefitting from use of the leased property, plant or equipment. Charges are made on a straight-line basis over the life of the lease, even if this does not match the pattern of payments (e.g. there is a rent-free period at the commencement of the lease).
The Authority as Lessor
Finance Leases
Where the Authority grants a finance lease over a property or an item of plant or equipment, the relevant asset is written out of the Balance Sheet as a disposal. At the commencement of the lease, the carrying amount of the asset in the Balance Sheet (whether Property, Plant and Equipment or Assets Held for Sale) is written off to the Other Operating Expenditure line in the Comprehensive Income and Expenditure Statement as part of the gain or loss on disposal. A gain, representing the Authority’s net investment in the lease, is credited to the same line in the Comprehensive Income and Expenditure Statement also as part of the gain or loss on disposal (i.e. netted off against the carrying value of the asset at the time of disposal), matched by a lease (long-term debtor) asset in the Balance Sheet.
Lease rentals receivable are apportioned between:
- a charge for the acquisition of the interest in the property – applied to write down the lease debtor (together with any premiums received), and
- finance income (credited to the Financing and Investment Income and Expenditure line in the Comprehensive Income and Expenditure Statement).
The gain credited to the Comprehensive Income and Expenditure Statement on disposal is not permitted by statute to increase the General Fund Balance and is required to be treated as a capital receipt. Where a premium has been received, this is posted out of the General Fund Balance to the Capital Receipts Reserve in the Movement in Reserves Statement. Where the amount due in relation to the lease asset is to be settled by the payment of rentals in future financial years, this is posted out of the General Fund Balance to the Deferred Capital Receipts Reserve in the Movement in Reserves Statement. When the future rentals are received, the element for the capital receipt for the disposal of the asset is used to write down the lease debtor. At this point, the deferred capital receipts are transferred to the Capital Receipts Reserve.
The written-off value of disposals is not a charge against council tax, as the cost of fixed assets is fully provided for under separate arrangements for capital financing. Amounts are therefore appropriated to the Capital Adjustment Account from the General Fund Balance in the Movement in Reserves Statement.
Operating Leases
Where the Authority grants an operating lease over a property or an item of plant or equipment, the asset is retained in the Balance Sheet. Rental income is credited to the Other Operating Expenditure line in the Comprehensive Income and Expenditure Statement. Credits are made on a straight-line basis over the life of the lease, even if this does not match the pattern of payments (e.g. there is a premium paid at the commencement of the lease). Initial direct costs incurred in negotiating and arranging the lease are added to the carrying amount of the relevant asset and charged as an expense over the lease term on the same basis as rental income.
41
NOTES TO THE CORE FINANCIAL STATEMENTS
xvi. Property, Plant and Equipment
Assets that have physical substance and are held for use in the production or supply of goods or services, for rental to others, or for administrative purposes and that are expected to be used during more than one financial year are classified as Property, Plant and Equipment.
Recognition
Expenditure on the acquisition, creation or enhancement of Property, Plant and Equipment is capitalised on an accruals basis, provided that it is probable that the future economic benefits or service potential associated with the item will flow to the Authority and the cost of the item can be measured reliably. Expenditure that maintains but does not add to an asset’s potential to deliver future economic benefits or service potential (i.e. repairs and maintenance) is charged as an expense when it is incurred.
Measurement
Assets are initially measured at cost, comprising:
- the purchase price- any costs attributable to bringing the asset to the location and condition necessary for it to be capable of
operating in the manner intended by management
The Authority does not capitalise expenditure below a de minimis of £15,000, or borrowing costs incurred whilst assets are under construction.
The cost of assets acquired other than by purchase is deemed to be its fair value, unless the acquisition does not have commercial substance (i.e. it will not lead to a variation in the cash flows of the Authority). In the latter case, where an asset is acquired via an exchange, the cost of the acquisition is the carrying amount of the asset given up by the Authority.
Donated assets are measured initially at fair value. The difference between fair value and any consideration paid is credited to the Taxation and Non-Specific Grant Income line of the Comprehensive Income and Expenditure Statement, unless the donation has been made conditionally. Until conditions are satisfied, the gain is held in the Donated Assets Account. Where gains are credited to the Comprehensive Income and Expenditure Statement, they are reversed out of the General Fund Balance to the Capital Adjustment Account in the Movement in Reserves Statement.
Assets are then carried in the Balance Sheet using the following measurement bases:
- infrastructure, community assets and assets under construction – depreciated historical cost- all other assets – current value, determined as the amount that would be paid for the asset in its existing
use (existing use value – EUV).
42
NOTES TO THE CORE FINANCIAL STATEMENTS
Where there is no market-based evidence of fair value because of the specialist nature of an asset, depreciated replacement cost (DRC) is used as an estimate of fair value.
Where non-property assets that have short useful lives or low values (or both), depreciated historical cost basis is used as a proxy for fair value.
Assets included in the Balance Sheet at fair value are revalued sufficiently regularly to ensure that their carrying amount is not materially different from their fair value at the year-end, but as a minimum every five years. Increases in valuations are matched by credits to the Revaluation Reserve to recognise unrealised gains. Where decreases in value are identified, they are accounted for by:
- where there is a balance of revaluation gains for the asset in the Revaluation Reserve, the carrying amount of the asset is written down against that balance (up to the amount of the accumulated gains)
- where there is no balance in the Revaluation Reserve or an insufficient balance, the carrying amount of the asset is written down against the relevant service line(s) in the Comprehensive Income and Expenditure Statement.
The Revaluation Reserve contains revaluation gains recognised since 1 April 2007 only, the date of its formal implementation. Gains arising before that date have been consolidated into the Capital Adjustment Account.
Impairment
Assets are assessed at each year-end as to whether there is any indication that an asset may be impaired. Where indications exist and any possible differences are estimated to be material, the recoverable amount of the asset is estimated and, where this is less than the carrying amount of the asset, an impairment loss is recognised for the shortfall.
Where impairment losses are identified, they are accounted for by:
- where there is a balance of revaluation gains for the asset in the Revaluation Reserve, the carrying amount of the asset is written down against that balance (up to the amount of the accumulated gains)
- where there is no balance in the Revaluation Reserve or an insufficient balance, the carrying amount of the asset is written down against the relevant service line(s) in the Comprehensive Income and Expenditure Statement.
Where an impairment loss is reversed subsequently, the reversal is credited to the relevant service line(s) in the Comprehensive Income and Expenditure Statement, up to the amount of the original loss, adjusted for depreciation that would have been charged if the loss had not been recognised.
Depreciation
Depreciation is provided for on all Property, Plant and Equipment assets by the systematic allocation of their depreciable amounts over their useful lives. An exception is made for assets without a determinable finite useful life (i.e. freehold land) and assets that are not yet available for use (i.e. assets under construction).
Depreciation is calculated on the following bases:
- dwellings and other buildings – straight-line allocation over the useful life of the property as estimated by the valuer
- vehicles, plant, furniture and equipment – straight line allocation over the assessed useful life of the asset concerned (life between 3 and 20 years) as advised by a suitably qualified officer
43
NOTES TO THE CORE FINANCIAL STATEMENTS
- infrastructure – straight-line allocation over assessed useful life of the type of asset (life between 10 and 50 years) as advised by a suitably qualified officer
Where an item of Property, Plant and Equipment asset has major components whose cost is significant in relation to the total cost of the item, the components are depreciated separately.
Revaluation gains are also depreciated, with an amount equal to the difference between current value depreciation charged on assets and the depreciation that would have been chargeable based on their historical cost being transferred each year from the Revaluation Reserve to the Capital Adjustment Account.
Disposals and Non-current Assets Held for Sale
When it becomes probable that the carrying amount of an asset will be recovered principally through a sale transaction rather than through its continuing use, it is reclassified as an Asset Held for Sale. The asset is revalued immediately before reclassification and then carried at the lower of this amount and fair value less costs to sell. Where there is a subsequent decrease to fair value less costs to sell, the loss is posted to the Other Operating Expenditure line in the Comprehensive Income and Expenditure Statement. Gains in fair value are recognised only up to the amount of any previously losses recognised in the Surplus or Deficit on Provision of Services. Depreciation is not charged on Assets Held for Sale.
If assets no longer meet the criteria to be classified as Assets Held for Sale, they are reclassified back to non-current assets and valued at the lower of their carrying amount before they were classified as held for sale; adjusted for depreciation, amortisation or revaluations that would have been recognised
had they not been classified as Held for Sale, and their recoverable amount at the date of the decision not to sell.
Assets that are to be abandoned or scrapped are not reclassified as Assets Held for Sale.
When an asset is disposed of or decommissioned, the carrying amount of the asset in the Balance Sheet (whether Property, Plant and Equipment or Assets Held for Sale) is written off to the Other Operating Expenditure line in the Comprehensive Income and Expenditure Statement as part of the gain or loss on disposal. Receipts from disposals (if any) are credited to the same line in the Comprehensive Income and Expenditure Statement also as part of the gain or loss on disposal (i.e. netted off against the carrying value of the asset at the time of disposal). Any revaluation gains accumulated for the asset in the Revaluation Reserve are transferred to the Capital Adjustment Account.
Amounts received for a disposal in excess of £10,000 are categorised as capital receipts. Receipts are required to be credited to the Capital Receipts Reserve, and can then only be used for new capital investment. Receipts are appropriated to the Reserve from the General Fund Balance in the Movement in Reserves Statement.
The written-off value of disposals is not a charge against council tax, as the cost of fixed assets is fully provided for under separate arrangements for capital financing. Amounts are appropriated to the Capital Adjustment Account from the General Fund Balance in the Movement in Reserves Statement.
44
NOTES TO THE CORE FINANCIAL STATEMENTS
xvii. Provisions, Contingent Liabilities and Contingent Assets
Provisions
Provisions are made where an event has taken place that gives the Authority a legal or constructive obligation that probably requires settlement by a transfer of economic benefits or service potential, and a reliable estimate can be made of the amount of the obligation. For instance, the Authority may be involved in a court case that could eventually result in the making of a settlement or the payment of compensation.
Provisions are charged as an expense to the appropriate service line in the Comprehensive Income and Expenditure Statement in the year that the authority becomes aware of the obligation, and are measured at the best estimate at the balance sheet date of the expenditure required to settle the obligation, taking into account relevant risks and uncertainties.
When payments are eventually made, they are charged to the provision carried in the Balance Sheet. Estimated settlements are reviewed at the end of each financial year – where it becomes less than probable that a transfer of economic benefits will now be required (or a lower settlement than anticipated is made), the provision is reversed and credited back to the relevant service.
Where some or all of the payment required to settle a provision is expected to be recovered from another party (e.g. from an insurance claim), this is only recognised as income for the relevant service if it is virtually certain that reimbursement will be received if the authority settles the obligation.
Contingent Liabilities
A contingent liability arises where an event has taken place that gives the authority a possible obligation whose existence will only be confirmed by the occurrence or otherwise of uncertain future events not wholly within the control of the authority. Contingent liabilities also arise in circumstances where a provision would otherwise be made but either it is not probable that an outflow of resources will be required or the amount of the obligation cannot be measured reliably.
Contingent liabilities are not recognised in the Balance Sheet but disclosed in a note to the accounts.
Contingent Assets
A contingent asset arises where an event has taken place that gives the authority a possible asset whose existence will only be confirmed by the occurrence or otherwise of uncertain future events not wholly within the control of the authority.
Contingent assets are not recognised in the Balance Sheet but disclosed in a note to the accounts where it is probable that there will be an inflow of economic benefits or service potential.
xviii. Reserves
The Authority sets aside specific amounts as reserves for future policy purposes or to cover contingencies. Reserves are created by appropriating amounts out of the General Fund Balance in the Movement in Reserves Statement. When expenditure to be financed from a reserve is incurred, it is charged to the appropriate service in that year to score against the Surplus or Deficit on the Provision of Services in the Comprehensive Income and Expenditure Statement. The reserve is then appropriated back into the General Fund Balance in the Movement in Reserves Statement so that there is no net charge against council tax for the expenditure.
45
NOTES TO THE CORE FINANCIAL STATEMENTS
Certain reserves are kept to manage the accounting processes for non-current assets, financial instruments, retirement and employee benefits and do not represent usable resources for the Authority – these reserves are explained in Note 23.
xix. Revenue Expenditure Funded from Capital under Statute
Expenditure incurred during the year that may be capitalised under statutory provisions but that does not result in the creation of a non-current asset has been charged as expenditure to the relevant service in the Comprehensive Income and Expenditure Statement in the year. Where the Authority has determined to meet the cost of this expenditure from existing capital resources or by borrowing, a transfer in the Movement in Reserves Statement from the General Fund Balance to the Capital Adjustment Account then reverses out the amounts charged so that there is no impact on the level of council tax.
xx. VAT
VAT payable is included as an expense only to the extent that it is not recoverable from Her Majesty’s Revenue and Customs. VAT receivable is excluded from income.
xxi. Exceptional Items
When items of income and expense are material, their nature and amount is disclosed separately, either on the face of the Comprehensive Income and Expenditure Statement or in the notes to the accounts, depending on how significant the items are to an understanding of the Authority’s financial performance.
xxii. Council Tax and Non-Domestic Rates (England)
Billing authorities act as agents, collecting council tax and non-domestic rates (NDR) on behalf of the major preceptors (including government for NDR) and, as principals, collecting council tax and NDR for themselves. Billing authorities are required by statute to maintain a separate fund (i.e. the Collection Fund) for the collection and distribution of amounts due in respect of council tax and NDR. Under the legislative framework for the Collection Fund, billing authorities, major preceptors and central government share proportionately the risks and rewards that the amount of council tax and NDR collected could be less or more than predicted.
Accounting for Council Tax and NDR The council tax and NDR income included in the Comprehensive Income and Expenditure Statement is the authority’s share of accrued income for the year. However, regulations determine the amount of council tax and NDR that must be included in the authority’s General Fund. Therefore, the difference between the income included in the Comprehensive Income and Expenditure Statement and the amount required by regulation to be credited to the General Fund is taken to the Collection Fund Adjustment Account and included as a reconciling item in the Movement in Reserves Statement.
The Balance Sheet includes the authority’s share of the end of year balances in respect of council tax and NDR relating to arrears, impairment allowances for doubtful debts, overpayments and prepayments and appeals.
Where debtor balances for the above are identified as impaired because of a likelihood arising from a past event that payments due under the statutory arrangements will not be made (fixed or determinable payments), the asset is written down and a charge made to the Financing and Investment Income and Expenditure line in the CIES. The impairment loss is measured as the difference between the carrying amount and the revised future cash flows.
46
NOTES TO THE CORE FINANCIAL STATEMENTS
2. Accounting Standards that have been issued but have not yet been adopted
The Code requires the disclosure of information relating to the expected impact of an accounting change that will be required by a new standard that has been issued but not yet adopted. This applies to the adoption of new or amended standards within the 2019/20 Code. New standards introduced in the 2019/20 Code that apply from 1 April 2019 are:
amendments to IAS40 Investment Property: Transfers of Investment Property Annual improvements to IFRS Standards 2014-2016 Cycle
47
NOTES TO THE CORE FINANCIAL STATEMENTS
3. Critical Judgements in applying accounting policies
In applying the accounting policies set out in Note 1, the Authority has had to make certain judgements about complex transactions or those involving uncertainty about future events. The critical judgements made in the Statement of Accounts are:
Future funding for local government – Consultation is underway on changes to the Business Rates Retention Scheme, which will ultimately replace existing government grants, creating uncertainty over future levels of funding. There is a high degree of uncertainty about future levels of funding for local government.
However, the Authority has determined that this uncertainty is not sufficient to provide an indication that the assets of the Authority might be impaired as a result of a need to close facilities and reduce levels of service provision.
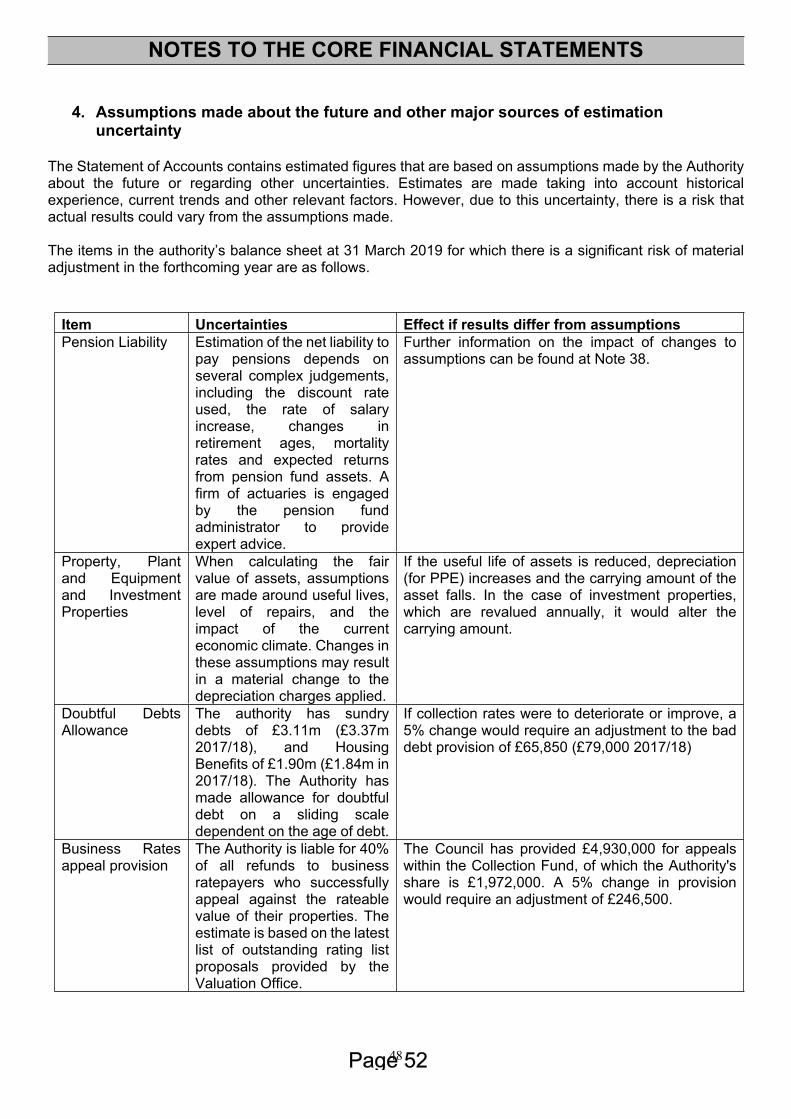
48
NOTES TO THE CORE FINANCIAL STATEMENTS
4. Assumptions made about the future and other major sources of estimation uncertainty
The Statement of Accounts contains estimated figures that are based on assumptions made by the Authority about the future or regarding other uncertainties. Estimates are made taking into account historical experience, current trends and other relevant factors. However, due to this uncertainty, there is a risk that actual results could vary from the assumptions made.
The items in the authority’s balance sheet at 31 March 2019 for which there is a significant risk of material adjustment in the forthcoming year are as follows.
Item Uncertainties Effect if results differ from assumptionsPension Liability Estimation of the net liability to
pay pensions depends on several complex judgements, including the discount rate used, the rate of salary increase, changes in retirement ages, mortality rates and expected returns from pension fund assets. A firm of actuaries is engaged by the pension fund administrator to provide expert advice.
Further information on the impact of changes to assumptions can be found at Note 38.
Property, Plant and Equipment and Investment Properties
When calculating the fair value of assets, assumptions are made around useful lives, level of repairs, and the impact of the current economic climate. Changes in these assumptions may result in a material change to the depreciation charges applied.
If the useful life of assets is reduced, depreciation (for PPE) increases and the carrying amount of the asset falls. In the case of investment properties, which are revalued annually, it would alter the carrying amount.
Doubtful Debts Allowance
The authority has sundry debts of £3.11m (£3.37m 2017/18), and Housing Benefits of £1.90m (£1.84m in 2017/18). The Authority has made allowance for doubtful debt on a sliding scale dependent on the age of debt.
If collection rates were to deteriorate or improve, a 5% change would require an adjustment to the bad debt provision of £65,850 (£79,000 2017/18)
Business Rates appeal provision
The Authority is liable for 40% of all refunds to business ratepayers who successfully appeal against the rateable value of their properties. The estimate is based on the latest list of outstanding rating list proposals provided by the Valuation Office.
The Council has provided £4,930,000 for appeals within the Collection Fund, of which the Authority's share is £1,972,000. A 5% change in provision would require an adjustment of £246,500.
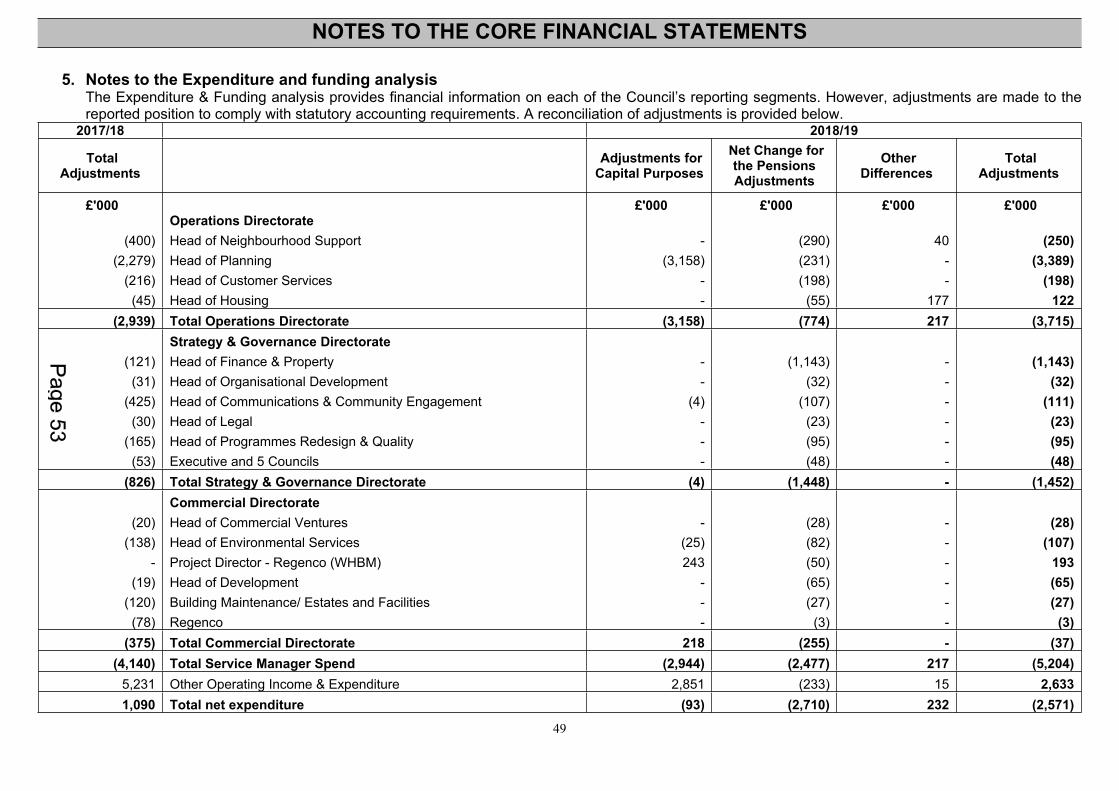
49
NOTES TO THE CORE FINANCIAL STATEMENTS
5. Notes to the Expenditure and funding analysisThe Expenditure & Funding analysis provides financial information on each of the Council’s reporting segments. However, adjustments are made to the reported position to comply with statutory accounting requirements. A reconciliation of adjustments is provided below.
2017/18 2018/19
Total Adjustments Adjustments for
Capital Purposes Net Change for
the Pensions Adjustments
Other Differences
Total Adjustments
£'000 £'000 £'000 £'000 £'000 Operations Directorate
(400) Head of Neighbourhood Support - (290) 40 (250)(2,279) Head of Planning (3,158) (231) - (3,389)
(216) Head of Customer Services - (198) - (198)(45) Head of Housing - (55) 177 122
(2,939) Total Operations Directorate (3,158) (774) 217 (3,715) Strategy & Governance Directorate
(121) Head of Finance & Property - (1,143) - (1,143)(31) Head of Organisational Development - (32) - (32)
(425) Head of Communications & Community Engagement (4) (107) - (111)(30) Head of Legal - (23) - (23)
(165) Head of Programmes Redesign & Quality - (95) - (95)(53) Executive and 5 Councils - (48) - (48)
(826) Total Strategy & Governance Directorate (4) (1,448) - (1,452) Commercial Directorate
(20) Head of Commercial Ventures - (28) - (28)(138) Head of Environmental Services (25) (82) - (107)
- Project Director - Regenco (WHBM) 243 (50) - 193(19) Head of Development - (65) - (65)
(120) Building Maintenance/ Estates and Facilities - (27) - (27)(78) Regenco - (3) - (3)
(375) Total Commercial Directorate 218 (255) - (37)(4,140) Total Service Manager Spend (2,944) (2,477) 217 (5,204)
5,231 Other Operating Income & Expenditure 2,851 (233) 15 2,6331,090 Total net expenditure (93) (2,710) 232 (2,571)
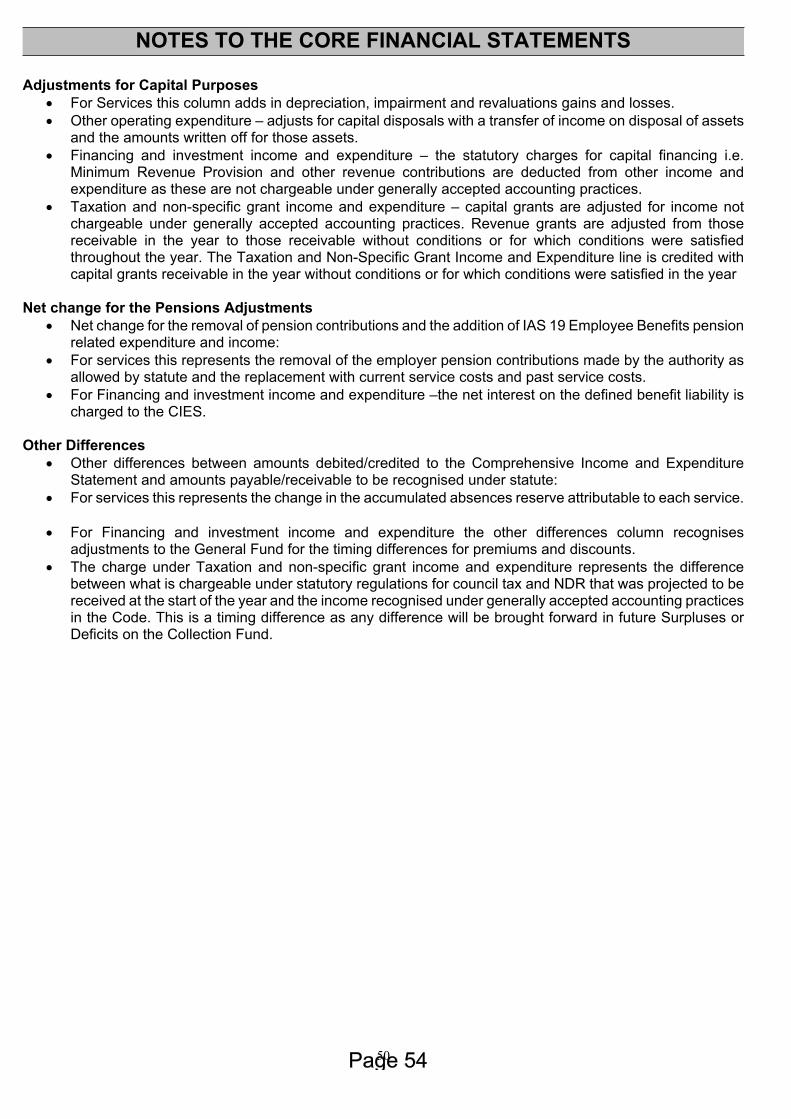
50
NOTES TO THE CORE FINANCIAL STATEMENTS
Adjustments for Capital Purposes For Services this column adds in depreciation, impairment and revaluations gains and losses. Other operating expenditure – adjusts for capital disposals with a transfer of income on disposal of assets
and the amounts written off for those assets. Financing and investment income and expenditure – the statutory charges for capital financing i.e.
Minimum Revenue Provision and other revenue contributions are deducted from other income and expenditure as these are not chargeable under generally accepted accounting practices.
Taxation and non-specific grant income and expenditure – capital grants are adjusted for income not chargeable under generally accepted accounting practices. Revenue grants are adjusted from those receivable in the year to those receivable without conditions or for which conditions were satisfied throughout the year. The Taxation and Non-Specific Grant Income and Expenditure line is credited with capital grants receivable in the year without conditions or for which conditions were satisfied in the year
Net change for the Pensions Adjustments Net change for the removal of pension contributions and the addition of IAS 19 Employee Benefits pension
related expenditure and income: For services this represents the removal of the employer pension contributions made by the authority as
allowed by statute and the replacement with current service costs and past service costs. For Financing and investment income and expenditure –the net interest on the defined benefit liability is
charged to the CIES.
Other Differences Other differences between amounts debited/credited to the Comprehensive Income and Expenditure
Statement and amounts payable/receivable to be recognised under statute: For services this represents the change in the accumulated absences reserve attributable to each service.
For Financing and investment income and expenditure the other differences column recognises adjustments to the General Fund for the timing differences for premiums and discounts.
The charge under Taxation and non-specific grant income and expenditure represents the difference between what is chargeable under statutory regulations for council tax and NDR that was projected to be received at the start of the year and the income recognised under generally accepted accounting practices in the Code. This is a timing difference as any difference will be brought forward in future Surpluses or Deficits on the Collection Fund.
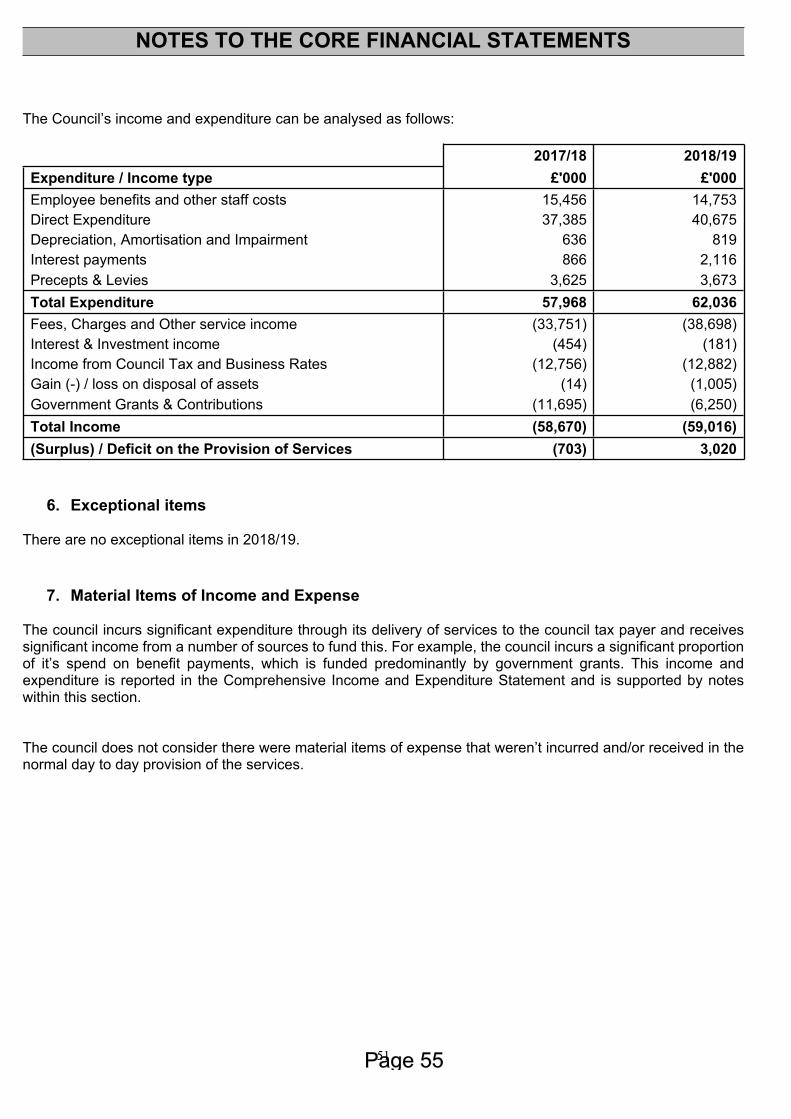
51
NOTES TO THE CORE FINANCIAL STATEMENTS
The Council’s income and expenditure can be analysed as follows:
2017/18 2018/19Expenditure / Income type £'000 £'000Employee benefits and other staff costs 15,456 14,753Direct Expenditure 37,385 40,675Depreciation, Amortisation and Impairment 636 819Interest payments 866 2,116Precepts & Levies 3,625 3,673Total Expenditure 57,968 62,036Fees, Charges and Other service income (33,751) (38,698)Interest & Investment income (454) (181)Income from Council Tax and Business Rates (12,756) (12,882)Gain (-) / loss on disposal of assets (14) (1,005)Government Grants & Contributions (11,695) (6,250)Total Income (58,670) (59,016)(Surplus) / Deficit on the Provision of Services (703) 3,020
6. Exceptional items
There are no exceptional items in 2018/19.
7. Material Items of Income and Expense
The council incurs significant expenditure through its delivery of services to the council tax payer and receives significant income from a number of sources to fund this. For example, the council incurs a significant proportion of it’s spend on benefit payments, which is funded predominantly by government grants. This income and expenditure is reported in the Comprehensive Income and Expenditure Statement and is supported by notes within this section.
The council does not consider there were material items of expense that weren’t incurred and/or received in the normal day to day provision of the services.
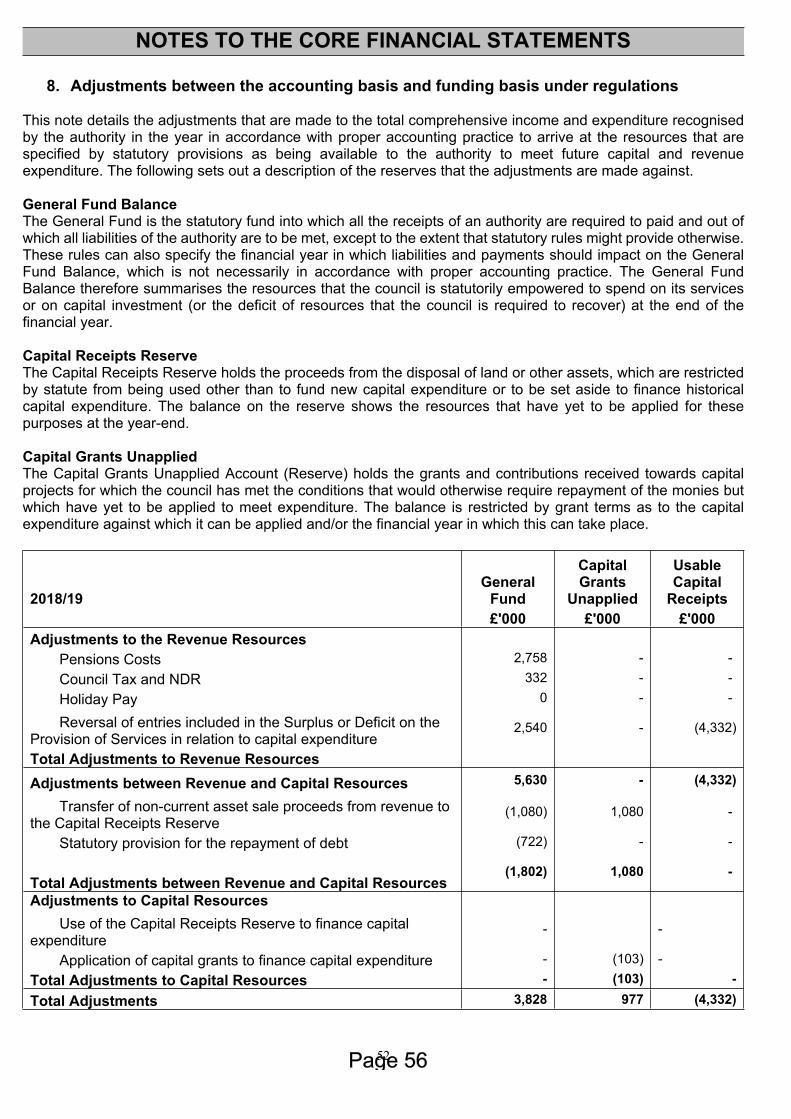
52
NOTES TO THE CORE FINANCIAL STATEMENTS
8. Adjustments between the accounting basis and funding basis under regulations
This note details the adjustments that are made to the total comprehensive income and expenditure recognised by the authority in the year in accordance with proper accounting practice to arrive at the resources that are specified by statutory provisions as being available to the authority to meet future capital and revenue expenditure. The following sets out a description of the reserves that the adjustments are made against.
General Fund Balance The General Fund is the statutory fund into which all the receipts of an authority are required to paid and out of which all liabilities of the authority are to be met, except to the extent that statutory rules might provide otherwise. These rules can also specify the financial year in which liabilities and payments should impact on the General Fund Balance, which is not necessarily in accordance with proper accounting practice. The General Fund Balance therefore summarises the resources that the council is statutorily empowered to spend on its services or on capital investment (or the deficit of resources that the council is required to recover) at the end of the financial year.
Capital Receipts ReserveThe Capital Receipts Reserve holds the proceeds from the disposal of land or other assets, which are restricted by statute from being used other than to fund new capital expenditure or to be set aside to finance historical capital expenditure. The balance on the reserve shows the resources that have yet to be applied for these purposes at the year-end.
Capital Grants UnappliedThe Capital Grants Unapplied Account (Reserve) holds the grants and contributions received towards capital projects for which the council has met the conditions that would otherwise require repayment of the monies but which have yet to be applied to meet expenditure. The balance is restricted by grant terms as to the capital expenditure against which it can be applied and/or the financial year in which this can take place.
2018/19General
Fund
Capital Grants
Unapplied
Usable Capital
Receipts £'000 £'000 £'000Adjustments to the Revenue Resources
Pensions Costs 2,758 - - Council Tax and NDR 332 - - Holiday Pay 0 - -
Reversal of entries included in the Surplus or Deficit on the Provision of Services in relation to capital expenditure
2,540 - (4,332)
Total Adjustments to Revenue ResourcesAdjustments between Revenue and Capital Resources 5,630 - (4,332)
Transfer of non-current asset sale proceeds from revenue to the Capital Receipts Reserve
(1,080) 1,080 -
Statutory provision for the repayment of debt (722) - -
Total Adjustments between Revenue and Capital Resources(1,802) 1,080 -
Adjustments to Capital ResourcesUse of the Capital Receipts Reserve to finance capital
expenditure- -
Application of capital grants to finance capital expenditure - (103) -Total Adjustments to Capital Resources - (103) -Total Adjustments 3,828 977 (4,332)
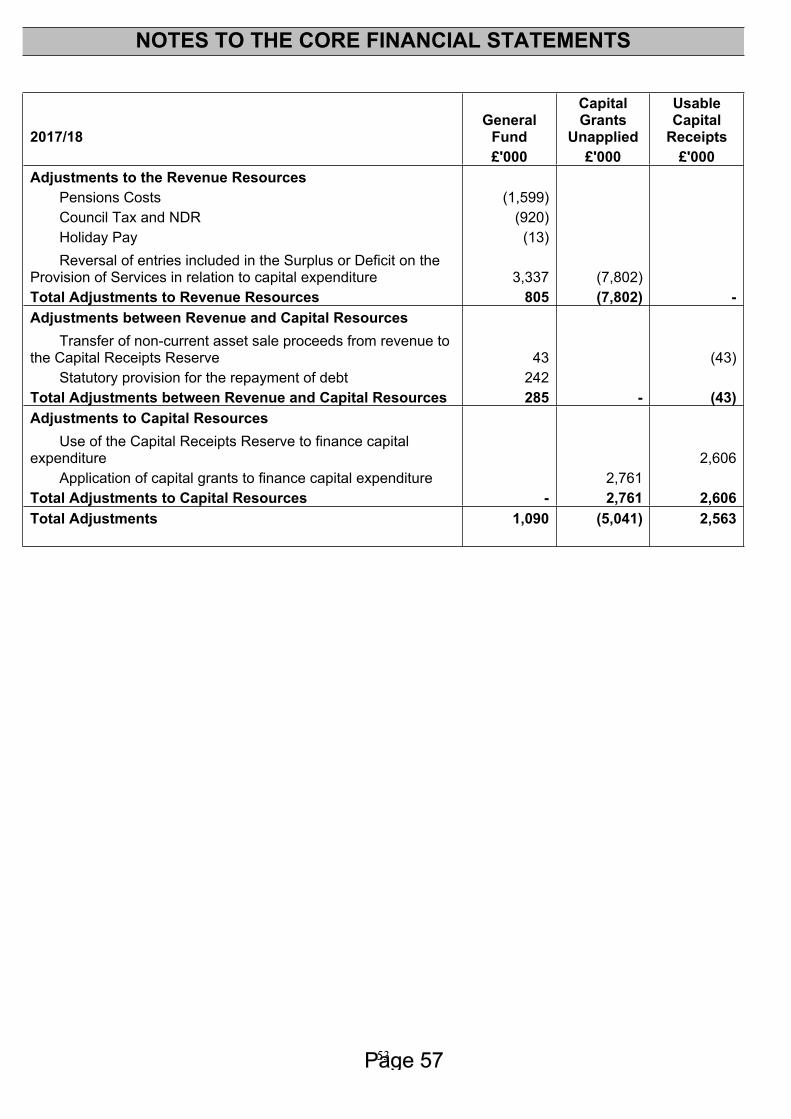
53
NOTES TO THE CORE FINANCIAL STATEMENTS
2017/18General
Fund
Capital Grants
Unapplied
Usable Capital
Receipts £'000 £'000 £'000Adjustments to the Revenue Resources
Pensions Costs (1,599) Council Tax and NDR (920) Holiday Pay (13) Reversal of entries included in the Surplus or Deficit on the
Provision of Services in relation to capital expenditure 3,337 (7,802) Total Adjustments to Revenue Resources 805 (7,802) -Adjustments between Revenue and Capital Resources
Transfer of non-current asset sale proceeds from revenue to the Capital Receipts Reserve 43 (43)
Statutory provision for the repayment of debt 242 Total Adjustments between Revenue and Capital Resources 285 - (43)Adjustments to Capital Resources
Use of the Capital Receipts Reserve to finance capital expenditure 2,606
Application of capital grants to finance capital expenditure 2,761 Total Adjustments to Capital Resources - 2,761 2,606Total Adjustments 1,090 (5,041) 2,563
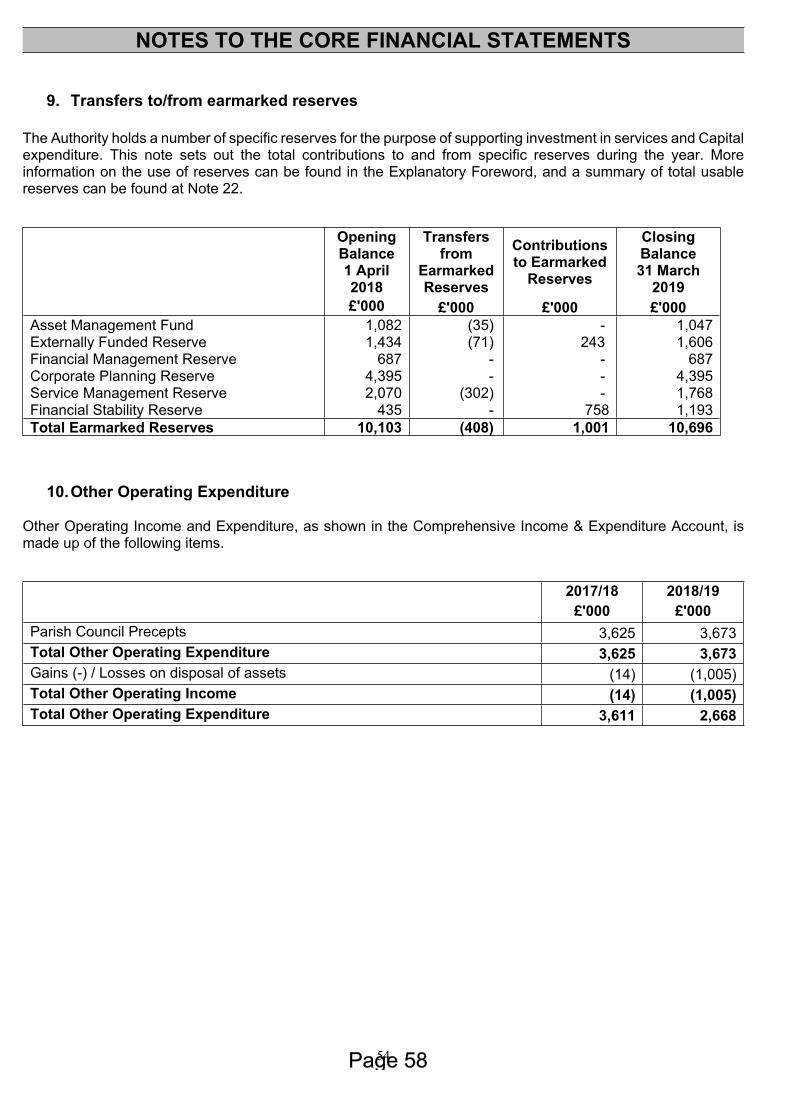
54
NOTES TO THE CORE FINANCIAL STATEMENTS
9. Transfers to/from earmarked reserves
The Authority holds a number of specific reserves for the purpose of supporting investment in services and Capital expenditure. This note sets out the total contributions to and from specific reserves during the year. More information on the use of reserves can be found in the Explanatory Foreword, and a summary of total usable reserves can be found at Note 22.
Opening Balance 1 April 2018
Transfers from
Earmarked Reserves
Contributions to Earmarked
Reserves
Closing Balance 31 March
2019 £'000 £'000 £'000 £'000Asset Management Fund 1,082 (35) - 1,047Externally Funded Reserve 1,434 (71) 243 1,606Financial Management Reserve 687 - - 687Corporate Planning Reserve 4,395 - - 4,395Service Management Reserve 2,070 (302) - 1,768Financial Stability Reserve 435 - 758 1,193Total Earmarked Reserves 10,103 (408) 1,001 10,696
10.Other Operating Expenditure
Other Operating Income and Expenditure, as shown in the Comprehensive Income & Expenditure Account, is made up of the following items.
2017/18 2018/19 £'000 £'000Parish Council Precepts 3,625 3,673Total Other Operating Expenditure 3,625 3,673Gains (-) / Losses on disposal of assets (14) (1,005)Total Other Operating Income (14) (1,005)Total Other Operating Expenditure 3,611 2,668
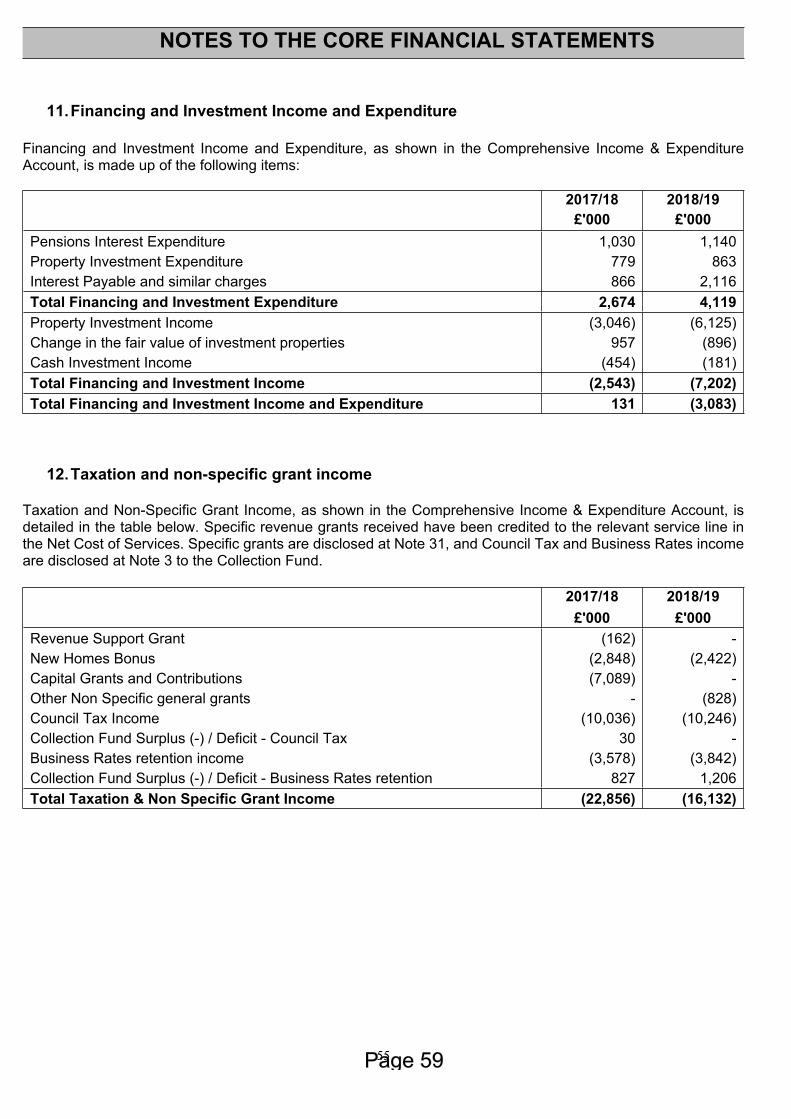
55
NOTES TO THE CORE FINANCIAL STATEMENTS
11.Financing and Investment Income and Expenditure
Financing and Investment Income and Expenditure, as shown in the Comprehensive Income & Expenditure Account, is made up of the following items:
2017/18 2018/19 £'000 £'000Pensions Interest Expenditure 1,030 1,140Property Investment Expenditure 779 863Interest Payable and similar charges 866 2,116Total Financing and Investment Expenditure 2,674 4,119Property Investment Income (3,046) (6,125)Change in the fair value of investment properties 957 (896)Cash Investment Income (454) (181)Total Financing and Investment Income (2,543) (7,202)Total Financing and Investment Income and Expenditure 131 (3,083)
12.Taxation and non-specific grant income
Taxation and Non-Specific Grant Income, as shown in the Comprehensive Income & Expenditure Account, is detailed in the table below. Specific revenue grants received have been credited to the relevant service line in the Net Cost of Services. Specific grants are disclosed at Note 31, and Council Tax and Business Rates income are disclosed at Note 3 to the Collection Fund.
2017/18 2018/19 £'000 £'000Revenue Support Grant (162) -New Homes Bonus (2,848) (2,422)Capital Grants and Contributions (7,089) -Other Non Specific general grants - (828)Council Tax Income (10,036) (10,246)Collection Fund Surplus (-) / Deficit - Council Tax 30 -Business Rates retention income (3,578) (3,842)Collection Fund Surplus (-) / Deficit - Business Rates retention 827 1,206Total Taxation & Non Specific Grant Income (22,856) (16,132)
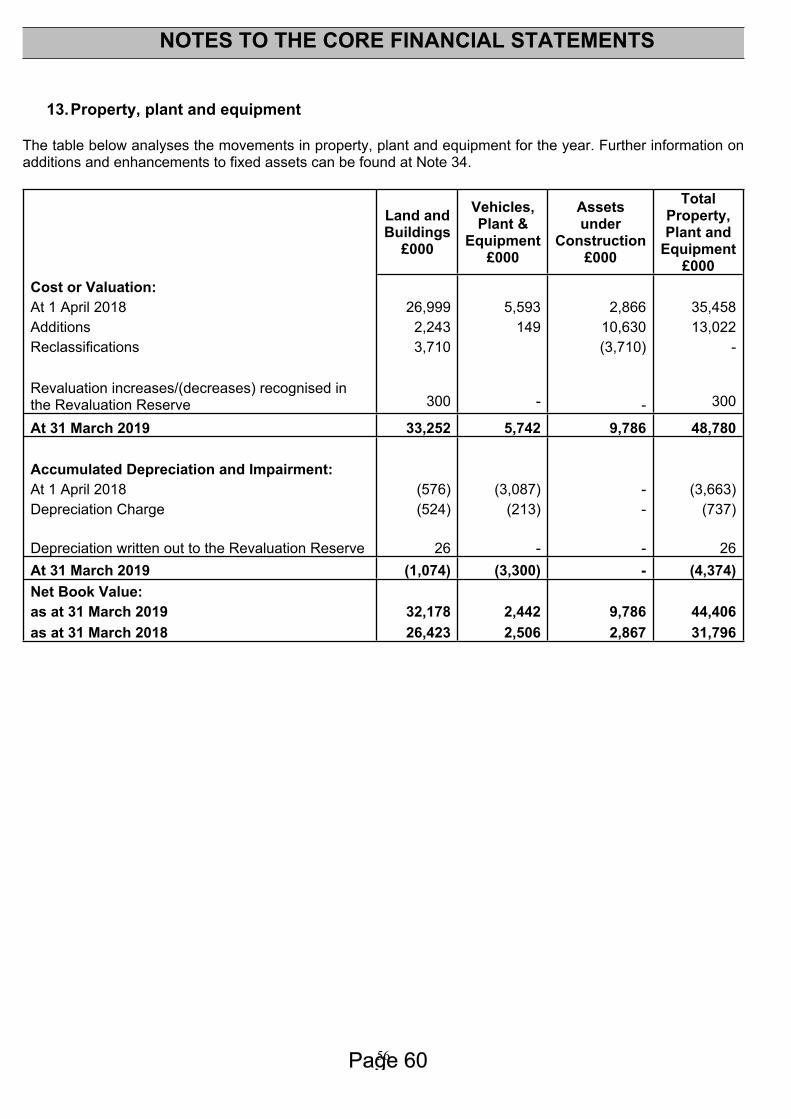
56
NOTES TO THE CORE FINANCIAL STATEMENTS
13.Property, plant and equipment
The table below analyses the movements in property, plant and equipment for the year. Further information on additions and enhancements to fixed assets can be found at Note 34.
Land and Buildings
£000
Vehicles, Plant &
Equipment£000
Assets under
Construction £000
Total Property, Plant and
Equipment £000
Cost or Valuation: At 1 April 2018 26,999 5,593 2,866 35,458Additions 2,243 149 10,630 13,022Reclassifications 3,710 (3,710) -
Revaluation increases/(decreases) recognised in the Revaluation Reserve 300 - - 300
At 31 March 2019 33,252 5,742 9,786 48,780
Accumulated Depreciation and Impairment: At 1 April 2018 (576) (3,087) - (3,663)Depreciation Charge (524) (213) - (737)
Depreciation written out to the Revaluation Reserve 26 - - 26At 31 March 2019 (1,074) (3,300) - (4,374)Net Book Value: as at 31 March 2019 32,178 2,442 9,786 44,406as at 31 March 2018 26,423 2,506 2,867 31,796
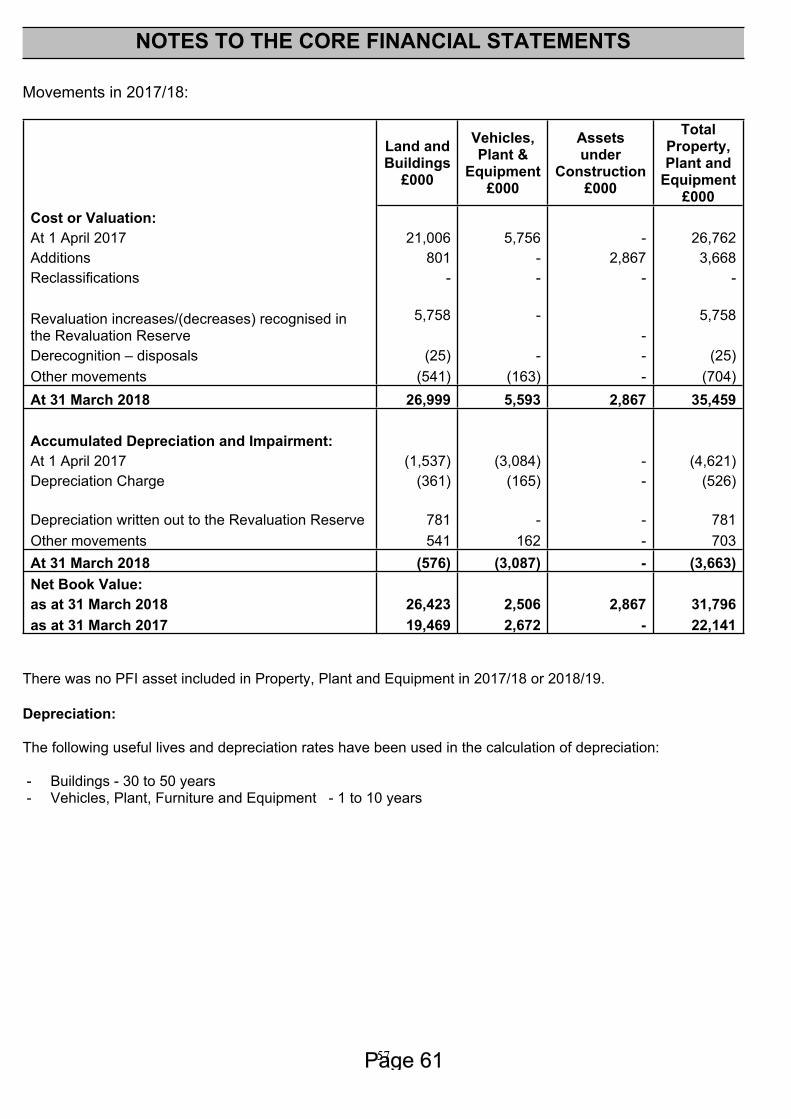
57
NOTES TO THE CORE FINANCIAL STATEMENTS
Movements in 2017/18:
Land and Buildings
£000
Vehicles, Plant &
Equipment£000
Assets under
Construction £000
Total Property, Plant and
Equipment £000
Cost or Valuation: At 1 April 2017 21,006 5,756 - 26,762Additions 801 - 2,867 3,668Reclassifications - - - -
Revaluation increases/(decreases) recognised in the Revaluation Reserve
5,758 --
5,758
Derecognition – disposals (25) - - (25)Other movements (541) (163) - (704)At 31 March 2018 26,999 5,593 2,867 35,459
Accumulated Depreciation and Impairment: At 1 April 2017 (1,537) (3,084) - (4,621)Depreciation Charge (361) (165) - (526)
Depreciation written out to the Revaluation Reserve 781 - - 781Other movements 541 162 - 703At 31 March 2018 (576) (3,087) - (3,663)Net Book Value: as at 31 March 2018 26,423 2,506 2,867 31,796as at 31 March 2017 19,469 2,672 - 22,141
There was no PFI asset included in Property, Plant and Equipment in 2017/18 or 2018/19.
Depreciation:
The following useful lives and depreciation rates have been used in the calculation of depreciation:
- Buildings - 30 to 50 years- Vehicles, Plant, Furniture and Equipment - 1 to 10 years
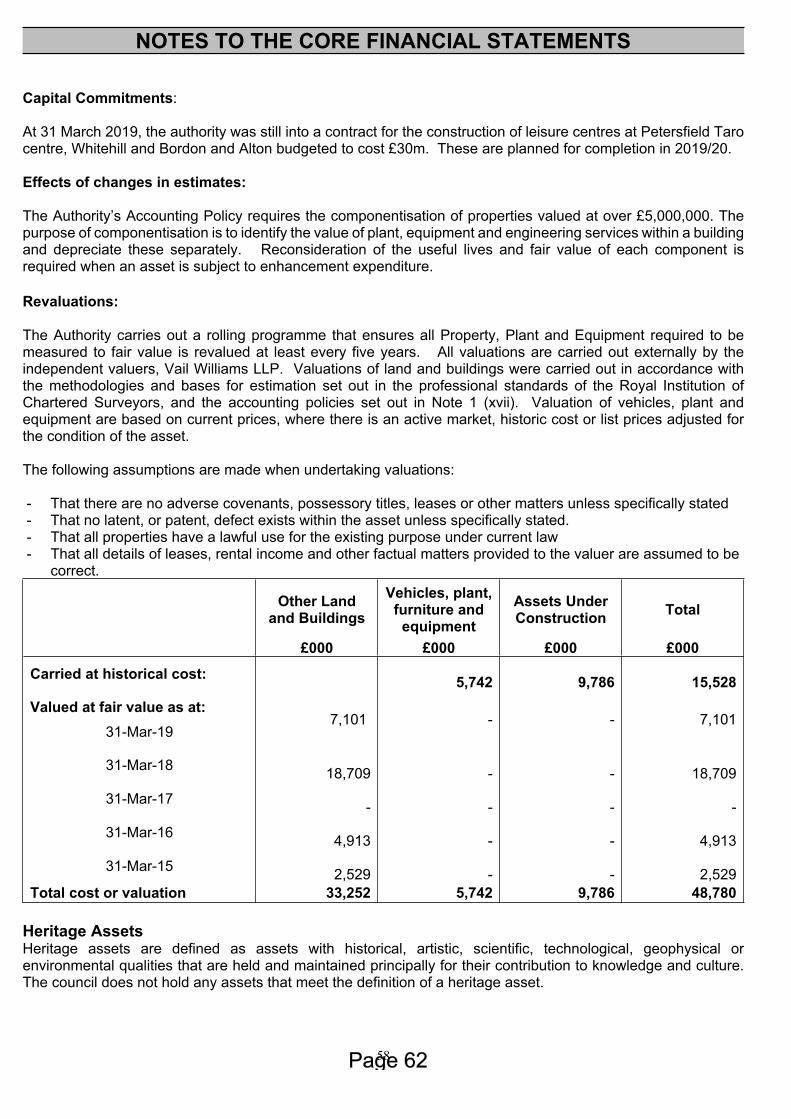
58
NOTES TO THE CORE FINANCIAL STATEMENTS
Capital Commitments:
At 31 March 2019, the authority was still into a contract for the construction of leisure centres at Petersfield Taro centre, Whitehill and Bordon and Alton budgeted to cost £30m. These are planned for completion in 2019/20.
Effects of changes in estimates:
The Authority’s Accounting Policy requires the componentisation of properties valued at over £5,000,000. The purpose of componentisation is to identify the value of plant, equipment and engineering services within a building and depreciate these separately. Reconsideration of the useful lives and fair value of each component is required when an asset is subject to enhancement expenditure.
Revaluations:
The Authority carries out a rolling programme that ensures all Property, Plant and Equipment required to be measured to fair value is revalued at least every five years. All valuations are carried out externally by the independent valuers, Vail Williams LLP. Valuations of land and buildings were carried out in accordance with the methodologies and bases for estimation set out in the professional standards of the Royal Institution of Chartered Surveyors, and the accounting policies set out in Note 1 (xvii). Valuation of vehicles, plant and equipment are based on current prices, where there is an active market, historic cost or list prices adjusted for the condition of the asset.
The following assumptions are made when undertaking valuations:
- That there are no adverse covenants, possessory titles, leases or other matters unless specifically stated- That no latent, or patent, defect exists within the asset unless specifically stated.- That all properties have a lawful use for the existing purpose under current law- That all details of leases, rental income and other factual matters provided to the valuer are assumed to be
correct.
Other Land and Buildings
Vehicles, plant, furniture and
equipment Assets Under Construction Total
£000 £000 £000 £000
Carried at historical cost: 5,742
9,786
15,528
Valued at fair value as at:31-Mar-19
7,101 - - 7,101
31-Mar-18 18,709
-
-
18,709
31-Mar-17 -
-
-
-
31-Mar-16 4,913
-
-
4,913
31-Mar-15 2,529
-
-
2,529
Total cost or valuation 33,252 5,742 9,786 48,780
Heritage AssetsHeritage assets are defined as assets with historical, artistic, scientific, technological, geophysical or environmental qualities that are held and maintained principally for their contribution to knowledge and culture. The council does not hold any assets that meet the definition of a heritage asset.
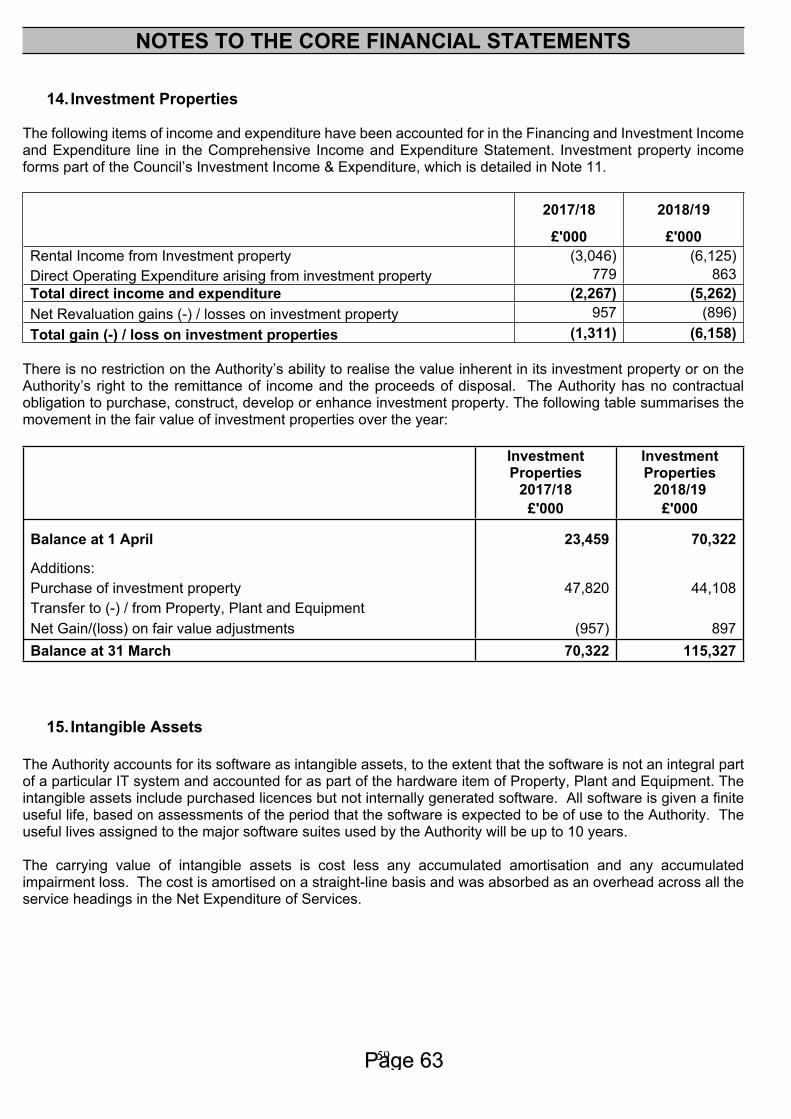
59
NOTES TO THE CORE FINANCIAL STATEMENTS
14. Investment Properties
The following items of income and expenditure have been accounted for in the Financing and Investment Income and Expenditure line in the Comprehensive Income and Expenditure Statement. Investment property income forms part of the Council’s Investment Income & Expenditure, which is detailed in Note 11.
2017/18 2018/19
£'000 £'000Rental Income from Investment property (3,046) (6,125)Direct Operating Expenditure arising from investment property 779 863Total direct income and expenditure (2,267) (5,262)Net Revaluation gains (-) / losses on investment property 957 (896)Total gain (-) / loss on investment properties (1,311) (6,158)
There is no restriction on the Authority’s ability to realise the value inherent in its investment property or on the Authority’s right to the remittance of income and the proceeds of disposal. The Authority has no contractual obligation to purchase, construct, develop or enhance investment property. The following table summarises the movement in the fair value of investment properties over the year:
Investment Properties
2017/18
Investment Properties
2018/19 £'000 £'000
Balance at 1 April 23,459 70,322
Additions: Purchase of investment property 47,820 44,108Transfer to (-) / from Property, Plant and Equipment Net Gain/(loss) on fair value adjustments (957) 897Balance at 31 March 70,322 115,327
15. Intangible Assets
The Authority accounts for its software as intangible assets, to the extent that the software is not an integral part of a particular IT system and accounted for as part of the hardware item of Property, Plant and Equipment. The intangible assets include purchased licences but not internally generated software. All software is given a finite useful life, based on assessments of the period that the software is expected to be of use to the Authority. The useful lives assigned to the major software suites used by the Authority will be up to 10 years.
The carrying value of intangible assets is cost less any accumulated amortisation and any accumulated impairment loss. The cost is amortised on a straight-line basis and was absorbed as an overhead across all the service headings in the Net Expenditure of Services.
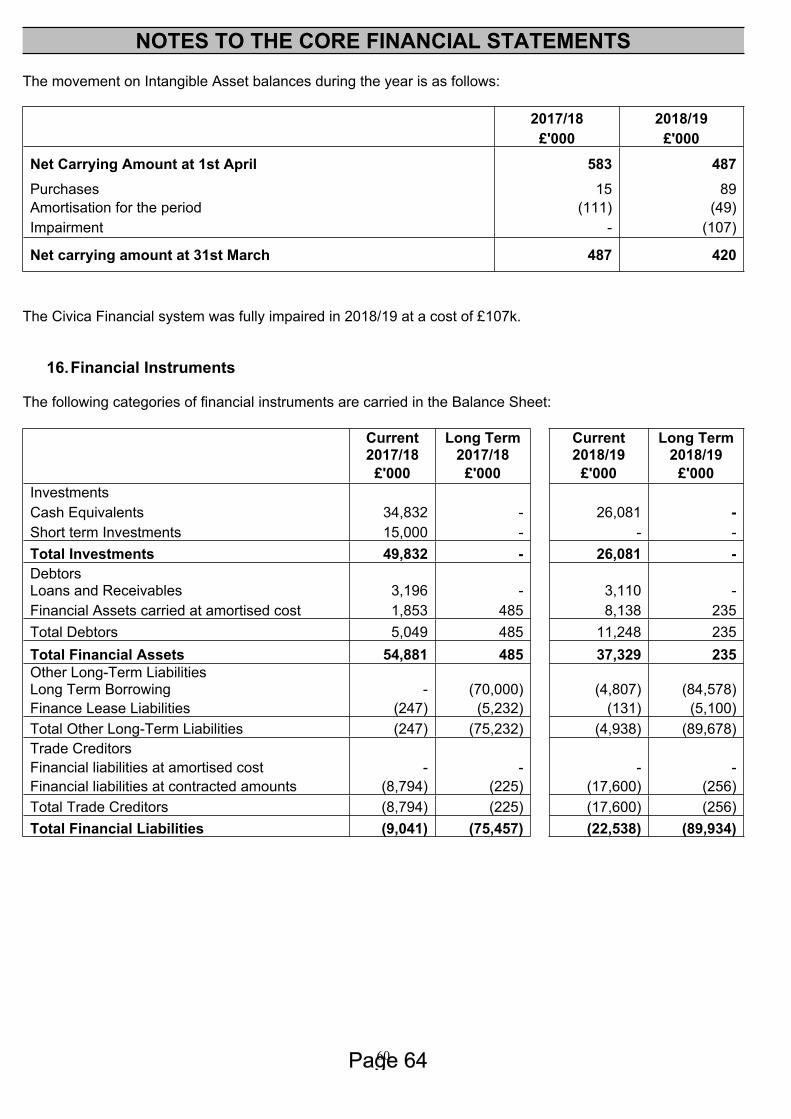
60
NOTES TO THE CORE FINANCIAL STATEMENTS
The movement on Intangible Asset balances during the year is as follows:
2017/18 2018/19 £'000 £'000
Net Carrying Amount at 1st April 583 487Purchases 15 89Amortisation for the period (111) (49)Impairment - (107)
Net carrying amount at 31st March 487 420
The Civica Financial system was fully impaired in 2018/19 at a cost of £107k.
16.Financial Instruments
The following categories of financial instruments are carried in the Balance Sheet:
Current Long Term Current Long Term 2017/18 2017/18 2018/19 2018/19 £'000 £'000 £'000 £'000
Investments Cash Equivalents 34,832 - 26,081 -Short term Investments 15,000 - - -Total Investments 49,832 - 26,081 -Debtors Loans and Receivables 3,196 - 3,110 -Financial Assets carried at amortised cost 1,853 485 8,138 235Total Debtors 5,049 485 11,248 235Total Financial Assets 54,881 485 37,329 235Other Long-Term Liabilities Long Term Borrowing - (70,000) (4,807) (84,578)Finance Lease Liabilities (247) (5,232) (131) (5,100)Total Other Long-Term Liabilities (247) (75,232) (4,938) (89,678)Trade Creditors Financial liabilities at amortised cost - - - -Financial liabilities at contracted amounts (8,794) (225) (17,600) (256)Total Trade Creditors (8,794) (225) (17,600) (256)Total Financial Liabilities (9,041) (75,457) (22,538) (89,934)
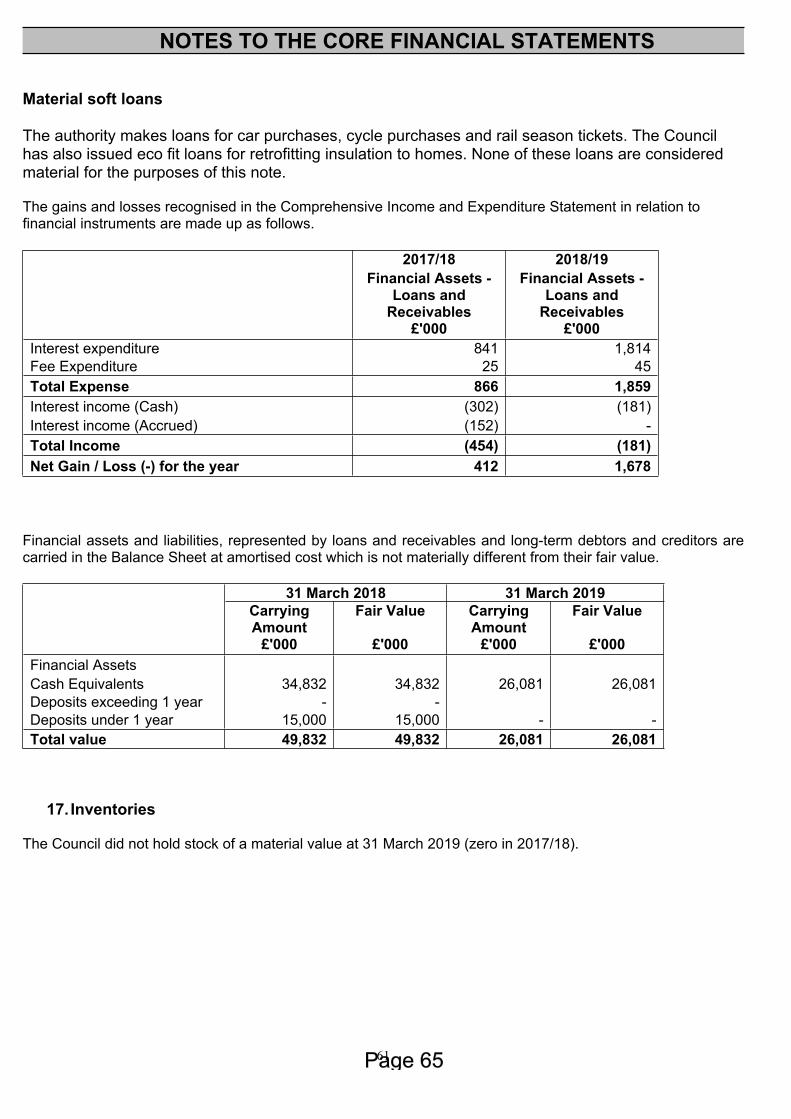
61
NOTES TO THE CORE FINANCIAL STATEMENTS
Material soft loans
The authority makes loans for car purchases, cycle purchases and rail season tickets. The Council has also issued eco fit loans for retrofitting insulation to homes. None of these loans are considered material for the purposes of this note.
The gains and losses recognised in the Comprehensive Income and Expenditure Statement in relation to financial instruments are made up as follows.
2017/18 2018/19 Financial Assets -
Loans and Receivables
Financial Assets - Loans and
Receivables £'000 £'000Interest expenditure 841 1,814Fee Expenditure 25 45Total Expense 866 1,859Interest income (Cash) (302) (181)Interest income (Accrued) (152) -Total Income (454) (181)Net Gain / Loss (-) for the year 412 1,678
Financial assets and liabilities, represented by loans and receivables and long-term debtors and creditors are carried in the Balance Sheet at amortised cost which is not materially different from their fair value.
31 March 2018 31 March 2019 Carrying
AmountFair Value Carrying
AmountFair Value
£'000 £'000 £'000 £'000Financial Assets Cash Equivalents 34,832 34,832 26,081 26,081Deposits exceeding 1 year - - Deposits under 1 year 15,000 15,000 - -Total value 49,832 49,832 26,081 26,081
17. Inventories
The Council did not hold stock of a material value at 31 March 2019 (zero in 2017/18).
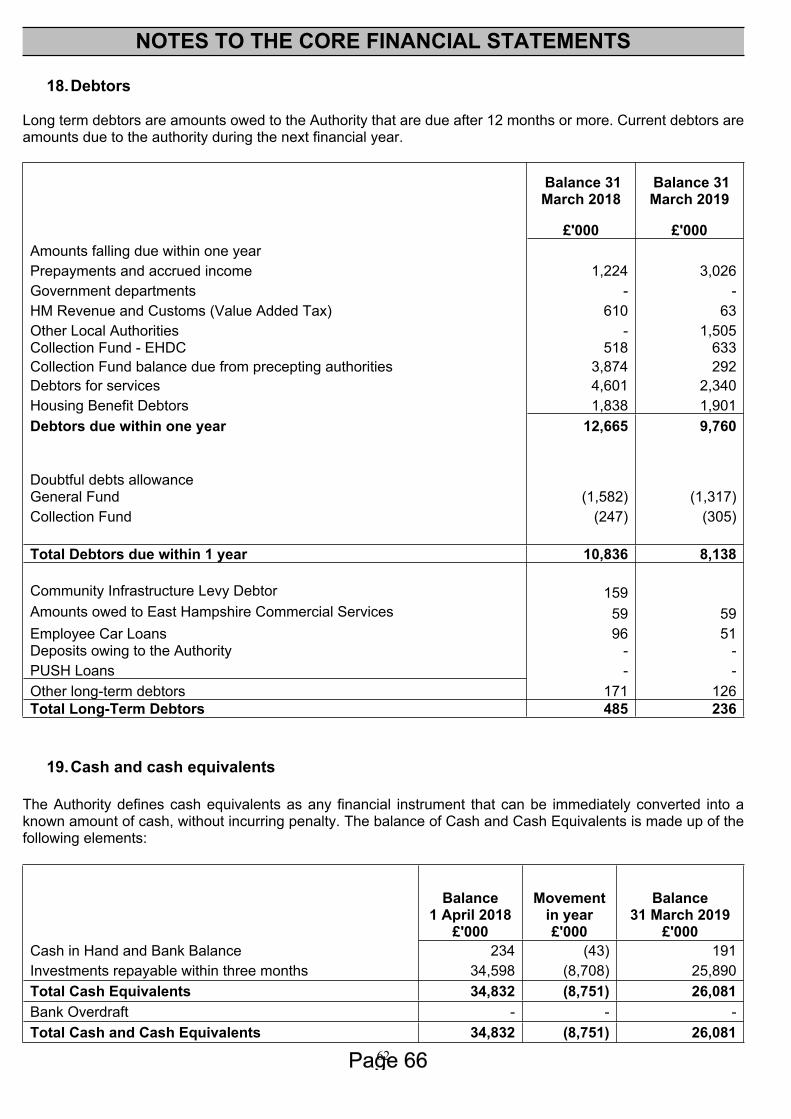
62
NOTES TO THE CORE FINANCIAL STATEMENTS
18.Debtors
Long term debtors are amounts owed to the Authority that are due after 12 months or more. Current debtors are amounts due to the authority during the next financial year.
Balance 31 March 2018
Balance 31 March 2019
£'000 £'000Amounts falling due within one year Prepayments and accrued income 1,224 3,026Government departments - - HM Revenue and Customs (Value Added Tax) 610 63Other Local Authorities - 1,505Collection Fund - EHDC 518 633Collection Fund balance due from precepting authorities 3,874 292Debtors for services 4,601 2,340Housing Benefit Debtors 1,838 1,901Debtors due within one year 12,665 9,760
Doubtful debts allowance General Fund (1,582) (1,317)Collection Fund (247) (305)
Total Debtors due within 1 year 10,836 8,138
Community Infrastructure Levy Debtor 159 Amounts owed to East Hampshire Commercial Services 59 59Employee Car Loans 96 51Deposits owing to the Authority - - PUSH Loans - - Other long-term debtors 171 126Total Long-Term Debtors 485 236
19.Cash and cash equivalents
The Authority defines cash equivalents as any financial instrument that can be immediately converted into a known amount of cash, without incurring penalty. The balance of Cash and Cash Equivalents is made up of the following elements:
Balance 1 April 2018
Movement in year
Balance 31 March 2019
£'000 £'000 £'000Cash in Hand and Bank Balance 234 (43) 191Investments repayable within three months 34,598 (8,708) 25,890Total Cash Equivalents 34,832 (8,751) 26,081Bank Overdraft - - -Total Cash and Cash Equivalents 34,832 (8,751) 26,081
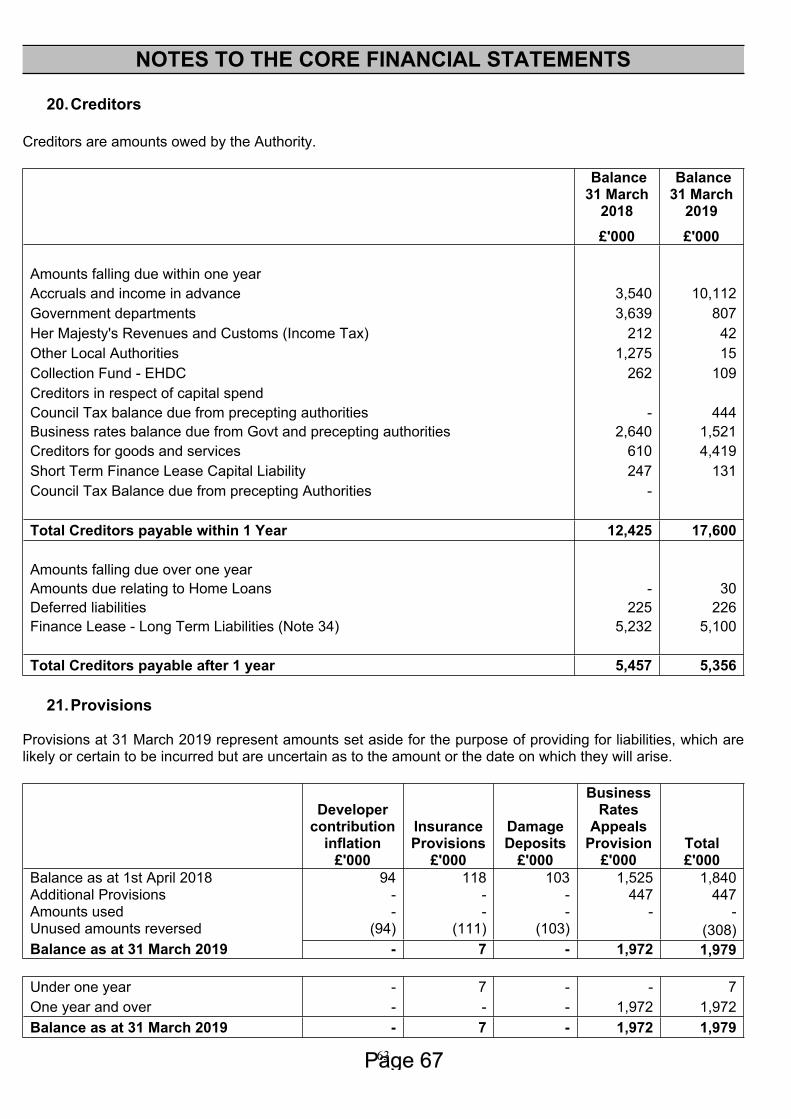
63
NOTES TO THE CORE FINANCIAL STATEMENTS
20.Creditors
Creditors are amounts owed by the Authority.
Balance 31 March
2018
Balance 31 March
2019 £'000 £'000
Amounts falling due within one year Accruals and income in advance 3,540 10,112Government departments 3,639 807Her Majesty's Revenues and Customs (Income Tax) 212 42Other Local Authorities 1,275 15Collection Fund - EHDC 262 109Creditors in respect of capital spend Council Tax balance due from precepting authorities - 444Business rates balance due from Govt and precepting authorities 2,640 1,521Creditors for goods and services 610 4,419Short Term Finance Lease Capital Liability 247 131Council Tax Balance due from precepting Authorities -
Total Creditors payable within 1 Year 12,425 17,600
Amounts falling due over one year Amounts due relating to Home Loans - 30Deferred liabilities 225 226Finance Lease - Long Term Liabilities (Note 34) 5,232 5,100
Total Creditors payable after 1 year 5,457 5,356
21.Provisions
Provisions at 31 March 2019 represent amounts set aside for the purpose of providing for liabilities, which are likely or certain to be incurred but are uncertain as to the amount or the date on which they will arise.
Developer
contribution inflation
Insurance Provisions
Damage Deposits
Business Rates
Appeals Provision Total
£'000 £'000 £'000 £'000 £'000Balance as at 1st April 2018 94 118 103 1,525 1,840Additional Provisions - - - 447 447Amounts used - - - - -Unused amounts reversed (94) (111) (103) (308)Balance as at 31 March 2019 - 7 - 1,972 1,979
Under one year - 7 - - 7One year and over - - - 1,972 1,972Balance as at 31 March 2019 - 7 - 1,972 1,979
64
NOTES TO THE CORE FINANCIAL STATEMENTS
Business Rates Appeals Provision
Businesses in the East Hampshire District Council area are entitled to appeal against the rating valuation of their property. The Council bears 40% of the cost of business rates appeals. The provision is created on the basis of known appeals that have yet to be settled.
Municipal Mutual Insurance
Municipal Mutual Insurance (MMI) was a local authority owned mutual providing insurance to the Council which ceased business in 1992. However, MMI is still liable for certain insurance claims which, if not covered by MMI's remaining assets, will be apportioned between the member authorities. A Supreme Court ruling in March 2012 gave certainty that MMI will incur full liability for Mesothelioma claims, significantly increasing the likelihood that costs will be incurred by the Council. The latest estimate of potential liability is Nil and the prior year provision of £110,000 has been released.
Damage Deposits
In order to meet statutory obligations for reducing homelessness, the Council will guarantee damage deposits on behalf of tenants moving into privately rented accommodation where certain criteria are met.
Developer Contributions
The Council holds developer contributions which, as part of the original agreements, the Council applies inflationary increases to ensure that the value of the contribution does not diminish over time. This provision has been created to provide for inflation costs.
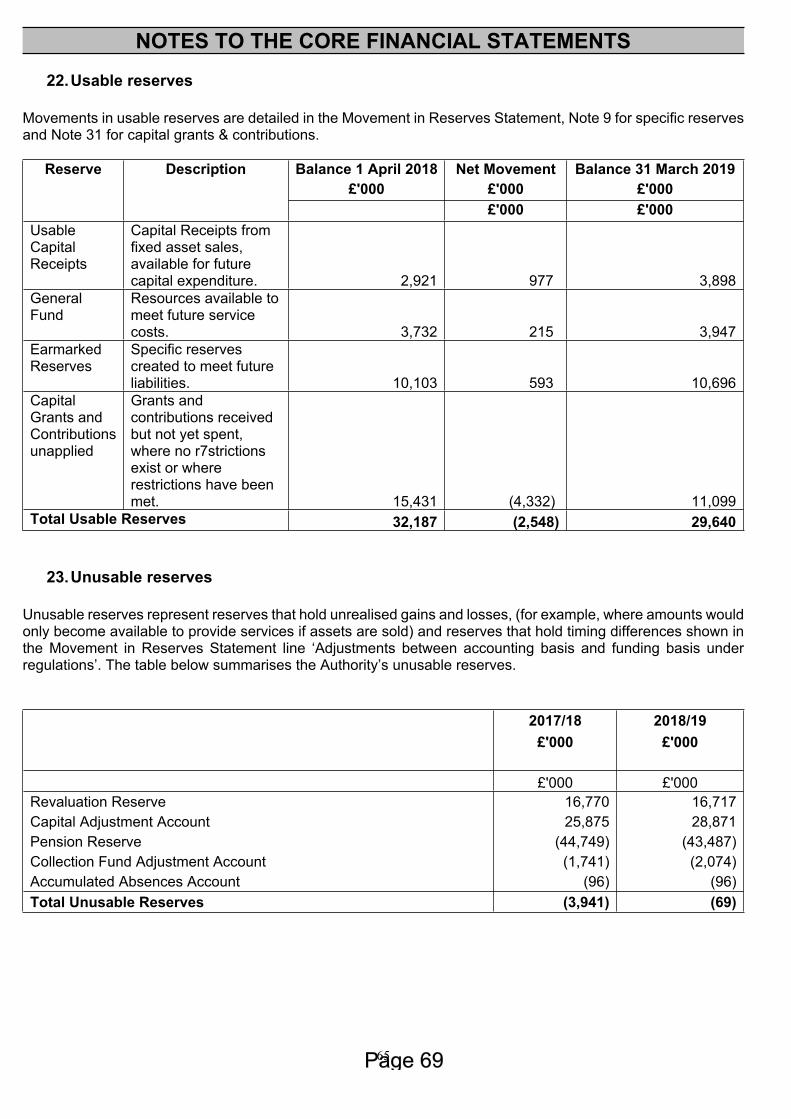
65
NOTES TO THE CORE FINANCIAL STATEMENTS
22.Usable reserves
Movements in usable reserves are detailed in the Movement in Reserves Statement, Note 9 for specific reserves and Note 31 for capital grants & contributions.
Reserve Description Balance 1 April 2018 Net Movement Balance 31 March 2019 £'000 £'000 £'000 £'000 £'000
Usable Capital Receipts
Capital Receipts from fixed asset sales, available for future capital expenditure. 2,921 977 3,898
General Fund
Resources available to meet future service costs. 3,732 215 3,947
Earmarked Reserves
Specific reserves created to meet future liabilities. 10,103 593 10,696
Capital Grants and Contributions unapplied
Grants and contributions received but not yet spent, where no r7strictions exist or where restrictions have been met. 15,431 (4,332) 11,099
Total Usable Reserves 32,187 (2,548) 29,640
23.Unusable reserves
Unusable reserves represent reserves that hold unrealised gains and losses, (for example, where amounts would only become available to provide services if assets are sold) and reserves that hold timing differences shown in the Movement in Reserves Statement line ‘Adjustments between accounting basis and funding basis under regulations’. The table below summarises the Authority’s unusable reserves.
2017/18 2018/19 £'000 £'000 £'000 £'000Revaluation Reserve 16,770 16,717Capital Adjustment Account 25,875 28,871Pension Reserve (44,749) (43,487)Collection Fund Adjustment Account (1,741) (2,074)Accumulated Absences Account (96) (96)Total Unusable Reserves (3,941) (69)
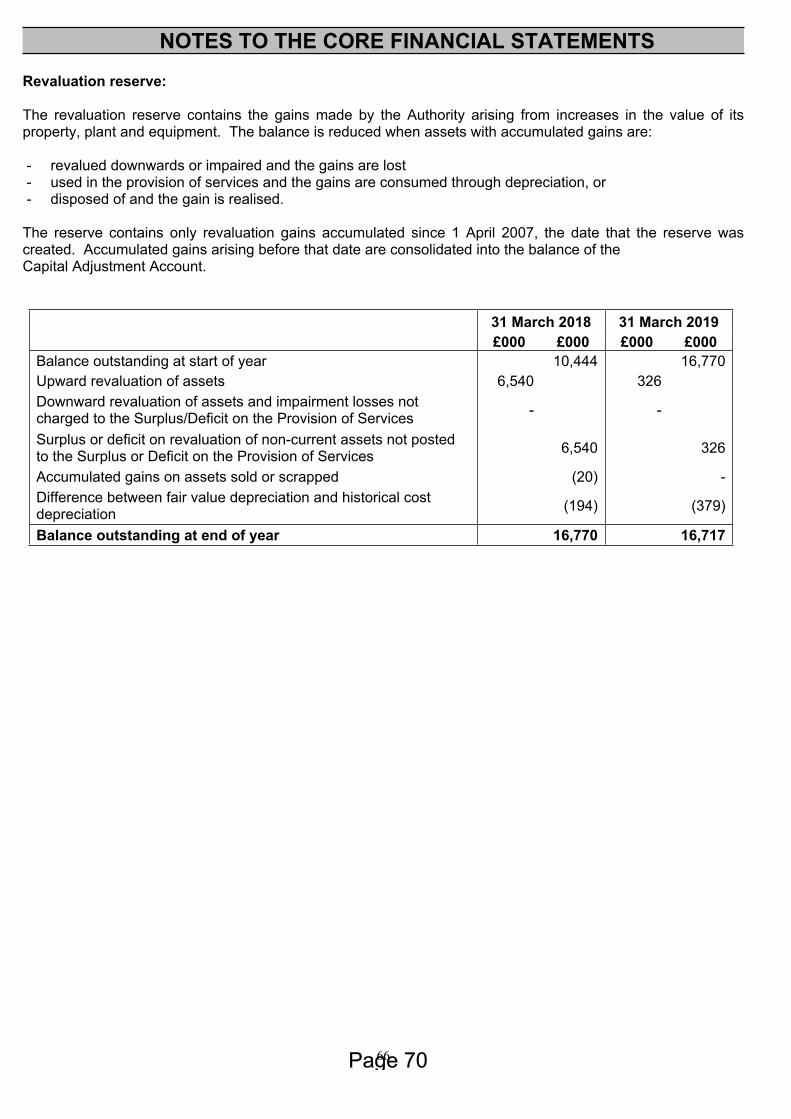
66
NOTES TO THE CORE FINANCIAL STATEMENTS
Revaluation reserve:
The revaluation reserve contains the gains made by the Authority arising from increases in the value of its property, plant and equipment. The balance is reduced when assets with accumulated gains are:
- revalued downwards or impaired and the gains are lost- used in the provision of services and the gains are consumed through depreciation, or- disposed of and the gain is realised.
The reserve contains only revaluation gains accumulated since 1 April 2007, the date that the reserve was created. Accumulated gains arising before that date are consolidated into the balance of the Capital Adjustment Account.
31 March 2018 31 March 2019 £000 £000 £000 £000Balance outstanding at start of year 10,444 16,770 Upward revaluation of assets 6,540 326Downward revaluation of assets and impairment losses not charged to the Surplus/Deficit on the Provision of Services - -
Surplus or deficit on revaluation of non-current assets not posted to the Surplus or Deficit on the Provision of Services 6,540 326
Accumulated gains on assets sold or scrapped (20) -Difference between fair value depreciation and historical cost depreciation (194) (379)
Balance outstanding at end of year 16,770 16,717
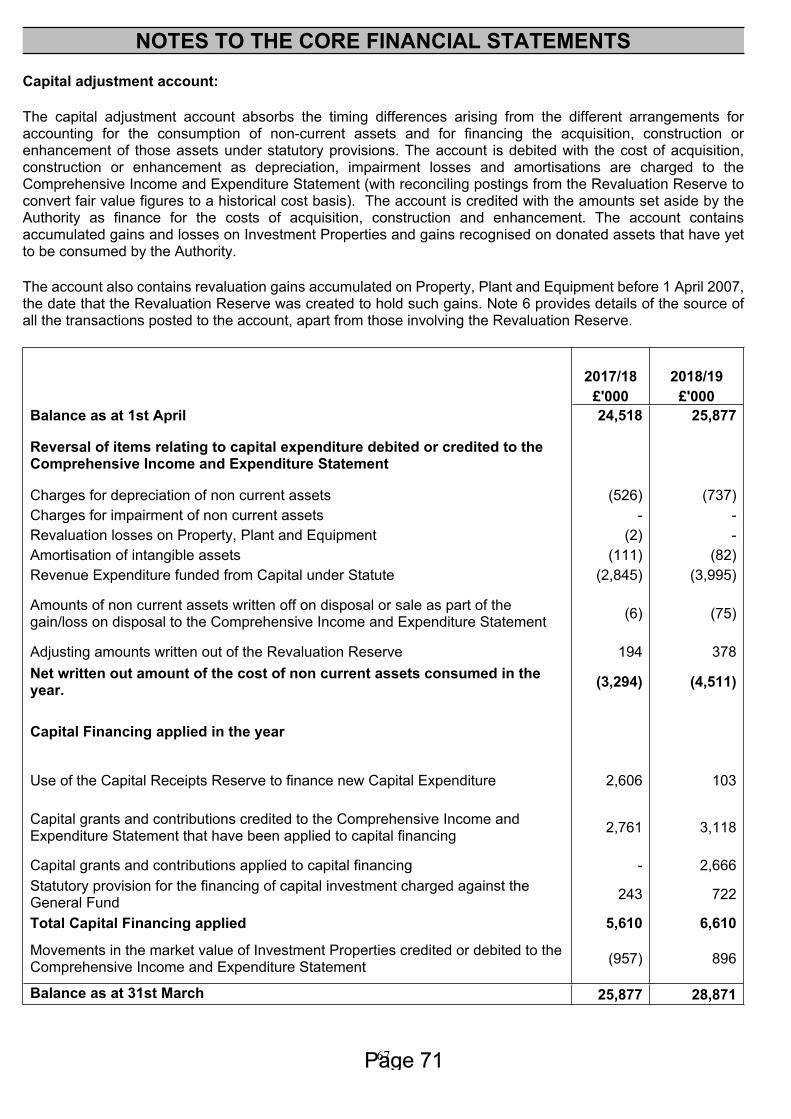
67
NOTES TO THE CORE FINANCIAL STATEMENTS
Capital adjustment account:
The capital adjustment account absorbs the timing differences arising from the different arrangements for accounting for the consumption of non-current assets and for financing the acquisition, construction or enhancement of those assets under statutory provisions. The account is debited with the cost of acquisition, construction or enhancement as depreciation, impairment losses and amortisations are charged to the Comprehensive Income and Expenditure Statement (with reconciling postings from the Revaluation Reserve to convert fair value figures to a historical cost basis). The account is credited with the amounts set aside by the Authority as finance for the costs of acquisition, construction and enhancement. The account contains accumulated gains and losses on Investment Properties and gains recognised on donated assets that have yet to be consumed by the Authority.
The account also contains revaluation gains accumulated on Property, Plant and Equipment before 1 April 2007, the date that the Revaluation Reserve was created to hold such gains. Note 6 provides details of the source of all the transactions posted to the account, apart from those involving the Revaluation Reserve.
2017/18 2018/19 £'000 £'000
Balance as at 1st April 24,518 25,877
Reversal of items relating to capital expenditure debited or credited to the Comprehensive Income and Expenditure Statement
Charges for depreciation of non current assets (526) (737)Charges for impairment of non current assets - - Revaluation losses on Property, Plant and Equipment (2) - Amortisation of intangible assets (111) (82)Revenue Expenditure funded from Capital under Statute (2,845) (3,995)
Amounts of non current assets written off on disposal or sale as part of the gain/loss on disposal to the Comprehensive Income and Expenditure Statement (6) (75)
Adjusting amounts written out of the Revaluation Reserve 194 378Net written out amount of the cost of non current assets consumed in the year. (3,294) (4,511)
Capital Financing applied in the year
Use of the Capital Receipts Reserve to finance new Capital Expenditure 2,606 103
Capital grants and contributions credited to the Comprehensive Income and Expenditure Statement that have been applied to capital financing 2,761 3,118
Capital grants and contributions applied to capital financing - 2,666Statutory provision for the financing of capital investment charged against the General Fund 243 722
Total Capital Financing applied 5,610 6,610
Movements in the market value of Investment Properties credited or debited to the Comprehensive Income and Expenditure Statement (957) 896
Balance as at 31st March 25,877 28,871
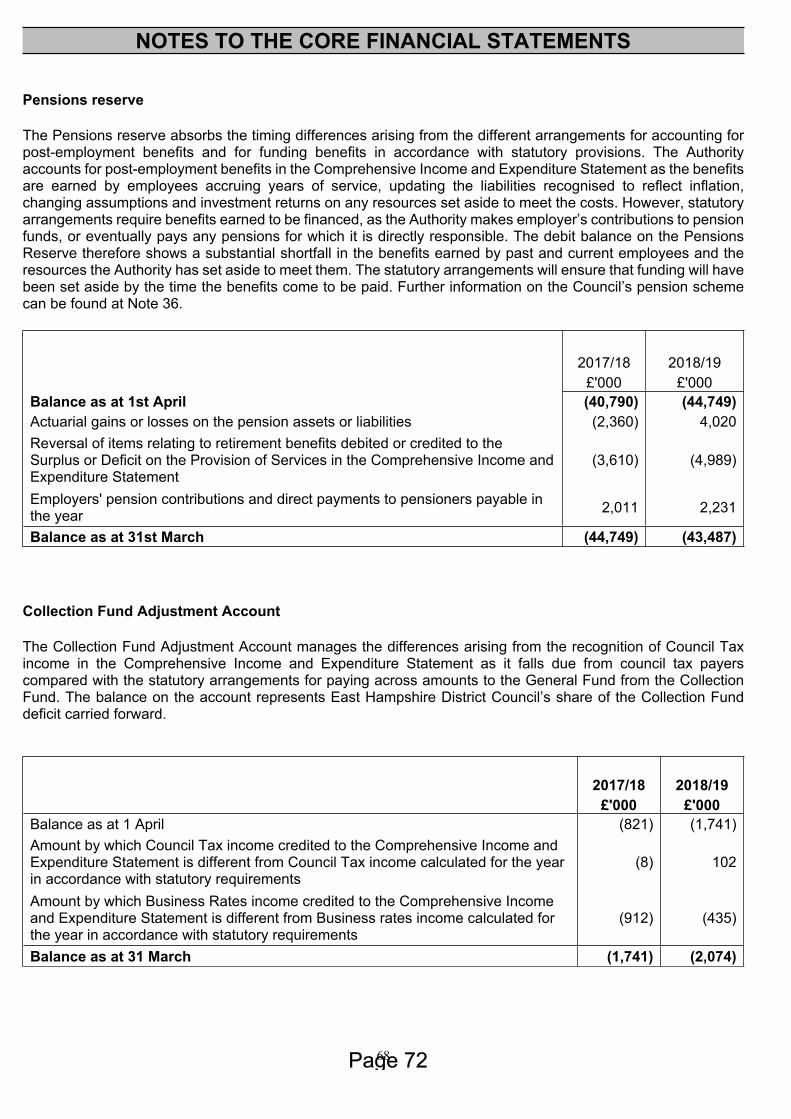
68
NOTES TO THE CORE FINANCIAL STATEMENTS
Pensions reserve
The Pensions reserve absorbs the timing differences arising from the different arrangements for accounting for post-employment benefits and for funding benefits in accordance with statutory provisions. The Authority accounts for post-employment benefits in the Comprehensive Income and Expenditure Statement as the benefits are earned by employees accruing years of service, updating the liabilities recognised to reflect inflation, changing assumptions and investment returns on any resources set aside to meet the costs. However, statutory arrangements require benefits earned to be financed, as the Authority makes employer’s contributions to pension funds, or eventually pays any pensions for which it is directly responsible. The debit balance on the Pensions Reserve therefore shows a substantial shortfall in the benefits earned by past and current employees and the resources the Authority has set aside to meet them. The statutory arrangements will ensure that funding will have been set aside by the time the benefits come to be paid. Further information on the Council’s pension scheme can be found at Note 36.
2017/18 2018/19 £'000 £'000Balance as at 1st April (40,790) (44,749)Actuarial gains or losses on the pension assets or liabilities (2,360) 4,020Reversal of items relating to retirement benefits debited or credited to the Surplus or Deficit on the Provision of Services in the Comprehensive Income and Expenditure Statement
(3,610) (4,989)
Employers' pension contributions and direct payments to pensioners payable in the year 2,011 2,231
Balance as at 31st March (44,749) (43,487)
Collection Fund Adjustment Account
The Collection Fund Adjustment Account manages the differences arising from the recognition of Council Tax income in the Comprehensive Income and Expenditure Statement as it falls due from council tax payers compared with the statutory arrangements for paying across amounts to the General Fund from the Collection Fund. The balance on the account represents East Hampshire District Council’s share of the Collection Fund deficit carried forward.
2017/18 2018/19 £'000 £'000Balance as at 1 April (821) (1,741)Amount by which Council Tax income credited to the Comprehensive Income and Expenditure Statement is different from Council Tax income calculated for the year in accordance with statutory requirements
(8) 102
Amount by which Business Rates income credited to the Comprehensive Income and Expenditure Statement is different from Business rates income calculated for the year in accordance with statutory requirements
(912) (435)
Balance as at 31 March (1,741) (2,074)
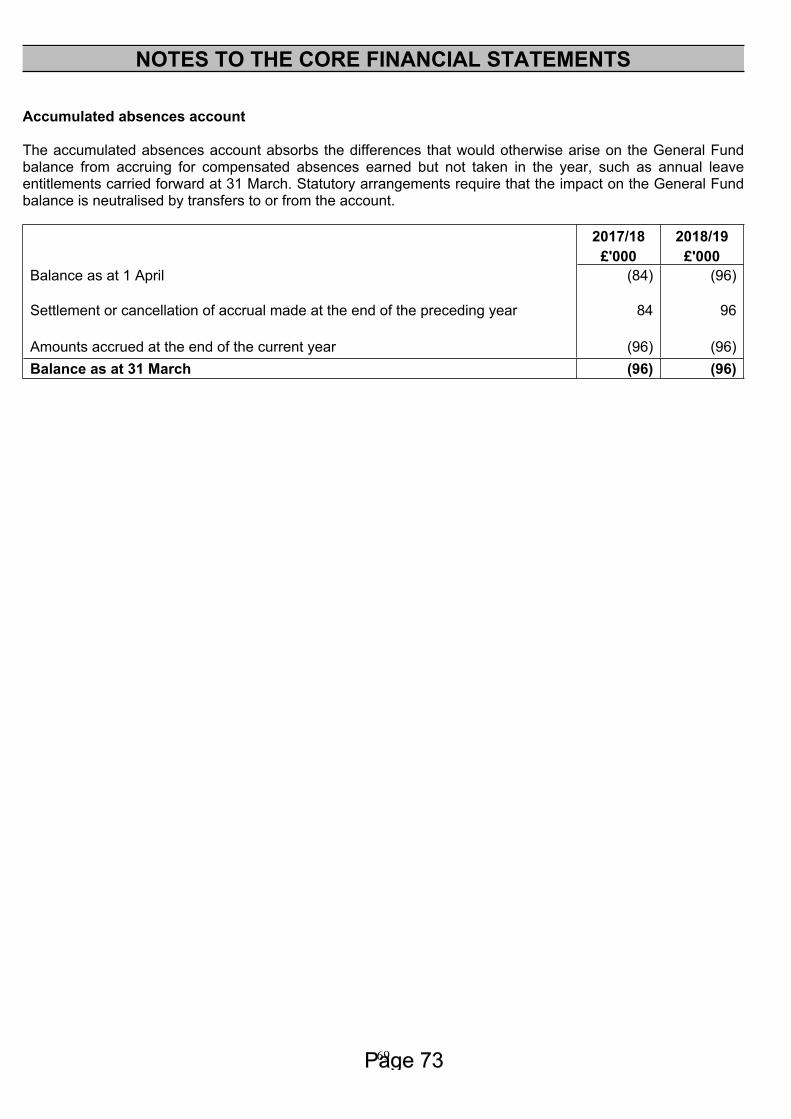
69
NOTES TO THE CORE FINANCIAL STATEMENTS
Accumulated absences account
The accumulated absences account absorbs the differences that would otherwise arise on the General Fund balance from accruing for compensated absences earned but not taken in the year, such as annual leave entitlements carried forward at 31 March. Statutory arrangements require that the impact on the General Fund balance is neutralised by transfers to or from the account.
2017/18 2018/19 £'000 £'000Balance as at 1 April (84) (96)
Settlement or cancellation of accrual made at the end of the preceding year 84 96
Amounts accrued at the end of the current year (96) (96)Balance as at 31 March (96) (96)
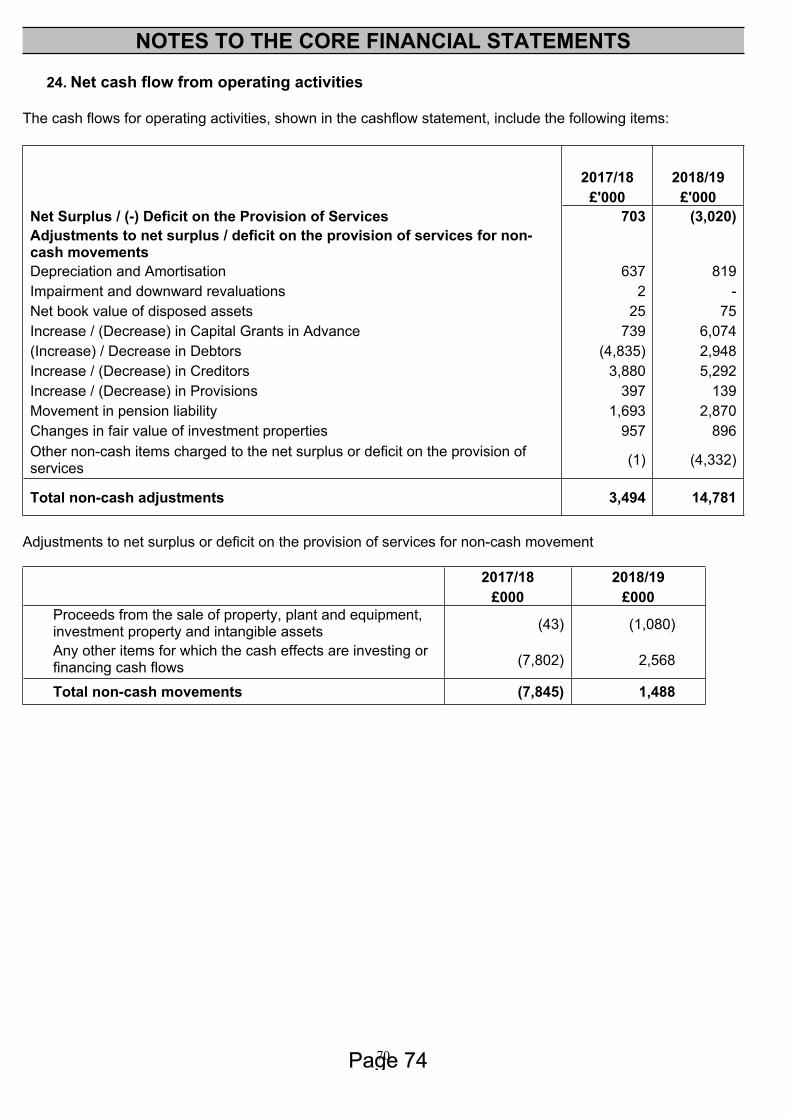
70
NOTES TO THE CORE FINANCIAL STATEMENTS
24. Net cash flow from operating activities
The cash flows for operating activities, shown in the cashflow statement, include the following items:
2017/18 2018/19 £'000 £'000
Net Surplus / (-) Deficit on the Provision of Services 703 (3,020)Adjustments to net surplus / deficit on the provision of services for non-cash movements
Depreciation and Amortisation 637 819Impairment and downward revaluations 2 - Net book value of disposed assets 25 75Increase / (Decrease) in Capital Grants in Advance 739 6,074(Increase) / Decrease in Debtors (4,835) 2,948Increase / (Decrease) in Creditors 3,880 5,292Increase / (Decrease) in Provisions 397 139Movement in pension liability 1,693 2,870Changes in fair value of investment properties 957 896Other non-cash items charged to the net surplus or deficit on the provision of services (1) (4,332)
Total non-cash adjustments 3,494 14,781
Adjustments to net surplus or deficit on the provision of services for non-cash movement
2017/18 2018/19 £000 £000
Proceeds from the sale of property, plant and equipment, investment property and intangible assets (43) (1,080)
Any other items for which the cash effects are investing or financing cash flows (7,802) 2,568
Total non-cash movements (7,845) 1,488
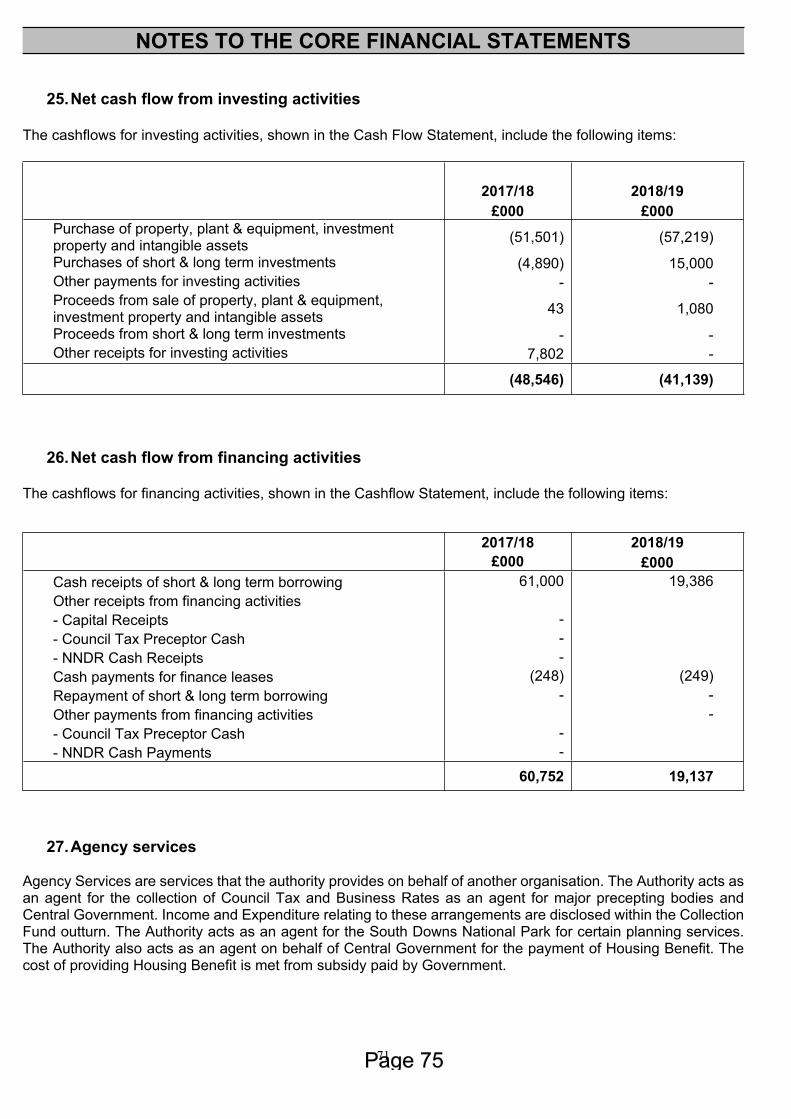
71
NOTES TO THE CORE FINANCIAL STATEMENTS
25.Net cash flow from investing activities
The cashflows for investing activities, shown in the Cash Flow Statement, include the following items:
2017/18 2018/19 £000 £000
Purchase of property, plant & equipment, investment property and intangible assets (51,501) (57,219)
Purchases of short & long term investments (4,890) 15,000 Other payments for investing activities - -
Proceeds from sale of property, plant & equipment, investment property and intangible assets 43 1,080
Proceeds from short & long term investments - - Other receipts for investing activities 7,802 -
(48,546) (41,139)
26.Net cash flow from financing activities
The cashflows for financing activities, shown in the Cashflow Statement, include the following items:
2017/18 2018/19 £000 £000 Cash receipts of short & long term borrowing 61,000 19,386 Other receipts from financing activities - Capital Receipts - - Council Tax Preceptor Cash - - NNDR Cash Receipts - Cash payments for finance leases (248) (249) Repayment of short & long term borrowing - - Other payments from financing activities - - Council Tax Preceptor Cash - - NNDR Cash Payments -
60,752 19,137
27.Agency services
Agency Services are services that the authority provides on behalf of another organisation. The Authority acts as an agent for the collection of Council Tax and Business Rates as an agent for major precepting bodies and Central Government. Income and Expenditure relating to these arrangements are disclosed within the Collection Fund outturn. The Authority acts as an agent for the South Downs National Park for certain planning services. The Authority also acts as an agent on behalf of Central Government for the payment of Housing Benefit. The cost of providing Housing Benefit is met from subsidy paid by Government.
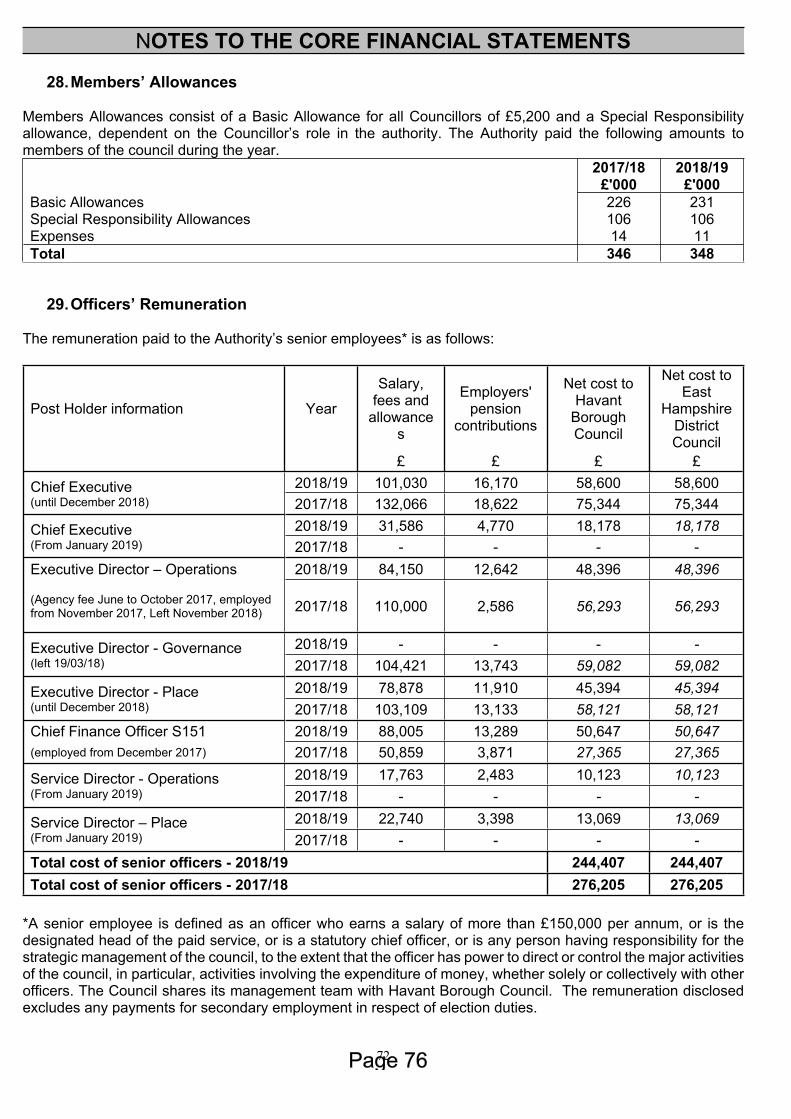
72
NOTES TO THE CORE FINANCIAL STATEMENTS
28.Members’ Allowances
Members Allowances consist of a Basic Allowance for all Councillors of £5,200 and a Special Responsibility allowance, dependent on the Councillor’s role in the authority. The Authority paid the following amounts to members of the council during the year. 2017/18 2018/19 £'000 £'000Basic Allowances 226 231Special Responsibility Allowances 106 106Expenses 14 11Total 346 348
29.Officers’ Remuneration
The remuneration paid to the Authority’s senior employees* is as follows:
Post Holder information Year
Salary, fees and
allowances
Employers' pension
contributions
Net cost to Havant
Borough Council
Net cost to East
Hampshire District Council
£ £ £ £2018/19 101,030 16,170 58,600 58,600Chief Executive
(until December 2018) 2017/18 132,066 18,622 75,344 75,3442018/19 31,586 4,770 18,178 18,178Chief Executive
(From January 2019) 2017/18 - - - -Executive Director – Operations 2018/19 84,150 12,642 48,396 48,396
(Agency fee June to October 2017, employed from November 2017, Left November 2018) 2017/18 110,000 2,586 56,293 56,293
2018/19 - - - -Executive Director - Governance (left 19/03/18) 2017/18 104,421 13,743 59,082 59,082
2018/19 78,878 11,910 45,394 45,394Executive Director - Place (until December 2018) 2017/18 103,109 13,133 58,121 58,121Chief Finance Officer S151 2018/19 88,005 13,289 50,647 50,647(employed from December 2017) 2017/18 50,859 3,871 27,365 27,365
2018/19 17,763 2,483 10,123 10,123Service Director - Operations(From January 2019) 2017/18 - - - -
2018/19 22,740 3,398 13,069 13,069Service Director – Place (From January 2019) 2017/18 - - - -Total cost of senior officers - 2018/19 244,407 244,407Total cost of senior officers - 2017/18 276,205 276,205
*A senior employee is defined as an officer who earns a salary of more than £150,000 per annum, or is the designated head of the paid service, or is a statutory chief officer, or is any person having responsibility for the strategic management of the council, to the extent that the officer has power to direct or control the major activities of the council, in particular, activities involving the expenditure of money, whether solely or collectively with other officers. The Council shares its management team with Havant Borough Council. The remuneration disclosed excludes any payments for secondary employment in respect of election duties.
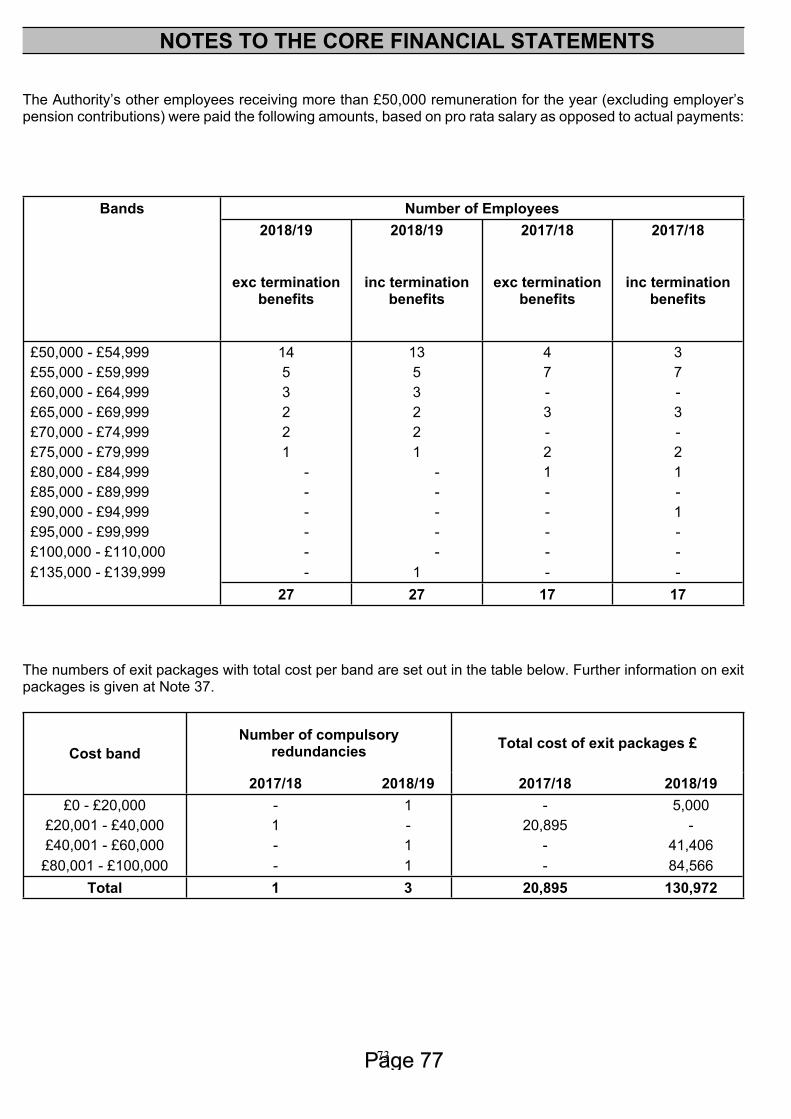
73
NOTES TO THE CORE FINANCIAL STATEMENTS
The Authority’s other employees receiving more than £50,000 remuneration for the year (excluding employer’s pension contributions) were paid the following amounts, based on pro rata salary as opposed to actual payments:
Bands Number of Employees 2018/19 2018/19 2017/18 2017/18
exc termination benefits
inc termination benefits
exc termination benefits
inc termination benefits
£50,000 - £54,999 14 13 4 3£55,000 - £59,999 5 5 7 7£60,000 - £64,999 3 3 - -£65,000 - £69,999 2 2 3 3£70,000 - £74,999 2 2 - -£75,000 - £79,999 1 1 2 2£80,000 - £84,999 - - 1 1£85,000 - £89,999 - - - -£90,000 - £94,999 - - - 1£95,000 - £99,999 - - - -£100,000 - £110,000 - - - -£135,000 - £139,999 - 1 - - 27 27 17 17
The numbers of exit packages with total cost per band are set out in the table below. Further information on exit packages is given at Note 37.
Number of compulsory redundancies Total cost of exit packages £
Cost band
2017/18 2018/19 2017/18 2018/19£0 - £20,000 - 1 - 5,000
£20,001 - £40,000 1 - 20,895 -£40,001 - £60,000 - 1 - 41,406
£80,001 - £100,000 - 1 - 84,566Total 1 3 20,895 130,972
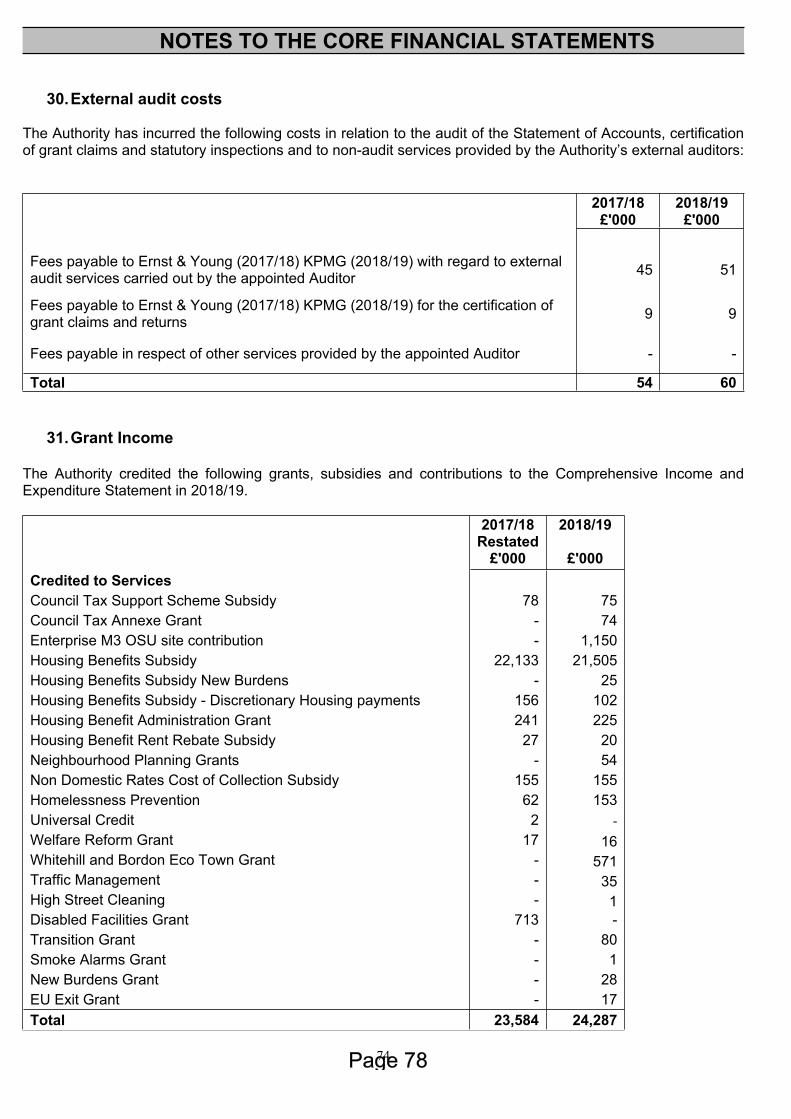
74
NOTES TO THE CORE FINANCIAL STATEMENTS
30.External audit costs
The Authority has incurred the following costs in relation to the audit of the Statement of Accounts, certification of grant claims and statutory inspections and to non-audit services provided by the Authority’s external auditors:
2017/18 2018/19 £'000 £'000 Fees payable to Ernst & Young (2017/18) KPMG (2018/19) with regard to external audit services carried out by the appointed Auditor 45 51
Fees payable to Ernst & Young (2017/18) KPMG (2018/19) for the certification of grant claims and returns 9 9
Fees payable in respect of other services provided by the appointed Auditor - -
Total 54 60
31.Grant Income
The Authority credited the following grants, subsidies and contributions to the Comprehensive Income and Expenditure Statement in 2018/19.
2017/18Restated
2018/19
£'000 £'000Credited to Services Council Tax Support Scheme Subsidy 78 75Council Tax Annexe Grant - 74Enterprise M3 OSU site contribution - 1,150Housing Benefits Subsidy 22,133 21,505Housing Benefits Subsidy New Burdens - 25Housing Benefits Subsidy - Discretionary Housing payments 156 102Housing Benefit Administration Grant 241 225Housing Benefit Rent Rebate Subsidy 27 20Neighbourhood Planning Grants - 54Non Domestic Rates Cost of Collection Subsidy 155 155Homelessness Prevention 62 153Universal Credit 2 -Welfare Reform Grant 17 16Whitehill and Bordon Eco Town Grant - 571Traffic Management - 35High Street Cleaning - 1Disabled Facilities Grant 713 -Transition Grant - 80Smoke Alarms Grant - 1New Burdens Grant - 28EU Exit Grant - 17Total 23,584 24,287
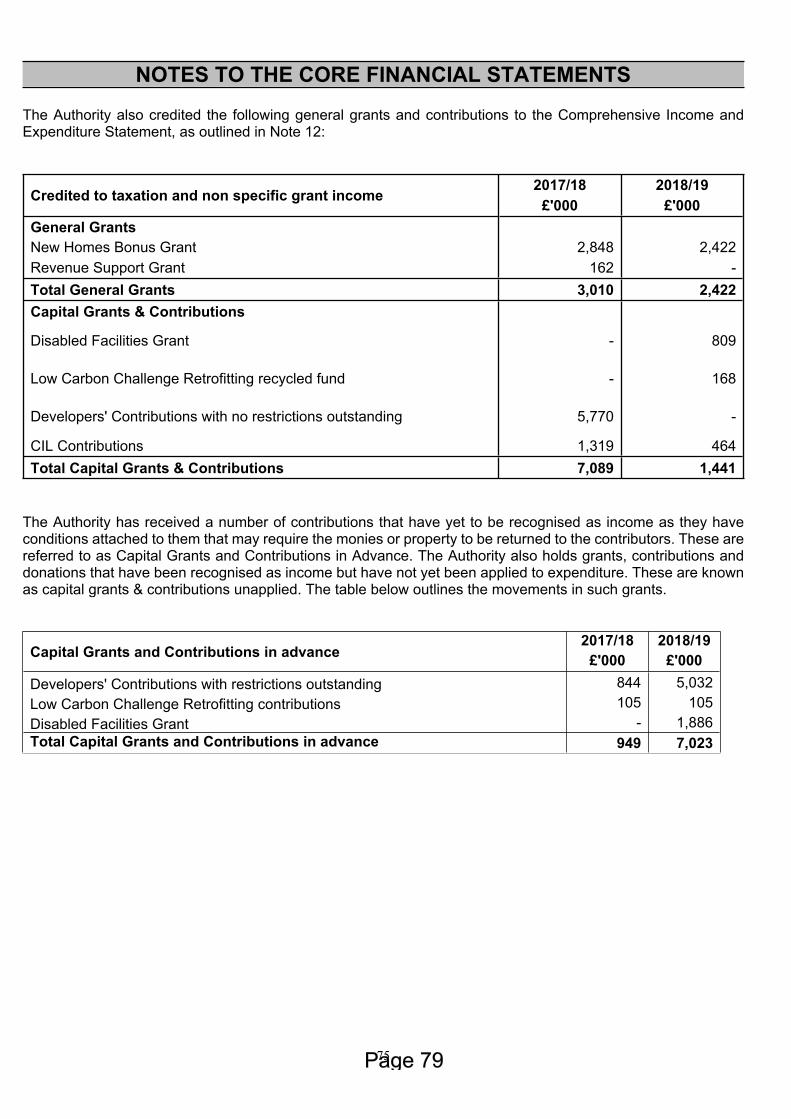
75
NOTES TO THE CORE FINANCIAL STATEMENTS
The Authority also credited the following general grants and contributions to the Comprehensive Income and Expenditure Statement, as outlined in Note 12:
2017/18 2018/19Credited to taxation and non specific grant income £'000 £'000General Grants New Homes Bonus Grant 2,848 2,422Revenue Support Grant 162 - Total General Grants 3,010 2,422Capital Grants & Contributions
Disabled Facilities Grant - 809
Low Carbon Challenge Retrofitting recycled fund - 168
Developers' Contributions with no restrictions outstanding 5,770 -
CIL Contributions 1,319 464Total Capital Grants & Contributions 7,089 1,441
The Authority has received a number of contributions that have yet to be recognised as income as they have conditions attached to them that may require the monies or property to be returned to the contributors. These are referred to as Capital Grants and Contributions in Advance. The Authority also holds grants, contributions and donations that have been recognised as income but have not yet been applied to expenditure. These are known as capital grants & contributions unapplied. The table below outlines the movements in such grants.
2017/18 2018/19Capital Grants and Contributions in advance £'000 £'000Developers' Contributions with restrictions outstanding 844 5,032Low Carbon Challenge Retrofitting contributions 105 105Disabled Facilities Grant - 1,886Total Capital Grants and Contributions in advance 949 7,023
76
NOTES TO THE CORE FINANCIAL STATEMENTS
32.Related Parties
The Authority is required to disclose material transactions with related parties – bodies or individuals that have the potential to control or influence the council or to be controlled or influenced by the council. Disclosure of these transactions allows readers to assess the extent to which the council might have been constrained in its ability to operate independently or might have secured the ability to limit another party’s ability to bargain freely with the Authority.
Central Government
Central government has significant influence over the general operations of the Authority – it is responsible for providing the statutory framework within which the Authority operates, provides the majority of its funding in the form of grants and prescribes the terms of many of the transactions that the Authority has with other parties (e.g. council tax bills, housing benefits). Grants received from government departments are detailed in Note 31.
Members
Members of the council have direct control over the council’s financial and operating policies. The total of members’ allowances paid in 2018/19 is shown in Note 28. During 2018/19, no works or services were commissioned from companies in which Members had an interest. No grants were awarded to organisations in which Members were on the governing body. The relevant members did not take part in any discussion or decision relating to the grants. The Register of Members Interests are available for public inspection.
Officers
There was no known material related party transaction with officers for 2018/19 or for 2017/18.
A Joint Management structure is established with Havant Borough Council. Details of the transactions with Havant Borough Council can be found in Note 29 Officers’ remuneration.
Entities controlled or Significantly influenced by the Authority
The Council has direct control over its trading companies, East Hampshire Trading Services Ltd (EHTS) and East Hampshire Commercial Services Ltd (EHCS). Gill Kneller (Chief Executive) is named as the only director for EHTS following James Hassett (Head of Operations) resigning as a Director for EHTS in August 2018. Dawn Adey (Client Relationship Director), Christopher Bradley (Head of Commercial Development) and Gill Kneller are named as directors for EHCS, due to their representation of Council interests through the Management Boards of the companies. James Hassett resigned as a Director for EHTS in August 2018.
33. Interests in other entities
The Council must consider all of its interests in entities and prepare a full set of group accounts where they have material interests in subsidiaries, associates or joint ventures. The following actions are carried out:
- Determine whether the Council has any form of interest in an entity- Assess the nature of the relationship with the Council- Determine the grounds of materiality whether group accounts should be prepared.
Having considered the accounting requirements and the Council’s involvement with all companies and organisations, Group Accounts have not been prepared.
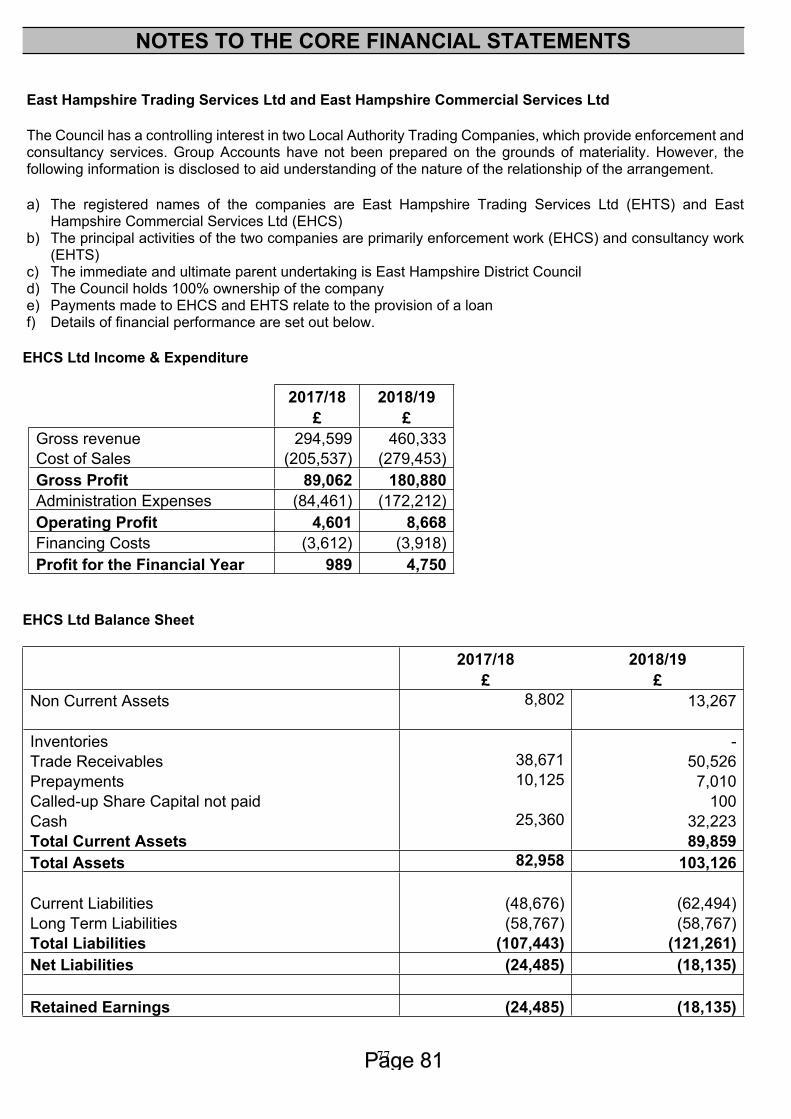
77
NOTES TO THE CORE FINANCIAL STATEMENTS
East Hampshire Trading Services Ltd and East Hampshire Commercial Services Ltd
The Council has a controlling interest in two Local Authority Trading Companies, which provide enforcement and consultancy services. Group Accounts have not been prepared on the grounds of materiality. However, the following information is disclosed to aid understanding of the nature of the relationship of the arrangement.
a) The registered names of the companies are East Hampshire Trading Services Ltd (EHTS) and East Hampshire Commercial Services Ltd (EHCS)
b) The principal activities of the two companies are primarily enforcement work (EHCS) and consultancy work (EHTS)
c) The immediate and ultimate parent undertaking is East Hampshire District Councild) The Council holds 100% ownership of the company e) Payments made to EHCS and EHTS relate to the provision of a loan f) Details of financial performance are set out below.
EHCS Ltd Income & Expenditure
2017/18 2018/19£ £
Gross revenue 294,599 460,333Cost of Sales (205,537) (279,453)Gross Profit 89,062 180,880Administration Expenses (84,461) (172,212)Operating Profit 4,601 8,668Financing Costs (3,612) (3,918)Profit for the Financial Year 989 4,750
EHCS Ltd Balance Sheet
2017/18 2018/19 £ £Non Current Assets 8,802 13,267 Inventories -Trade Receivables 38,671 50,526Prepayments 10,125 7,010Called-up Share Capital not paid 100Cash 25,360 32,223Total Current Assets 89,859Total Assets 82,958 103,126 Current Liabilities (48,676) (62,494)Long Term Liabilities (58,767) (58,767)Total Liabilities (107,443) (121,261)Net Liabilities (24,485) (18,135) Retained Earnings (24,485) (18,135)
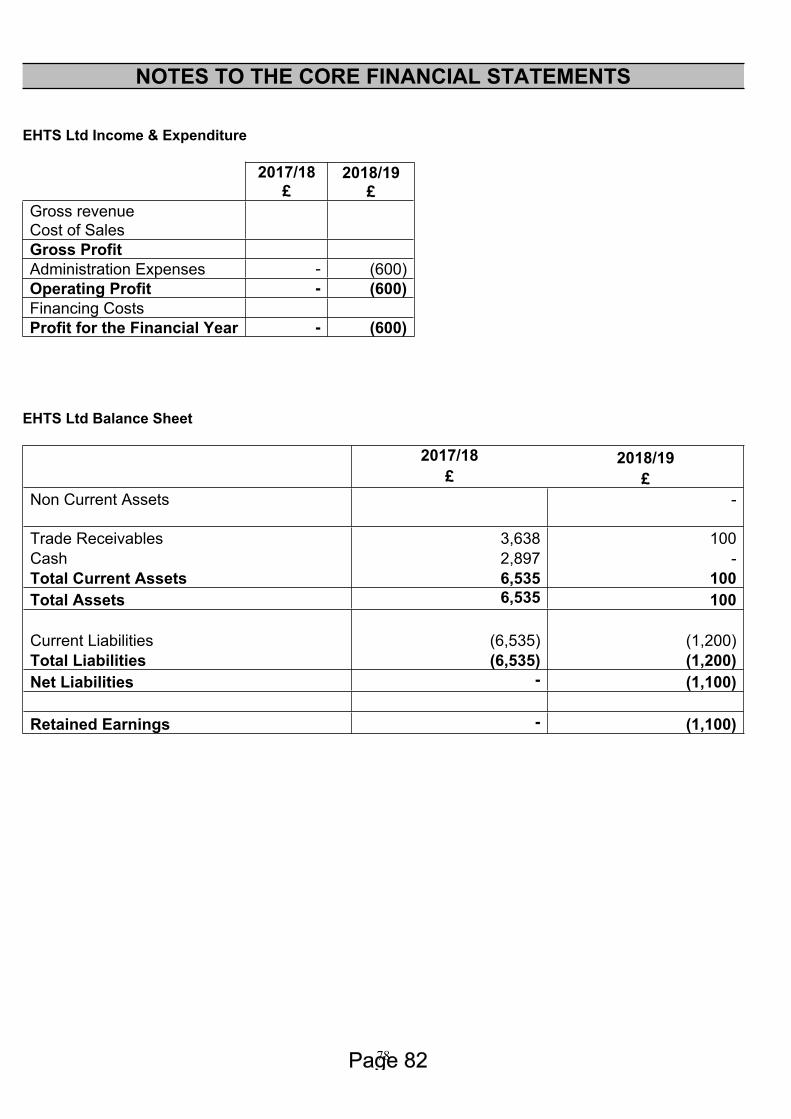
78
NOTES TO THE CORE FINANCIAL STATEMENTS
EHTS Ltd Income & Expenditure
2017/18 2018/19£ £
Gross revenueCost of SalesGross ProfitAdministration Expenses - (600)Operating Profit - (600)Financing CostsProfit for the Financial Year - (600)
EHTS Ltd Balance Sheet
2017/18 2018/19 £ £Non Current Assets - Trade Receivables 3,638 100Cash 2,897 -Total Current Assets 6,535 100Total Assets 6,535 100 Current Liabilities (6,535) (1,200)Total Liabilities (6,535) (1,200)Net Liabilities - (1,100) Retained Earnings - (1,100)
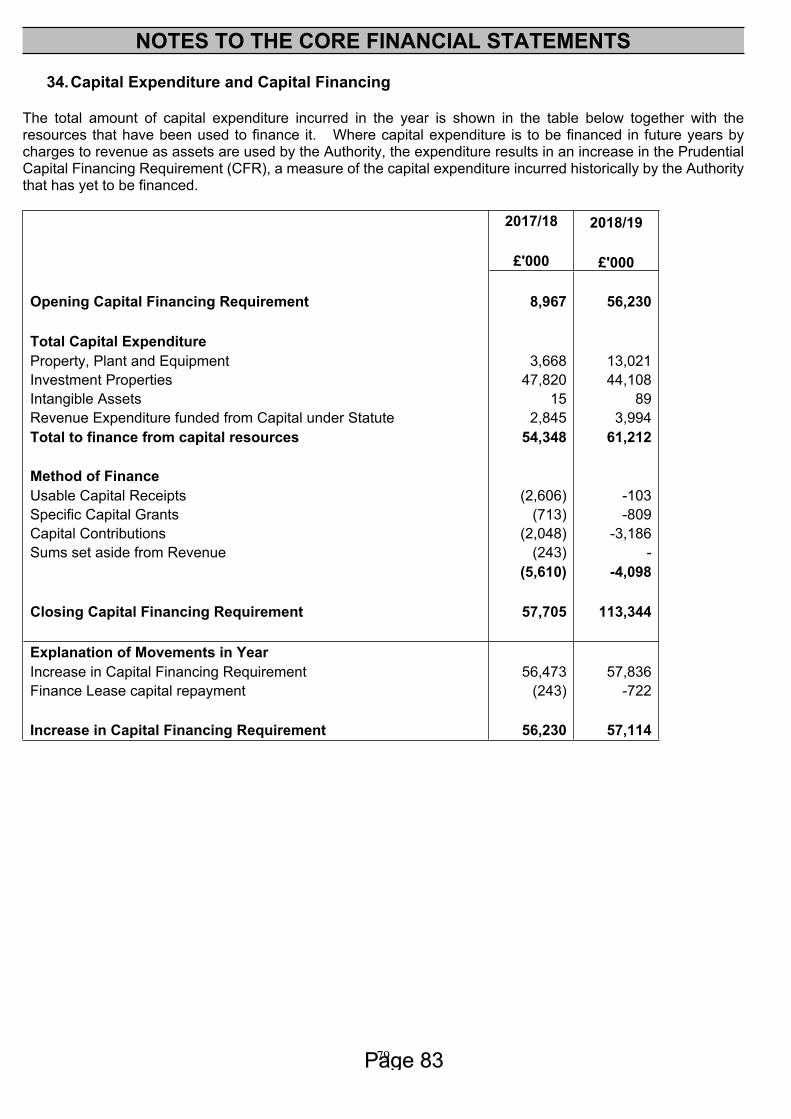
79
NOTES TO THE CORE FINANCIAL STATEMENTS
34.Capital Expenditure and Capital Financing
The total amount of capital expenditure incurred in the year is shown in the table below together with the resources that have been used to finance it. Where capital expenditure is to be financed in future years by charges to revenue as assets are used by the Authority, the expenditure results in an increase in the Prudential Capital Financing Requirement (CFR), a measure of the capital expenditure incurred historically by the Authority that has yet to be financed.
2017/18 2018/19 £'000 £'000
Opening Capital Financing Requirement 8,967 56,230
Total Capital Expenditure Property, Plant and Equipment 3,668 13,021Investment Properties 47,820 44,108Intangible Assets 15 89Revenue Expenditure funded from Capital under Statute 2,845 3,994Total to finance from capital resources 54,348 61,212 Method of Finance Usable Capital Receipts (2,606) -103Specific Capital Grants (713) -809Capital Contributions (2,048) -3,186Sums set aside from Revenue (243) - (5,610) -4,098 Closing Capital Financing Requirement 57,705 113,344 Explanation of Movements in Year Increase in Capital Financing Requirement 56,473 57,836Finance Lease capital repayment (243) -722 Increase in Capital Financing Requirement 56,230 57,114
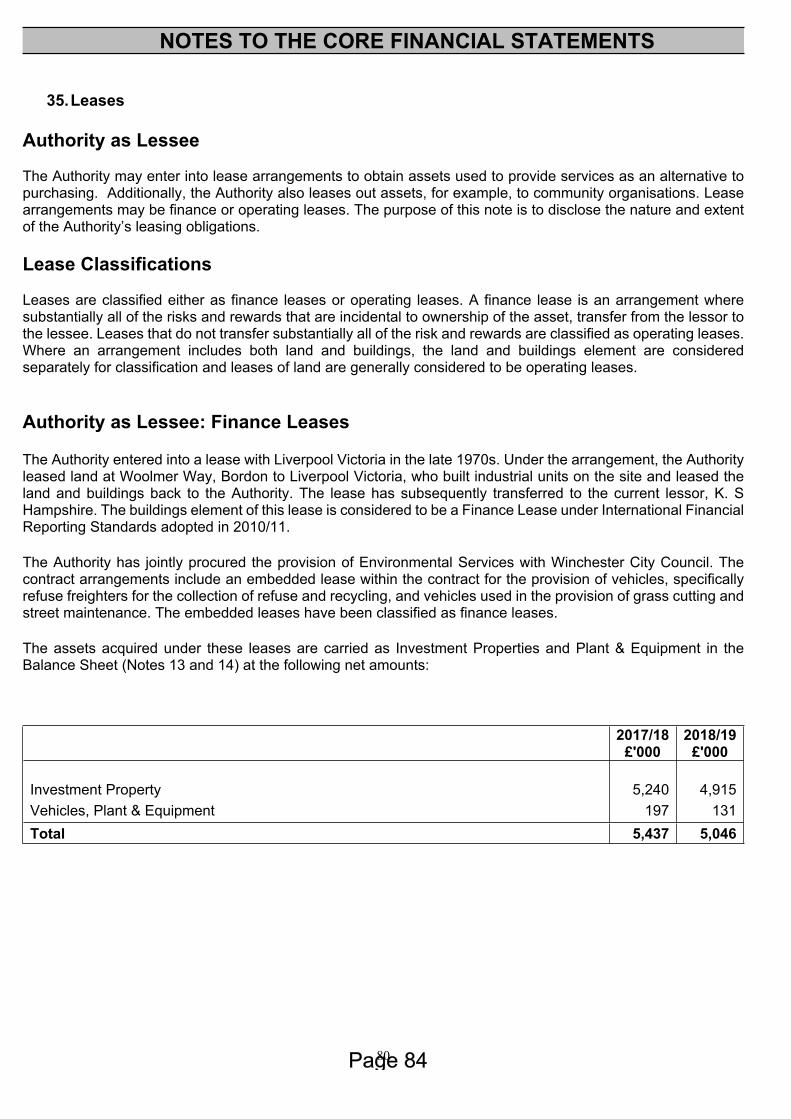
80
NOTES TO THE CORE FINANCIAL STATEMENTS
35.Leases
Authority as Lessee
The Authority may enter into lease arrangements to obtain assets used to provide services as an alternative to purchasing. Additionally, the Authority also leases out assets, for example, to community organisations. Lease arrangements may be finance or operating leases. The purpose of this note is to disclose the nature and extent of the Authority’s leasing obligations.
Lease Classifications
Leases are classified either as finance leases or operating leases. A finance lease is an arrangement where substantially all of the risks and rewards that are incidental to ownership of the asset, transfer from the lessor to the lessee. Leases that do not transfer substantially all of the risk and rewards are classified as operating leases. Where an arrangement includes both land and buildings, the land and buildings element are considered separately for classification and leases of land are generally considered to be operating leases.
Authority as Lessee: Finance Leases
The Authority entered into a lease with Liverpool Victoria in the late 1970s. Under the arrangement, the Authority leased land at Woolmer Way, Bordon to Liverpool Victoria, who built industrial units on the site and leased the land and buildings back to the Authority. The lease has subsequently transferred to the current lessor, K. S Hampshire. The buildings element of this lease is considered to be a Finance Lease under International Financial Reporting Standards adopted in 2010/11.
The Authority has jointly procured the provision of Environmental Services with Winchester City Council. The contract arrangements include an embedded lease within the contract for the provision of vehicles, specifically refuse freighters for the collection of refuse and recycling, and vehicles used in the provision of grass cutting and street maintenance. The embedded leases have been classified as finance leases.
The assets acquired under these leases are carried as Investment Properties and Plant & Equipment in the Balance Sheet (Notes 13 and 14) at the following net amounts:
2017/18 2018/19 £'000 £'000
Investment Property 5,240 4,915Vehicles, Plant & Equipment 197 131Total 5,437 5,046
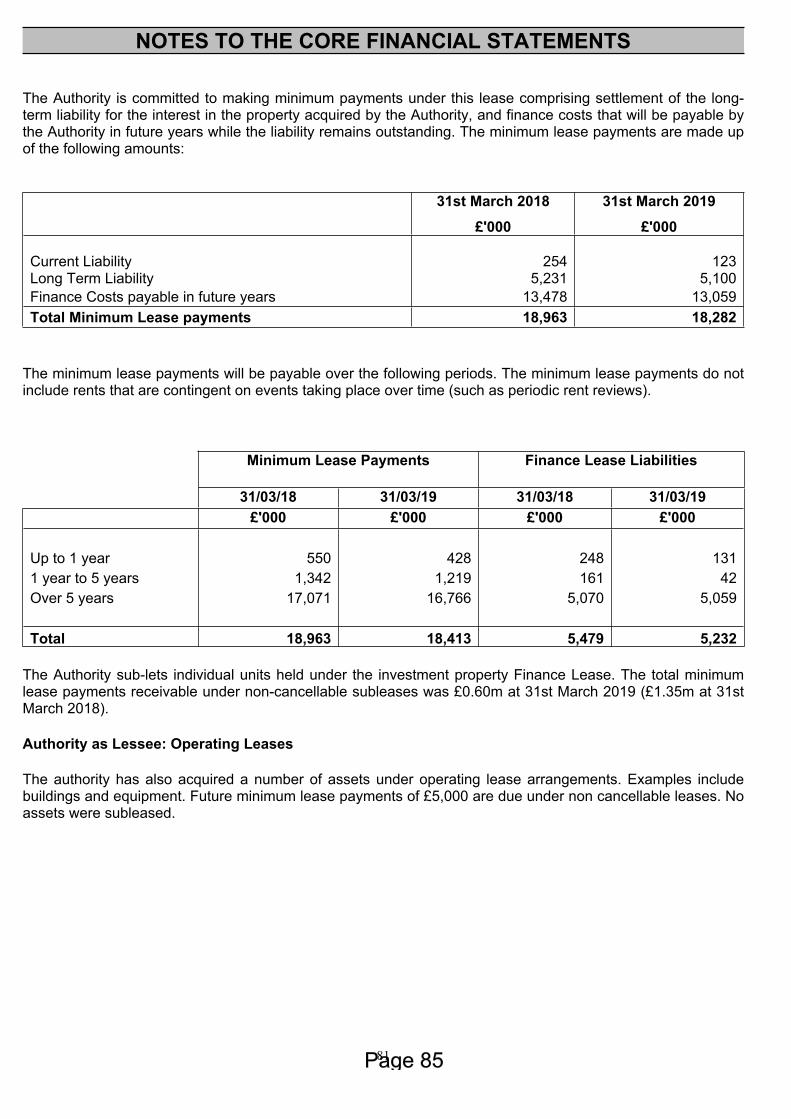
81
NOTES TO THE CORE FINANCIAL STATEMENTS
The Authority is committed to making minimum payments under this lease comprising settlement of the long-term liability for the interest in the property acquired by the Authority, and finance costs that will be payable by the Authority in future years while the liability remains outstanding. The minimum lease payments are made up of the following amounts:
31st March 2018 31st March 2019
£'000 £'000 Current Liability 254 123Long Term Liability 5,231 5,100Finance Costs payable in future years 13,478 13,059Total Minimum Lease payments 18,963 18,282
The minimum lease payments will be payable over the following periods. The minimum lease payments do not include rents that are contingent on events taking place over time (such as periodic rent reviews).
Minimum Lease Payments Finance Lease Liabilities
31/03/18 31/03/19 31/03/18 31/03/19 £'000 £'000 £'000 £'000 Up to 1 year 550 428 248 1311 year to 5 years 1,342 1,219 161 42Over 5 years 17,071 16,766 5,070 5,059 Total 18,963 18,413 5,479 5,232
The Authority sub-lets individual units held under the investment property Finance Lease. The total minimum lease payments receivable under non-cancellable subleases was £0.60m at 31st March 2019 (£1.35m at 31st March 2018).
Authority as Lessee: Operating Leases
The authority has also acquired a number of assets under operating lease arrangements. Examples include buildings and equipment. Future minimum lease payments of £5,000 are due under non cancellable leases. No assets were subleased.
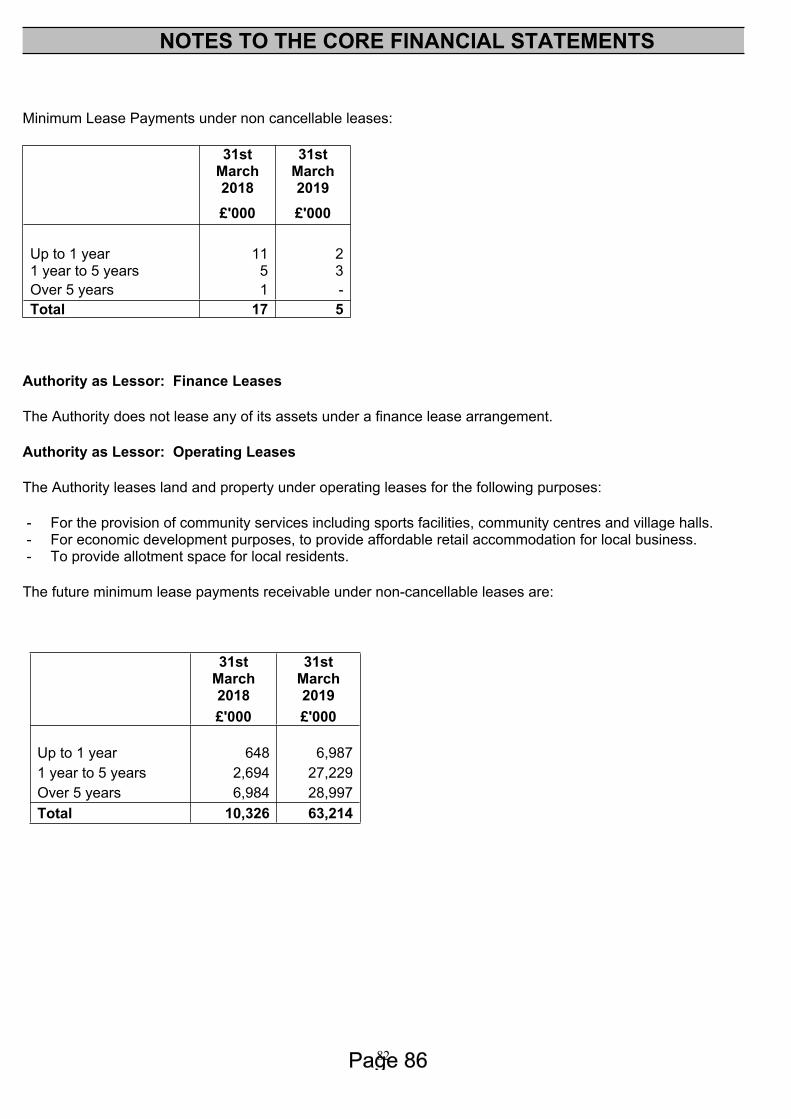
82
NOTES TO THE CORE FINANCIAL STATEMENTS
Minimum Lease Payments under non cancellable leases:
31st March 2018
31st March 2019
£'000 £'000 Up to 1 year 11 21 year to 5 years 5 3Over 5 years 1 -Total 17 5
Authority as Lessor: Finance Leases
The Authority does not lease any of its assets under a finance lease arrangement.
Authority as Lessor: Operating Leases
The Authority leases land and property under operating leases for the following purposes:
- For the provision of community services including sports facilities, community centres and village halls.- For economic development purposes, to provide affordable retail accommodation for local business.- To provide allotment space for local residents.
The future minimum lease payments receivable under non-cancellable leases are:
31st March 2018
31st March 2019
£'000 £'000 Up to 1 year 648 6,9871 year to 5 years 2,694 27,229Over 5 years 6,984 28,997Total 10,326 63,214
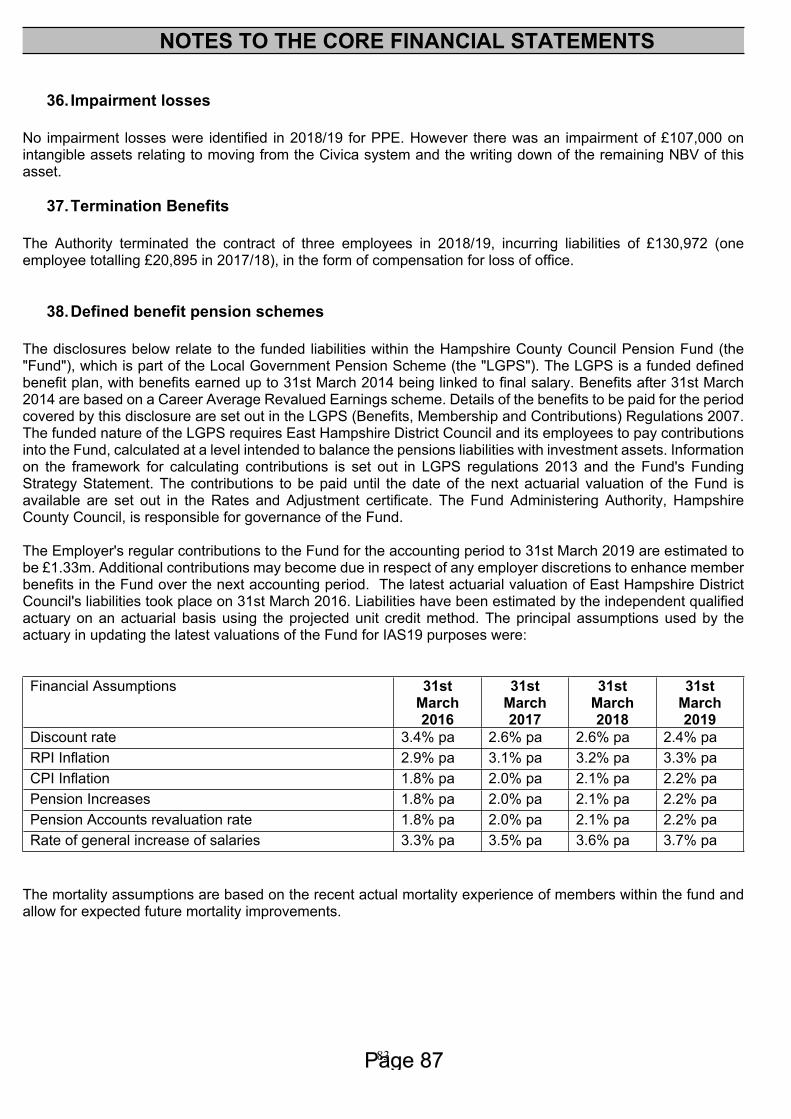
83
NOTES TO THE CORE FINANCIAL STATEMENTS
36. Impairment losses
No impairment losses were identified in 2018/19 for PPE. However there was an impairment of £107,000 on intangible assets relating to moving from the Civica system and the writing down of the remaining NBV of this asset.
37.Termination Benefits
The Authority terminated the contract of three employees in 2018/19, incurring liabilities of £130,972 (one employee totalling £20,895 in 2017/18), in the form of compensation for loss of office.
38.Defined benefit pension schemes
The disclosures below relate to the funded liabilities within the Hampshire County Council Pension Fund (the "Fund"), which is part of the Local Government Pension Scheme (the "LGPS"). The LGPS is a funded defined benefit plan, with benefits earned up to 31st March 2014 being linked to final salary. Benefits after 31st March 2014 are based on a Career Average Revalued Earnings scheme. Details of the benefits to be paid for the period covered by this disclosure are set out in the LGPS (Benefits, Membership and Contributions) Regulations 2007. The funded nature of the LGPS requires East Hampshire District Council and its employees to pay contributions into the Fund, calculated at a level intended to balance the pensions liabilities with investment assets. Information on the framework for calculating contributions is set out in LGPS regulations 2013 and the Fund's Funding Strategy Statement. The contributions to be paid until the date of the next actuarial valuation of the Fund is available are set out in the Rates and Adjustment certificate. The Fund Administering Authority, Hampshire County Council, is responsible for governance of the Fund.
The Employer's regular contributions to the Fund for the accounting period to 31st March 2019 are estimated to be £1.33m. Additional contributions may become due in respect of any employer discretions to enhance member benefits in the Fund over the next accounting period. The latest actuarial valuation of East Hampshire District Council's liabilities took place on 31st March 2016. Liabilities have been estimated by the independent qualified actuary on an actuarial basis using the projected unit credit method. The principal assumptions used by the actuary in updating the latest valuations of the Fund for IAS19 purposes were:
Financial Assumptions 31st March 2016
31st March 2017
31st March 2018
31st March 2019
Discount rate 3.4% pa 2.6% pa 2.6% pa 2.4% paRPI Inflation 2.9% pa 3.1% pa 3.2% pa 3.3% paCPI Inflation 1.8% pa 2.0% pa 2.1% pa 2.2% paPension Increases 1.8% pa 2.0% pa 2.1% pa 2.2% paPension Accounts revaluation rate 1.8% pa 2.0% pa 2.1% pa 2.2% paRate of general increase of salaries 3.3% pa 3.5% pa 3.6% pa 3.7% pa
The mortality assumptions are based on the recent actual mortality experience of members within the fund and allow for expected future mortality improvements.
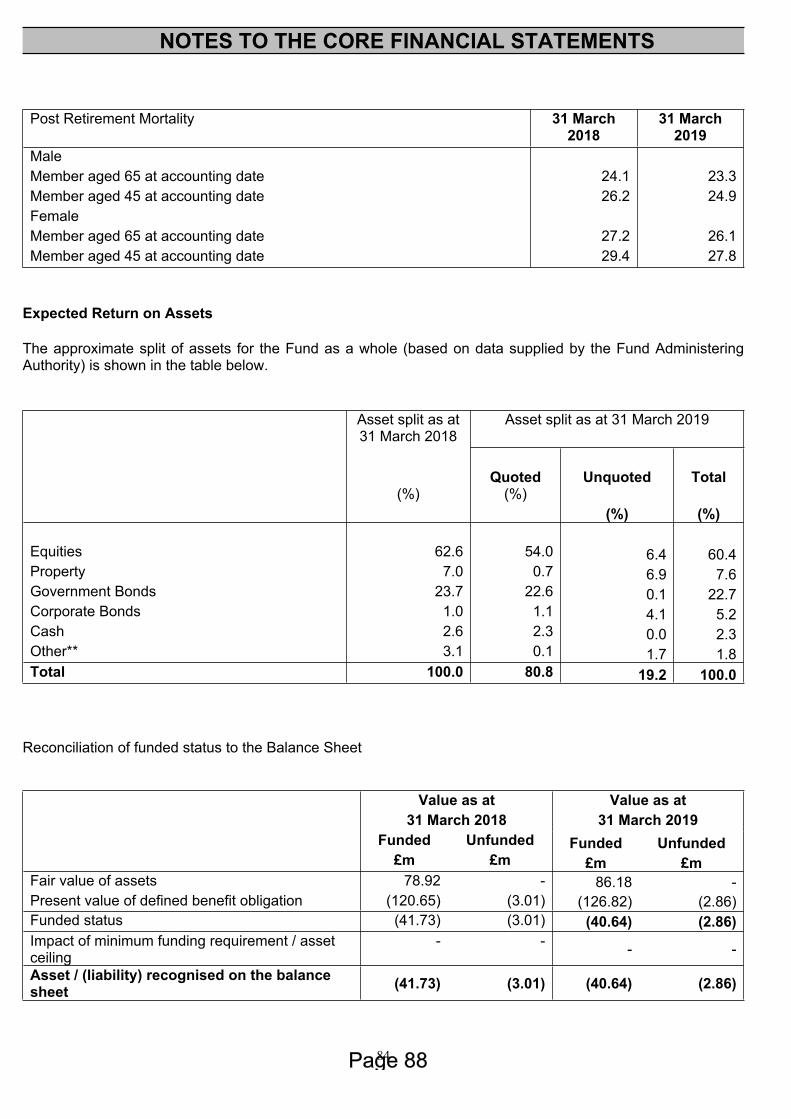
84
NOTES TO THE CORE FINANCIAL STATEMENTS
Post Retirement Mortality 31 March 2018
31 March 2019
Male Member aged 65 at accounting date 24.1 23.3Member aged 45 at accounting date 26.2 24.9Female Member aged 65 at accounting date 27.2 26.1Member aged 45 at accounting date 29.4 27.8
Expected Return on Assets
The approximate split of assets for the Fund as a whole (based on data supplied by the Fund Administering Authority) is shown in the table below.
Asset split as at 31 March 2019
Asset split as at 31 March 2018
Quoted Unquoted Total (%) (%)
(%) (%) Equities 62.6 54.0 6.4 60.4Property 7.0 0.7 6.9 7.6Government Bonds 23.7 22.6 0.1 22.7Corporate Bonds 1.0 1.1 4.1 5.2Cash 2.6 2.3 0.0 2.3Other** 3.1 0.1 1.7 1.8Total 100.0 80.8 19.2 100.0
Reconciliation of funded status to the Balance Sheet
Value as at Value as at 31 March 2018 31 March 2019 Funded Unfunded Funded Unfunded £m £m £m £m
Fair value of assets 78.92 - 86.18 -Present value of defined benefit obligation (120.65) (3.01) (126.82) (2.86)Funded status (41.73) (3.01) (40.64) (2.86)Impact of minimum funding requirement / asset ceiling
- - - -
Asset / (liability) recognised on the balance sheet (41.73) (3.01) (40.64) (2.86)
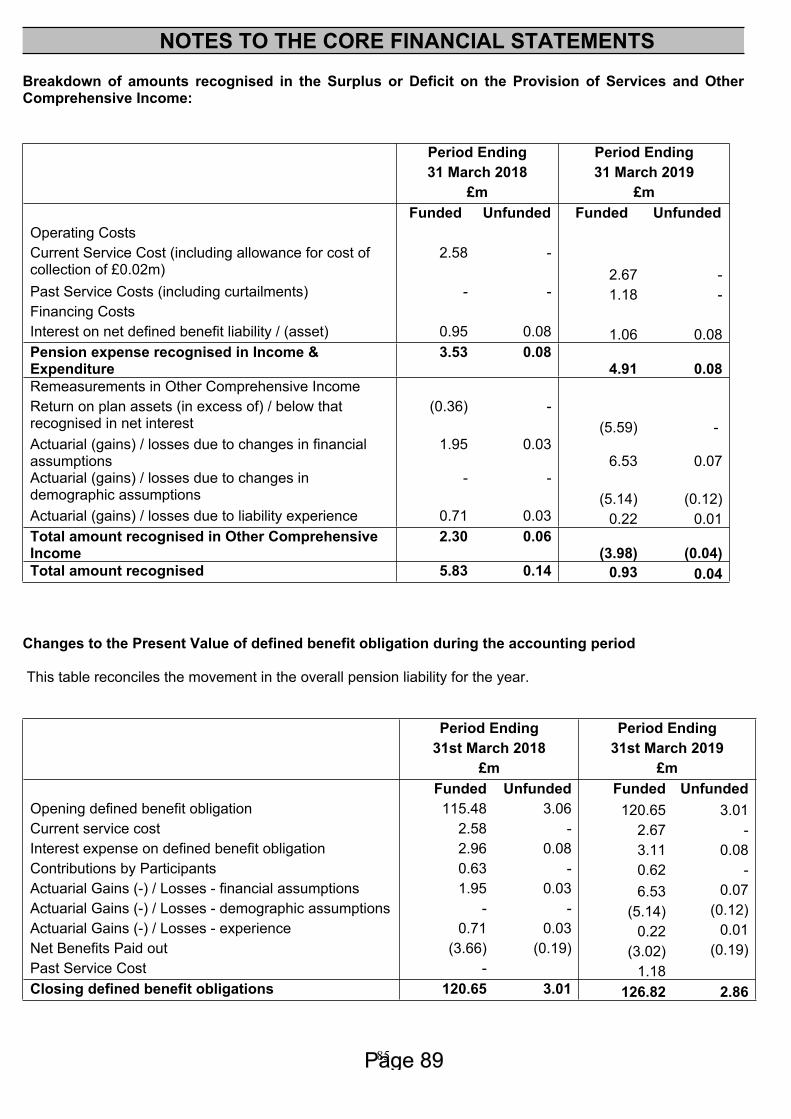
85
NOTES TO THE CORE FINANCIAL STATEMENTS
Breakdown of amounts recognised in the Surplus or Deficit on the Provision of Services and Other Comprehensive Income:
Period Ending Period Ending 31 March 2018 31 March 2019 £m £m Funded Unfunded Funded UnfundedOperating Costs Current Service Cost (including allowance for cost of collection of £0.02m)
2.58 - 2.67 -
Past Service Costs (including curtailments) - - 1.18 - Financing Costs Interest on net defined benefit liability / (asset) 0.95 0.08 1.06 0.08Pension expense recognised in Income & Expenditure
3.53 0.084.91 0.08
Remeasurements in Other Comprehensive Income Return on plan assets (in excess of) / below that recognised in net interest
(0.36) - (5.59) -
Actuarial (gains) / losses due to changes in financial assumptions
1.95 0.036.53 0.07
Actuarial (gains) / losses due to changes in demographic assumptions
- -(5.14) (0.12)
Actuarial (gains) / losses due to liability experience 0.71 0.03 0.22 0.01Total amount recognised in Other Comprehensive Income
2.30 0.06(3.98) (0.04)
Total amount recognised 5.83 0.14 0.93 0.04
Changes to the Present Value of defined benefit obligation during the accounting period
This table reconciles the movement in the overall pension liability for the year.
Period Ending Period Ending 31st March 2018 31st March 2019 £m £m Funded Unfunded Funded Unfunded
Opening defined benefit obligation 115.48 3.06 120.65 3.01Current service cost 2.58 - 2.67 - Interest expense on defined benefit obligation 2.96 0.08 3.11 0.08Contributions by Participants 0.63 - 0.62 - Actuarial Gains (-) / Losses - financial assumptions 1.95 0.03 6.53 0.07Actuarial Gains (-) / Losses - demographic assumptions - - (5.14) (0.12)Actuarial Gains (-) / Losses - experience 0.71 0.03 0.22 0.01Net Benefits Paid out (3.66) (0.19) (3.02) (0.19)Past Service Cost - 1.18 Closing defined benefit obligations 120.65 3.01 126.82 2.86
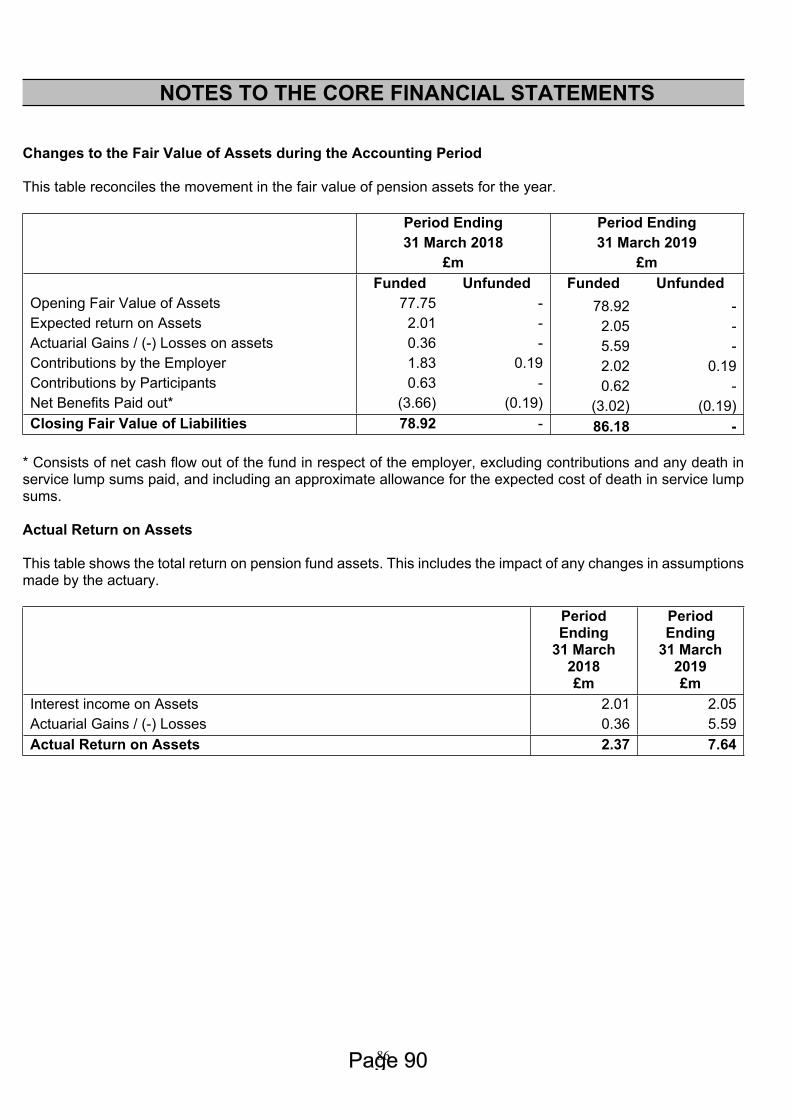
86
NOTES TO THE CORE FINANCIAL STATEMENTS
Changes to the Fair Value of Assets during the Accounting Period
This table reconciles the movement in the fair value of pension assets for the year.
Period Ending Period Ending 31 March 2018 31 March 2019 £m £m Funded Unfunded Funded Unfunded
Opening Fair Value of Assets 77.75 - 78.92 - Expected return on Assets 2.01 - 2.05 -Actuarial Gains / (-) Losses on assets 0.36 - 5.59 -Contributions by the Employer 1.83 0.19 2.02 0.19Contributions by Participants 0.63 - 0.62 -Net Benefits Paid out* (3.66) (0.19) (3.02) (0.19)Closing Fair Value of Liabilities 78.92 - 86.18 -
* Consists of net cash flow out of the fund in respect of the employer, excluding contributions and any death in service lump sums paid, and including an approximate allowance for the expected cost of death in service lump sums.
Actual Return on Assets
This table shows the total return on pension fund assets. This includes the impact of any changes in assumptions made by the actuary.
Period Ending
Period Ending
31 March 2018
31 March 2019
£m £mInterest income on Assets 2.01 2.05Actuarial Gains / (-) Losses 0.36 5.59Actual Return on Assets 2.37 7.64
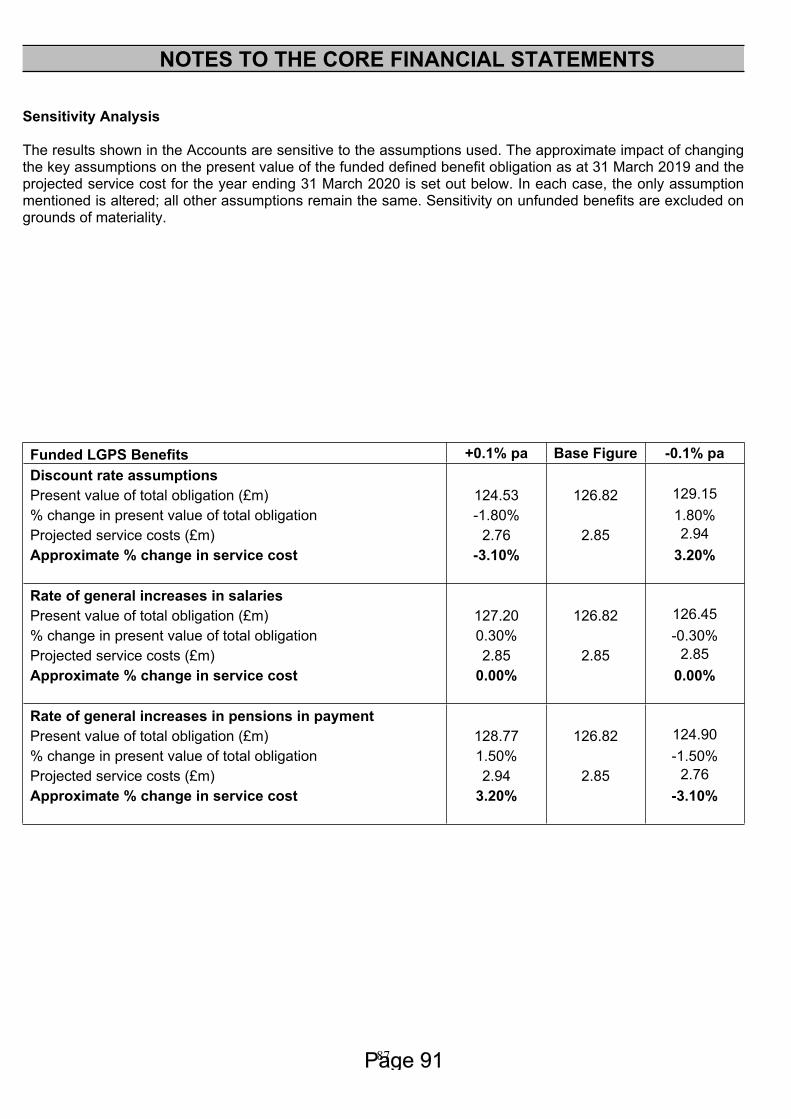
87
NOTES TO THE CORE FINANCIAL STATEMENTS
Sensitivity Analysis
The results shown in the Accounts are sensitive to the assumptions used. The approximate impact of changing the key assumptions on the present value of the funded defined benefit obligation as at 31 March 2019 and the projected service cost for the year ending 31 March 2020 is set out below. In each case, the only assumption mentioned is altered; all other assumptions remain the same. Sensitivity on unfunded benefits are excluded on grounds of materiality.
Funded LGPS Benefits +0.1% pa Base Figure -0.1% paDiscount rate assumptions Present value of total obligation (£m) 124.53 126.82 129.15% change in present value of total obligation -1.80% 1.80%Projected service costs (£m) 2.76 2.85 2.94Approximate % change in service cost -3.10% 3.20% Rate of general increases in salaries Present value of total obligation (£m) 127.20 126.82 126.45% change in present value of total obligation 0.30% -0.30%Projected service costs (£m) 2.85 2.85 2.85Approximate % change in service cost 0.00% 0.00% Rate of general increases in pensions in payment Present value of total obligation (£m) 128.77 126.82 124.90% change in present value of total obligation 1.50% -1.50%Projected service costs (£m) 2.94 2.85 2.76Approximate % change in service cost 3.20% -3.10%
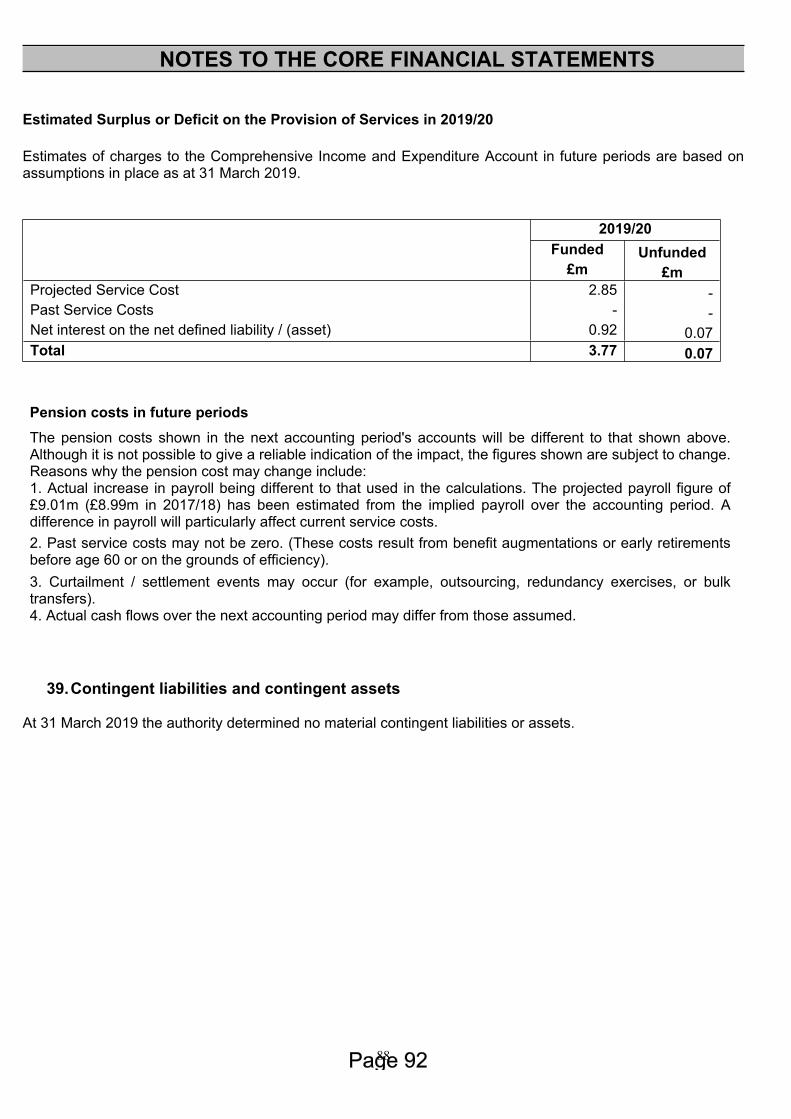
88
NOTES TO THE CORE FINANCIAL STATEMENTS
Estimated Surplus or Deficit on the Provision of Services in 2019/20
Estimates of charges to the Comprehensive Income and Expenditure Account in future periods are based on assumptions in place as at 31 March 2019.
2019/20 Funded Unfunded £m £mProjected Service Cost 2.85 -Past Service Costs - -Net interest on the net defined liability / (asset) 0.92 0.07Total 3.77 0.07
Pension costs in future periodsThe pension costs shown in the next accounting period's accounts will be different to that shown above. Although it is not possible to give a reliable indication of the impact, the figures shown are subject to change. Reasons why the pension cost may change include:1. Actual increase in payroll being different to that used in the calculations. The projected payroll figure of £9.01m (£8.99m in 2017/18) has been estimated from the implied payroll over the accounting period. A difference in payroll will particularly affect current service costs.2. Past service costs may not be zero. (These costs result from benefit augmentations or early retirements before age 60 or on the grounds of efficiency).3. Curtailment / settlement events may occur (for example, outsourcing, redundancy exercises, or bulk transfers).4. Actual cash flows over the next accounting period may differ from those assumed.
39.Contingent liabilities and contingent assets
At 31 March 2019 the authority determined no material contingent liabilities or assets.
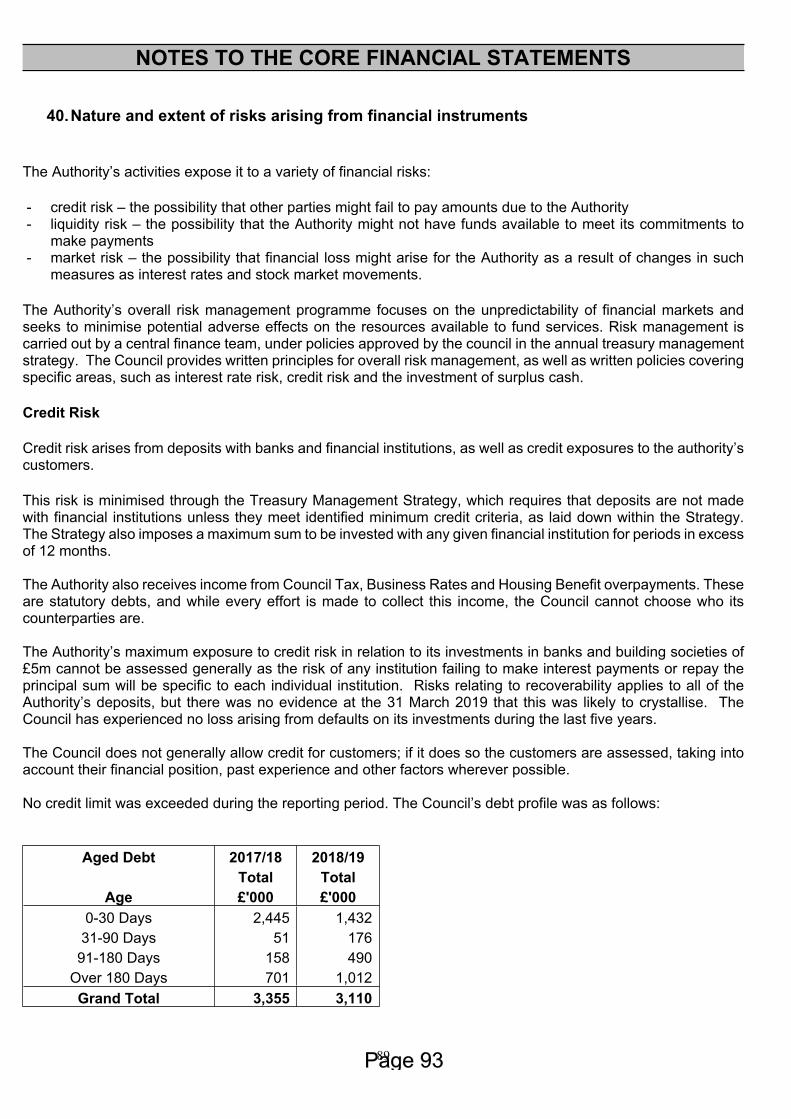
89
NOTES TO THE CORE FINANCIAL STATEMENTS
40.Nature and extent of risks arising from financial instruments
The Authority’s activities expose it to a variety of financial risks:
- credit risk – the possibility that other parties might fail to pay amounts due to the Authority- liquidity risk – the possibility that the Authority might not have funds available to meet its commitments to
make payments- market risk – the possibility that financial loss might arise for the Authority as a result of changes in such
measures as interest rates and stock market movements.
The Authority’s overall risk management programme focuses on the unpredictability of financial markets and seeks to minimise potential adverse effects on the resources available to fund services. Risk management is carried out by a central finance team, under policies approved by the council in the annual treasury management strategy. The Council provides written principles for overall risk management, as well as written policies covering specific areas, such as interest rate risk, credit risk and the investment of surplus cash.
Credit Risk
Credit risk arises from deposits with banks and financial institutions, as well as credit exposures to the authority’s customers.
This risk is minimised through the Treasury Management Strategy, which requires that deposits are not made with financial institutions unless they meet identified minimum credit criteria, as laid down within the Strategy. The Strategy also imposes a maximum sum to be invested with any given financial institution for periods in excess of 12 months.
The Authority also receives income from Council Tax, Business Rates and Housing Benefit overpayments. These are statutory debts, and while every effort is made to collect this income, the Council cannot choose who its counterparties are.
The Authority’s maximum exposure to credit risk in relation to its investments in banks and building societies of £5m cannot be assessed generally as the risk of any institution failing to make interest payments or repay the principal sum will be specific to each individual institution. Risks relating to recoverability applies to all of the Authority’s deposits, but there was no evidence at the 31 March 2019 that this was likely to crystallise. The Council has experienced no loss arising from defaults on its investments during the last five years.
The Council does not generally allow credit for customers; if it does so the customers are assessed, taking into account their financial position, past experience and other factors wherever possible.
No credit limit was exceeded during the reporting period. The Council’s debt profile was as follows:
Aged Debt 2017/18 2018/19 Total Total
Age £'000 £'0000-30 Days 2,445 1,432
31-90 Days 51 17691-180 Days 158 490
Over 180 Days 701 1,012Grand Total 3,355 3,110
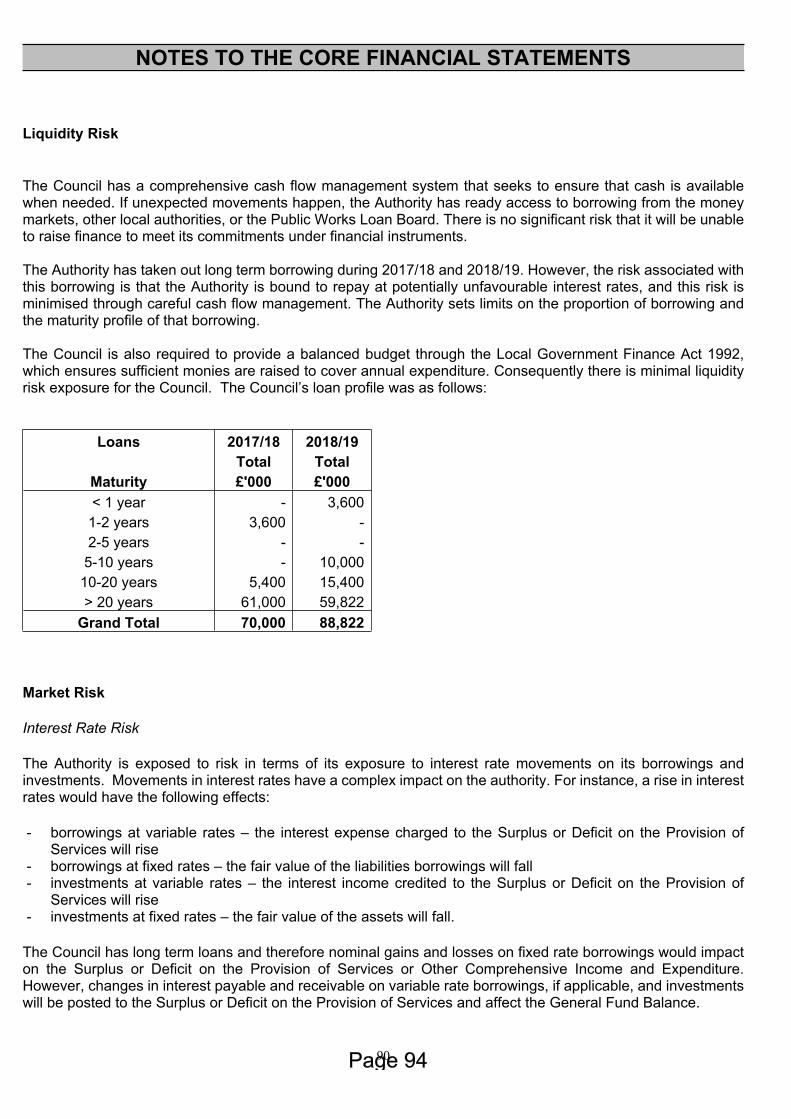
90
NOTES TO THE CORE FINANCIAL STATEMENTS
Liquidity Risk
The Council has a comprehensive cash flow management system that seeks to ensure that cash is available when needed. If unexpected movements happen, the Authority has ready access to borrowing from the money markets, other local authorities, or the Public Works Loan Board. There is no significant risk that it will be unable to raise finance to meet its commitments under financial instruments.
The Authority has taken out long term borrowing during 2017/18 and 2018/19. However, the risk associated with this borrowing is that the Authority is bound to repay at potentially unfavourable interest rates, and this risk is minimised through careful cash flow management. The Authority sets limits on the proportion of borrowing and the maturity profile of that borrowing.
The Council is also required to provide a balanced budget through the Local Government Finance Act 1992, which ensures sufficient monies are raised to cover annual expenditure. Consequently there is minimal liquidity risk exposure for the Council. The Council’s loan profile was as follows:
Loans 2017/18 2018/19 Total Total
Maturity £'000 £'000< 1 year - 3,6001-2 years 3,600 -2-5 years - -
5-10 years - 10,00010-20 years 5,400 15,400> 20 years 61,000 59,822
Grand Total 70,000 88,822
Market Risk
Interest Rate Risk
The Authority is exposed to risk in terms of its exposure to interest rate movements on its borrowings and investments. Movements in interest rates have a complex impact on the authority. For instance, a rise in interest rates would have the following effects:
- borrowings at variable rates – the interest expense charged to the Surplus or Deficit on the Provision of Services will rise
- borrowings at fixed rates – the fair value of the liabilities borrowings will fall- investments at variable rates – the interest income credited to the Surplus or Deficit on the Provision of
Services will rise- investments at fixed rates – the fair value of the assets will fall.
The Council has long term loans and therefore nominal gains and losses on fixed rate borrowings would impact on the Surplus or Deficit on the Provision of Services or Other Comprehensive Income and Expenditure. However, changes in interest payable and receivable on variable rate borrowings, if applicable, and investments will be posted to the Surplus or Deficit on the Provision of Services and affect the General Fund Balance.
91
NOTES TO THE CORE FINANCIAL STATEMENTS
Movements in the fair value of fixed rate investments that have a quoted market price will be reflected in Other Comprehensive Income and Expenditure.
The Authority has a number of strategies for managing interest rate risk. The policy is to aim to keep a maximum of 65% of its investments in variable rate deposits. Due to the nature of the investments held at 31 March 2019, the authority was not exposed to significant interest rate risk.
Equity Price Risk
The Authority does not invest in equity shares, and thus has no exposure to equity price risk.
Foreign Exchange Risk
The Authority has no financial asset or liability denominated in a foreign currency and thus has no exposure to loss arising from movements in exchange rates.
41.Events after the Balance Sheet Date
The Statement of Accounts was approved by the Responsible Finance Officer on 31 July 2019, and this is the date up to which events after the balance sheet date have been considered for inclusion in the Accounts.
The valuation of the Authority’s pension fund has been subject to a post balance sheet revaluation, caused by a court case referred to as ‘McCloud’. The Government were appealing against this judgement but their right to appeal was refused in July 2019. As a result, there has been a subsequent revised pensions estimation, undertaken by the Authority’s actuaries, resulted in a change in the pension values and disclosures in the accounts. Further detail can be found in Note 38.
42.Authorisation of the statement of accounts
The Statement of Accounts was authorised by the Responsible Finance Officer on 23 July 2019, and replaces the unaudited Draft Statement of Accounts issued by the Responsible Finance Officer on 31 May 2019.
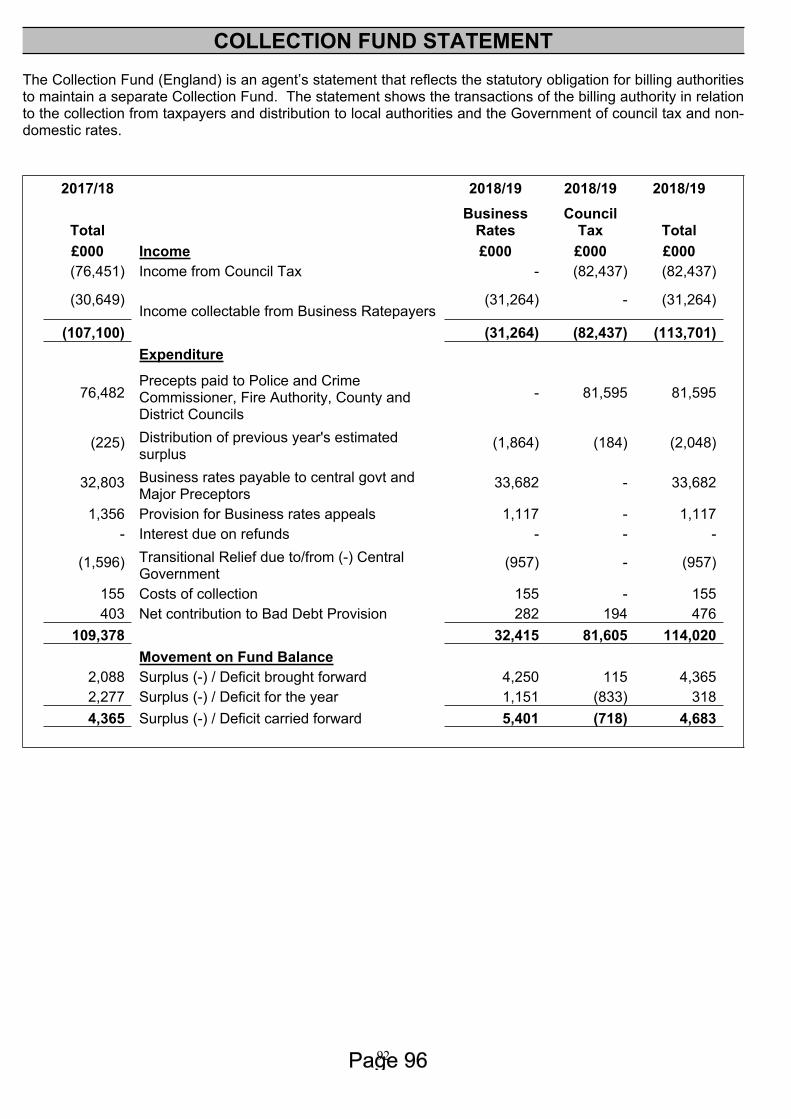
92
COLLECTION FUND STATEMENTThe Collection Fund (England) is an agent’s statement that reflects the statutory obligation for billing authorities to maintain a separate Collection Fund. The statement shows the transactions of the billing authority in relation to the collection from taxpayers and distribution to local authorities and the Government of council tax and non-domestic rates.
2017/18 2018/19 2018/19 2018/19
TotalBusiness
RatesCouncil
Tax Total £000 Income £000 £000 £000 (76,451) Income from Council Tax - (82,437) (82,437)
(30,649)
Income collectable from Business Ratepayers(31,264) - (31,264)
(107,100) (31,264) (82,437) (113,701) Expenditure
76,482
Precepts paid to Police and Crime Commissioner, Fire Authority, County and District Councils
- 81,595 81,595
(225) Distribution of previous year's estimated
surplus(1,864) (184) (2,048)
32,803 Business rates payable to central govt and
Major Preceptors33,682 - 33,682
1,356 Provision for Business rates appeals 1,117 - 1,117 - Interest due on refunds - - -
(1,596) Transitional Relief due to/from (-) Central
Government(957) - (957)
155 Costs of collection 155 - 155 403 Net contribution to Bad Debt Provision 282 194 476 109,378 32,415 81,605 114,020 Movement on Fund Balance 2,088 Surplus (-) / Deficit brought forward 4,250 115 4,365 2,277 Surplus (-) / Deficit for the year 1,151 (833) 318 4,365 Surplus (-) / Deficit carried forward 5,401 (718) 4,683
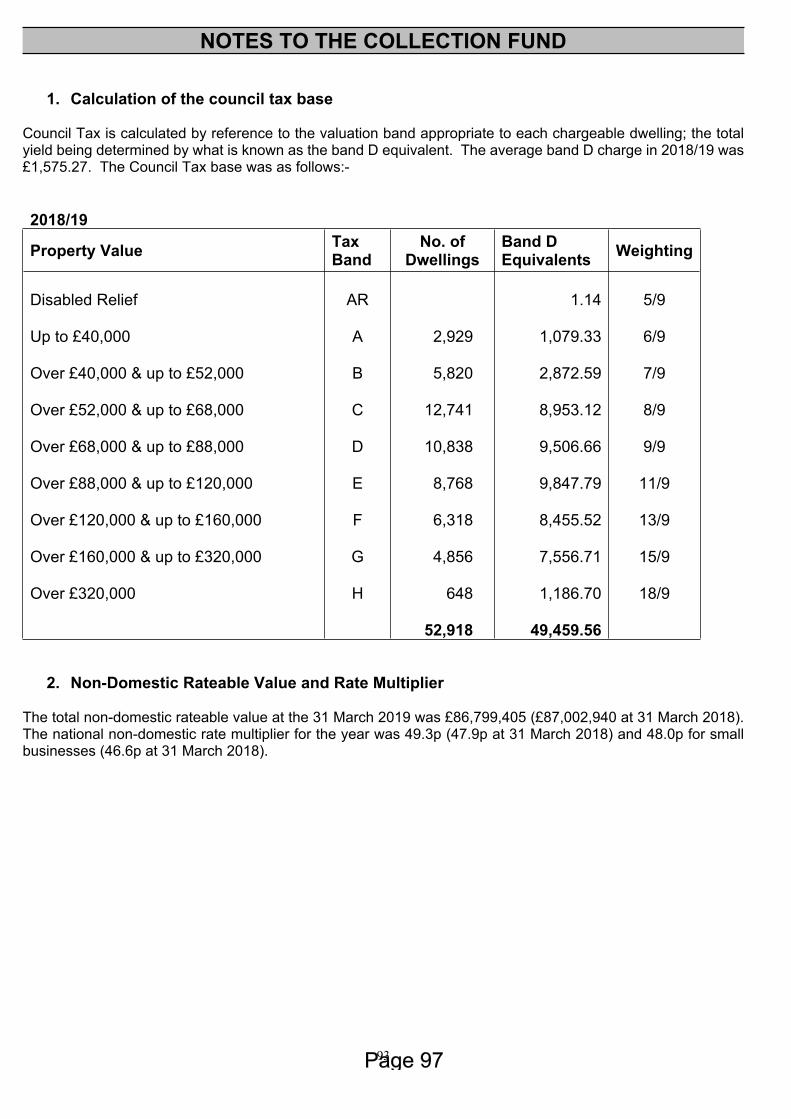
93
NOTES TO THE COLLECTION FUND
1. Calculation of the council tax base
Council Tax is calculated by reference to the valuation band appropriate to each chargeable dwelling; the total yield being determined by what is known as the band D equivalent. The average band D charge in 2018/19 was £1,575.27. The Council Tax base was as follows:-
2018/19
Property Value Tax Band
No. of Dwellings
Band D Equivalents Weighting
Disabled Relief AR
1.14 5/9
Up to £40,000 A 2,929
1,079.33 6/9
Over £40,000 & up to £52,000 B 5,820
2,872.59 7/9
Over £52,000 & up to £68,000 C 12,741
8,953.12 8/9
Over £68,000 & up to £88,000 D 10,838
9,506.66 9/9
Over £88,000 & up to £120,000 E 8,768
9,847.79 11/9
Over £120,000 & up to £160,000 F 6,318
8,455.52 13/9
Over £160,000 & up to £320,000 G 4,856
7,556.71 15/9
Over £320,000 H 648
1,186.70 18/9
52,918
49,459.56
2. Non-Domestic Rateable Value and Rate Multiplier
The total non-domestic rateable value at the 31 March 2019 was £86,799,405 (£87,002,940 at 31 March 2018). The national non-domestic rate multiplier for the year was 49.3p (47.9p at 31 March 2018) and 48.0p for small businesses (46.6p at 31 March 2018).
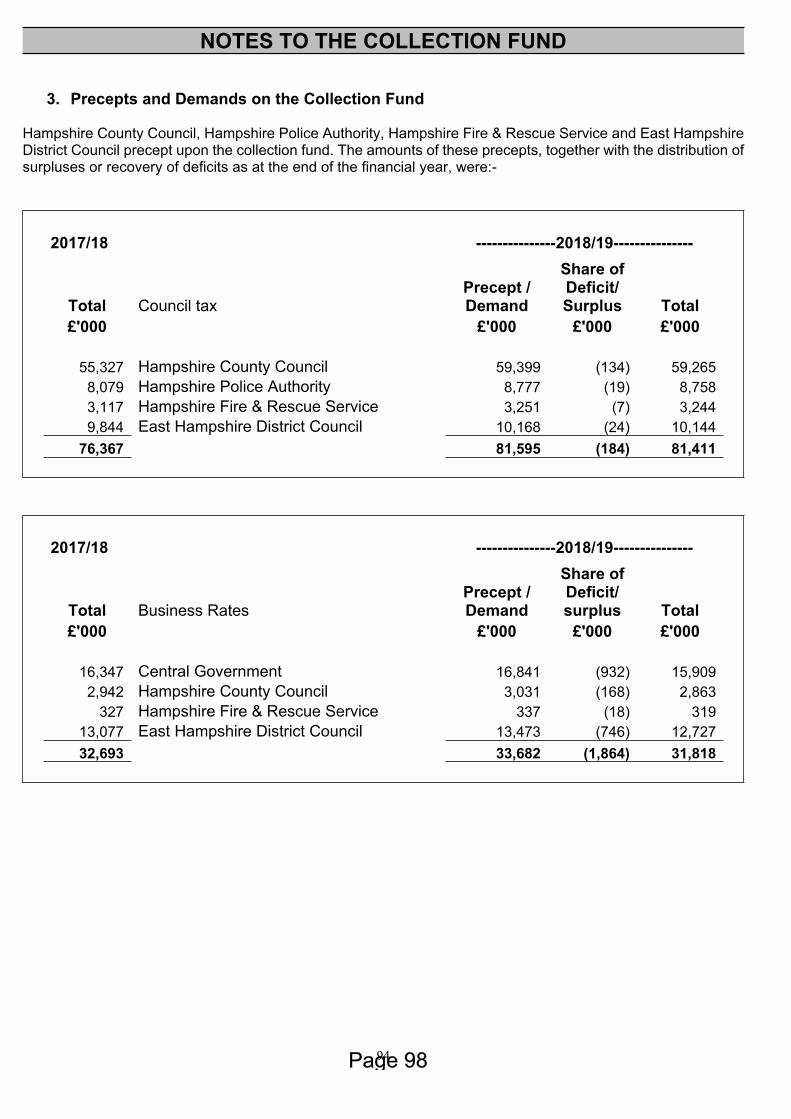
94
NOTES TO THE COLLECTION FUND
3. Precepts and Demands on the Collection Fund
Hampshire County Council, Hampshire Police Authority, Hampshire Fire & Rescue Service and East Hampshire District Council precept upon the collection fund. The amounts of these precepts, together with the distribution of surpluses or recovery of deficits as at the end of the financial year, were:-
2017/18 ---------------2018/19---------------
Total Council taxPrecept / Demand
Share of Deficit/ Surplus Total
£'000 £'000 £'000 £'000 55,327 Hampshire County Council 59,399 (134) 59,265 8,079 Hampshire Police Authority 8,777 (19) 8,758 3,117 Hampshire Fire & Rescue Service 3,251 (7) 3,244 9,844 East Hampshire District Council 10,168 (24) 10,144 76,367 81,595 (184) 81,411
2017/18 ---------------2018/19---------------
Total Business RatesPrecept / Demand
Share of Deficit/ surplus Total
£'000 £'000 £'000 £'000 16,347 Central Government 16,841 (932) 15,909 2,942 Hampshire County Council 3,031 (168) 2,863 327 Hampshire Fire & Rescue Service 337 (18) 319 13,077 East Hampshire District Council 13,473 (746) 12,727 32,693 33,682 (1,864) 31,818
95
GLOSSARY OF TERMS
AccrualThis concept means that income and expenditure is accounted for as it is earned or incurred, not as the money is received or paid (cash basis).
AssetA tangible or intangible item, that is of value to the Authority. Tangible assets include land andbuildings, plant and machinery, vehicles, fixtures and fittings. Intangible assets include computer software licenses and in house software development.
Actuarial Gains & Losses (Pensions)Over reporting period, these consist of:• Experience gains and losses are the effects of differences between previous assumptions made when calculating overall pension liability, and what has actually occurred, and• The effects of changes in actuarial assumptions such as salary inflation and life expectancy on the pension liability.
Billing AuthorityThe Council responsible for collecting Council Tax from residents. East Hampshire District Council is a billing authority.
Business Rates Retention SchemeA government funding scheme launched in 2013/14 which allows the Council to retain a share of the Business Rates collected in the Borough.
Capital ExpenditureExpenditure on the acquisition or construction of assets, or expenditure that enhances an existing asset that has a long-term value to the authority, particularly land and buildings.
Capital Adjustment Account (CAA)An accounting reserve which forms part of the capital accounting system and is not available for use. It represents amounts that have been set aside from revenue resources or capital receipts to finance expenditure on fixed assets or for the repayment of external loans.
Capital ProgrammeThe authority’s plan of capital projects and spending over future years. Included in this category is the purchase or enhancement of land and buildings, vehicle purchases and other major items ofequipment.
Capital ReceiptsIncome from the sale of land or buildings which can be used to finance new capitalexpenditure, or to repay outstanding debt on assets originally financed through loans.
Carrying AmountThe cost or value of an asset, less depreciation incurred against that asset.
Cash and Cash EquivalentsCash relates to the Council’s bank balance or overdraft, petty cash and change floats as at 31 March. Cash equivalents relate to cash deposits that are readily convertible into cash at any given time, for example, balances held in the Council’s overnight investment account.
Central Services to the PublicThis covers services to the public that are often provided by central departments and includes Local Tax Collection, Elections, Emergency Planning, and Local Land Charges.
CIPFAThe Chartered Institute of Public Finance and Accountancy.
96
GLOSSARY OF TERMS
Collection FundIncome and expenditure relating to the collection and distribution of Council Tax and National Non Domestic Rates.
Community AssetsAssets that the Council intend to hold in perpetuity for the benefit of the Community, that have no determinable useful life and that may have restrictions on their disposal. East Hampshire District Council’s community assets relate mainly to open spaces.
Contingent Assets and LiabilitiesA liability that, at the balance sheet date, can be anticipated to arise if a particular event occurs. Atypical example is a court case pending against the Council, the outcome of which is uncertain, but if the judgement were to be awarded against the Council, could result in a financial cost being incurred (liability) or an award of income to the council (asset).
CreditorsA creditor is an organisation, body or individual from whom the Council has purchased goods or services but the payment for which has not yet been made.
Current Service CostThe present value of pension benefits accrued to employees in the period of account.
CurtailmentCurtailments show the cost of the early payment of pension benefits if any employee has beenmade redundant in the previous financial year.
DebtorsOrganisations, bodies or individuals who have received goods or services from the Council for which the payment has not yet been received.
Deferred CreditThis is income that has been received before the period or periods to which it relates. Deferred income is shown in the Balance Sheet.
DeficitA deficit arises where expenditure exceeds income. A deficit can be financed by reserves.
DepreciationAn annual charge made in the Council’s revenue account reflecting the reduction in value of an asset caused by the day to day operation of that asset.
Expected Rate of Return on Assets (Pensions)The expected increase in the value of pension fund assets, based on valuations and long-termexpected returns as at the start of the accounting period.
Existing Use ValueThis is a method of valuing property that achieves a valuation based on the current use of the asset.
Fair ValueA methodology used to determine the value of Council assets. For land and buildings it is the amount that would be paid for an asset in its existing use or, where this is not available, the cost of replacing the asset in its existing use.
Financial InstrumentsA financial instrument is a contract that gives rise to a financial asset of one entity and a financial liability or equity instrument of another. Financial Instruments include trade debtors and trade creditors, and treasury management transactions, for example, cash deposits, swaps, and embedded derivatives.
97
GLOSSARY OF TERMS
General FundThe main revenue fund of the Council which contains the income and expenditure of allservices provided by the District Council. The General Fund Balance represents the Council’s minimum reserve balance to cover emergency expenditure.
Gross Book Value (GBV)The GBV of a fixed asset is the value of the asset before depreciation has been applied.
Historic CostThe historic cost of an asset Is deemed to be the carrying amount of an assets as at 1 April 2007 (the date the revaluation reserve was created) or at the date of acquisition, whichever date is the later, and adjusted for subsequent depreciation or impairment (if applicable).
IFRSInternational Financial Reporting Standard.
Impairment LossA significant decline in the value of an asset that is specific to that asset which is caused through deterioration rather than a reduction in market value of the asset.
Interest Cost (Pensions)Increase in present value of pension benefit obligations, which arise because the benefits are one year closer to payment.
Market ValueThe Market Value of an asset is the value that could be achieved if the asset were offered for sale with no restrictions that could affect its value.
National Non-Domestic Rates (NNDR)Tax charged on the rateable value of non-domestic properties (business properties). The rate oftax is set by the Government. The proceeds are pooled nationally and are redistributed on thebasis of a fixed amount per head of population.
Net Book ValueThe value of an asset, less the depreciation that has been applied to the asset since its purchase or revaluation.
Current Replacement CostThe cost of replacing an asset, reduced to reflect obsolescence. This cost is often used to value assets where market values or existing use values are not available.
Net Realisable ValueThe existing use value of an asset, less any additional costs likely to be incurred to bring the asset into use.
Non-Current AssetsTangible and intangible assets that yield benefits to the authority for a period of more than one year, for example, land and buildings.
Past Service CostThe increase in the present value of pension benefits for employee service before the year of account, which result in the current period from the introduction of, or changes to, post-employment benefits. Past service cost may either be positive (where benefits are introduced or improved) or negative (where existing benefits are reduced).
98
GLOSSARY OF TERMS
PreceptThe levy (demand) made by the County Council, Parish and Town Councils, on the DistrictCouncil’s Collection Fund for their net expenditure requirements.
Present value of defined benefit obligationThe value, in today’s money, of expected future payments required to settle the pension obligation resulting from employee service.
ProvisionsAmounts set aside to meet liabilities or losses which are likely to occur, or certain to occur in thefuture, but where the exact amounts and/or dates are uncertain.
ReservesAmounts set aside to meet planned future capital or revenue expenditure, particularly projects.
Revenue ExpenditureDay to day income and expenditure, relating to the provision of the Council’s services.
Revaluation Reserve An unusable reserve, that represents the amount by which the Council’s assets have been revalued since April 2007.
Revenue Support Grant (RSG)A general government grant in support of local authority expenditure. The grant is calculated by Central Government and is based on the relative needs of the district.
Settlement (Pension)Settlement occurs when the council enters into a transaction that eliminates all further obligation for part or all of the benefits provided under a defined benefit pension, for example, when a lump-sum cash payment is made to, or on behalf of, participants in exchange for their rights to receive specified post-employment benefits.
SurplusA surplus occurs where income exceeds expenditure. In some cases, a surplus will be transferred to an appropriate reserve.
Enquiries to: Lydia MorrisonDirect line: 02392 446624Email: [email protected] Date: 29th July 2019
KPMG LLP66 Queen SquareBristolBS1 4BE
This representation letter is provided in connection with your audit of the financial statements of East Hampshire District Council (“the Authority”), for the year ended 31 March 2019, for the purpose of expressing an opinion:
i. as to whether these financial statements give a true and fair view of the financial position of the Authority as at 31 March 201 and of the Authority’s expenditure and income for the year then ended; and
ii. whether the financial statements have been prepared properly in accordance with the CIPFA/LASAAC Code of Practice on Local Authority Accounting in the United Kingdom 2018/19.
These financial statements comprise the Expenditure and Funding Analysis, the Movement in Reserves Statement, the Comprehensive Income and Expenditure Statement, the Balance Sheet, the Cash Flow Statement, the Collection Fund and the related notes.
The Authority confirms that the representations it makes in this letter are in accordance with the definitions set out in the Appendix to this letter.
The Authority confirms that, to the best of its knowledge and belief, having made such inquiries as it considered necessary for the purpose of appropriately informing itself:
Financial statements
1. The Authority has fulfilled its responsibilities, as set out in the Accounts and Audit Regulations 2015, for the preparation of financial statements that:
i. give a true and fair view of the financial position of the Authority as at 31 March 2019 and of the Authority’s expenditure and income for the year then ended;
ii. have been properly prepared in accordance with the CIPFA/LASAAC Code of Practice on Local Authority Accounting in the United Kingdom 2018/19.
The financial statements have been prepared on a going concern basis.
Dear Rees,
Appendix B
2
2. Measurement methods and significant assumptions used by the Authority in making accounting estimates, including those measured at fair value, are reasonable.
3. All events subsequent to the date of the financial statements and for which IAS 10 Events after the reporting period requires adjustment or disclosure have been adjusted or disclosed.
4. The effects of uncorrected misstatements are immaterial, both individually and in aggregate, to the financial statements as a whole. A list of the uncorrected misstatements is attached to this representation letter.
Information provided
5. The Authority has provided you with:
access to all information of which it is aware, that is relevant to the preparation of the financial statements, such as records, documentation and other matters;
additional information that you have requested from the Authority for the purpose of the audit; and
unrestricted access to persons within the Authority from whom you determined it necessary to obtain audit evidence.
6. All transactions have been recorded in the accounting records and are reflected in the financial statements.
7. The Authority confirms the following:
The Authority has disclosed to you the results of its assessment of the risk that the financial statements may be materially misstated as a result of fraud.
Included in the Appendix to this letter are the definitions of fraud, including misstatements arising from fraudulent financial reporting and from misappropriation of assets.
8. The Authority has disclosed to you all information in relation to:
a) Fraud or suspected fraud that it is aware of and that affects the Authority and involves:
management; employees who have significant roles in internal control; or others where the fraud could have a material effect on the financial
statements; and
b) allegations of fraud, or suspected fraud, affecting the Authority’s financial statements communicated by employees, former employees, analysts, regulators or others.
In respect of the above, the Authority acknowledges its responsibility for such internal control as it determines necessary for the preparation of financial statements that are free from material misstatement, whether due to fraud or error. In particular, the Authority
3
acknowledges its responsibility for the design, implementation and maintenance of internal control to prevent and detect fraud and error.
9. The Authority has disclosed to you all known instances of non-compliance or suspected non-compliance with laws and regulations whose effects should be considered when preparing the financial statements.
10.The Authority has disclosed to you and has appropriately accounted for and/or disclosed in the financial statements, in accordance with IAS 37 Provisions, Contingent Liabilities and Contingent Assets, all known actual or possible litigation and claims whose effects should be considered when preparing the financial statements.
11.The Authority has disclosed to you the identity of the Authority’s related parties and all the related party relationships and transactions of which it is aware. All related party relationships and transactions have been appropriately accounted for and disclosed in accordance with IAS 24 Related Party Disclosures.
Included in the Apendix to this letter are the definitions of both a related party and a related party transaction as we understand them as defined in IAS 24 and the CIPFA/LASAAC Code of Practice on Local Authority Accounting in the United Kingdom 2018/19.
12.The Authority confirms that:
a) The financial statements disclose all of the key risk factors, assumptions made and uncertainties surrounding the Authority’s ability to continue as a going concern as required to provide a true and fair view.
b) Any uncertainties disclosed are not considered to be material and therefore do not cast significant doubt on the ability of the Authority to continue as a going concern.
13.On the basis of the process established by the Authority and having made appropriate enquiries, the Authority is satisfied that the actuarial assumptions underlying the valuation of defined benefit obligations are consistent with its knowledge of the business and are in accordance with the requirements of IAS 19 (Revised) Employee Benefits.
The Authority further confirms that:
a) all significant retirement benefits, including any arrangements that are:
statutory, contractual or implicit in the employer's actions; arise in the UK and the Republic of Ireland or overseas; funded or unfunded; and approved or unapproved,
have been identified and properly accounted for; and
b) all plan amendments, curtailments and settlements have been identified and properly accounted for.

4
This letter was tabled and agreed at the meeting of the Governance, Audit and Scrutiny Committee on 29th July 2019.
Yours faithfully,
Jamie MatthewsChair of the Governance, Audit and Scrutiny Committee
Lydia MorrisonChief Financial Officer