Embed Size (px)
Citation preview
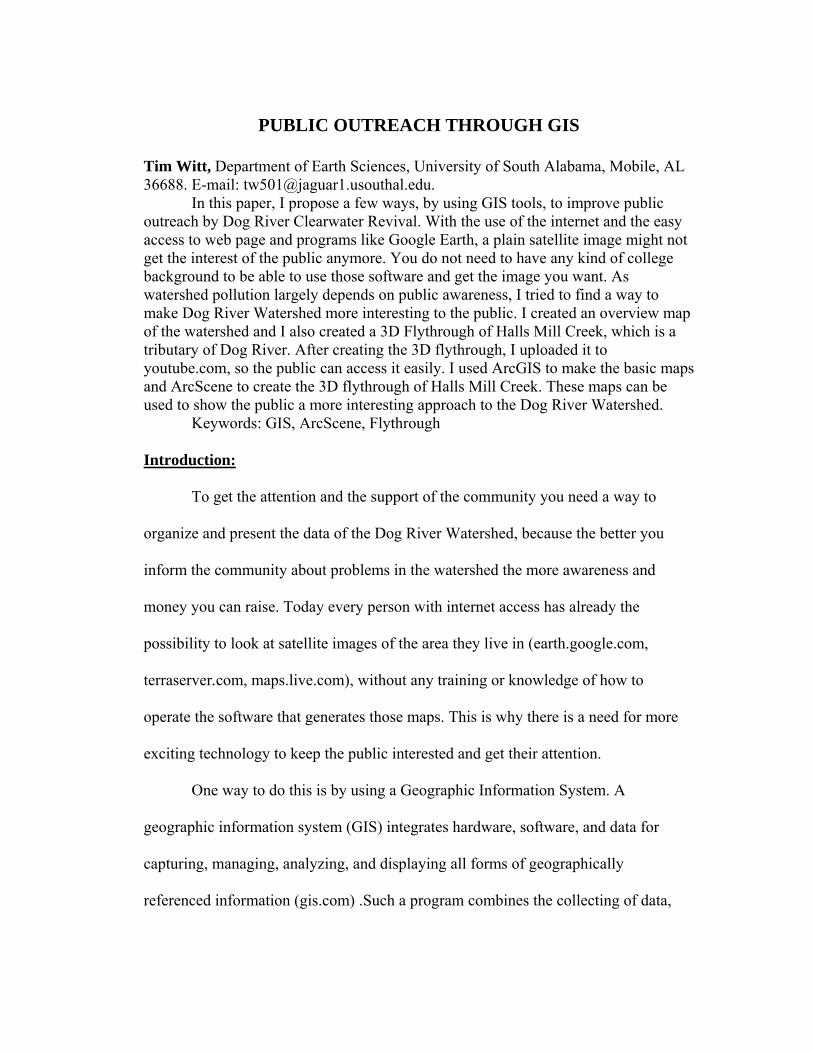
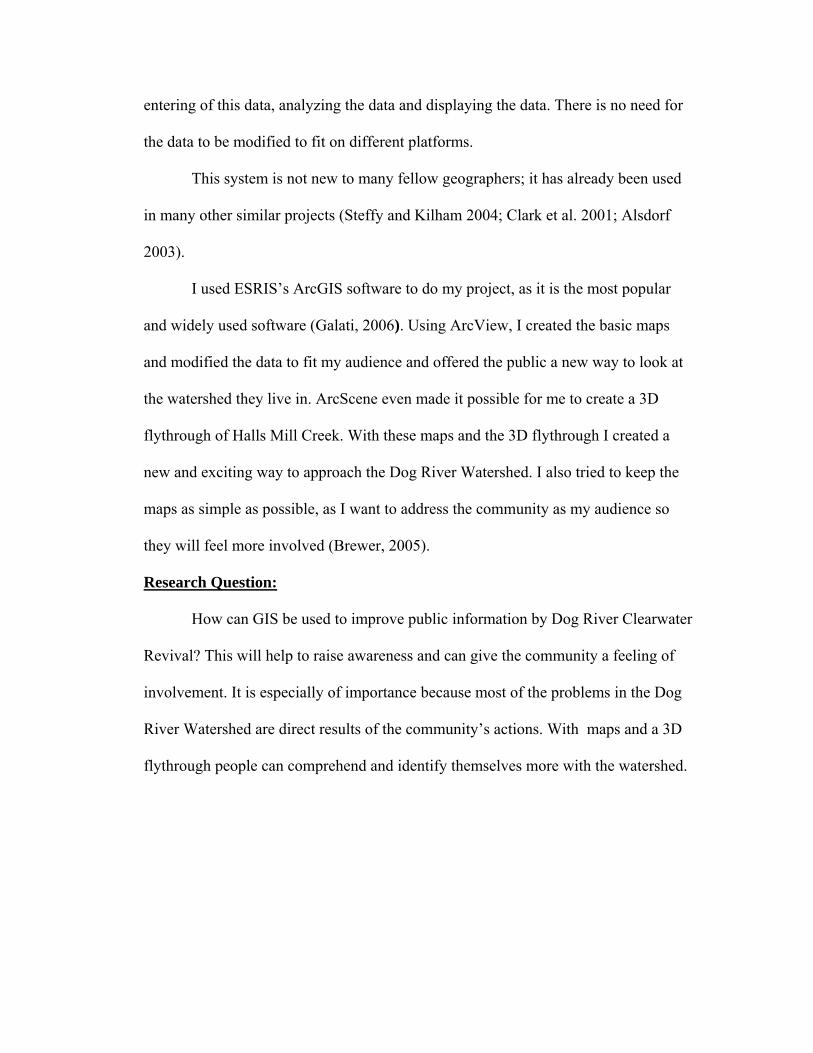
PUBLIC OUTREACH THROUGH GIS
Tim Witt, Department of Earth Sciences, University of South Alabama, Mobile, AL 36688. E-mail: [email protected].
In this paper, I propose a few ways, by using GIS tools, to improve public outreach by Dog River Clearwater Revival. With the use of the internet and the easy access to web page and programs like Google Earth, a plain satellite image might not get the interest of the public anymore. You do not need to have any kind of college background to be able to use those software and get the image you want. As watershed pollution largely depends on public awareness, I tried to find a way to make Dog River Watershed more interesting to the public. I created an overview map of the watershed and I also created a 3D Flythrough of Halls Mill Creek, which is a tributary of Dog River. After creating the 3D flythrough, I uploaded it to youtube.com, so the public can access it easily. I used ArcGIS to make the basic maps and ArcScene to create the 3D flythrough of Halls Mill Creek. These maps can be used to show the public a more interesting approach to the Dog River Watershed.
Keywords: GIS, ArcScene, Flythrough
Introduction:
To get the attention and the support of the community you need a way to
organize and present the data of the Dog River Watershed, because the better you
inform the community about problems in the watershed the more awareness and
money you can raise. Today every person with internet access has already the
possibility to look at satellite images of the area they live in (earth.google.com,
terraserver.com, maps.live.com), without any training or knowledge of how to
operate the software that generates those maps. This is why there is a need for more
exciting technology to keep the public interested and get their attention.
One way to do this is by using a Geographic Information System. A
geographic information system (GIS) integrates hardware, software, and data for
capturing, managing, analyzing, and displaying all forms of geographically
referenced information (gis.com) .Such a program combines the collecting of data,
entering of this data, analyzing the data and displaying the data. There is no need for
the data to be modified to fit on different platforms.
This system is not new to many fellow geographers; it has already been used
in many other similar projects (Steffy and Kilham 2004; Clark et al. 2001; Alsdorf
2003).
I used ESRIS’s ArcGIS software to do my project, as it is the most popular
and widely used software (Galati, 2006). Using ArcView, I created the basic maps
and modified the data to fit my audience and offered the public a new way to look at
the watershed they live in. ArcScene even made it possible for me to create a 3D
flythrough of Halls Mill Creek. With these maps and the 3D flythrough I created a
new and exciting way to approach the Dog River Watershed. I also tried to keep the
maps as simple as possible, as I want to address the community as my audience so
they will feel more involved (Brewer, 2005).
Research Question:
How can GIS be used to improve public information by Dog River Clearwater
Revival? This will help to raise awareness and can give the community a feeling of
involvement. It is especially of importance because most of the problems in the Dog
River Watershed are direct results of the community’s actions. With maps and a 3D
flythrough people can comprehend and identify themselves more with the watershed.
Methods:
For this project I used the ESRI ArcGIS software. For creating the maps and
the 3D flythrough I acquired data from the city of Mobile. The layers I used were,
major and minor roads, watershed, wetlands, water bodies and neighborhoods. I also
acquired 2 aerial photographs of the Mobile area which included the Dog River
watershed. With this data I created a map of Dog River watershed and also outlined
the area where I would create the 3D flythrough. After creating this basic map of the
Dog River Watershed and its surroundings I created a map of the outlined area which
included parts of the Halls Mill Creek watershed. I had to clip the different layers that
I used in the previous map by using the outlined area as a cutting edge. Not only did I
have to clip the different polygons and polylines but also the two aerial photographs,
so I can use them later in the 3D flythrough.
After finishing these two maps I had to prepare a flight path and a hill shade
raster in ArcView. I imported these two layers and the aerial photographs in
ArcScene. The base heights from the hill shade layer were used to transform the 2D
aerial photographs into a 3D surface.
Results:
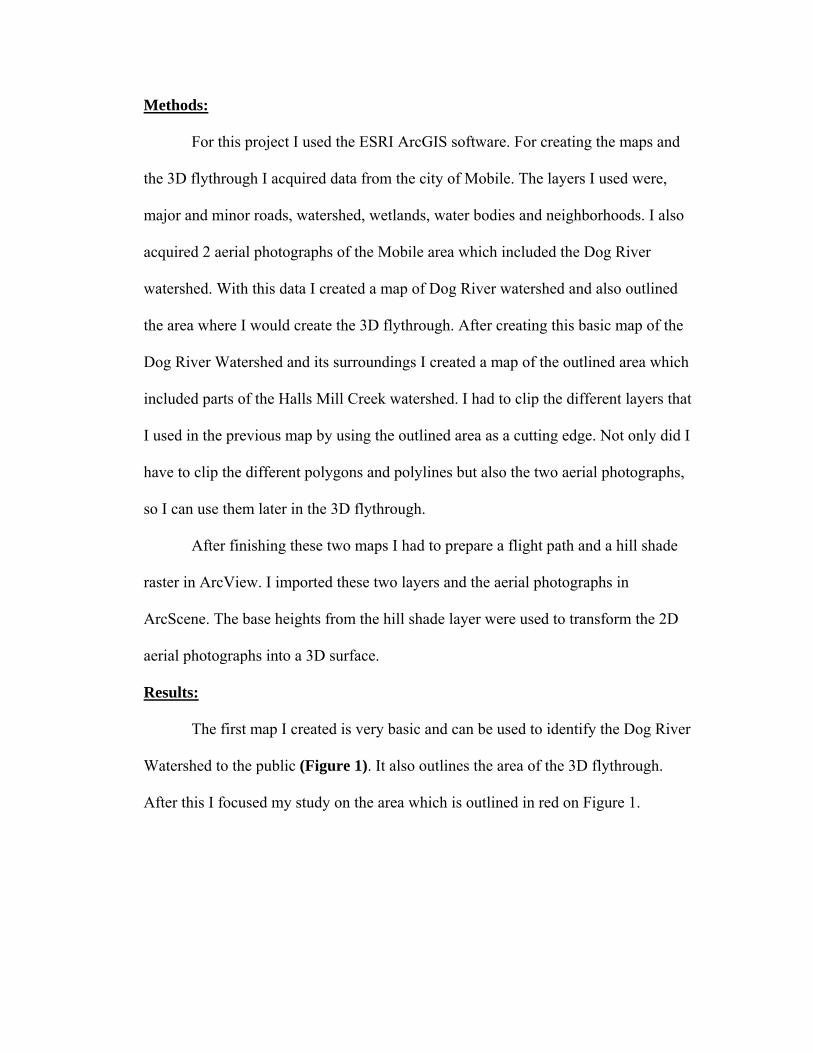
The first map I created is very basic and can be used to identify the Dog River
Watershed to the public (Figure 1). It also outlines the area of the 3D flythrough.
After this I focused my study on the area which is outlined in red on Figure 1.
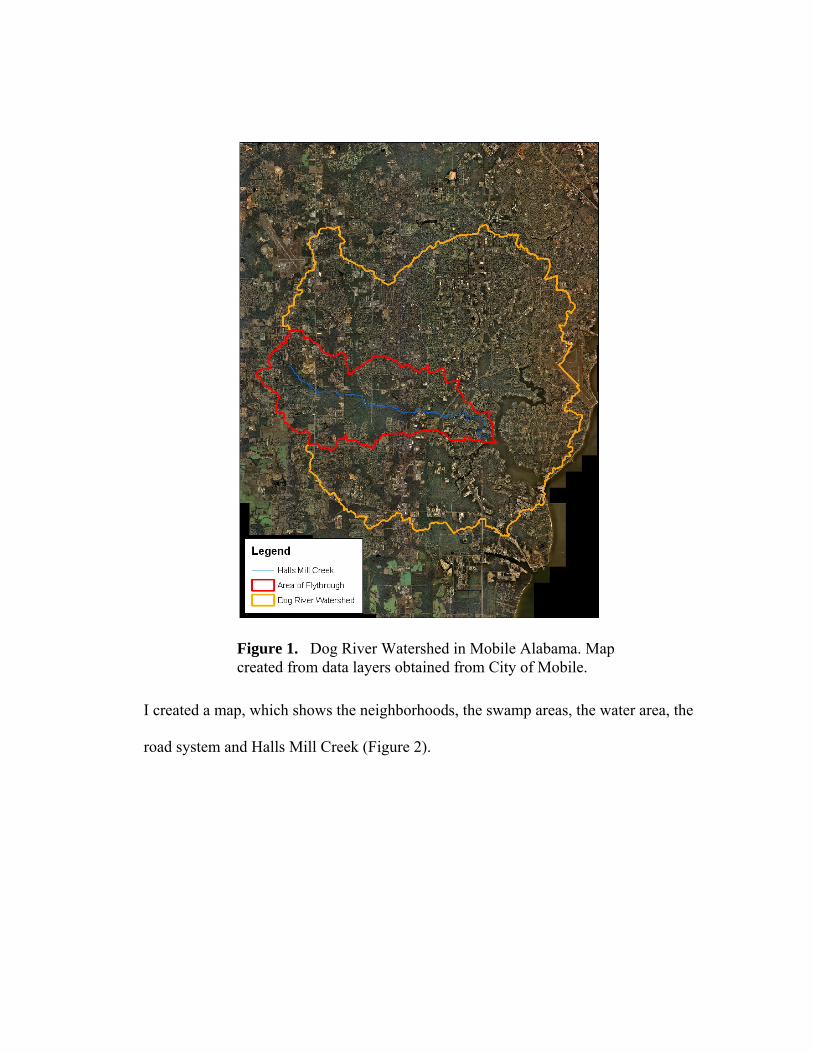
I created a map, which shows the neighborhoods, the swamp areas, the water area, the
road system and Halls Mill Creek (Figure 2).
Figure 1. Dog River Watershed in Mobile Alabama. Map created from data layers obtained from City of Mobile.
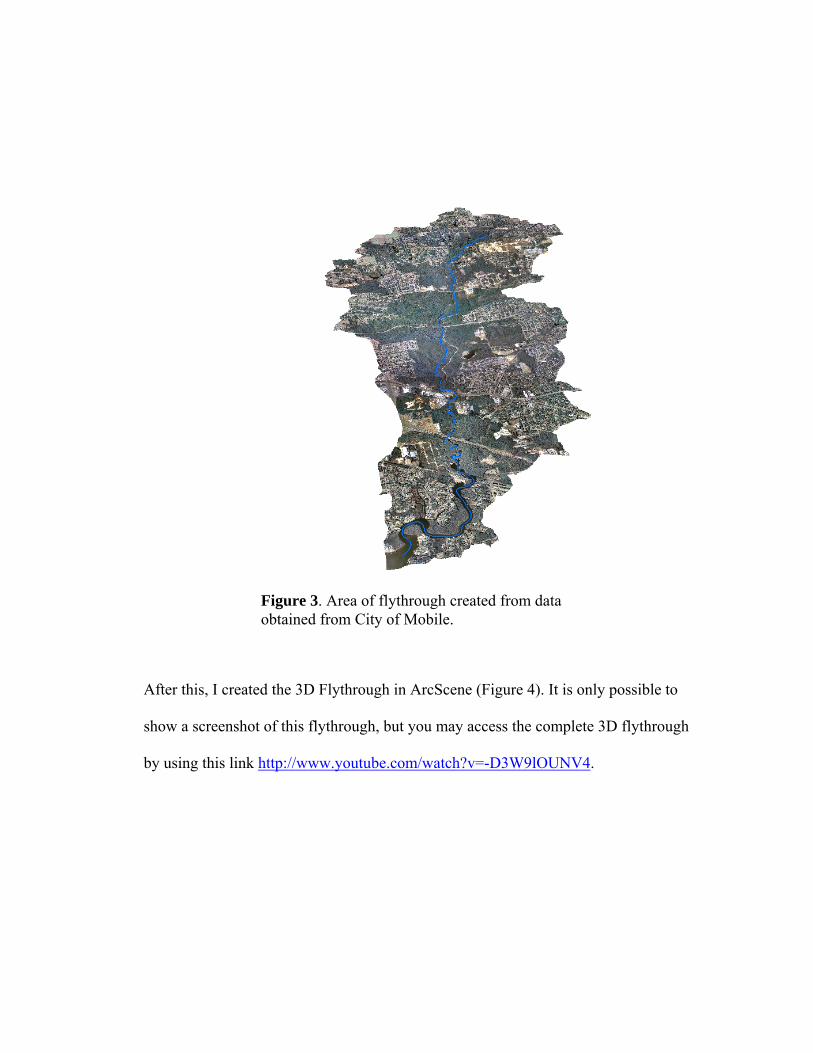
To introduce the 3D Flythrough I created a map of the flythrough area, by using the
aerial photographs and the Halls Mill Creek stream centerline (Figure 3). This map
was created in ArcScene.
Figure 2. This is a map of the area in which the flythrough takes place. Map created from data layers obtained from City of Mobile.
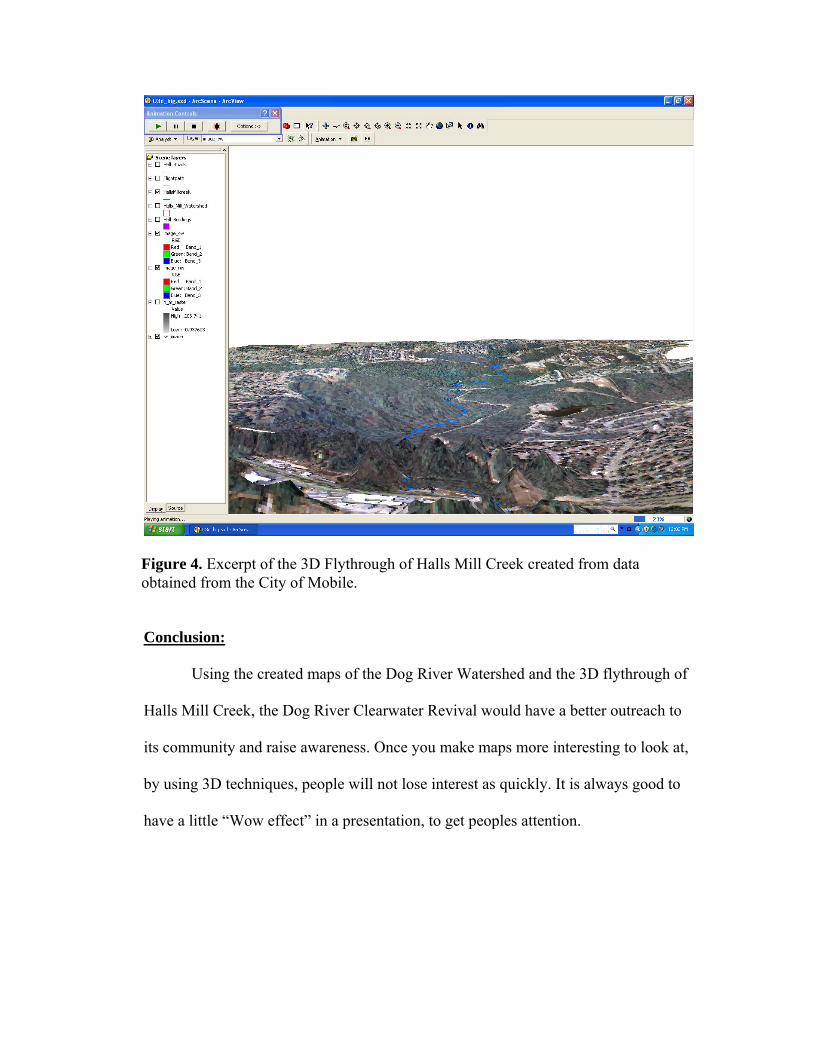
After this, I created the 3D Flythrough in ArcScene (Figure 4). It is only possible to
show a screenshot of this flythrough, but you may access the complete 3D flythrough
by using this link http://www.youtube.com/watch?v=-D3W9lOUNV4.
Figure 3. Area of flythrough created from data obtained from City of Mobile.
Conclusion:
Using the created maps of the Dog River Watershed and the 3D flythrough of
Halls Mill Creek, the Dog River Clearwater Revival would have a better outreach to
its community and raise awareness. Once you make maps more interesting to look at,
by using 3D techniques, people will not lose interest as quickly. It is always good to
have a little “Wow effect” in a presentation, to get peoples attention.
Figure 4. Excerpt of the 3D Flythrough of Halls Mill Creek created from data obtained from the City of Mobile.
Problems:
Because of the size, over 20 GB, and resolution of the pictures, creating the
maps and 3D Flythrough is very time consuming. When cutting the pictures, it took
ArcGIS more than seven hour to complete this task. This happened partially due to
the computer being too slow. Another problem that occurred because of the slow
working computer was that I had to cut the aerial photos in three different pieces or
else it could not be loaded into ArcScene, which resulted in more time loss.
Limitations:
The surface of the 3D Flythrough was not as clear as I hoped it would be,
meaning the resolution of the picture was downgraded. With a better computer it
would be possible to have a higher resolution surface and therefore the 3D Flythrough
would be more eye appealing.
Discussion:
Not only could the GIS system be used to make maps or 3D Flythroughs of
Dog River Watershed, it could also be used for data collection. You could identify
spots where earlier classes took pictures, identify places where people are doing a
water watch and you could even link result tables to the particular spots. This is also a
good project to be continued since with the lack of time I was only able to create one
3D flythrough. There are many more parts of the Dog River watershed which can be
illustrated by a 3D flythrough.
References:
Alsdorf, Douglas E. (2003). Water Storage of the Central Amazon Floodplain Measured with GIS and Remote Sensing Imagery. Annals of the Association of American Geographers, 93, Retrieved April 13, 2009, from http://www.jstor.org/stable/1515323.
Brewer, Cynthia A. (2005) Designing better Maps : a guide for GIS users. Redlands: ESRI Press.
Clark, M. E., Rose, K. A., Levine, D. A., & Hargrove, W. W. (2001). Predicting Climate Change Effects on Appalachian Trout: Combining GIS and Individual-Based Modeling. Ecological Applications, 11, Retrieved April 14, 2009, from http://www.jstor.org/stable/3061064.
Galati, Stephen R. (2006) Geographic Information Systems Demystified.” Norwood: Artech House,
Steffy, L. Y., & Kilham, S. S. (2004). Elevated δ 15N in Stream Biota in Areas with Septic Tank Systems in an Urban Watershed . Ecological Applications, 14, Retrieved April 14, 2009, from http://www.jstor.org/stable/4493568.
Unknown Author, (Unknown Date). What is GIS?. Retrieved April 14, 2009, from GIS.com Web site: http://www.gis.com/whatisgis/index.html.