Embed Size (px)
Citation preview

INTERNATIONAL MONETARY FUND
Public Investment and Fiscal Policy
Prepared by the Fiscal Affairs Department and the Policy Development and Review Department
(In consultation with other departments and in cooperation with the World Bank and the Inter-American Development Bank)
Approved by Teresa Ter-Minassian and Mark Allen
March 12, 2004
Contents Page
Executive Summary...................................................................................................................3 I. Introduction....................................................................................................................5 II. Public Investment and Growth.......................................................................................5 III. The Analytical Framework ..........................................................................................11
A. Targeting the Overall Fiscal Balance and Public Debt ....................................12 B. Targeting the Current Fiscal Balance ..............................................................13 C. Safeguarding Public Investment, Macroeconomic Stability, and Debt
Sustainability..............................................................................................16 IV. The Coverage of Fiscal Indicators and Targets ...........................................................17
A. The Current Approach to Coverage .................................................................18 B. An Improved Approach to Coverage...............................................................20
V. Public-Private Partnerships..........................................................................................23
A. Background ......................................................................................................23 B. Accounting for and Reporting PPP Operations ...............................................26
VI. Conclusions and Next Steps.........................................................................................28 VII. Issues for Discussion ....................................................................................................31

- 2 -
Figures 1. Investment Trends in Advanced OECD and Selected Latin American Countries, 1970-2000 ....................................................................................................................6 2. Investment Trends in Selected Asian and African Countries, 1970-2000.........................8 3. Coverage of Fiscal Statistics and Targets in Staff Reports and Fund-Supported
Programs ..........................................................................................................................19 Boxes 1. Approaches to Coverage in Brazil and Turkey................................................................21 2. Criteria for Assessing Whether Public Enterprises Are Commercially Run ...................22 Appendices 1. Studies of Public Investment and Growth .......................................................................32 2. Budget Rules and Public Debt Dynamics........................................................................37 3. The Government Finance Statistics Manual 2001 Analytical Framework .....................41 4. Commercial Orientation of Public Enterprises in Colombia ...........................................44 Appendix Figure 4. Public Investment and Growth, 1970-2000 ....................................................................35 Appendix Tables 1. The Effect of Public Investment on Output, Productivity, and Growth .........................33 2. Colombia: Commercial Orientation of Public Enterprises .............................................46 References................................................................................................................................47
- 3 -
EXECUTIVE SUMMARY
The share of public investment in GDP, and especially the share of infrastructure investment, has declined during the last three decades in a number of countries, particularly in Latin America. Since the private sector has not increased infrastructure investment as hoped for, significant infrastructure gaps have emerged in several countries. These gaps may adversely affect the growth potential of the affected countries and limit targeted improvements in social indicators. Not only are the governments of these countries now seeking to reverse the declining trend of public investment, partly through increased resort to private-public partnerships (PPPs), but also multilateral development banks (MDBs) have signaled that they are prepared to redirect some of their lending to infrastructure projects, to help to close infrastructure gaps.
Against this background, questions have been raised about the widely used approach to fiscal analysis and policy, which focuses on the overall fiscal balance and gross public debt. A concern is that this approach may unduly constrain the ability of countries to take advantage of increased opportunities to finance high-quality infrastructure projects. In this context, some have advocated shifting to the current fiscal balance (which excludes public investment) as the fiscal policy target of choice. This paper examines the pros and cons of such a shift, and finds that the risks for macroeconomic stability and debt sustainability entailed by exclusive reliance on the current balance as a fiscal target outweigh the potential benefits.
Instead, the paper proposes that, while maintaining a focus on the overall balance and public debt as a basis for fiscal analysis and policy (and fiscal conditionality in Fund-supported programs), steps are taken to promote productive public investment. More specifically, with the support of the Fund, the MDBs, and other international partners as appropriate: increased priority should be given to spending on needed and well-designed infrastructure projects in budget allocations; room should be created, at least beyond the very short term, to protect high-priority projects when fiscal adjustment is required; and the scope for increased financing of new public investment that is consistent with short-term macroeconomic stability and longer-term debt sustainability should be fully utilized.
In addition, the paper addresses the concern, raised in particular by Latin American countries, that coverage of the operations of commercially-run public enterprises by fiscal indicators and targets unduly constrains investment by these enterprises. The paper finds that, indeed, the coverage of fiscal indicators and targets varies significantly across countries, with coverage being in general broader in Latin America than elsewhere. This is reflected in Fund documents and Fund-supported programs. The paper recommends the exclusion of the operations of commercially-run public enterprises from fiscal indicators and targets in countries where currently the entire public sector is covered, based on criteria that are specified in the paper. The progressive extension of coverage in other countries, to encompass the general government and public enterprises that are not commercially run, is also recommended.

- 4 -
The paper also discusses the main preliminary lessons from the growing experience with PPPs. Although PPPs, if well structured and implemented, offer the prospect of sizable efficiency gains in the construction of infrastructure assets and the provision of associated services, they can involve significant costs and risks for government over the longer term, and under certain circumstances can even threaten debt sustainability. The current lack of an internationally accepted accounting and reporting standard for PPPs creates an incentive for governments to use these arrangements to ease budgetary constraints in the short term, without due regard to longer-term debt sustainability. While such a standard is being developed, the paper puts forward preliminary proposals for incorporating in assessments of debt sustainability the known future costs of PPPs, as well as the potential future costs associated with the provision of government guarantees in PPP contracts. It also emphasizes the importance of full disclosure of such contracts.
Finally, the paper proposes that a few pilot case studies be undertaken over the next several months. These will be done partly with a view to assessing the resource costs of the approaches described above. Agreement of the countries concerned will be sought, and there will be close cooperation with the World Bank and other MDBs.

- 5 -
I. INTRODUCTION 1. The share of public investment in GDP, and especially the share of infrastructure investment, has declined during the last three decades in a number of countries. There is a concern, especially in Latin America, that this has resulted in infrastructure gaps that may adversely affect longer-term growth. It may also curtail the capacity of developing countries to meet broader development objectives, including the Millennium Development Goals (MDGs). Against this background, the World Bank and other multilateral development banks (MDBs) have signaled their preparedness to redirect some of their lending to infrastructure projects.1 In this connection, there is also a concern that the widely used approach to fiscal analysis and policy—which focuses on the overall fiscal balance and gross public debt—may unduly constrain the ability of countries to take advantage of increased opportunities to finance public investment by borrowing from MDBs, bilateral donors, and market sources. Similar issues are being discussed in the euro area, since a consequence of the fiscal deficit limits under the Stability and Growth Pact (SGP) is that member countries which have reached these limits cannot borrow to finance additional public investment, even if they have low debt and face significant infrastructure needs.
2. This paper addresses a number of fiscal issues facing countries that wish to significantly increase public investment. Following a review in Section II of trends in public investment in major regions, and of available evidence on the relationship between public investment and economic growth, Section III discusses the analytical framework to be used in assessing the scope to increase public investment, and to protect it when fiscal adjustment is needed. Recognizing that an overly broad definition of fiscal activity could lead to excessive curtailment of public investment, Sections IV and V turn to the proper measurement of public investment for analytical purposes, focusing on the coverage of fiscal indicators and targets, and the treatment of public-private partnerships (PPPs) in the fiscal accounts. Section VI summarizes the main conclusions of the paper, and proposes possible next steps toward reflecting them in the operational activities of the Fund. Section VII suggests issues for discussion by Executive Directors.
II. PUBLIC INVESTMENT AND GROWTH
3. Over the last three decades, the share of public investment in GDP has declined on average in advanced OECD countries, and more significantly so in Latin America,
1 At a meeting of international financial institutions on Revitalizing Infrastructure: Cooperation Among International Financial Institutions (Washington, D.C., September 9, 2003), all of the multilateral development banks indicated that they have plans to increase infrastructure lending. In this connection, the World Bank has recently issued an Infrastructure Action Plan which envisages increased use of existing financial instruments, and the creation of new instruments, to meet rising infrastructure demand.

- 6 -
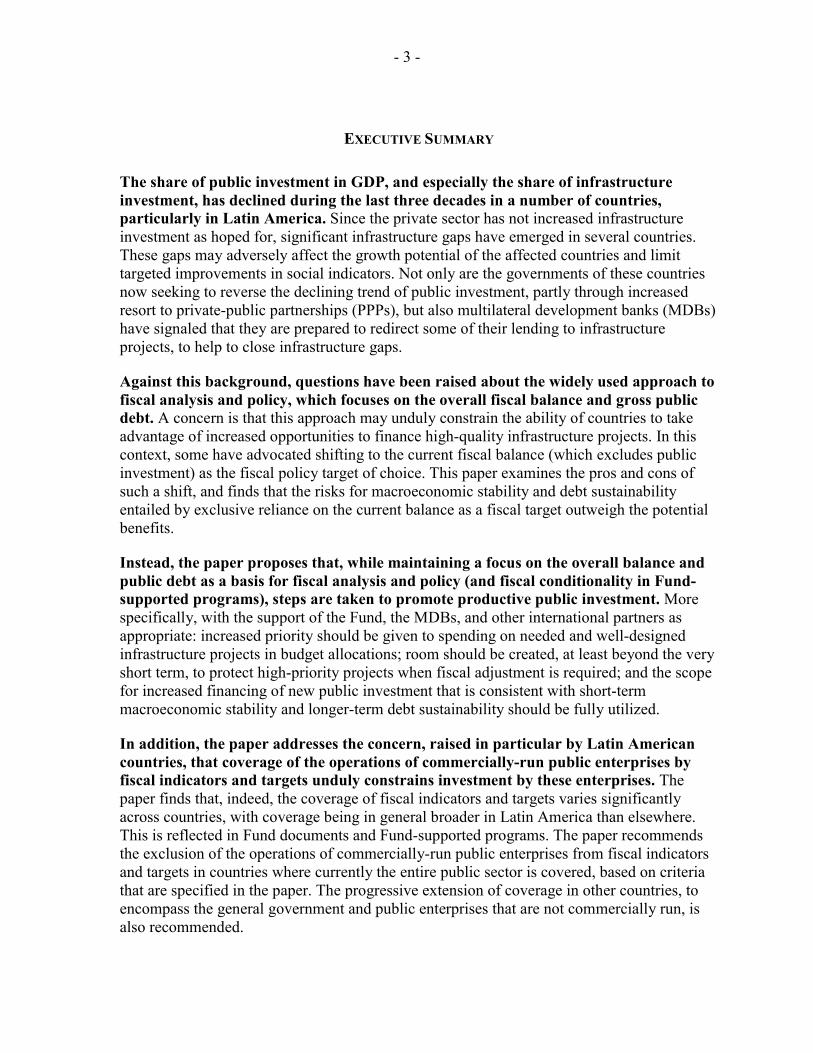
where it has also displayed substantial volatility. This decline has been wholly or partly offset in these regions by a rising share of private investment in GDP. As a result, the share of total investment in GDP has fallen in advanced OECD countries, while it has fluctuated around a broadly flat trend in Latin American countries (Figure 1).2 In contrast, the share of public investment in GDP has shown on average no clear upward or downward trend in Asian and African countries, albeit with significant volatility in some countries. The same is true for the shares of private and total investment in GDP in African countries. In Asian countries, these shares showed a rising trend through to the mid-1990s, but fell sharply in the aftermath of the crisis that hit Southeast Asia in 1997 (Figure 2).3
4. The possibility that a declining share of public investment in GDP could have adverse consequences for economic growth over the longer term is a legitimate cause for concern, although the empirical evidence in this area is inconclusive. There are a number of reasons why the many studies on this topic, which are reviewed in Appendix I, do not yield clear-cut conclusions.4 First, it is difficult to control for all the factors, in addition to public investment, that affect growth over the longer term. Second, a sizable portion of public investment is directed to supporting broad functions of government, including redistribution and the provision of social services, maintaining law and order, and administration, which do not directly boost productive potential. And third, the lumpy nature of much infrastructure investment implies that the full impact of investment in roads,
2 While data on public investment—that is gross fixed capital formation by the public sector or, in some cases, general government—are readily available for advanced OECD countries, this is the case for only selected countries in Latin America, Asia, and Africa.
3 There is relatively little information on what has happened to public capital stocks as a consequence of declining public investment. Kamps (2003) reports declines (relative to GDP) across advanced OECD countries since the late 1970s, the principal exceptions in this regard being Japan, Sweden, Switzerland and the countries of southern Europe. There were especially significant declines in Denmark, Ireland, the Netherlands, and the United Kingdom.
4 Appendix I does not cover the literature which explores whether higher public investment can raise growth rates in the short term. Generally speaking, fiscal multipliers are quite low, and because of the lags involved in launching new public investment projects or even expanding existing projects, increases in current spending and tax cuts tend to be a more effective means of boosting aggregate demand. However, since investment projects can be halted more quickly than they can be started, the costs of cutting public investment in terms of foregone output may be felt quite quickly. Hemming, Kell, and Mahfouz (2002) review the literature on fiscal multipliers.

- 7 -
0 1 2 3 4 5 6 7
1970 1973 1976 1979 1982 1985 1988 1991 1994 1997 2000
United Kingdom
Average for selected OECD countries 1/ United States
Germany Italy
Figure 1. Investment Trends in Advanced OECD and Selected Latin American Countries, 1970–2000 (In percent of GDP)
Source: International Finance Corporation and OECD. 1/ Unweighted average for Australia, Austria, Belgium, Canada, Denmark, Finland, France, Germany, Ireland, Italy, Japan, Norway, Portugal, Spain, Sweden, United Kingdom, and United States.2/ Unweighted average for Argentina, Brazil, Chile, Colombia, Ecuador, and Mexico.
0
2
4
6
8
10
12
14
1970 1973 1976 1979 1982 1985 1988 1991 1994 1997 2000
MexicoArgentina
Chile
Brazil
Average for selected Latin American countries 2/
Public Investment Advanced OECD Latin America
Private Investment Latin America
5
10
15
20
25
30
1970 1973 1976 1979 1982 1985 1988 1991 1994 1997 2000
United Kingdom
Average for selected OECD countries 1/
United States
Germany
Italy
0
5
10
15
20
1970 1973 1976 1979 1982 1985 1988 1991 1994 1997 2000
Average for selected Latin American countries 2/
Mexico
Argentina
Chile
Brazil
Total Investment Latin AmericaAdvanced OECD
10 12 14 16 18 20 22 24 26 28 30
1970 1973 1976 1979 1982 1985 1988 1991 1994 1997 2000
United Kingdom
Average for selected OECD countries 1/
United States
Germany
Italy
5
10
15
20
25
30
1970 1973 1976 1979 1982 1985 1988 1991 1994 1997 2000
Average for selected Latin American countries 2/
MexicoArgentina
Chile
Brazil
Advanced OECD
- 8 -
0 2 4 6 8
10 12 14 16 18 20
1970 1973 1976 1979 1982 1985 1988 1991 1994 1997 2000
Malaysia
India
Thailand
Average for selected Asian countries 1/
Korea
Indonesia
Figure 2. Investment Trends in Selected Asian and African Countries, 1970–2000(In percent of GDP)
Source: International Finance Corporation. 1/ Includes unweighted average of Bangladesh, China, India, Indonesia, Korea, Malaysia, Pakistan, Philippines, and Thailand.2/ Includes unweighted average of Benin, Cote d'Ivoire, Guinea-Bissau, Kenya, Madagascar, Malawi, Mauritania, Mauritius, Namibia, and Seychelles. Average is reported for 1976-2000, due to incomplete data prior to 1976.
Public Investment Asia Africa
Private Investment Asia Africa
Total Investment Asia Africa
0
2
4
6
8
10
12
14
16
18
20
22
1970 1973 1976 1979 1982 1985 1988 1991 1994 1997 2000
Malawi
Mauritius
Kenya
Average for selected Sub-Sahara African countries 2/
Tunisia
Cote d'Ivoire
0
5
10
15
20
25
1970 1973 1976 1979 1982 1985 1988 1991 1994 1997 2000
Malawi
Mauritius
Kenya
Tunisia
Cote d'Ivoire Namibia
Average for selected Sub-Sahara African countries 2/
5
10
15
20
25
30
35
1970 1973 1976 1979 1982 1985 1988 1991 1994 1997 2000
Malawi
Mauritius
Kenya
Tunisia
Cote d'Ivoire
Namibia
Average for selected Sub-Sahara African countries 2/
5 10 15 20 25 30 35
1970 1973 1976 1979 1982 1985 1988 1991 1994 1997 2000
Malaysia
India
Thailand
Korea
Indonesia
Average for selected Asian countries 1/
10 15 20 25 30 35 40 45
1970 1973 1976 1979 1982 1985 1988 1991 1994 1997 2000
Malaysia
India
Thailand
Korea
Indonesia Average for selected Asian countries 1/

- 9 -
telecommunications, and other infrastructure on growth can only be realized with considerable lags, once effective networks have been established.5
5. There are also reasons to believe that the ratio of public investment to GDP can fall over time without any negative impact on growth. First, poorer countries have to invest heavily in basic infrastructure, and both the limited capacity of the private sector and thin capital markets require extensive government intervention in large-scale investment projects. However, as development proceeds, the public capital stock is built up, and financial markets expand, the role of the private sector in the provision of infrastructure can be expected to increase, especially in those areas where technological advances have reduced the scale of production and increased the scope for competition (e.g., electricity generation and telecommunications).6 Second, in some countries, a declining public investment ratio may reflect a trend towards smaller government. This trend, which manifested itself in privatization and other ways of reducing the role of government in the economy during the 1980s and 1990s, implies that private investment will be substituted for public investment. This in turn was expected to increase efficiency and boost growth prospects, in part by reducing the scope for “white elephants” and other forms of wasteful public investment that can actually hinder longer-term growth.7
6. There is, however, evidence that public investment has fallen because of fiscal adjustment, and on this count there are reasons to be concerned. There is cause for worry either if cuts in public investment are not reversed, and thus fiscal adjustment contributes to declining public investment ratios, or if cuts are reversed and there is substantial volatility in public investment instead (which can reduce the efficiency of both public and private investment). There is evidence suggesting that in a number of cases fiscal adjustment has fallen disproportionately on public investment. For example, the World Bank (1988) reports that cuts in public investment were on average more than three times larger than cuts in current spending during periods of fiscal adjustment in the 1980s. There is also evidence that fiscal adjustment has had a significant impact on public investment in Latin American countries (Servén and Solimano, 1992, and Calderón, Easterly, and Servén, 2003a). It is estimated that about half of the fiscal adjustment in Argentina, Bolivia, Brazil, Chile, and Peru during the 1990s reflected a compression of investment in infrastructure
5 There is little evidence on relative rates of return on public and private investment. However, a study for advanced OECD countries shows that the short- to medium-term rates of return on public and private investment in infrastructure are similar, but long-term rates of return for public investment are significantly higher (Demetriades and Mamuneas, 2000).
6 As a result, public investment ratios are lower in advanced OECD countries than in other regions (see Figures 1 and 2).
7 See Tanzi and Davoodi (2002) for a discussion of the links between wasteful public investment, low growth, and corruption.

- 10 -
(Calderón, Easterly, and Servén, 2003a). For OECD countries, Roubini and Sachs (1989) observe that public investment is often quickly and drastically cut during periods of restrictive fiscal policy. More specifically for the euro area, it has been claimed that the SGP deficit limits have contributed to the recent decline in public investment in Europe (Blanchard and Giavazzi, 2003). Others, however, while acknowledging that fiscal adjustment in the run-up to monetary union (to meet the deficit and debt targets under the Maastricht Treaty) may have adversely impacted public investment, attach more importance to the preference for smaller governments in general (European Commission, 2003, and Galí and Perotti, 2003).
7. It is especially worrying when fiscal adjustment results in infrastructure compression, for a number of reasons. Recent empirical studies focusing specifically on infrastructure investment have tended to show a strong and fairly robust impact on growth. Calderón, Easterly, and Servén (2003b) estimate that infrastructure compression in the 1990s reduced longer-term growth by about 3 percentage points a year in Argentina, Bolivia, and Brazil, and by 1½–2 percentage points a year in Chile, Mexico, and Peru. There are also clear links between infrastructure development and poverty, and with many of the MDGs.8 Finally, private sector involvement in infrastructure has also been smaller than originally expected. After increasing more than six fold between 1990 and 1997, investment in infrastructure projects with private participation was almost halved between 1997 and 2001 (Harris, 2003), despite increasing use of PPPs during the latter period.9
8. Finally, there is evidence supporting the claim that there are sizable infrastructure gaps in Latin America, as well as in other regions. Indeed, Calderón and Servén (2003) find that infrastructure gaps in Latin American countries relative to East Asian countries account for about one third of the gap in output per worker between these regions. Moreover, Leipziger, Fay, Wodon, and Yepes (2003) estimate that governments and private sectors in developing countries will have to spend 5½ percent of GDP annually on new investment and maintenance over 2005–10 to achieve the MDGs, with the corresponding figures for low-, middle-, and upper-income countries being 7, 5, and 1 percent of GDP respectively. Of course, these aggregate figures mask significant variations across countries
8 Brenneman and Kerf (2002) review the literature on infrastructure development and poverty.
9 This may have been caused by a variety of factors, which would vary in importance across countries: the impact of financial crises in the second half of the nineties; higher than anticipated costs of doing business in emerging market economies and developing countries, including costs associated with uncertainties related to the judicial process and with bureaucratic procedures, corruption, and discriminatory regulation and taxation; bad publicity associated with claims that some large infrastructure projects had adverse social and environmental consequences; and the fact that the more lucrative investment opportunities in the power and telecommunications sectors were coming to an end in a number of countries.

- 11 -
and sectors. Specific analysis of infrastructure needs in individual countries will be necessary to design appropriate strategies for infrastructure development in each country.
III. THE ANALYTICAL FRAMEWORK
9. Decisions about public investment should reflect both microeconomic and macroeconomic considerations.
• From the microeconomic perspective, government involvement has to be justified by reference to market failure. In this connection, factors such as the network and natural monopoly characteristics of many infrastructure projects, their large financing requirements and sunk costs, and an emphasis on social rather than financial returns argue in favor of public investment. Social returns should include the positive impact of public investment on private investment.10 For all projects, social returns should exceed the opportunity cost of government funds. Countries should also have the institutional capacity to manage a public investment program of the appropriate size.
• From a macroeconomic perspective, public investment has to be financeable, and financing constraints may limit the scope to take on new projects. Where financing is available, total public investment should be consistent with maintaining macroeconomic stability, and in this context, attention needs to be paid both to aggregate demand conditions and, especially in low income countries, to absorptive capacity more generally.11 Additional borrowing also has to be consistent with public debt sustainability. A sufficient (but not necessary) condition for this is generally that financial rates of return to public investment earned by the government (which are reflected in tax revenue, user charges etc.) are higher than the borrowing costs of the government; that said, even in this case attention needs to be paid to the uncertainties surrounding these returns. In addition, it is necessary to ensure that mismatches between the timing of debt service costs and project returns do not create short-term liquidity problems.
This following sections discuss how these considerations can be best reflected in the framework used for fiscal analysis and policy purposes.
10 See Erenburg (1993) and Erenburg and Wohar (1995) for evidence on the relationship between public and private investment.
11 See Heller and Gupta (2002) and World Bank-International Monetary Fund (2003) for further discussion.

- 12 -
A. Targeting the Overall Fiscal Balance and Public Debt
10. The most widely used approach to fiscal analysis and policy, and to setting fiscal targets, focuses on the overall fiscal balance and gross public debt. Both the literature and country experiences point to clear links between these indicators and short-term macroeconomic stability, as well as longer term debt sustainability. It is for this reason that this approach is used by country authorities, financial markets, analysts, and international organizations, including the Fund. In implementing the approach, the overall fiscal balance and public debt targets are set at levels which—in combination with other macroeconomic and structural policies—support specific output, inflation, and balance of payments objectives, and ensure a sustainable (i.e., constant or declining) debt path.
11. This approach does not preclude paying attention to the structure and quality of fiscal policy. Indeed, multilateral and bilateral donors, including the Fund, devote considerable technical assistance resources to helping countries improve the level and composition of revenue and expenditure, and to assisting in particular with reforms directed at removing distortions and other impediments to growth, and promoting distributional equity. Assistance is also provided to help strengthen fiscal institutions. The quality of fiscal adjustment is also a key consideration in the design of Fund-supported programs, with an emphasis on the implementation of revenue and/or expenditure measures that are institutionally feasible and durable, promote efficiency and minimize the social costs of adjustment, and are owned by country authorities.
12. Targeting the overall fiscal balance and public debt, while at the same time paying attention to structure and quality of fiscal policy, is in principle fully consistent with the goal of promoting productive public investment. However, as explained in Section II, it has proved difficult to achieve all of these objectives simultaneously, and to prevent public investment from bearing the brunt of required fiscal adjustment. A number of factors have contributed to such an outcome.
• First, political economy considerations suggest that cutting current spending is often difficult because such spending benefits politically influential interest groups (e.g., civil servants, the military, farmers). By the same token, any scope to increase spending following adjustment tends to be used to benefit the same groups.12
• Second, there are structural impediments to fiscal reform. In particular, existing legislation on entitlement programs, as well as weaknesses in revenue administration
12 While it could be argued that public investment can also benefit those with political influence, and there are examples where this is clearly the case, the literature on the political economy of fiscal adjustment emphasizes the resilience of current spending. See Alesina and Perotti (1995) for a review of this literature.

- 13 -
and budget management, can make cutting current spending and revenue mobilization more difficult in the short term than halting a few large public investment projects.
• Third, it is easier (albeit not costless) to interrupt public investment projects, and then resume them when funds become available. This is neither a feasible nor in general a desirable option for wages, transfers, and interest payments which make up the bulk of current spending. Thus, public investment projects are easier targets when fiscal adjustment is called for, and this is a source of the volatility in public investment noted above.
• Fourth, a tendency to base fiscal policy on overoptimistic growth and investment projections is a source of both excessive tightening—if initial fiscal targets are adhered to despite slower-than-expected growth—and unnecessary compression of public investment—which may have been set at too low a level at the start of a program on the basis of optimistic projections of private investment, and is then cut further to meet fiscal targets.13
B. Targeting the Current Fiscal Balance
13. Concerns about the decline in the share of public investment in GDP in a number of countries have prompted calls to treat investment spending differently to current spending for fiscal analysis and policy purposes. One approach to doing this would be to target the current fiscal balance, which excludes public investment, rather than the overall balance. A corollary is that borrowing to finance infrastructure would not be counted against debt targets. Such an approach has been specifically proposed by some Latin American countries.14 A variant of this approach is the so-called golden rule, which requires governments to run a current balance or surplus. Some type of golden rule is followed in various countries at the central and subnational levels (e.g., the United Kingdom, Germany, and the United States). Given the need to step up infrastructure investment in many of the current euro area member countries, and in most of the EU accession countries, it has also been suggested that the SGP should be made more flexible in this regard, by allowing the exclusion of investment in infrastructure from the pact’s targets and ceilings.15
13 IEO (2003) notes that Fund-supported programs tend to be based on overoptimistic growth and investment projections.
14 In this connection, President Fox of Mexico, on behalf of a group of Latin American leaders, made a proposal at the 2003 G-8 Summit in Evian that a committee of representatives from the G-8 countries, international financial institutions, and two emerging market economies should propose concrete mechanisms to move in this direction.
15 See Blanchard and Giavazzi (2003), Buiter and Grafe (2002), and Galí and Perotti (2003). The SGP fiscal policy framework requires that general government finances must be close to
(continued)

- 14 -
14. There are a number of arguments in favor of targeting the current fiscal balance.
• It would appropriately recognize that, in contrast to current spending, productive public investment adds to the stock of public (physical) capital. If financial returns match (or exceed) the cost of borrowing, the net worth of the government is not affected (increases).
• Borrowing to finance productive public investment can pay for itself over the longer term, at least in part and wholly in some cases, both through higher growth which raises tax revenue and to the extent that the government receives user fees.
• Spreading the costs of public investment over time promotes intergenerational equity. By financing public investment through borrowing, rather than through current savings, governments can shift part of the cost of investment to future beneficiaries by having them service the resulting debt.
• If public investment is productive, a balanced current budget is consistent with a positive steady-state public debt ratio. More specifically, it results in a steady-state ratio of public debt to GDP which is linked to the steady-state ratio of the public capital stock to GDP. This contrasts with a balanced overall budget, which eventually drives the ratio of public debt to GDP to zero. Such an outcome is unlikely to be optimal in theory or practice. Appendix II covers the analytics of budget rules and public debt dynamics.
15. However, focusing exclusively on the current balance for fiscal analysis and policy purposes, and as a fiscal target, would entail significant risks.
• In countries where financing is constrained, there is little alternative to focusing on the overall balance. Indeed, if gross financing requirements (including the rollover of debt coming due) are large, fiscal targets may have to be set in the light of total, rather than net, financing availability. Likewise, in countries facing excess demand pressure, public investment cannot be excluded when assessing the degree of fiscal adjustment required to bring domestic absorption into line with resource availability. This again argues for focusing on the overall balance rather than just the current balance.
balance or in surplus over the medium term. At the same time, the SGP includes an excess deficit procedure to which a member country is subject when its deficit exceeds 3 percent of GDP. Limited scope for flexibility is provided by the provision under this procedure that the European Commission can take into account the level of public investment in determining whether a country’s deficit is excessive.

- 15 -
• Even public investment with significant positive impact on economic growth may not be sustainable if governments are unable to realize the fiscal dividends of growth (e.g., because of poor tax administration), or if additional revenue generated by these projects is earmarked to new (particularly current) spending. Borrowing may also need to be constrained because of concerns about longer-term debt sustainability. Gross public debt matters even when it is offset by public assets, both because of the signals high debt levels send to markets, and because heavy debt service limits the government’s room for maneuver in the face of adverse shocks. These concerns apply especially to indebted emerging market economies facing high borrowing costs, where macroeconomic variables (growth, interest rates, and exchange rates) are volatile, and with uneven access to capital markets. They may also be relevant to advanced OECD and other countries where aging populations will create an increasing fiscal burden.
• While the current balance approach assumes that public investment yields adequate returns, in reality public investment projects are not necessarily of high quality. In the absence of appropriate screening and monitoring mechanisms, governments may incur large borrowing costs to finance investments with low rates of financial and even social return, in some cases undermining the prospects for debt sustainability. Conversely, other uses of public funds—namely to restructure revenue and expenditure—may have a higher rate of return than public investment. In countries with large infrastructure gaps, certain projects (e.g., roads, ports, airports) may have very high rates of return that justify giving them priority in the budget process. However, in other countries, investment in human capital may be a higher priority, in part because it may have a larger impact on growth. Also, reducing very high tax rates, or eliminating major tax distortions, may be the most pressing need. Excluding public investment from fiscal targets would create a bias against these choices.
• Freeing public investment from any fiscal constraint may also discriminate against private involvement in infrastructure, even in circumstances where such involvement would be desirable on efficiency grounds (e.g., when there is no obvious market failure). This problem would be compounded if weaknesses in the planning of public investment create concerns about macroeconomic stability and/or debt sustainability that lead to higher interest rates, which in turn would discourage private investment. Too little attention may also be paid to ensuring that an appropriate legal and institutional framework is put in place to promote private investment in infrastructure.
• Finally, focusing on the current fiscal balance may invite creative accounting, with a view to classifying current spending as investment, and thereby excluding it from fiscal targets. There are numerous examples of such practices in countries using some variant of the golden rule.

- 16 -
C. Safeguarding Public Investment, Macroeconomic Stability, and Debt Sustainability
16. In view of the risks associated with the current balance approach, it is proposed instead that a number of steps are taken to strengthen the present approach to fiscal analysis and policy, with a view to jointly safeguarding public investment, macroeconomic stability and debt sustainability. In particular, more attention should be paid to determining the scope to increase productive public investment, to using the current balance as a fiscal indicator, and to adopting structural fiscal targets.
17. Assessing the scope to increase productive public investment has two aspects.
• First, the fiscal impact of public investment has to be determined. The size and composition of an annual investment program should be chosen taking into account its short- and longer-term impact on government finances. This requires detailed projections of any multi-annual outlays to cover construction costs, future operation and maintenance, and debt service, and of any direct revenues (e.g., user fees) from the projects. These projections are needed for a reliable assessment of the consistency of the proposed investment program with financing availability, short-term macroeconomic stability, and longer-term debt sustainability. Insofar as possible, any quantifiable impact on productive potential, and therefore on growth and tax revenue over the longer term, should also be assessed.
• Second, there is a need for assurance about the quality of public investment, and where necessary to improve its productivity and cost effectiveness. This requires building up the institutions and capacity to conduct technically sound and nonpoliticized cost-benefit analysis of proposed investment projects, to structure contracts and evaluate bids, and to monitor closely the implementation of the projects. In this connection, the planned stepping up of infrastructure financing by the MDBs will have the added benefit of improving the selection and oversight of projects.
18. Placing increased emphasis on the current fiscal balance (and government net worth) reflects an explicit recognition of the asset-creating nature of public investment. It would imply an increased effort over time to rely on revenue mobilization and reform of current spending (including entitlement programs) to undertake necessary fiscal adjustment. In some cases, it may be helpful to adopt an explicit current balance target, in addition to the usual overall balance and debt targets.16 The Fund’s Government Finance Statistics Manual 2001 (GFSM 2001) is a fiscal reporting framework that provides a basis for the calculation
16 Modifying the analytical approach in this way would also be consistent with the well-established view that one fiscal indicator is not satisfactory for all purposes. Tanzi (1993) discusses the issues involved in measuring the fiscal deficit, and advocates use of a range of indicators.

- 17 -
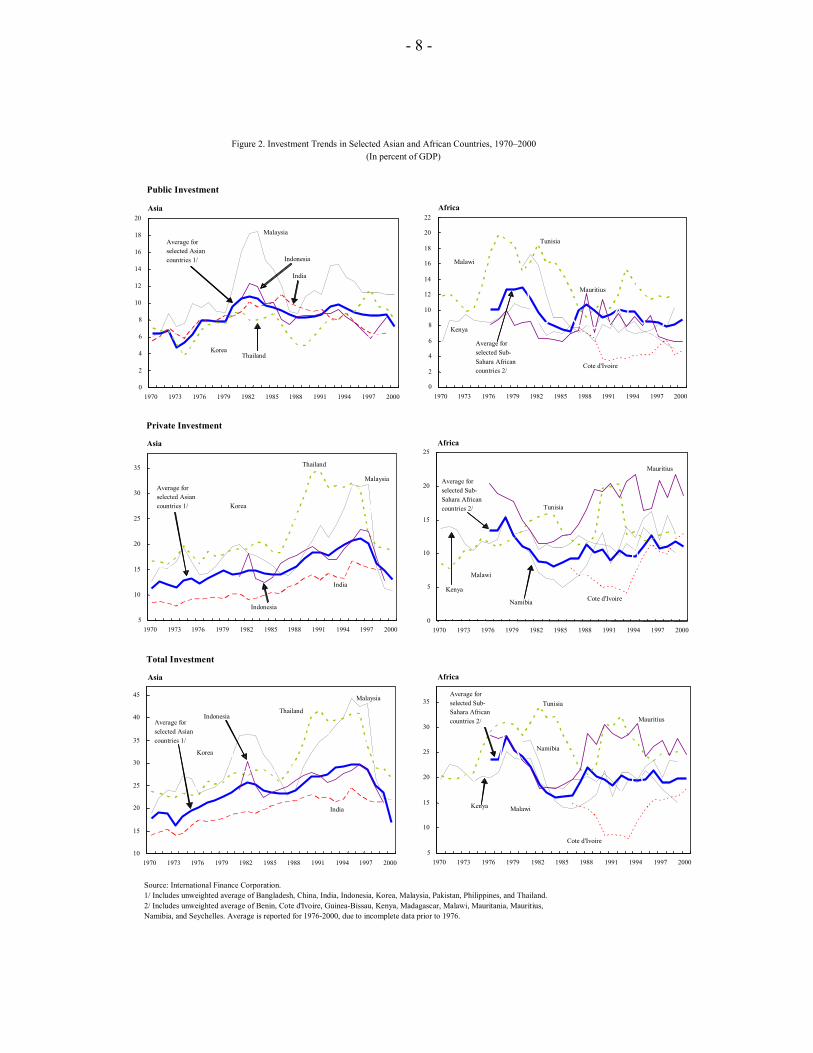
and analysis of the current balance (the operating balance in the GFSM 2001 terminology) and net worth (see Appendix III for details).
19. The adoption of structural (or cyclically-adjusted) fiscal targets would reduce the volatility and procyclicality of fiscal policy. This would respond to political economy and institutional factors that limit the scope for adjusting revenue and curtailing current spending, especially in the short term. A number of studies, in particular by the IDB,17 have pointed to the volatility and procyclicality of fiscal policy, in particular in Latin American countries, resulting from the combination of significant vulnerability to exogenous macroeconomic shocks, electoral cycles, and the lack of budget rules to constrain spending during good times. Targeting structural fiscal balances is an intellectually appealing way of limiting fiscal policy discretion during “good times” so as to provide room for maneuver in “bad times.” That said, the practical difficulties of estimating structural balances in countries, like most of those in Latin America, which experience large, unpredictable shocks and are subject to significant structural change, should not be underestimated. Moreover, in some countries with high debt and large refinancing requirements, the scope for moderating the fiscal adjustment required by financing constraints may remain limited in the short run, even if prudent fiscal policies are followed in good times. Further analysis of these issues (including the experiences to date of countries like Chile, which have adopted a structural budget balance target, or have implemented other fiscal smoothing mechanisms) is clearly desirable, and the staff will return to the Board with a paper on this topic.
IV. THE COVERAGE OF FISCAL INDICATORS AND TARGETS
20. There may also be a link between coverage of fiscal indicators and targets in some countries—particularly in Latin America—and infrastructure compression. Since public enterprises are often responsible for key areas of infrastructure investment, fiscal targets that cover public enterprises could be an obstacle to such investment, even when undertaken by commercially run enterprises.
21. In principle, fiscal statistics should cover all activities of a fiscal nature, whether carried out by governments or by other institutions, including public enterprises. In practice, since the bulk of fiscal activity tends to be carried out by (different levels of) government, the focus in national accounting standards (e.g., the 1993 System of National Accounts (1993 SNA) and the 1995 European System of Accounts (ESA 95)) has tended to be on the activities of the general government. This focus is also shared by the GFSM 2001 fiscal reporting framework. However, in recognition of the fact that quasi-fiscal activities (QFAs) are often carried out by public enterprises, GFSM 2001 also recommends the collection and compilation of aggregate statistics on public enterprises and the public sector as a whole. An additional reason for covering public enterprises in the fiscal accounts is that
17 See Gavin and Perotti (1997) and Gavin and Hausmann (1998).

- 18 -
they may be a source of significant contingent liabilities for the government, which may be explicit, as in the case of guarantees, or implicit if there is an expectation, based on past experience, that a public enterprise which gets into trouble because of excessive borrowing will be eventually bailed out by the government.18
A. The Current Approach to Coverage
22. The coverage of fiscal statistics reported in Fund documents varies across regions, with the broadest coverage being found in Latin America. This is clear from Figure 3, which shows the proportion of countries by region that report fiscal statistics for the central government (100 percent), the general government (55 percent on average), and the nonfinancial public sector (23 percent on average), as well as the corresponding figures for the coverage of fiscal performance criteria under Fund-supported programs (90, 39, and 22 percent respectively). By contrast, the operations of public enterprises are covered in the fiscal accounts of over 80 percent of Latin American countries, and in setting performance criteria for 75 percent of these countries. This uneven coverage partly reflects a history in Latin American countries of using public enterprises for fiscal purposes, and allowing some enterprises to build up excessive amounts of debt, which has often led to government bailouts of enterprises.19 Where public enterprises are not covered in Latin American countries, it is usually because data are not available, or only available with lags that are incompatible with the desired periodicity of fiscal monitoring. The broader coverage of fiscal targets for Latin American countries has been a source of concern for some leaders in the region
23. Public enterprises are rarely covered by fiscal statistics in other regions. The coverage of public enterprises in Fund documents in advanced OECD countries is limited, and it is narrowest in the subgroup of countries in Europe, where coverage is only 5 percent. In these countries, limited coverage is justified because public enterprises are in the main commercially run. In Africa, Asia, the Middle East, and elsewhere in Europe, public enterprises are covered in at most 14 percent of countries (in Africa) and not at all in the Middle East. The situation is similar with respect to the coverage of fiscal performance criteria. In these countries, coverage of public enterprises is limited mainly because of a lack of data; indeed, data limitations explain why coverage is limited to the central government for many countries. Yet there are numerous instances of public enterprises in countries with narrow coverage that undertake significant QFAs and borrow heavily.
18 The Fund’s Code of Good Practices on Fiscal Transparency recommends reporting of the consolidated public sector balance where public enterprises (or public financial institutions) carry out significant QFAs or are judged to borrow excessively. The Code also calls for separate reporting of the nature and fiscal significance of QFAs.
19 For example, the 1980s debt crisis in Latin America partly reflected an unsustainable accommodation of debt by (or in the name of) public enterprises.

- 19 -
Figure 3. Coverage of Fiscal Statistics and Targets in Staff Reports and Fund-Supported Programs
(In percent of relative country groupings)
Source: Information provided by area departments.1/ Excluding Australia, Japan, and New Zealand.
0 10 20 30 40 50 60 70 80 90 100 Other European
Middle East Asia 1/ Africa
of which: Europe Advanced OECD
Latin America All countries
Fund-Supported Programs
0 10 20 30 40 50 60 70 80 90 100
Other European
Middle East
Asia
Africa
Latin America
All countries
Central government General government Nonfinancial public sector
Staff Reports

- 20 -
B. An Improved Approach to Coverage
24. Excluding the operations of public enterprises that are commercially run from fiscal indicators and targets would allow a more appropriate assessment of a country’s fiscal stance, and would eliminate inappropriate constraints on investment by these enterprises. As a general rule, if an enterprise undertakes significant QFAs, relies substantially on government financial support, or on extensive explicit or implicit government guarantees, then it cannot be considered to be a commercial enterprise. However, these characteristics are not easily observable in practice. Therefore, in assessing the commercial nature of public enterprises, reliance needs to be placed on a few objective criteria that can be tested on the basis of relatively easily available data. Based on approaches developed in the cases of Brazil and Turkey (see Box 1), this paper proposes nine criteria, falling into four broad categories: managerial independence, relations with government, financial conditions, and governance structure (see Box 2). Requiring that all the criteria be met would minimize the risk of errors in excluding enterprises from coverage, but would probably be too restrictive. It is therefore proposed that all four criteria related to managerial independence and relations with government, plus at least one of the criteria related to each of financial conditions and governance structure, would have to be met for an enterprise to be considered commercially run.
25. It should be stressed that the proposed criteria are at this stage preliminary. The criteria have been applied to the case of Colombia, where, as illustrated in Appendix IV, the exercise led to one of the fourteen largest public enterprises being judged to be commercially run. However, one example—and especially one that at this stage remains preliminary and incomplete—is hardly sufficient to assess the applicability of the suggested criteria to a wide range of circumstances. In this connection, further work is needed to determine whether all of the criteria, which have been developed mainly for enterprises operating in monopolistic or oligopolistic markets, are applicable to public enterprises operating in a competitive setting, and to distinguish legitimate subsidies—that is, transparent payments to otherwise commercially run enterprises that perform a service on behalf of the government—from subsidies that compensate for inefficiency. It is also important to note that, given existing data limitations, an expansion of coverage will necessarily take considerable time for many countries.
26. In implementing the proposed approach, practical considerations suggest that the starting point should be the current national treatment. Where the fiscal accounts already cover all public enterprises, the aim would be to identify commercially run enterprises and to exclude them from fiscal indicators and targets. In countries where the current coverage is the general government, the aim would be to identify public enterprises that are not commercially run for inclusion in the fiscal indicators and targets. If the current coverage is the central government alone, the priority will likely be to expand it to the rest of the general government, although factors such as the extent of fiscal decentralization, the relative importance of the fiscal risks posed by subnational governments and public

- 21 -
enterprises, as well as relative difficulties in data collection, should all be taken into account in designing an appropriate strategy for the expansion of coverage of the fiscal accounts.
Box 1. Approaches to Coverage in Brazil and Turkey
In the case of Brazil, the decision was made under the 2002–05 Stand-By Arrangement to include an adjustor to the primary surplus performance criterion to allow higher-than-programmed investment spending by Petrobrás, because it was deemed to be a commercially run public enterprise. In making such an assessment, Petrobrás met the following criteria: it earned an average rate of return and had a debt/equity ratio (adjusted for country risk) comparable to those of its international competitors; it had a diversified ownership structure, with the government’s share amounting to one-third of the company; it met international accounting standards, was subject to external audits, and had its shares listed on a major international exchange; it was not subsidized; and it was subject to the same regulatory and tax environment as private sector firms. However, there were criteria that Petrobrás did not meet: it did not have an independent board of directors (5 of the 9 directors are appointed by the government); there was not fully independent decision-making with respect to investment and pay policies (while in practice this was the case, legally the government had oversight in these areas); and there was some guaranteed borrowing (one World Bank loan was guaranteed by the government as required under the loan terms). The judgment was made by staff that there were adequate safeguards to minimize any risks linked to these arrangements.
Similar criteria were used in the case of Turkey to identify a subset of public enterprises that posed the greatest risk to the public finances and should therefore be monitored under the fiscal performance criteria and indicative targets of the 2002–04 Stand-By Arrangement. In Turkey, all 47 public enterprises are included under the main fiscal indicator. However, to monitor the program in a timely manner, 10 enterprises were included under the fiscal performance criteria and another 10 under indicative fiscal targets. An attempt was made to quantify the criteria and to calculate an aggregate fiscal risk score for each enterprise. The criteria covered: enterprise size measured in terms of sales, value-added, wages, investment, and employment; listings on major stock exchanges, a comparison of the legal framework with that for private firms, and the availability of comprehensive annual reports and audited financial statements; pricing policy, including the setting of administrative prices, the relationship between domestic prices and international prices (for tradable goods), and cost-recovery ratios (for utilities); rates of return (operating profit/capital), arrears (defined as accounts receivable/turnover), debt-equity ratios, and debt stocks; and the extent of government subsidies and transfers, direct lending and new equity injections, government guarantees, and tax arrears.

- 22 -
Box 2. Criteria for Assessing Whether Public Enterprises Are Commercially Run
Managerial Independence
Pricing policy. For producers of tradable goods and services, were average product prices over the last year within 10 percent of the established international price benchmark for those products? For producers of non-tradable goods and services, are prices set administratively or do they reflect marginal cost or cost-recovery considerations?
Employment policy. Is personnel policy independent of civil service laws, and more generally of government intervention in wage-setting and hiring?
Relations with Government
Subsidies and transfers. Has the government given direct or indirect subsidies, or explicit or implicit loan guarantees, to the enterprise, and has the enterprise made any special transfers to the government over the last three years?
Regulatory and tax regime. Is the enterprise subject to the same regulations and taxes as private firms in the industry?
Financial Conditions
Profitability. Is the average rate of return on capital over the last three years within one standard deviation of the industry-wide average in the country over the same time period?1
Creditworthiness. Is the cost of debt over the last three years within one standard deviation of the industry-wide average in the country over the same time period?1
Governance Structure
Stock listing. Is the enterprise listed on at least one major world stock exchange?
Outside audits and annual reports. Is the firm subject to outside audits and are comprehensive annual reports available for the last three years?
Shareholders’ rights. Are minority shareholders’ rights protected?
_____________________________ 1 In the case where data on rates of return or cost of debt are not available for a particular industry, or there is a high degree of concentration that could render the standard deviation calculation misleading, the economy-wide rate of return or cost of debt could be used.

- 23 -
27. The finances of those public enterprises that are not covered by fiscal indicators and targets should nevertheless be reported. This is needed for statistical purposes, and also to ensure that there is continuing justification for excluding them. An added reason for monitoring them is that even commercially run enterprises can borrow and invest irresponsibly, and more generally pose macroeconomic risks. Finally, governments need information on all the enterprises in which they have a stake, in order to effectively discharge their ownership and asset management responsibilities.
V. PUBLIC-PRIVATE PARTNERSHIPS
28. Public-private partnerships (PPPs) are becoming an increasingly important alternative to traditional public investment, and proper accounting and reporting of PPPs will be important to support responsible use of these new mechanisms. Not only can an infusion of private capital and management lead to a higher level of infrastructure investment and increased efficiency, but it also allows governments to spread the cost of these investments over time. However, an internationally accepted accounting and reporting standard for PPPs is currently lacking, and this is a source of uncertainty and arbitrariness in their treatment in the fiscal accounts. In particular, there is a danger that PPP investment will be treated either as public investment or private investment. In the former case, this could overstate the impact of PPPs on the overall fiscal deficit and public debt, which could produce a bias against PPPs that are more efficient than traditional public investment. Although PPPs are too recent an innovation to have substituted significantly for public investment, such a bias could conceivably lead to unnecessary compression of public investment looking forward. By contrast, if PPPs are treated wholly like private investment, their impact on the overall fiscal deficit and public debt could be understated, and there may be an incentive for the government to use PPPs simply to spread the impact of public investment on the fiscal accounts over time, rather than to maximize efficiency gains. Before discussing accounting and reporting in more detail, the fact that PPPs are a fairly recent innovation warrants the inclusion of some background information.
A. Background
29. A number of countries have fairly well-established PPP programs. Perhaps the best-developed program is the United Kingdom’s Private Finance Initiative (PFI), which began in 1992. A number of other advanced OECD countries also have significant PPP programs. In Latin America, Chile and Mexico have pioneered the use of PPPs to promote private sector participation in infrastructure projects. Other countries are lagging somewhat, but several are developing both PPP programs and the legal and institutional framework for such partnerships.20
20 The background paper on PPPs provides an overview of country experiences to date.

- 24 -
30. The basic feature of PPPs is that the private sector supplies infrastructure assets and services that have traditionally been provided by the public sector, often with the government as the main purchaser. Private sector involvement in sectors dominated by public enterprises (e.g., energy and telecommunications, where privatization or joint ventures have been extensive) and private financing of public investment without private provision of services are sometimes regarded as PPPs. However, PPPs are most often used to build and operate hospitals, schools, prisons, roads, and water supply and waste management facilities. The attractions of PPPs to the government are that private financing can initially support increased infrastructure investment without adding to direct government borrowing, and that private sector management and innovation should lead to better value-for-money. The attraction of PPPs to the private sector is that they offer new business opportunities in areas that have tended to be the preserve of the public sector.
31. The most common form of PPP is one where the government enters into a long-term contract with a private partner to supply specified services, and the private partner is responsible for designing, building, financing, and operating the asset required to deliver these services. It is the ability of the private sector to better coordinate and provide innovative approaches to managing these closely related activities—and the risks associated with them—that is the principal source of efficiency gains from PPPs. The private operator will typically own the PPP asset while operating it, but there is usually provision for the asset to be transferred to the government at less than its true residual value when the operating contract ends. There are numerous variations on this basic PPP theme, and PPPs are often complicated by the creation of special purpose vehicles to facilitate them, and a reliance on complex financial operations, such as securitization.
32. A successful PPP delivers high-quality services at lower cost than the government. For this to be the case, not only has the private sector to be more efficient, but also the efficiency gains have to be large enough to compensate for the fact that private sector borrowing costs are often higher than those of the government. The required efficiency gains are more likely to materialize if PPPs have the following characteristics.
• The quality of services is contractible. If the government can specify the quality of services it wants the private sector to supply, and can translate these into measurable output indicators, then it can enter into a contract with the private sector which links service payments to service delivery. The less clearly specified are the contract conditions, the greater the risk of costly renegotiation of the contract during its implementation.
• Risk is transferred to the private sector. PPP projects are exposed to a range of different risks, including construction delays and cost overruns; problems with service availability and quality; uncertainty about the future need for a service; and changing asset values. Adequate transfer of risk (and rewards) from the government to the private sector is necessary to get the full benefit from an inflow of private capital and a change in management responsibility.

- 25 -
• There is either competition or incentive-based regulation. There tends to be only limited scope for competition in the supply of infrastructure assets and services, because sunk costs are often large, many infrastructure services require the setting up of extensive networks (which introduces an element of natural monopoly), and the government is in many cases the main purchaser. Open bidding for contracts provides the principal opportunity for fostering competition in a PPP setting. Where a private sector monopolist is free to sell services to the public (e.g., where it charges road tolls), regulation is also necessary to contain monopoly profits and otherwise protect consumer interests.
• An appropriate institutional framework is in place. In this connection, political commitment, good governance, and supporting legislation will enable the private sector to enter into long-term contracts knowing that its interests are protected and that the government will honor its commitments (which often stretch over many years) under PPPs.
• The government has to develop its own technical expertise. In particular, it has to be able to manage a PPP program, conduct thorough project appraisal and prioritization, and ensure that PPPs are consistent with broader fiscal and economic policy objectives.
• The fiscal implications of PPPs are properly accounted for and reported. While PPPs can help ease fiscal constraints, they also offer opportunities to bypass expenditure controls, and to move public investment off budget and debt off the government balance sheet, mainly to meet fiscal rules or targets. However, the government may still bear considerable risk, and face potentially large fiscal costs, especially over the medium to long term. Full transparency about the fiscal consequences of PPPs can help to prevent their misuse and to make increased efficiency a principal motivation.21
33. Meeting these preconditions poses substantial challenges. For some tasks, such as the development of appropriate legal and institutional frameworks, choice of regulatory regimes, and the design of contracts, significant expertise has been developed in both the public and private sectors, especially in countries that have pioneered PPPs, and also in the MDBs. Countries intending to develop their own PPP programs may consider tapping such expertise, including when appropriate through technical assistance. However, progress is still needed with developing an internationally accepted accounting and reporting standard for PPPs which can guide their treatment in fiscal accounts, as well as in fiscal analysis. In what
21 In any event, potential PPP liabilities are unlikely to be hidden from market scrutiny for long; as PPPs become more commonplace, market analysts and rating agencies can be expected to develop the expertise to assess the fiscal risks they involve.

- 26 -
follows, this paper briefly reviews existing practices, discusses relevant conceptual issues, and makes some preliminary suggestions in these areas.
B. Accounting for and Reporting PPP Operations
34. Accounting for and reporting certain PPP operations is relatively straightforward.
• Where a PPP asset is owned by the private operator, payments under operating contracts for services provided to the government are recorded as current expenditure in the government cash accounts or, if the GFSM 2001 framework is used, as an expense in the government operating statement. Fees received by the government from a private operator under a concession agreement, or an operating lease for use of a government-owned asset, are recorded as revenue.
• When the government obtains an asset from a private supplier through a financial lease, under GFSM 2001 this would be recorded on the government’s operating statement as the acquisition of a nonfinancial asset, financed by the incurrence of a lease liability. Both the asset and the liability would be recorded on the government balance sheet at the same time. Under cash accounting, only the periodic lease payments would be recorded in the government’s cash flow statement at the time they are made.22
This treatment is reflected in various standards, including the 1993 SNA, ESA 95 and the related Manual on Government Deficit and Debt, and guidelines produced by the International Federation of Accountants (IFAC), in addition to GFSM 2001.
35. No internationally accepted accounting standard has been developed so far to reflect varying degrees of risk transfer from the government to the private sector, and country practices differ substantially in this area. In a number of cases, only payments under PPP contracts are recorded in fiscal accounts, and a PPP asset is not placed on the government balance sheet until it is transferred to the government at the end of the operating contract. In other cases (e.g., the United Kingdom and the Australian State of Victoria), a PPP project is treated as a public investment and reflected on the government balance sheet,
22 However, it should be noted that an Executive Board decision (No. 12274, 00/850 of August 2000) requires external liabilities incurred under a financial lease to be included in the government’s external debt statistics for the purposes of Fund-supported programs, to prevent circumvention of debt ceilings.

- 27 -
along with the corresponding financing liability,23 if the balance of risks under the contract is judged to remain with the government.24
36. A recent Eurostat decision on accounting for risk transfer gives considerable cause for concern, because it is likely to result in most PPPs being classified as private investment. According to this decision, EU members countries can consider as private investment any PPP project which is judged by the relevant national statistical body to transfer to the private partner (most of) the construction risk and either the availability (continuity of service supply) or the demand risk. Since most PPPs involve the private sector bearing construction and availability risk, they will probably be treated as private investment, even though the government bears substantial demand risk (e.g., when it guarantees to the private operator a minimum level of demand for the service provided through the PPP). It is worth noting that the recent decision is more permissive than previous opinions by Eurostat (e.g., in the case of Ireland, where most PPP projects are classified as government investment on account of limited risk transfer), and thus could provide an incentive for EU governments to resort to PPPs mainly to circumvent the SGP fiscal constraints.
37. Classifying PPP investment as either public or private, depending on the assessed sharing of risks, arguably fails to recognize the intrinsically mixed nature of these operations. A more appropriate treatment in the fiscal accounts would reflect the range of fiscal costs and risks entailed by PPP contracts, and the Fund needs to proactively encourage and work with the accounting profession to develop as quickly as possible internationally agreed approach to assessing, quantifying, and disclosing these costs and risks. In the meantime, country authorities should strengthen their own capacity to assess the risks implied by PPP contracts, and encourage independent scrutiny of such risks, including by the legislative branch of government. Transparent disclosure of PPP contracts by the government, preferably in a standardized format, would facilitate such scrutiny.25
38. Until an internationally accepted accounting and reporting standard for PPPs is developed, the actual and potential costs for the government implied by a PPP contract should be taken into account when undertaking debt sustainability analysis (DSA).
• First, the net present value of scheduled government payments under PPP contracts less any contractual receipts (e.g., concession fees)—both discounted using
23 This is in practice equivalent to accounting for the transaction as a financial lease.
24 It is worth noting that, following this approach, about two thirds of PPPs undertaken by the United Kingdom to date have been accounted as public investments (see HM Treasury, 2003).
25 It is important that subnational governments, as well as the central government, meet this disclosure requirement, since the former are responsible for many PPP projects.

- 28 -
a risk-free interest rate—should be counted as a liability and added to the initial stock of government debt when undertaking DSA. The rationale for this is that these commitments affect debt sustainability in the same way as the service of the debt, in that they require the generation of larger future primary surpluses (or smaller primary deficits) to achieve a desired debt path.
• Second, explicit guarantees included in PPP contracts (e.g., for debt incurred by the private partner to finance investment, for minimum revenue from sales to the public, or for the price at which the government will acquire the asset at the end of the contract) should be disclosed, and the expected liability—that is the stock of guarantees weighted by the probability that they will be called—should influence assessments of debt sustainability.26 More specifically, a particular debt path will be viewed less favorably, the larger the expected liability associated with guarantees. The staff is planning a paper on the appropriate fiscal treatment of guarantees and other government contingent liabilities, including those deriving from PPPs.
VI. CONCLUSIONS AND NEXT STEPS
39. This paper has discussed a number of steps that countries, with appropriate support from the Fund, the World Bank and other MDBs, and bilateral donors, can take to ensure that inappropriate constraints on public investment, especially in infrastructure, are minimized. These steps include the following.
• Undertaking more detailed and careful assessments of the scope to increase productive public investment by reference to the fiscal and broader macroeconomic impact of public investment programs, and the financing associated with them.
• Strengthening the cost-benefit analysis of proposed investment projects, with a view to avoiding a waste of scarce budgetary resources on low-productivity investment, and to maximizing the efficiency and cost effectiveness of public investment.
• Focusing not only on the overall fiscal balance and gross public debt, but also on the current balance, with a view to promoting, at least over the longer term, a more balanced composition of any required fiscal adjustment.
• Setting in place or strengthening institutional mechanisms (including, when appropriate, a shift to targeting the structural, as opposed to the actual, fiscal balance)
26 Disclosure of guarantees and other contingent liabilities is called for by the Code of Good Practices on Fiscal Transparency. Where guarantees are significant, it would also be prudent to include in annual budgets ceilings on the stock of guarantees, and to provision for the expected cost of calls on guarantees.

- 29 -
to ensure that the fiscal dividends of “good times” are saved, so as to moderate the adjustment required in “bad times.”
• Excluding from fiscal indicators and targets the operations of commercially run public enterprises, which would free their investments from the constraints of fiscal targets (while simultaneously seeking to expand the coverage of public enterprises that are not commercially run in cases where these are excluded).
• Strengthening countries’ capacity to: select opportunities for PPPs; establish appropriate legal and regulatory frameworks for such operations; structure contracts to ensure an adequate transfer of risks to the private partner, including through appropriate pricing of such risks; and appropriately reflect PPPs in the fiscal accounts and in debt sustainability analysis.
40. To support these efforts, a number of steps by the World Bank and the other MDBs will be helpful.
• Incorporating the analysis of infrastructure investment and maintenance into World Bank public expenditure review work. This is consistent with the agreed definition of primary responsibilities and the framework for Bank/Fund collaboration on public expenditure issues, as well as the World Bank Infrastructure Action Plan. A new World Bank initiative—the preparation of country reports on Recent Economic Developments in Infrastructure, which will contain detailed descriptions, analysis, and discussion of the state of infrastructure, sectoral investment needs, priorities from a growth perspective, financing constraints, and the potential role of the Bank—can make a key contribution to this work.
• Redirecting some of their lending to financing infrastructure projects, especially in countries facing acute infrastructure gaps. This would help ease binding short-term financing constraints for some countries. It is, however, important that the additional financing be judged to be consistent with longer-term debt sustainability in these countries.
• Providing sound technical screening of the projects they finance.
• Selectively assisting (in line with resource availability) countries in strengthening their own capacity to evaluate the rest of their investment program and prospective PPPs.
41. The Fund can also support countries’ efforts to move in the directions outlined above, by better reflecting the importance of productive public investment in its policy advice, program design, and technical assistance. Specifically the Fund should pay attention to the following.

- 30 -
• Ensuring that any additional financing (from MDBs, bilateral donors, and market sources) for infrastructure investment is accommodated under program targets if, on the basis of careful analysis, it is judged to be clearly consistent with short-term macroeconomic stability and longer-term debt sustainability, and there are reasonable assurances that new projects have been subjected to rigorous cost-benefit analysis.
• Focusing systematically on past and prospective developments in public investment and in the current balance, and on the policy measures needed to achieve a desired path for these variables.
• Assisting countries with:
• designing mechanisms to reduce the volatility and procyclicality of fiscal policy;
• implementing the GFSM 2001 fiscal reporting framework, to facilitate the compilation and analysis of statistics on current fiscal balances and net worth;
• refining and applying the criteria for identifying commercially run public enterprises;
• collecting the information necessary to extend the coverage of fiscal indicators and targets to public enterprises that are not commercially run (and to levels of government that are not at present covered); and
• appropriately reflecting in their fiscal accounts the fiscal costs and risks entailed by PPPs, including through proactive involvement with the accounting profession to develop an internationally accepted accounting and reporting standard for PPPs.
42. Some of these activities—especially the provision of technical assistance in the areas outlined above—would likely entail significant resource costs for the Fund, and it is proposed to undertake some pilot case studies over the next several months, so as to make a realistic assessment of these costs and to develop an appropriate strategy for prioritizing the use of available resources. These case studies would focus, in particular, on modifying the coverage of fiscal indicators as outlined above, and assessing the fiscal implications of PPPs. This would be done with the agreement of the countries concerned, and in cooperation with the World Bank and other relevant MDBs. In view of the particular relevance of the issues outlined above for countries in Latin America and Europe, it is currently planned that the pilots would concentrate primarily on countries in these regions, although a country with comparatively weak data would also be included. The staff intends to report to the Board on the progress with the pilots by the end of this year.

- 31 -
VII. ISSUES FOR DISCUSSION
• How do Directors view the declining trend in the share of public investment in GDP, and especially the share of infrastructure, in a number of countries, and its impact on growth in these countries?
• Do Directors agree with the staff view that the risks entailed by an exclusive reliance on the current fiscal balance as a fiscal indicator, and as a fiscal target, outweigh its advantages?
• Do Directors agree with the steps outlined in the paper to ensure that—while the primary focus of fiscal analysis and policy, and of Fund conditionality, on the overall fiscal balance and gross public debt would be maintained—productive public investment is given increased priority in making budgetary choices, and appropriately protected during periods of fiscal adjustment? Would Directors suggest other useful steps for this purpose?
• Do Directors agree that the preferred coverage for fiscal indicators and targets should be the general government and public enterprises that are not commercially run? Do they also agree that the operations of all public enterprises should be regularly monitored and reported? Do they consider appropriate the criteria proposed to distinguish enterprises that are commercially run from those that are not?
• Do Directors agree on the importance of ensuring adequate risk transfer to the private sector in PPP contracts, both to secure significant efficiency gains and to limit the potential fiscal costs of PPPs over the longer term? Do Directors share staff concern with the current lack of an appropriate and internationally accepted accounting and reporting standard for PPPs? Do they support the proposed approach to disclosing, and reflecting in debt sustainability assessments, known and potential costs to governments reflected in PPP contracts? Do they have any alternative or complementary suggestions in this area?
• Do Directors support a pilot approach to assisting countries seeking to implement some of the proposals put forward in this paper?
• Would Directors support the publication of this paper and the background paper on PPPs, after revisions to reflect the Board discussion?

- 32 - APPENDIX I
Studies of Public Investment and Growth
43. As discussed in the main text, studies of the impact of public investment on longer-term growth do not give clear-cut results. This is despite the substantial research effort that took off following a series of papers by Aschauer, published in 1989, which suggested that falling public investment in the United States helped explain the post-1970 slowdown in U.S. productivity growth, and that there was a positive cross-country correlation between public investment and productivity growth. A number of subsequent studies reached similar conclusions. However, the strength and robustness of such results turn out to be sensitive to the methodology and data employed. This appendix provides further detail on this body of empirical work.
44. Some of the key studies are summarized in Table 1. These are grouped according to the four main methodologies that have been employed.
• Aggregate production functions, which relate output to public capital stocks. Public capital is viewed either as an input in its own right, or as a factor improving the productivity of other factor inputs, such as private capital.
• Cost or profit functions, to assess whether public capital lowers business costs (or increases profits).
• Research focused on growth rather than the level of output, examining whether public investment—in aggregate, or broken down into components such as infrastructure—helps explain differences in cross-country or cross-regional growth.
• Vector autoregressions (VARs), which are well suited to exploiting the time-series properties of public investment, output, and other variables without imposing a causal structure a priori.
45. Considering first the links between public capital and output, other studies—but not all—using Aschauer’s general methodology have also found a positive association between these variables, both in the United States and elsewhere. However, pointing to the range of econometric problems arising with such studies, Gramlich (1994) and others have noted that the implied rates of return on public capital in many of these studies appear to be implausibly high.27 It is also notable that, while the work of Aschauer and others was motivated in part by the post-1970 slowdown in productivity growth and the role that declining public investment might have played in this, U.S. productivity growth picked up significantly during the 1990s while public investment continued to decline. Most of the studies using cost or profit
27 Although this may be an extreme case, Canning and Bennathan (2000) note that the implied rate of return to investment in telephone networks in an earlier study is over 10,000 percent a year.

- 33 - APPENDIX I Table 1. The Effect of Public Investment on Output, Productivity, and Growth
Study Data Results
1. Production Function Approach Aschauer (1989a) U.S., time series 1949–85 Positive effect of public capital on output Aschauer (1989b) G–7, panel data, 1966–85 Positive effect of public capital on output Merriman (1990) Japan, panel data on 9 regions, 1954–63 Positive effect of public capital on output Ford and Poret (1991) 11 OECD countries, time series 1960–89 Significant positive effect in Belgium, Canada, and Germany Bajo-Rubio and Sosvilla-Rivero
(1993) Spain, time series 1964–88 Positive effect of public capital on output
Dalamagas (1995) Greece, time series 1950–92 Ambiguous effects Sturm and De Haan (1995) U.S., time series 1949–85 Positive effect of public capital on output; insignificant effects using time
differences Garcia Milà, McGuire, and Porter
(1996) U.S., panel data on 48 states, 1970–83 Insignificant effect of public capital on output
Kavanagh (1997) Ireland, time series 1958–90 Insignificant effect of public capital on output Canning and Bennathan (2000) 90 countries, 1960–1990 Specific types of infrastructure complement physical and human capital in
supporting output per worker La Ferrara and Marcellino (2000) Italy, regional panel, 1970–94 Negative effect of public capital on output Ligthart (2000) Portugal, time series 1965–95 Positive effect of public capital on output Calderón and Servén (2003) 101 countries, 1960–97 Positive effect of specific infrastructure components on output per worker
2. Cost or Profit Function Approach Berndt and Hansson (1991) Sweden, time series 1960–88 Reduction in costs. Public capital in excess supply. Lynde and Richmond (1993a) U.K., time series 1966–90 Reduction in costs Lynde and Richmond (1993b) U.S., time series 1958–89 Increase in output Conrad and Seitz (1994) Germany, panel on 3 sectors, 1961–88 Reduction in costs. Public capital in short supply during 1961–79; in excess
supply during 1980–88 Dalamagas (1995) Greece, time series 1950–92 Reduction in costs Seitz and Licht (1995) Germany, panel on 11 states, 1971–88 Reduction in costs Morrison and Schwartz (1996) U.S., panel on 48 states, 1970–87 Infrastructure has a negative impact on costs La Ferrara and Marcellino (2000) Italy, regional panel, 1970–94 Insignificant effect on costs. Public capital in excess supply for Italy as a whole.
3. Cross-Section Growth Regressions Barro (1991) 76 countries, 1960–85 No effect of public investment on per capita GDP growth Easterly and Rebelo (1993) 100 countries, 1970–88 Insignificant effect of public investment on per capita GDP growth, significant
effect of transport and communication spending Crinfield and Panggabean (1995) 282 U.S. metropolitan areas, 1960–77 Ambiguous or insignificant effects of local and federal public capital on per
capita GDP growth Holtz-Eakin and Schwartz (1995) 48 U.S. states, 1971–86 Insignificant effects of public capital on per capita GDP growth Devarajan, Swaroop, and Zou (1996) 43 countries, 1970–90 Positive effect of current government spending on growth, negative effect of
public capital spending and of infrastructure Mas, Maudos, Perez, and Uriel
(1996) 17 Spanish regions, 1955–91 Not always significant effects of public capital on per capita GDP growth
Khan and Kumar (1997) 95 countries, 1970–90 Positive effect of public investment on per capita growth, though declining over time and with significant regional variation
Matha, Vanhoudt, and Smid (2000) EU countries, 1960–97 Positive effect of public investment on per capita GDP levels, negative on output growth
La Ferrara and Marcellino (2000) Italian regions, 1970–94 (panel structure) Positive effect of public infrastructure investment on TFP growth Clements, Bhattacharya, and Nguyen
(2003) 40 low-income countries, 1970–99 Positive effect of public investment on per capita GDP growth
Milbourne, Otto, and Voss (2003) 72 countries, 1960–85 Positive effect of total public investment, and education and infrastructure components, on growth; not significant when endogeneity controlled for
Gupta, Clements, Baldacci, and Mulas-Granados (2004)
39 low-income countries, 1990–2000 Positive effect of government capital expenditure on per capita GDP growth
4. VAR Studies Clarida (1993) U.S., France, Germany, U.K., time series
1964–89 Total factor productivity and public capital are cointegrated, but direction of
causality is unclear Otto and Voss (1996) Australia, time series 1959–82 No significant relation between public capital and output Sturm, Jacobs, and Grote (1999) Netherlands, time series 1853–13 Public infrastructure Granger-causes output Ligthart (2000) Portugal, time series 1965–95 Public investment Granger-causes output Source: Adapted from Table III.1 in European Commission (2003), with some additional references added (e.g., to more recent research) and some country specific studies deleted (especially where the findings are similar to those of other work referred to in the table).

- 34 - APPENDIX I
functions have found that public capital lowers business costs or increases profits, although with relatively weak effects. In an application of this approach to Germany, Conrad and Seitz (1994) find that while public infrastructure increases productivity and lowers business costs, there are clear indications of over-investment by the public sector during the 1980s.
46. In a number of studies focusing on the level and growth of output, empirical support for a positive impact of public capital has been obtained using particular components of investment—notably infrastructure—even where such evidence is lacking in the case of aggregate public investment. For example, Calderón and Servén (2003) find that quantitative measures of electricity generating capacity, road and rail lines, and telephone lines have a positive and significant impact on output per worker. Growth regressions (in the bottom group in the table) also emphasize the role of infrastructure investment. Easterly and Rebelo (1993) find that aggregate public investment does not appear to be a significant determinant of per capita GDP growth (similar to the results of Barro (1991) and several others), but they do find a strong positive impact arising from public investment in the transportation and communications sectors. Similarly, Milbourne, Otto, and Voss (2003) find that public investment in education, as well as in transport and communications, appears to have a positive and significant effect on growth.
47. Since empirical analysis can be distorted by reverse causation—higher growth may create the demand for higher public investment, rather than being the result of such investment—VAR studies attempt to establish the direction of causation. However, this has produced mixed results, as have attempts to control for reverse causation in cross-sectional panel studies.28 Simultaneity bias can also affect the empirical work, in that a sizable public investment project may lead to a short-run spurt in output, but possibly without an enduring effect on productivity and growth (Gramlich, 1994).
48. The lack of clear-cut results on the relationship between public investment and growth may not be too surprising. A cursory look at the data would certainly suggest that such a link may be difficult to find (Figure 4). Moreover, empirical work is complicated by data problems that have to be borne in mind. First, the usual definition of public investment—gross fixed capital formation by the public sector or general government—is narrow, in the sense that it does not cover all public spending that adds to a country’s productive potential. Current spending on education and health which enhances human capital is a clear missing element. Second, net public investment (i.e., gross investment less depreciation) is the proper indicator of additions to the public capital stock, but gross public
28 The Easterly and Rebelo (1993) results referred to above continue to hold when instrumental variable methods are used—although with what the authors describe as some “disturbingly high” coefficient values. The impact of infrastructure capital on output in Calderón and Servén (2003) also remains significant when the possible endogeneity of public capital is controlled for. The Milbourne, Otto, and Voss (2003) results cease to be significant when instrumental variable methods are used.

- 35 - APPENDIX I
Figure 4. Public Investment and Growth, 1970-2000 1/
Source: WEO Database, International Finance Corporation, and OECD.1/ Five-year within period averages. 2/ Australia, Austria, Belgium, Canada, Denmark, Finland, France, Germany, Ireland, Italy, Japan, Norway, Portugal, Spain, Sweden, United Kingdom, and United States.3/ Argentina, Bolivia, Brazil, Chile, Colombia, Ecuador, Mexico, Peru, Venezuela; Cote d'Ivoire, Kenya, Madagascar, Malawi; China, India, Indonesia, Korea, Malaysia, Philippines, Thailand; Morocco, Tunisia.
Advanced OECD countries 2/
-2
0
2
4
6
8
10
0 1 2 3 4 5 6 7 8 9 10Public investment (In percent of GDP)
Per c
apita
GD
P gr
owth
Selected emerging market economies and developing countries 3/
-6
-4
-2
0
2
4
6
8
10
12
0 2 4 6 8 10 12 14 16 18 20Public investment (In percent of GDP)
Per c
apita
GD
P gr
owth

- 36 - APPENDIX I
investment data are more readily available. Moreover, when they are available, the quality of net investment data is adversely affected by difficulties in measuring depreciation, and current spending on investment maintenance, which in effect counteracts depreciation, is frequently not taken into account. And third, data on the public capital stock, either in financial terms or physical terms (e.g., miles of power lines and roads, number of telephone connections, etc.), would be better for most analytical purposes, but they are used in only a few studies (albeit those that give the strongest positive results).

- 37 - APPENDIX II
Budget Rules and Public Debt Dynamics
49. This appendix discusses the implications of an overall balance rule and a golden rule for public debt dynamics.29 Key factors in determining the long-run consequences of a golden rule are its exact specification (in terms of gross or net investment), the role of inflation, and the rate of return on public investment.
Public debt dynamics
50. The dynamics of public debt B are described by the following equation:
1 1 1 1C I
t t t t t t t t tB B G G T p K i Bθ− − − −− = + − − + (1)
where CtG ( I
tG ) is government consumption and transfers (investment), tT is tax revenue, θ is the rate of return on public capital, p is the price of public capital, K is real public capital, and i is the nominal interest rate on public debt. All variables are in nominal terms, except for public capital K which is expressed in real terms. Dividing both sides by nominal GDP and rearranging terms gives
1 1 1(1 )(1 ) 1C I t t
t t t t t t tt t t
r nb b g g k bn n
θτπ− − −
−− = + − − +
+ + + (2)
where lower-case letters indicate ratios to GDP, n is the economy’s real growth rate, π is the
rate of inflation, and 1 11
irπ+
= −+
is the real rate of return on public debt. This is the familiar
debt accumulation equation, which relates the evolution of public debt to the primary balance, which is given by the first four terms on the right hand side of (2), as well as to the intrinsic debt dynamics, which depend on the difference between the real interest rate and the growth rate.
Dynamics of public capital
51. The dynamics of the public capital stock are illustrated by the following expression:
1[ (1 )] It t t tp K K Gδ−− − = (3)
29 These implications are discussed more fully in Buiter (2001), Buiter and Grafe (2002), and Blanchard and Giavazzi (2003).

- 38 - APPENDIX II
where δ is the rate of depreciation of public capital. Dividing by nominal GDP gives
1 1 1I t
t t t tt
nk k g knδ
− −
+− = −
+ . (4)
An overall balance rule
52. A typical overall balance rule establishes that the ratio of the fiscal deficit to GDP cannot exceed a ceiling d , which implies that
1t t tB B d Y−− ≤ (5)
Dividing both sides by nominal GDP and re-arranging terms yields
1 1 1t
t t tt
b b d b γγ− −− ≤ −
+ (6)
where γ is the growth rate of nominal GDP. If the fiscal deficit is always equal to the ceiling d , the public debt ratio would stabilize at the level b such that
(1 )db γγ
= +. (7)
Equation (7) shows that the steady-state public debt ratio will be higher, the lower the rate of growth of nominal GDP and the higher the deficit ceiling. For example, with nominal GDP growth of 4 percent and a deficit ceiling of 2 percent, the public debt to GDP ratio would stabilize at around 50 percent of GDP. Under a balanced budget rule, the public debt ratio would tend to zero as long as nominal GDP growth is positive.
Net investment golden rule
53. This rule establishes that the fiscal deficit cannot exceed net public investment, so that
1 1I
t t t t tB B G p Kδ− −− ≤ − . (8)
Dividing both sides by nominal GDP and rearranging terms gives
1 1 1(1 )
1 (1 )(1 )I t t t
t t t t tt t t
nb b g k bn n
π πδπ− − −
+ +− ≤ − −
+ + + . (9)

- 39 - APPENDIX II
Using (2) and (9), the budget constraint implied by a net investment rule can be expressed as follows:
1 1 1 0(1 )(1 ) 1 (1 )(1 )
C tt t t t t
t t t t t
ik g k bn n nθ δτ
π π− − −+ − − − ≥+ + + + + .
(10)
This budget constraint states that current revenue, inclusive of returns on public capital, must be larger than current expenditure, including depreciation.
54. The steady-state public capital stock (as a ratio to GDP), derived from equation (4), is
given by 1ISS SS
nk gn δ+
=+
. The steady-state public debt ratio implied by the net investment
rule is given by
(1 )(1 )SS SS
nb kn
ππ π
+=
+ + . (11)
Assuming that inflation is zero, Blanchard and Giavazzi (2003) obtain a steady-state public debt ratio equal to the steady-state public capital stock. However, with positive inflation a net investment rule implies a public debt ratio which is lower than the public capital stock. For example, with inflation and real growth at 2 percent per year, the steady-state public debt ratio would be around half the steady-state public capital stock, while with inflation at 6 percent this ratio falls to a quarter.
Gross investment golden rule
55. A gross investment golden rule establishes that the fiscal deficit cannot exceed gross public investment, so that
1I
t t tB B G−− ≤ (12)
which in turn implies that
1 1(1 )
(1 )(1 )I t t t
t t t tt t
nb b g bn
π ππ− −
+ +− ≤ −
+ + . (13)
The budget constraint implied by a gross investment rule is the following:
1 1 0(1 )(1 ) (1 )(1 )
C tt t t t
t t t t
ik g bn nθτ
π π− −+ − − ≥+ + + +
(14)
which states that current revenue must exceed current expenditure net of depreciation.

- 40 - APPENDIX II
56. In this case, the steady-state public debt ratio is given by
( )(1 )(1 )SS SS
nb knδ π
π π+ +
=+ + .
(15)
With a rate of depreciation of public capital higher than the rate of inflation, under a gross investment rule the steady-state public debt ratio will exceed the steady-state public capital stock. For example, with a rate of depreciation of 6 percent and growth and inflation at 2 percent, the steady-state public debt ratio would be twice as large as the steady-state public capital stock.
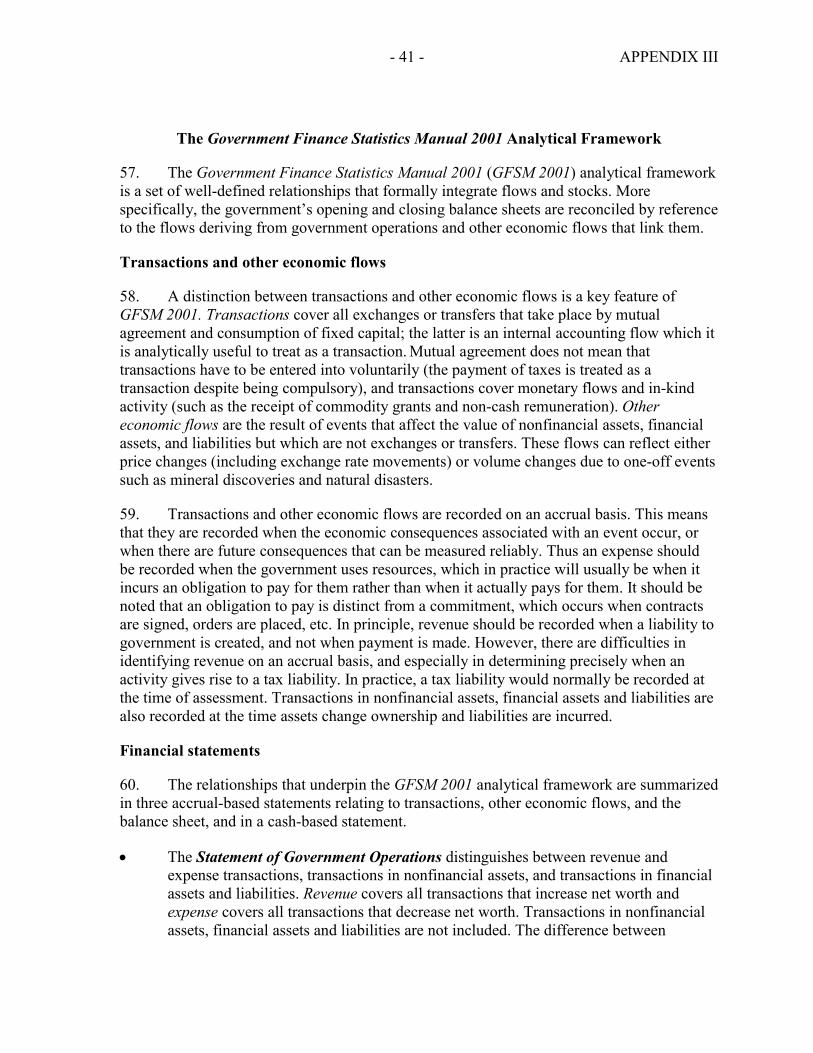
- 41 - APPENDIX III
The Government Finance Statistics Manual 2001 Analytical Framework
57. The Government Finance Statistics Manual 2001 (GFSM 2001) analytical framework is a set of well-defined relationships that formally integrate flows and stocks. More specifically, the government’s opening and closing balance sheets are reconciled by reference to the flows deriving from government operations and other economic flows that link them.
Transactions and other economic flows
58. A distinction between transactions and other economic flows is a key feature of GFSM 2001. Transactions cover all exchanges or transfers that take place by mutual agreement and consumption of fixed capital; the latter is an internal accounting flow which it is analytically useful to treat as a transaction. Mutual agreement does not mean that transactions have to be entered into voluntarily (the payment of taxes is treated as a transaction despite being compulsory), and transactions cover monetary flows and in-kind activity (such as the receipt of commodity grants and non-cash remuneration). Other economic flows are the result of events that affect the value of nonfinancial assets, financial assets, and liabilities but which are not exchanges or transfers. These flows can reflect either price changes (including exchange rate movements) or volume changes due to one-off events such as mineral discoveries and natural disasters.
59. Transactions and other economic flows are recorded on an accrual basis. This means that they are recorded when the economic consequences associated with an event occur, or when there are future consequences that can be measured reliably. Thus an expense should be recorded when the government uses resources, which in practice will usually be when it incurs an obligation to pay for them rather than when it actually pays for them. It should be noted that an obligation to pay is distinct from a commitment, which occurs when contracts are signed, orders are placed, etc. In principle, revenue should be recorded when a liability to government is created, and not when payment is made. However, there are difficulties in identifying revenue on an accrual basis, and especially in determining precisely when an activity gives rise to a tax liability. In practice, a tax liability would normally be recorded at the time of assessment. Transactions in nonfinancial assets, financial assets and liabilities are also recorded at the time assets change ownership and liabilities are incurred.
Financial statements
60. The relationships that underpin the GFSM 2001 analytical framework are summarized in three accrual-based statements relating to transactions, other economic flows, and the balance sheet, and in a cash-based statement.
• The Statement of Government Operations distinguishes between revenue and expense transactions, transactions in nonfinancial assets, and transactions in financial assets and liabilities. Revenue covers all transactions that increase net worth and expense covers all transactions that decrease net worth. Transactions in nonfinancial assets, financial assets and liabilities are not included. The difference between

- 42 - APPENDIX III
revenue and expense is the net operating balance. Subtracting the net acquisition of nonfinancial assets from the net operating balance yields net lending/borrowing, which in turn is equal to the net acquisition of financial assets less the net incurrence of liabilities.
• The Statement of Other Economic Flows presents information on changes in net worth that arise from flows other than transactions, as described above.
• The Balance Sheet shows the government’s net worth at the end of a fiscal year, which is equal to the stock of nonfinancial assets plus net financial worth (i.e., the difference between financial assets and liabilities). The change in net worth during a year is the sum of changes due to revenue and expense transactions and to other economic flows.
• The Statement of Sources and Uses of Cash shows cash flows associated with revenue and expense transactions and transactions in nonfinancial assets, and their net impact in terms of the cash surplus/deficit. Adding the cash flow from transactions in financial assets and liabilities to the cash surplus/deficit gives the net change in the stock of cash.
Valuation 61. All flows and stocks should be valued at market prices. This is the amount for which the goods, services, assets, labor or the provision of capital are in fact exchanged or the cash value of in-kind transactions. Flows should be valued at the prices current on the dates when they are recorded. Stocks should be valued at the prices current on the balance sheet date.
62. Consumption of fixed capital is the economic equivalent of depreciation. It is the decline in the current market value of the stock of fixed assets during the accounting period as a result of physical deterioration, normal obsolescence, and accidental damage. Consumption of fixed capital accrues continuously over the accounting period, it is treated as an expense under accrual accounting, and it is taken into account in calculating the net operating balance.30 Because information on consumption of fixed capital is not readily available, GFSM 2001 defines the difference between revenue and expense excluding consumption of fixed capital as the gross operating balance, which can be used in place of the net operating balance when this is the case.
63. Although the balance sheet is to be valued at market prices, provision is made in GFSM 2001 for reporting the nominal value of the debt as a memorandum item. The nominal value of the debt reflects the original value of the debt and the impact of subsequent
30 However, consumption of fixed capital is offset by the disposal of a nonfinancial asset in calculating net lending/borrowing, which is therefore unaffected.

- 43 - APPENDIX III
economic flows such as transactions (e.g., accrual of interest, repayment of principal), revaluations, and other flows. As such, it measures the amount that debtors owe to creditors, which is relevant from the point of view of assessing the fiscal policy implications of debt, and in particular for debt sustainability analysis.
Fiscal indicators 64. Net lending/borrowing, the net operating balance, and the cash surplus/deficit are the main GFSM 2001 fiscal indicators.31
• Net lending/borrowing is perhaps the most important indicator, since it reflects the government’s financing operations. As such, it summarizes the way in which fiscal policy affects the rest of the economy and the rest of the world via its impact on the government’s use of resources and on aggregate demand.
• The net operating balance is an indicator of the impact of fiscal policy on net worth. Net worth, and the change in net worth, are relevant to the analysis of fiscal sustainability in that, as opposed to focusing on debt alone, they take it into account both the government’s assets and its liabilities. However, debt and debt sustainability remain important, since governments can run into solvency and liquidity problems independently of their net worth because most nonfinancial assets are not marketable.
• The cash surplus/deficit measures the change in the government’s liquidity position due to revenue and expense transactions, and transactions in nonfinancial assets. It is thus the cash equivalent of net lending/borrowing. The net change in the stock of cash, which also reflects transactions in financial assets, measures the change in the government’s overall liquidity position, and as such is a better indicator of cash-flow implications of government operations.
65. GFSM 2001 recognizes that a wider range of fiscal indicators may continue to be useful in particular circumstances. The most notable indicator in this regard is the overall balance (on an accrual basis), which is derived from net lending/borrowing by grouping transactions in financial assets undertaken for public policy purposes together with transactions in nonfinancial assets, and treating sales of nonfinancial assets as transactions in financial assets. Commonly used indicators that are based on the overall balance (e.g., the adjusted overall balance, the non-oil balance, the operational balance, and the primary balance) follow directly. Other indicators are also derived in a straightforward way, including government saving and investment.
31 GFSM 2001 refers to them as core balances.

- 44 - APPENDIX IV
Commercial Orientation of Public Enterprises in Colombia
66. The Colombian authorities evaluated whether any of 14 large public enterprises might qualify as commercially run, using the criteria suggested in Section IV. These enterprises operate in many sectors, including telecommunications, transportation, petroleum, gas, and electricity, and generate more than 75 percent of the total operating surplus of the public enterprise sector (5 percent of GDP). All public enterprises are included in the definition of the public sector deficit used under the Fund-supported programs.
67. Based on the suggested criteria, Table 2 reveals significant differences in the commercial orientation of public enterprises in Colombia.
68. Relations with Government. None of the enterprises receives subsidies or loan guarantees from the government, and all enterprises are subject to the same regulations and tax rules as the private sector.
69. Managerial Independence. Enterprises operate with varying degrees of managerial independence.
• The government appoints board members and senior managers of six enterprises, who are subject to civil service laws. Eight enterprises are subject to collective bargaining agreements covering employment, wages, and pensions.
• Prices in the telecommunications, electricity, and oil sectors are set by regulatory committees, members of which are appointed by the government. In general, prices reflect marginal costs or cost-recovery considerations. However, the telecommunications and electricity enterprises must offer subsidized prices to low-income customers, financed either by a government transfer or higher prices for other consumers.
70. Financial Conditions. There are significant differences in the profitability and creditworthiness of enterprises.
• Ecogas, Ecopetrol, and Satena are highly profitable, while Corelca and Urra incur sizable losses.
• Several enterprises (ISA, ISAGEN, Meta, and Santander) have relatively low levels of debt, while Telecom, Adpostal, Corelca, and Urra are highly indebted. Both Ecopetrol and ISA have credit ratings that are equivalent to the rating on sovereign credit.
It should be noted that the comparators against which profitability and debt levels have been judged are at this stage unclear, and for this reason the assessment made by the Colombian authorities should be regarded as preliminary and incomplete.

- 45 - APPENDIX IV
71. Governance Structure. Enterprises also have important differences in their governance structures.
• Nine enterprises are audited by international and national firms. All enterprises publish comprehensive annual reports and are subject to oversight by the controller general.
• ISA is the only enterprise with private equity participation and with shares listed on the Bogota stock exchange, and is planning to issue American Depository Receipts (ADR) in the next few years.
• ISA also has several instruments that protect minority shareholders’ rights. Ecopetrol, Telecom and Santander are elaborating governance codes according to international standards.
72. It would appear that one enterprise, ISA (which is involved in electricity distribution) can be judged commercially run. It is a profitable, creditworthy enterprise that does not benefit from any special financial treatment by the government. It has a high degree of managerial independence, regulated electricity prices reflect costs and do not involve subsidies, and there are no civil servants in management positions. It has a significant private sector equity participation, and has a sound governance structure that gives minority shareholders a strong voice in major decisions affecting the enterprise.

- 46 - - 46 - APPENDIX IV
Publ
icPr
oduc
tion
Ente
rpris
eSe
ctor
Pric
esC
olle
ctiv
eC
ivil
serv
ants
Tax
and
Prot
ects
refle
ctSu
bsid
ized
labo
rin
man
agem
ent
Loan
regu
lato
rySt
ock
Out
side
Ann
ual
shar
ehol
ders
'co
sts
pric
esco
ntra
cts
posi
tions
guar
ante
esex
empt
ions
Prof
itabi
lity
1/D
ebt l
evel
2/
Deb
t cos
t 3/
listin
gau
dits
4/
repo
rtsrig
hts
EC
OP
ETR
OL
Oil
prod
uctio
nY
esY
esY
esY
esN
oN
o18
.468
.017
.0Y
esY
esE
CO
GÁ
S 5
/G
as (t
rans
porta
tion)
Yes
Yes
No
No
14.1
6.3
...Y
esTE
LEC
OM
6/
Tele
com
mun
icat
ions
Yes
Yes
Yes
No
No
-7.9
89.4
...Y
esY
esA
DP
OS
TAL
7/M
ail s
ervi
ceY
esY
esY
esY
esN
oN
o-9
1.0
96.8
...Y
esIS
AEl
ectri
city
(tra
nsm
issio
n)Y
esY
esN
oN
o1.
032
.713
.1Y
esY
esY
esY
esIS
AG
EN
Elec
trici
ty (g
ener
atio
n)Y
esY
esN
oN
o1.
641
.79.
7Y
esY
esC
OR
ELC
A 8
/El
ectri
city
(gen
erat
ion)
Yes
Yes
No
No
-369
.094
.0...
Yes
Yes
UR
RA
Elec
trici
ty (g
ener
atio
n)Y
esY
esN
oN
o-1
20.7
85.0
8.1
Yes
Yes
CE
DE
NA
REl
ectri
city
(dist
ribut
ion)
Yes
Yes
Yes
No
No
0.6
59.0
9.4
Yes
Yes
ME
TA 9
/El
ectri
city
(dist
ribut
ion)
Yes
Yes
Yes
No
No
-0.8
23.1
...Y
esY
esS
AN
TAN
DE
REl
ectri
city
(dist
ribut
ion)
Yes
Yes
Yes
No
No
-5.0
23.2
9.1
Yes
Yes
HU
ILA
Elec
trici
ty (d
istrib
utio
n)Y
esY
esY
esN
oN
o3.
035
.017
.0Y
esY
esIN
DU
MIL
Arm
amen
tY
esY
esN
oN
o11
.054
.03.
9Y
esS
ATE
NA
Air
trans
porta
tion
Yes
Yes
Yes
No
No
40.9
65.0
8.4
Yes
Tota
l ent
erpr
ises
1414
811
514
141
1014
1
S
ourc
e: D
epar
tmen
t of N
atio
nal P
lann
ing.
1/
Pro
fitab
ility
is d
efin
ed a
s the
ratio
of n
et p
rofit
s to
net w
orth
.
2/ D
ebt l
evel
is d
efin
ed a
s the
ratio
of t
otal
liab
ilitie
s to
tota
l ass
ets.
Follo
win
g La
w 3
58, d
ebt l
evel
s are
def
ined
as l
ow (<
40
perc
ent),
med
ium
(40
perc
ent -
70
perc
ent),
and
hig
h (>
70
perc
ent).
3/
Deb
t cos
t is d
efin
ed a
s the
ratio
of a
ccru
ed fi
nanc
ial c
osts
to a
vera
ge to
tal d
ebt,
incl
udin
g sh
ort-
and
long
-term
deb
t.
4/ T
he G
ener
al C
ompt
rolle
r exe
rcise
s fis
cal c
ontro
l ove
r all
publ
ic e
nter
pris
es.
5/
Deb
t inc
lude
s bill
s pay
able
and
tax
arre
ars.
6/
Tel
ecom
was
liqu
idat
ed in
June
200
3. T
he g
over
nmen
t cre
ated
Col
ombi
a Te
leco
mm
unic
atio
ns u
nder
priv
ate
sect
or re
gula
tions
.
7/ D
ebt i
s def
ined
as l
abor
and
pen
sion
liab
ilitie
s.
8/ D
ebt i
nclu
des l
abor
liab
ilitie
s and
floa
ting
debt
with
supp
liers
.
9/ D
ebt i
s def
ined
as f
loat
ing
debt
and
pen
sion
liab
ilitie
s.
Tabl
e 2.
Col
ombi
a: C
omm
erci
al O
rient
atio
n of
Pub
lic E
nter
pris
es
Man
ager
ial I
ndep
ende
nce
Rel
atio
ns w
ith G
over
nmen
t
Cred
itwor
thin
ess
Fina
ncia
l Con
ditio
nsG
over
nanc
e St
ruct
ure
Pric
ing
polic
yEm
ploy
men
t pol
icy

- 47 -
REFERENCES
Alesina, Alberto, and Roberto Perotti, 1995, “Political Economy of Budget Deficits,” Staff
Papers, International Monetary Fund, Vol. 42 (March), pp.1–31.
Aschauer, David Alan, 1989a, “Is Public Expenditure Productive?” Journal of Monetary Economics, Vol. 23 (March), pp. 177–200.
———, 1989b, “Public Investment and Productivity Growth in the Group of Seven,”
Economic Perspectives, Vol. 13 (September/October), pp. 17–25. Bajo-Rubio, Oscar, and Simon Sosvilla-Rivero, 1993, “Does Public Capital Affect Private
Sector Performance? An Analysis of the Spanish Case, 1964-1988,” Economic Modeling, Vol. 10 (July), pp. 179–84.
Balassone, Fabrizio, and Daniele Franco, 2000, “Public Investment, the Stability Pact, and
the Golden Rule,” Fiscal Studies, Vol. 21, No. 2, pp. 207–29. Barro, Robert, 1991, “Economic Growth in a Cross Section of Countries,” Quarterly Journal
of Economics, Vol. 106 (May), pp. 407–43. Berndt, Ernst R., and Bengt Hansson, 1991, “Measuring the Contribution of Public
Infrastructure Capital in Sweden,” NBER Working Paper No. 3842 (Cambridge, Massachusetts: National Bureau of Economics Research).
Blanchard, Olivier J., and Francesco Giavazzi, 2003, “Improving the SGP through a Proper
Accounting of Public Investment” (unpublished; Cambridge, Massachusetts: MIT Press).
Brenneman, Adam, and Michel Kerf, 2002, “Infrastructure and Poverty Linkages: A Review
of the Literature” (unpublished; Washington: World Bank). Buiter, Willem H., 1983, “Measurement of the Public Sector Deficit and Its Implications for
Policy Evaluation and Design,” Staff Papers, International Monetary Fund, Vol. 30 (June), pp. 307–49.
———, 1990, Principles of Budgetary and Financial Policy (Cambridge, Massachusetts:
MIT Press). ———, 2001, “Notes on ‘A Code for Fiscal Stability’,” Oxford Economic Papers, Vol. 53
(January), pp. 1–19.

- 48 -
Buiter, Willem H., and Clemens Grafe, 2002, “Patching Up the Pact: Some Suggestions for Enhancing Fiscal Sustainability in an Enlarged European Union”, CEPR Discussion Paper No. 3496 (London: Centre for Economic Policy Research).
Buti, Marco, Sylvester Eijffinger, and Daniele Franco, 2003, “Revisiting the Stability and
Growth Pact: Grand Design or Internal Adjustment?” Economic Papers, No. 180 (Brussels: European Communities).
Calderón, César, and Luis Servén, 2003, “The Output Cost of Latin America’s Infrastructure
Gap,” in The Limits of Stabilization—Infrastructure, Public Deficits, and Growth in Latin America, ed. by William Easterly and Servén (Washington: World Bank).
Calderón, César, William Easterly, and Luis Servén, 2003a, “Latin America’s Infrastructure
in the Era of Macroeconomic Crises,” in The Limits of Stabilization—Infrastructure, Public Deficits, and Growth in Latin America, ed. by Easterly and Servén (Washington: World Bank).
———, 2003b, “Infrastructure Compression and Public Sector Solvency in Latin America,” in The Limits of Stabilization—Infrastructure, Public Deficits, and Growth in Latin America, ed. by Easterly and Servén (Washington: World Bank).
Canning, David, and Esra Bennathan, 2000, “The Social Rate of Return on Infrastructure
Investments,” World Bank Policy Research Working Paper No. 2390 (Washington). Clarida, Richard H., 1993, “International Capital Mobility, Public Investment and Economic
Growth,” NBER Working Paper No. 4506 (Cambridge, Massachusetts: National Bureau of Economics Research).
Clements, Benedict, Rina Bhattacharya, and Toan Quoc Nguyen, 2003, “External Debt,
Public Investment, and Growth in Low-Income Countries,” IMF Working Paper (forthcoming; Washington: International Monetary Fund).
Conrad, Klaus, and Helmut Seitz, 1994 “The Economic Benefits of Public Infrastructure,”
Applied Economics, Vol. 26 (April), pp. 303–11. Crihfield, John B., and Martin P. H. Panggabean, 1995, “Is Public Infrastructure Productive?
A Metropolitan Perspective Using New Capital Stock Estimates,” Regional Science and Urban Economics, Vol. 25 (October), pp. 607–30.
Dalamagas, Basil, 1995, “A Reconsideration of Public Sector’s Contribution to Growth,”
Empirical Economics, Vol. 20, No. 3, pp. 385–414. Demetriades, Panicos and Theofanis Mamuneas, 2000, “Intertemporal Output and
Employment Effects of Public Infrastructure Capital: Evidence from 12 OECD Economies,” Economic Journal, Vol. 110 (July), pp. 687-712.

- 49 -
Devarajan, Shantayanan, Vinaya Swaroop, and Heng-fu Zou, 1996, “The Composition of
Public Expenditure and Economic Growth,” Journal of Monetary Economics, Vol. 37 (April), pp. 313–44.
Easterly, William, and Sergio Rebelo, 1993, “Fiscal Policy and Economic Growth,” Journal
of Monetary Economics, Vol. 32 (December), pp. 417–58. Erenburg, Sharon J., 1993, “The Real Effects of Public Investment on Private Investment,
Applied Economics, Vol. 25, pp. 831-7 ———, and Mark E. Wohar, 1995, “Public and Private Investment: Are there Casual
Linkages?” Journal of Macroeconomics Vol. 17, pp. 1-30 European Commission, 2003, Public Finances in EMU, 2003, European Economy, Reports
and Studies (Brussels). Föttinger, Wolfgang, 2001, “Balanced Budget Versus Golden Rule: On the Remediability of
Fiscal Restrictions,” in Fiscal Rules, ed. by Franco Balassone and Daniele Franco (Rome: Banca d’Italia).
Ford, Robert, and Pierre Poret, 1991, “Infrastructure and Private Sector Productivity,” OECD
Economic Studies, Vol. 17 (Autumn), pp. 63–89. Galí, Jordi, and Roberto Perotti, 2003, “Fiscal Policy and Monetary Integration in Europe,”
Economic Policy, Vol. 18 (October), pp. 533–72. Garcia-Milà, Teresa, Therese J. McGuire, and Robert H. Porter, 1996, “The Effects of Public
Capital in State-Level Production Functions Reconsidered,” Review of Economics and Statistics, Vol. 78 (February), pp. 177–206.
Gavin, Michael and and Roberto Perotti, 1997, “Fiscal Policy in Latin America,” NBER
Macroeconomics Annual (National Buraeu of Economic Research, pp. 11-72. Gavin, Michael and Ricardo Hausmann, 1998, Macroeconomic Volatility and Economic
Development, in Silvio Borner and Martin Paldam (eds.), The Political Dimension of Economic Growth: Proceedings of the IEA Conference held in San José, Costa Rica, Macmillan Press: London in association with the International Economic Association
Gramlich, Edward M., 1994, “Infrastructure Investment: A Review Essay,” Journal of
Economic Literature, Vol. 32 (September), pp. 1176–96. Gupta, Sanjeev, Benedict Clements, Emanuele Baldacci, and Carlos Mulas-Granados, “Fiscal
Policy, Expenditure Composition, and Growth in Low-Income Countries,” IMF Working Paper (forthcoming; Washington: International Monetary Fund).

- 50 -
Harris, Clive, 2003, “Private Participation in Infrastructure in Developing Countries: Trends,
Impacts, and Policy Lessons,” World Bank Working Paper No. 5 (Washington). Heller, Peter S. and Sanjeev Gupta, 2002, "More Aid—Making it work for the Poor" World
Economics, Volume 3, no. 4. Hemming, Richard, Michael Kell, and Selma Mahfouz, 2002, “The Effectiveness of Fiscal
Policy in Stimulating Economic Activity—A Review of the Literature,” IMF Working Paper 02/208 (Washington: International Monetary Fund).
HM Treasury, 2003, PFI: Meeting the Investment Challenge (London: Her Majesty’s
Stationery Office). Holtz-Eakin, Douglas, and Amy Ellen Schwartz, 1995, “Infrastructure in a Structural Model
of Economic Growth,” Regional Science and Urban Economics, Vol. 25 (April), pp. 131–51.
Independent Evaluation Office, 2003, Evaluation Report: Fiscal Adjustment in
IMF-Supported Programs (Washington: International Monetary Fund). Kamps, Christophe, 2003, “New Estimates of Government Net Capital Stocks for 22 OECD
Countries, 1960–2001,” IMF Working Paper (forthcoming). Kavanagh, Catherine, 1997, “Public Capital and Private Sector Productivity in Ireland,
1958–90,” Journal of Economic Studies, Vol. 24, No. 1/2, pp. 72–94. Khan, Mohsin S., and Manmohan S. Kumar, 1997, “Public and Private Investment and the
Growth Process in Developing Countries,” Oxford Bulletin of Economics and Statistics, Vol. 59, No. l, pp. 69–88.
La Ferrara, Eliana, and Massimiliano Marcellino, 2000, “TFP, Costs, and Public
Infrastructure: An Equivocal Relationship,” IGIER Working Paper No. 176 (Milan, Italy: Innocenzo Gasparini Institute for Economic Research).
Leipziger, Danny, Marianne Fay, Quentin Woden, and Tito Yepes, 2003, “Achieving the
Millenium Development Goals—A Multi-Sectoral Approach Revisited” World Bank Policy Research Working Paper No. 3163 (Washington).
Ligthart, Jenny E., 2000, “Public Capital and Output Growth in Portugal: An Empirical
Analysis,” IMF Working Paper 00/11 (Washington: International Monetary Fund). Lynde, Catherine, and James Richmond, 1993a, “Public Capital and Long-Run Costs in UK
Manufacturing,” Economic Journal, Vol. 103, No. 419, pp. 880–93.

- 51 -
———, 1993b, “Public Capital and Total Factor Productivity,” International Economic Review, Vol. 34 (May), pp. 401–14.
Mas, Mathilde, Joaquin Maudos, Francisco Perez, and Ezequiel Uriel, 1996, “Infrastructure
and Productivity in the Spanish Regions,” Regional Studies, Vol. 30, No. 7, pp. 641–50.
Merriman, David, 1991, “Public Capital and Regional Output: Another Look at Some
Japanese and American Data,” Regional Science and Urban Economics, Vol. 20 (February), pp. 437–58.
Milbourne, Ross, Glen D. Otto, and Graham M. Voss, 2003, “Public Investment and
Economic Growth,” Applied Economics, Vol. 35 (March), pp. 527–40. Morrison, Catherine J., and Amy Ellen Schwartz, 1996, “State Infrastructure and Productive
Performance,” American Economic Review, Vol. 86 (December), pp. 1095–111. Otto, Glen D., and Graham M. Voss, 1996, “Public Capital and Private Production in
Australia,” Southern Economic Journal, Vol. 62, No. 3, pp. 723–38. Oksanen, Heikki, 2003, “Population Ageing and Public Finance Targets,” European
Economy, Economic Papers, No. 196 (Brussels: European Commission, Directorate-General for Economic and Financial Affairs).
Roubini, Nouriel, and Jeffrey Sachs, 1989, “Government Spending and Budget Deficits in
the Industrial Countries,” Economic Policy, Vol. 4 (April), pp 99–132. Seitz, Helmut, and Georg Licht, 1995, “The Impact of Public Infrastructure Capital on
Regional Manufacturing Production Cost,” Regional Studies, Vol. 29 (June), pp. 231–40.
Servén, Luis, and Andres Solimano, 1992, “Economic Adjustment and Investment
Performance in Developing Countries: The Experience of the 1980s,” in Adjustment Lending Revisited: Policies to Restore Growth, ed. by Vittorio Corbo, Stanley Fischer, and Steven B. Webb (Washington: World Bank).
Sturm, Jan Egbert, Jan Jacobs, and Peter Groote,1999, “Output Effects of Infrastructure
Investment in the Netherlands, 1853-1913,” Journal of Macroeconomics, Vol. 21 (April), pp. 355–80.
Sturm, Jan Egbert, and Jakob De Haan, 1995, “Is Public Expenditure Really Productive?
New Evidence from the USA and the Netherlands,” Economic Modeling, Vol. 12 (January), pp. 60–72.

- 52 -
Tanzi, Vito, 1993, “Fiscal Deficit Measurement: Basic Issues,” in How To Measure the Fiscal Deficit: Analytical and Methodological Issues, ed. by Mario I. Bléjer and Adrienne Cheasty (Washington: International Monetary Fund).
———, and Hamid R. Davoodi, 2002, “Corruption, Public Investment, and Growth,” in
Governance, Corruption, and Economic Performance, ed. by George T. Abed and Sanjeev Gupta (Washington: International Monetary Fund.
Vanhoudt, Patrick, Thomas Mathä, and Bert Smid, 2000, “How Productive Are Capital
Investments in Europe?” EIB Papers (European Investment Bank), Vol. 5, No. 2, pp. 81–106.
World Bank, 1988, World Development Report (Washington; Oxford; New York: Oxford
University Press). World Bank-International Monetary Fund, 2003, Supporting Sound Policies with Adequate
and Appropriate Financing, The Development Committee (Joint Ministerial Committee of the Boards of Governors of the Bank and the Fund On the Transfer of Real Resources to Developing Countries), DC 2003-0016, September 13, 2003.