Embed Size (px)
Citation preview
This article was downloaded by: ["Queen's University Libraries, Kingston"]On: 23 September 2013, At: 04:23Publisher: RoutledgeInforma Ltd Registered in England and Wales Registered Number: 1072954 Registeredoffice: Mortimer House, 37-41 Mortimer Street, London W1T 3JH, UK
Journal of Human Development andCapabilities: A Multi-DisciplinaryJournal for People-CenteredDevelopmentPublication details, including instructions for authors andsubscription information:http://www.tandfonline.com/loi/cjhd20
Public Health Spending, Governanceand Child Health Outcomes: Revisitingthe LinksBingjie Hu & Ronald U. MendozaPublished online: 21 Mar 2013.
To cite this article: Bingjie Hu & Ronald U. Mendoza (2013) Public Health Spending, Governanceand Child Health Outcomes: Revisiting the Links, Journal of Human Development andCapabilities: A Multi-Disciplinary Journal for People-Centered Development, 14:2, 285-311, DOI:10.1080/19452829.2013.765392
To link to this article: http://dx.doi.org/10.1080/19452829.2013.765392
PLEASE SCROLL DOWN FOR ARTICLE
Taylor & Francis makes every effort to ensure the accuracy of all the information (the“Content”) contained in the publications on our platform. However, Taylor & Francis,our agents, and our licensors make no representations or warranties whatsoever as tothe accuracy, completeness, or suitability for any purpose of the Content. Any opinionsand views expressed in this publication are the opinions and views of the authors,and are not the views of or endorsed by Taylor & Francis. The accuracy of the Contentshould not be relied upon and should be independently verified with primary sourcesof information. Taylor and Francis shall not be liable for any losses, actions, claims,proceedings, demands, costs, expenses, damages, and other liabilities whatsoever orhowsoever caused arising directly or indirectly in connection with, in relation to or arisingout of the use of the Content.
This article may be used for research, teaching, and private study purposes. Anysubstantial or systematic reproduction, redistribution, reselling, loan, sub-licensing,systematic supply, or distribution in any form to anyone is expressly forbidden. Terms &

Conditions of access and use can be found at http://www.tandfonline.com/page/terms-and-conditions
Dow
nloa
ded
by [
"Que
en's
Uni
vers
ity L
ibra
ries
, Kin
gsto
n"]
at 0
4:23
23
Sept
embe
r 20
13
Public Health Spending, Governance and
Child Health Outcomes: Revisiting the Links
BINGJIE HU and RONALD U. MENDOZABingjie Hu is an economist at the World Bank, Washington DC, USA
Ronald U. Mendoza is an associate professor at the Asian Institute of
Management, Philippines
Abstract This paper empirically examines the determinants of child healthin developing countries and how public policy may interact with these deter-minants. It improves on previous empirical studies by conducting a morecareful analysis of the determinants controlling for possible endogeneity,and by using a more comprehensive and richer panel dataset, drawing on ahealth database covering 136 countries over 1960–2005, supplemented bythe latest World Development Indicators dataset as well as data on a broadvariety of alternative indicators of governance, such as those from the Inter-national Country Risk Guide and the Open Budget Index. We find that bothpublic spending on healthcare and the quality of governance matter for thereduction of child mortality rates. However, our mixed results on the inter-action of governance with public spending throw some doubt on the conclu-siveness of previous empirical studies.
Key words: Child and infant mortality rates, Governance, Social spending,Fiscal spaceJEL code: H-51, I-18, O-15
Introduction
Public spending could help boost human development outcomes directlythrough, for example, investments in basic education and health. Alterna-tively, public spending could also be utilized to help strengthen growth-enhan-cing and income-enhancing investments, notably for the vast majority of poorhouseholds in developing countries. Both strategies could be principallymotivated to address market failures, to the extent that investments in edu-cation and health could produce broader externalities for families, commu-nities and the broader economy. Yet governance failures are also possiblewhen it comes to public spending. In an era of tighter public sector resourcesand many competing areas for public spending and investments, policy-
Journal of Human Development and Capabilities, 2013Vol. 14, No. 2, 285–311, http://dx.doi.org/10.1080/19452829.2013.765392
# 2013 Human Development and Capability Association
Dow
nloa
ded
by [
"Que
en's
Uni
vers
ity L
ibra
ries
, Kin
gsto
n"]
at 0
4:23
23
Sept
embe
r 20
13
makers need to demonstrate strong results from public social spending, whichusually requires good governance of public resources.
The importance of good governance has been emphasized by economistsand policy analysts, mainly for its role in enhancing economic performanceand supporting income growth (for instance, see Hall and Jones, 1999). Inline with this idea, some studies in the development literature have high-lighted the impact of governance quality on the social outcomes that publicpolicies are supposed to attain, such as education and child health (Pritchettand Summers, 1996; Filmer et al., 2000). One idea shared by these studies isthat in countries where governance is poor, public resources suffer from lea-kages and fail to translate into social investments that could result in desirablesocial outcomes such as better child education and health.
However, much of the development literature on the role of governancehas been based on anecdotal evidence, with only a small group of studies thatprovide empirical evidence on the effect of governance on social outcomesand the effectiveness of public spending. A cross-country study by Guptaet al. (2002) suggests that public spending on healthcare only has an insignif-icant effect on child mortality rates, whereas corruption itself has a significantnegative impact. Along similar lines, a more recent study by Rajkumar andSwaroop (2008) finds that governance quality affects the impact of publichealth spending on policy outcomes such as child education and health.Their results suggest that in countries that are poorly governed, public spend-ing has little impact on the outcomes; by contrast, in countries with good gov-ernance, public spending on healthcare has a significant effect on childeducation and child mortality rates.
Our present empirical analysis contributes to this small but growingstrand of literature on the role of good governance in enhancing social out-comes, using a comprehensive cross-country dataset on infant and child mor-tality rates, public spending on healthcare, indicators of governance qualityand other factors that may affect child health. In this paper, we study theimpact of public spending on healthcare on child mortality rates, and howgovernance affects the effectiveness of public spending. We attempt toimprove on previous studies by using better measures of governancequality, and addressing potential reverse causality between public spendingon healthcare and child health outcomes. To our knowledge, many empiricalstudies of child health determinants do not attempt to address endogeneityissues, with a few exceptions (for example, Rajkumar and Swaroop, 2008)that may have relied on a problematic empirical strategy. In our view, theabove-mentioned authors fail to justify all of their explanatory variables. Forinstance, the authors have used the percentage of population under the ageof five as a determinant of child mortality rate in their regression. This demo-graphical variable may be endogenous, because it relates to the fertility choicemade according to the contemporaneous mortality rates. The study has alsoincluded Muslim religion as a right-hand-side variable without explaining why.
In the present analysis, we contribute to the literature by instrumentingfor the potentially endogenous public spending variable, utilizing variation
286
B. Hu and R. U. Mendoza
Dow
nloa
ded
by [
"Que
en's
Uni
vers
ity L
ibra
ries
, Kin
gsto
n"]
at 0
4:23
23
Sept
embe
r 20
13
across countries and over time, and using only those explanatory variablesthat could be justified by the theory. Unlike previous empirical studiesthat fail to find a meaningful effect of public spending alone on policyoutcomes—Gupta et al. (2002) on child health, Filmer and Pritchett (1999)on child education and health, and Rajkumar and Swaroop (2008) on childeducation—our study does show that more public spending on healthcareleads to significantly lower infant and child mortality rates, controlling for gov-ernance quality. Our main regression results indicate that for a one percentagepoint increase in public spending on healthcare as a share of gross domesticproduct (GDP), there may be a 0.1% decrease in child deaths per 1000 chil-dren under the age of five. This impact of spending on outcomes is statisticallysignificant at the 1% level.
In the meantime, we also find that the general quality of governance, asmeasured by the control of corruption and the quality of bureaucracy, plays animportant role in helping to reduce infant and child mortality rates. Forexample, our main regression results lead us to believe that infant and childmortality rates could be significantly lowered if there was less corruption.Likewise, the effect of higher quality of bureaucracy on child mortality ratesis also statistically significant.
The impact of a related but more specific aspect of good governance, thetransparency of fiscal budgeting process, has been covered by the develop-ment literature (Shah, 2007; Ablo and Reinikka, 1998; Deles et al., 2010).The key hypothesis is that the quality of budget institutions affects whetherpublic resources are effectively spent and has an important impact on socialoutcomes. In the present study, we make an effort to empirically test thatproposition by using an institutional quality indicator that directly measuresthe transparency of the budgeting process. Unlike previous studies of socialbudgeting that are based on anecdotal evidence, our empirical analysis isless clear about the impact of budget transparency on child mortality ratesor the effectiveness of public spending. Data on this new indicator ofbudget governance are still less than comprehensive, with the transparencyratings available for one year only, so improvements could be made givenmore informative measures of fiscal transparency.
Apart from variables related to governance quality, we also look intoother empirical determinants such as income, inequality and female edu-cation. Not surprisingly, we find income per capita to have a significant nega-tive impact on infant and child mortality rates and find income inequality tohave an adverse effect on child health, implying that access to basic resourcesby the poor households does matter for child well-being.
In order to address endogeneity issues related to maternal choices thatare made according to contemporaneous infant or child mortality rates, weuse the lag of female illiteracy rate as an explanatory variable. We find a signifi-cant positive association between female illiteracy and child mortality rates.Our results provide evidence that the child mortality rate, measured as thenumber of deaths per 1000 children under the age of five, may drop morethan 1% if there is a one percentage point reduction in female illiteracy
287
Public Health Spending, Governance and Child Health Outcomes
Dow
nloa
ded
by [
"Que
en's
Uni
vers
ity L
ibra
ries
, Kin
gsto
n"]
at 0
4:23
23
Sept
embe
r 20
13
rate. This finding is consistent with the previous literature on the importanceof maternal education for child health (Caldwell and McDonald, 1982;Hojman, 1996; Boyle et al., 2006; McCrary et al., 2011).
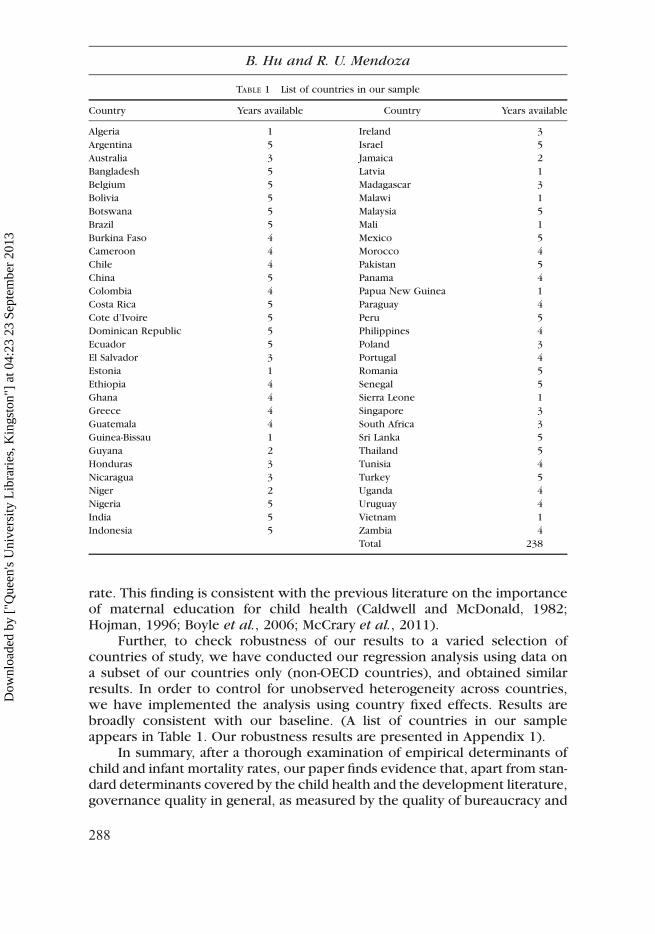
Further, to check robustness of our results to a varied selection ofcountries of study, we have conducted our regression analysis using data ona subset of our countries only (non-OECD countries), and obtained similarresults. In order to control for unobserved heterogeneity across countries,we have implemented the analysis using country fixed effects. Results arebroadly consistent with our baseline. (A list of countries in our sampleappears in Table 1. Our robustness results are presented in Appendix 1).
In summary, after a thorough examination of empirical determinants ofchild and infant mortality rates, our paper finds evidence that, apart from stan-dard determinants covered by the child health and the development literature,governance quality in general, as measured by the quality of bureaucracy and
TABLE 1 List of countries in our sample
Country Years available Country Years available
Algeria 1 Ireland 3
Argentina 5 Israel 5
Australia 3 Jamaica 2
Bangladesh 5 Latvia 1
Belgium 5 Madagascar 3
Bolivia 5 Malawi 1
Botswana 5 Malaysia 5
Brazil 5 Mali 1
Burkina Faso 4 Mexico 5
Cameroon 4 Morocco 4
Chile 4 Pakistan 5
China 5 Panama 4
Colombia 4 Papua New Guinea 1
Costa Rica 5 Paraguay 4
Cote d’Ivoire 5 Peru 5
Dominican Republic 5 Philippines 4
Ecuador 5 Poland 3
El Salvador 3 Portugal 4
Estonia 1 Romania 5
Ethiopia 4 Senegal 5
Ghana 4 Sierra Leone 1
Greece 4 Singapore 3
Guatemala 4 South Africa 3
Guinea-Bissau 1 Sri Lanka 5
Guyana 2 Thailand 5
Honduras 3 Tunisia 4
Nicaragua 3 Turkey 5
Niger 2 Uganda 4
Nigeria 5 Uruguay 4
India 5 Vietnam 1
Indonesia 5 Zambia 4
Total 238
288
B. Hu and R. U. Mendoza
Dow
nloa
ded
by [
"Que
en's
Uni
vers
ity L
ibra
ries
, Kin
gsto
n"]
at 0
4:23
23
Sept
embe
r 20
13
the control of corruption, also plays an important role in enhancing childwelfare. However, we obtain ambiguous results on the effect of budget trans-parency and the interaction between governance and public spending effec-tiveness, which suggests a need to keep searching for more precisemeasures of governance quality and better instruments for the public spend-ing variable.
The remaining sections of our paper are organized as follows. The nextsection discusses the main determinants of child mortality rates and presentsthe empirical methodology. We discuss our results in the subsequent section.The final section presents our conclusion.
Empirical methodology
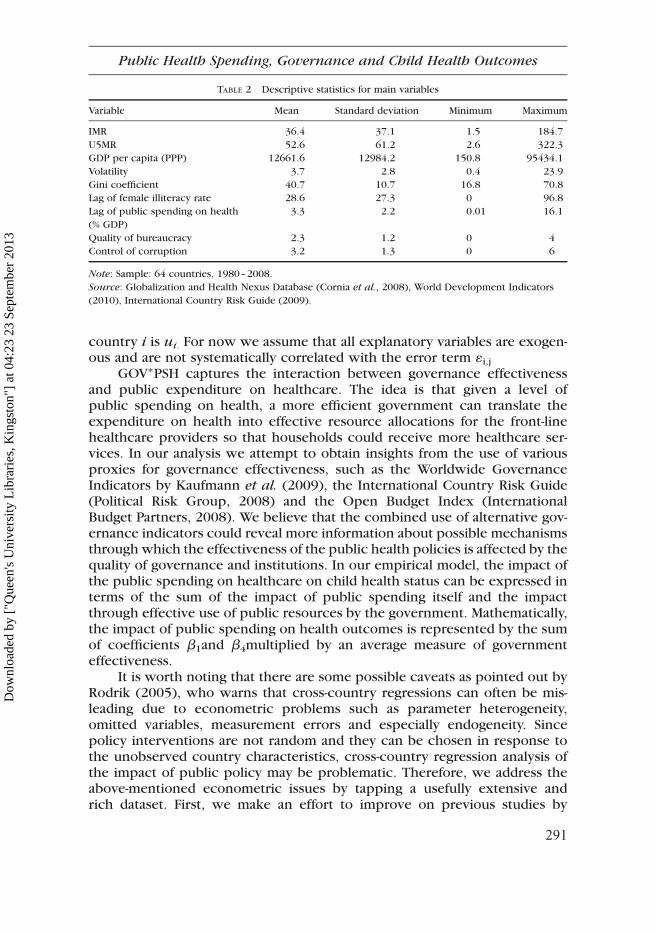
Drawing on the empirical literature, the following summarizes the main expla-natory variables that we will use to analyze child health outcomes. (Descrip-tive statistics for these variables appear in Table 2. A detailed description ofour data is in Appendix 2).
. Income. National income may affect infant and child mortality both directlyand indirectly (Hojman, 1996). First, there is a direct positive associationbetween wealth and survival chances, since the ability of households tosecure food supply and meet medical needs depends on their wealthlevel. Second, national income may also affect survival chances indirectlythrough its impact upon the birth rate. Third, a higher income is usuallyassociated with a higher degree of female participation in the labor force(Handwerker, 1992), which in turn may have an indirect effect on child mor-tality rates.
. Inequality. A society’s income distribution pattern may affect mortalityrates. Waldmann (1992), for instance, finds that inequality still has anadverse impact on mortality even if the real income of the poor is accountedfor. In addition, Agha (2000) documents the rural–urban disparity in childhealth outcomes due to income inequality in Pakistan. Furthermore,Cornia et al. (2008) propose that, given an average GDP per capita, amore egalitarian income distribution can improve health status by ensuringthat most households have access to basic resources whereas high inequal-ity adversely affects future health status.
. Economic and income volatility. Aggregate macroeconomic shocks mayhave an adverse effect on child health outcomes. If shocks reduce invest-ment in child health, there may be a persistent negative impact on poor chil-dren and intergenerational transmission of poverty. On some fronts, such asin education and child labor, the relationship between macroeconomicuncertainty and child outcomes may be ambiguous due to the interplaybetween substitution and income effects (Ferreira and Schady, 2009).Thus it remains an empirical question whether the volatility of the macroe-conomic environment has a negative or positive impact on child healthstatus.
289
Public Health Spending, Governance and Child Health Outcomes
Dow
nloa
ded
by [
"Que
en's
Uni
vers
ity L
ibra
ries
, Kin
gsto
n"]
at 0
4:23
23
Sept
embe
r 20
13
. Female education. Education for women can help mothers improve childhealth through providing more effective childcare at home and more effi-cient use of health services. It may also lead to delayed child-bearing andlonger birth intervals as well as more work opportunities for women to gen-erate additional household wealth. Wealth in the hands of women is alsooften seen as more conducive to investing in the basic needs of the house-hold, including on children’s health (for example, Caldwell, 1979, 1994;Boyle et al., 2006; Hojman, 1996; Basu and Stephenson, 2005).
. Public spending on health. Public health policy and investments can helpto reduce child mortality by augmenting households’ capability to investin mothers’ and children’s nutrition, health and well-being. Nevertheless,as elaborated earlier, policies and expenditures do not always translate tothese outcomes, and their effectiveness is subject to empirical inquiry.
. Effectiveness of governance. Public expenditure on healthcare may notnecessarily translate into effective health services due to several reasons.First, the mere allocation of public resources for health services may failto reach health service providers if budget institutions, which involvebudget formulation, execution, monitoring and auditing, do not functionproperly (Deles et al., 2010). Second, even if the health service providersreceive the allocated public resources, they may fail to supply effective ser-vices to consumers, especially poor people and children, due to moralhazard problems and information asymmetry between public health regula-tors and service providers (Grindle, 2004). Third, intra-household resourceallocation may also distort the child health outcomes (Duflo, 2000). Finally,countries with poor quality of institutions and high corruption tend toinvest more in physical capital instead of social welfare (Kaufmann et al.,2004; Gupta et al., 2002).
Therefore, drawing on the preceding, the empirical model of child mor-tality rate determinants could be specified by the following equation:
ln U5MR( )i,t= b0 + b1ln GDPpc( )
i,t+b2 PSH( )i,t+b3GOVi,t
+ b4 GOV ∗PSH( )i,t+BXi,t + ui + 1i,t (1)
The under-five mortality rate (U5MR) is defined as the probability of a childborn in a specific year or period dying before reaching the age of five, ifsubject to age-specific mortality rates of that period. GDPpc is income percapita measured in 2005 purchasing power parity (PPP) internationaldollars, PSH is the public spending on healthcare as a share of GDP; andGOV is a measure of government effectiveness, which is a proxy for the effec-tiveness of the public sector. X contains other country characteristics that canaffect health status, such as illiteracy rate among females and volatility of themacroeconomic environment. The i-tth observation refers to that of country i,year t. We control for unobserved country-specific characteristics that mayaffect mortality rates using country fixed effects, so that the intercept for
290
B. Hu and R. U. Mendoza
Dow
nloa
ded
by [
"Que
en's
Uni
vers
ity L
ibra
ries
, Kin
gsto
n"]
at 0
4:23
23
Sept
embe
r 20
13
country i is ui. For now we assume that all explanatory variables are exogen-ous and are not systematically correlated with the error term 1i,j
GOV∗PSH captures the interaction between governance effectivenessand public expenditure on healthcare. The idea is that given a level ofpublic spending on health, a more efficient government can translate theexpenditure on health into effective resource allocations for the front-linehealthcare providers so that households could receive more healthcare ser-vices. In our analysis we attempt to obtain insights from the use of variousproxies for governance effectiveness, such as the Worldwide GovernanceIndicators by Kaufmann et al. (2009), the International Country Risk Guide(Political Risk Group, 2008) and the Open Budget Index (InternationalBudget Partners, 2008). We believe that the combined use of alternative gov-ernance indicators could reveal more information about possible mechanismsthrough which the effectiveness of the public health policies is affected by thequality of governance and institutions. In our empirical model, the impact ofthe public spending on healthcare on child health status can be expressed interms of the sum of the impact of public spending itself and the impactthrough effective use of public resources by the government. Mathematically,the impact of public spending on health outcomes is represented by the sumof coefficients b1and b4multiplied by an average measure of governmenteffectiveness.
It is worth noting that there are some possible caveats as pointed out byRodrik (2005), who warns that cross-country regressions can often be mis-leading due to econometric problems such as parameter heterogeneity,omitted variables, measurement errors and especially endogeneity. Sincepolicy interventions are not random and they can be chosen in response tothe unobserved country characteristics, cross-country regression analysis ofthe impact of public policy may be problematic. Therefore, we address theabove-mentioned econometric issues by tapping a usefully extensive andrich dataset. First, we make an effort to improve on previous studies by
TABLE 2 Descriptive statistics for main variables
Variable Mean Standard deviation Minimum Maximum
IMR 36.4 37.1 1.5 184.7
U5MR 52.6 61.2 2.6 322.3
GDP per capita (PPP) 12661.6 12984.2 150.8 95434.1
Volatility 3.7 2.8 0.4 23.9
Gini coefficient 40.7 10.7 16.8 70.8
Lag of female illiteracy rate 28.6 27.3 0 96.8
Lag of public spending on health 3.3 2.2 0.01 16.1
(% GDP)
Quality of bureaucracy 2.3 1.2 0 4
Control of corruption 3.2 1.3 0 6
Note: Sample: 64 countries, 1980–2008.
Source: Globalization and Health Nexus Database (Cornia et al., 2008), World Development Indicators
(2010), International Country Risk Guide (2009).
291
Public Health Spending, Governance and Child Health Outcomes
Dow
nloa
ded
by [
"Que
en's
Uni
vers
ity L
ibra
ries
, Kin
gsto
n"]
at 0
4:23
23
Sept
embe
r 20
13

using cross-country panel data covering as long a period as possible, so that itis possible to capture more variation across time and account for heterogen-eity across countries by using country fixed effects. Second, we aim toenhance the empirical specification of the economic determinants of childhealth outcomes by using better explanatory variables such as more informa-tive proxies for governance quality and better instruments for public spendingon health care. Third, we attempt to address the reverse causality problemassociated with the policy variable; namely, public spending on healthcare.If the public spending on healthcare is chosen in response to child health out-comes, then it is systematically correlated with the error term in Equation (1)and our estimates will be biased. Thus ideally we need to find an instrumentalvariable that explains the variation in public spending on health, yet does notdetermine child health status through any other channels apart from its inter-action with public spending.
We propose a plausible candidate instrumental variable: the legal originof a given country. Previous studies suggest that legal origin may have influ-ence over the tendency of a government to play a more significant role inthe society (La Porta et al., 1999; Acemoglu and Johnson, 2003). Legalorigins have also been used as instrumental variables for public spending inthe previous studies (for instance, see Rajkumar and Swaroop, 2008). Theidea is that countries with certain legal origins are more likely to have centra-lized government control and therefore tend to have greater power in allocat-ing public resources. For instance, countries with a common law system areless state-oriented than those with a civil law system, which are in turn lessstate-oriented than the ex-Soviet countries. In our paper, we use five legalorigin indicators: UK law, French law, socialist law, German law and Scandina-vian law. We believe that it is reasonable to assume such legal origins do notdirectly determine child or infant mortality rates.
We also consider the following variable as potential candidate instrumen-tal variables for public spending on healthcare:
. Democracy. The structure of the political system may also affect publicspending on healthcare. There is empirical evidence on the positiveimpact of democracy on public expenditure (Stasavage, 2005; Chen,2008; Careja and Emmenegger, 2009). The idea is that, with the introductionof multiple competitions, governments are faced with electoral pressureand thus have a better incentive to increase public expenditure in sectorssuch as health and education.
In our analysis, the proxy for the extent of democracy is the democraticaccountability index from the International Country Risk Guide (Political RiskGroup, 2009). The measurement of this variable is based on the actual politi-cal structure in a given country. For example, a de facto one-party state is dis-tinguished from a de jure one-party state. We believe that this democracyindex is a valid instrument for the spending variable since it is plausible to
292
B. Hu and R. U. Mendoza
Dow
nloa
ded
by [
"Que
en's
Uni
vers
ity L
ibra
ries
, Kin
gsto
n"]
at 0
4:23
23
Sept
embe
r 20
13
assume that democracy does not affect child health outcomes directly otherthan through the public spending channel.
Analysis of empirical results
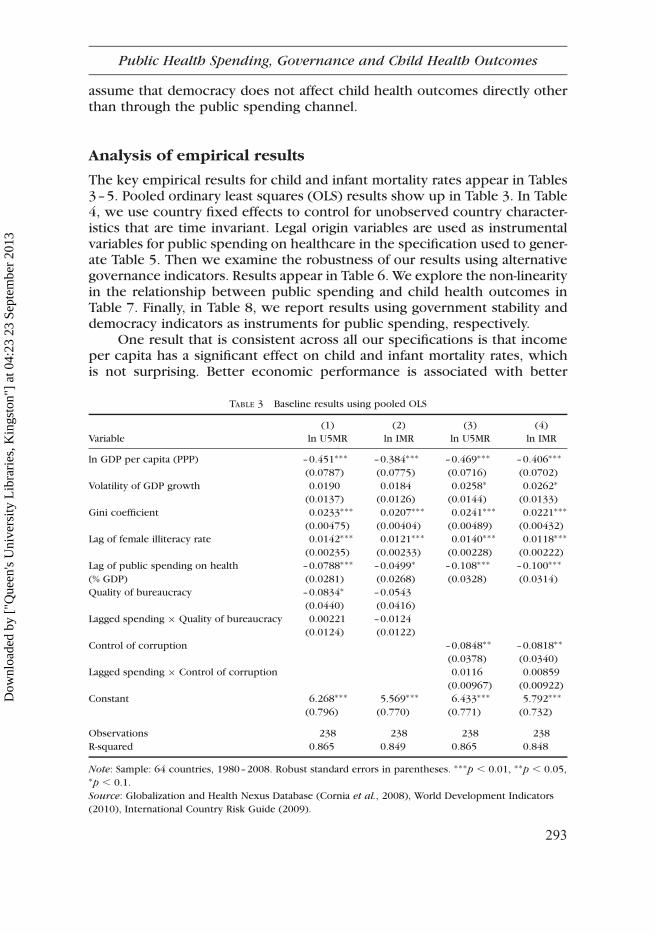
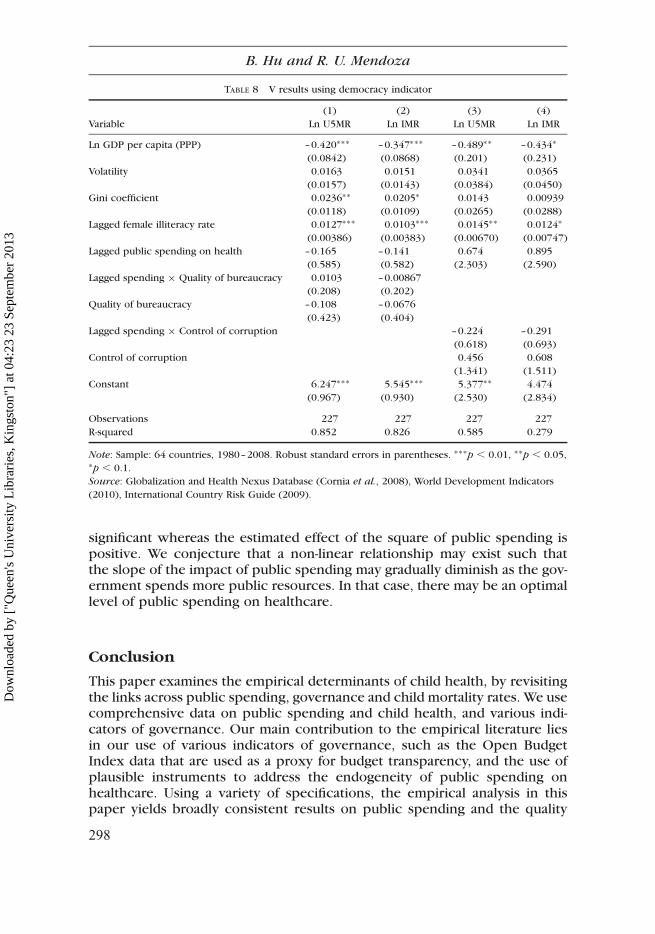
The key empirical results for child and infant mortality rates appear in Tables3–5. Pooled ordinary least squares (OLS) results show up in Table 3. In Table4, we use country fixed effects to control for unobserved country character-istics that are time invariant. Legal origin variables are used as instrumentalvariables for public spending on healthcare in the specification used to gener-ate Table 5. Then we examine the robustness of our results using alternativegovernance indicators. Results appear in Table 6. We explore the non-linearityin the relationship between public spending and child health outcomes inTable 7. Finally, in Table 8, we report results using government stability anddemocracy indicators as instruments for public spending, respectively.
One result that is consistent across all our specifications is that incomeper capita has a significant effect on child and infant mortality rates, whichis not surprising. Better economic performance is associated with better
TABLE 3 Baseline results using pooled OLS
(1) (2) (3) (4)
Variable ln U5MR ln IMR ln U5MR ln IMR
ln GDP per capita (PPP) –0.451∗∗∗ –0.384∗∗∗ –0.469∗∗∗ –0.406∗∗∗
(0.0787) (0.0775) (0.0716) (0.0702)
Volatility of GDP growth 0.0190 0.0184 0.0258∗ 0.0262∗
(0.0137) (0.0126) (0.0144) (0.0133)
Gini coefficient 0.0233∗∗∗ 0.0207∗∗∗ 0.0241∗∗∗ 0.0221∗∗∗
(0.00475) (0.00404) (0.00489) (0.00432)
Lag of female illiteracy rate 0.0142∗∗∗ 0.0121∗∗∗ 0.0140∗∗∗ 0.0118∗∗∗
(0.00235) (0.00233) (0.00228) (0.00222)
Lag of public spending on health –0.0788∗∗∗ –0.0499∗ –0.108∗∗∗ –0.100∗∗∗
(% GDP) (0.0281) (0.0268) (0.0328) (0.0314)
Quality of bureaucracy –0.0834∗ –0.0543
(0.0440) (0.0416)
Lagged spending × Quality of bureaucracy 0.00221 –0.0124
(0.0124) (0.0122)
Control of corruption –0.0848∗∗ –0.0818∗∗
(0.0378) (0.0340)
Lagged spending × Control of corruption 0.0116 0.00859
(0.00967) (0.00922)
Constant 6.268∗∗∗ 5.569∗∗∗ 6.433∗∗∗ 5.792∗∗∗
(0.796) (0.770) (0.771) (0.732)
Observations 238 238 238 238
R-squared 0.865 0.849 0.865 0.848
Note: Sample: 64 countries, 1980–2008. Robust standard errors in parentheses. ∗∗∗p , 0.01, ∗∗p , 0.05,∗p , 0.1.
Source: Globalization and Health Nexus Database (Cornia et al., 2008), World Development Indicators
(2010), International Country Risk Guide (2009).
293
Public Health Spending, Governance and Child Health Outcomes
Dow
nloa
ded
by [
"Que
en's
Uni
vers
ity L
ibra
ries
, Kin
gsto
n"]
at 0
4:23
23
Sept
embe
r 20
13
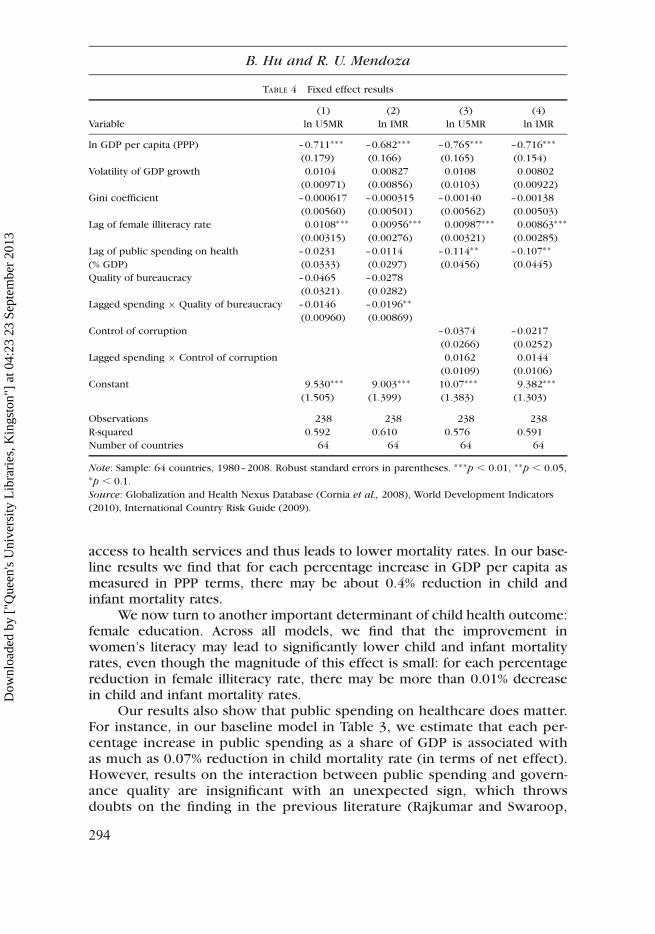
access to health services and thus leads to lower mortality rates. In our base-line results we find that for each percentage increase in GDP per capita asmeasured in PPP terms, there may be about 0.4% reduction in child andinfant mortality rates.
We now turn to another important determinant of child health outcome:female education. Across all models, we find that the improvement inwomen’s literacy may lead to significantly lower child and infant mortalityrates, even though the magnitude of this effect is small: for each percentagereduction in female illiteracy rate, there may be more than 0.01% decreasein child and infant mortality rates.
Our results also show that public spending on healthcare does matter.For instance, in our baseline model in Table 3, we estimate that each per-centage increase in public spending as a share of GDP is associated withas much as 0.07% reduction in child mortality rate (in terms of net effect).However, results on the interaction between public spending and govern-ance quality are insignificant with an unexpected sign, which throwsdoubts on the finding in the previous literature (Rajkumar and Swaroop,
TABLE 4 Fixed effect results
(1) (2) (3) (4)
Variable ln U5MR ln IMR ln U5MR ln IMR
ln GDP per capita (PPP) –0.711∗∗∗ –0.682∗∗∗ –0.765∗∗∗ –0.716∗∗∗
(0.179) (0.166) (0.165) (0.154)
Volatility of GDP growth 0.0104 0.00827 0.0108 0.00802
(0.00971) (0.00856) (0.0103) (0.00922)
Gini coefficient –0.000617 –0.000315 –0.00140 –0.00138
(0.00560) (0.00501) (0.00562) (0.00503)
Lag of female illiteracy rate 0.0108∗∗∗ 0.00956∗∗∗ 0.00987∗∗∗ 0.00863∗∗∗
(0.00315) (0.00276) (0.00321) (0.00285)
Lag of public spending on health –0.0231 –0.0114 –0.114∗∗ –0.107∗∗
(% GDP) (0.0333) (0.0297) (0.0456) (0.0445)
Quality of bureaucracy –0.0465 –0.0278
(0.0321) (0.0282)
Lagged spending × Quality of bureaucracy –0.0146 –0.0196∗∗
(0.00960) (0.00869)
Control of corruption –0.0374 –0.0217
(0.0266) (0.0252)
Lagged spending × Control of corruption 0.0162 0.0144
(0.0109) (0.0106)
Constant 9.530∗∗∗ 9.003∗∗∗ 10.07∗∗∗ 9.382∗∗∗
(1.505) (1.399) (1.383) (1.303)
Observations 238 238 238 238
R-squared 0.592 0.610 0.576 0.591
Number of countries 64 64 64 64
Note: Sample: 64 countries, 1980–2008. Robust standard errors in parentheses. ∗∗∗p , 0.01, ∗∗p , 0.05,∗p , 0.1.
Source: Globalization and Health Nexus Database (Cornia et al., 2008), World Development Indicators
(2010), International Country Risk Guide (2009).
294
B. Hu and R. U. Mendoza
Dow
nloa
ded
by [
"Que
en's
Uni
vers
ity L
ibra
ries
, Kin
gsto
n"]
at 0
4:23
23
Sept
embe
r 20
13
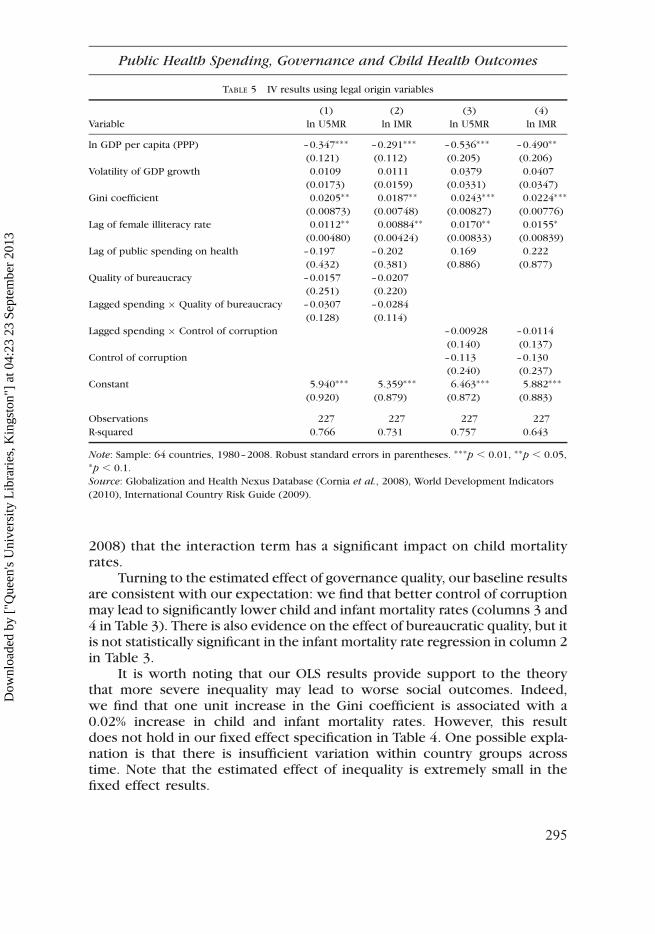
2008) that the interaction term has a significant impact on child mortalityrates.
Turning to the estimated effect of governance quality, our baseline resultsare consistent with our expectation: we find that better control of corruptionmay lead to significantly lower child and infant mortality rates (columns 3 and4 in Table 3). There is also evidence on the effect of bureaucratic quality, but itis not statistically significant in the infant mortality rate regression in column 2in Table 3.
It is worth noting that our OLS results provide support to the theorythat more severe inequality may lead to worse social outcomes. Indeed,we find that one unit increase in the Gini coefficient is associated with a0.02% increase in child and infant mortality rates. However, this resultdoes not hold in our fixed effect specification in Table 4. One possible expla-nation is that there is insufficient variation within country groups acrosstime. Note that the estimated effect of inequality is extremely small in thefixed effect results.
TABLE 5 IV results using legal origin variables
(1) (2) (3) (4)
Variable ln U5MR ln IMR ln U5MR ln IMR
ln GDP per capita (PPP) –0.347∗∗∗ –0.291∗∗∗ –0.536∗∗∗ –0.490∗∗
(0.121) (0.112) (0.205) (0.206)
Volatility of GDP growth 0.0109 0.0111 0.0379 0.0407
(0.0173) (0.0159) (0.0331) (0.0347)
Gini coefficient 0.0205∗∗ 0.0187∗∗ 0.0243∗∗∗ 0.0224∗∗∗
(0.00873) (0.00748) (0.00827) (0.00776)
Lag of female illiteracy rate 0.0112∗∗ 0.00884∗∗ 0.0170∗∗ 0.0155∗
(0.00480) (0.00424) (0.00833) (0.00839)
Lag of public spending on health –0.197 –0.202 0.169 0.222
(0.432) (0.381) (0.886) (0.877)
Quality of bureaucracy –0.0157 –0.0207
(0.251) (0.220)
Lagged spending × Quality of bureaucracy –0.0307 –0.0284
(0.128) (0.114)
Lagged spending × Control of corruption –0.00928 –0.0114
(0.140) (0.137)
Control of corruption –0.113 –0.130
(0.240) (0.237)
Constant 5.940∗∗∗ 5.359∗∗∗ 6.463∗∗∗ 5.882∗∗∗
(0.920) (0.879) (0.872) (0.883)
Observations 227 227 227 227
R-squared 0.766 0.731 0.757 0.643
Note: Sample: 64 countries, 1980–2008. Robust standard errors in parentheses. ∗∗∗p , 0.01, ∗∗p , 0.05,∗p , 0.1.
Source: Globalization and Health Nexus Database (Cornia et al., 2008), World Development Indicators
(2010), International Country Risk Guide (2009).
295
Public Health Spending, Governance and Child Health Outcomes
Dow
nloa
ded
by [
"Que
en's
Uni
vers
ity L
ibra
ries
, Kin
gsto
n"]
at 0
4:23
23
Sept
embe
r 20
13
Interestingly, our instrumental variable (IV) results in Table 5 arebroadly consistent with our baseline results. Note that the estimatedeffect of public spending is larger in magnitude than that in OLSresults, which is consistent with what we expect. Considering the poss-ible reverse causality between public spending and child outcomes, theOLS estimates should be biased towards zero. Results on the other deter-minants are also consistent with our baseline results. The lack of statistical
TABLE 6 Robustness exercise using alternative governance indicators
(1) (2) (3) (4) (5)
Variable lnu5mr lnu5mr lnu5mr lnu5mr lnu5mr
ln GDP per capita (PPP) –0.451∗∗∗ –0.469∗∗∗ –0.472∗∗∗ –0.475∗∗∗ –0.381∗∗∗
(0.0787) (0.0716) (0.0957) (0.0966) (0.0729)
Volatility of GDP growth 0.0190 0.0258∗ 0.0198 0.0244 0.0355∗∗
(0.0137) (0.0144) (0.0316) (0.0314) (0.0165)
Gini coefficient 0.0233∗∗∗ 0.0241∗∗∗ 0.0307∗∗∗ 0.0312∗∗∗ 0.0256∗∗∗
(0.00475) (0.00489) (0.00887) (0.00786) (0.00486)
Lag of female illiteracy rate 0.0142∗∗∗ 0.0140∗∗∗ 0.0168∗∗∗ 0.0170∗∗∗ 0.0164∗∗∗
(0.00235) (0.00228) (0.00378) (0.00376) (0.00281)
Lag of public spending on health –0.0788∗∗∗ –0.108∗∗∗ –0.0531∗∗ –0.0473 –0.0930
(0.0281) (0.0328) (0.0222) (0.0291) (0.0632)
Quality of bureaucracy –0.0834∗
(0.0440)
Lagged spending × Quality of bureaucracy 0.00221
(0.0124)
Control of corruption –0.0848∗∗
(0.0378)
Lagged spending × Control of corruption 0.0116
(0.00967)
Governance quality (WGI) –0.126
(0.254)
Lagged spending × Governance quality 0.0191
(0.0355)
Control of corruption (WGI) –0.118
(0.193)
Lagged spending × Control of corruption 0.0170
(WGI) (0.0341)
Open budget index score 0.00433
(0.00373)
Lagged spending × Open budget index –8.04e–05
(0.00165)
Constant 6.268∗∗∗ 6.433∗∗∗ 5.712∗∗∗ 5.671∗∗∗ 5.243∗∗∗
(0.796) (0.771) (0.965) (0.989) (0.716)
Observations 238 238 89 89 143
R-squared 0.865 0.865 0.854 0.854 0.808
Note: Sample: 64 countries, 1980–2008. Robust standard errors in parentheses. ∗∗∗p , 0.01, ∗∗p , 0.05,∗p , 0.1.
Source: Globalization and Health Nexus Database (Cornia et al., 2008), World Development Indicators
(2010), International Country Risk Guide (2009), Open Budget Index (2006).
296
B. Hu and R. U. Mendoza
Dow
nloa
ded
by [
"Que
en's
Uni
vers
ity L
ibra
ries
, Kin
gsto
n"]
at 0
4:23
23
Sept
embe
r 20
13
significance may be due to the fact that there is only limited variation inlegal origins and that the correlation between the instrumental variablesand public spending is not sufficiently strong.
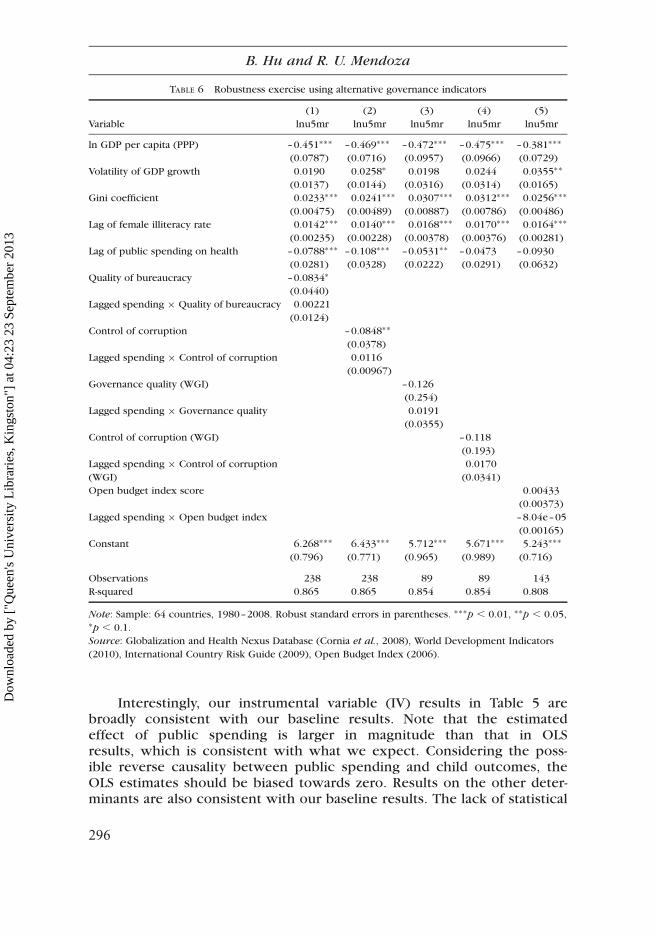
As a robustness exercise, we have repeated the empirical exercise using abroad set of alternative governance indicators. Results appear in Table 6. Wefind that income per capita, inequality, and female education are robust deter-minants of child mortality rates. Public spending on healthcare also seems tohave a significant impact across most of our specifications. Governance alsomatters according to our results using International Country Risk Guide gov-ernance indicators of bureaucracy quality and control of corruption. Themeasurement of governance using World Governance Indicators and theOpen Budget Index seem to be less precise as the results show that govern-ance only has an insignificant impact on the outcomes.
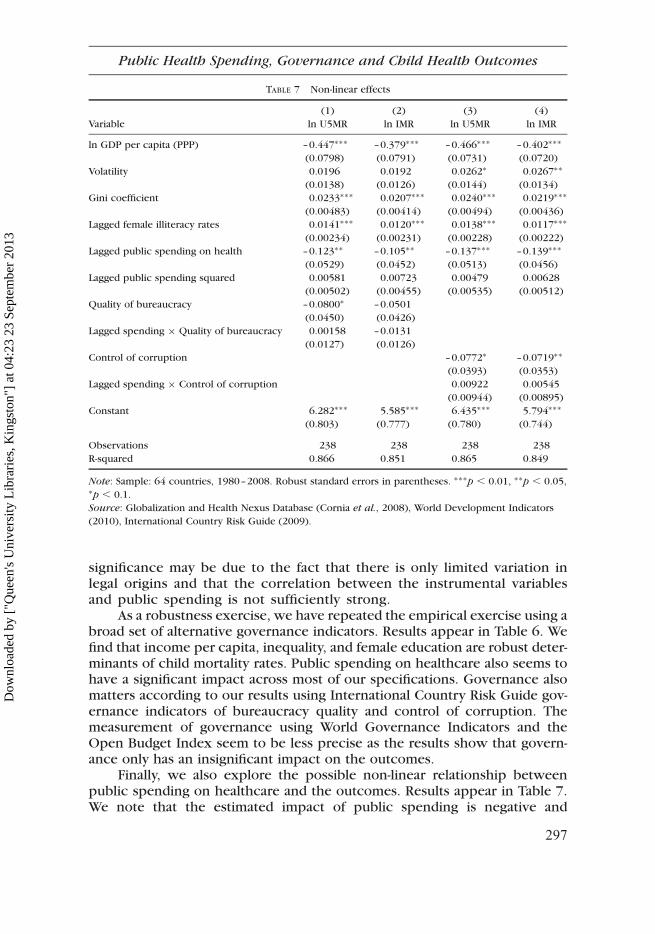
Finally, we also explore the possible non-linear relationship betweenpublic spending on healthcare and the outcomes. Results appear in Table 7.We note that the estimated impact of public spending is negative and
TABLE 7 Non-linear effects
(1) (2) (3) (4)
Variable ln U5MR ln IMR ln U5MR ln IMR
ln GDP per capita (PPP) –0.447∗∗∗ –0.379∗∗∗ –0.466∗∗∗ –0.402∗∗∗
(0.0798) (0.0791) (0.0731) (0.0720)
Volatility 0.0196 0.0192 0.0262∗ 0.0267∗∗
(0.0138) (0.0126) (0.0144) (0.0134)
Gini coefficient 0.0233∗∗∗ 0.0207∗∗∗ 0.0240∗∗∗ 0.0219∗∗∗
(0.00483) (0.00414) (0.00494) (0.00436)
Lagged female illiteracy rates 0.0141∗∗∗ 0.0120∗∗∗ 0.0138∗∗∗ 0.0117∗∗∗
(0.00234) (0.00231) (0.00228) (0.00222)
Lagged public spending on health –0.123∗∗ –0.105∗∗ –0.137∗∗∗ –0.139∗∗∗
(0.0529) (0.0452) (0.0513) (0.0456)
Lagged public spending squared 0.00581 0.00723 0.00479 0.00628
(0.00502) (0.00455) (0.00535) (0.00512)
Quality of bureaucracy –0.0800∗ –0.0501
(0.0450) (0.0426)
Lagged spending × Quality of bureaucracy 0.00158 –0.0131
(0.0127) (0.0126)
Control of corruption –0.0772∗ –0.0719∗∗
(0.0393) (0.0353)
Lagged spending × Control of corruption 0.00922 0.00545
(0.00944) (0.00895)
Constant 6.282∗∗∗ 5.585∗∗∗ 6.435∗∗∗ 5.794∗∗∗
(0.803) (0.777) (0.780) (0.744)
Observations 238 238 238 238
R-squared 0.866 0.851 0.865 0.849
Note: Sample: 64 countries, 1980–2008. Robust standard errors in parentheses. ∗∗∗p , 0.01, ∗∗p , 0.05,∗p , 0.1.
Source: Globalization and Health Nexus Database (Cornia et al., 2008), World Development Indicators
(2010), International Country Risk Guide (2009).
297
Public Health Spending, Governance and Child Health Outcomes
Dow
nloa
ded
by [
"Que
en's
Uni
vers
ity L
ibra
ries
, Kin
gsto
n"]
at 0
4:23
23
Sept
embe
r 20
13
significant whereas the estimated effect of the square of public spending ispositive. We conjecture that a non-linear relationship may exist such thatthe slope of the impact of public spending may gradually diminish as the gov-ernment spends more public resources. In that case, there may be an optimallevel of public spending on healthcare.
Conclusion
This paper examines the empirical determinants of child health, by revisitingthe links across public spending, governance and child mortality rates. We usecomprehensive data on public spending and child health, and various indi-cators of governance. Our main contribution to the empirical literature liesin our use of various indicators of governance, such as the Open BudgetIndex data that are used as a proxy for budget transparency, and the use ofplausible instruments to address the endogeneity of public spending onhealthcare. Using a variety of specifications, the empirical analysis in thispaper yields broadly consistent results on public spending and the quality
TABLE 8 V results using democracy indicator
(1) (2) (3) (4)
Variable Ln U5MR Ln IMR Ln U5MR Ln IMR
Ln GDP per capita (PPP) –0.420∗∗∗ –0.347∗∗∗ –0.489∗∗ –0.434∗
(0.0842) (0.0868) (0.201) (0.231)
Volatility 0.0163 0.0151 0.0341 0.0365
(0.0157) (0.0143) (0.0384) (0.0450)
Gini coefficient 0.0236∗∗ 0.0205∗ 0.0143 0.00939
(0.0118) (0.0109) (0.0265) (0.0288)
Lagged female illiteracy rate 0.0127∗∗∗ 0.0103∗∗∗ 0.0145∗∗ 0.0124∗
(0.00386) (0.00383) (0.00670) (0.00747)
Lagged public spending on health –0.165 –0.141 0.674 0.895
(0.585) (0.582) (2.303) (2.590)
Lagged spending × Quality of bureaucracy 0.0103 –0.00867
(0.208) (0.202)
Quality of bureaucracy –0.108 –0.0676
(0.423) (0.404)
Lagged spending × Control of corruption –0.224 –0.291
(0.618) (0.693)
Control of corruption 0.456 0.608
(1.341) (1.511)
Constant 6.247∗∗∗ 5.545∗∗∗ 5.377∗∗ 4.474
(0.967) (0.930) (2.530) (2.834)
Observations 227 227 227 227
R-squared 0.852 0.826 0.585 0.279
Note: Sample: 64 countries, 1980–2008. Robust standard errors in parentheses. ∗∗∗p , 0.01, ∗∗p , 0.05,∗p , 0.1.
Source: Globalization and Health Nexus Database (Cornia et al., 2008), World Development Indicators
(2010), International Country Risk Guide (2009).
298
B. Hu and R. U. Mendoza
Dow
nloa
ded
by [
"Que
en's
Uni
vers
ity L
ibra
ries
, Kin
gsto
n"]
at 0
4:23
23
Sept
embe
r 20
13
of governance, which imply that both the level of public social spending andthe quality of governance matter for child health outcomes. However, weobtain counterintuitive results on the interaction between the two. This inturn raises some questions about how precise the measures of the spendingand governance are.
It is worth noting that previous studies have either ignored the endogene-ity issues (for example, Rajkumar and Swaroop [2008] using the percentage ofpopulation under the age of five as an explanatory variable for child mortality,and the other problematic variables such as the Muslim religion indicator as adeterminant without justification) or relied on a small cross-section of obser-vations (for example, Filmer and Pritchett 1999). We suggest that futureresearch try to more directly address the links across public spending, govern-ance and child health using alternative data and approaches. We see threepromising areas for further work.
First, we recognize the limitations of broad governance indicators. Itis possible to improve on measures of governance, by focusing on specificaspects of the governance. For instance, in the context of the presentanalysis, governance indicators related to better public finance manage-ment might provide the most direct link between public spending andhealth outcomes. In addition, it might help to examine the same questionsaddressed in this paper, using sub-national indicators of governance. In agrowing number of countries, public service delivery has become highlydecentralized, emphasizing the role of local government units. It is poss-ible that the link between public spending and health is broken at pointsalong the health production chain that are more related to local govern-ment public finance. Indeed, we are trying to extend the present studyin this direction. Finally, it would be ideal to use household survey datato address the questions in this paper in a complementary way. One poss-ible approach, for example, is to try and evaluate the impact of interven-tions that create space for public debate of government spending. Forinstance, it helps to look into the impact of social accountability andcitizen participation in cases of sharp increases in the budgets of demo-cratic village governments on the quality of public goods. It would alsobe interesting to see whether more citizen participation leads to strongerhuman development and child health outcomes. Such micro-level empiri-cal analysis of effects of governance could complement studies based onaggregate indicators.
Acknowledgements
The views expressed in this paper are the authors’ and do not necessarily reflectthose of their respective organizational affiliations. This study was initiatedwhile both authors were staff members of the United Nations Children’sFund. Questions and comments on this draft could be directed to RonaldU. Mendoza ([email protected]) and Bingjie Hu ([email protected]).
299
Public Health Spending, Governance and Child Health Outcomes
Dow
nloa
ded
by [
"Que
en's
Uni
vers
ity L
ibra
ries
, Kin
gsto
n"]
at 0
4:23
23
Sept
embe
r 20
13
References
Ablo, E. and Reinikka, R. (1998) ‘Do budgets really matter? Evidence from public spending oneducation and health in Uganda’, Working Paper, World Bank, Washington, DC, [http://elibrary.worldbank.org/content/workingpaper/10.1596/1813-9450-1926]
Acemoglu, D. and Johnson, S. (2003) ‘Unbundling institutions’, No. w9934, National Bureau ofEconomic Research, Cambridge, MA.
Agha, S. (2000) ‘The determinants of infant mortality in Pakistan’, Social Science & Medicine,51(2), pp. 199–208.
Anyanwu, J. and Erhijakpor, A. (2007) ‘Health expenditures and health outcomes in Africa’,Mimeo, African Development Bank, [http://www.afdb.org/fileadmin/uploads/afdb/].
Barro, R. J. and Jong-Wha Lee (2000) ‘International data on educational attainment updates andimplications’, No. w7911, National Bureau of Economic Research, Cambridge, MA.
Basu, A. M. and Stephenson, R. (2005) ‘Low levels of maternal education and the proximatedeterminants of childhood mortality: A little learning is not a dangerous thing’, Social
Science & Medicine, 60(9), pp. 2011–2023.Boyle, M. H., Racine, Y., Georgiades, K., Hong, S., Snelling, D. et al. (2006) ‘The influence of
economic development level, household wealth and maternal education on child health inthe developing world’, Social Science and Medicine, 63, pp. 2242–2254.
Caldwell, J. C. (1979) ‘Education as a factor in mortality decline: An examination of Nigeriandata’, Population Studies, 33(3), pp. 395–413.
Caldwell, J. C. (1994) ‘How is greater maternal education translated into lower child mortality?’,Health Transition Review, 4(2), pp. 224–229.
Caldwell, J. and McDonald, P. (1982) ‘Influence of maternal education on infant and child-mortality – Levels and causes’, Health Policy and Education, 2(3–4), pp. 251–267.
Careja, R. and Emmenegger, P. (2009) ‘The politics of public spending in post-Communistcountries’, East European Politics and Societies, 23(2), pp. 165–184.
Chen, J. (2008) ‘Democratization and government education provision in East Asia’, Journal of
East Asian Studies, 8(2), pp. 175–209.Cornia, G. A., Rosignoli, S. and Tiberti, L. (2008) ‘Globalization and health: pathways of trans-
mission and evidence of impact’, Globalization Knowledge Network Papers, Institute ofPopulation Health, University of Ottawa, [http://www.globalhealthequity.ca/electronic%20library/Globalisation%20and%20Health%20Pathways%20of%20Tranmission%20and%20Evidence%20of%20Impact.pdf].
Deles, P., Mendoza, R. and Vergara, G. (2010) ‘Social budgeting initiatives and innovations:Insights using a public finance lens’, Working Paper, Fordham University [http://www.fordham.edu/images/academics/programs/iped/innovations%20in%20social%20budgeting%208.16.2010.pdf].
Duflo, E. (2000) ‘Child health and household resources in South Africa: Evidence from the OldAge Pension Program’, American Economic Review, 90(2), pp. 393–398.
Ferreira, F. H. G. and Schady, N. (2009) ‘Aggregate economic shocks, child schooling, and childhealth’, World Bank Research Observer, 24(2), pp. 147–181.
Filmer, D. and Pritchett, L. (1999) ‘The impact of public spending on health: Does moneymatter?’, Social Science and Medicine, 49(1999), pp. 1309–1323.
Filmer, D., Hammer, J. and Pritchett, L. (2000) ‘Weak links in the chain: A diagnosis of healthpolicy in poor countries’, World Bank Research Observer, 15(2), pp. 199–244.
Grindle, M. S. (2004) ‘Good enough governance: poverty reduction and reform in developingcountries’, Governance, 17(4), pp. 525–548.
Gupta, S., Davoodi, H. and Tiongson, E. (2002) ‘Corruption and the provision of health care andeducation services’, in G. Abed and S. Gupta (Eds), Governance, Corruption and Economic
Performance,IMF, Washington, DC pp. 19–58.Hall, R. E. and Jones, C. I. (1999) ‘Why do some countries produce so much more output per
worker than others?’, Quarterly Journal of Economics, 114(1), pp. 83–116.
300
B. Hu and R. U. Mendoza
Dow
nloa
ded
by [
"Que
en's
Uni
vers
ity L
ibra
ries
, Kin
gsto
n"]
at 0
4:23
23
Sept
embe
r 20
13
Handwerker, W. P. (1992) ‘West-Indian gender relations, family-planning programs and fertilitydecline’, Social Science & Medicine, 35(10), pp. 1245–1257.
Hojman, D. E. (1996) ‘Economic and other determinants of infant and child mortality in smalldeveloping countries: The case of Central America and the Caribbean’, Applied Economics,28(3), pp. 281–290.
International Budget Partnership (2008) Open Budget Index Data, [http://internationalbudget.org/what-we-do/open-budget-survey/].
Kaufmann, D., Kraay, A. and Mastruzzi, M. (2004) ‘Governance matters III: Governance indi-cators for 1996, 1998, 2000, and 2002’, World Bank Economic Review, 18(2), pp. 253–287, doi:10.1093/wber/lhh041.
Kaufmann, D., Kraay, A. and Mastruzzi, M. (2009) ‘Governance matters VIII: Aggregate and indi-vidual governance indicators, 1996–2008’, Policy Research Working Paper No. 4978, WorldBank, [http://ssrn.com/abstract=1424591].
La Porta, R., Lopez-de-Silanes, F., Shleifer, A. and Vishny, R. (1999) ‘The quality of government’,Journal of Law, Economics, and Organization, 15(1), pp. 222–279.
McCrary, J. and Royer, H. (2011) ‘The effects of female education on fertility and infant health:Evidence from school entry policies using exact date of birth’, American Economic Review,101, pp. 158–195.
Political Risk Group (2008) International Country Risk Guide Dataset [http://www.prsgroup.com/icrg.aspx].
Political Risk Group (2009) International Country Risk Guide Dataset [http://www.prsgroup.com/icrg.aspx].
Mosley, W. H. and Chen, L. C. (1984) ‘An analytical framework for the study of child survival indeveloping countries’, Population and Development Review, 10, pp. 25–45.
Pritchett, L. and Summers, L. (1996) ‘Wealthier is healthier’, Journal of Human Resources,31(4), pp. 841–868.
Rajkumar, A. S. and Swaroop, V. (2008) ‘Public spending and outcomes: Does governancematter?’, Journal of Development Economics, 86(2008), pp. 96–111.
Rodrik, D. (2005) ‘Why we learn nothing from regressing economic growth on policies’,Mimeo, Harvard University, Boston, MA, [http://www.hks.harvard.edu/fs/drodrik/Research%20papers/policy%20regressions.pdf] accessed 5 March 2013.
Shah, A. (Ed.) (2007) Budgeting and Budgetary Institutions, World Bank, Washington, DC.Stasavage, D. (2005) ‘Democracy and education spending in Africa’, American Journal of Pol-
itical Science, 49(2), pp. 343–358.UNICEF (2006) Child Mortality Rate Dataset, [http://www.childmortality.org/].World Bank (2006) World Development Indicators Dataset [http://data.worldbank.org/data-
catalog/world-development-indicators].World Bank (2010) World Development Indicators Dataset [http://data.worldbank.org/data-
catalog/world-development-indicators].
301
Public Health Spending, Governance and Child Health Outcomes
Dow
nloa
ded
by [
"Que
en's
Uni
vers
ity L
ibra
ries
, Kin
gsto
n"]
at 0
4:23
23
Sept
embe
r 20
13
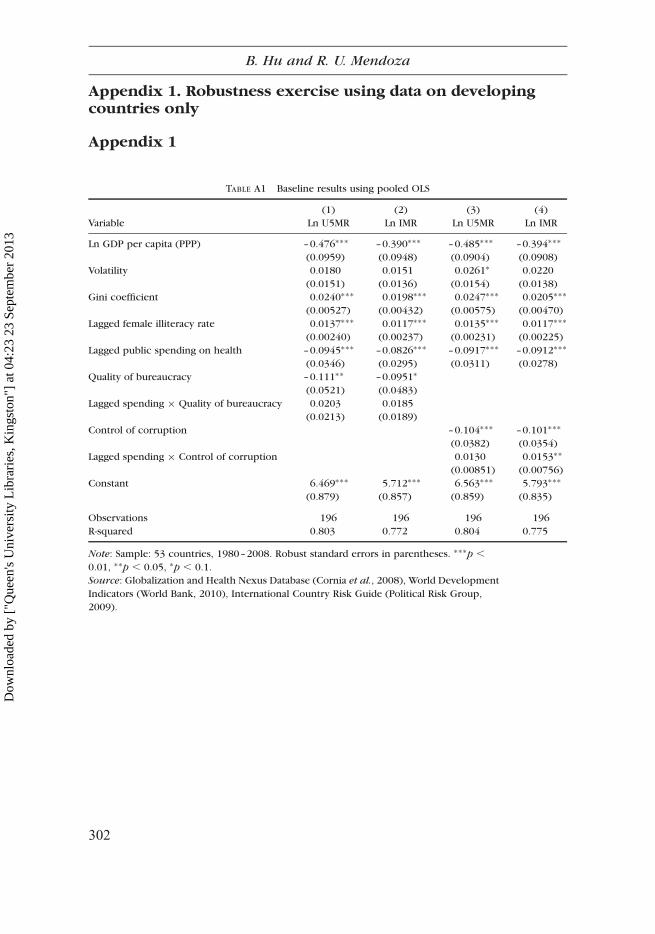
Appendix 1. Robustness exercise using data on developingcountries only
TABLE A1 Baseline results using pooled OLS
(1) (2) (3) (4)
Variable Ln U5MR Ln IMR Ln U5MR Ln IMR
Ln GDP per capita (PPP) –0.476∗∗∗ –0.390∗∗∗ –0.485∗∗∗ –0.394∗∗∗
(0.0959) (0.0948) (0.0904) (0.0908)
Volatility 0.0180 0.0151 0.0261∗ 0.0220
(0.0151) (0.0136) (0.0154) (0.0138)
Gini coefficient 0.0240∗∗∗ 0.0198∗∗∗ 0.0247∗∗∗ 0.0205∗∗∗
(0.00527) (0.00432) (0.00575) (0.00470)
Lagged female illiteracy rate 0.0137∗∗∗ 0.0117∗∗∗ 0.0135∗∗∗ 0.0117∗∗∗
(0.00240) (0.00237) (0.00231) (0.00225)
Lagged public spending on health –0.0945∗∗∗ –0.0826∗∗∗ –0.0917∗∗∗ –0.0912∗∗∗
(0.0346) (0.0295) (0.0311) (0.0278)
Quality of bureaucracy –0.111∗∗ –0.0951∗
(0.0521) (0.0483)
Lagged spending × Quality of bureaucracy 0.0203 0.0185
(0.0213) (0.0189)
Control of corruption –0.104∗∗∗ –0.101∗∗∗
(0.0382) (0.0354)
Lagged spending × Control of corruption 0.0130 0.0153∗∗
(0.00851) (0.00756)
Constant 6.469∗∗∗ 5.712∗∗∗ 6.563∗∗∗ 5.793∗∗∗
(0.879) (0.857) (0.859) (0.835)
Observations 196 196 196 196
R-squared 0.803 0.772 0.804 0.775
Note: Sample: 53 countries, 1980–2008. Robust standard errors in parentheses. ∗∗∗p ,
0.01, ∗∗p , 0.05, ∗p , 0.1.
Source: Globalization and Health Nexus Database (Cornia et al., 2008), World Development
Indicators (World Bank, 2010), International Country Risk Guide (Political Risk Group,
2009).
Appendix 1
302
B. Hu and R. U. Mendoza
Dow
nloa
ded
by [
"Que
en's
Uni
vers
ity L
ibra
ries
, Kin
gsto
n"]
at 0
4:23
23
Sept
embe
r 20
13
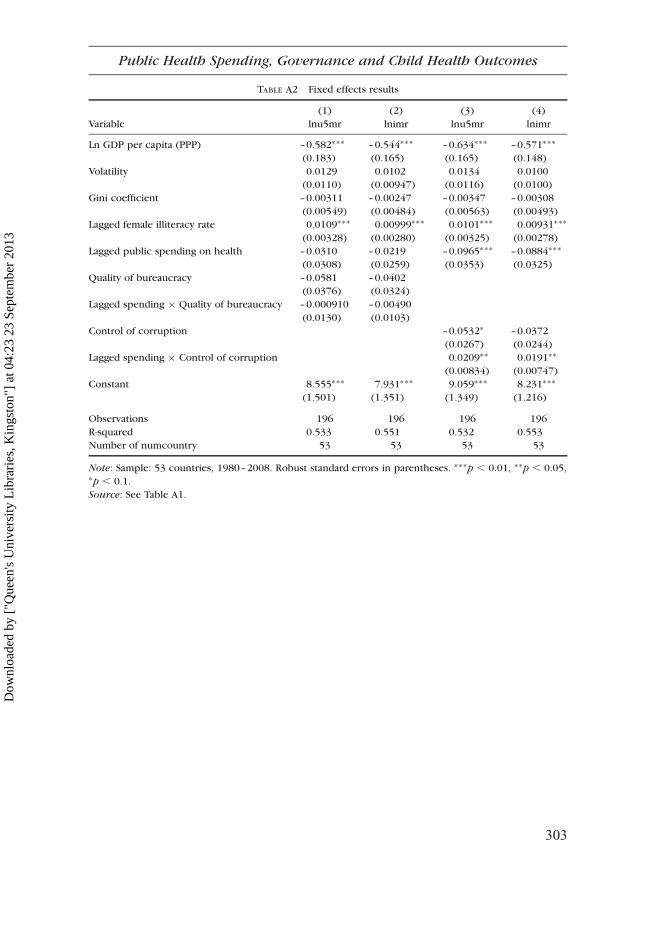
TABLE A2 Fixed effects results
(1) (2) (3) (4)
Variable lnu5mr lnimr lnu5mr lnimr
Ln GDP per capita (PPP) –0.582∗∗∗ –0.544∗∗∗ –0.634∗∗∗ –0.571∗∗∗
(0.183) (0.165) (0.165) (0.148)
Volatility 0.0129 0.0102 0.0134 0.0100
(0.0110) (0.00947) (0.0116) (0.0100)
Gini coefficient –0.00311 –0.00247 –0.00347 –0.00308
(0.00549) (0.00484) (0.00563) (0.00493)
Lagged female illiteracy rate 0.0109∗∗∗ 0.00999∗∗∗ 0.0101∗∗∗ 0.00931∗∗∗
(0.00328) (0.00280) (0.00325) (0.00278)
Lagged public spending on health –0.0310 –0.0219 –0.0965∗∗∗ –0.0884∗∗∗
(0.0308) (0.0259) (0.0353) (0.0325)
Quality of bureaucracy –0.0581 –0.0402
(0.0376) (0.0324)
Lagged spending × Quality of bureaucracy –0.000910 –0.00490
(0.0130) (0.0103)
Control of corruption –0.0532∗ –0.0372
(0.0267) (0.0244)
Lagged spending × Control of corruption 0.0209∗∗ 0.0191∗∗
(0.00834) (0.00747)
Constant 8.555∗∗∗ 7.931∗∗∗ 9.059∗∗∗ 8.231∗∗∗
(1.501) (1.351) (1.349) (1.216)
Observations 196 196 196 196
R-squared 0.533 0.551 0.532 0.553
Number of numcountry 53 53 53 53
Note: Sample: 53 countries, 1980–2008. Robust standard errors in parentheses. ∗∗∗p , 0.01, ∗∗p , 0.05,∗p , 0.1.
Source: See Table A1.
303
Public Health Spending, Governance and Child Health Outcomes
Dow
nloa
ded
by [
"Que
en's
Uni
vers
ity L
ibra
ries
, Kin
gsto
n"]
at 0
4:23
23
Sept
embe
r 20
13
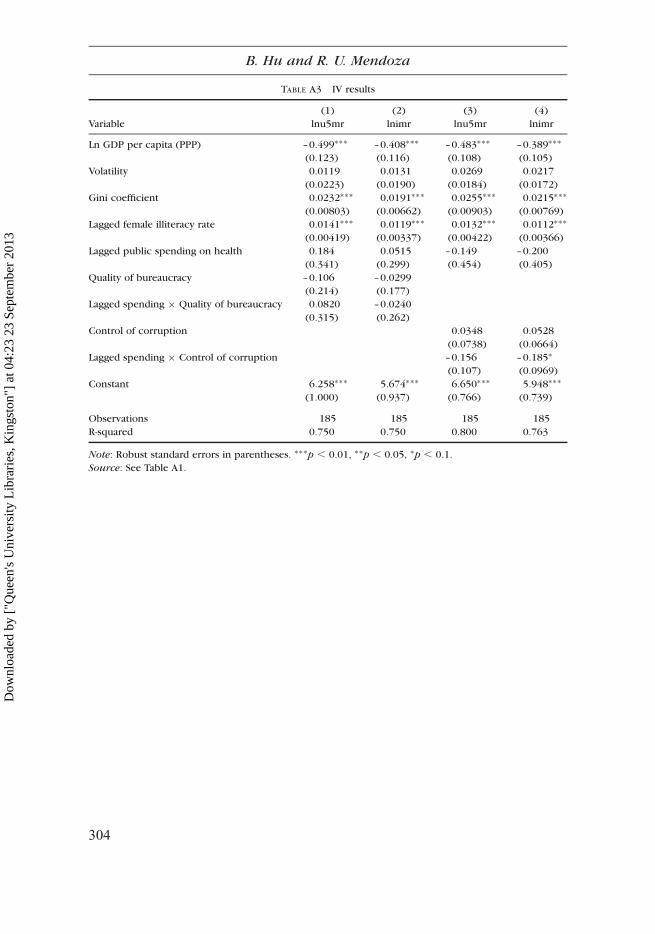
TABLE A3 IV results
(1) (2) (3) (4)
Variable lnu5mr lnimr lnu5mr lnimr
Ln GDP per capita (PPP) –0.499∗∗∗ –0.408∗∗∗ –0.483∗∗∗ –0.389∗∗∗
(0.123) (0.116) (0.108) (0.105)
Volatility 0.0119 0.0131 0.0269 0.0217
(0.0223) (0.0190) (0.0184) (0.0172)
Gini coefficient 0.0232∗∗∗ 0.0191∗∗∗ 0.0255∗∗∗ 0.0215∗∗∗
(0.00803) (0.00662) (0.00903) (0.00769)
Lagged female illiteracy rate 0.0141∗∗∗ 0.0119∗∗∗ 0.0132∗∗∗ 0.0112∗∗∗
(0.00419) (0.00337) (0.00422) (0.00366)
Lagged public spending on health 0.184 0.0515 –0.149 –0.200
(0.341) (0.299) (0.454) (0.405)
Quality of bureaucracy –0.106 –0.0299
(0.214) (0.177)
Lagged spending × Quality of bureaucracy 0.0820 –0.0240
(0.315) (0.262)
Control of corruption 0.0348 0.0528
(0.0738) (0.0664)
Lagged spending × Control of corruption –0.156 –0.185∗
(0.107) (0.0969)
Constant 6.258∗∗∗ 5.674∗∗∗ 6.650∗∗∗ 5.948∗∗∗
(1.000) (0.937) (0.766) (0.739)
Observations 185 185 185 185
R-squared 0.750 0.750 0.800 0.763
Note: Robust standard errors in parentheses. ∗∗∗p , 0.01, ∗∗p , 0.05, ∗p , 0.1.
Source: See Table A1.
304
B. Hu and R. U. Mendoza
Dow
nloa
ded
by [
"Que
en's
Uni
vers
ity L
ibra
ries
, Kin
gsto
n"]
at 0
4:23
23
Sept
embe
r 20
13
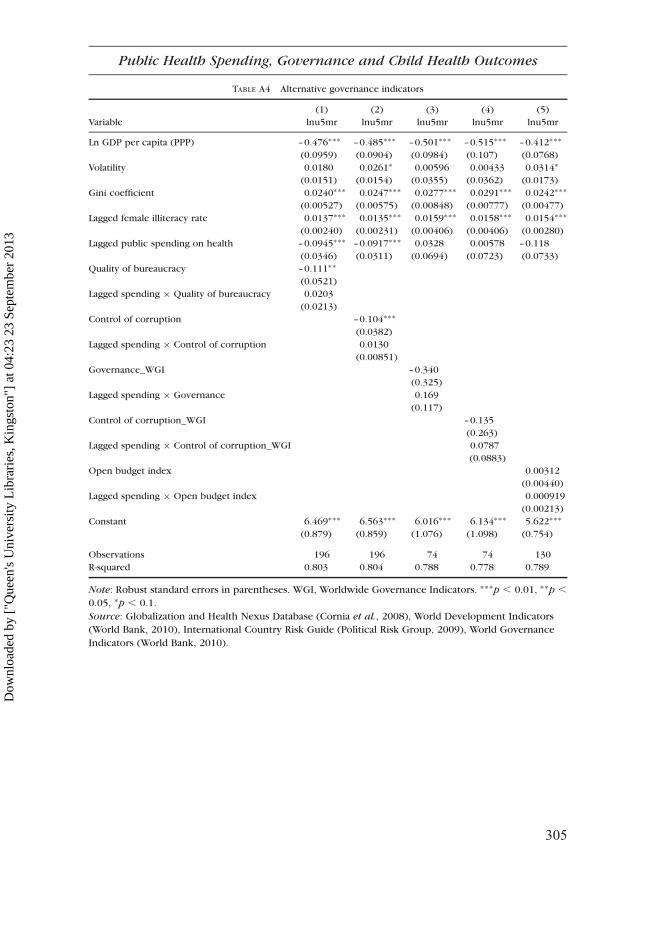
TABLE A4 Alternative governance indicators
(1) (2) (3) (4) (5)
Variable lnu5mr lnu5mr lnu5mr lnu5mr lnu5mr
Ln GDP per capita (PPP) –0.476∗∗∗ –0.485∗∗∗ –0.501∗∗∗ –0.515∗∗∗ –0.412∗∗∗
(0.0959) (0.0904) (0.0984) (0.107) (0.0768)
Volatility 0.0180 0.0261∗ 0.00596 0.00433 0.0314∗
(0.0151) (0.0154) (0.0355) (0.0362) (0.0173)
Gini coefficient 0.0240∗∗∗ 0.0247∗∗∗ 0.0277∗∗∗ 0.0291∗∗∗ 0.0242∗∗∗
(0.00527) (0.00575) (0.00848) (0.00777) (0.00477)
Lagged female illiteracy rate 0.0137∗∗∗ 0.0135∗∗∗ 0.0159∗∗∗ 0.0158∗∗∗ 0.0154∗∗∗
(0.00240) (0.00231) (0.00406) (0.00406) (0.00280)
Lagged public spending on health –0.0945∗∗∗ –0.0917∗∗∗ 0.0328 0.00578 –0.118
(0.0346) (0.0311) (0.0694) (0.0723) (0.0733)
Quality of bureaucracy –0.111∗∗
(0.0521)
Lagged spending × Quality of bureaucracy 0.0203
(0.0213)
Control of corruption –0.104∗∗∗
(0.0382)
Lagged spending × Control of corruption 0.0130
(0.00851)
Governance_WGI –0.340
(0.325)
Lagged spending × Governance 0.169
(0.117)
Control of corruption_WGI –0.135
(0.263)
Lagged spending × Control of corruption_WGI 0.0787
(0.0883)
Open budget index 0.00312
(0.00440)
Lagged spending × Open budget index 0.000919
(0.00213)
Constant 6.469∗∗∗ 6.563∗∗∗ 6.016∗∗∗ 6.134∗∗∗ 5.622∗∗∗
(0.879) (0.859) (1.076) (1.098) (0.754)
Observations 196 196 74 74 130
R-squared 0.803 0.804 0.788 0.778 0.789
Note: Robust standard errors in parentheses. WGI, Worldwide Governance Indicators. ∗∗∗p , 0.01, ∗∗p ,
0.05, ∗p , 0.1.
Source: Globalization and Health Nexus Database (Cornia et al., 2008), World Development Indicators
(World Bank, 2010), International Country Risk Guide (Political Risk Group, 2009), World Governance
Indicators (World Bank, 2010).
305
Public Health Spending, Governance and Child Health Outcomes
Dow
nloa
ded
by [
"Que
en's
Uni
vers
ity L
ibra
ries
, Kin
gsto
n"]
at 0
4:23
23
Sept
embe
r 20
13
Appendix 2. Data
Appendix 2
Globalization–Health Nexus DatabaseThe Globalization–Health Nexus Database (GHND) dataset provides compre-hensive statistical information required for the analysis of the relationshipsamong country characteristics, globalization and health. It provides infor-mation on variables that measure health status, social and economic factorsthat may affect health outcomes as well as country characteristics that maybe associated with health status. The GHND dataset covers 136 countries,which are representative of various geographical regions around the world.The time span covered by the original GHND data consists of five-yearperiods from 1960 to 2005. The five years of data are computed by takingthe five-year arithmetic mean of the variable centered round the mid-decadeor end-decade years. Details on the calculation method are described in thedocumentation for the GHND dataset.
Owing to data limitations, our main analysis is based on a subset of thisdataset, including observations on 53 countries that cover the period from1990 to 2000. Among these countries, 32.1% are high-income countries,37.7% are middle-income countries, 22.6% are low-income countries, andthe remaining 7.6% are transition countries. This subsample contains fullinformation on the following variables, which are relevant for our cross-country study of the empirical determinants of health outcomes.
. Under-five mortality rate (per 1000 live births). The under-five mortalityrate is measured by the number of children who die before the age fiveper 1000 children. The data on this variable are provided by UNICEF(2006) and the coverage is complete for 1980, 1990, 1995, 2000 and2005. Note that missing values for year 1985 is interpolated by computingthe mean between the values of the preceding period (1980) and the follow-ing period (1990). Data on recent years are supplemented using WorldDevelopment Indicators (World Bank, 2010).
. Infant mortality rate (per 1000 live births). Infant mortality rate is thenumber of infants dying before reaching one year of age, per 1000 livebirths in a given year. The data, which are provided by UNICEF (2006),contain complete information for all years considered. Data on recentyears are supplemented using World Development Indicators (WorldBank, 2010).
. Normalized Gini coefficient. The original data on income inequality that arebased on different income, consumption or earnings concepts are normal-ized to ‘Gini coefficient of gross income per capita’ (Cornia et al., 2008).Data on this variable are supplemented by the World Development Indi-cators dataset (World Bank, 2010).
306
B. Hu and R. U. Mendoza
Dow
nloa
ded
by [
"Que
en's
Uni
vers
ity L
ibra
ries
, Kin
gsto
n"]
at 0
4:23
23
Sept
embe
r 20
13
. GDP per capita. GDP per capita is the sum of gross value added by all resi-dent producers in the economy plus any product taxes and minus any sub-sidies not included on the value of the products. It is calculated withoutdeducting depreciation of fabricated assets for depletion and degradationof natural resources. Data on GDP per capita are from the World Develop-ment Indicators (World Bank, 2006). We have also used supplementarydata on real GDP per capita using the latest World Development Indicators(World Bank, 2010).
. Volatility of economic growth. The volatility of economic growth ismeasured by the five-year inter-temporal mobile standard deviation of theannual growth rate of GDP per capita at constant international prices.Details on the calculation are available in the documentation for theGHND database.
. Public expenditure on health. This variable is measured by the amount ofpublic expenditure on health as a share of GDP. Information on publicexpenditure on health is obtained from various data sources including theOECD Health Database for OECD countries, the TransMonee database2006 for Central and Eastern European countries, and World DevelopmentIndicators 2006 for remaining countries.
. Female illiteracy. Female education status is measured by the percentage ofilliterate females aged 25 and above (Barro and Lee, 2000).
International Country Risk Guide variablesThe International Country Risk Guide rating is based upon three categories ofrisk: political, financial and economic. A separate index is constructed foreach of the three categories. For purposes of our analysis, we focus onthe first risk group, political risks. In the construction of the politicalrisk rating, 12 variables covering both political and social characteristicsare measured. We use four of these variables—namely, government stability,corruption, democratic accountability and bureaucracy quality—in ourempirical analysis of the impact of governance and public spending onsocial outcomes:
. Government stability. The highest possible rating on government stability is12 points. This is a measure of the ability of a government to carry out itsdeclared programs and its ability to stay in office. The risk rating is thesum of three subcomponent scores, each with a maximum score of fourpoints and a minimum score of zero points. A higher score representslower risks. The three subcomponents for the rating of government stabilityare government unity, legislative strength and popular support.
. Corruption. The corruption variable could take a value that ranges fromzero to six, with six representing the best control of corruption and zerostanding for the worst rating. This variable is a measure of corruptionwithin the political system. The International Country Risk Guide
307
Public Health Spending, Governance and Child Health Outcomes
Dow
nloa
ded
by [
"Que
en's
Uni
vers
ity L
ibra
ries
, Kin
gsto
n"]
at 0
4:23
23
Sept
embe
r 20
13
measure of corruption takes into account not only financial corruption inthe form of special payments and bribes related to trade licenses, exchangecontrols, tax assessment, police protection or loans, but more focused onthe type of corruption in the form of excessive patronage, nepotism, jobreservations, secret party funding and suspiciously close ties between poli-tics and business. A higher score for this variable stands for lower risks andbetter control of corruption in the political system.
. Democratic accountability. The possible value of this variable ranges fromzero to six with six indicating the best democratic accountability and themost responsive the government is to its people. This variable measuresthe extent to which the government responds to its citizens, based on theassumption that the less responsive it is, the more likely it is for the govern-ment to fail. The scores are assigned on the basis of the type of governanceadopted by the country. The types of governance that are used to define thisvariable include alternating democracy, dominated democracy, de facto one-party state and de jure one-party state and autarchy.
. Bureaucracy quality. The range of this variable is from zero to four. Ahigher value of this variable is assigned to countries where the bureaucracyhas better capabilities to govern without abrupt changes in policy or inter-ruption in government services. The institutional strength and quality of thebureaucracy is an important determinant of risks and may minimize revi-sions of policy when governments change. Higher bureaucracy quality islikely to be associated with more efficient management and allocation ofresources and more effective delivery of public services.
Worldwide Governance IndicatorsThe Worldwide Governance Indicators measure six dimensions of govern-ance: voice and accountability, political stability and absence of violence orterrorism, government effectiveness, regulatory quality, rule of law and cor-ruption. Covering 212 countries and territories for 1996, 1998 and 2000,and annually from 2002 through 2008, the indicators are based on severalhundred individual variables measuring perceptions of governance, drawnfrom different data sources from around the world. These individual measuresare assigned to categories that capture the six dimensions of governance andare used to construct six aggregate governance indicators with an unobservedcomponents model.
The Worldwide Governance Indicators are based on subjective orperception-based data on governance reflecting the views of various informedstakeholders. Kaufmann et al. (2009) show that there are several reasons forusing subjective data to measure governance. First, perceptions are importantbecause agents base their decisions on their perceptions and views. Second,in many areas of governance, there are few alternatives available to measuregovernance. When objective or fact-based data are available, they oftencapture a de jure notion of laws that differs from the de facto reality. The
308
B. Hu and R. U. Mendoza
Dow
nloa
ded
by [
"Que
en's
Uni
vers
ity L
ibra
ries
, Kin
gsto
n"]
at 0
4:23
23
Sept
embe
r 20
13
authors further argue that almost all measures of governance and the invest-ment climate rely on judgment in some measure so that the distinctionbetween subjective and objective data may not be a valid dichotomy.
Governance is defined broadly as the traditions and institutions by whichauthority in a country is exercised (Kaufman et al., 2009). The six correspond-ing dimensions of governance are as follows:
. Voice and accountability: perceptions of the extent to which citizens areable to participate in selecting their government, as well as freedom ofexpression, freedom of association and free media.
. Political stability and absence of violence: perceptions of the likelihoodthat the government will be destabilized or overthrown by violent means.
. Government effectiveness: perceptions of the quality of public services, thequality of the civil service and the degree of its independence from politicalpressures, the quality of policy formulation and implementation and thecredibility of the government’s commitment to such policies.
. Regulator quality: perceptions of the ability of the government to formulateand implement sound policies and regulations that permits and promotesprivate sector development.
. Rule of law: perceptions of the extent to which agents have confidence inand abide by the rules of society and the quality of contract enforcement,property rights, the police and the courts, as well as the likelihood ofcrime and violence.
. Control of corruption: perceptions of the extent to which public power isexercised for private gain.
The World Governance Indicators are constructed using 35 differentsources, which consist of surveys of individuals or domestic firms, expertassessments and commercial business information providers. These datasources are provided by 33 organizations, including international organiz-ations such as the African Development Bank, Asian Development Bank,European Bank for Reconstruction and Development and private businessinformation providers such as Political Risk Services and the Economist Intel-ligence Unit.
As for the method of aggregation, individual data sources are combined toconstruct the six aggregate governance indicators. The underlying statisticalapproach assumes that each of the individual data sources provides an imper-fect signal of some underlying perception of governance that is difficult toobserve directly. Thus our objective is to extract the informative signalabout governance from each individual data source and to optimallycombine different data sources to derive the best measurement of governancein a country. Kaufmann et al. (2004, 2009) adopt an unobserved componentsapproach and argue that the advantage of this method is that the aggregateindicators are more informative about the unobserved governance than anyindividual data source. The identifying assumption in the unobserved com-ponents approach is that any observed correlation between two measures
309
Public Health Spending, Governance and Child Health Outcomes
Dow
nloa
ded
by [
"Que
en's
Uni
vers
ity L
ibra
ries
, Kin
gsto
n"]
at 0
4:23
23
Sept
embe
r 20
13
of a governance variable is due to their common but unobserved signal of thatgovernance variable. By this assumption, data sources that are more corre-lated with each other are more informative about the underlying governancevariable. The authors rescale the individual indicators from each data sourceso that they are comparable across sources and then construct a weightedaverage of each rescaled data sources to build an aggregate indicator ofgovernance.
The authors emphasize the limitations of these measures of governance,which are shared by ‘all efforts to measure governance across countries andover time’. The margins of error are present in ‘any effort to measure govern-ance’ and are due to the difficulty in measuring such a complicated variable asgovernance. This paper also shows that more than one-half of all cross-countrycomparisons result in highly significant differences in one of the six dimen-sions of governance. It is shown that the likelihood of a comparisonbetween any given pair of countries being characterized by a significant differ-ence in governance is about 75%. In addition, the authors show that aboutone-third of countries have had significant changes in at least one dimensionof governance between 1998 and 2008.
The Open Budget IndexDeveloped by the International Budget Partnership, the Open Budget Initiat-ive (OBI) dataset provides measurements of public availability of budget infor-mation and other transparent and accountable budgeting practices in 85countries. The survey has 123 questions, of which 91 questions evaluatepublic access to budge information. The responses to these questions are aver-aged to form the open budge index. The remaining 32 questions are related toopportunities for public participation in the budget process and the ability ofkey oversight institutions of government to hold the executive accountable.
Most questions ask about what occurs in practice, not requirements thatexist in law. The OBI index is based on the 91 questions related to public avail-ability of information on the Open Budget Questionnaire. The score reflectsthe quantity of publicly available information in the eight key budget docu-ments; namely, pre-budget statement, executive’s budget proposal, enactedbudget, citizens’ budget, in-year reports, mid-year review, year-end reportand audit report. The public availability and comprehensiveness of the Execu-tive’s Budge Proposal is a key determinant of a country’s OBI score, as 58 outof the 91 questions concern the executive’s budge proposal.
Publicly available information about the budget documents is defined asthe information that can be obtained by any and all members of the publicthrough a request to the public authority issuing the documents. Thus itincludes two types of information, one of which is available through a well-defined procedure that ensures simultaneous release of public documentsto all interested parties. The other type of information is available only onrequest. The implicit assumption underlying this definition is that the
310
B. Hu and R. U. Mendoza
Dow
nloa
ded
by [
"Que
en's
Uni
vers
ity L
ibra
ries
, Kin
gsto
n"]
at 0
4:23
23
Sept
embe
r 20
13
performance on OBI of a given country is not affected by which method a gov-ernment chooses to disseminate documents.
Letter grade ‘a’ or ‘b’ is used to describe good practice regarding thesubject matter of the question. Grade ‘c’ or ‘d’ corresponds to poor practices.An ‘a’ response indicates that a standard is fully met. In order to aggregate theresponses, a numeric score of 100% is awarded for ‘a’, 67% for ‘b’, 33% for ‘c’and 0% for ‘d’. If the response is ‘e’ not applicable, then the question is notcounted as part of the aggregate. If only three options are given by the ques-tion, then ‘a’ is assigned 100%, ‘b’ is graded as 0%. Grade ‘c’ causes the ques-tion to be excluded in the aggregation.
A score of 81–100% indicates that the government provides extensiveinformation to citizens on the budget process. A score of 61–80% indicatesthat the government ‘provides significant information to citizens’, countryscores of 41–60% indicate that the government ‘provides some informationto citizens’ and scores of 21–40% percent indicate that the government ‘pro-vides minimal information to citizens’. Scores below 20% indicate that the gov-ernment ‘provides scant or no information to citizens’.
According the creators of the OBI, there is a worldwide transparency gapin the public financial management practices. Only five countries make exten-sive information publicly available. On average, countries surveyed provideminimal information on their central government’s budget and financial activi-ties. In most of the countries surveyed, legislatures have very limited capabili-ties to review the executive’s budget proposal and monitor theimplementation of the budgeting process. Likewise, the supreme audit insti-tutions do not have sufficient independence or ability to monitor the govern-ment expenditure.
Less transparent countries share similar characteristics such as geo-graphic locations, income level, dependency on foreign aids and weak demo-cratic institutions. In addition, the survey finds that the lack of transparencyundermines accountability and prevents participation by citizens.
The Open Budget Questionnaire is intended to offer an independent,non-governmental view of the state of budget transparency. All researchersare non-governmental organizations and share a common interest in promot-ing access to information during the budget process, strengthening the powerof the legislature, and in the performance of Supreme Audit Institution. TheInternational Budget Partnership staff conduct an analysis after the question-naires are completed and make an effort to ensure that the questions havebeen answered in a consistent manner. The feedbacks are also cross-checked with public information. Following this analysis and review the ques-tionnaire is submitted to two anonymous peer reviewers who are required tobe independent of both the government and the research organization. Peerreviewer feedbacks are examined by the International Budget Partnershipstaff so that the comments are consistent with the study’s methodology andhelp ensure the consistency of assumptions across countries in selectinganswers.
311
Public Health Spending, Governance and Child Health Outcomes
Dow
nloa
ded
by [
"Que
en's
Uni
vers
ity L
ibra
ries
, Kin
gsto
n"]
at 0
4:23
23
Sept
embe
r 20
13