Embed Size (px)
DESCRIPTION
Public Health Service Agencies
Citation preview
Public Health Service Agencies: Overview and
Funding (FY2010-FY2016)
C. Stephen Redhead, Coordinator
Specialist in Health Policy
Agata Dabrowska, Coordinator
Analyst in Health Policy
October 13, 2015
Congressional Research Service
7-5700
www.crs.gov
R43304

Public Health Service Agencies: Overview and Funding (FY2010-FY2016)
Congressional Research Service
Summary Within the Department of Health and Human Services (HHS), eight agencies are designated
components of the U.S. Public Health Service (PHS). The PHS agencies are funded primarily
with annual discretionary appropriations. They also receive significant amounts of funding from
other sources including mandatory funds from the Affordable Care Act (ACA), user fees, and
third-party reimbursements (collections).
The Agency for Healthcare Research and Quality (AHRQ) funds research on
improving the quality and delivery of health care. For several years prior to
FY2015, AHRQ did not receive a direct appropriation. Instead, it relied on
redistributed (“set-aside”) funds from other PHS agencies for most of its funding,
with supplemental amounts from the ACA’s Patient-Centered Outcomes Research
Trust Fund (PCORTF). In FY2015, AHRQ received its own appropriation in lieu
of set-aside funds. Overall, the agency’s total funding rose from $403 million to
$465 million between FY2010 and FY2015. That increase came despite a
decrease in discretionary funding over that period, which was more than offset by
increasing amounts of PCORTF funding.
The Centers for Disease Control and Prevention (CDC) is the federal
government’s lead public health agency. CDC obtains its funding from multiple
sources besides discretionary appropriations. The agency’s funding fluctuated
between FY2010 and FY2015, with the overall level increasing slightly from
$10.9 billion to $11.3 billion over that period. CDC experienced a drop in its
discretionary appropriations during that time, which was offset by funding from
other sources, primarily the ACA’s Prevention and Public Health Fund (PPHF).
The Agency for Toxic Substances and Disease Registry (ATSDR) investigates
the public health impact of exposure to hazardous substances. ATSDR is headed
by the CDC director and included in the discussion of CDC in this report.
The Food and Drug Administration (FDA) regulates drugs, medical devices,
food, and tobacco products, among other consumer products. FDA saw its
funding increase significantly between FY2010 and FY2015 from $3.1 billion to
$4.5 billion. The agency is funded with annual discretionary appropriations and
industry user fees. While appropriations increased modestly over the FY2010-
FY2015 period, user fees more than doubled and now account for 42% of FDA’s
total funding.
The Health Resources and Services Administration (HRSA) funds programs
and systems that provide health care services to the uninsured and medically
underserved. HRSA, like CDC, relies on funding from several different sources.
The agency’s funding increased from $8.1 billion in FY2010 to $10.3 billion in
FY2015 despite a significant drop in its discretionary appropriation during that
time. The growth in overall funding was driven largely by increasing amounts
from the ACA’s Community Health Center Fund (CHCF).
The Indian Health Service (IHS) supports a health care delivery system for
Native Americans. IHS’s funding, which includes discretionary appropriations
and collections from third-party payers of health care, increased between FY2010
and FY2015 from $5.1 billion to $5.9 billion. Appropriations and collections both
increased during that period.
The National Institutes of Health (NIH) funds basic, clinical, and translational
biomedical and behavioral research. NIH gets more than 99% of its funding from
Public Health Service Agencies: Overview and Funding (FY2010-FY2016)
Congressional Research Service
discretionary appropriations. Its funding dropped from $31.2 billion in FY2010
to $30.3 billion in FY2015.
The Substance Abuse and Mental Health Services Administration
(SAMHSA) funds mental health and substance abuse prevention and treatment
services. SAMHSA’s funding, about 95% of which comes from discretionary
appropriations, has remained at about $3.6 billion over the FY2010-FY2015
period.
Congress has yet to complete work on any of the regular appropriations bills for FY2016, which
began on October 1, 2015. On September 30, the President signed the Continuing Appropriations
Act, 2016 (P.L. 114-53). The measure provides continuing appropriations through December 11,
2016. It funds discretionary programs at the same rate (and under the same conditions) as in
FY2015, minus an across-the-board reduction of 0.2108%. For entitlement and other mandatory
spending that is funded through appropriation acts, P.L. 114-53 provides funding to maintain
program levels under current law. This report will be updated with information on PHS agency
funding for FY2016 once legislative action on appropriations for the new fiscal year is
completed.
Public Health Service Agencies: Overview and Funding (FY2010-FY2016)
Congressional Research Service
Contents
Introduction to the PHS Agencies ................................................................................................... 1
Sources of PHS Agency Funding .................................................................................................... 2
Transfers .................................................................................................................................... 2 PHS Program Evaluation Set-Aside .......................................................................................... 3 Mandatory Funding, User Fees, and Collections ...................................................................... 4
Mandatory Appropriations .................................................................................................. 5 User Fees ............................................................................................................................. 6 Collections .......................................................................................................................... 6
Recent Trends in PHS Agency Funding .......................................................................................... 6
Impact of Budget Caps and Sequestration ................................................................................ 7 Mandatory Spending ........................................................................................................... 7 Discretionary Spending ....................................................................................................... 8
Report Roadmap .............................................................................................................................. 9
Agency for Healthcare Research and Quality (AHRQ) ................................................................. 11
Agency Overview ..................................................................................................................... 11 Agency Funding Since FY2010 .............................................................................................. 12
Centers for Disease Control and Prevention (CDC) ...................................................................... 14
Agency Overview .................................................................................................................... 14 Agency Funding Since FY2010 .............................................................................................. 15
Food and Drug Administration (FDA) .......................................................................................... 19
Agency Overview .................................................................................................................... 19 Agency Funding Since FY2010 .............................................................................................. 20
Health Resources and Services Administration (HRSA) .............................................................. 24
Agency Overview .................................................................................................................... 24 Agency Funding Since FY2010 .............................................................................................. 25
Indian Health Service (IHS) .......................................................................................................... 30
Agency Overview .................................................................................................................... 30 Agency Funding Since FY2010 .............................................................................................. 30
National Institutes of Health (NIH) ............................................................................................... 33
Agency Overview .................................................................................................................... 33 Agency Funding Since FY2010 .............................................................................................. 34
Substance Abuse and Mental Health Services Administration (SAMHSA) ................................. 37
Agency Overview .................................................................................................................... 37 Agency Funding Since FY2010 .............................................................................................. 38
Tables
Table 1. PHS Evaluation Set-Aside Fund Assessments and Transfers in FY2013
and FY2015 .................................................................................................................................. 4
Table 2. Sequestration of Funding for PHS Agency Programs ....................................................... 8
Table 3. Agency for Healthcare Research and Quality (AHRQ) ................................................... 13

Public Health Service Agencies: Overview and Funding (FY2010-FY2016)
Congressional Research Service
Table 4. Centers for Disease Control and Prevention (CDC) and Agency for Toxic
Substances and Disease Registry (ATSDR) ............................................................................... 16
Table 5. Food and Drug Administration (FDA) ............................................................................ 21
Table 6. Health Resources and Services Administration (HRSA) ................................................. 26
Table 7. Indian Health Service (IHS) ............................................................................................ 31
Table 8. National Institutes of Health (NIH) ................................................................................. 35
Table 9. Substance Abuse and Mental Health Services Administration (SAMHSA) .................... 39
Table B-1. Community Health Center Fund, FY2011-FY2016 .................................................... 42
Table C-1. PPHF Transfers to HHS Agencies ............................................................................... 44
Table D-1. Distribution of PCORTF Funding ............................................................................... 45
Table E-1. FDA User Fee Authorizations and Revenue ................................................................ 46
Appendixes
Appendix A. American Recovery and Reinvestment Act (ARRA): FY2009 Supplemental
Appropriations ............................................................................................................................ 41
Appendix B. Community Health Center Fund .............................................................................. 42
Appendix C. Prevention and Public Health Fund (PPHF) ............................................................ 43
Appendix D. Patient-Centered Outcomes Research Trust Fund ................................................... 45
Appendix E. FDA User Fee Authorizations .................................................................................. 46
Contacts
Author Contact Information .......................................................................................................... 47
Acknowledgments ......................................................................................................................... 47
Key Policy Staff ............................................................................................................................ 47

Public Health Service Agencies: Overview and Funding (FY2010-FY2016)
Congressional Research Service 1
Introduction to the PHS Agencies The Department of Health and Human Services (HHS) has designated eight of its 11 operating
divisions (agencies) as components of the U.S. Public Health Service (PHS). The PHS agencies
are: (1) the Agency for Healthcare Research and Quality (AHRQ), (2) the Agency for Toxic
Substances and Disease Registry (ATSDR), (3) the Centers for Disease Control and Prevention
(CDC), (4) the Food and Drug Administration (FDA), (5) the Health Resources and Services
Administration (HRSA), (6) the Indian Health Service (IHS), (7) the National Institutes of Health
(NIH), and (8) the Substance Abuse and Mental Health Services Administration (SAMHSA).1
While the PHS agencies all provide and support essential public health services, their specific
missions vary. With the exception of FDA, the agencies have limited regulatory responsibilities.
Two of them—NIH and AHRQ—are primarily research agencies. NIH conducts and supports
basic, clinical, and translational medical research. AHRQ conducts and supports research on the
quality and effectiveness of health care services and systems.
Three of the agencies—IHS, HRSA, and SAMHSA—provide health care services or help support
systems that deliver such services. IHS supports a health care delivery system for American
Indians and Alaska Natives. Health services are provided directly by the IHS, as well as through
tribally contracted and operated health programs, and through services purchased from private
providers. HRSA funds programs and systems to improve access to health care among low-
income populations, pregnant women and children, persons living with HIV/AIDS, rural and
frontier populations, and others who are medically underserved. SAMHSA funds community-
based mental health and substance abuse prevention and treatment services.
CDC is a public health agency that develops and supports community-based and population-wide
programs and systems to promote quality of life and prevent the leading causes of disease, injury,
disability, and death. ATSDR, which is headed by the CDC director and included in the discussion
of CDC in this report, is tasked with identifying potential public health effects from exposure to
hazardous substances. Finally, FDA is primarily a regulatory agency, whose mission is to ensure
the safety of foods, dietary supplements, and cosmetics, and the safety and effectiveness of drugs,
vaccines, medical devices, and other health products. In 2009, Congress gave FDA the authority
to regulate the manufacture, marketing, and distribution of tobacco products in order to protect
public health.
The programs and activities of five of the PHS agencies—AHRQ, CDC, HRSA, NIH, and
SAMHSA—are mostly authorized under the Public Health Service Act (PHSA).2 While some of
FDA’s regulatory activities are also authorized under the PHSA, the agency and its programs
derive most of their statutory authority from the Federal Food, Drug, and Cosmetic Act
(FFDCA).3 HRSA’s maternal and child health programs are authorized by the Social Security Act
1 HHS also includes three human services agencies that are not part of the Public Health Service: (1) the Administration
for Children and Families (ACF); (2) the Administration for Community Living (ACL), which was created in April
2012 by consolidating the Administration on Aging (AoA), the HHS Office on Disability, and ACF’s Administration
on Developmental Disability; and (3) the Centers for Medicare & Medicaid Services (CMS). Departmental leadership
is provided by the Office of the Secretary (OS), which is comprised of various subdivisions including the Assistant
Secretary for Preparedness and Response (ASPR), the Assistant Secretary for Health (ASH), the Office of the Surgeon
General, the Office for Civil Rights (OCR), the Office of the Inspector General (OIG), and the Office of the National
Coordinator for Health Information Technology (ONC). For more information on HHS and links to the PHS agency
websites, see http://www.hhs.gov/. 2 42 U.S.C. §§201 et seq. 3 21 U.S.C. §§301 et seq.

Public Health Service Agencies: Overview and Funding (FY2010-FY2016)
Congressional Research Service 2
(SSA),4 and many of the IHS programs and services are authorized by the Indian Health Care
Improvement Act.5 ATSDR was created by the Comprehensive Environmental Response,
Compensation and Liability Act (CERCLA, the “Superfund” law).6
Sources of PHS Agency Funding The primary source of funding for each PHS agency is the discretionary budget authority it
receives through the annual appropriations process.7 AHRQ, CDC, HRSA, NIH, and SAMHSA
are funded through the Departments of Labor, Health and Human Services, and Education, and
Related Agencies (Labor-HHS-ED) appropriations act. Funding for ATSDR and IHS is provided
through the Department of the Interior, Environment, and Related Agencies
(Interior/Environment) appropriations act. FDA gets its funding through the Agriculture, Rural
Development, Food and Drug Administration, and Related Agencies (Agriculture) appropriations
act.8
The economic stimulus package enacted in February 2009—the American Reinvestment and
Recovery Act (ARRA)—provided a total of $15.1 billion in supplemental FY2009 discretionary
appropriations to five of the PHS agencies.9 Details of the allocation of those funds are provided
in Appendix A. Almost all of the ARRA appropriations were designated as two-year funds,
available for obligation through the end of FY2010.
Transfers
The annual Labor-HHS-ED appropriations act gives the HHS Secretary limited authority to
transfer funds from one budget account to another within the department. The Secretary may
transfer up to 1% of the funds in any given account. However, a recipient account may not be
increased by more than 3%. Congressional appropriators must be notified in advance of any
transfer.10
4 SSA Title V, 42 U.S.C. §§701 et seq. 5 25 U.S.C. §§1601 et seq. 6 42 U.S.C. §9604(i). 7 Budget authority is the authority provided in federal law to incur financial obligations that will result in expenditures,
or outlays, of federal funds. Such obligations include contracts for the purchase of supplies and services, liabilities for
salaries and wages, and grant awards. Appropriations are the most common form of budget authority. Discretionary
budget authority represents funding that is provided in and controlled by the annual appropriations acts. 8 For an overview of each of these three appropriations acts, see CRS Report R43967, Labor, Health and Human
Services, and Education: FY2015 Appropriations, coordinated by Karen E. Lynch; CRS Report R43617, Interior,
Environment, and Related Agencies: FY2015 Appropriations, by Carol Hardy Vincent; and CRS Report R43669,
Agriculture and Related Agencies: FY2015 Appropriations, coordinated by Jim Monke. 9 P.L. 111-5, 123 Stat. 115. The PHS agency appropriations were included in Title VII (Interior/Environment) and Title
VIII (Labor-HHS-ED) of Division A of ARRA. In addition to these discretionary appropriations, ARRA included
several HHS mandatory spending provisions. For example, ARRA temporarily increased federal payments to states
under the Medicaid and the Temporary Assistance for Needy Families (TANF) programs. ARRA also incorporated the
Health Information Technology for Economic and Clinical Health (HITECH) Act, which established multibillion dollar
incentive programs under Medicare and Medicaid to encourage hospitals and physicians to adopt and use interoperable
electronic health record technology. For more information, see, American Recovery and Reinvestment Act of 2009 (P.L.
111-5): Summary and Legislative History, by Clinton T. Brass et al. 10 The HHS Secretary’s FY2015 transfer authority was provided in Section 206 of the FY2015 Labor-HHS-ED
appropriations act (P.L. 113-235, Division G).

Public Health Service Agencies: Overview and Funding (FY2010-FY2016)
Congressional Research Service 3
The HHS Secretary used this transfer authority in FY2013 and again in FY2014 as part of a
broader effort to provide the Centers for Medicare & Medicaid Services (CMS) with additional
funding to implement the Affordable Care Act (ACA). In FY2013, for example, NIH was the
primary source of transfers both to CMS for ACA implementation and to CDC and SAMHSA to
help offset a loss of funding for those two agencies from the ACA’s Prevention and Public Health
Fund (PPHF). A significant portion of the FY2013 PPHF funds that were originally allocated to
CDC and SAMHSA were reallocated to CMS for ACA implementation. In FY2014, NIH was
again the primary source of transfers to CMS to support ACA implementation.11
PHS Program Evaluation Set-Aside
In addition to the transfer authority provided in the annual Labor-HHS-ED appropriations act,
Section 241 of the PHSA authorizes the HHS Secretary, with the approval of congressional
appropriators, to use a portion of the funds appropriated for programs authorized by the PHSA to
evaluate their implementation and effectiveness. This long-standing budgeting authority is known
as the PHS Program Evaluation Set-Aside (set-aside), or PHS budget “tap.”
Under this authority the appropriations of a number of HHS agencies and offices are subject to an
assessment. Although the PHSA limits the set-aside to no more than 1% of program
appropriations, in recent years the annual Labor-HHS-ED appropriations act has specified a
higher amount. The FY2015 Labor-HHS-ED appropriations act capped the set-aside at 2.5%.12
Following passage of the annual Labor-HHS-ED appropriations act, the HHS Budget Office
calculates the assessment on each of the donor agencies and offices. These funds are then
transferred to various recipient agencies and offices within the department for evaluation and
other specified purposes, based on the amounts specified in the appropriations act.13
Table 1 shows the total assessments and transfers for FY2013, by HHS agency and office, and
indicates whether the entity was a net donor or recipient of set-aside funds that year. NIH, whose
annual discretionary appropriation exceeds that of all the other PHS agencies combined, is subject
to the largest assessment of set-aside funds. NIH contributed almost $710 million (69%) of the
$1.026 billion in set-aside funds in FY2013. The agency received $8 million in set-aside funding,
making it a significant net donor of such funds. Similarly, HRSA contributed more set-aside funds
than it received in FY2013. On the other hand, AHRQ, CDC, and SAMHSA each were net
recipients of set-aside funding in FY2013. The Administration for Children and Families (ACF)
and the Office of the Secretary (OS) also received set-aside funds.
The FY2013 assessments and transfers of set-aside funding shown in Table 1 are broadly
representative of the distribution of such funds during each of the preceding fiscal years
extending back to the mid-2000s. In FY2014, the allocation of set-aside funding was comparable
11 For more discussion of ACA implementation funding, see, Federal Funding for Health Insurance Exchanges, by
Annie L. Mach and C. Stephen Redhead. 12 P.L. 113-235, Division G, Section 205; 128 Stat. 2485. Note: The President’s FY2016 budget proposed increasing
the maximum amount of set-aside funds to 3.0%. 13 Only funds appropriated for activities and programs authorized by the PHSA are subject to an assessment. Thus,
most of the funds appropriated for CDC, HRSA, NIH, and SAMHSA are assessed. The annual Labor-HHS-ED
appropriations act excludes some funding from the set-aside; still other funding is excluded by convention. For
example, funds appropriated for HHS block grants targeting prevention, substance abuse, and mental health as well as
funds for program management activities and for buildings and facilities are typically excluded from the set-aside.
Funding for agencies (e.g., ATSDR, FDA, IHS) and programs (e.g., HRSA’s maternal and child health block grant)
that are not authorized by the PHSA are also excluded.

Public Health Service Agencies: Overview and Funding (FY2010-FY2016)
Congressional Research Service 4
to that of FY2013 but with one key difference. For the first time, CMS was a recipient of set-
aside funds.14
In FY2015, congressional appropriators made substantial changes to the allocation of set-aside
funds by transferring most of the funding to NIH and eliminating any transfers to AHRQ, CDC,
and HRSA. As shown in Table 1, NIH went from being by far the largest net donor of set-aside
funds to a net recipient of such funding in FY2015. Meanwhile, AHRQ and CDC experienced a
significant net loss of set-aside funding in FY2015. The situation with AHRQ is of particular
interest. From FY2003 through FY2014, AHRQ did not receive an annual discretionary
appropriation. The agency was supported by set-aside funds and, in recent years, by smaller
amounts from other sources. In FY2015, however, AHRQ received a discretionary appropriation
for the first time in more than a decade in lieu of receiving any set-aside funding.
Table 1. PHS Evaluation Set-Aside Fund Assessments and Transfers in FY2013
and FY2015
Dollars in Thousands
FY2013 FY2015
Agency/
Office
Total
Assessments
Total
Transfers
Net Gain
(Loss)
Total
Assessments
Total
Transfers
Net Gain
(Loss)
NIH 709,536 8,200 (701,336) 688,604 715,000 26,396
HRSA 126,340 25,000 (101,340) 209,583 — (209,583)
CDC 116,170 375,048 258,878 148,884 — (148,884)
SAMHSA 53,867 129,667 75,800 29,337 133,667 104,330
AHRQ 78 365,362 365,284 7,340 — (7,340)
CMS — — — — 196,000 196,000
ACF — 5,762 5762 — — —
ACL 158 — (158) 590 — (590)
OS 19,412 116,522 97,110 27,657 67,328 39,671
Total 1,025,561 1,025,561 1,111,995 1,111,995
Sources: Department of Health and Human Services, “Use of Public Health Service Set-Aside Authority for
Fiscal Year 2013,” Report to Congress; and Department of Health and Human Services, “Use of Public Health
Services Set-Aside Authority for Fiscal Year 2015,” Report to Congress.
Mandatory Funding, User Fees, and Collections
Although the bulk of PHS agency funding is provided through annual discretionary
appropriations, agencies also receive mandatory funding, user fees, and third-party collections.15
As discussed briefly below, these additional sources of funding are a substantial component of the
budget of several PHS agencies.
14 Complete details of the FY2014 set-aside fund assessments and transfers are not publicly available. 15 Mandatory spending, also known as direct spending, refers to outlays from budget authority that is provided in laws
other than annual appropriations acts. Mandatory spending includes spending on entitlement programs.
Public Health Service Agencies: Overview and Funding (FY2010-FY2016)
Congressional Research Service 5
Mandatory Appropriations
The Patient Protection and Affordable Care Act (ACA)16
included numerous appropriations that
together are providing billions of dollars in mandatory spending to support new and existing grant
programs and other activities.17
Some of the ACA appropriations fund specific programs and
activities within the PHS agencies. These appropriations are itemized in the funding tables in this
report.
The ACA also established three multibillion dollar trust funds to help support PHS agency
programs and activities. First, the Community Health Center Fund (CHCF), for which the
ACA provided a total of $11 billion in annual appropriations over the five-year period FY2011-
FY2015, is supporting the federal health centers program and the National Health Service Corps
(NHSC), both administered by HRSA.18
A table summarizing each fiscal year’s CHCF
appropriation and the allocation of funds appears in Appendix B.19
Second, the Prevention and Public Health Fund (PPHF), for which the ACA provided a
permanent annual appropriation, is intended to support prevention, wellness, and other public
health programs and activities.20
To date, CDC has received the majority of PPHF funds, while
AHRQ, HRSA, and SAMHSA have received smaller amounts. The HHS Secretary transferred
almost half of the FY2013 PPHF funds to CMS to support ACA implementation. A broader
analysis of the allocation of PPHF funding is provided in Appendix C.
The Patient-Centered Outcomes Research Trust Fund (PCORTF) is supporting comparative
effectiveness research over a 10-year period (FY2010-FY2019) with a mix of appropriations—
some of which are offset by revenue from a fee imposed on health insurance policies and self-
insured health plans—and transfers from the Medicare Part A and Part B trust funds.21
A portion
of the PCORTF is allocated for AHRQ. More information on the PCORTF, including the
appropriation and transfer formulas, is provided in Appendix D.
In addition to the ACA funding, HRSA, CDC, and IHS each receive mandatory funds from other
sources. HRSA’s Family-to-Family Health Information Centers Program has been funded by a
series of mandatory appropriations since FY2007; CDC receives Medicaid funding to support the
Vaccines for Children program; and both IHS and NIH receive mandatory funds for diabetes
programs. These and other mandatory appropriations are itemized in the agency funding tables in
this report.
16 The ACA was signed into law on March 23, 2010 (P.L. 111-148, 124 Stat. 119). On March 30, 2010, the President
signed the Health Care and Education Reconciliation Act (HCERA; P.L. 111-152, 124 Stat. 1029), which included
several new health reform provisions and amended numerous provisions in the ACA. Several subsequently enacted
bills made additional changes to selected ACA provisions. All references to the ACA in this report refer collectively to
the law and to the changes made by HCERA and subsequent legislation. 17 For a complete list and discussion of all the appropriations in the ACA, including details of the obligation of these
funds, see CRS Report R41301, Appropriations and Fund Transfers in the Affordable Care Act (ACA), by C. Stephen
Redhead. 18 ACA Section 10503(a)-(b). 19 The Medicare Access and CHIP Reauthorization Act of 2015 (MACRA; P.L. 114-10, 129 Stat. 87) appropriated two
more years of funding for the CHCF—a total of $3.910 billion for each of FY2016 and FY2017—to support health
center operations and the NHSC. 20 ACA Section 4002. 21 ACA Section 6301(d)-(e).
Public Health Service Agencies: Overview and Funding (FY2010-FY2016)
Congressional Research Service 6
User Fees
Several PHS agencies assess user fees on third parties to help fund their programs and activities.
User fees collected by CDC, HRSA, and SAMHSA represent a very small portion of each
agency’s overall budget.22
In comparison, the industry user fees that FDA collects help finance a
broad range of the agency’s regulatory activities and account for a substantial and growing share
of the agency’s budget.
It has been almost 25 years since the Prescription Drug User Fee Act (PDUFA)23
established the
first user fee program at FDA. Since PDUFA’s enactment, Congress has created several other
FDA user fee programs. These programs provide FDA with additional resources that allow it to
hire more personnel and expedite the process of reviewing new product applications. Some user
fees also pay for information technology infrastructure and post-approval regulation of safety and
effectiveness. FDA’s user fee programs now support the agency’s regulation of prescription drugs,
animal drugs, medical devices, tobacco products, and foods, among other activities. The amount
of user fees that FDA collects under these programs has increased steadily since PDUFA was
enacted, both in absolute terms and as a share of FDA’s overall budget. In FY2015, user fees
accounted for 42% of the FDA’s overall budget. More discussion of user fees is provided in the
FDA section of this report and in Appendix E.
Collections
IHS supplements its annual discretionary appropriation with third-party collections from public
and private payers. Most of these funds come from Medicare and Medicaid, which reimburse IHS
for services provided to American Indians and Alaska Natives enrolled in these programs at
facilities operated by IHS and the tribes. IHS also collects reimbursements from private health
insurers. IHS collections (and reimbursements) are reflected in Table 7 of this report.
Recent Trends in PHS Agency Funding Congress has taken a number of recent steps through both the annual appropriations process and
the enactment of deficit-reduction legislation to reduce the growth in federal spending. These
actions, which are briefly discussed below, have helped reduce discretionary funding for several
PHS agencies over the past six years (i.e., FY2010-FY2015). Among the five PHS agencies that
are funded through the Labor-HHS-ED appropriations act, only SAMHSA received funding in
FY2015 that was essentially level with the amount it received in FY2010. CDC, HRSA, and NIH
each received a smaller discretionary appropriation in FY2015 than they had received in FY2010.
Similarly, AHRQ’s discretionary appropriation in FY2015 was less than the amount of set-aside
funding the agency received in FY2010. With the exception of NIH, which is funded almost
entirely by discretionary appropriations, the decline in discretionary funding for the other three
agencies (i.e., AHRQ, CDC, and HRSA) has been offset by the receipt of mandatory ACA funds.
FDA and IHS, neither of which receives discretionary funding through the Labor-HHS-ED
appropriation act, have seen their appropriations increase over the six-year period FY2010-
FY2015. Both agencies have also witnessed a steady increase in funding from other sources; user
fees at FDA, and third-party collections at IHS.
22 These user fees are listed in the agency-specific tables in this report. 23 P.L. 102-571, 106 Stat. 4491.

Public Health Service Agencies: Overview and Funding (FY2010-FY2016)
Congressional Research Service 7
Impact of Budget Caps and Sequestration
In April 2011, lawmakers agreed to cuts in discretionary spending for a broad range of agencies
and programs as part of negotiations to complete the FY2011 appropriations process and avert a
government shutdown. Congress and the President then enacted the Budget Control Act of 2011
(BCA),24
which amended the Balance Budget and Emergency Deficit Control Act of 1985
(BBEDCA).25
The BCA established enforceable discretionary spending limits, or caps, for
defense and nondefense spending for each of FY2012 through FY2021 and triggered annual
spending reductions, equally divided between defense and nondefense spending, beginning in
FY2013. Within each spending category the cuts are divided proportionately between
discretionary spending and nonexempt mandatory spending. All the spending summarized in this
report falls within the nondefense category.
Under the BCA, the spending reductions are achieved through a combination of sequestration
(i.e., an across-the-board cancellation of budgetary resources) and lowering the BCA-imposed
discretionary spending caps. The Office of Management and Budget (OMB) is responsible for
calculating the percentages and amounts by which mandatory and discretionary spending are
required to be reduced each year, and for applying the BBEDCA’s sequestration exemptions and
special rules.
Mandatory Spending
The BCA requires the mandatory spending reductions to be executed each year by a sequestration
of all nonexempt accounts. Generally, the ACA and other mandatory funding discussed in this
report is fully sequestrable at the applicable percentage rate for nonexempt nondefense mandatory
spending (see Table 2), with the following key exceptions. First, the funds for the CDC-
administered Vaccines for Children program come from Medicaid, which is exempt from
sequestration. Second, funding for the Energy Employees Occupational Illness Compensation
Program Act (EEOICPA) also is exempt from sequestration. Third, under the sequestration
special rules, cuts in CHCF funding for community health centers and migrant health centers and
the cuts in mandatory diabetes funding for IHS are capped at 2% (see Table 2).
While all the nonexempt PHS programs with mandatory funding were sequestered in FY2013 and
FY2014, several of them avoided sequestration in FY2015 and/or FY2016 because there were no
budgetary resources at the time the sequestration was ordered by the President. The Maternal,
Infant, and Early Childhood Home Visiting program, administered by HRSA, is one example of
this anomaly. The ACA authorized the Home Visiting program and funded it through FY2014
(see Table 6). Pursuant to the BCA, the President ordered the FY2015 sequestration on March 10,
2014, the day the FY2015 budget was released. But Congress and the President had yet to enact
legislation extending funding for the Home Visiting program, so there were no FY2015 budgetary
resources to sequester.26
24 P.L. 112-25, 125 Stat. 240. For more information, see CRS Report R41965, The Budget Control Act of 2011, by Bill
Heniff Jr., Elizabeth Rybicki, and Shannon M. Mahan, and CRS Report R42949, The American Taxpayer Relief Act of
2012: Modifications to the Budget Enforcement Procedures in the Budget Control Act, by Bill Heniff Jr. 25 P.L. 99-177; Title II, 99 Stat. 1038. 26 While a full accounting of this anomaly is beyond the scope of this report, the following programs listed in the tables
in the report were not sequestered in the years indicated in parentheses because there were no budgetary resources at
the time the sequestration was ordered: (1) CHCF – health centers, NHSC (FY2016); (2) Maternal, Infant, and Early
Childhood Home Visiting program (FY2015, FY2016); (3) Teaching Health Center Graduate Medical Education
program (FY2016); (4) Family-to-Family Information Centers (FY2014, FY2015, FY2016); and (5) IHS and NIH
(continued...)
Public Health Service Agencies: Overview and Funding (FY2010-FY2016)
Congressional Research Service 8
Discretionary Spending
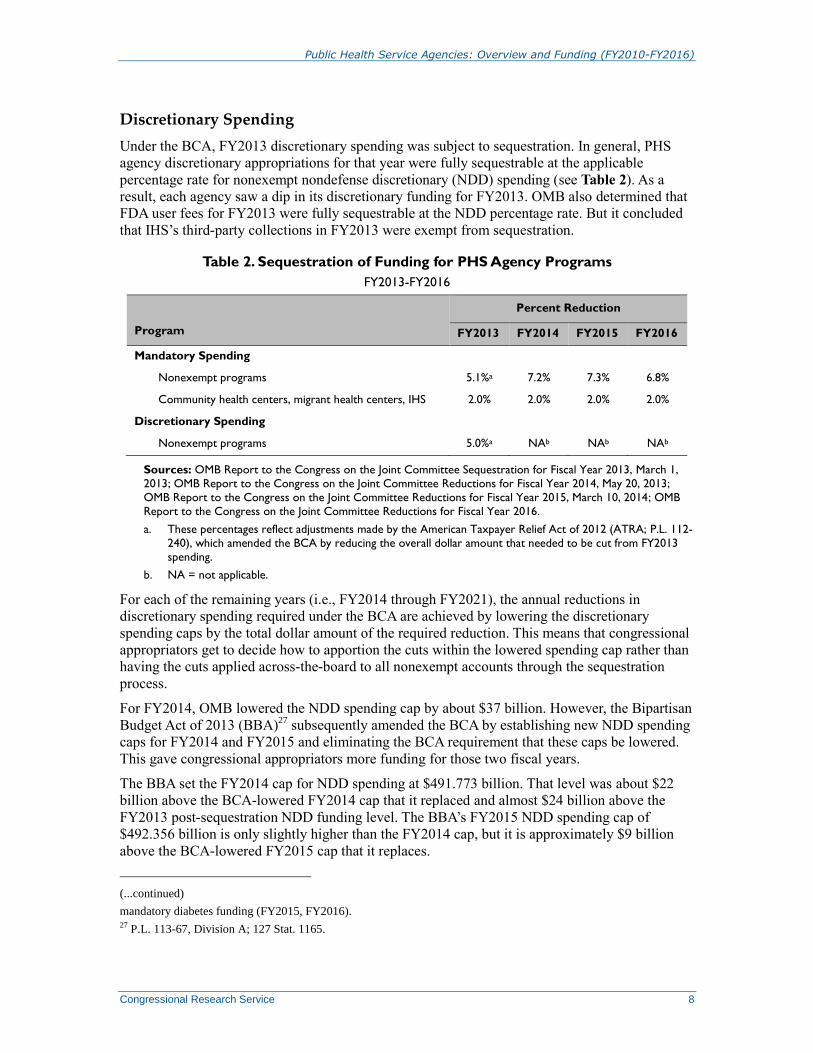
Under the BCA, FY2013 discretionary spending was subject to sequestration. In general, PHS
agency discretionary appropriations for that year were fully sequestrable at the applicable
percentage rate for nonexempt nondefense discretionary (NDD) spending (see Table 2). As a
result, each agency saw a dip in its discretionary funding for FY2013. OMB also determined that
FDA user fees for FY2013 were fully sequestrable at the NDD percentage rate. But it concluded
that IHS’s third-party collections in FY2013 were exempt from sequestration.
Table 2. Sequestration of Funding for PHS Agency Programs
FY2013-FY2016
Program
Percent Reduction
FY2013 FY2014 FY2015 FY2016
Mandatory Spending
Nonexempt programs 5.1%a 7.2% 7.3% 6.8%
Community health centers, migrant health centers, IHS 2.0% 2.0% 2.0% 2.0%
Discretionary Spending
Nonexempt programs 5.0%a NAb NAb NAb
Sources: OMB Report to the Congress on the Joint Committee Sequestration for Fiscal Year 2013, March 1,
2013; OMB Report to the Congress on the Joint Committee Reductions for Fiscal Year 2014, May 20, 2013;
OMB Report to the Congress on the Joint Committee Reductions for Fiscal Year 2015, March 10, 2014; OMB
Report to the Congress on the Joint Committee Reductions for Fiscal Year 2016.
a. These percentages reflect adjustments made by the American Taxpayer Relief Act of 2012 (ATRA; P.L. 112-
240), which amended the BCA by reducing the overall dollar amount that needed to be cut from FY2013
spending.
b. NA = not applicable.
For each of the remaining years (i.e., FY2014 through FY2021), the annual reductions in
discretionary spending required under the BCA are achieved by lowering the discretionary
spending caps by the total dollar amount of the required reduction. This means that congressional
appropriators get to decide how to apportion the cuts within the lowered spending cap rather than
having the cuts applied across-the-board to all nonexempt accounts through the sequestration
process.
For FY2014, OMB lowered the NDD spending cap by about $37 billion. However, the Bipartisan
Budget Act of 2013 (BBA)27
subsequently amended the BCA by establishing new NDD spending
caps for FY2014 and FY2015 and eliminating the BCA requirement that these caps be lowered.
This gave congressional appropriators more funding for those two fiscal years.
The BBA set the FY2014 cap for NDD spending at $491.773 billion. That level was about $22
billion above the BCA-lowered FY2014 cap that it replaced and almost $24 billion above the
FY2013 post-sequestration NDD funding level. The BBA’s FY2015 NDD spending cap of
$492.356 billion is only slightly higher than the FY2014 cap, but it is approximately $9 billion
above the BCA-lowered FY2015 cap that it replaces.
(...continued)
mandatory diabetes funding (FY2015, FY2016). 27 P.L. 113-67, Division A; 127 Stat. 1165.

Public Health Service Agencies: Overview and Funding (FY2010-FY2016)
Congressional Research Service 9
In FY2016, discretionary spending levels are once again subject to the original requirements of
the BCA. The law set the FY2016 cap for NDD spending at $530.000 billion, which OMB has
lowered to $493.491 billion pursuant to the BCA.28
Report Roadmap The remainder of this report consists of seven sections, one for each PHS agency beginning with
AHRQ.29
Each section includes an overview of the agency’s statutory authority and principal
activities, and a brief summary of the agency’s funding over the period FY2010-FY2015. This
material is accompanied by a detailed funding table showing the FY2010-FY2015 funding levels
and the FY2016 budget request for the agency. The amounts in the funding tables in this report
are taken from the departmental and agency budget documents submitted to the appropriations
committees, as well as agency operating plans.30
Specific documents are listed in the source note
under each table.
The funding tables are formatted in a similar, though not identical, manner. The formatting
generally matches the way in which each agency’s funding is presented in the congressional
budget documents. Each table shows the funding for all the agency’s budget accounts and,
typically, for selected programs and activities within those accounts. These amounts are summed
to give the agency’s total, or program level, funding. At the bottom of the table any user fees, set-
aside funds, ACA funds, and other nondiscretionary amounts are subtracted from the program
level to give the agency’s discretionary budget authority (i.e., annual discretionary
appropriations).
The tables for AHRQ, CDC, HRSA, and SAMHSA include non-add entries—italicized and in
parentheses—to indicate the contribution of funding from sources other than the agency’s
discretionary appropriations to specific accounts. Almost all of the CDC accounts are funded with
discretionary appropriations plus amounts from multiple other sources (see Table 4).
The use of a dash in the funding tables generally means “not applicable.” Either the activity or
program was not authorized or there was no mandatory funding provided for that fiscal year. In
contrast, a zero usually indicates that congressional appropriators had chosen not to appropriate
any discretionary funds that year or, in the case of the FY2016 budget request, that no
discretionary funding was requested.
It is important to keep in mind that the PHS agency funding tables that appear in budget
documents and appropriations committee reports, as well as the tables in this report, show only
the amount of evaluation set-aside funds received. They do not reflect the amount of funding
assessed on agency accounts. As a result, the funding tables for the PHS agencies subject to an
assessment (i.e., CDC, HRSA, NIH, and SAMHSA) give a somewhat distorted view of their
available budgetary resources. This effect is particularly significant in the case of NIH. As
mentioned earlier, NIH is assessed approximately $700 million annually, and until FY2015 the
agency received $8 million each year in set-aside transfers. While the funding table for NIH
shows receipt of set-aside funds, which count towards the agency’s overall program level
28 Office of Management and Budget, OMB Sequestration Preview Report to the President and Congress for Fiscal
Year 2016, February 2, 2015, https://www.whitehouse.gov/sites/default/files/omb/assets/legislative_reports/
sequestration/2016_sequestration_preview_report_president.pdf. 29 ATSDR and its budget are included in the discussion of CDC. 30 All the budget documents and operating plans are available at http://www.hhs.gov/budget/.
Public Health Service Agencies: Overview and Funding (FY2010-FY2016)
Congressional Research Service 10
funding, the amounts shown for each agency account have not been reduced to reflect the
assessment. Thus, NIH appears to have about $700 million more than is in fact the case.
Note that the funding tables show the post-sequestration amounts for the accounts that were
subject to sequestration in FY2013-FY2015. The amounts shown for the FY2016 request do not
reflect sequestration.
Congress has yet to complete work on any of the regular appropriations bills for FY2016, which began on
October 1, 2015. On September 30, the President signed the Continuing Appropriations Act, 2016 (P.L. 114-
53). The measure provides continuing appropriations through December 11, 2016. It funds discretionary
programs at the same rate (and under the same conditions) as in FY2015, minus an across-the-board
reduction of 0.2108%. For entitlement and other mandatory spending that is funded through appropriation acts, P.L. 114-53 provides funding to maintain program levels under current law. This report will be updated
with information on PHS agency funding for FY2016 once legislative action on appropriations for the new
fiscal year is completed.

Public Health Service Agencies: Overview and Funding (FY2010-FY2016)
Congressional Research Service 11
Agency for Healthcare Research and Quality
(AHRQ)31
Agency Overview
AHRQ supports research designed to improve the quality of health care, increase the efficiency of
its delivery, and broaden access to health services. Specific research efforts are aimed at reducing
the costs of care, promoting patient safety, measuring the quality of health care, and improving
health care services, organization, and financing. AHRQ also is required to disseminate its
research findings to health care providers, payers, and consumers, among others. In addition, the
agency collects data on health care expenditures and utilization through the Medical Expenditure
Panel Survey (MEPS) and the Healthcare Cost and Utilization Project (HCUP).
AHRQ has evolved from a succession of
agencies concerned with fostering health
services research and health care technology
assessment. The Omnibus Budget
Reconciliation Act of 1989 (P.L. 101-239)
added a new PHSA Title IX and established
the Agency for Health Care Policy and Research (AHCPR), a successor agency to the former
National Center for Health Services Research and Health Care Technology Assessment
(NCHSR). AHCPR was reauthorized in 1992 (P.L. 102-410). On December 6, 1999, President
Clinton signed the Healthcare Research and Quality Act of 1999 (P.L. 106-129), which renamed
AHCPR as the Agency for Healthcare Research and Quality (AHRQ) and reauthorized
appropriations for its programs and activities through FY2005.32
Congress has yet to reauthorize
the agency’s funding. Despite the expired authorization of appropriations, AHRQ continues to get
annual funding.
The AHRQ budget is organized according to three program areas: (1) Healthcare Costs, Quality
and Outcomes (HCQO) Research; (2) MEPS; and (3) program support. HCQO research focuses
on six priority areas, summarized in the text box below.
Healthcare Costs, Quality and Outcomes (HCQO) Research Areas
Health Information Technology (HIT). Research evaluating HIT and its impact on the quality and efficiency of
health care.
Patient Safety. Research on reducing and preventing medical errors, with a focus on health care-associated
infections (HAIs).
Patient-Centered Health. Research comparing the effectiveness of different treatment options (previously
referred to as comparative effectiveness research).
Health Services Research, Data, and Dissemination. Research on quality of health care that spans multiple
priority areas including, for example, the annual National Healthcare Quality and National Healthcare Disparities
Reports.
Value. Research and projects supporting value in health care, focusing on reducing cost and improving quality.
Prevention/Care Management. Research on improving the delivery of primary care and preventive services.
31 This section was written by Amanda K. Sarata, Specialist in Health Policy. 32 See the AHRQ website at http://www.ahrq.gov.
For more information
CRS Report R44136, The Agency for Healthcare Research
and Quality (AHRQ) Budget: Fact Sheet, by Amanda K.
Sarata.
Public Health Service Agencies: Overview and Funding (FY2010-FY2016)
Congressional Research Service 12
From FY2003 through FY2014, AHRQ did not receive its own annual discretionary
appropriation. Instead, the agency largely relied on the PHS evaluation set-aside to fund its
activities and programs. In recent years AHRQ also has received mandatory funds from the PPHF
and the PCORTF (see Appendix C and Appendix D). In FY2015, AHRQ received its own
discretionary appropriation for the first time in more than a decade in lieu of any set-aside
funding.
Agency Funding Since FY2010
AHRQ’s program level has increased steadily over the past several years with decreases in
discretionary funding being more than offset by transfers of ACA mandatory funds (see Table 3).
Specifically, since FY2010, the agency’s budget has increased by $62 million, and transfers
mostly from PCORTF have more than offset decreases in PHS evaluation set-aside dollars.
Although the majority of agency funding came from PHS evaluation set-aside dollars during this
period—and an agency-specific discretionary appropriation in FY2015—funding from PCORTF
has also grown considerably from $8 million in FY2011 to $101 million in FY2015.

CRS-13
Table 3. Agency for Healthcare Research and Quality (AHRQ)
(Millions of Dollars, by Fiscal Year)
Program or Activity 2010 2011 2012 2013 2014 2015
2016
Request
Health Costs, Quality and Outcomes (HCQO) Research 276 266 272 300 304 330 339
Health Information Technology Research 28 28 26 26 30 28 23
Patient Safety Research 91 66 66 67 72 77 76
Patient-Centered Health Researcha 21 29 41 68 — — —
PCORTF Transfer (non-add)a — (8) (24) (58) — — —
PCORTF Transfera — — — — 65 101 116
Health Services Research, Data, and Disseminationb 112 112 108 111 111 112 112
Value 4 4 4 4 3 — —
Prevention/Care Management 21 28 28 26 23 12 12
PPHF Transfer (non-add) (6) (12) (12) (6) (7) — —
Medical Expenditure Panel Surveys (MEPS) 59 59 59 61 64 65 69
Program Support 68 68 74 68 69 70 72
Total, Program Level 403 392 405 429 436 465 479
Less Funds From Other Sources
PHS Evaluation Set-Aside 397 372 369 365 364 0 88
PCORTF Transfers — 8 24 58 65 101 116
PPHF Transfers 6 12 12 6 7 — —
Total, Discretionary Budget Authority 0 0 0 0 0 364 276
Sources: Funding amounts for FY2010 and FY2011 are taken from AHRQ’s FY2012 and FY2013 congressional budget justification documents. Funding amounts for
FY2012 and FY2013 are taken from AHRQ’s Sequestration Operating Plan for FY2013. Funding amounts for FY2014 and FY2015 are taken from the FY2016 HHS Budget
in Brief and the FY2015 congressional budget justification. The funding amounts for the FY2016 President’s Request are taken from the FY2016 HHS Budget in Brief. All
these documents are available at http://www.hhs.gov/budget/.
Notes: Individual amounts may not add to subtotals or totals due to rounding.
a. AHRQ receives funds transferred from the PCORTF to carry out PHSA Section 937, which requires the dissemination of the results of patient-centered outcomes
research carried out by the Patient Centered Outcomes Research Institute (PCORI) and other “government-funded research relevant to comparative clinical
effectiveness research.” For FY2011-FY2013, the PCORTF transfer supplemented the agency’s set-aside funding for its patient-centered health research program.
Since FY2014, however, AHRQ’s patient-centered health research program has been entirely funded by the PCORTF transfer, which is now shown as its own
separate budget line. AHRQ’s budget documents no longer list patient-centered health research as a separate program area.
b. Formerly “Crosscutting Activities;” also formerly “Research Innovations.”
Public Health Service Agencies: Overview and Funding (FY2010-FY2016)
Congressional Research Service 14
Centers for Disease Control and Prevention (CDC)33
Agency Overview
According to CDC, its mission is “to protect America from health, safety and security threats,
both foreign and in the [United States].”34
CDC is organized into a number of centers, institutes,
and offices, some focused on specific public health challenges (e.g., injury prevention), others
focused on general public health capabilities (e.g., surveillance and laboratory services).35
In
addition, the Agency for Toxic Substances and Disease Registry (ATSDR) is headed by the CDC
Director and is discussed in this section.
Many CDC activities are not specifically authorized but are based in broad, permanent authorities
in the PHSA.36
Four CDC operating divisions are explicitly authorized. The National Institute for
Occupational Safety and Health (NIOSH) was permanently authorized by the Occupational
Safety and Health Act of 1970.37
The National Center on Birth Defects and Developmental
Disabilities (NCBDDD) was established in PHSA Section 317C by the Children’s Health Act of
2000.38
The National Center for Health Statistics (NCHS) was established in PHSA Section 306
by the Health Services Research, Health Statistics, and Medical Libraries Act of 1974.39
ATSDR
was established by the Comprehensive Environmental Response, Compensation and Liability Act
of 1980 (CERCLA, the “Superfund” law).40
Authorizations of appropriations for NCBDDD,
NCHS, and ATSDR have expired, but the programs continue to receive annual appropriations.
CDC provides about $5 billion per year in grants to state, local, municipal, tribal, and foreign
governments, and to academic and non-profit entities.41
It has few regulatory responsibilities.
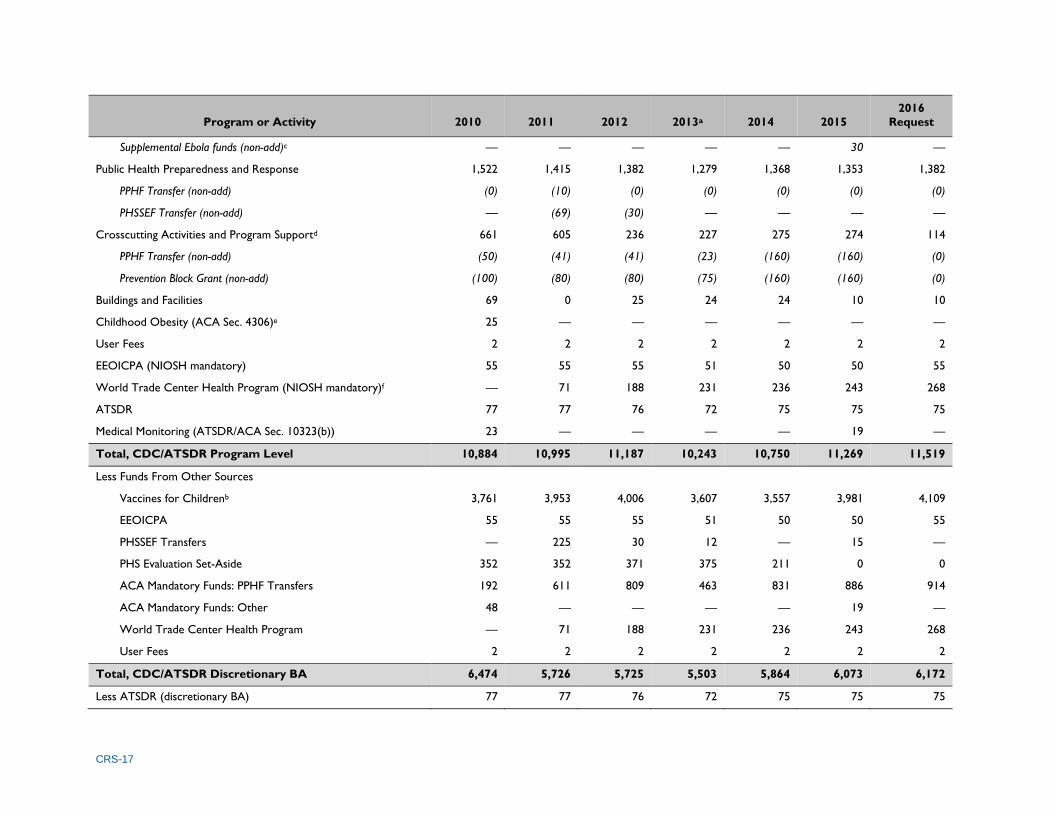
Table 4 presents funding levels for CDC programs for FY2010 through the FY2016 request. In
addition to annual discretionary appropriations, program level amounts for recent years include
funds from the following four mandatory appropriations: (1) the Vaccines for Children (VFC)
program;42
(2) NIOSH activities to support the Energy Employees Occupational Illness
Compensation Program Act (EEOICPA);43
(3) the World Trade Center (WTC) Health Program;44
and (4) appropriations provided under ACA, principally through the PPHF.45
CDC also receives
annual set-aside funds and authorized user fees, and may also receive funding through
supplemental appropriations and other transfers.
33 This section was written by Sarah A. Lister, Specialist in Public Health and Epidemiology. 34 See the CDC website at http://www.cdc.gov/about/organization/mission.htm. 35 Information about CDC’s organization is available at http://www.cdc.gov/about/organization/cio.htm. 36 For example, PHSA Section 301 authorizes the Secretary of HHS to conduct research and investigations as necessary
to control disease, and Section 317 authorizes the Secretary to award grants to states for preventive health programs. 37 29 U.S.C. §671. 38 42 U.S.C. §247b-4. 39 42 U.S.C. §242k. 40 42 U.S.C. §9604(i). 41 See CDC, Procurements and Grants, http://www.cdc.gov/about/business/funding.htm. 42 See CDC, Vaccines for Children Program, http://www.cdc.gov/vaccines/programs/vfc/index.html. 43 See CDC, EEOICPA, “Frequently Asked Questions,” http://www.cdc.gov/niosh/ocas/faqsact.html. 44 See CDC, World Trade Center Health Program, http://www.cdc.gov/niosh/topics/wtc/. 45 CRS Report R41301, Appropriations and Fund Transfers in the Affordable Care Act (ACA), by C. Stephen Redhead.
See more information about the PPHF in Appendix C of this report.
Public Health Service Agencies: Overview and Funding (FY2010-FY2016)
Congressional Research Service 15
Agency Funding Since FY2010
Compared with FY2010, CDC’s budget authority for FY2015 is lower, and its program level is
higher (see Table 4). Two of CDC’s mandatory funding sources—ACA funding, principally from
the PPHF, and the WTC Health Program—have, in whole or part, replaced discretionary funding
for some ongoing activities.
Both budget authority and program level reached their lowest points since FY2010 in FY2013, a
result of sequestration of most mandatory and discretionary funds, and redirection of some PPHF
funds to ACA implementation (see Appendix C). VFC and EEOICPA funds are exempt from
sequestration. The PPHF and WTC Health Program are not, and sequestration of these mandatory
funds has continued each fiscal year since FY2013.
In 2014 CDC implemented the “Working Capital Fund,” a revolving fund to be used by agency
programs to pay for agency-wide business services—such as procurement and human
resources—that received direct appropriations in the past.46
CDC now applies certain business
services funds previously assigned to the Cross-cutting Activities and Program Support account to
the programmatic accounts instead. Although this does not change the amount of funds available
to the agency, it has the effect of increasing the amounts budgeted to programmatic accounts.
CDC has adjusted its accounting from FY2012 forward to make budget lines comparable from
year to year. Of note, Table 4 reflects this adjustment, such that amounts presented for FY2012
and later years are not necessarily comparable to amounts presented for FY2010 and FY2011.
In December 2014 Congress provided $1.771 billion in FY2015 emergency supplemental
appropriations to CDC for response to the Ebola outbreak. The funds, which are available through
FY2019, are to be used for both domestic and international activities. CDC has not yet presented
these funds within its general budget, and they are not presented in Table 4. More information is
available on the CDC website.47
46 See CDC, “Working Capital Fund,” http://www.cdc.gov/fmo/topic/wcf/index.html. 47 CDC, “FY2015 Ebola Response Funding,” http://www.cdc.gov/fmo/topic/Budget%20Information/index.html.

CRS-16
Table 4. Centers for Disease Control and Prevention (CDC) and
Agency for Toxic Substances and Disease Registry (ATSDR)
(Millions of Dollars, by Fiscal Year)
Program or Activity 2010 2011 2012 2013a 2014 2015
2016
Request
Immunization and Respiratory Diseases 721 748 815 718 783 798 748
PHS Evaluation Set-Aside (non-add) (13) (13) (13) (13) (13) (0) (0)
PPHF Transfer (non-add) (0) (100) (190) (91) (160) (210) (210)
PHSSEF Transfer (non-add) — (156) — (12) — (15) —
Vaccines for Childrenb 3,761 3,953 4,006 3,607 3,557 3,981 4,109
HIV/AIDS, Viral Hepatitis, STI and TB 1,119 1,116 1,163 1,095 1,118 1,118 1,162
PHS Evaluation Set-Aside (non-add) (0) (0) (0) (4) (0) (0) (0)
PPHF Transfer (non-add) (30) (0) (10) (0) (0) (0) (0)
Emerging & Zoonotic Infectious Diseases 281 304 362 341 390 405 699
PPHF Transfer (non-add) (20) (52) (52) (44) (52) (52) (55)
Chronic Disease Prevention and Health Promotion 924 1,075 1,211 1,003 1,186 1,198 1,058
PPHF Transfer (non-add) (59) (301) (411) (233) (446) (451) (480)
Birth Defects, Developmental Disabilities, Disability and Health 144 136 142 134 129 132 132
PPHF Transfer (non-add) (0) (0) (0) (0) (0) (0) (68)
Environmental Health 181 170 158 142 179 179 179
PPHF Transfer (non-add) (0) (35) (35) (21) (13) (13) (37)
Injury Prevention and Control 149 144 146 139 150 170 257
Public Health Scientific Services 441 468 517 493 481 481 539
PHS Evaluation Set-Aside (non-add) (248) (248) (248) (248) (86) (0) (0)
PPHF Transfer (non-add) (32) (72) (70) (52) (0) (0) (64)
Occupational Safety and Health 375 316 325 323 332 335 283
PHS Evaluation Set-Aside (non-add) (92) (92) (111) (111) (112) (0) (0)
Global Health 354 340 377 363 416 447 448
CRS-17
Program or Activity 2010 2011 2012 2013a 2014 2015
2016
Request
Supplemental Ebola funds (non-add)c — — — — — 30 —
Public Health Preparedness and Response 1,522 1,415 1,382 1,279 1,368 1,353 1,382
PPHF Transfer (non-add) (0) (10) (0) (0) (0) (0) (0)
PHSSEF Transfer (non-add) — (69) (30) — — — —
Crosscutting Activities and Program Supportd 661 605 236 227 275 274 114
PPHF Transfer (non-add) (50) (41) (41) (23) (160) (160) (0)
Prevention Block Grant (non-add) (100) (80) (80) (75) (160) (160) (0)
Buildings and Facilities 69 0 25 24 24 10 10
Childhood Obesity (ACA Sec. 4306)e 25 — — — — — —
User Fees 2 2 2 2 2 2 2
EEOICPA (NIOSH mandatory) 55 55 55 51 50 50 55
World Trade Center Health Program (NIOSH mandatory)f — 71 188 231 236 243 268
ATSDR 77 77 76 72 75 75 75
Medical Monitoring (ATSDR/ACA Sec. 10323(b)) 23 — — — — 19 —
Total, CDC/ATSDR Program Level 10,884 10,995 11,187 10,243 10,750 11,269 11,519
Less Funds From Other Sources
Vaccines for Childrenb 3,761 3,953 4,006 3,607 3,557 3,981 4,109
EEOICPA 55 55 55 51 50 50 55
PHSSEF Transfers — 225 30 12 — 15 —
PHS Evaluation Set-Aside 352 352 371 375 211 0 0
ACA Mandatory Funds: PPHF Transfers 192 611 809 463 831 886 914
ACA Mandatory Funds: Other 48 — — — — 19 —
World Trade Center Health Program — 71 188 231 236 243 268
User Fees 2 2 2 2 2 2 2
Total, CDC/ATSDR Discretionary BA 6,474 5,726 5,725 5,503 5,864 6,073 6,172
Less ATSDR (discretionary BA) 77 77 76 72 75 75 75

CRS-18
Program or Activity 2010 2011 2012 2013a 2014 2015
2016
Request
Total, CDC Discretionary BA 6,397 5,649 5,649 5,430 5,788 5,998 6,096
Sources: CDC and ATSDR congressional budget justifications and related documents for FY2012 through FY2016, http://www.cdc.gov/fmo.
Notes: Individual amounts may not add to subtotals or totals due to rounding.
Mandatory amounts displayed for FY2013 through FY2015 reflect sequestration as required for non-defense mandatory spending.
BA and program level amounts for FY2012 and subsequent fiscal years reflect a realignment of funds from certain business services in the Cross-cutting Activities and
Program Support account into most other accounts, in order to implement the Working Capital Fund, discussed in the text of this report. As a result, amounts for these
years are not necessarily comparable to amounts for previous years.
PHSSEF is Public Health and Social Services Emergency Fund, a fund used by appropriators to provide the Secretary with ongoing or one-time emergency funding, such as
for the response to influenza epidemics. STI is sexually transmitted infection. EEOICPA is Energy Employees Occupational Illness Compensation Program Act.
a. Amounts for FY2013 include a transfer of $79 million from other HHS agencies, pursuant to the Secretary’s transfer authority (see discussion under “Transfers”).
b. The Vaccines for Children (VFC) program provides free pediatric vaccines to doctors who serve eligible (generally low-income) children. VFC is funded entirely as
an entitlement through federal Medicaid appropriations and is exempt from sequestration. Amounts for FY2014 through the FY2016 request are estimates.
c. Amounts include $30 million for FY2015 for the response to the 2014 Ebola outbreak in West Africa (P.L. 113-164). Amounts do not include subsequent
supplemental FY2015 funding for response to the outbreak provided in P.L. 113-235. These funds are discussed in CRS Report R43807, FY2015 Funding to Counter
Ebola and the Islamic State (IS), coordinated by Susan B. Epstein; and at CDC, “FY2015 Ebola Response Funding,” http://www.cdc.gov/fmo/topic/
Budget%20Information/index.html.
d. For the purposes of this table, Cross-cutting Activities and Program Support excludes amounts for Buildings and Facilities, which are displayed in a separate row.
Amounts for FY2010 include amounts previously designated as Public Health Leadership and Support, Business Services Support, and Preventive Health and Health
Services Block Grant.
e. ACA Section 4306 appropriated $25 million for a childhood obesity demonstration project, http://www.cdc.gov/obesity/childhood/researchproject.html. The
Medicare Access and CHIP Reauthorization Act of 2015 (MACRA, P.L. 114-10) appropriated additional funding for the childhood obesity demonstration program;
$10 million for the two-year period FY2016 through FY2017.
f. Beginning July 1, 2011 (i.e., for the final quarter of FY2011), the World Trade Center Health Program, previously funded through discretionary appropriations to
NIOSH, was replaced by a mandatory program. Amounts are federal obligations only. Amounts for FY2015 and FY2016 are estimated federal obligations.
g. ACA Section 10323(b) appropriated $23 million for the period FY2010-FY2014, and $20 million for each five‐year period thereafter, in no‐year funding for the early
detection of certain medical conditions related to environmental health hazards in Libby, Montana.
Public Health Service Agencies: Overview and Funding (FY2010-FY2016)
Congressional Research Service 19
Food and Drug Administration (FDA)48
Agency Overview
FDA regulates the safety of human foods, dietary supplements, cosmetics, and animal foods; and
the safety and effectiveness of human drugs, biological products (e.g., vaccines), medical devices,
radiation-emitting products, and animal drugs. In 2009, Congress gave FDA the authority to
regulate the manufacture, marketing, and distribution of tobacco products in order to protect
public health.
Seven centers within FDA represent the broad program areas for which the agency has
responsibility: the Center for Biologics Evaluation and Research (CBER), the Center for Devices
and Radiological Health (CDRH), the Center for Drug Evaluation and Research (CDER), the
Center for Food Safety and Applied Nutrition (CFSAN), the Center for Veterinary Medicine
(CVM), the National Center for Toxicological Research (NCTR), and the Center for Tobacco
Products (CTP). Several other offices have agency-wide responsibilities.
The Federal Food, Drug, and Cosmetic Act (FFDCA) is the principal source of FDA’s statutory
authority.49
FDA is also responsible for administering certain provisions in other laws, most
notably the PHSA.50
Although the FDA’s authorizing committees in Congress are the committees
with jurisdiction over public health issues—the Senate Committee on Health, Education, Labor,
and Pensions, and the House Committee on Energy and Commerce—FDA’s assignment within
the appropriations committees reflects its origin as part of the Department of Agriculture. The
Senate and House appropriations subcommittees on Agriculture, Rural Development, FDA, and
Related Agencies have jurisdiction over FDA’s budget, even though the agency has been part of
various federal health agencies (HHS and its predecessors) since 1940.
FDA’s budget has two funding streams: annual
appropriations (i.e., discretionary budget
authority, or BA) and industry user fees. In
FDA’s annual appropriation, Congress sets
both the total amount of appropriated funds
and the amount of user fees that the agency is
authorized to collect and obligate for that
fiscal year. Appropriated funds are largely for
the Salaries and Expenses account, with a
much smaller amount for the Buildings and Facilities account. The several different user fees,
which account for 42% of FDA’s total FY2015 program level, contribute only to the Salaries and
Expenses account.
The largest and oldest FDA user fee that is linked to a specific program was first authorized by
the Prescription Drug User Fee Act (PDUFA, P.L. 102-571) in 1992. Appendix E presents the
authorizing legislation for current FDA user fees, sorted by the dollar amount they contribute to
the agency’s FY2015 budget. After PDUFA, Congress added user fee authorities regarding
48 This section was written by Susan Thaul, Specialist in Drug Safety and Effectiveness. 49 21 U.S.C. §§301 et seq. 50 PHSA Section 351 (21 U.S.C. §262) authorizes the regulation of biological products and states that FFDCA
requirements apply to biological products licensed under the PHSA. A listing of other laws containing provisions for
which FDA is responsible is at http://www.fda.gov/RegulatoryInformation/Legislation/default.htm.
For more information
CRS Report RL34334, The Food and Drug Administration:
Budget and Statutory History, FY1980-FY2007, coordinated
by Judith A. Johnson.
CRS Report R41983, How FDA Approves Drugs and
Regulates Their Safety and Effectiveness, by Susan Thaul.
CRS Report R42130, FDA Regulation of Medical Devices, by
Judith A. Johnson.
Public Health Service Agencies: Overview and Funding (FY2010-FY2016)
Congressional Research Service 20
medical devices, animal drugs, animal generic drugs, tobacco products, priority review, food
reinspection, food recall, voluntary qualified food importer, generic drugs, biosimilars, and, most
recently, outsourcing facilities (related to drug compounding) and some wholesale distributors
and third-party logistics providers (related to pharmaceutical supply chain security).51
Each of the
medical product fee authorities requires reauthorization every five years. Several indefinite
authorities apply to fees for mammography inspection, color additive certification, export
certification, and priority review vouchers.52
Agency Funding Since FY2010
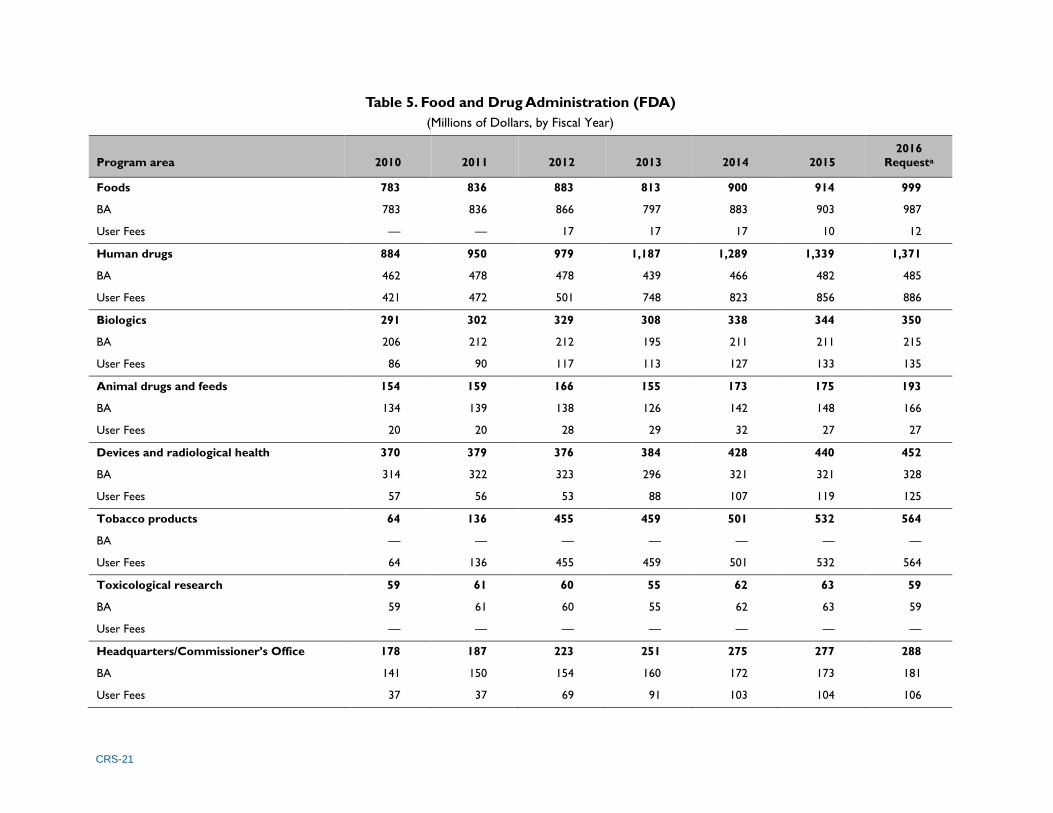
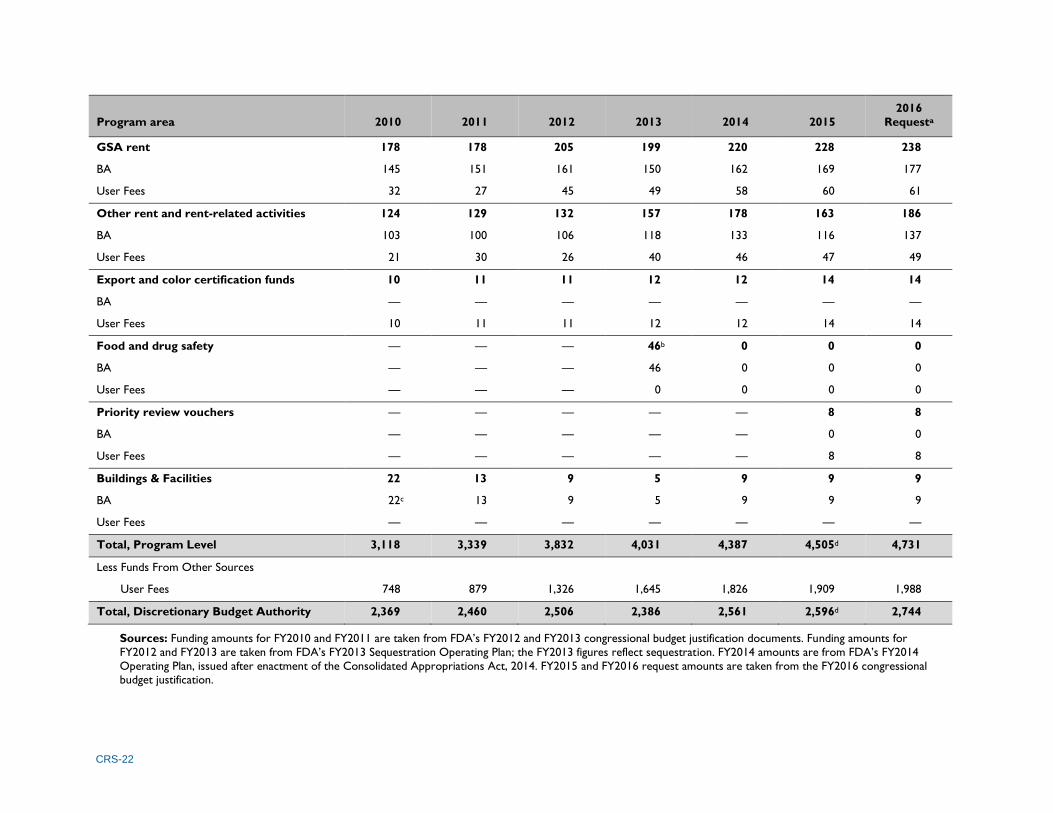
Between FY2010 and FY2015, FDA’s funding increased from $3.1 billion to $4.5 billion (see
Table 5). Although congressionally provided appropriations increased 10% over that period, user
fee revenue more than doubled. In FY2015, user fees account for 42% of FDA’s total funding.
Continuing funding issues for the agency include adequate resources to carry out food safety
activities (the President’s request includes a $301 million increase above the FY2015 level), the
risk of user fees’ being subject to subsequent sequestrations, and the ongoing challenge of
performing increasing congressionally directed tasks without concomitant resources increases.
51 CRS Report R42366, Prescription Drug User Fee Act (PDUFA): 2012 Reauthorization as PDUFA V, by Susan
Thaul; CRS Report R42508, The FDA Medical Device User Fee Program, by Judith A. Johnson; CRS Report R40443,
The FDA Food Safety Modernization Act (P.L. 111-353), coordinated by Renée Johnson; CRS Report R42680, The
Food and Drug Administration Safety and Innovation Act (FDASIA, P.L. 112-144), coordinated by Susan Thaul; and
CRS Report R43290, The Proposed Drug Quality and Security Act (H.R. 3204), by Susan Thaul. 52 User fees provide varying proportions of funding for several FDA programs (see Table E-1). For example, the
agency’s tobacco regulatory activities are entirely supported through user fees paid by tobacco product manufacturers
and importers, and the toxicology program receives no user fee funds. In FY2015, fees account for 64% of the human
drugs program budget, 39% of the biologics budget, 27% of the devices and radiological health budget, 15% of the
animal drugs and feeds budget, and 1% of the foods budget. Appendix E of this report presents additional detail.
CRS-21
Table 5. Food and Drug Administration (FDA)
(Millions of Dollars, by Fiscal Year)
Program area 2010 2011 2012 2013 2014 2015
2016
Requesta
Foods 783 836 883 813 900 914 999
BA 783 836 866 797 883 903 987
User Fees — — 17 17 17 10 12
Human drugs 884 950 979 1,187 1,289 1,339 1,371
BA 462 478 478 439 466 482 485
User Fees 421 472 501 748 823 856 886
Biologics 291 302 329 308 338 344 350
BA 206 212 212 195 211 211 215
User Fees 86 90 117 113 127 133 135
Animal drugs and feeds 154 159 166 155 173 175 193
BA 134 139 138 126 142 148 166
User Fees 20 20 28 29 32 27 27
Devices and radiological health 370 379 376 384 428 440 452
BA 314 322 323 296 321 321 328
User Fees 57 56 53 88 107 119 125
Tobacco products 64 136 455 459 501 532 564
BA — — — — — — —
User Fees 64 136 455 459 501 532 564
Toxicological research 59 61 60 55 62 63 59
BA 59 61 60 55 62 63 59
User Fees — — — — — — —
Headquarters/Commissioner’s Office 178 187 223 251 275 277 288
BA 141 150 154 160 172 173 181
User Fees 37 37 69 91 103 104 106
CRS-22
Program area 2010 2011 2012 2013 2014 2015
2016
Requesta
GSA rent 178 178 205 199 220 228 238
BA 145 151 161 150 162 169 177
User Fees 32 27 45 49 58 60 61
Other rent and rent-related activities 124 129 132 157 178 163 186
BA 103 100 106 118 133 116 137
User Fees 21 30 26 40 46 47 49
Export and color certification funds 10 11 11 12 12 14 14
BA — — — — — — —
User Fees 10 11 11 12 12 14 14
Food and drug safety — — — 46b 0 0 0
BA — — — 46 0 0 0
User Fees — — — 0 0 0 0
Priority review vouchers — — — — — 8 8
BA — — — — — 0 0
User Fees — — — — — 8 8
Buildings & Facilities 22 13 9 5 9 9 9
BA 22c 13 9 5 9 9 9
User Fees — — — — — — —
Total, Program Level 3,118 3,339 3,832 4,031 4,387 4,505d 4,731
Less Funds From Other Sources
User Fees 748 879 1,326 1,645 1,826 1,909 1,988
Total, Discretionary Budget Authority 2,369 2,460 2,506 2,386 2,561 2,596d 2,744
Sources: Funding amounts for FY2010 and FY2011 are taken from FDA’s FY2012 and FY2013 congressional budget justification documents. Funding amounts for
FY2012 and FY2013 are taken from FDA’s FY2013 Sequestration Operating Plan; the FY2013 figures reflect sequestration. FY2014 amounts are from FDA’s FY2014
Operating Plan, issued after enactment of the Consolidated Appropriations Act, 2014. FY2015 and FY2016 request amounts are taken from the FY2016 congressional budget justification.
CRS-23
Notes: Consistent with the Administration and congressional committee formats, each program area includes funding designated for the responsible FDA center (e.g.,
the Center for Drug Evaluation and Research or the Center for Food Safety and Applied Nutrition) and the portion of effort budgeted for the agency-wide Office of
Regulatory Affairs to commit to that area. It also apportions user fee revenue across the program areas as indicated in the Administration’s request (e.g., 90% of the
animal drug user fee revenue is designated for the animal drugs and feeds program, with the rest going to headquarters and Office of the Commissioner, GSA rent, and
other rent and rent-related activities categories).
a. For user fees in the Administration’s FY2016 request, this column shows only the $1,988 million in fees that have been authorized. The request included an
additional $199 million in proposed fees, allocated across several FDA program areas. With these proposed user fees, the President’s request for user fees totals
$2,187 million yielding a total program level request of $4,930 million.
b. The FY2013 Sequestration Operating Plan notes food safety and drug safety items that had not been included in the program-level appropriations.
c. The FY2010 Buildings & Facilities appropriation included about $7 million for the National Center for Natural Products Research, as directed by the Committee on
Appropriations.
d. The FY2015 Agriculture appropriations act provided an additional $25 million to FDA for Ebola response and preparedness activities. Adding this amount to the
FDA appropriations brought BA to $2,622 million and the total program level to $4,530 million for FY2015.

Public Health Service Agencies: Overview and Funding (FY2010-FY2016)
Congressional Research Service 24
Health Resources and Services Administration
(HRSA)53
Agency Overview
HRSA is the federal agency charged with improving access to health care for those who are
uninsured, isolated, or medically vulnerable. The agency currently awards funding to more than
3,000 grantees, including community-based organizations; colleges and universities; hospitals;
state, local, and tribal governments; and private entities to support health services projects, such
as training health care workers or providing specific health services.54
HRSA also administers the
health centers program, which provides grants to non-profit entities that provide primary care
services to people who experience financial, geographic, cultural, or other barriers to health care.
HRSA is organized into five bureaus (see text box below) and ten offices. Some offices focus on
specific populations or health care issues (e.g., Office of Women’s Health, Office of Rural Health
Policy), while others provide agency-wide support or technical assistance to HRSA’s regional
offices (e.g., Office of Planning, Analysis and Evaluation; Office of Regional Operations).55
HRSA Bureaus
The Bureau of Primary Health Care administers the Health Centers program, authorized under Title III of the
PHSA. Community and other health centers provide access to primary care for individuals who are low-income,
uninsured, or living where health care is scarce.
The Bureau of Health Workforce administers scholarship, loan and loan repayment programs that help
underserved communities recruit and retain health professionals. These programs include the National Health Service
Corps, NURSE Corps, and the Faculty Loan Repayment Program. The bureau also administers a number of programs
for health professions training and development of diversity and cultural competence in the health workforce. These
programs include the Oral Health Training Program, the Nursing Workforce Diversity Program, the Children’s
Hospitals Graduate Medical Education Program, the Teaching Health Center Graduate Medical Education program
funded under ACA, and the Scholarships for Disadvantaged Students Program. The Bureau of Health Professions also
administers the National Practitioner and Healthcare Integrity Protection Data Banks and the National Center for
Health Workforce Analysis. Titles III, VII, and VIII of the PHSA authorize programs in this bureau.
The Maternal and Child Health Bureau administers the Maternal and Child Health Block Grant and other
programs that support the infrastructure for maternal and child health services, including the Maternal, Infant, and
Early Childhood Home Visiting Program that was authorized and funded by ACA. These programs are authorized in
Title V of the Social Security Act (SSA). This bureau also administers Healthy Start, newborn hearing screening,
autism, and other programs authorized under Titles III, XI, XII, and XIX of the PHSA.
The HIV/AIDS Bureau administers the Ryan White HIV/AIDS program, which is the largest discretionary grant
program within HRSA and is focused on HIV/AIDS care. The Ryan White HIV/AIDS program administers grant
programs that provide early intervention, minority, and family services. It also administers the AIDS Drug Assistance
Program (ADAP). Title XXVI of the PHSA authorizes the Ryan White HIV/AIDS programs.
The Healthcare Systems Bureau provides national leadership and direction in targeted areas, such as organ and
bone marrow transplantation, poison control centers, and others. It also administers the 340B drug pricing program.
Titles III and XII of the PHSA authorize programs in this bureau.
As noted in the text box, the majority of HRSA’s programs are authorized by the PHSA or, in
some cases, by the SSA. Additionally, Section 427(e) of the Federal Mine Safety and Health
53 This section was written by Elayne J. Heisler, Specialist in Health Services. 54 See HRSA’s website at http://www.hrsa.gov. 55 See HRSA’s website at http://www.hrsa.gov.

Public Health Service Agencies: Overview and Funding (FY2010-FY2016)
Congressional Research Service 25
Amendments Act (P.L. 95-164) authorizes the Black Lung Program, which supports clinics that
provide services to retired coal miners and others.
Agency Funding Since FY2010
HRSA funding increased from $8.1 billion in FY2010 to $10.3 billion in FY2015 despite a
reduction in its discretionary appropriation during that time (see Table 6). Specifically,
discretionary appropriations declined by about 18%; falling from $7.5 billion to $6.1 billion.
Much of the decline in discretionary
appropriations occurred because of the loss of
discretionary appropriations for the National
Health Service Corps (NHSC) and the
elimination of the congressional earmark
program that supported health care facility
construction and renovation.
The overall growth in HRSA’s funding was
primarily driven by increasing amounts from
the CHCF, which more than offset the decline
in discretionary funding. While CHCF funding
may have been intended to supplement annual
discretionary appropriations for the health
centers program and the NHSC, the funds
have partially supplanted (i.e., replaced)
discretionary health center funding and have
become the sole source of funding for the
NHSC program, which has not received an
annual discretionary appropriation since FY2011.
With CHCF funding set to expire at the end of FY2015, Congress included two more years of
CHCF funding in the Medicare Access and CHIP Reauthorization Act of 2015 (MACRA; P.L.
114-10); see Table 6 and Appendix B. MACRA also extended funding for other HRSA programs
that were established and initially funded by the ACA; notably, the Maternal, Infant, and Early
Childhood Home Visiting Program.
For more information
CRS Report R44054, Health Resources and Services
Administration (HRSA) FY2016 Budget Request and Funding
History: Fact Sheet, by Elayne J. Heisler.
CRS Report R43937, Federal Health Centers: An Overview,
by Elayne J. Heisler.
CRS Report R43920, National Health Service Corps:
Changes in Funding and Impact on Recruitment, by Bernice
Reyes-Akinbileje.
CRS Report R42428, The Maternal and Child Health
Services Block Grant: Background and Funding, by Carmen
Solomon-Fears.
CRS Report R43177, Health Workforce Programs in Title
VII of the Public Health Service Act, by Bernice Reyes-
Akinbileje.
CRS Report R43930, Maternal and Infant Early Childhood
Home Visiting (MIECHV) Program: Background and Funding,
by Adrienne L. Fernandes-Alcantara.

CRS-26
Table 6. Health Resources and Services Administration (HRSA)
(Millions of Dollars, by Fiscal Year)
Bureau or Activity 2010 2011 2012 2013 2014 2015
2016
Request
2016
Enacted
Primary Care 2,253 4,149 2,817 2,992 3,636 5,001 4,191 —
Health Centers 2,141 2,481 2,672 2,856 3,542 4,901 4,092 —
CHCF Transfer (non-add) — (1,000) (1,200) (1,465) (2,145) (3,509) — (3,600)a
New mandatory proposal for FY2016 (non-add) — — — — — — (2,700)b —
Health Centers Tort Claims 44 100 95 89 95 100 100 —
School Based Health Centers (ACA Sec. 4101(a)) 50 50 50 47 — — — —
Health Center Construction (ACA Sec. 10503(c)) — 1,500 — — — — — —
Hansen’s Disease Programsc 18 18 — — — — — —
Health Workforced 1,249 1,357 1,086 1,001 1,043 1,058 1,799 —
National Health Service Corps (NHSC) 141 315 295 285 283 287 810 —
CHCF Transfer (non-add) — (290) (295) (285) (283) (287) — (310)a
New mandatory proposal for FY2016 (non-add) — — — — — — (523)b —
Faculty Loan Repayment Program 1 1 1 1 1 1 1
Training for Diversitye 96 95 85 80 81 82 85 —
Primary Care Training and Enhancement 237 39 39 37 37 39 39 —
PPHF Transfer (non-add) (198) — — — — — — —
Rural Physician Training Grants — — — — — — 4 —
Interdisciplinary, Community-Based Linkagesf 72 72 73 62 71 73 53 —
PPHF Transfer (non-add) — — (12) (2) — — — —
Public Health Workforce Development 30g 30 33 8 18 21 17 —
PPHF Transfer (non-add) (21)g (20) (25) — — — — —
Nursing Workforce Developmenth 290 242 231 218 223 232 232 —
PPHF Transfer (non-add) (47) — — — — — —
Children’s Hospitals GME Payments 317 268 265 251 264 265 100i —

CRS-27
Bureau or Activity 2010 2011 2012 2013 2014 2015
2016
Request
2016
Enacted
GME Targeted Support (New mandatory proposal) — — — — — — 400i —
Teaching Health Center GME Payments (ACA
Sec.5508(c))
— 230 — — — — — 60j
Other Health Workforce Programsk 41 41 35 34 37 39 39 —
National Practitioner Data Bank (User Fees) 24 24 28 27 27 19 20 —
Maternal and Child Health 984 1,128 1,208 1,193 1,220 1,254 1,352 —
Maternal and Child Health Block Grant 661 656 639 605 632 637 637 —
Healthy Start 105 104 104 98 101 102 102 —
Maternal, Infant Home Visiting (ACA Sec. 2951) 100 250 350 380 371 400l — 400l
New mandatory proposal for FY2016 — — — — — — 500m —
Family-to-Family Health Centers (ACA Sec. 5507)n 5 5 5 5 5 3 — 5
Other Maternal and Child Health Programso 113 113 112 105 110 112 112 —
Ryan White HIV/AIDS 2,315 2,337 2,392 2,249 2,313 2,319 2,323 —
Health Care Systems 267 87 101 95 103 103 118 —
Health Care Systems Programsp 93 82 96 91 75 76 76 —
Hansen’s Disease Programs — — 18 17 17 17 17 —
Health Center Infrastructure (ACA Sec. 10502) 100 — — — — — — —
State Health Access Grants 74 — — — — — — —
340B Drug Pricing Programs 4 4 4 10 10 25 —
User fee (non-add) — — — — — (8) —
Rural Health 185 138 138 131 142 147 128 —
Other Activities 813 467 460 436 446 448 465 —
Congressional Earmarks 337 — — — — — — —
Family Planning 317 299 294 278 286 286 300 —
Program Management 147 162 160 151 153 154 157 —
Healthy Weight Collaborative (PPHF Transfer) 5 — — — — — — —
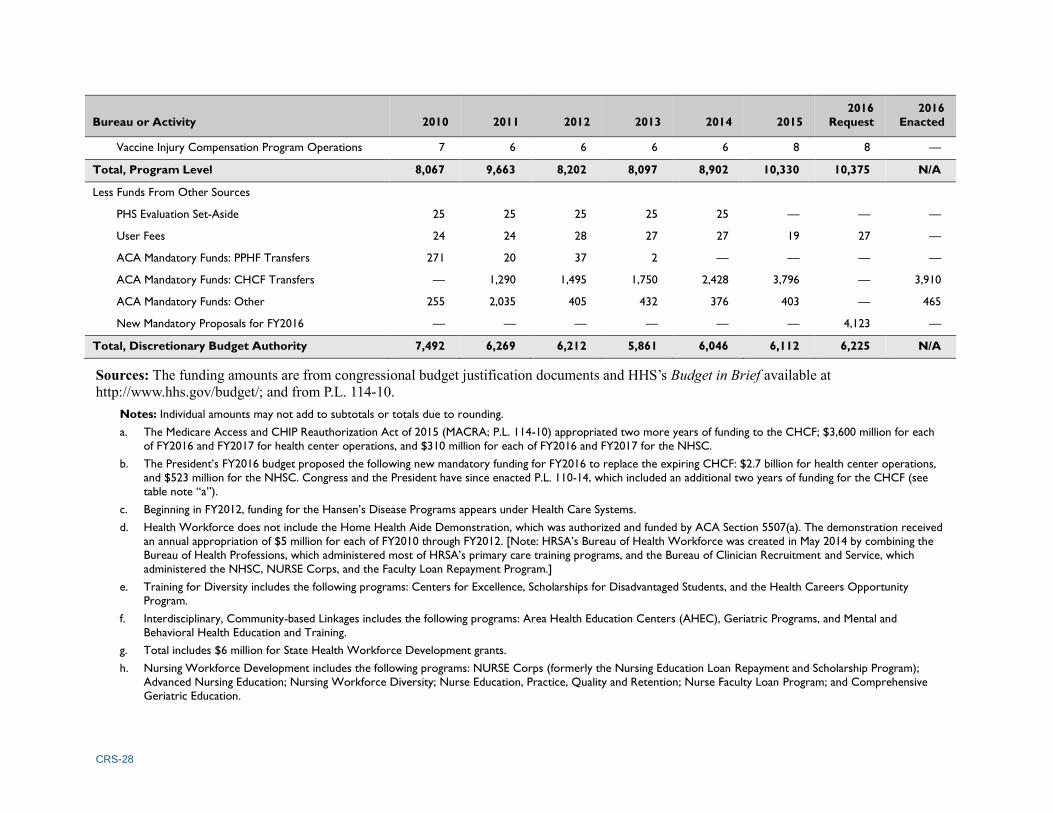
CRS-28
Bureau or Activity 2010 2011 2012 2013 2014 2015
2016
Request
2016
Enacted
Vaccine Injury Compensation Program Operations 7 6 6 6 6 8 8 —
Total, Program Level 8,067 9,663 8,202 8,097 8,902 10,330 10,375 N/A
Less Funds From Other Sources
PHS Evaluation Set-Aside 25 25 25 25 25 — — —
User Fees 24 24 28 27 27 19 27 —
ACA Mandatory Funds: PPHF Transfers 271 20 37 2 — — — —
ACA Mandatory Funds: CHCF Transfers — 1,290 1,495 1,750 2,428 3,796 — 3,910
ACA Mandatory Funds: Other 255 2,035 405 432 376 403 — 465
New Mandatory Proposals for FY2016 — — — — — — 4,123 —
Total, Discretionary Budget Authority 7,492 6,269 6,212 5,861 6,046 6,112 6,225 N/A
Sources: The funding amounts are from congressional budget justification documents and HHS’s Budget in Brief available at
http://www.hhs.gov/budget/; and from P.L. 114-10.
Notes: Individual amounts may not add to subtotals or totals due to rounding.
a. The Medicare Access and CHIP Reauthorization Act of 2015 (MACRA; P.L. 114-10) appropriated two more years of funding to the CHCF; $3,600 million for each
of FY2016 and FY2017 for health center operations, and $310 million for each of FY2016 and FY2017 for the NHSC.
b. The President’s FY2016 budget proposed the following new mandatory funding for FY2016 to replace the expiring CHCF: $2.7 billion for health center operations,
and $523 million for the NHSC. Congress and the President have since enacted P.L. 110-14, which included an additional two years of funding for the CHCF (see
table note “a”).
c. Beginning in FY2012, funding for the Hansen’s Disease Programs appears under Health Care Systems.
d. Health Workforce does not include the Home Health Aide Demonstration, which was authorized and funded by ACA Section 5507(a). The demonstration received
an annual appropriation of $5 million for each of FY2010 through FY2012. [Note: HRSA’s Bureau of Health Workforce was created in May 2014 by combining the
Bureau of Health Professions, which administered most of HRSA’s primary care training programs, and the Bureau of Clinician Recruitment and Service, which
administered the NHSC, NURSE Corps, and the Faculty Loan Repayment Program.]
e. Training for Diversity includes the following programs: Centers for Excellence, Scholarships for Disadvantaged Students, and the Health Careers Opportunity
Program.
f. Interdisciplinary, Community-based Linkages includes the following programs: Area Health Education Centers (AHEC), Geriatric Programs, and Mental and
Behavioral Health Education and Training.
g. Total includes $6 million for State Health Workforce Development grants.
h. Nursing Workforce Development includes the following programs: NURSE Corps (formerly the Nursing Education Loan Repayment and Scholarship Program);
Advanced Nursing Education; Nursing Workforce Diversity; Nurse Education, Practice, Quality and Retention; Nurse Faculty Loan Program; and Comprehensive
Geriatric Education.
CRS-29
i. The President’s FY2016 budget proposed new mandatory funding for Targeted Support for Graduate Medical Education, which would be used to provide additional
support for the Children’s Hospital GME Payment Program and full support for the Teaching Health Center GME program.
j. MACRA (P.L. 114-10) appropriated $60 million for each of FY2016 and FY2017 for GME payments to teaching health centers.
k. Other Health Workforce Programs include HealthCare Workforce Assessment, Oral Health Training, and the Patient Navigator Program (funded through FY2011).
l. MACRA (P.L. 114-10) appropriated $400 million for the home visiting program for each of FY2015 through FY2017.
m. The President’s FY2016 budget proposed new mandatory funds to extend and expand the home visiting program through FY2025, including $500 million for
FY2016. However, MACRA (P.L. 114-10) provided three more years of funding for the program (see table note “l”).
n. ACA Section 5507(b) funded family-to-family information centers through FY2012. Several subsequently enacted laws, most recently MACRA (P.L. 114-10), have
extended that funding through FY2017.
o. Other Maternal and Child Health Programs include Autism and Other Developmental Disorders, Traumatic Brain Injury, Sickle Cell Services Demonstration,
Universal Newborn Hearing Screening, Emergency Medical Services for Children, and Heritable Disorders.
p. Health Care Systems Programs include Organ Transplantation, National Cord Blood Inventory, C.W. Bill Young Cell Transplantation Program, and Poison Control
Centers.

Public Health Service Agencies: Overview and Funding (FY2010-FY2016)
Congressional Research Service 30
Indian Health Service (IHS)56
Agency Overview
IHS provides health care for approximately 2.2 million eligible American Indians/Alaska Natives
through a system of programs and facilities located on or near Indian reservations, and through
contractors in certain urban areas. IHS provides services to members of 566 federally recognized
tribes either directly or through facilities and programs operated by Indian Tribes or Tribal
Organizations through self-determination contracts and self-governance compacts authorized in
the Indian Self-Determination and Education Assistance Act (ISDEAA).57
The Snyder Act of 1921 provides general
statutory authority for IHS.58
In addition,
specific IHS programs are authorized by two
acts: the Indian Sanitation Facilities Act of
195959
and the Indian Health Care
Improvement Act (IHCIA).60
The Indian
Sanitation Facilities Act authorizes the IHS to
construct sanitation facilities for Indian communities and homes, and IHCIA authorizes programs
such as urban health, health professions recruitment, and substance abuse and mental health
treatment, and permits IHS to receive reimbursements from Medicare, Medicaid, the State
Children’s Health Insurance Program (CHIP), the Department of Veterans Affairs (VA), and third-
party insurers.
As discussed earlier, IHS receives its appropriations through the Interior/Environment
appropriations act. IHS funding is not subject to the PHS Program Evaluation Set-Aside.
Agency Funding Since FY2010
IHS’s funding, which includes discretionary appropriations and collections from third-party
payers of health care, increased between FY2010 and FY2015 from $5.1 billion to $5.9 billion
(see Table 7). This increase was driven both by increased discretionary appropriations, which
rose from $4.1 billion to $4.6 billion, and by increased collections, which rose from $891 million
to $1.1 billion. Much of the funding increase was used to support clinical services. Discretionary
appropriations, in particular, have increased funding for purchased/referred care, a subset of the
clinical services budget line that applies to funds used to refer patients to an outside provider
when the IHS cannot provide a service within its system. Collections received from providing
clinical services are also used to augment the clinical services budget.
56 This section was written by Elayne J. Heisler, Specialist in Health Services. 57 P.L. 93-638; 25 U.S.C. §§450 et seq. 58 P.L. 67-85, as amended; 25 U.S.C. §13. The Snyder Act established this authority as part of the Bureau of Indian
Affairs within the Department of the Interior. The Transfer Act of 1954 (P.L. 83-568) transferred this authority to the
U.S. Surgeon General within the Department of Health, Education, and Welfare (now HHS). 59 P.L. 86-121; 42 U.S.C. §2004a. 60 P.L. 94-437, as amended; 25 U.S.C. §§1601 et seq., and 42 U.S.C. §§1395qq and 1396j (and amending other
sections). This act was permanently reauthorized by the ACA. See CRS Report R41630, The Indian Health Care
Improvement Act Reauthorization and Extension as Enacted by the ACA: Detailed Summary and Timeline, by Elayne J.
Heisler.
For more information
CRS Report R43330, The Indian Health Service (IHS): An
Overview, by Elayne J. Heisler.
CRS Report R44040, Indian Health Service FY2016 Budget
Request and Funding History: Fact Sheet, by Elayne J.
Heisler.
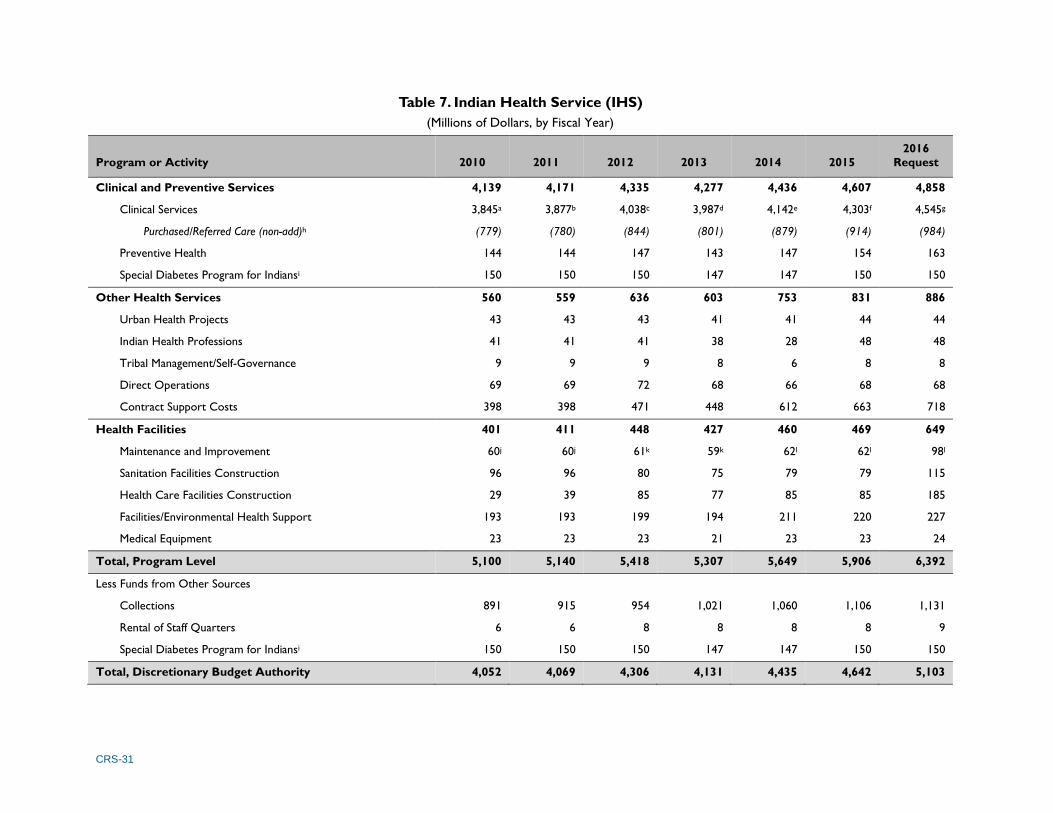
CRS-31
Table 7. Indian Health Service (IHS)
(Millions of Dollars, by Fiscal Year)
Program or Activity 2010 2011 2012 2013 2014 2015
2016
Request
Clinical and Preventive Services 4,139 4,171 4,335 4,277 4,436 4,607 4,858
Clinical Services 3,845a 3,877b 4,038c 3,987d 4,142e 4,303f 4,545g
Purchased/Referred Care (non-add)h (779) (780) (844) (801) (879) (914) (984)
Preventive Health 144 144 147 143 147 154 163
Special Diabetes Program for Indiansi 150 150 150 147 147 150 150
Other Health Services 560 559 636 603 753 831 886
Urban Health Projects 43 43 43 41 41 44 44
Indian Health Professions 41 41 41 38 28 48 48
Tribal Management/Self-Governance 9 9 9 8 6 8 8
Direct Operations 69 69 72 68 66 68 68
Contract Support Costs 398 398 471 448 612 663 718
Health Facilities 401 411 448 427 460 469 649
Maintenance and Improvement 60j 60j 61k 59k 62l 62l 98l
Sanitation Facilities Construction 96 96 80 75 79 79 115
Health Care Facilities Construction 29 39 85 77 85 85 185
Facilities/Environmental Health Support 193 193 199 194 211 220 227
Medical Equipment 23 23 23 21 23 23 24
Total, Program Level 5,100 5,140 5,418 5,307 5,649 5,906 6,392
Less Funds from Other Sources
Collections 891 915 954 1,021 1,060 1,106 1,131
Rental of Staff Quarters 6 6 8 8 8 8 9
Special Diabetes Program for Indiansi 150 150 150 147 147 150 150
Total, Discretionary Budget Authority 4,052 4,069 4,306 4,131 4,435 4,642 5,103

CRS-32
Sources: Funding amounts for FY2010, FY2011, and FY2012 are taken from IHS’s FY2012, FY2013, and FY2014 congressional budget justification documents,
respectively. Funding amounts for FY2013, FY2014, and FY2015 are taken from the FY2015 HHS Budget in Brief. Funding amounts for FY2016 are taken from the
FY2016 HHS Budget in Brief. These documents are available at http://www.hhs.gov/budget/.
Notes: Individual amounts may not add to subtotals or totals due to rounding.
a. Includes $891 million in collections from Medicare, Medicaid, CHIP, private insurance, and other programs.
b. Includes $915 million in collections from Medicare, Medicaid, CHIP, private insurance, and other programs.
c. Includes $954 million in collections from Medicare, Medicaid, CHIP, private insurance, and other programs.
d. Includes an estimated $1,021 million in collections from Medicare, Medicaid, CHIP, private insurance, and other programs.
e. Includes an estimated $1,060 million in collections from Medicare, Medicaid, CHIP, the Department of Veterans Affairs, private insurance, and other programs.
f. Includes an estimated $1,106 million in collections from Medicare, Medicaid, CHIP, the Department of Veterans Affairs, private insurance, and other programs.
g. Includes an estimated $1,131 million in collections from Medicare, Medicaid, CHIP, the Department of Veterans Affairs, private insurance, and other programs.
h. This was previously referred to as “Contract Health Services.”
i. PHSA Section 330C provides an annual appropriation of $150 million through FY2017 for this program. These mandatory funds are subject to a 2% sequestration
(not shown for FY2015 and FY2016).
j. Includes $6 million that IHS received from rental of staff quarters.
k. Includes $8 million that IHS received from rental of staff quarters.
l. Includes $8 million that IHS estimates the agency will receive from rental of staff quarters.

Public Health Service Agencies: Overview and Funding (FY2010-FY2016)
Congressional Research Service 33
National Institutes of Health (NIH)61
Agency Overview
NIH is the primary agency of the federal government charged with performing and supporting
biomedical and behavioral research. Its activities cover a wide range of basic, clinical, and
translational research, as well as research training and health information collection and
dissemination. The agency is organized into 27 research institutes and centers, headed by the NIH
Director. The Office of the Director (OD) sets overall policy for NIH and coordinates the
programs and activities of all NIH components, particularly in areas of research that involve
multiple institutes. The institutes and centers (collectively called ICs) focus on particular diseases,
areas of human health and development, or aspects of research support. Each IC plans and
manages its own research programs in coordination with the Office of the Director.
The bulk of NIH’s budget, about 83%, goes out to the extramural research community through
grants, contracts, and other awards. The funding supports research performed by more than
300,000 non-federal scientists and technical personnel who work at more than 2,500 universities,
hospitals, medical schools, and other research institutions around the country and abroad.62
A
smaller proportion of the budget, about 11%, supports the intramural research programs of the
NIH institutes and centers, funding research performed by NIH scientists and non-employee
trainees in the NIH laboratories and Clinical Center. The remaining 6% funds various research
management, support, and facilities’ needs.
NIH derives its statutory authority from the
PHSA. Title III, Section 301 of the PHSA
grants the Secretary of HHS broad permanent
authority to conduct and sponsor research. In
addition, Title IV, “National Research
Institutes,” authorizes in greater detail various
activities, functions, and responsibilities of the
NIH Director and the institutes and centers.
All of the ICs are covered by specific
provisions in the PHSA, but they vary considerably in the amount of detail included in the
statutory language. There are few time-and-dollar authorization levels specified for individual
activities. Congress mandated a significant reorganization of IC responsibilities in the FY2012
Consolidated Appropriations Act (P.L. 112-74, Division F) by creating a new National Center for
Advancing Translational Sciences (NCATS) and eliminating the National Center for Research
Resources (NCRR). Activities relating to translational sciences from NCRR and many other ICs
were consolidated in NCATS, and NCRR’s other programs were moved to several other ICs and
the OD.
NIH gets almost its entire funding (99.5%) from annual discretionary appropriations. As shown in
Table 8, the annual Labor-HHS-ED appropriations act provides separate appropriations to 24 of
the ICs, the OD, and the Buildings and Facilities account. One of the ICs (Environmental Health
61 This section was written by Judith A. Johnson, Specialist in Biomedical Policy. 62 U.S. Department of Health and Human Services, FY2015 Budget in Brief, March 4, 2014, p. 39, http://www.hhs.gov/
budget/fy2015/fy-2015-budget-in-brief.pdf.
For more information
CRS Report R41705, The National Institutes of Health
(NIH): Background and Congressional Issues, by Judith A.
Johnson.
CRS Report R43341, NIH Funding: FY1994-FY2016, by
Judith A. Johnson.
CRS Report R43944, Federal Research and Development
Funding: FY2016, coordinated by John F. Sargent Jr.

Public Health Service Agencies: Overview and Funding (FY2010-FY2016)
Congressional Research Service 34
Sciences) also receives funding from the Interior/Environment appropriations act. In addition,
NIH receives a mandatory appropriation for type 1 diabetes research.
Agency Funding Since FY2010
NIH’s funding in FY2015 is about 5% below the FY2010 level. This decline can be viewed as
part of a broader funding trend that dates back to FY2003, the year Congress completed a five-
year doubling of NIH’s budget that resulted in the agency’s funding increasing from $13.6 billion
in FY1998 to $27.2 billion in FY2003.
Following the doubling period, NIH had several years of modest funding increases. Funding for
the agency peaked in FY2010 at $31.2 billion before decreasing in each of the next three years.
Overall, NIH’s budget has failed to keep pace with the rising cost of biomedical research—as
measured by the Biomedical Research and Development Price Index (BRDPI)—since the end of
the doubling period. In constant (i.e., BRDPI-adjusted) 2012 dollars, NIH funding in FY2015 is
22% lower than the FY2003 level.63
63 For more information, see CRS Report R43341, NIH Funding: FY1994-FY2016, by Judith A. Johnson.

CRS-35
Table 8. National Institutes of Health (NIH)
(Millions of Dollars, by Fiscal Year)
Institutes and Centers (ICs) 2010a 2011b 2012c 2013 2014 2015
2016
Request
Cancer (NCI) 5,098 5,059 5,067 4,783 4,932 4,953 5,098
Heart/Lung/Blood (NHLBI) 3,094 3,070 3,076 2,900 2,989 2,996 3,072
Dental/Craniofacial Research (NIDCR) 413 410 410 387 398 398 407
Diabetes/Digestive/Kidney (NIDDK)d 1,959 1,942 1,945 1,835 1,884 1,749 1,788
Neurological Disorders/Stroke (NINDS) 1,634 1,622 1,625 1,532 1,589 1,605 1,660
Allergy/Infectious Diseases (NIAID)e 4,815 4,776 4,486 4,230 4,401 4,418 4,615
General Medical Sciences (NIGMS) 2,048 2,034 2,428 2,291 2,362 1,657 1,587
Child Health/Human Development (NICHD) 1,327 1,318 1,320 1,245 1,283 1,287 1,318
Eye (NEI) 706 701 702 656 676 677 695
Environmental Health Sciences (NIEHS) 695 684 685 646 665 667 682
NIEHS, Interior/Environment appropriationf 79 79 79 75 77 77 77
Aging (NIA) 1,108 1,100 1,121 1,039 1,172 1,198 1,267
Arthritis/Musculoskeletal/Skin (NIAMS) 538 534 535 505 520 522 533
Deafness/Communication Disorders (NIDCD) 418 415 416 392 404 405 416
Mental Health (NIMH) 1,494 1,477 1,479 1,394 1,420 1,434 1,489
Drug Abuse (NIDA) 1,067 1,051 1,052 992 1,018 1,016 1,047
Alcohol Abuse/Alcoholism (NIAAA) 462 458 459 433 446 447 460
Nursing Research (NINR) 145 144 145 136 141 141 145
Human Genome Research (NHGRI) 524 511 513 483 498 499 515
Biomedical Imaging/Bioengineering (NIBIB) 316 314 338 319 327 327 337
Minority Health/Health Disparities (NIMHD) 211 210 276 260 268 271 282
Complementary/Integrative Health (NCCIH)g 129 128 128 121 124 124 128
[former] Center for Research Resources (NCRR) 1,267 1,258 — — — — —
Advancing Translational Sciences (NCATS) — — 575 542 634 633 660

CRS-36
Institutes and Centers (ICs) 2010a 2011b 2012c 2013 2014 2015
2016
Request
Fogarty International Center (FIC) 70 69 70 66 68 68 70
National Library of Medicine (NLM) 349 345 346 360 337 337 394
Office of Director (OD) 1,177 1,167 1,459 1,411 1,303 1,414 1,443
Buildings & Facilities (B&F) 100 50 125 118 128 129 129
Total, Program Level 31,243 30,926 30,860 29,151 30,070 30,311 31,311
Less Funds From Other Sources
PHS Evaluation Set-Asideh 8 8 8 8 8 715 847
Type 1 Diabetes Research (NIDDK)i 150 150 150 142 139 150 150
Total, Discretionary Budget Authority 31,084 30,767 30,702 29,001 29,923 29,446 30,314
Sources: Funding amounts for FY2010 are taken from the NIH FY2012 congressional budget justification. Amounts for FY2011 are from the FY2013 justification.
Amounts for FY2012 are from the FY2014 justification, available (along with older years) at http://officeofbudget.od.nih.gov/. Funding amounts for FY2013 are from the
FY2015 HHS Budget in Brief. Funding amounts for FY2014, FY2015, and FY2016 are taken from the FY2016 Justification of Estimates for Appropriation Committees, Vol.
1, Overview, table on “Budget Request for Institute and Center,” p.85 at http://officeofbudget.od.nih.gov/br.html.
Notes: FY2010 through FY2013 IC and NLM amounts are not comparable to FY2014 as they do not reflect transfers from ICs to NLM. FY2010 and FY2011 are not
adjusted for comparability for the NCATS/NCRR reorganization. Totals may differ from the sum of the components due to rounding.
a. FY2010 reflects real transfer of $1 million from HHS Office of the Secretary to NIMH, $4.6 million transfer to HRSA Ryan White program (Secretary’s authority),
and transfers among ICs for the Genes, Environment, and Health Initiative (NIH Director’s authority).
b. FY2011 reflects real transfer of almost $1 million from HHS Office of the Secretary to NIMH for the Interagency Autism Coordinating Committee.
c. FY2012 reflects Secretary’s transfer of $8.727 million to HRSA for Ryan White AIDS and Secretary’s net transfer of $18.273 million for Alzheimer’s disease
research to NIA from other ICs.
d. Amounts for NIDDK do not include mandatory funds for type 1 diabetes research (see note i).
e. FY2010 and FY2011 amounts include funds appropriated to NIAID for transfer to the Global Fund to Fight AIDS, Tuberculosis, and Malaria ($300 million in FY2010
and $297.3 million in FY2011). FY2010 amount also includes BioShield transfer of $304 million; for more information, see CRS Report R43607, The Project BioShield
Act: Issues for the 113th Congress, by Frank Gottron.
f. This is a separate account in the Interior/Environment appropriations act for NIEHS research activities related to Superfund.
g. Reflects name change from National Center for Complementary and Alternative Medicine to National Center for Complementary and Integrative Health; provision
included in P.L. 113-235.
h. For each of FY2010 through FY2014, the $8 million in set-aside funds was allocated to NLM. All of the FY2015 set-aside funds (i.e., $715 million) were allocated to
NIGMS.
i. PHSA Section 330B provides an annual appropriation of $150 million through FY2017 for this program. These mandatory funds were subject to sequestration in
FY2013 and FY2014, but not in FY2015 or FY2016 (as discussed earlier in the report).

Public Health Service Agencies: Overview and Funding (FY2010-FY2016)
Congressional Research Service 37
Substance Abuse and Mental Health Services
Administration (SAMHSA)64
Agency Overview
SAMHSA is the lead federal agency for increasing access to behavioral health services. It
supports community-based mental health and substance abuse treatment and prevention services
through formula grants to the states and U.S. territories and through competitive grant programs
that fund states, territories, tribal organizations, local communities, and private entities. SAMHSA
also engages in a range of other activities, such as technical assistance, data collection, and
workforce development.
SAMHSA and most of its programs and activities are authorized under Title V of the PHSA,
which organizes SAMHSA in three centers:
Center for Substance Abuse Treatment (CSAT)65
Center for Substance Abuse Prevention (CSAP)66
Center for Mental Health Services (CMHS)67
Each center has general statutory authority, called Programs of Regional and National
Significance (PRNS), under which it has established grant programs for states and communities
to address their important substance abuse and mental health needs. PHSA Title V also authorizes
a number of specific grant programs, referred to as categorical grants.
SAMHSA’s two largest grant programs are
separately authorized under PHSA Title XIX,
Part B. The Community Mental Health
Services block grant falls within CMHS.68
The
full amount of the Substance Abuse Prevention and Treatment block grant falls within CSAT,
although no less than 20% of each state’s block grant must be used for prevention.69
In addition to the three statutorily defined centers, SAMHSA’s budget reflects a fourth category,
“health surveillance and program support,” for other activities such as collecting data, providing
statistical and analytic support, raising public awareness, developing the behavioral health
workforce, and maintaining the National Registry of Evidence-based Programs and Practices.70
64 This section was written by Erin Bagalman, Analyst in Health Policy. 65 PHSA Title V, Part B, Subpart 1; 42 U.S.C. §§290bb et seq. 66 PHSA Title V, Part B, Subpart 2; 42 U.S.C. §§290bb-21 et seq. 67 PHSA Title V, Part B, Subpart 3; 42 U.S.C. §§290bb-31 et seq. 68 PHSA Title XIX, Part B, Subpart I; 42 U.S.C. §§300x et seq. 69 PHSA Title XIX, Part B, Subpart II; 42 U.S.C. §§300x-21 et seq. 70 In the Consolidated Appropriations Act, 2012 (P.L. 112-74, Division F, Title II; 125 Stat. 1073) and the
accompanying conference report (H.Rept. 112-331, pp. 1139-1142), Congress rejected proposed changes to
SAMHSA’s budget structure in the FY2012 budget request. Congress directed that future budget requests reflect the
structure of the three centers (i.e., CMHS, CSAT, and CSAP) and the Health Surveillance and Program Support
account. SAMHSA’s subsequent budget requests have reflected this structure.
For more information
CRS Report R43968, SAMHSA FY2016 Budget Request and
Funding History: A Fact Sheet, by Erin Bagalman.

Public Health Service Agencies: Overview and Funding (FY2010-FY2016)
Congressional Research Service 38
The last comprehensive reauthorization of SAMHSA and its programs occurred in 2000 as part of
the Children’s Health Act,71
which also added “charitable choice” provisions allowing religious
organizations to receive funding for substance abuse prevention and treatment services without
altering their religious character.72
Since 2000, Congress has expanded some of SAMHSA’s
programs and activities without taking up comprehensive reauthorization. Although
authorizations of appropriations for most of SAMHSA’s grant programs expired at the end of
FY2003, many of these programs continue to receive annual discretionary appropriations.
Agency Funding Since FY2010
From FY2010 through FY2015, SAMHSA’s program-level funding has generally hovered around
$3.6 billion, dropping to $3.4 billion in FY2013 due to sequestration and rebounding to $3.6
billion in FY2014 (see Table 9). The current (FY2015) distribution of funding across CMHS
(30%), CSAT (60%), CSAP (5%), and Health Surveillance and Program Support (5%) overstates
the amount allocated to substance abuse treatment and understates the amount allocated to
substance abuse prevention because CSAT’s funding reflects the entire amount of the Substance
Abuse Prevention and Treatment block grant, including the 20% set-aside for prevention. Relative
to FY2015 funding, the FY2016 request would increase program-level funding by 1% while
decreasing discretionary budget authority by 2%; it would make up the difference with increased
funding from the set-aside and PPHF transfers.
71 P.L. 106-310, Titles XXXI-XXXIV. 72 PHSA §1955, 42 U.S.C. §300x-65; PHSA §§581 et seq., 42 U.S.C. §§290kk et seq.
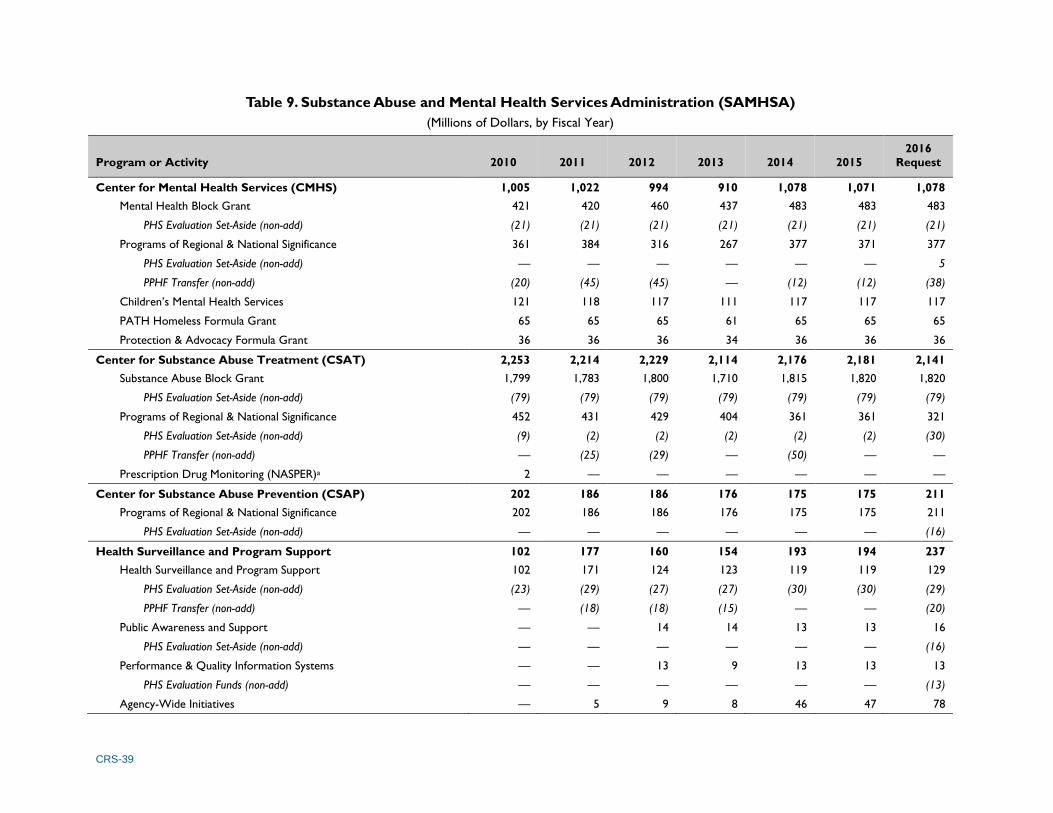
CRS-39
Table 9. Substance Abuse and Mental Health Services Administration (SAMHSA)
(Millions of Dollars, by Fiscal Year)
Program or Activity 2010 2011 2012 2013 2014 2015
2016
Request
Center for Mental Health Services (CMHS) 1,005 1,022 994 910 1,078 1,071 1,078
Mental Health Block Grant 421 420 460 437 483 483 483
PHS Evaluation Set-Aside (non-add) (21) (21) (21) (21) (21) (21) (21)
Programs of Regional & National Significance 361 384 316 267 377 371 377
PHS Evaluation Set-Aside (non-add) — — — — — — 5
PPHF Transfer (non-add) (20) (45) (45) — (12) (12) (38)
Children’s Mental Health Services 121 118 117 111 117 117 117
PATH Homeless Formula Grant 65 65 65 61 65 65 65
Protection & Advocacy Formula Grant 36 36 36 34 36 36 36
Center for Substance Abuse Treatment (CSAT) 2,253 2,214 2,229 2,114 2,176 2,181 2,141
Substance Abuse Block Grant 1,799 1,783 1,800 1,710 1,815 1,820 1,820
PHS Evaluation Set-Aside (non-add) (79) (79) (79) (79) (79) (79) (79)
Programs of Regional & National Significance 452 431 429 404 361 361 321
PHS Evaluation Set-Aside (non-add) (9) (2) (2) (2) (2) (2) (30)
PPHF Transfer (non-add) — (25) (29) — (50) — —
Prescription Drug Monitoring (NASPER)a 2 — — — — — —
Center for Substance Abuse Prevention (CSAP) 202 186 186 176 175 175 211
Programs of Regional & National Significance 202 186 186 176 175 175 211
PHS Evaluation Set-Aside (non-add) — — — — — — (16)
Health Surveillance and Program Support 102 177 160 154 193 194 237
Health Surveillance and Program Support 102 171 124 123 119 119 129
PHS Evaluation Set-Aside (non-add) (23) (29) (27) (27) (30) (30) (29)
PPHF Transfer (non-add) — (18) (18) (15) — — (20)
Public Awareness and Support — — 14 14 13 13 16
PHS Evaluation Set-Aside (non-add) — — — — — — (16)
Performance & Quality Information Systems — — 13 9 13 13 13
PHS Evaluation Funds (non-add) — — — — — — (13)
Agency-Wide Initiatives — 5 9 8 46 47 78
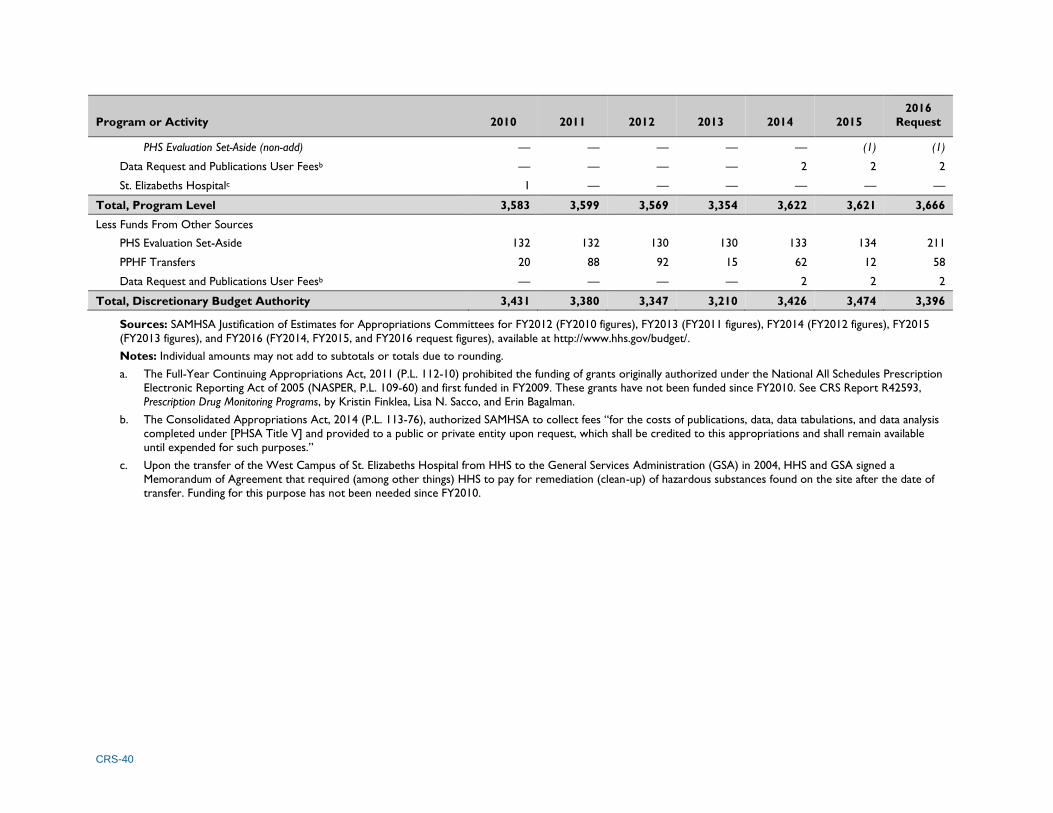
CRS-40
Program or Activity 2010 2011 2012 2013 2014 2015
2016
Request
PHS Evaluation Set-Aside (non-add) — — — — — (1) (1)
Data Request and Publications User Feesb — — — — 2 2 2
St. Elizabeths Hospitalc 1 — — — — — —
Total, Program Level 3,583 3,599 3,569 3,354 3,622 3,621 3,666
Less Funds From Other Sources
PHS Evaluation Set-Aside 132 132 130 130 133 134 211
PPHF Transfers 20 88 92 15 62 12 58
Data Request and Publications User Feesb — — — — 2 2 2
Total, Discretionary Budget Authority 3,431 3,380 3,347 3,210 3,426 3,474 3,396
Sources: SAMHSA Justification of Estimates for Appropriations Committees for FY2012 (FY2010 figures), FY2013 (FY2011 figures), FY2014 (FY2012 figures), FY2015
(FY2013 figures), and FY2016 (FY2014, FY2015, and FY2016 request figures), available at http://www.hhs.gov/budget/.
Notes: Individual amounts may not add to subtotals or totals due to rounding.
a. The Full-Year Continuing Appropriations Act, 2011 (P.L. 112-10) prohibited the funding of grants originally authorized under the National All Schedules Prescription
Electronic Reporting Act of 2005 (NASPER, P.L. 109-60) and first funded in FY2009. These grants have not been funded since FY2010. See CRS Report R42593,
Prescription Drug Monitoring Programs, by Kristin Finklea, Lisa N. Sacco, and Erin Bagalman.
b. The Consolidated Appropriations Act, 2014 (P.L. 113-76), authorized SAMHSA to collect fees “for the costs of publications, data, data tabulations, and data analysis
completed under [PHSA Title V] and provided to a public or private entity upon request, which shall be credited to this appropriations and shall remain available
until expended for such purposes.”
c. Upon the transfer of the West Campus of St. Elizabeths Hospital from HHS to the General Services Administration (GSA) in 2004, HHS and GSA signed a
Memorandum of Agreement that required (among other things) HHS to pay for remediation (clean-up) of hazardous substances found on the site after the date of
transfer. Funding for this purpose has not been needed since FY2010.

Public Health Service Agencies: Overview and Funding (FY2010-FY2016)
Congressional Research Service 41
Appendix A. American Recovery and Reinvestment
Act (ARRA): FY2009 Supplemental Appropriations Through ARRA, Congress appropriated a total of $22.4 billion in supplemental FY2009
discretionary appropriations for health and human services programs administered by HHS. Of
that total amount, $15.1 billion was provided directly to, or allocated for, programs and activities
administered by the PHS agencies (see text box below).73
In most instances the funding was to
remain available for obligation through the end of FY2010 (i.e., September 30, 2010). Essentially
all the ARRA discretionary funds provided to HHS have been obligated.74
ARRA Funding for PHS Agency Programs
Agency for Healthcare Research and Quality (AHRQ): $1.1 billion
These funds were used to support comparative effectiveness research (now called patient-centered outcomes
research). Of the total amount: $300 million was administered by AHRQ; $400 million was transferred to NIH; and
the remaining $400 million was allocated at the discretion of the HHS Secretary and used primarily to develop the
infrastructure for comparative effectiveness research.
Health Resources and Services Administration (HRSA): $2.5 billion
These funds were used to support HRSA programs as follows: $1.5 billion for health center construction, renovation, equipment, and health information technology (HIT); $500 million to support new health center delivery sites and
service areas and expand services at existing sites; $300 million for the National Health Service Corps; and $200
million for HRSA’s health workforce programs.
Indian Health Service (IHS): $500 million
These funds were used to support the following IHS facility and infrastructure projects: $227 million for health
facilities construction; $100 million for maintenance and improvement; $85 million for HIT activities; $68 million for
sanitation facilities construction; and $20 million for health equipment, including HIT. [Note: IHS received an
additional $90 million in ARRA discretionary funds from the Environmental Protection Agency for sanitation facilities
construction.]
National Institutes of Health (NIH): $10 billion
These funds were used to support NIH activities as follows: $8.2 billion for intramural and extramural scientific
research; $1.3 billion for extramural research facility construction, renovation, and equipment; and $500 million for
the construction, repair, and improvement of NIH’s facilities. NIH also received a transfer of $400 million from
AHRQ for comparative effectiveness research (see above).
Prevention and Wellness Fund: $1 billion
These funds were used as follows: $300 million for CDC’s immunization program; $50 million for CDC and CMS to
support state and local efforts to reduce health care-associated infections; and $650 million for CDC to support an
evidence-based clinical and community-based prevention and wellness program—Communities Putting Prevention to
Work (CPPW)—focused on increasing levels of physical activity, improving nutrition, reducing obesity rates, and
decreasing smoking prevalence and exposure to secondhand smoke.
73 P.L. 111-5, 123 Stat. 115. The HHS appropriations were included in Title VIII (Labor-HHS-ED) of Division A of
ARRA. In addition to these discretionary appropriations, ARRA included several HHS mandatory spending provisions.
For more information, see CRS Report R40537, American Recovery and Reinvestment Act of 2009 (P.L. 111-5):
Summary and Legislative History, by Clinton T. Brass et al. 74 HHS maintains a Recovery Act website at http://www.hhs.gov/recovery/. It includes detailed implementation plans
for all the ARRA-funded programs, up-to-date information on ARRA obligations and outlays (by state), and links to
the Recovery Act websites maintained by individual HHS agencies.
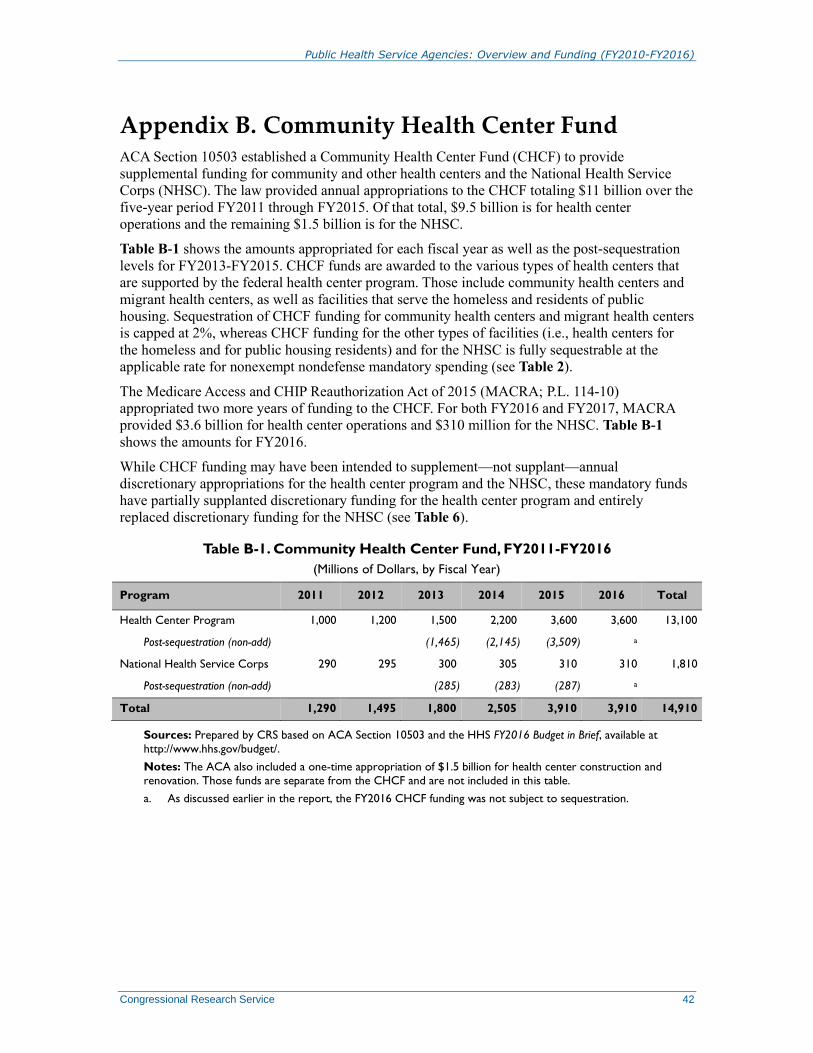
Public Health Service Agencies: Overview and Funding (FY2010-FY2016)
Congressional Research Service 42
Appendix B. Community Health Center Fund ACA Section 10503 established a Community Health Center Fund (CHCF) to provide
supplemental funding for community and other health centers and the National Health Service
Corps (NHSC). The law provided annual appropriations to the CHCF totaling $11 billion over the
five-year period FY2011 through FY2015. Of that total, $9.5 billion is for health center
operations and the remaining $1.5 billion is for the NHSC.
Table B-1 shows the amounts appropriated for each fiscal year as well as the post-sequestration
levels for FY2013-FY2015. CHCF funds are awarded to the various types of health centers that
are supported by the federal health center program. Those include community health centers and
migrant health centers, as well as facilities that serve the homeless and residents of public
housing. Sequestration of CHCF funding for community health centers and migrant health centers
is capped at 2%, whereas CHCF funding for the other types of facilities (i.e., health centers for
the homeless and for public housing residents) and for the NHSC is fully sequestrable at the
applicable rate for nonexempt nondefense mandatory spending (see Table 2).
The Medicare Access and CHIP Reauthorization Act of 2015 (MACRA; P.L. 114-10)
appropriated two more years of funding to the CHCF. For both FY2016 and FY2017, MACRA
provided $3.6 billion for health center operations and $310 million for the NHSC. Table B-1
shows the amounts for FY2016.
While CHCF funding may have been intended to supplement—not supplant—annual
discretionary appropriations for the health center program and the NHSC, these mandatory funds
have partially supplanted discretionary funding for the health center program and entirely
replaced discretionary funding for the NHSC (see Table 6).
Table B-1. Community Health Center Fund, FY2011-FY2016
(Millions of Dollars, by Fiscal Year)
Program 2011 2012 2013 2014 2015 2016 Total
Health Center Program 1,000 1,200 1,500 2,200 3,600 3,600 13,100
Post-sequestration (non-add) (1,465) (2,145) (3,509) a
National Health Service Corps 290 295 300 305 310 310 1,810
Post-sequestration (non-add) (285) (283) (287) a
Total 1,290 1,495 1,800 2,505 3,910 3,910 14,910
Sources: Prepared by CRS based on ACA Section 10503 and the HHS FY2016 Budget in Brief, available at
http://www.hhs.gov/budget/.
Notes: The ACA also included a one-time appropriation of $1.5 billion for health center construction and
renovation. Those funds are separate from the CHCF and are not included in this table.
a. As discussed earlier in the report, the FY2016 CHCF funding was not subject to sequestration.
Public Health Service Agencies: Overview and Funding (FY2010-FY2016)
Congressional Research Service 43
Appendix C. Prevention and Public Health Fund
(PPHF) ACA Section 4002 established the Prevention and Public Health Fund (PPHF), to be administered
by the HHS Secretary, and provided it with a permanent annual appropriation. Under the ACA,
PPHF’s annual appropriation would increase from $500 million for FY2010 to $2 billion for
FY2015 and each subsequent fiscal year. However, the Middle Class Tax Relief and Job Creation
Act of 2012 amended the ACA by reducing the PPHF appropriation from FY2013 through
FY2021 as part of a package of offsets to partly cover the costs of the law.75
The PPHF annual
appropriation is now $1 billion through FY2017, and thereafter will increase in increments to $2
billion for FY2022 and each subsequent fiscal year.
The HHS Secretary is instructed to transfer amounts from the PPHF to agencies for prevention,
wellness, and public health activities. The funds are available to the Secretary at the beginning of
each fiscal year. The Administration’s annual budget sets out the intended distribution and use of
PPHF funds for that fiscal year. The Secretary determined the distribution of PPHF funds for
FY2010 through FY2013. For FY2014 and FY2015 funds, Congress explicitly directed the
distribution of PPHF funds, prohibiting the Secretary from making further transfers.76
As discussed earlier in the report, the PPHF appropriation is fully sequestrable at the applicable
percentage rate for nonexempt nondefense mandatory spending (see Table 2). Sequestration is
applied to the entire appropriation by the Secretary before funds are transferred to the agencies.
The distribution of PPHF funds to HHS agencies for FY2010 through the FY2016 President’s
budget proposal is presented in Table C-1. Further details regarding PPHF distributions to
AHRQ, CDC, HRSA, and SAMHSA are provided in the respective agency budget tables in the
body of this report.77
For FY2013, the Secretary transferred almost half of available PPHF funds to CMS for ACA
implementation, as shown in Table C-1. This transfer reduced the PPHF funds that had been
provided to some of the PHS agencies from what they had received for FY2012. Along with the
sequestration of discretionary funding in FY2013, the loss of PPHF funds that year had a
significant effect on CDC’s budget for FY2013.78
In determining the transfer of PPHF funds for FY2010 through FY2013, the Secretary funded a
mix of pre-existing programs and activities, and programs and activities newly authorized under
the ACA. In directing the distribution of FY2014 and FY2015 PPHF funds, Congress in most
cases provided PPHF funds to pre-existing programs and activities.
75 P.L. 112-96, Section 3205; 126 Stat. 194. 76 See, for FY2015, P.L. 113-235, Consolidated and Further Continuing Appropriations Act, 2015, Sec. 219 of general
provisions for Labor, Health and Human Services, and Education, 128 Stat. 2489. 77 See also references to the PPHF in text and tables in CRS Report RL33880, Funding for the Older Americans Act
and Other Aging Services Programs, by Angela Napili and Kirsten J. Colello. 78 CDC describes the trends in budget authority and PPHF transfers for the agency as a whole in an FY2015 budget fact
sheet (p. 2) at http://www.cdc.gov/fmo/topic/Budget%20Information/FY-2015-Fact-Sheets/CDC-Overview.pdf.
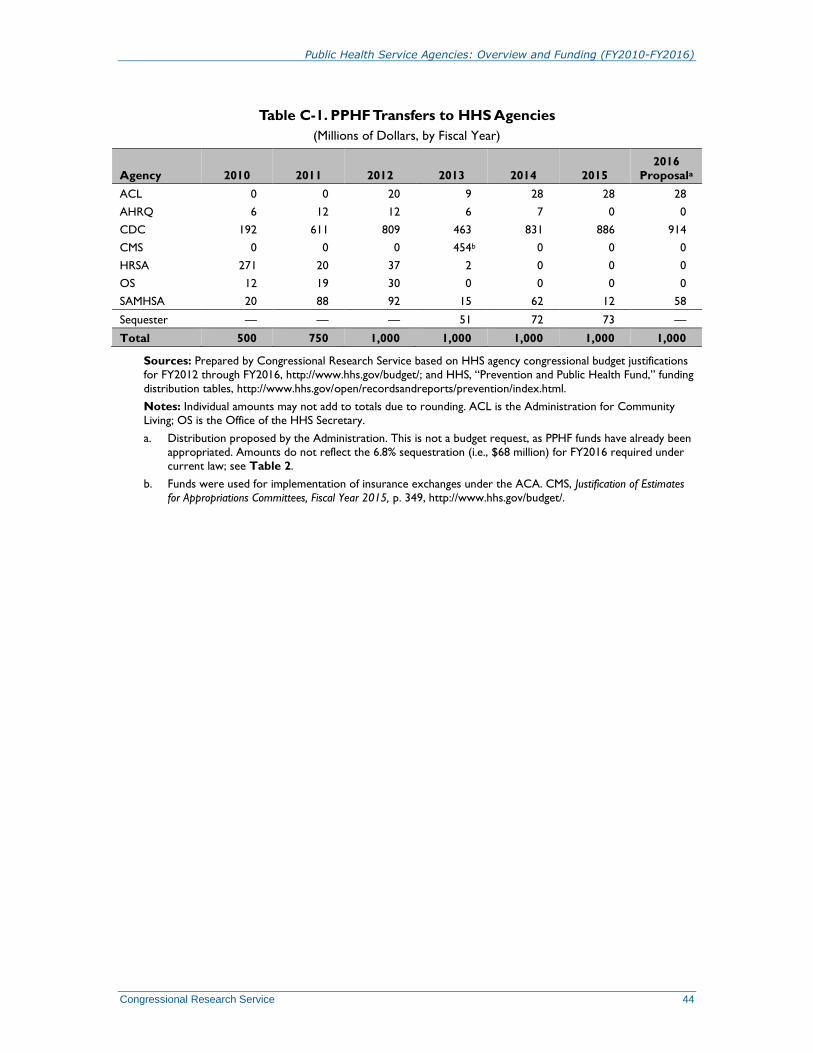
Public Health Service Agencies: Overview and Funding (FY2010-FY2016)
Congressional Research Service 44
Table C-1. PPHF Transfers to HHS Agencies
(Millions of Dollars, by Fiscal Year)
Agency 2010 2011 2012 2013 2014 2015
2016
Proposala
ACL 0 0 20 9 28 28 28
AHRQ 6 12 12 6 7 0 0
CDC 192 611 809 463 831 886 914
CMS 0 0 0 454b 0 0 0
HRSA 271 20 37 2 0 0 0
OS 12 19 30 0 0 0 0
SAMHSA 20 88 92 15 62 12 58
Sequester — — — 51 72 73 —
Total 500 750 1,000 1,000 1,000 1,000 1,000
Sources: Prepared by Congressional Research Service based on HHS agency congressional budget justifications
for FY2012 through FY2016, http://www.hhs.gov/budget/; and HHS, “Prevention and Public Health Fund,” funding
distribution tables, http://www.hhs.gov/open/recordsandreports/prevention/index.html.
Notes: Individual amounts may not add to totals due to rounding. ACL is the Administration for Community
Living; OS is the Office of the HHS Secretary.
a. Distribution proposed by the Administration. This is not a budget request, as PPHF funds have already been
appropriated. Amounts do not reflect the 6.8% sequestration (i.e., $68 million) for FY2016 required under
current law; see Table 2.
b. Funds were used for implementation of insurance exchanges under the ACA. CMS, Justification of Estimates
for Appropriations Committees, Fiscal Year 2015, p. 349, http://www.hhs.gov/budget/.

Public Health Service Agencies: Overview and Funding (FY2010-FY2016)
Congressional Research Service 45
Appendix D. Patient-Centered Outcomes Research
Trust Fund Section 6301(e) of the ACA established the Patient-Centered Outcomes Research Trust Fund
(PCORTF) to support comparative clinical effectiveness research at both HHS and the Patient-
Centered Outcomes Research Institute (PCORI).79
The law provided annual funding to the
PCORTF over the period FY2010-FY2019 from the following three sources: (1) annual
appropriations; (2) fees on health insurance and self-insured plans; and (3) transfers from the
Medicare Part A and Part B Trust Funds.
Specifically, the ACA appropriated the following amounts to the PCORTF: (1) $10 million for
FY2010; (2) $50 million for FY2011; and (3) $150 million for each of FY2012 through FY2019.
In addition, for each of FY2013 through 2019, the ACA appropriated an amount equivalent to the
net revenues from a new fee that the law imposes on health insurance policies and self-insured
plans. For policy/plan years ending during FY2013, the fee equals $1 multiplied by the number of
covered lives. For policy/plan years ending during each subsequent fiscal year through FY2019,
the fee equals $2 multiplied by the number of covered lives. Finally, transfers to PCORTF from
the Medicare Part A and Part B trust funds are calculated by multiplying the average number of
individuals entitled to benefits under Medicare Part A, or enrolled in Medicare Part B, by $1 (for
FY2013) or by $2 (for each of fiscal years 2014 through 2019).
For each of FY2011 through FY2019, the ACA requires 80% of the PCORTF funds to be made
available to PCORI, and the remaining 20% of funds to be transferred to the HHS Secretary for
carrying out PHSA Section 937.80
Of the total amount transferred to HHS, 80% is to be
distributed to AHRQ. Table D-1 shows the allocation of PCORTF funds through FY2016.
Table D-1. Distribution of PCORTF Funding
(Millions of Dollars, by Fiscal Year)
Funding Recipient 2010 2011 2012 2013 2014
2015
Est.
2016
Est.
PCORI 10 40 120 289 376 506 578
HHS — 10 30 72 94 127 145
AHRQ (non-add) — (8) (24) (58) (75) (102) (116)
Office of the Secretary
(non-add)
— (2) (6) (14) (19) (25) (29)
Total 10 50 150 361 470 633 723
Source: CRS calculations using data provided in Office of Management and Budget, Budget of the U.S.
Government, Appendix (FY2013-FY2016).
79 PCORI (established by ACA Section 6301(a), adding new SSA Section 1181) is a non-governmental body
authorized by Congress to evaluate existing research and to conduct original research examining the relative health
outcomes, clinical effectiveness, and appropriateness of different medical treatments. 80 ACA Section 6301(b) added a new PHSA Section 937 requiring the broad dissemination of research findings
published by PCORI. See Table 3.

Public Health Service Agencies: Overview and Funding (FY2010-FY2016)
Congressional Research Service 46
Appendix E. FDA User Fee Authorizations
Table E-1. FDA User Fee Authorizations and Revenue
(Dollars in Millions, In Order of FY2015 Anticipated Revenue)
User Fee Initial Authorizing Legislation and Year
FY2015
Revenue
Prescription drug Prescription Drug User Fee Act (PDUFA), 1992
(P.L. 102-300)
798
Tobacco product Family Smoking Prevention and Tobacco Control Act, 2009
(P.L. 111-31)
566
Generic drug Food and Drug Administration Safety and Innovation Act (FDASIA), 2012
(P.L. 112-144)
312
Medical device Medical Device User Fee and Modernization Act (MDUFMA), 2002
(P.L. 107-250)
128
Animal drug Animal Drug User Fee Act (ADUFA), 2003
(P.L. 108-130)
22
Biosimilars Food and Drug Administration Safety and Innovation Act (FDASIA), 2012
(P.L. 112-144)
21
Mammography Mammography Quality Standards Act (MQSA), 1992
(P.L. 102-539)
20
Color certification Color Additive Amendments of 1960
(P.L. 86-618)
8
Rare pediatric
disease priority
review voucher
Prescription Drug User Fee Amendments of 2012
(P.L. 112-144)
8
Animal generic drug Animal Generic Drug User Fee Act (AGDUFA), 2008
(P.L. 110-316)
7
Food reinspection Food Safety Modernization Act (FSMA), 2011
(P.L. 111-353)
6
Voluntary qualified
importer (VQIP)
Food Safety Modernization Act (FSMA), 2011
(P.L. 111-353)
5
Export certification FDA Export Reform and Enhancement Act of 1996 [for medical products]
(P.L. 104-134);
Food Safety Modernization Act (FSMA), 2011 [for foods]
(P.L. 111-353)
5
Food recall Food Safety Modernization Act (FSMA), 2011
(P.L. 111-353)
1
Outsourcing facility Drug Quality and Security Act (DQSA), 2013
(P.L. 113-54)
1
Tropic disease
priority review
voucher
Food and Drug Administration Amendments Act (FDAAA), 2007
(P.L. 110-85)
0
Total 1,909
Source: FY 2016 FDA Justification of Estimates for Appropriations Committees, All Purpose Table,
http://www.fda.gov/downloads/AboutFDA/ReportsManualsForms/Reports/BudgetReports/UCM437622.pdf.

Public Health Service Agencies: Overview and Funding (FY2010-FY2016)
Congressional Research Service 47
Author Contact Information
C. Stephen Redhead, Coordinator
Specialist in Health Policy
[email protected], 7-2261
Sarah A. Lister
Specialist in Public Health and Epidemiology
[email protected], 7-7320
Agata Dabrowska, Coordinator
Analyst in Health Policy
[email protected], 7-9455
Bernice Reyes-Akinbileje
Analyst in Health Resources and Services
[email protected], 7-2260
Erin Bagalman
Analyst in Health Policy
[email protected], 7-5345
Amanda K. Sarata
Specialist in Health Policy
[email protected], 7-7641
Elayne J. Heisler
Specialist in Health Services
[email protected], 7-4453
Susan Thaul
Specialist in Drug Safety and Effectiveness
[email protected], 7-0562
Judith A. Johnson
Specialist in Biomedical Policy
[email protected], 7-7077
Acknowledgments
The figures in the funding tables in this report were reviewed by Leah Rosenstiel, Research Assistant.
Key Policy Staff
Area of Expertise Name Phone Email
Agency for Healthcare Research and
Quality (AHRQ)
Amanda K. Sarata 7-7641 [email protected]
Centers for Disease Control and
Prevention (CDC)
Sarah A. Lister 7-7320 [email protected]
Food and Drug Administration (FDA) Susan Thaul
Agata Dabrowska
7-0562 [email protected]
Health Resources and Services
Administration (HRSA)
Elayne J. Heisler
Bernice Reyes Akinbileje
7-4453
7-2260
Indian Health Service (IHS) Elayne J. Heisler 7-4453 [email protected]
National Institutes of Health (NIH) Judy A. Johnson 7-7077 [email protected]
Substance Abuse and Mental Health
Services Administration (SAMHSA)
Erin Bagalman 7-5345 [email protected]
HHS budget and appropriations,
sequestration
C. Stephen Redhead 7-2261 [email protected]