Embed Size (px)
Citation preview
Public Health Models to Address HIV at the Local and National Levels
Presentation to the African-AmericanHIV UniversityAugust 25, 2015
Mario J. Perez, DirectorDivision of HIV and STD ProgramsLos Angeles County Department of Public Health
Quick Overview
• Role of a Local Public Health Department• Los Angeles County Overview • Epidemiology Overview• Overview of Goals, Strategies, and Activities• A Few Take Home Messages• Overview of NHAS: Updated to 2020
2
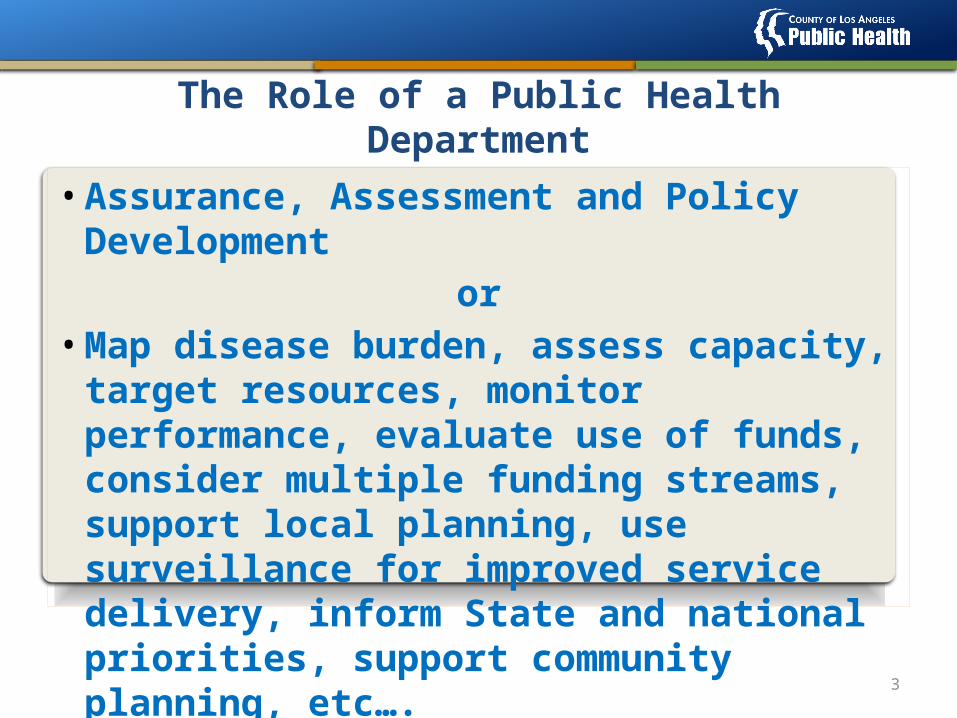
The Role of a Public Health Department
• Assurance, Assessment and Policy Developmentor
• Map disease burden, assess capacity, target resources, monitor performance, evaluate use of funds, consider multiple funding streams, support local planning, use surveillance for improved service delivery, inform State and national priorities, support community planning, etc….
3
Los Angeles County
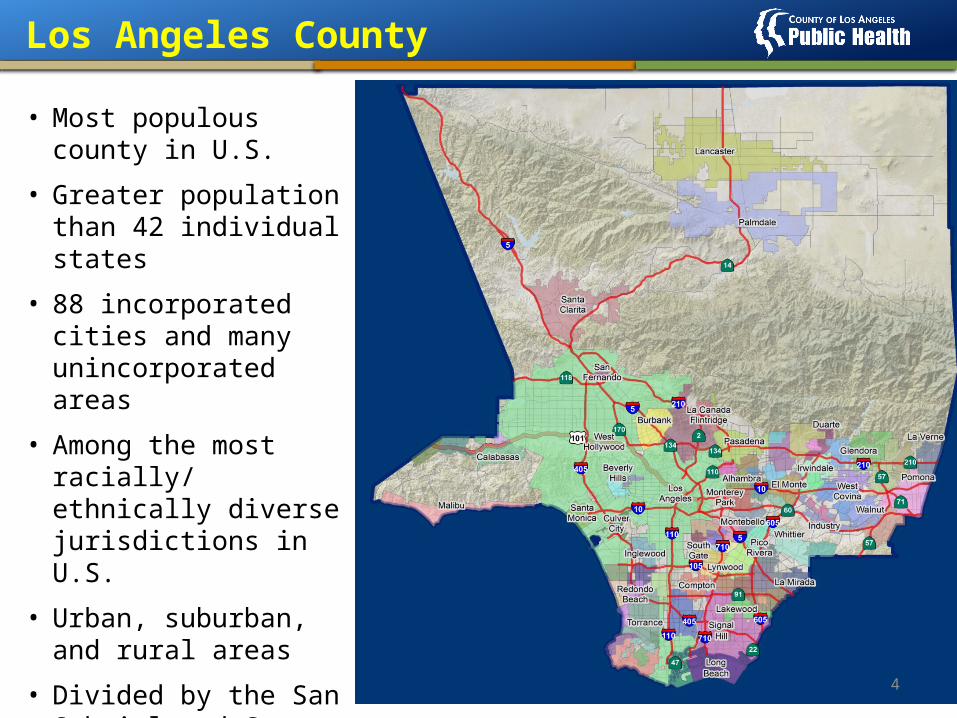
• Most populous county in U.S.
• Greater population than 42 individual states
• 88 incorporated cities and many unincorporated areas
• Among the most racially/ ethnically diverse jurisdictions in U.S.
• Urban, suburban, and rural areas
• Divided by the San Gabriel and Santa Monica mountain ranges
4
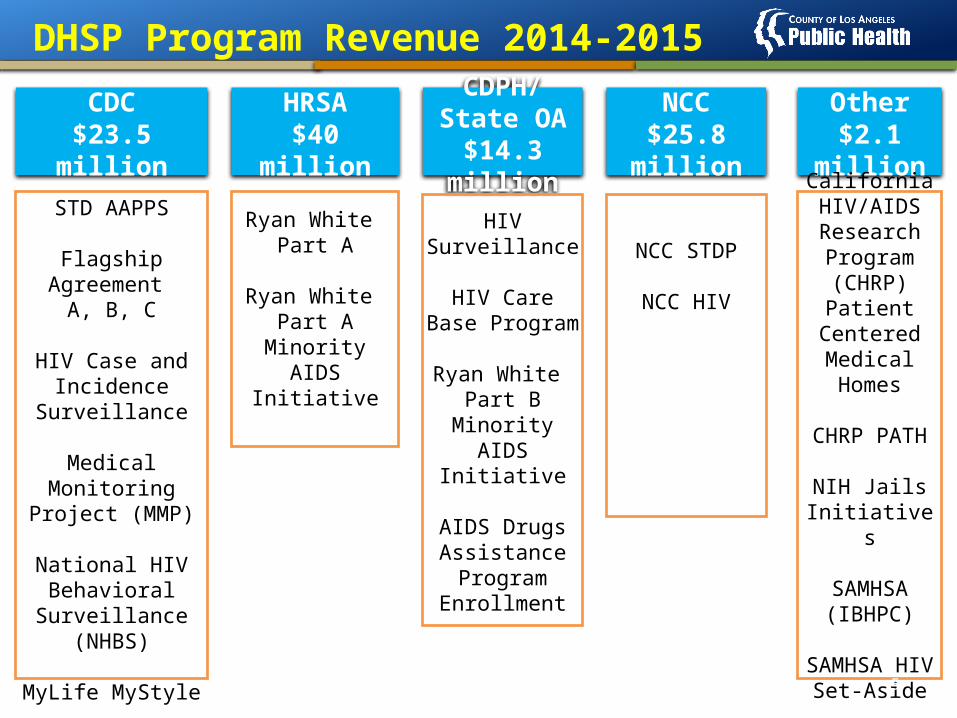
DHSP Program Revenue 2014-2015
CDC$23.5 million
STD AAPPS
Flagship Agreement/A, B, C
HIV Case and Incidence
Surveillance
Medical Monitoring Project (MMP)
National HIV Behavioral
Surveillance (NHBS)
MyLife MyStyle
HRSA$40 million
Ryan White Part A
Ryan White Part A Minority AIDS Initiative
CDPH/State OA
$14.3 million
HIV Surveillance
HIV Care Base Program
Ryan White Part B
Minority AIDS Initiative
AIDS Drugs Assistance Program
Enrollment
Other$2.1 million
California HIV/AIDS Research Program
(CHRP) Patient Centered
Medical Homes
CHRP PATH
NIH Jails Initiatives
SAMHSA (IBHPC)
SAMHSA HIV Set-Aside
NCC$25.8 million
NCC STDP
NCC HIV
5
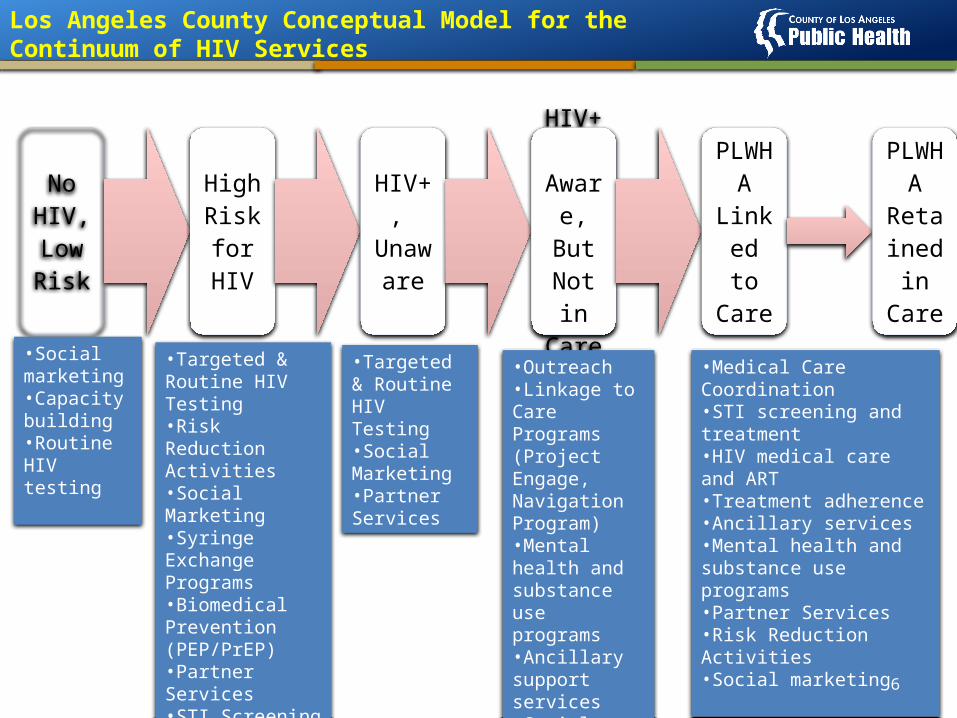
Los Angeles County Conceptual Model for theContinuum of HIV Services
No HIV,Low Risk
High Risk for HIV
HIV+, Unaw
are
HIV+ Aware, But Not in
Care
PLWHA
Linked to Care
PLWHA
Retained in
Care
•Social marketing•Capacity building•Routine HIV testing
•Targeted & Routine HIV Testing•Risk Reduction Activities•Social Marketing•Syringe Exchange Programs•Biomedical Prevention (PEP/PrEP)•Partner Services•STI Screening and Treatment
•Targeted & Routine HIV Testing•Social Marketing•Partner Services
•Outreach•Linkage to Care Programs (Project Engage, Navigation Program)•Mental health and substance use programs•Ancillary support services•Social Marketing
•Medical Care Coordination•STI screening and treatment•HIV medical care and ART•Treatment adherence•Ancillary services•Mental health and substance use programs•Partner Services•Risk Reduction Activities•Social marketing
6
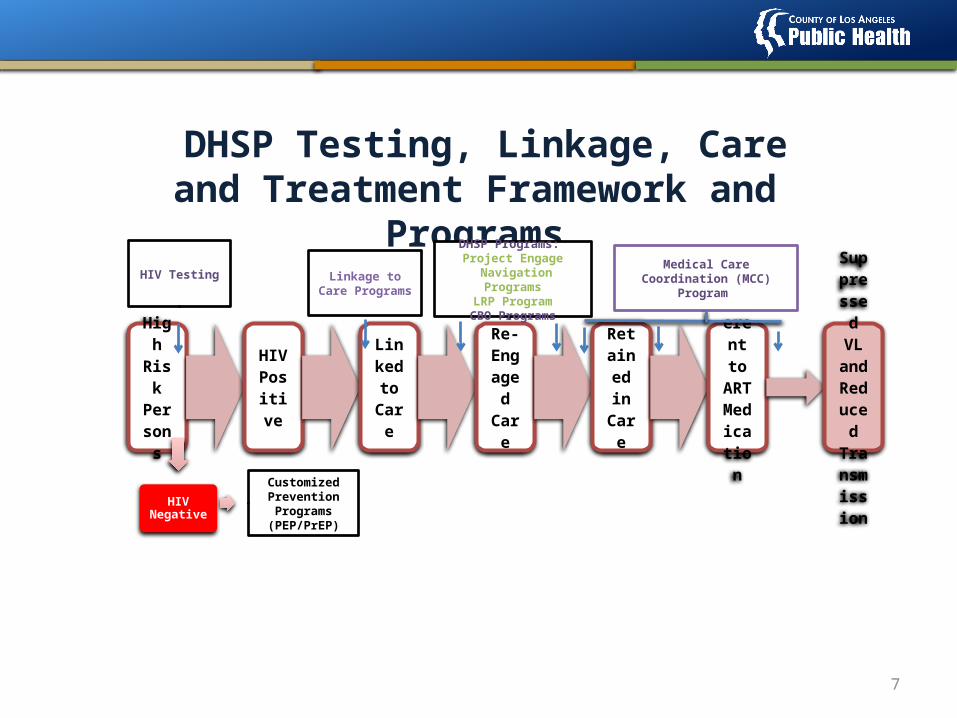
DHSP Testing, Linkage, Care and Treatment Framework and Programs
7
High
Risk Persons
HIV Positive
Linked to
Care
Re-Engage
d Care
Retained in Care
Adherent to
ART Medication
Suppressed VL
and Reduce
d Transmissio
n
HIV Negative
Customized Prevention Programs
(PEP/PrEP)
HIV Testing Linkage to Care Programs
DHSP Programs: Project Engage
Navigation ProgramsLRP Program
CBO Programs
Medical Care Coordination (MCC) Program
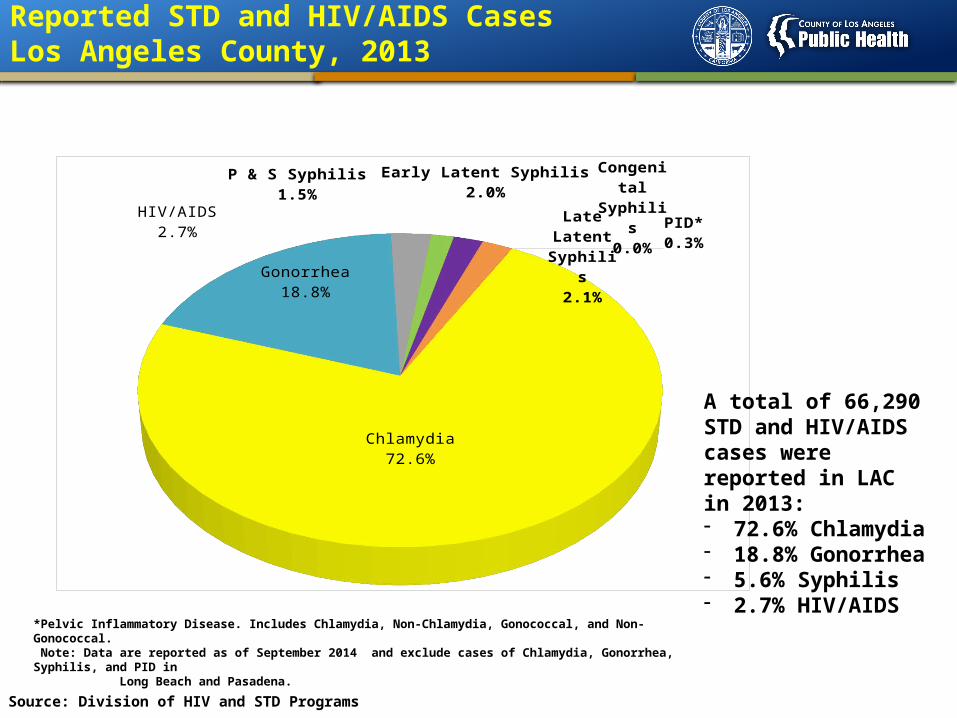
Reported STD and HIV/AIDS CasesLos Angeles County, 2013
Gonorrhea18.8%
HIV/AIDS2.7%
P & S Syphilis1.5%
Early Latent Syphilis2.0% Late La-
tent Syphilis
2.1%
Congeni-tal
Syphilis0.0%
PID*0.3%
Chlamydia72.6%
A total of 66,290 STD and HIV/AIDS cases were reported in LAC in 2013:- 72.6% Chlamydia- 18.8% Gonorrhea- 5.6% Syphilis- 2.7% HIV/AIDS
Source: Division of HIV and STD Programs
*Pelvic Inflammatory Disease. Includes Chlamydia, Non-Chlamydia, Gonococcal, and Non-Gonococcal. Note: Data are reported as of September 2014 and exclude cases of Chlamydia, Gonorrhea, Syphilis, and PID in Long Beach and Pasadena.
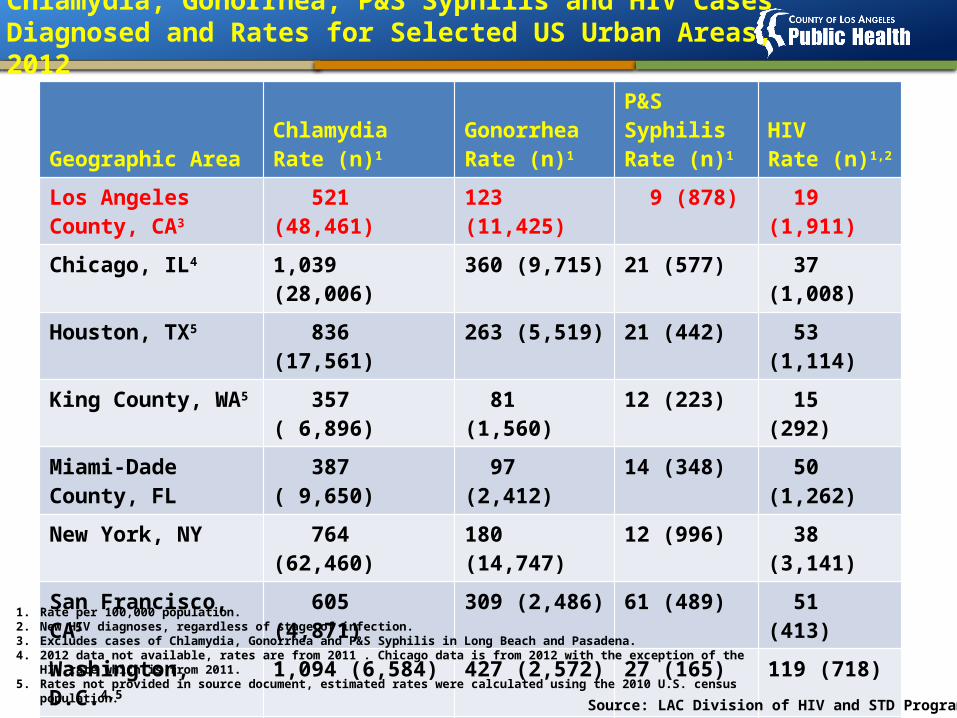
Chlamydia, Gonorrhea, P&S Syphilis and HIV Cases Diagnosed and Rates for Selected US Urban Areas, 2012
9
Geographic AreaChlamydia Rate (n)1
Gonorrhea Rate (n)1
P&S Syphilis Rate (n)1
HIVRate (n)1,2
Los Angeles County, CA3
521 (48,461) 123 (11,425) 9 (878) 19 (1,911)
Chicago, IL4 1,039 (28,006) 360 (9,715) 21 (577) 37 (1,008)
Houston, TX5 836 (17,561) 263 (5,519) 21 (442) 53 (1,114)
King County, WA5 357 ( 6,896) 81 (1,560) 12 (223) 15 (292)
Miami-Dade County, FL
387 ( 9,650) 97 (2,412) 14 (348) 50 (1,262)
New York, NY 764 (62,460) 180 (14,747) 12 (996) 38 (3,141)
San Francisco, CA5 605 (4,871) 309 (2,486) 61 (489) 51 (413)
Washington, D.C.4,5 1,094 (6,584) 427 (2,572) 27 (165) 119 (718)
United States 457 (1,422,976) 108 (334,820) 5 (15,667) *16 (42,181)
1. Rate per 100,000 population.2. New HIV diagnoses, regardless of stage of infection.3. Excludes cases of Chlamydia, Gonorrhea and P&S Syphilis in Long Beach and Pasadena.4. 2012 data not available, rates are from 2011 . Chicago data is from 2012 with the exception of the HIV rate which is from 2011.5. Rates not provided in source document, estimated rates were calculated using the 2010 U.S. census population.
Source: LAC Division of HIV and STD Programs
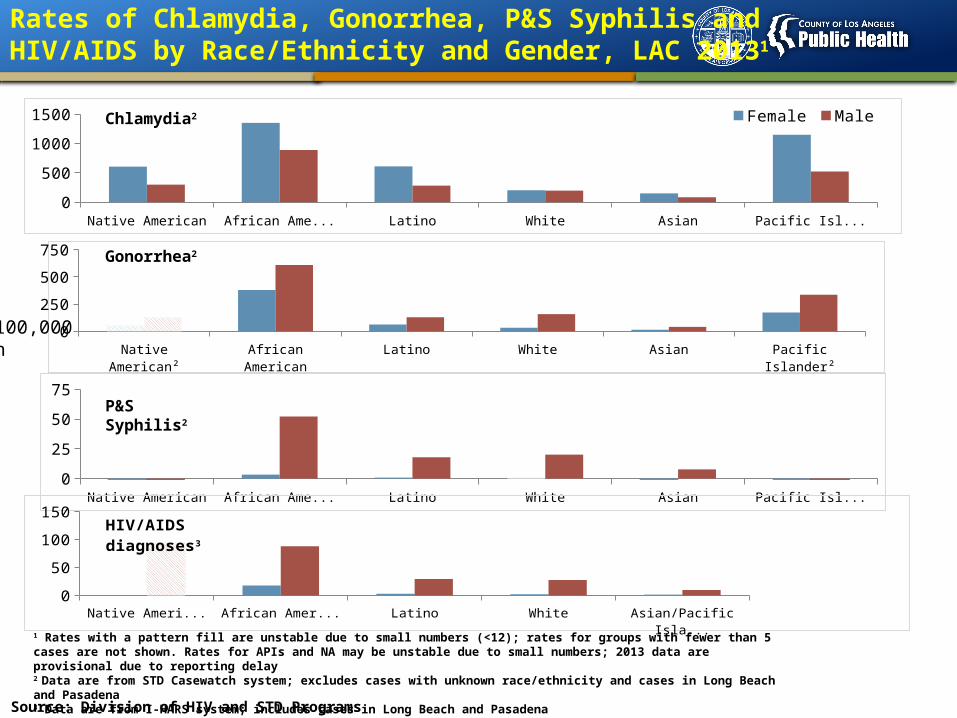
Rates of Chlamydia, Gonorrhea, P&S Syphilis and HIV/AIDS by Race/Ethnicity and Gender, LAC 20131
Native American African American Latino White Asian Pacific Islander0
500
1000
1500 Female Male
Native American² African American Latino White Asian Pacific Islander²0
250
500
750
Native American African American Latino White Asian Pacific Islander0
25
50
75
Chlamydia2
Gonorrhea2
P&S Syphilis2
1 Rates with a pattern fill are unstable due to small numbers (<12); rates for groups with fewer than 5 cases are not shown. Rates for APIs and NA may be unstable due to small numbers; 2013 data are provisional due to reporting delay2 Data are from STD Casewatch system; excludes cases with unknown race/ethnicity and cases in Long Beach and Pasadena3 Data are from I-HARS system; includes cases in Long Beach and Pasadena
Rat
e p
er 1
00,0
00 p
opu
latio
n
Native American² African American Latino White Asian/Pacific Islander0
50
100
150HIV/AIDS diagnoses3
Source: Division of HIV and STD Programs
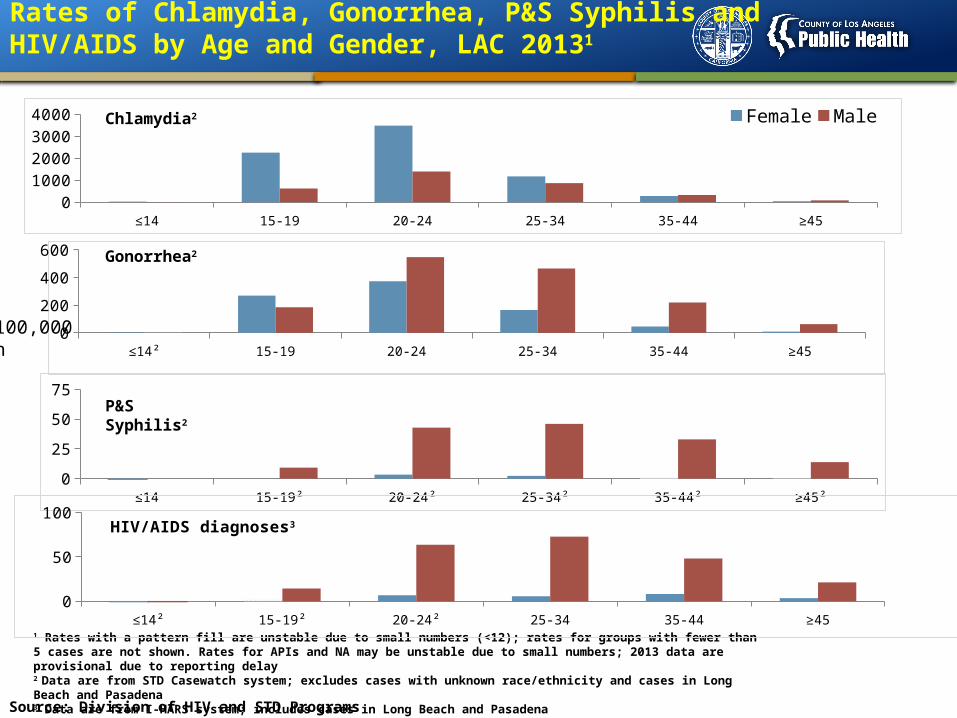
Rates of Chlamydia, Gonorrhea, P&S Syphilis and HIV/AIDS by Age and Gender, LAC 20131
≤14 15-19 20-24 25-34 35-44 ≥450
1000200030004000 Female Male
≤14² 15-19 20-24 25-34 35-44 ≥450
200
400
600
≤14 15-19² 20-24² 25-34² 35-44² ≥45²0
25
50
75
Chlamydia2
Gonorrhea2
P&S Syphilis2
1 Rates with a pattern fill are unstable due to small numbers (<12); rates for groups with fewer than 5 cases are not shown. Rates for APIs and NA may be unstable due to small numbers; 2013 data are provisional due to reporting delay2 Data are from STD Casewatch system; excludes cases with unknown race/ethnicity and cases in Long Beach and Pasadena3 Data are from I-HARS system; includes cases in Long Beach and Pasadena
Rat
e p
er 1
00,0
00 p
opu
latio
n
≤14² 15-19² 20-24² 25-34 35-44 ≥450
20406080
100HIV/AIDS diagnoses3
Source: Division of HIV and STD Programs
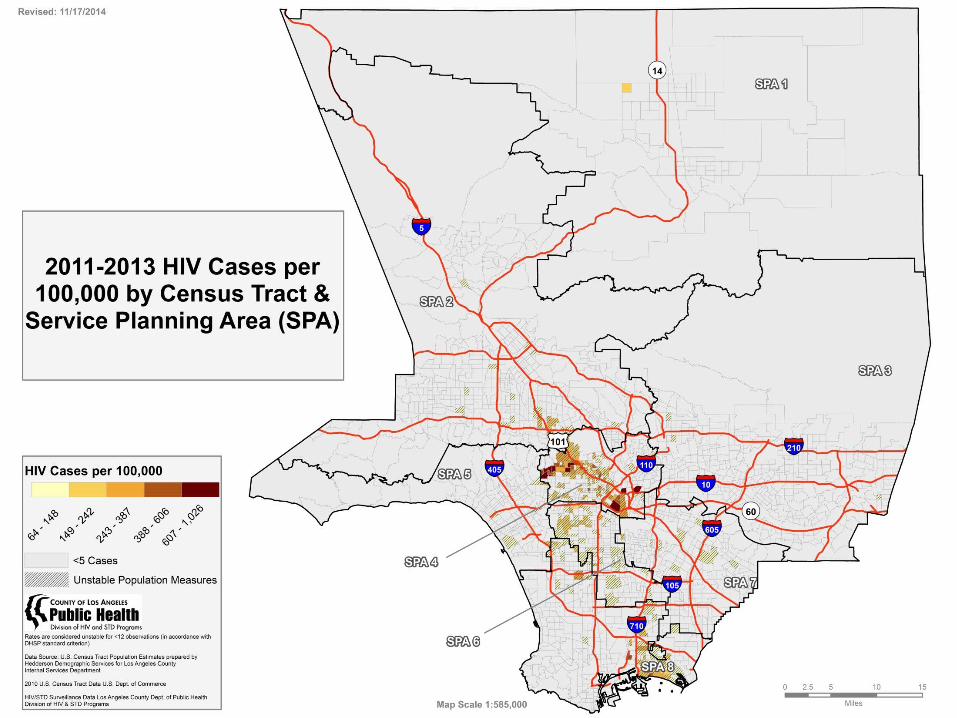
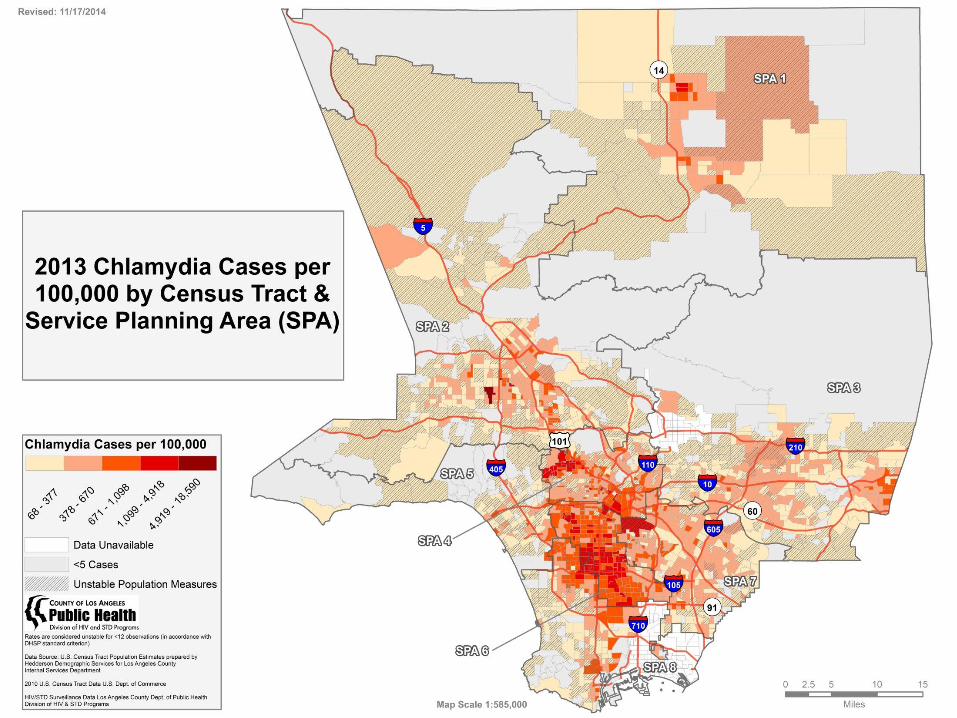
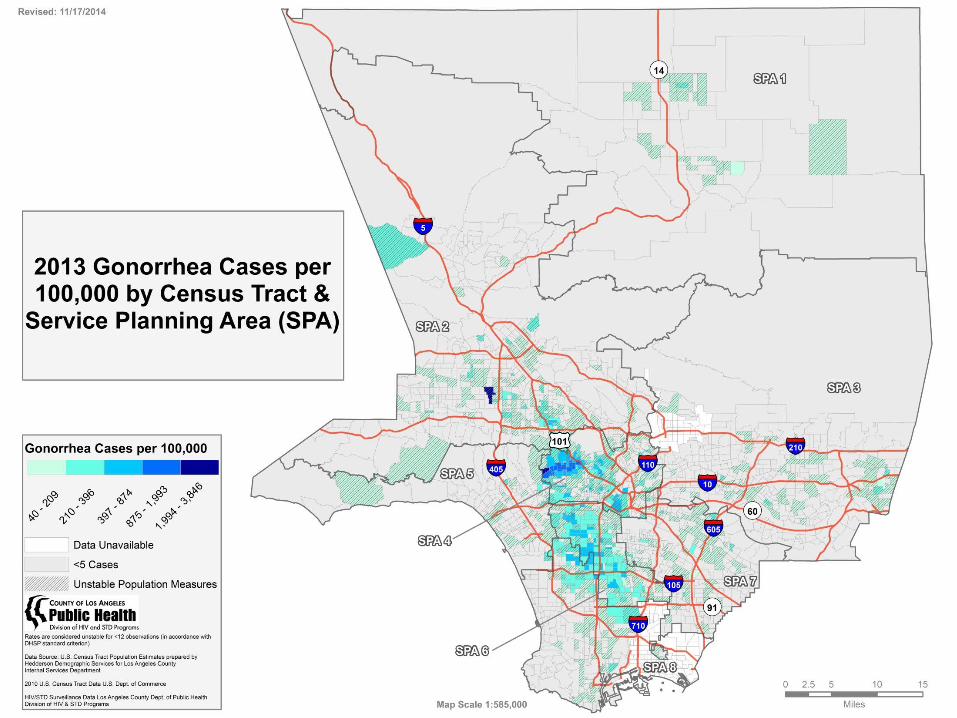
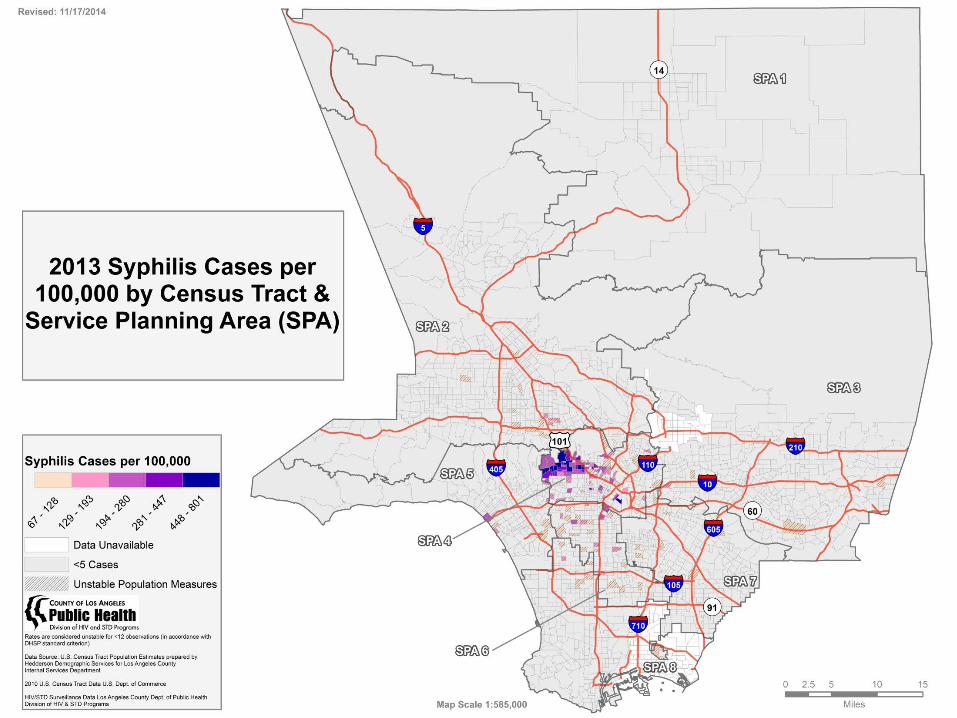
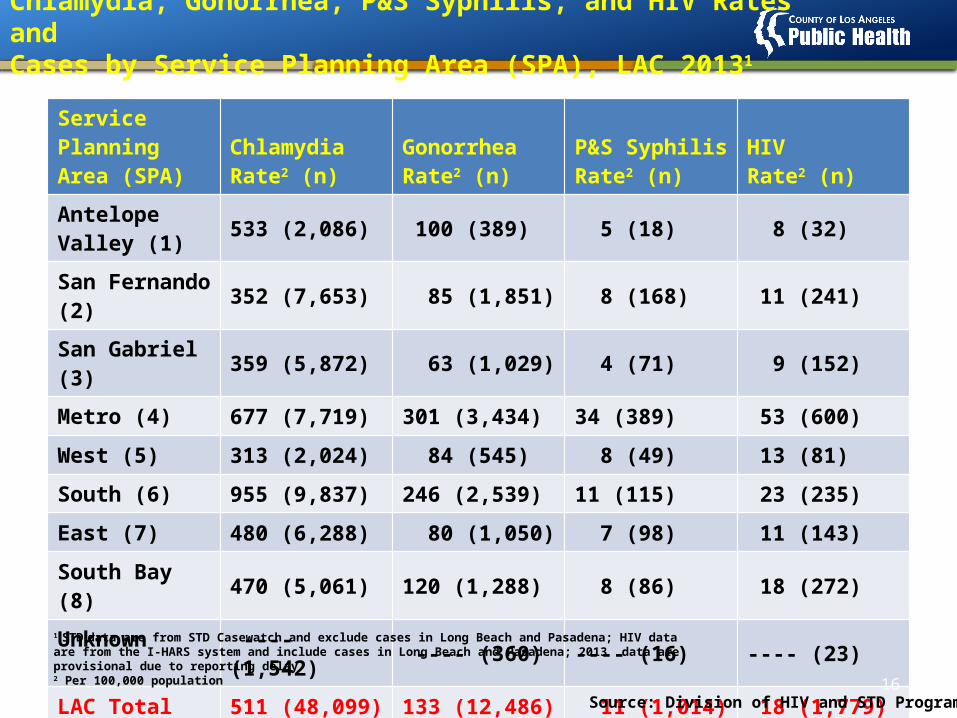
Chlamydia, Gonorrhea, P&S Syphilis, and HIV Rates and Cases by Service Planning Area (SPA), LAC 20131
Service Planning Area (SPA)
Chlamydia Rate2 (n)
GonorrheaRate2 (n)
P&S SyphilisRate2 (n)
HIVRate2 (n)
Antelope Valley (1) 533 (2,086) 100 (389) 5 (18) 8 (32)
San Fernando (2) 352 (7,653) 85 (1,851) 8 (168) 11 (241)
San Gabriel (3) 359 (5,872) 63 (1,029) 4 (71) 9 (152)
Metro (4) 677 (7,719) 301 (3,434) 34 (389) 53 (600)
West (5) 313 (2,024) 84 (545) 8 (49) 13 (81)
South (6) 955 (9,837) 246 (2,539) 11 (115) 23 (235)
East (7) 480 (6,288) 80 (1,050) 7 (98) 11 (143)
South Bay (8) 470 (5,061) 120 (1,288) 8 (86) 18 (272)
Unknown ---- (1,542) ---- (360) ---- (16) ---- (23)
LAC Total 511 (48,099) 133 (12,486) 11 (1,014) 18 (1,779)
16
1 STD data are from STD Casewatch and exclude cases in Long Beach and Pasadena; HIV data are from the I-HARS system and include cases in Long Beach and Pasadena; 2013 data are provisional due to reporting delay2 Per 100,000 population
Source: Division of HIV and STD Programs
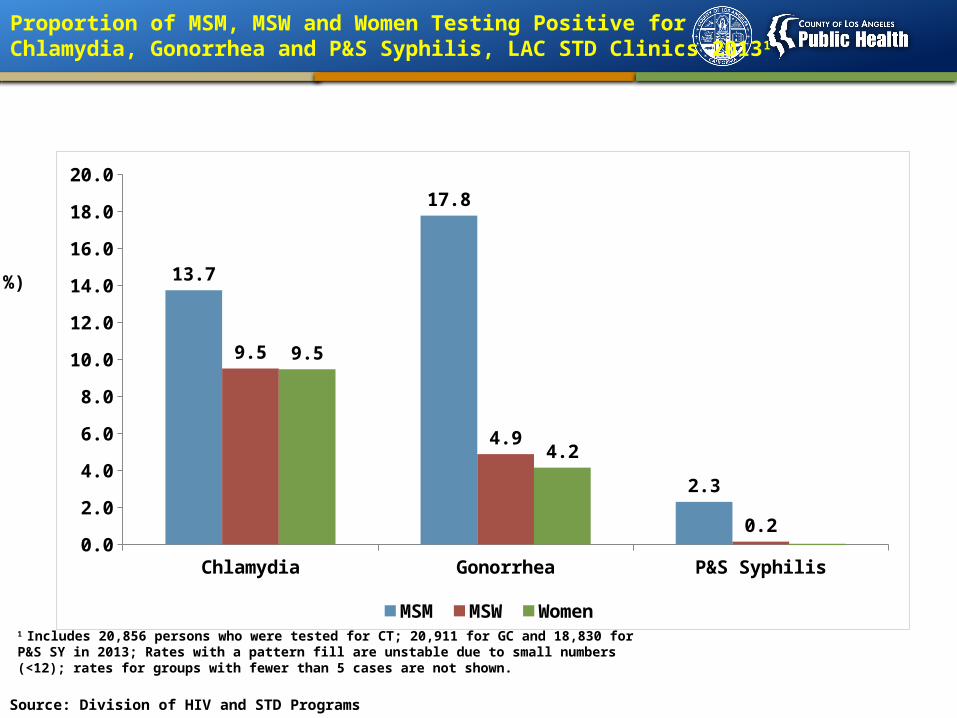
Proportion of MSM, MSW and Women Testing Positive for Chlamydia, Gonorrhea and P&S Syphilis, LAC STD Clinics 20131
Per
cen
t(%
)
Source: Division of HIV and STD Programs
Chlamydia Gonorrhea P&S Syphilis0.0
2.0
4.0
6.0
8.0
10.0
12.0
14.0
16.0
18.0
20.0
13.7
17.8
2.3
9.5
4.9
0.2
9.5
4.2
MSM MSW Women1 Includes 20,856 persons who were tested for CT; 20,911 for GC and 18,830 for P&S SY in 2013; Rates with a pattern fill are unstable due to small numbers (<12); rates for groups with fewer than 5 cases are not shown.
25,895
16,155
13,250
3,200
Estimate ~ 61,700 living
with HIV & AIDS in LAC
3,200
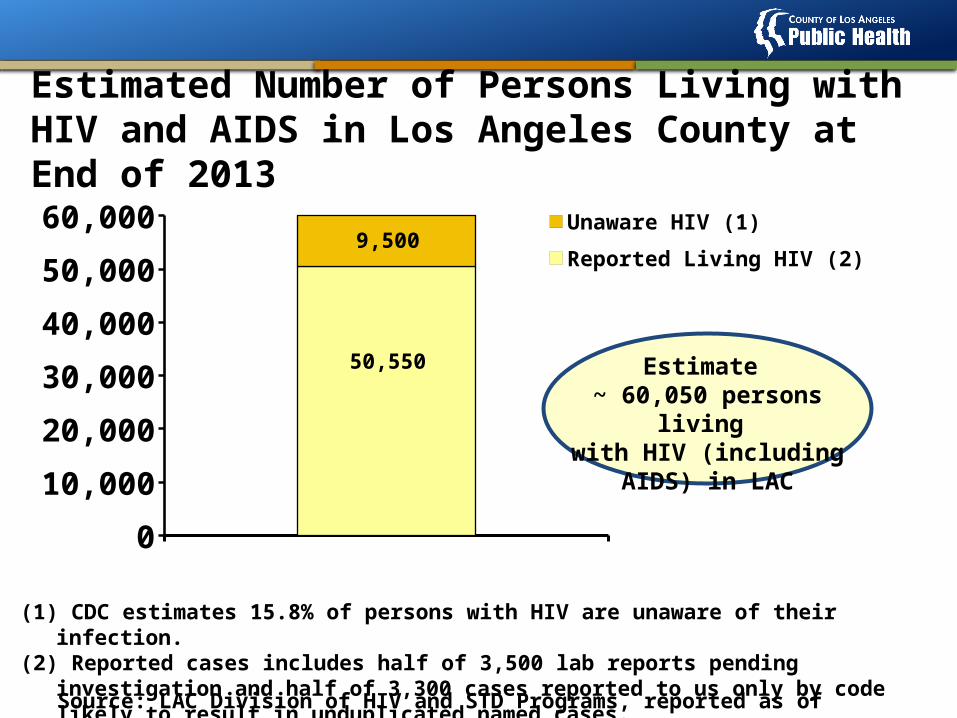
Estimated Number of Persons Living with HIV and AIDS in Los Angeles County at End of 2013
(1) CDC estimates 15.8% of persons with HIV are unaware of their infection.(2) Reported cases includes half of 3,500 lab reports pending investigation and half of
3,300 cases reported to us only by code likely to result in unduplicated named cases.
All Living HIV/AIDS0
10,000
20,000
30,000
40,000
50,000
60,000 Unaware HIV (1)
Reported Living HIV (2)
Estimate ~ 60,050 persons living
with HIV (including AIDS) in LAC
50,550
1,500
Source: LAC Division of HIV and STD Programs, reported as of 12/31/13.
9,500
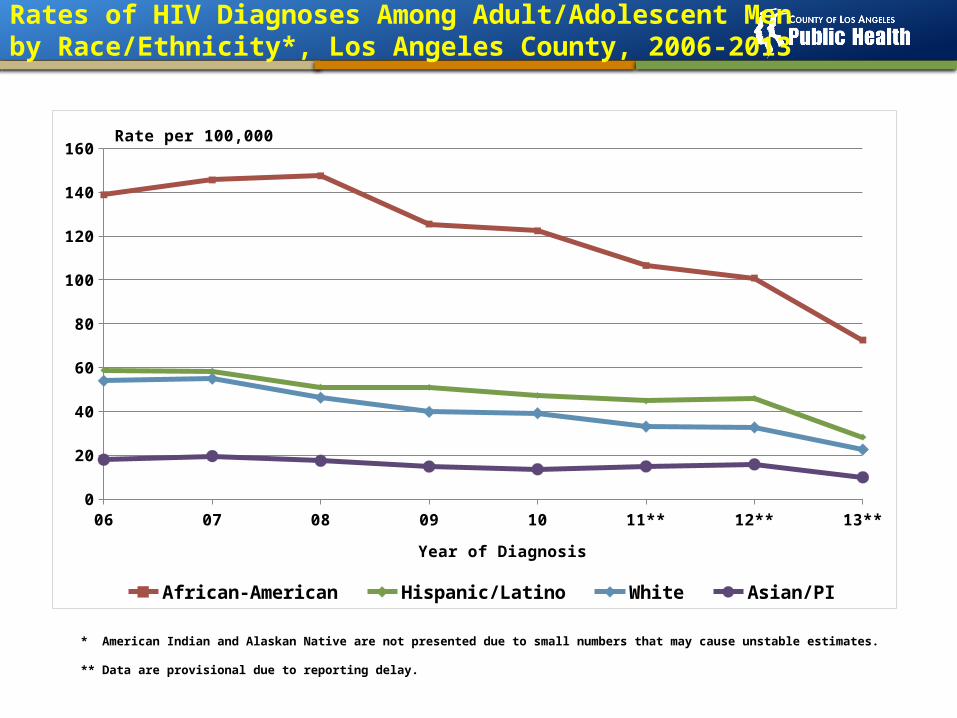
Rates of HIV Diagnoses Among Adult/Adolescent Menby Race/Ethnicity*, Los Angeles County, 2006-2013
06 07 08 09 10 11** 12** 13**0
20
40
60
80
100
120
140
160
African-American Hispanic/Latino White Asian/PI
Year of Diagnosis
Rate per 100,000
* American Indian and Alaskan Native are not presented due to small numbers that may cause unstable estimates. ** Data are provisional due to reporting delay.
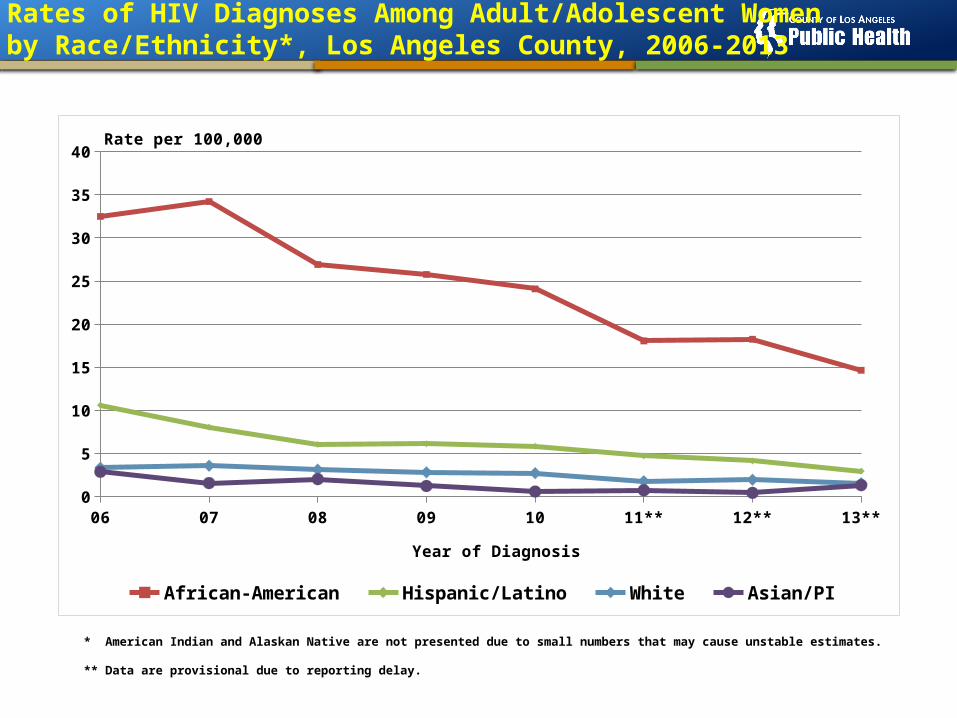
Rates of HIV Diagnoses Among Adult/Adolescent Women by Race/Ethnicity*, Los Angeles County, 2006-2013
* American Indian and Alaskan Native are not presented due to small numbers that may cause unstable estimates. ** Data are provisional due to reporting delay.
06 07 08 09 10 11** 12** 13**0
5
10
15
20
25
30
35
40
African-American Hispanic/Latino White Asian/PI
Year of Diagnosis
Rate per 100,000
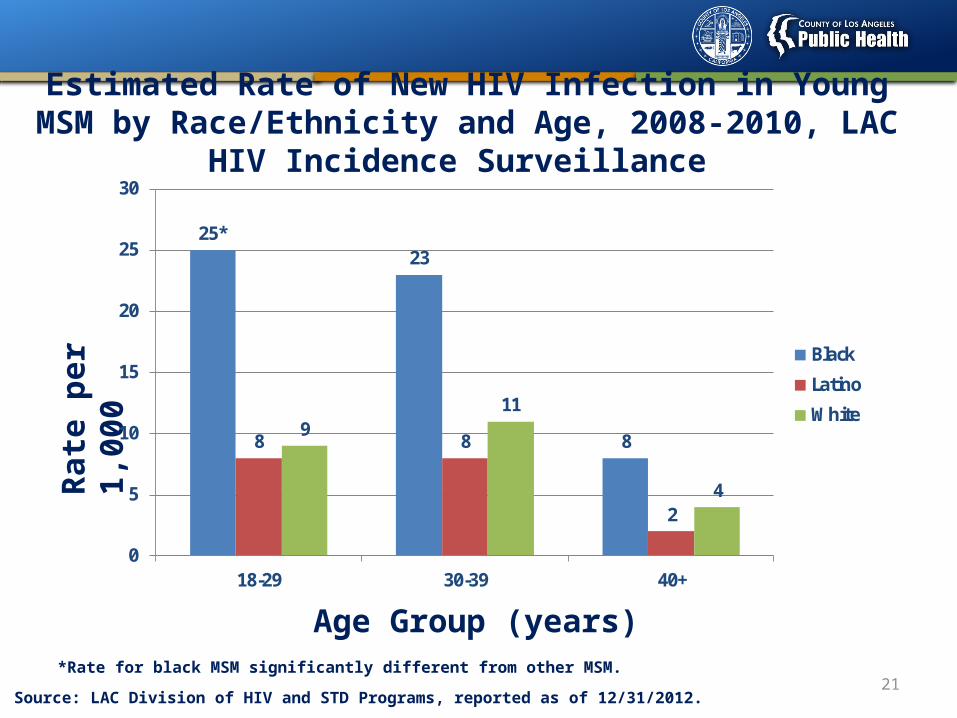
Estimated Rate of New HIV Infection in Young MSM by Race/Ethnicity and Age, 2008-2010, LAC HIV Incidence Surveillance
21
25*23
88 8
2
911
4
0
5
10
15
20
25
30
18-29 30-39 40+
Black
Latino
White
Rate
per
1,0
00
Age Group (years)*Rate for black MSM significantly different from other MSM.
Source: LAC Division of HIV and STD Programs, reported as of 12/31/2012.
22
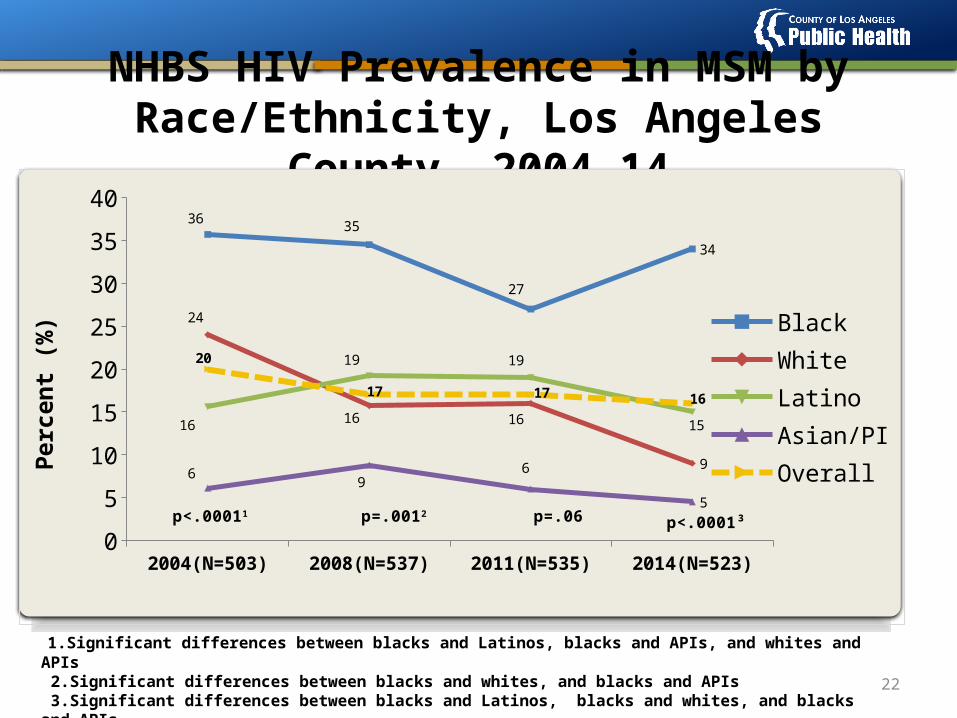
NHBS HIV Prevalence in MSM by Race/Ethnicity, Los Angeles County, 2004-14
2004(N=503) 2008(N=537) 2011(N=535) 2014(N=523)0
5
10
15
20
25
30
35
4036 35
27
34
24
16 16
9
16
19 19
15
69
6
5
20
17 17 16
Black WhiteLatinoAsian/PIOverall
Perc
ent (
%)
p=.0012p<.00011 p=.06 p<.0001³
1.Significant differences between blacks and Latinos, blacks and APIs, and whites and APIs 2.Significant differences between blacks and whites, and blacks and APIs 3.Significant differences between blacks and Latinos, blacks and whites, and blacks and APIs.
Estimate Infected (1)
Diagnosed
Linked to Care (2)
Retained in Care (3)
Prescribed ART (4)
Virally Suppressed (5)
0 20000 40000 60000
59,500
82%
66%/69%/71%
47%/56%
41%
45%
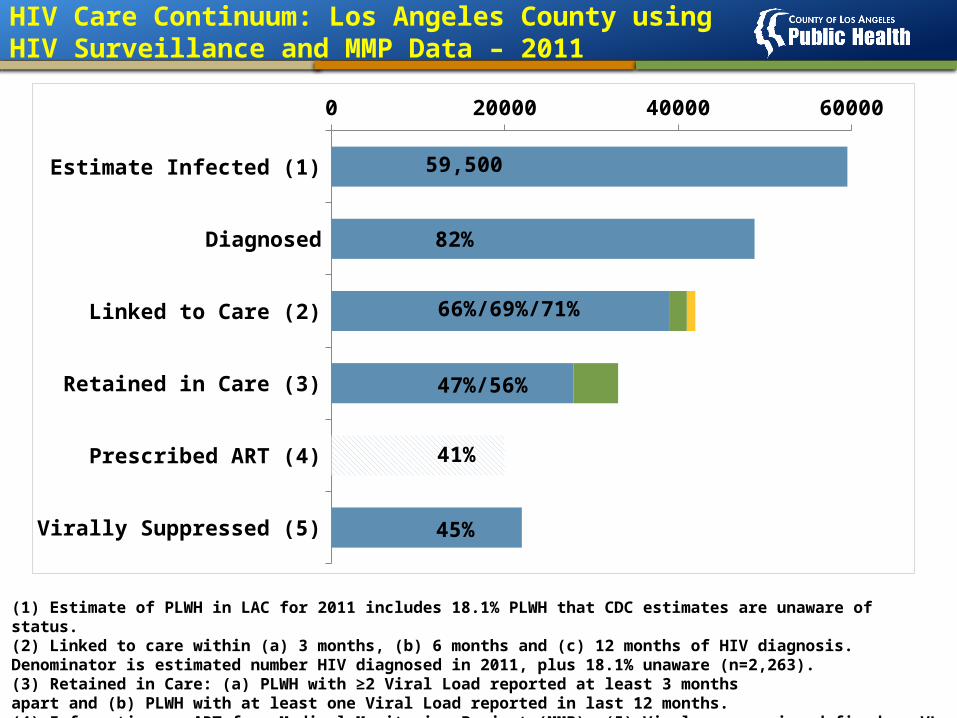
HIV Care Continuum: Los Angeles County using HIV Surveillance and MMP Data – 2011
(1) Estimate of PLWH in LAC for 2011 includes 18.1% PLWH that CDC estimates are unaware of status.(2) Linked to care within (a) 3 months, (b) 6 months and (c) 12 months of HIV diagnosis. Denominator is estimated number HIV diagnosed in 2011, plus 18.1% unaware (n=2,263).(3) Retained in Care: (a) PLWH with ≥2 Viral Load reported at least 3 months apart and (b) PLWH with at least one Viral Load reported in last 12 months.(4) Information on ART from Medical Monitoring Project (MMP). (5) Viral suppression defined as VL <200.
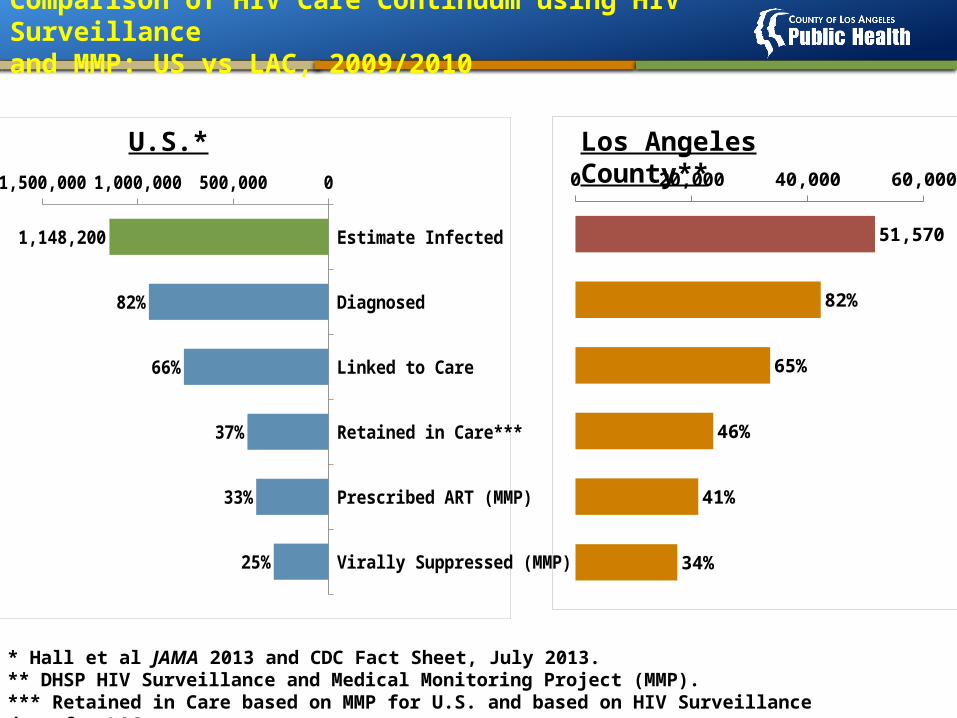
Comparison of HIV Care Continuum using HIV Surveillanceand MMP: US vs LAC, 2009/2010
Estimate Infected
Diagnosed
Linked to Care
Retained in Care***
Prescribed ART (MMP)
Virally Suppressed (MMP)
0500,0001,000,0001,500,000
1,148,200
82%
66%
37%
33%
25%
0 20,000 40,000 60,000
51,570
82%
65%
46%
41%
34%
* Hall et al JAMA 2013 and CDC Fact Sheet, July 2013.** DHSP HIV Surveillance and Medical Monitoring Project (MMP).*** Retained in Care based on MMP for U.S. and based on HIV Surveillance data for LAC.
U.S.* Los Angeles County**
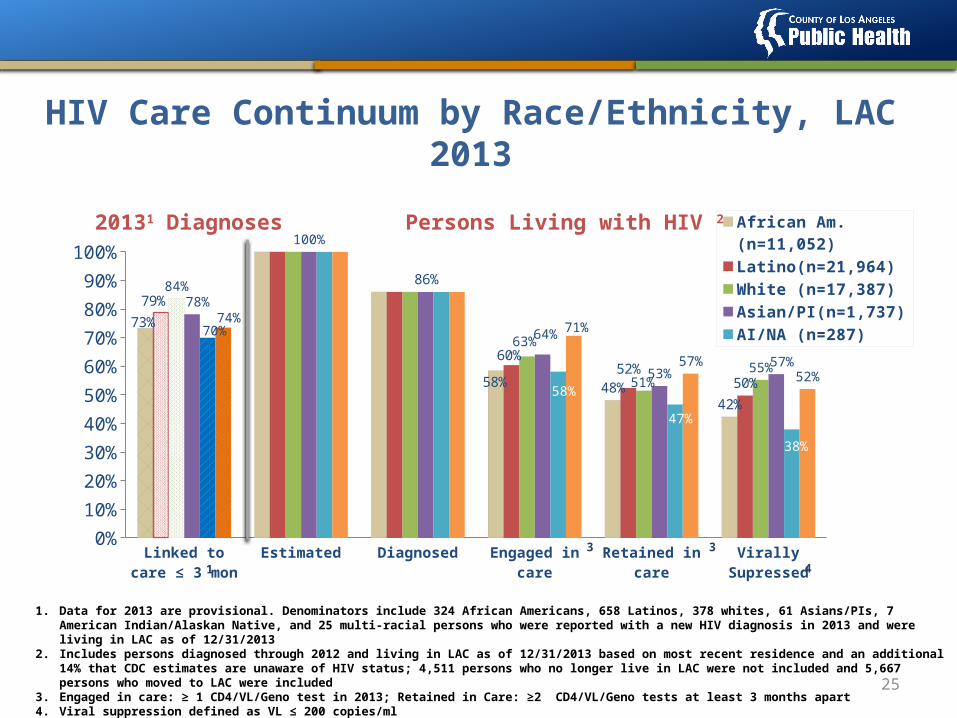
HIV Care Continuum by Race/Ethnicity, LAC 2013
25
Linke
d to c
are
...
Estim
ated
Diagnose
d
Engaged
in ..
.
Retai
ned in
...
Virally
Supre
...0%
10%
20%
30%
40%
50%
60%
70%
80%
90%
100%
73%
58% 48%42%
79%
86%
60%52%
50%
84%
63%
51%55%
78%
100%
64%
53%57%
70%
58%
47%
38%
74%71%
57%52%
African Am.(n=11,052)Latino(n=21,964)White (n=17,387)Asian/PI(n=1,737)AI/NA (n=287)Multi-racial (n=893)
20131 Diagnoses Persons Living with HIV 2
1
33
4
1. Data for 2013 are provisional. Denominators include 324 African Americans, 658 Latinos, 378 whites, 61 Asians/PIs, 7 American Indian/Alaskan Native, and 25 multi-racial persons who were reported with a new HIV diagnosis in 2013 and were living in LAC as of 12/31/2013
2. Includes persons diagnosed through 2012 and living in LAC as of 12/31/2013 based on most recent residence and an additional 14% that CDC estimates are unaware of HIV status; 4,511 persons who no longer live in LAC were not included and 5,667 persons who moved to LAC were included
3. Engaged in care: ≥ 1 CD4/VL/Geno test in 2013; Retained in Care: ≥2 CD4/VL/Geno tests at least 3 months apart4. Viral suppression defined as VL ≤ 200 copies/ml
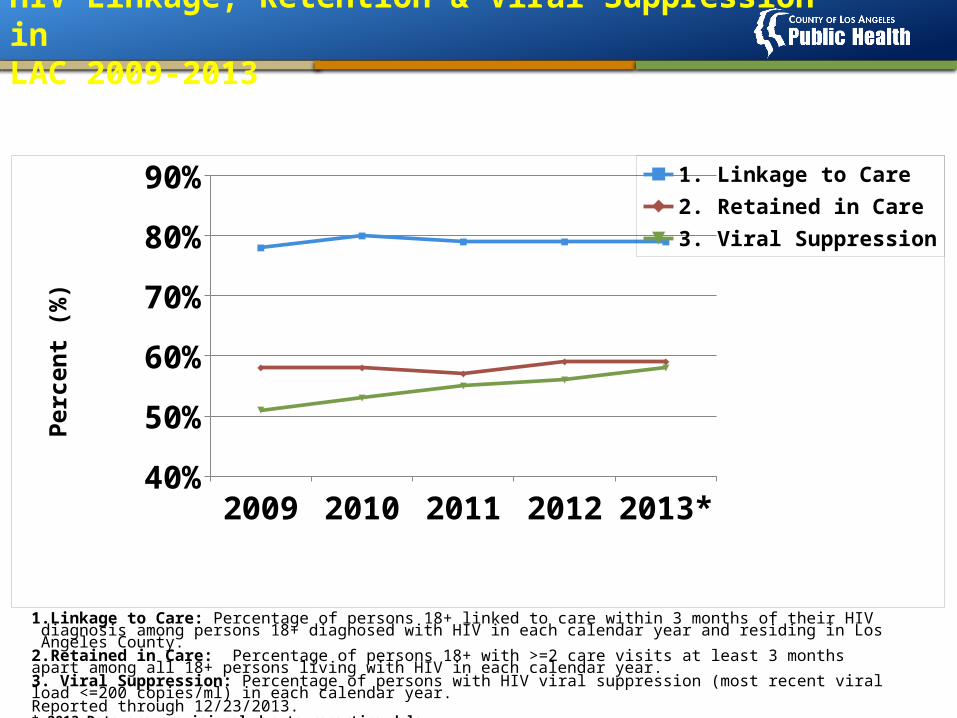
HIV Linkage, Retention & Viral Suppression in LAC 2009-2013
2009 2010 2011 2012 2013*
1. Linkage to Care 0.78 0.8 0.79 0.79 0.79
2. Retained in Care 0.58 0.58 0.57 0.59 0.59
3. Viral Suppression 0.51 0.53 0.55 0.56 0.58
45%
55%
65%
75%
85%1. Linkage to Care2. Retained in Care3. Viral Suppression
Perc
ent (
%)
1.Linkage to Care: Percentage of persons 18+ linked to care within 3 months of their HIV diagnosis among persons 18+ diagnosed with HIV in each calendar year and residing in Los Angeles County.
2.Retained in Care: Percentage of persons 18+ with >=2 care visits at least 3 months apart among all 18+ persons living with HIV in each calendar year. 3. Viral Suppression: Percentage of persons with HIV viral suppression (most recent viral load <=200 copies/ml) in each calendar year. Reported through 12/23/2013.* 2013 Data are provisional due to reporting delay.
2626
• Although LAC had higher numbers of STDs compared to most other jurisdictions in 2013, LAC rates are generally lower than other US urban areas
• There are large disparities for HIV/STDs including a disproportional impact on African Americans, MSM and youth
27
• HIV and syphilis disproportionally impact MSM while gonorrhea and chlamydia impact a broader segment of LAC’s population
• Geographic disparities include a high HIV, GC and CT burden in the Metro and South SPAs and a high SY burden in the Metro SPA
28
• Approximately 1,850 new HIV infections annually and ~ 60,050 persons living with HIV in LAC
• An estimated 9,500 persons in LAC were unaware of their HIV infection in 2013
• It is estimated that 66% of newly-diagnosed HIV+ persons link to care in 3 months, 69% within 6 months and 71% within 12 months
29
• 47% of HIV+ persons are retained in care with 2 VL at least 3 mos apart and 56% had at least 1 VL in the previous 12 months in 2011
• It is estimated that only 45% of total PLWH, including those unaware of their HIV infection, had suppressed VL in 2011
• Among patients in the Ryan White HIV care system in LAC, 87% were retained in care and 75% had suppressed viral loads in 2010
30
• HIV surveillance data show increases in overall viral suppression in LAC, however improvements are still needed
• Continuing high HIV prevalence among MSM and MSM of color
• Decreasing HIV rates for African American men
and women
31
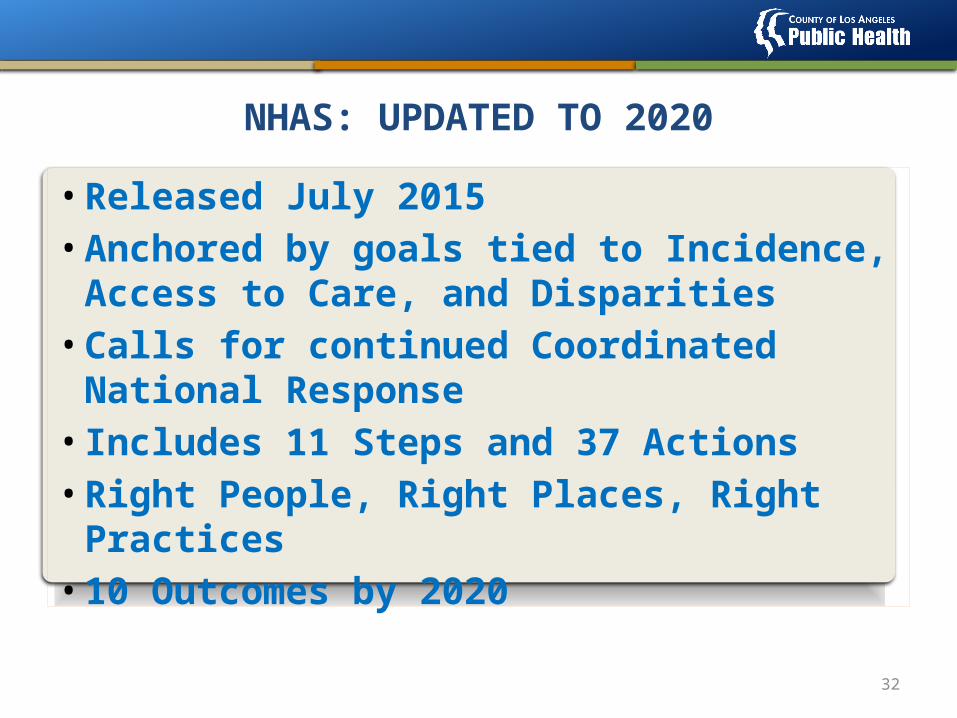
NHAS: UPDATED TO 2020
• Released July 2015• Anchored by goals tied to Incidence, Access to Care,
and Disparities• Calls for continued Coordinated National Response• Includes 11 Steps and 37 Actions• Right People, Right Places, Right Practices• 10 Outcomes by 2020
32
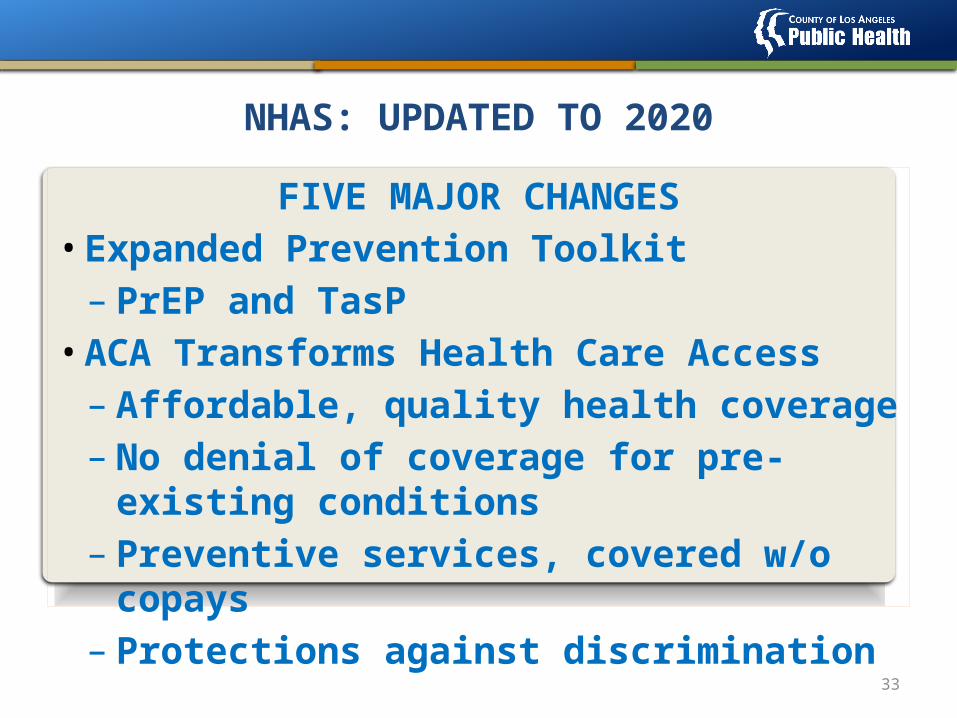
NHAS: UPDATED TO 2020
FIVE MAJOR CHANGES• Expanded Prevention Toolkit
– PrEP and TasP• ACA Transforms Health Care Access
– Affordable, quality health coverage– No denial of coverage for pre-existing conditions– Preventive services, covered w/o copays– Protections against discrimination
33
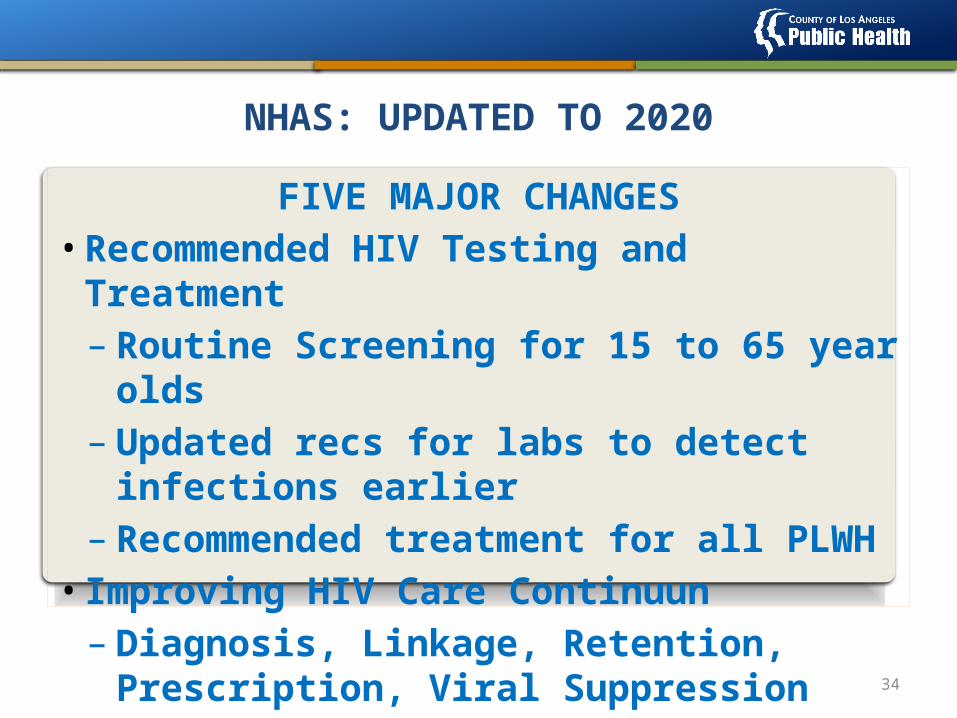
NHAS: UPDATED TO 2020
FIVE MAJOR CHANGES• Recommended HIV Testing and Treatment
– Routine Screening for 15 to 65 year olds– Updated recs for labs to detect infections earlier– Recommended treatment for all PLWH
• Improving HIV Care Continuun– Diagnosis, Linkage, Retention, Prescription, Viral
Suppression
34
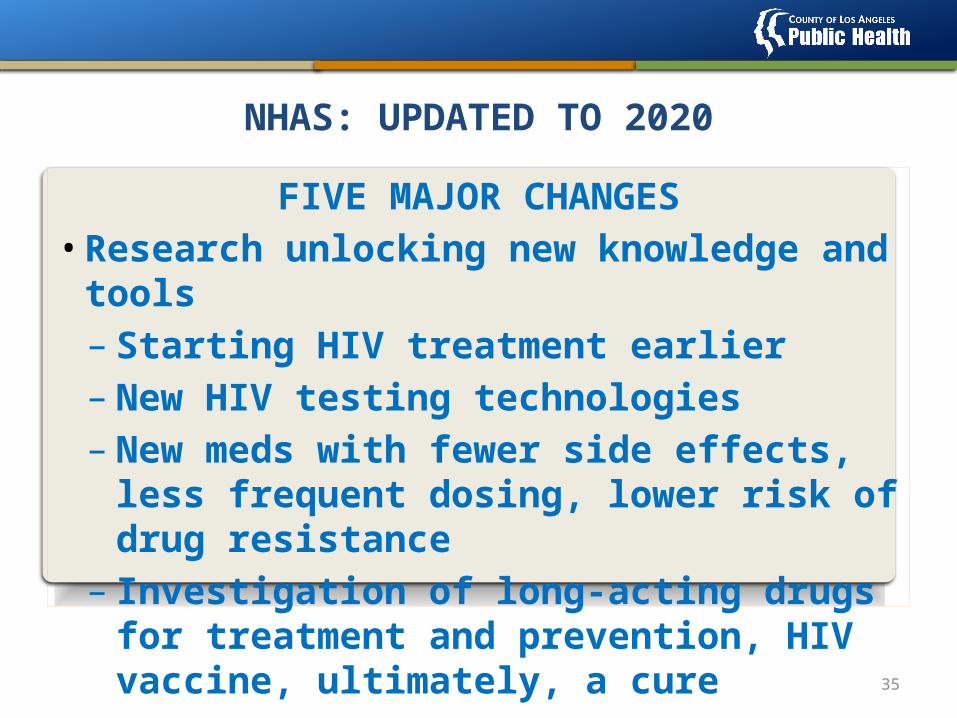
NHAS: UPDATED TO 2020
FIVE MAJOR CHANGES• Research unlocking new knowledge and tools
– Starting HIV treatment earlier– New HIV testing technologies– New meds with fewer side effects, less frequent
dosing, lower risk of drug resistance– Investigation of long-acting drugs for treatment
and prevention, HIV vaccine, ultimately, a cure
35
Thank You
Gracias
36