Embed Size (px)
Citation preview
Public Health Expenditure in Bangladesh: Do We Need A Reform Agenda?
July 2002
Dhaka, Bangladesh
UK
Public Health Expenditure in Bangladesh: Do We Need A Reform Agenda?
The report was prepared, under the general direction of Dr. S. M. MoazzemHossain, Head, Health and Nutrition, Save the Children (UK), BangladeshProgramme Office, by two consultants - Mr. Rashed Al Mahmud Titumir,Assistant Professor of Economics, Bangladesh Open University and Dr. Sk.Md. Mamunur Rahman Malik, a public health specialist. The report has benefited with scholarly input and valuable guidance fromProfessor Muzaffer Ahmad, Professor of Economics, Institute of BusinessAdministration, University of Dhaka.
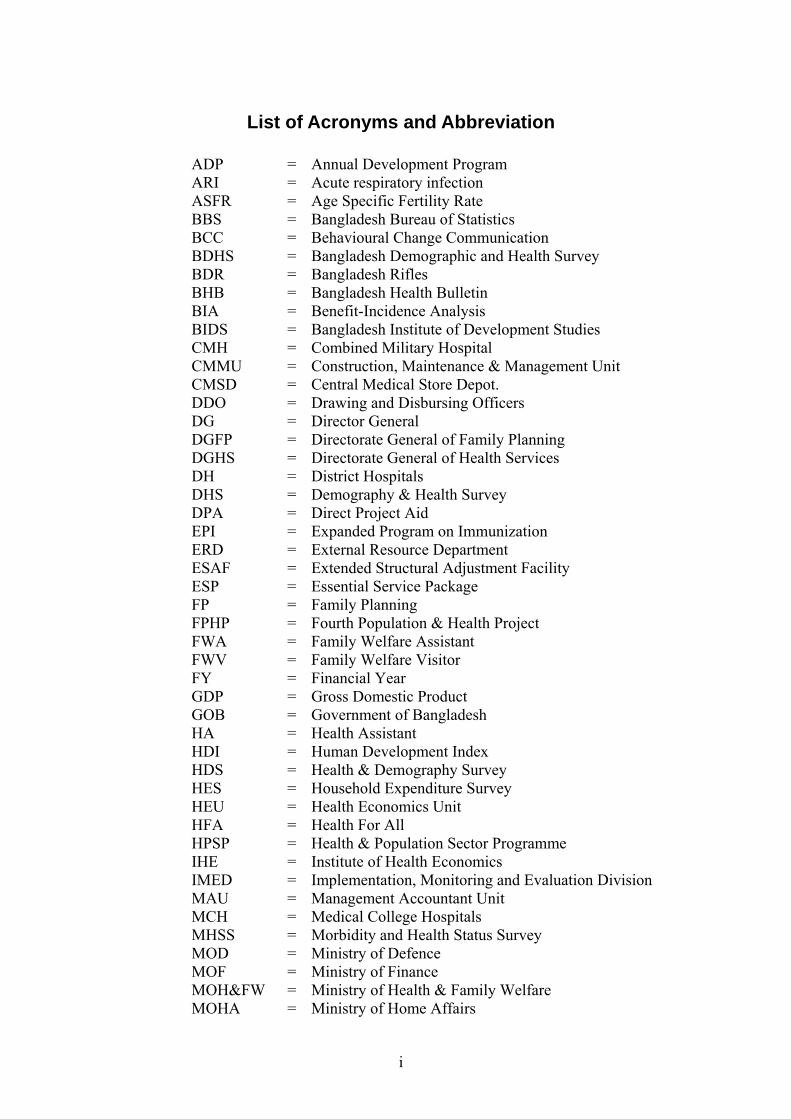
List of Acronyms and Abbreviation
ADP = Annual Development Program ARI = Acute respiratory infection ASFR = Age Specific Fertility Rate BBS = Bangladesh Bureau of Statistics BCC = Behavioural Change Communication BDHS = Bangladesh Demographic and Health Survey BDR = Bangladesh Rifles BHB = Bangladesh Health Bulletin BIA = Benefit-Incidence Analysis BIDS = Bangladesh Institute of Development Studies CMH = Combined Military Hospital CMMU = Construction, Maintenance & Management Unit CMSD = Central Medical Store Depot. DDO = Drawing and Disbursing Officers DG = Director General DGFP = Directorate General of Family Planning DGHS = Directorate General of Health Services DH = District Hospitals DHS = Demography & Health Survey DPA = Direct Project Aid EPI = Expanded Program on Immunization ERD = External Resource Department ESAF = Extended Structural Adjustment Facility ESP = Essential Service Package FP = Family Planning FPHP = Fourth Population & Health Project FWA = Family Welfare Assistant FWV = Family Welfare Visitor FY = Financial Year GDP = Gross Domestic Product GOB = Government of Bangladesh HA = Health Assistant HDI = Human Development Index HDS = Health & Demography Survey HES = Household Expenditure Survey HEU = Health Economics Unit HFA = Health For All HPSP = Health & Population Sector Programme IHE = Institute of Health Economics IMED = Implementation, Monitoring and Evaluation Division MAU = Management Accountant Unit MCH = Medical College Hospitals MHSS = Morbidity and Health Status Survey MOD = Ministry of Defence MOF = Ministry of Finance MOH&FW = Ministry of Health & Family Welfare MOHA = Ministry of Home Affairs
i
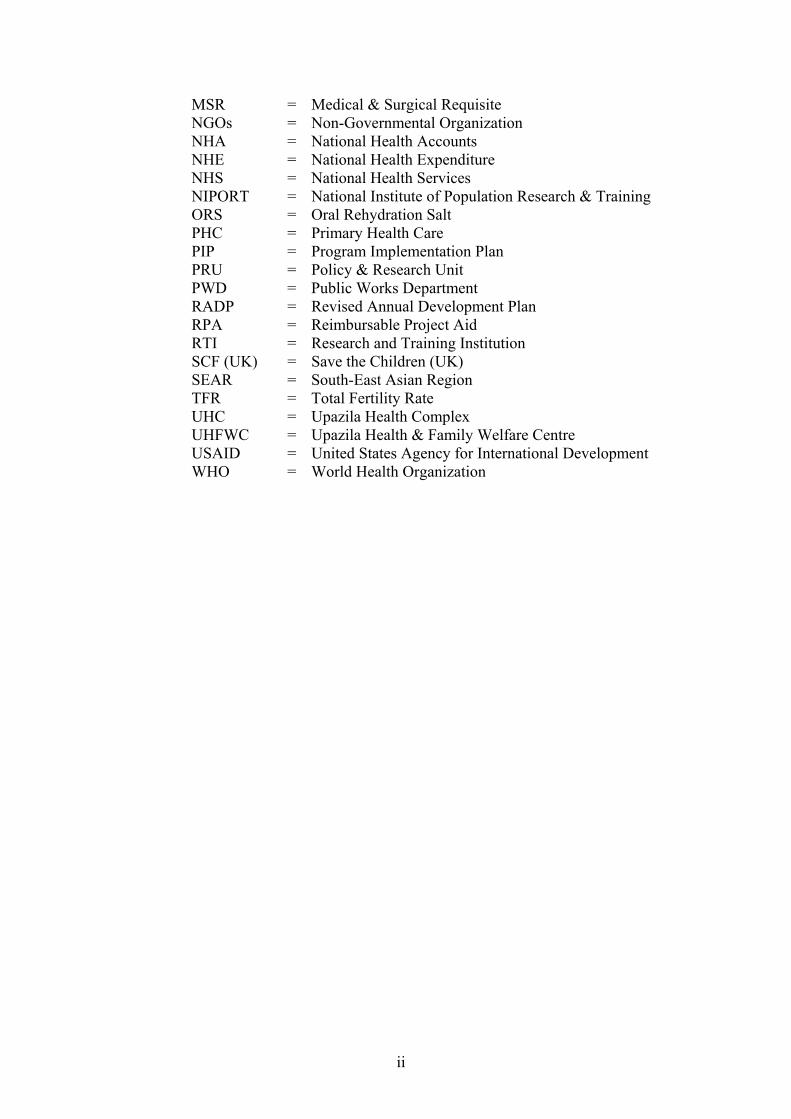
MSR = Medical & Surgical Requisite NGOs = Non-Governmental Organization NHA = National Health Accounts NHE = National Health Expenditure NHS = National Health Services NIPORT = National Institute of Population Research & Training ORS = Oral Rehydration Salt PHC = Primary Health Care PIP = Program Implementation Plan PRU = Policy & Research Unit PWD = Public Works Department RADP = Revised Annual Development Plan RPA = Reimbursable Project Aid RTI = Research and Training Institution SCF (UK) = Save the Children (UK) SEAR = South-East Asian Region TFR = Total Fertility Rate UHC = Upazila Health Complex UHFWC = Upazila Health & Family Welfare Centre USAID = United States Agency for International Development WHO = World Health Organization
ii
Table of Contents
LIST OF ACRONYMS AND ABBREVIATION.............................................................................. I
I. INTRODUCTION: BACKGROUND AND RATIONALE .........................................................1
1.1 PUBLIC HEALTH EXPENDITURE IN BANGLADESH NEED FOR AN ANALYSIS: I
:
: I
I
: :
.......................................... 1 1.2. OBJECTIVES AND SCOPE OF ANALYS S..................................................................................... 2
2. ANALYTICAL FRAMEWORK..............................................................................................3
3. PUBLIC HEALTH EXPENDITURE IN BANGLADESH: A MACRO OVERVIEW ......................5
3.1 EXPENDITURE REVIEW OF HEALTH & POPULATION SECTOR........................................................... 5 3.2 TREND IN REVENUE EXPENDITURE: HEALTH SECTOR’S SHARE IN THE BUDGET ................................... 7 3.3. DONOR’S SHARE OF HEALTH EXPENDITURES............................................................................. 8 3.4 TREND IN REVENUE AND DEVELOPMENT EXPENDITURE ON HEALTH ................................................. 9
3.4.1 Intra-sectoral Allocation of Expenditure between Health and Family Planning ........... 10 3.5 NATURE OF HEALTH EXPENDITURE....................................................................................... 10
3.5.1 Distribution of Revenue Expenditure ..................................................................... 11 3.5.2 Distribution of Development Expenditure ............................................................... 12 3.5.3 Spending on the Essential Services Package........................................................... 13
4. DISTRIBUTION OF PUBLIC HEALTH EXPENDITURE .................................................... 16
4.1 RESOURCE ALLOCATION IN BANGLADESH CURRENT METHODS ..................................................... 16 4.2 GEOGRAPHIC ANALYSIS OF PUBLIC HEALTH SPENDING .............................................................. 18 4.3 RESOURCE ALLOCATION FOR MEDICAL AND SURGICAL REQUISITE................................................. 20
5. DISTRIBUTIONAL IMPLICATIONS OF PUBLIC HEALTH SPENDING............................. 22
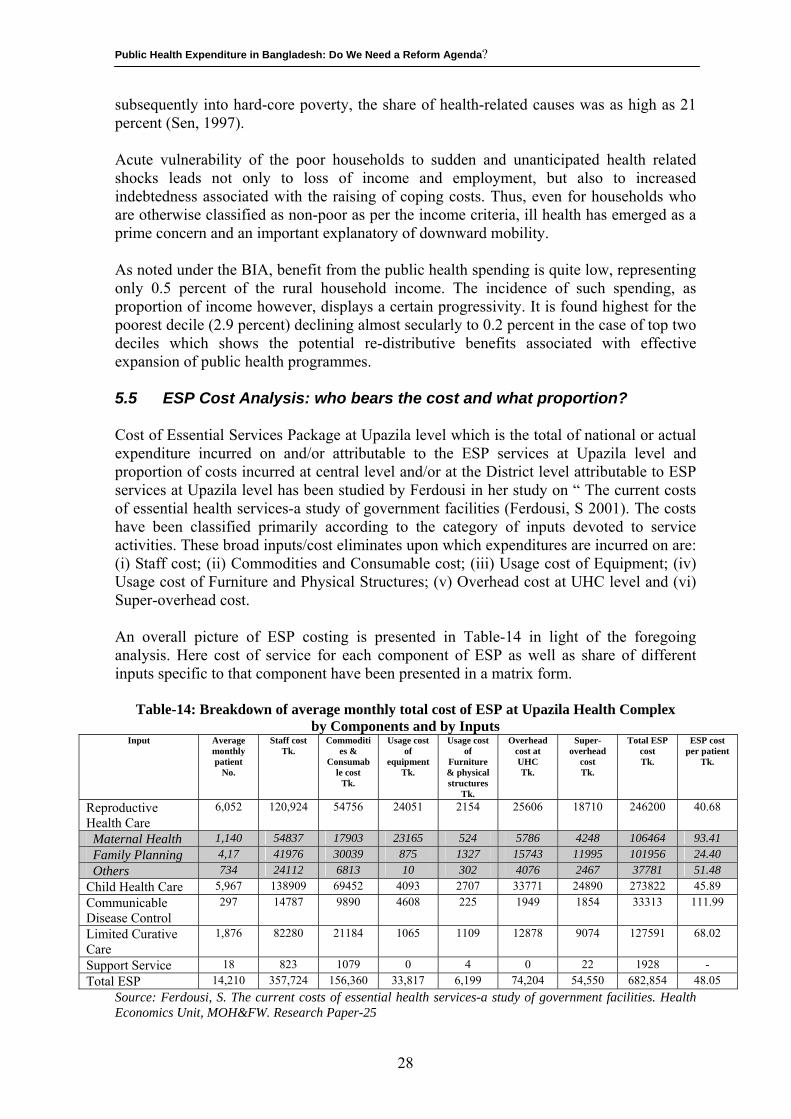
5.1. WHO IS BENEFITED FROM THE PUBLIC SPENDING IN BANGLADESH FINDINGS FROM THE BENEFIT NCIDENCE ANALYSIS (BIA)......................................................................................................................... 22 5.2 WHO PAYS MORE AND HOW MUCH FOR HEALTH CARE COSTS?: EV DENCES FROM THE HOUSEHOLD EXPENDITURE SURVEY (HES) ......................................................................................................... 25 5.3 WHO BEARS THE BURDEN OF HIGH COSTS OF ILL HEALTH AND AT WHAT PRICE? ................................ 26 5.4 INTERFACE BETWEEN HEALTH AND POVERTY WHAT PUBLIC HEALTH PROGRAMMES CAN DO?................. 27 5.5 ESP COST ANALYSIS WHO BEARS THE COST AND WHAT PROPORTION? .......................................... 28 5.6 UNOFFICIAL FEES AT THE PUBLIC HEALTH FACILITIES: WHAT DOES IT COST TO THE SOCIETY AND TO THE PATIENT? ................................................................................................................................. 29
6. PATTERNS IN NATIONAL HEALTH EXPENDITURE IN BANGLADESH AND HEALTH SYSTEM PERFORMANCE....................................................................................................... 30
6.1. HEALTH INDICATORS OF BANGLADESH AS A MEASURE OF HEALTH STATUS........................................ 30 6.2 MEASURE OF HEALTH SYSTEM PERFORMANCE: USING WHO’S CORE PERFORMANCE CRITERIA ............... 31 6.3 PATTERNS IN NATIONAL HEALTH EXPENDITURE IN THE NEIGHBOURING COUNTRIES AND CROSS COUNTRY COMPARISON OF HEALTH INDICATORS............................................................................................... 32
7. CONCLUDING OBSERVATIONS: DO WE NEED ALTERNATIVE STRATEGIES? ............... 34
7.1. EXISTING RESOURCE ALLOCATION AND BUDGETING SYSTEM......................................................... 34 7.2. OVERALL BUDGET STRUCTURE............................................................................................. 35 7.3. ALTERNATIVE SUGGESTIONS FOR ALLOCATIVE SYSTEM ............................................................... 35
7.3.1. Model A: Incrementalist (current model) ............................................................... 35 7.3.2. Model B: Health facility requirement...................................................................... 36 7.3.3. Model C: Health services requirement ................................................................... 36 7.3.4. Model D: Population based resource allocation....................................................... 36
7.4. SUPPORTING COMPONENTS FOR DEVELOPMENT OF CHOSEN ALLOCATIVE SYSTEM ............................... 37 7.5 SUGGESTED PROCESS FOR CHANGE IN ALLOCATIVE SYSTEM ......................................................... 38 7.6 CHANGE IN THE DECISION MAKING CULTURE ........................................................................... 38
9. REFERENCE:.................................................................................................................. 40
iii

iv
Public Health Expenditure in Bangladesh: Do We Need a Reform Agenda?
I. INTRODUCTION: BACKGROUND AND RATIONALE 1.1 Public Health Expenditure in Bangladesh: Need for an Analysis The public health expenditure in Bangladesh requires thorough investigation, particularly in view of the major reforms currently undergoing in the public health sector of the country and also in view of the challenges faced by the sector in mobilizing adequate domestic resources for financing these reform measures of the country’s health and population sector. Built on a sector wide framework, the current health reform measures of the government, being implemented through a five year (1998-2003) Health & Population Sector Programme (HPSP), aims at accelerating programme performance, prioritize client needs and achieve sustainable financing of the health and family planning services in the country (MOH&FW, 1998a). The cost of the HPSP has been estimated to be around US $ 2.3 billion out of which the government of Bangladesh’s contribution is US $ 2.3 billion (approximately 70 % of the total budgetary outlay) while the contribution from the development partners of the government for the HPSP is expected to be around US $ 900 million or 30% of the total cost of the HPSP (MOH&FW, 2001a) In view of the above, it is imperative to investigate whether the public spending on health in an under resourced country like Bangladesh is actually being translated in paying benefits to those in need. One way of addressing the issue might be to investigate whether the sector is plagued by a system of governance implying inappropriate policies, together with delicate state of enforcement, non-responsive management, and weak accountability, etc. From that perspective, public expenditure may be analysed to comprehend whether scarce resource is targeted towards them who need public expenditure as input to improve their health status with a view to increasing their capability. The other way could be to study the distributional implication of public health spending in the country, examining the extent to which the government’s public expenditure directly or indirectly benefits the lives of its citizens specially those people with modest means. Yet, another way would be to focus policy discussions on appropriate resource allocation that enhances equity and efficiency of use. The Save the Children Fund (UK)’s role in financing advocacy strategy is to ensure that there are enough public resources to fund quality basic services (SCF, 2001) and effective and efficient mechanisms exist within the public system to channel resources to where they are needed most. At the same time, the organization wants to advocate that at country level, the external development financing supports, rather than undermines, its use for the efficient provision of equitable appropriate services. It is in this perspective that the SCF (UK) has commissioned this study with a view to improving the structure of government’s decision making process on public health expenditure in the country, largely to make the process of public expenditure more accessible and understandable to a wider range of stakeholders. These groups might otherwise view the public expenditure as too arcane and confusing to warrant their attention. Applied budget work can help to “demystify” the public expenditure for these
1
Public Health Expenditure in Bangladesh: Do We Need a Reform Agenda?
stakeholders and bring them into the important debate on how to allocate a country’s resources to meet its most pressing needs. The findings of the present study might also allow the government to find appropriate public policy options for health care financing in the country particularly at a time when the government is contemplating to formulate the Health, Nutrition and Population Sector Programme for the 2003-2008 period under the sixth five year development plan. 1.2. Objectives and Scope of Analysis The present study seeks to examine the macro allocation of resources flows to the public health sector including intra-sectoral distribution of that resources. In particular, the study aims to:
i) observe the trends in sectoral allocation of national budget over last decade with more emphasis on how different sectors have grown with particular attention to social sectors with concentration on health;
ii) examine how responsive has been the financing by a decomposition of
spending pattern; and
iii) analyse the necessity of a reform agenda regarding public health expenditure.
Through the above analysis, the study contemplates to provide an understanding on the nature of current resource use and identify potential opportunities for improving the sectoral impact on health status of the people. One of the other major aims of this study has been to examine the incidence of benefit of public expenditure on health that accrues to people of different economic strata with a focus on rural poor people. The study has been based on desk review through accessing various budget documents and reports both available at the libraries, research centres/institutes and within the health and finance ministries. The first part of this report presents an analytical framework. The subsequent section (section-3) of the report provides a macro overview of the public expenditure in Bangladesh with particular attention to social sectors with concentration on health. The next section (Section-4) provides an analysis of distribution of public health spending to examine how responsive has been the financing by a decomposition of spending pattern. In section – 5 of the report, the distributional implication of public health spending has been examined. In section 6 of this report, an attempt has been made to draw an analogy between the patterns of national health expenditure in Bangladesh and the measure of health status, if any. The concluding observations are provided in the following section (Section-7)
2
Public Health Expenditure in Bangladesh: Do We Need a Reform Agenda?
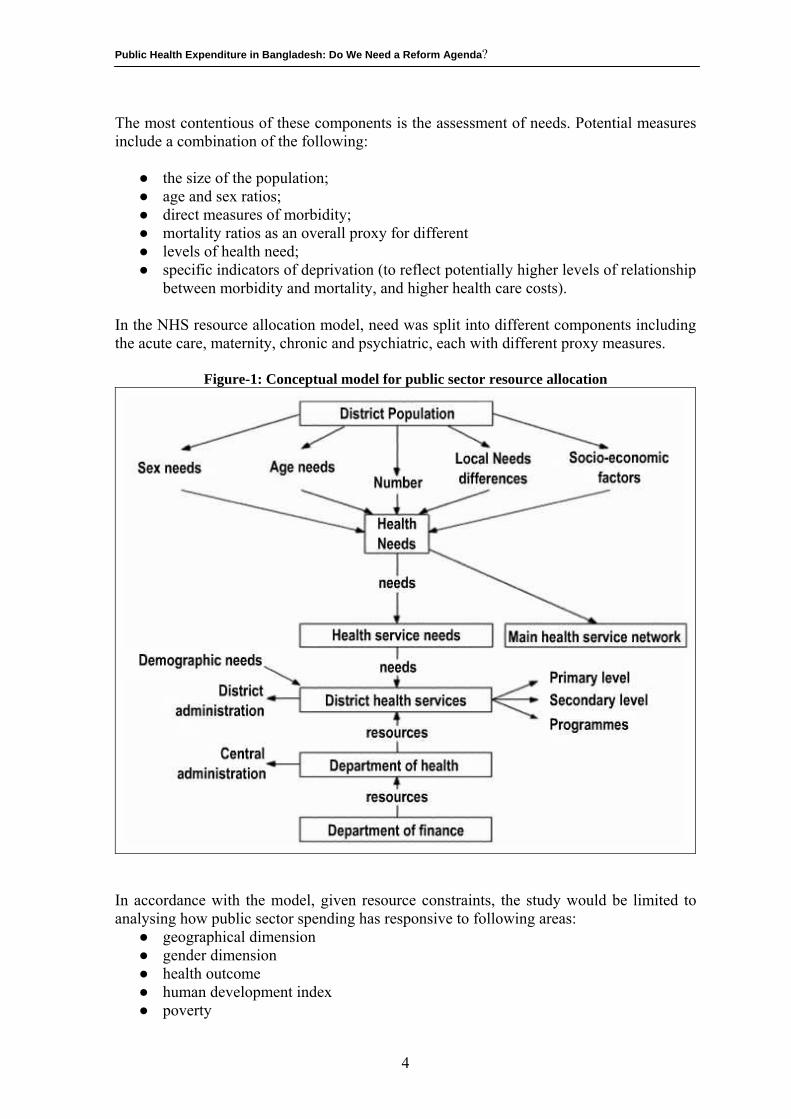
2. ANALYTICAL FRAMEWORK A sustainable system of health is an accessible, relevant and efficiently driven system that perpetuates and improves healthy outcomes. The sustainability criterion dwells on the likelihood of continuance of the flow of benefits to beneficiaries, and to the society, depending on key variables such as relevance, equity and efficiency. The relevance criterion concerns how the system has addressed the real needs. The relevance of a system relates primarily to its design and concerns - the extent to which stated goals, objectives and activities address the identified problems or real needs of the population. An analysis of relevance of a system focuses on the ability of the system to identify real problems or needs, and how it addresses them in accordance with local need as well as maintaining complementarities and coherence with related activities undertaken elsewhere. The efficiency of a system is understood in terms of its capacity to mobilise and use resources in pursuit of its operative goals in a manner that the attainment is least expensive without compromising benefits to the target as well as flexibility and institutional capacity. The equity, a complement to social justice, denotes access to opportunity of equitable standards. Equity in health has been perceived variously. It could be operationalised as:(a) equal access to the system, (b) equal participation in the system, (c) equal attainments through the system. Not all groups in society can afford the direct and indirect costs associated with investing in health. The government therefore plays a role in promoting equality of opportunity. If health care was provided under market conditions, only those who could afford to pay would be able to avail. Not only would there be under-investment from the social point of view, but income inequalities would be preserved from one generation to the next, since good health is itself a determinant of lifetime income. Health is often considered a type of good with special merit (merit goods) that is not readily quantifiable and that might be under-supplied if left to the market. Health is an important channel through which governments advance nation building. An equity-focused policy would require a shift in resource allocation, away from a mechanism based on existing facilities, to one based on an assessment of the needs of particular areas and their population groups. The figure-1 sets out a conceptual model for such a process. One of the best-documented examples of this approach is the United Kingdom National Health Service (NHS), which in the 1970s developed a resource allocation formula (DHSS, 1976)1 based on a model with the following components:
● the health needs of a specified population; ● the relative costs of different services; ● the relative costs associated with different areas; ● the costs associated with non-service delivery, such as teaching costs; ● the use by patients in one area of services in another (cross-boundary flows).
Within a public sector resource allocation system, a further criterion may be the level of private sector health care, as this may reduce the potential need for public sector resources.
1 The section draws on Green, A et al (2000) and the figure-1 was reproduced from that article.
3
Public Health Expenditure in Bangladesh: Do We Need a Reform Agenda?
The most contentious of these components is the assessment of needs. Potential measures include a combination of the following:
● the size of the population; ● age and sex ratios; ● direct measures of morbidity; ● mortality ratios as an overall proxy for different ● levels of health need; ● specific indicators of deprivation (to reflect potentially higher levels of relationship
between morbidity and mortality, and higher health care costs). In the NHS resource allocation model, need was split into different components including the acute care, maternity, chronic and psychiatric, each with different proxy measures.
Figure-1: Conceptual model for public sector resource allocation
In accordance with the model, given resource constraints, the study would be limited to analysing how public sector spending has responsive to following areas:
● geographical dimension ● gender dimension ● health outcome ● human development index ● poverty
4
Public Health Expenditure in Bangladesh: Do We Need a Reform Agenda?
3. PUBLIC HEALTH EXPENDITURE IN BANGLADESH: A MACRO OVERVIEW
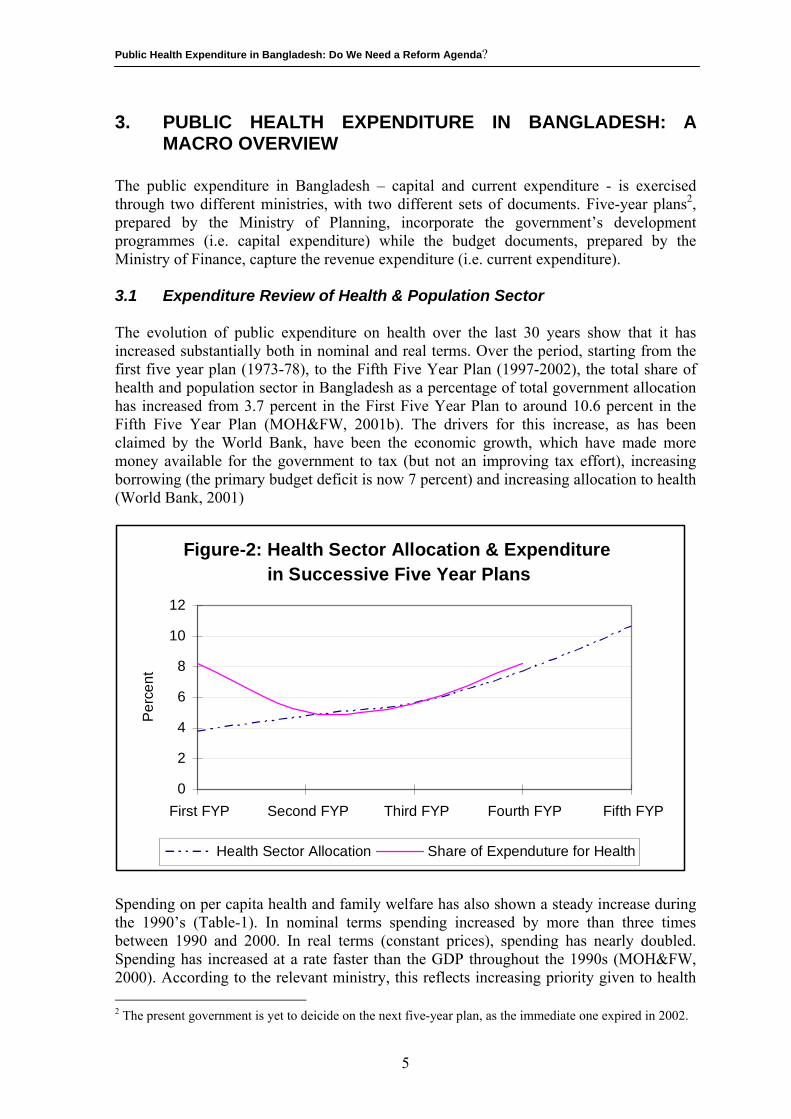
The public expenditure in Bangladesh – capital and current expenditure - is exercised through two different ministries, with two different sets of documents. Five-year plans2, prepared by the Ministry of Planning, incorporate the government’s development programmes (i.e. capital expenditure) while the budget documents, prepared by the Ministry of Finance, capture the revenue expenditure (i.e. current expenditure). 3.1 Expenditure Review of Health & Population Sector The evolution of public expenditure on health over the last 30 years show that it has increased substantially both in nominal and real terms. Over the period, starting from the first five year plan (1973-78), to the Fifth Five Year Plan (1997-2002), the total share of health and population sector in Bangladesh as a percentage of total government allocation has increased from 3.7 percent in the First Five Year Plan to around 10.6 percent in the Fifth Five Year Plan (MOH&FW, 2001b). The drivers for this increase, as has been claimed by the World Bank, have been the economic growth, which have made more money available for the government to tax (but not an improving tax effort), increasing borrowing (the primary budget deficit is now 7 percent) and increasing allocation to health (World Bank, 2001)
Figure-2: Health Sector Allocation & Expenditure in Successive Five Year Plans
0
2
4
6
8
10
12
First FYP Second FYP Third FYP Fourth FYP Fifth FYP
Per
cent
Health Sector Allocation Share of Expenduture for Health
Spending on per capita health and family welfare has also shown a steady increase during the 1990’s (Table-1). In nominal terms spending increased by more than three times between 1990 and 2000. In real terms (constant prices), spending has nearly doubled. Spending has increased at a rate faster than the GDP throughout the 1990s (MOH&FW, 2000). According to the relevant ministry, this reflects increasing priority given to health 2 The present government is yet to deicide on the next five-year plan, as the immediate one expired in 2002.
5
Public Health Expenditure in Bangladesh: Do We Need a Reform Agenda?
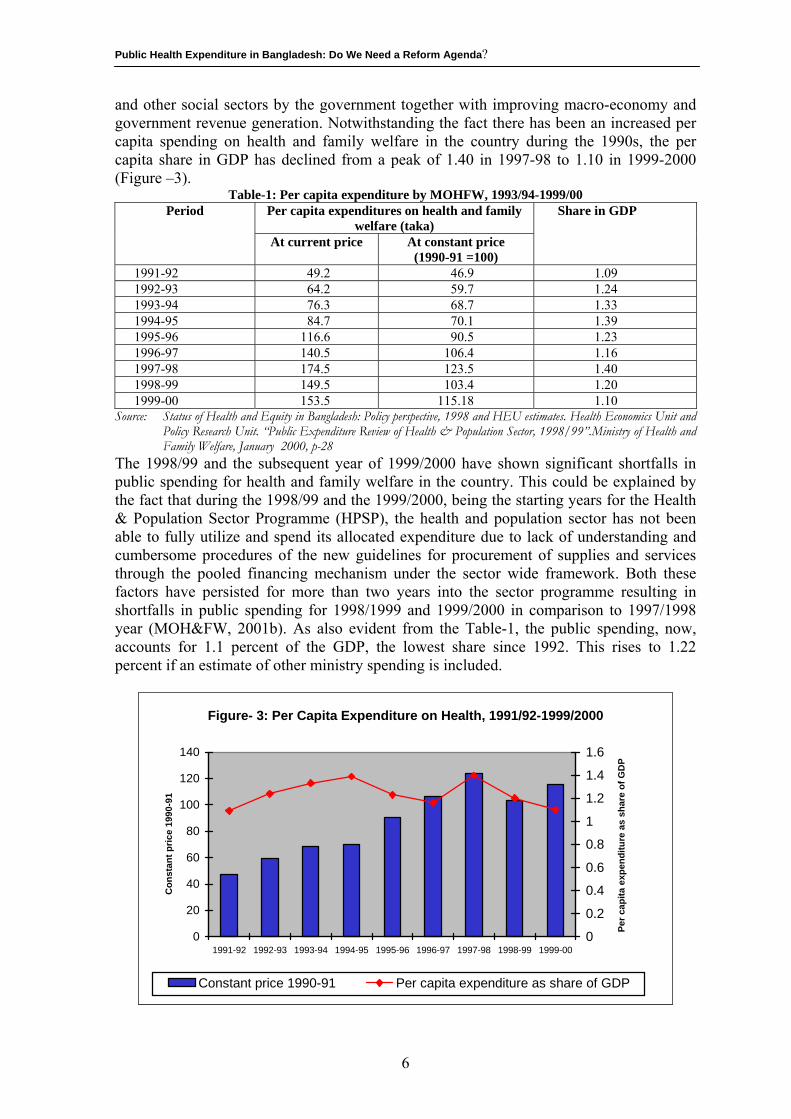
and other social sectors by the government together with improving macro-economy and government revenue generation. Notwithstanding the fact there has been an increased per capita spending on health and family welfare in the country during the 1990s, the per capita share in GDP has declined from a peak of 1.40 in 1997-98 to 1.10 in 1999-2000 (Figure –3).
Table-1: Per capita expenditure by MOHFW, 1993/94-1999/00 Per capita expenditures on health and family
welfare (taka) Period
At current price At constant price (1990-91 =100)
Share in GDP
1991-92 49.2 46.9 1.09 1992-93 64.2 59.7 1.24 1993-94 76.3 68.7 1.33 1994-95 84.7 70.1 1.39 1995-96 116.6 90.5 1.23 1996-97 140.5 106.4 1.16 1997-98 174.5 123.5 1.40 1998-99 149.5 103.4 1.20 1999-00 153.5 115.18 1.10
Source: Status of Health and Equity in Bangladesh: Policy perspective, 1998 and HEU estimates. Health Economics Unit and Policy Research Unit. “Public Expenditure Review of Health & Population Sector, 1998/99”.Ministry of Health and Family Welfare, January 2000, p-28
The 1998/99 and the subsequent year of 1999/2000 have shown significant shortfalls in public spending for health and family welfare in the country. This could be explained by the fact that during the 1998/99 and the 1999/2000, being the starting years for the Health & Population Sector Programme (HPSP), the health and population sector has not been able to fully utilize and spend its allocated expenditure due to lack of understanding and cumbersome procedures of the new guidelines for procurement of supplies and services through the pooled financing mechanism under the sector wide framework. Both these factors have persisted for more than two years into the sector programme resulting in shortfalls in public spending for 1998/1999 and 1999/2000 in comparison to 1997/1998 year (MOH&FW, 2001b). As also evident from the Table-1, the public spending, now, accounts for 1.1 percent of the GDP, the lowest share since 1992. This rises to 1.22 percent if an estimate of other ministry spending is included.
Figure- 3: Per Capita Expenditure on Health, 1991/92-1999/2000
0
20
40
60
80
100
120
140
1991-92 1992-93 1993-94 1994-95 1995-96 1996-97 1997-98 1998-99 1999-00
Con
stan
t pric
e 19
90-9
1
0
0.2
0.4
0.6
0.8
1
1.2
1.4
1.6
Per c
apita
exp
endi
ture
as
shar
e of
GD
P
Constant price 1990-91 Per capita expenditure as share of GDP
6
Public Health Expenditure in Bangladesh: Do We Need a Reform Agenda?
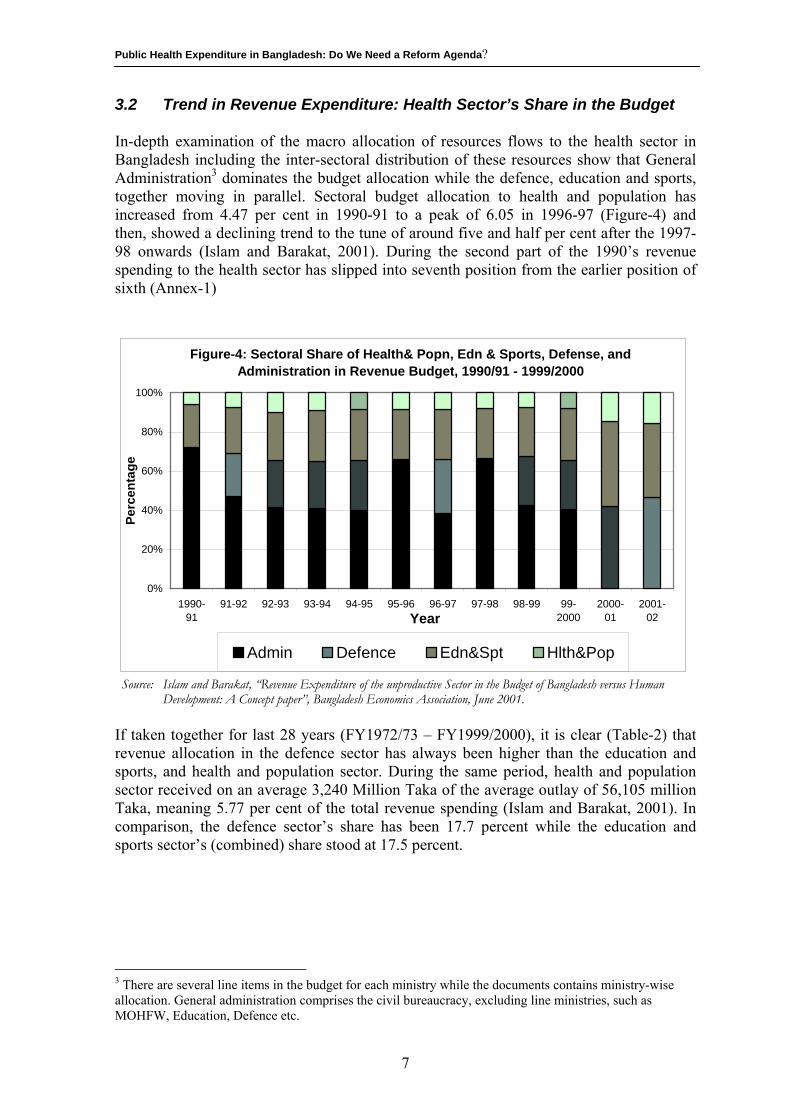
3.2 Trend in Revenue Expenditure: Health Sector’s Share in the Budget In-depth examination of the macro allocation of resources flows to the health sector in Bangladesh including the inter-sectoral distribution of these resources show that General Administration3 dominates the budget allocation while the defence, education and sports, together moving in parallel. Sectoral budget allocation to health and population has increased from 4.47 per cent in 1990-91 to a peak of 6.05 in 1996-97 (Figure-4) and then, showed a declining trend to the tune of around five and half per cent after the 1997-98 onwards (Islam and Barakat, 2001). During the second part of the 1990’s revenue spending to the health sector has slipped into seventh position from the earlier position of sixth (Annex-1)
Figure-4: Sectoral Share of Health& Popn, Edn & Sports, Defense, and Administration in Revenue Budget, 1990/91 - 1999/2000
0%
20%
40%
60%
80%
100%
1990-91
91-92 92-93 93-94 94-95 95-96 96-97 97-98 98-99 99-2000
2000-01
2001-02Year
Perc
enta
ge
Admin Defence Edn&Spt Hlth&Pop
Source: Islam and Barakat, “Revenue Expenditure of the unproductive Sector in the Budget of Bangladesh versus Human Development: A Concept paper”, Bangladesh Economics Association, June 2001.
If taken together for last 28 years (FY1972/73 – FY1999/2000), it is clear (Table-2) that revenue allocation in the defence sector has always been higher than the education and sports, and health and population sector. During the same period, health and population sector received on an average 3,240 Million Taka of the average outlay of 56,105 million Taka, meaning 5.77 per cent of the total revenue spending (Islam and Barakat, 2001). In comparison, the defence sector’s share has been 17.7 percent while the education and sports sector’s (combined) share stood at 17.5 percent.
3 There are several line items in the budget for each ministry while the documents contains ministry-wise allocation. General administration comprises the civil bureaucracy, excluding line ministries, such as MOHFW, Education, Defence etc.
7
Public Health Expenditure in Bangladesh: Do We Need a Reform Agenda?
Table-2: Defence, Education and Sports, Health and Population: Revenue Budget during FY 1972/73-FY1999/2000
Defence Education &
Sports Health &
Population Total budget
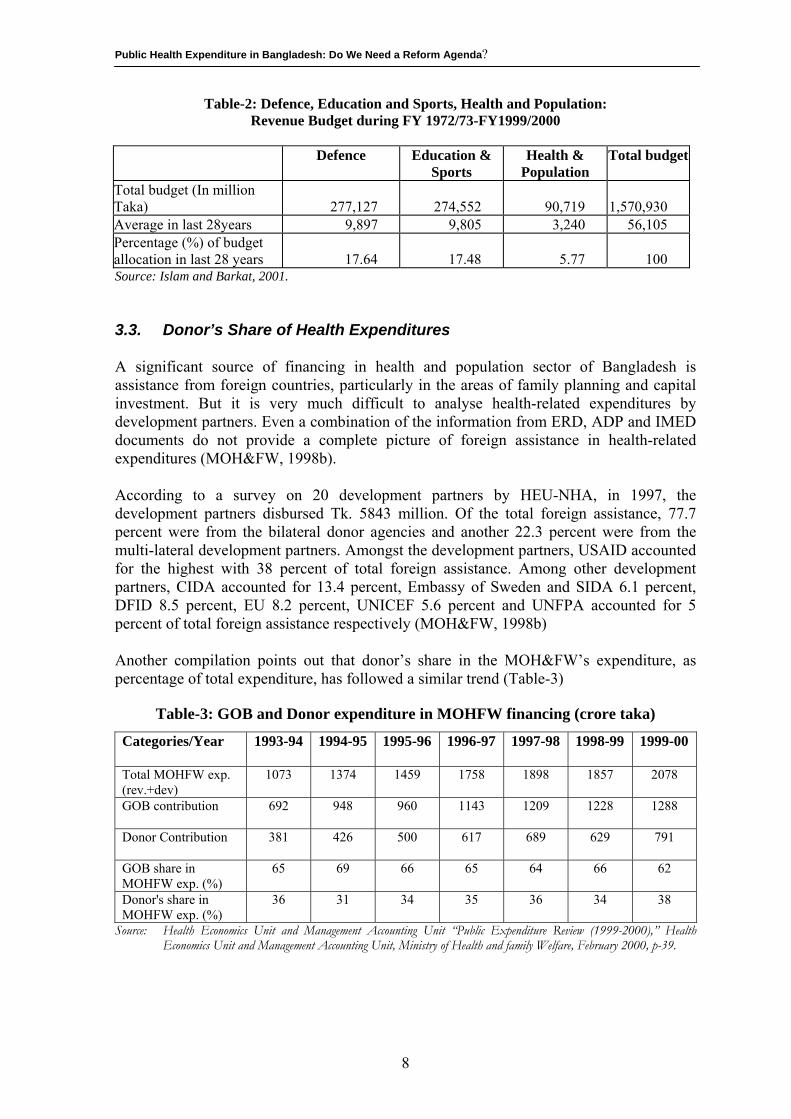
Total budget (In million Taka) 277,127 274,552 90,719 1,570,930 Average in last 28years 9,897 9,805 3,240 56,105 Percentage (%) of budget allocation in last 28 years 17.64 17.48 5.77 100 Source: Islam and Barkat, 2001. 3.3. Donor’s Share of Health Expenditures A significant source of financing in health and population sector of Bangladesh is assistance from foreign countries, particularly in the areas of family planning and capital investment. But it is very much difficult to analyse health-related expenditures by development partners. Even a combination of the information from ERD, ADP and IMED documents do not provide a complete picture of foreign assistance in health-related expenditures (MOH&FW, 1998b). According to a survey on 20 development partners by HEU-NHA, in 1997, the development partners disbursed Tk. 5843 million. Of the total foreign assistance, 77.7 percent were from the bilateral donor agencies and another 22.3 percent were from the multi-lateral development partners. Amongst the development partners, USAID accounted for the highest with 38 percent of total foreign assistance. Among other development partners, CIDA accounted for 13.4 percent, Embassy of Sweden and SIDA 6.1 percent, DFID 8.5 percent, EU 8.2 percent, UNICEF 5.6 percent and UNFPA accounted for 5 percent of total foreign assistance respectively (MOH&FW, 1998b) Another compilation points out that donor’s share in the MOH&FW’s expenditure, as percentage of total expenditure, has followed a similar trend (Table-3)
Table-3: GOB and Donor expenditure in MOHFW financing (crore taka)
Categories/Year 1993-94 1994-95 1995-96 1996-97 1997-98 1998-99 1999-00
Total MOHFW exp. (rev.+dev)
1073 1374 1459 1758 1898 1857 2078
GOB contribution
692 948 960 1143 1209 1228 1288
Donor Contribution
381 426 500 617 689 629 791
GOB share in MOHFW exp. (%)
65 69 66 65 64 66 62
Donor's share in MOHFW exp. (%)
36 31 34 35 36 34 38
Source: Health Economics Unit and Management Accounting Unit “Public Expenditure Review (1999-2000),” Health Economics Unit and Management Accounting Unit, Ministry of Health and family Welfare, February 2000, p-39.
8
Public Health Expenditure in Bangladesh: Do We Need a Reform Agenda?
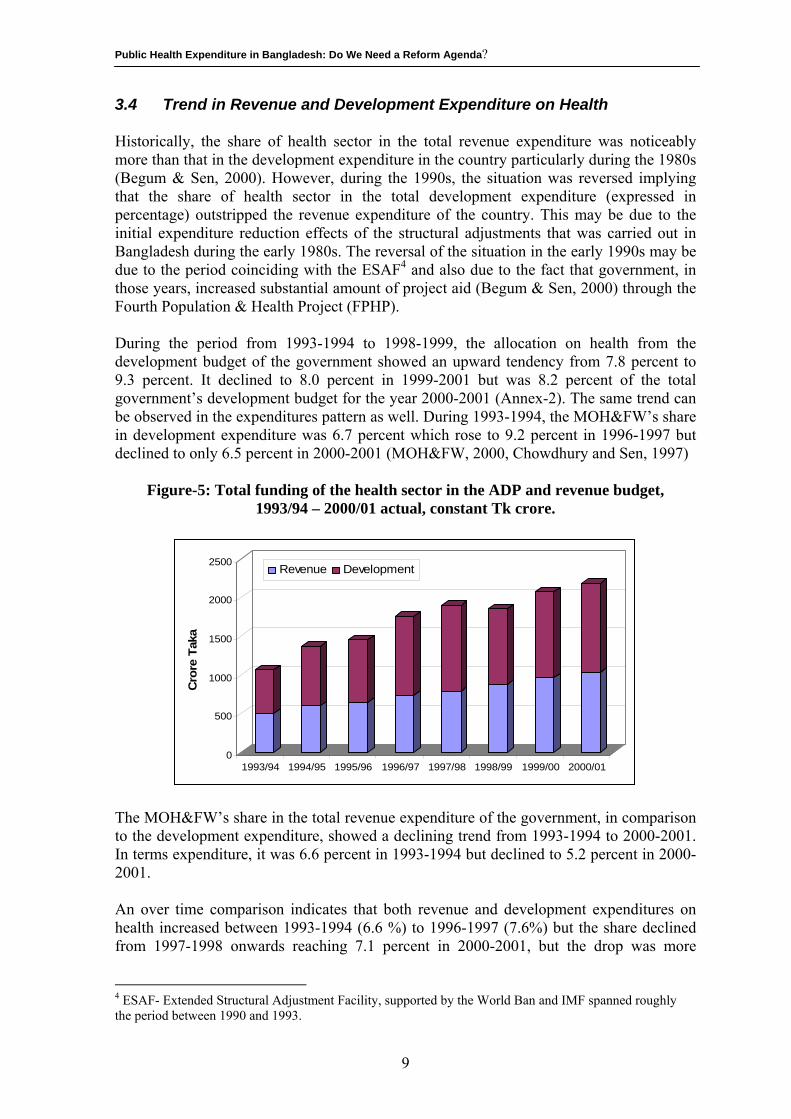
3.4 Trend in Revenue and Development Expenditure on Health Historically, the share of health sector in the total revenue expenditure was noticeably more than that in the development expenditure in the country particularly during the 1980s (Begum & Sen, 2000). However, during the 1990s, the situation was reversed implying that the share of health sector in the total development expenditure (expressed in percentage) outstripped the revenue expenditure of the country. This may be due to the initial expenditure reduction effects of the structural adjustments that was carried out in Bangladesh during the early 1980s. The reversal of the situation in the early 1990s may be due to the period coinciding with the ESAF4 and also due to the fact that government, in those years, increased substantial amount of project aid (Begum & Sen, 2000) through the Fourth Population & Health Project (FPHP). During the period from 1993-1994 to 1998-1999, the allocation on health from the development budget of the government showed an upward tendency from 7.8 percent to 9.3 percent. It declined to 8.0 percent in 1999-2001 but was 8.2 percent of the total government’s development budget for the year 2000-2001 (Annex-2). The same trend can be observed in the expenditures pattern as well. During 1993-1994, the MOH&FW’s share in development expenditure was 6.7 percent which rose to 9.2 percent in 1996-1997 but declined to only 6.5 percent in 2000-2001 (MOH&FW, 2000, Chowdhury and Sen, 1997)
Figure-5: Total funding of the health sector in the ADP and revenue budget, 1993/94 – 2000/01 actual, constant Tk crore.
0
500
1000
1500
2000
2500
Cro
re T
aka
1993/94 1994/95 1995/96 1996/97 1997/98 1998/99 1999/00 2000/01
Revenue Development
The MOH&FW’s share in the total revenue expenditure of the government, in comparison to the development expenditure, showed a declining trend from 1993-1994 to 2000-2001. In terms expenditure, it was 6.6 percent in 1993-1994 but declined to 5.2 percent in 2000-2001. An over time comparison indicates that both revenue and development expenditures on health increased between 1993-1994 (6.6 %) to 1996-1997 (7.6%) but the share declined from 1997-1998 onwards reaching 7.1 percent in 2000-2001, but the drop was more
4 ESAF- Extended Structural Adjustment Facility, supported by the World Ban and IMF spanned roughly the period between 1990 and 1993.
9
Public Health Expenditure in Bangladesh: Do We Need a Reform Agenda?
marked in 1999-2001 (Figure-5) reflecting only 6.1% of the total government expenditure on health (MOH&FW, 2001b). The two categories of expenditure-the revenue and the development did not move in the same direction over the recent years. While the development expenditure had been making an increase during the 1996-1997 to 1998-1999 period, the revenue expenditure on health has eventually declined in 2000-2001 to 5.2 percent from 6.6 percent in 1993-1994 (Data for which are available) 3.4.1 Intra-sectoral Allocation of Expenditure between Health and Family
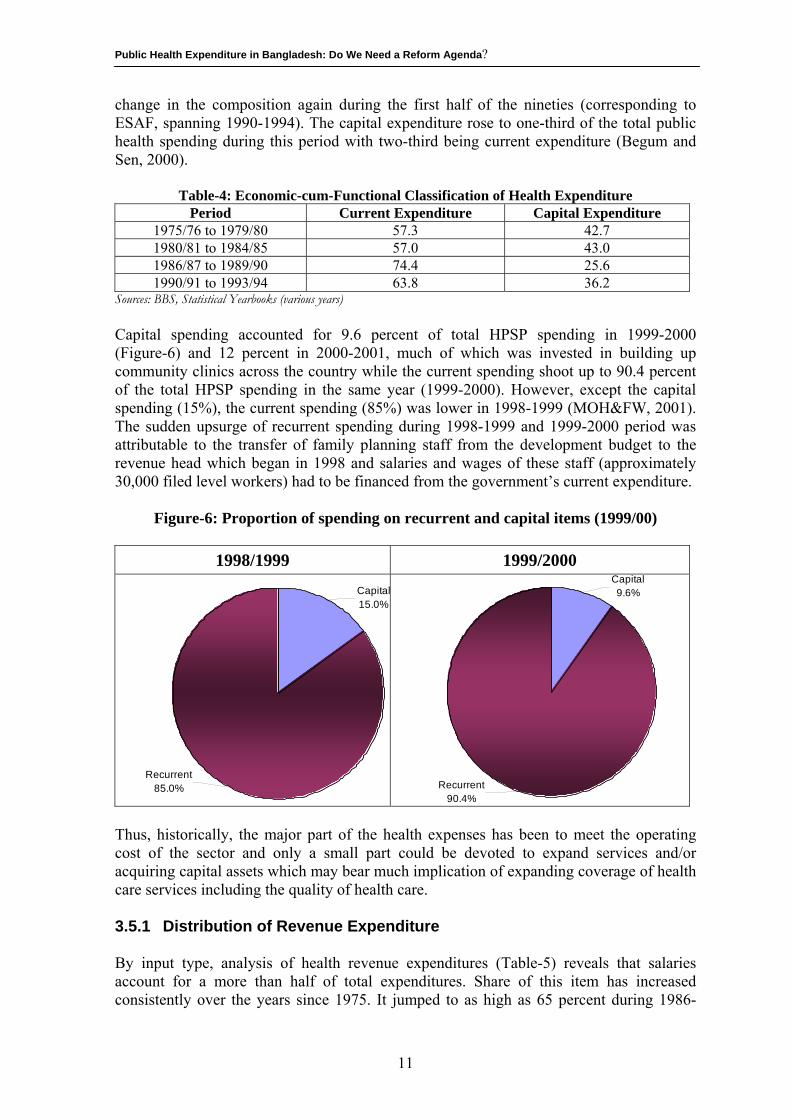
Planning Historically since independence, the country’s health infrastructure was bifurcated into two wings-health and family planning until the beginning of the Health & Population Sector Programme which saw a re-organization of the bifurcated wings of health and family planning into a common management structure in the country since 1st of July1998. The intra-sectoral distribution of the public health expenditure into two separate structure of the MOH&FW, i.e., health and family planning reveals (Annex-3) that the health sector has, traditionally, enjoyed the higher share both in terms of revenue and development expenditure since 1972-1973 until the 1979-1980 period. After this period (1980-1981), while the health sector continued to enjoy higher allocation in revenue expenditure until the 1996-1997 period (years upto which data on intra-sectoral allocation between health and family planning are available), the family planning sector, on the other hand, outgrew the health sector in terms of development expenditure allocation until the 1995-1996 period. This was partly due to increased project aid coming to the family planning sector from external sources during these period and partly due to the increased allocation given to the sector by the government for large scale family planning programme in the country. This trend continued until the end of 1994-1995 when the development expenditure on health again outstripped the corresponding expenditure on family planning in two successive years, both in 1995-1996 and also in 1996-1997 (DGHS, 1998). This was mostly due to re-distribution of unspent resources from the family planning into the health sector and also due to the increased allocation to the health sector from the fourth Population & Health project of the government. During the 1996-1997 period however, the revenue expenditure on health (716.00 million taka), showing an incremental increase al through from 1975-1976, outstripped the corresponding expenditure on family planning (50.78 million take) by almost 14 times. 3.5 Nature of Health Expenditure The economic-cum-functional classification of health expenditure reveals that during the 1975-1976 to 1984-1985 period, nearly 60 percent of the total health expenditure was “current” in nature, i.e., was consumption expenditure involving expenses on wages, salaries, commodities and services (Table-4). The remaining 40 percent was for acquisition of fixed capital assets (Begum and Sen, 2000). In the second half of 1980s when structural adjustments was underway and development expenditure declined substantially, as high as three-fourth expenditure of the sector fell under the “ current” category and one-fourth was in the nature of capital spending. There has been some
10
Public Health Expenditure in Bangladesh: Do We Need a Reform Agenda?
change in the composition again during the first half of the nineties (corresponding to ESAF, spanning 1990-1994). The capital expenditure rose to one-third of the total public health spending during this period with two-third being current expenditure (Begum and Sen, 2000).
Table-4: Economic-cum-Functional Classification of Health Expenditure Period Current Expenditure Capital Expenditure
1975/76 to 1979/80 57.3 42.7 1980/81 to 1984/85 57.0 43.0 1986/87 to 1989/90 74.4 25.6 1990/91 to 1993/94 63.8 36.2
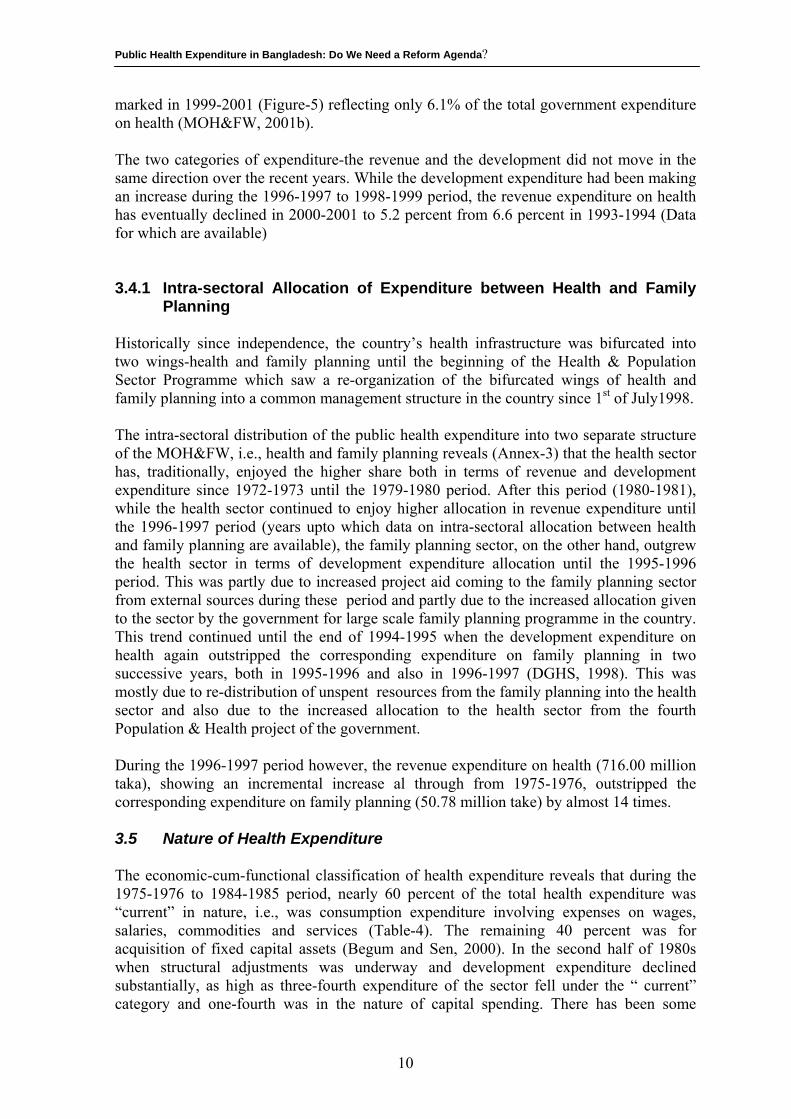
Sources: BBS, Statistical Yearbooks (various years) Capital spending accounted for 9.6 percent of total HPSP spending in 1999-2000 (Figure-6) and 12 percent in 2000-2001, much of which was invested in building up community clinics across the country while the current spending shoot up to 90.4 percent of the total HPSP spending in the same year (1999-2000). However, except the capital spending (15%), the current spending (85%) was lower in 1998-1999 (MOH&FW, 2001). The sudden upsurge of recurrent spending during 1998-1999 and 1999-2000 period was attributable to the transfer of family planning staff from the development budget to the revenue head which began in 1998 and salaries and wages of these staff (approximately 30,000 filed level workers) had to be financed from the government’s current expenditure.
Figure-6: Proportion of spending on recurrent and capital items (1999/00)
1998/1999 1999/2000
Recurrent85.0%
Capital15.0%
Recurrent90.4%
Capital9.6%
Thus, historically, the major part of the health expenses has been to meet the operating cost of the sector and only a small part could be devoted to expand services and/or acquiring capital assets which may bear much implication of expanding coverage of health care services including the quality of health care. 3.5.1 Distribution of Revenue Expenditure By input type, analysis of health revenue expenditures (Table-5) reveals that salaries account for a more than half of total expenditures. Share of this item has increased consistently over the years since 1975. It jumped to as high as 65 percent during 1986-
11
Public Health Expenditure in Bangladesh: Do We Need a Reform Agenda?
1990 and remained at that level over the first half of nineties. Another area showing continuous expansion in share in the revenue budget is the civil works meant for repair and maintenance. In sharp contrast, the relative share of the expenditure on medical and surgical requisites (MSR) from which the cost of non-personnel items of health care including drugs and medicines are met have shown a decline (Begum & Sen, 2000). Thus, material support and the logistics for health care which often bear critical importance for the quality and efficacy of health care got increasingly marginalized over the years.
Table-5: Component-wise break up of Health Revenue Expenditure Components 1975/76 to
1979/80 1980/81 to
1984/85 1986/87 to
1989/90 1990/91 to
1994/95 Pay and Allowances 50.0 53.8 64.9 65.8 Medical & Surgical Requisite (MSR)
20.4 23.0 17.3 16.5
Other Expenses (Including Diet)
27.3 21.0 14.0 10.4
Grants 1.8 1.5 1.6 2.0 Civil Works - 0.8 1.2 5.3
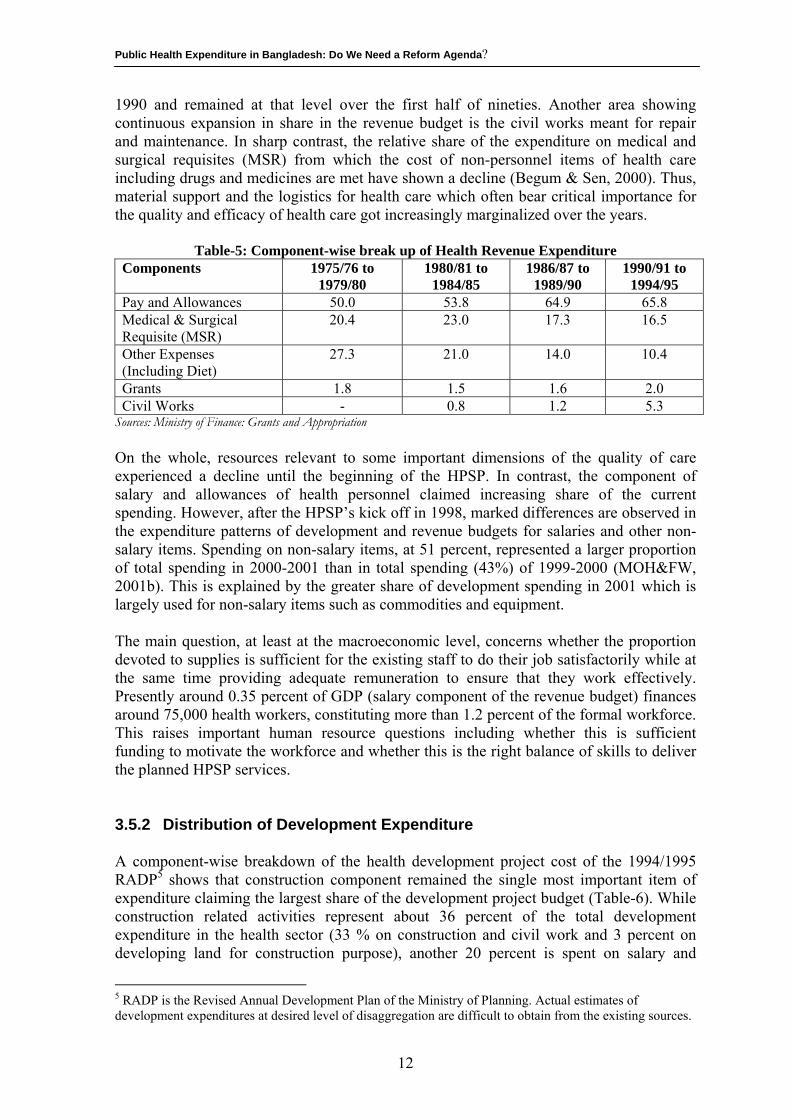
Sources: Ministry of Finance: Grants and Appropriation On the whole, resources relevant to some important dimensions of the quality of care experienced a decline until the beginning of the HPSP. In contrast, the component of salary and allowances of health personnel claimed increasing share of the current spending. However, after the HPSP’s kick off in 1998, marked differences are observed in the expenditure patterns of development and revenue budgets for salaries and other non-salary items. Spending on non-salary items, at 51 percent, represented a larger proportion of total spending in 2000-2001 than in total spending (43%) of 1999-2000 (MOH&FW, 2001b). This is explained by the greater share of development spending in 2001 which is largely used for non-salary items such as commodities and equipment. The main question, at least at the macroeconomic level, concerns whether the proportion devoted to supplies is sufficient for the existing staff to do their job satisfactorily while at the same time providing adequate remuneration to ensure that they work effectively. Presently around 0.35 percent of GDP (salary component of the revenue budget) finances around 75,000 health workers, constituting more than 1.2 percent of the formal workforce. This raises important human resource questions including whether this is sufficient funding to motivate the workforce and whether this is the right balance of skills to deliver the planned HPSP services. 3.5.2 Distribution of Development Expenditure A component-wise breakdown of the health development project cost of the 1994/1995 RADP5 shows that construction component remained the single most important item of expenditure claiming the largest share of the development project budget (Table-6). While construction related activities represent about 36 percent of the total development expenditure in the health sector (33 % on construction and civil work and 3 percent on developing land for construction purpose), another 20 percent is spent on salary and
5 RADP is the Revised Annual Development Plan of the Ministry of Planning. Actual estimates of development expenditures at desired level of disaggregation are difficult to obtain from the existing sources.
12
Public Health Expenditure in Bangladesh: Do We Need a Reform Agenda?
allowances, training, consultancy, tax/duty and research and evaluation purposes. An equal amount is spent on “miscellaneous” expenditure and this fund is usually spent to meet the cost overruns of the projects (Begum and Sen, 2000). Set against these, the amount spent for procuring equipment, vehicle, furniture, ambulance and the likes account for 14 percent of the development expenditure. The matched figures for drugs/vaccine supply is even less (11%). Thus, of the total development expenditure for health, only a quarter has been spent on items, until the 1994/1995 period in the country, upon which much of the quality and efficacy of the services delivered depended.
Table-6: Major Component-wise Break-up of Projects Costs of the Health Sector included in 1994/95 RADP
Component % of Total Cost Pay & Allowances 7.00 Construction/Civil Work 33.20 Land/Land Development 2.81 Equipment/Furniture 13.78 Training 4.03 Consultancy 1.84 Drug/Vaccine Supply 11.00 CDVAT 5.18 Research & Evaluation 1.06 Miscellaneous 20.10 Total 100.00
Source: Project Document of the Planning Commission. 3.5.3 Spending on the Essential Services Package
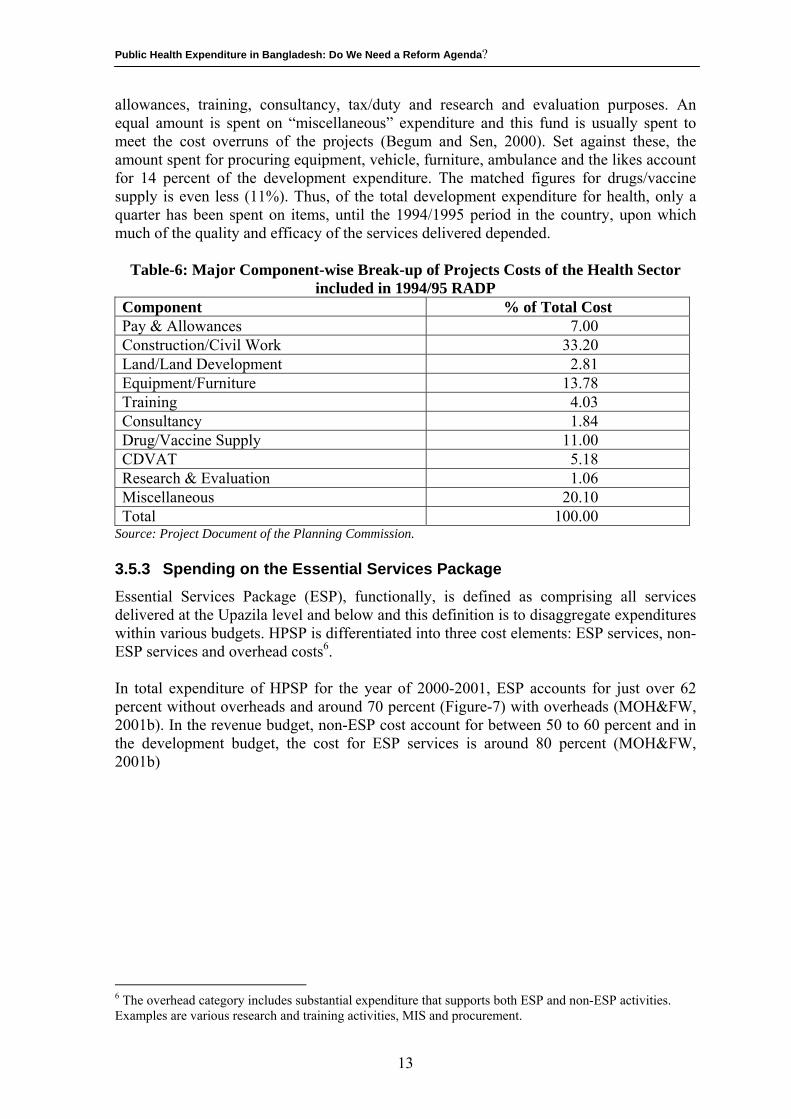
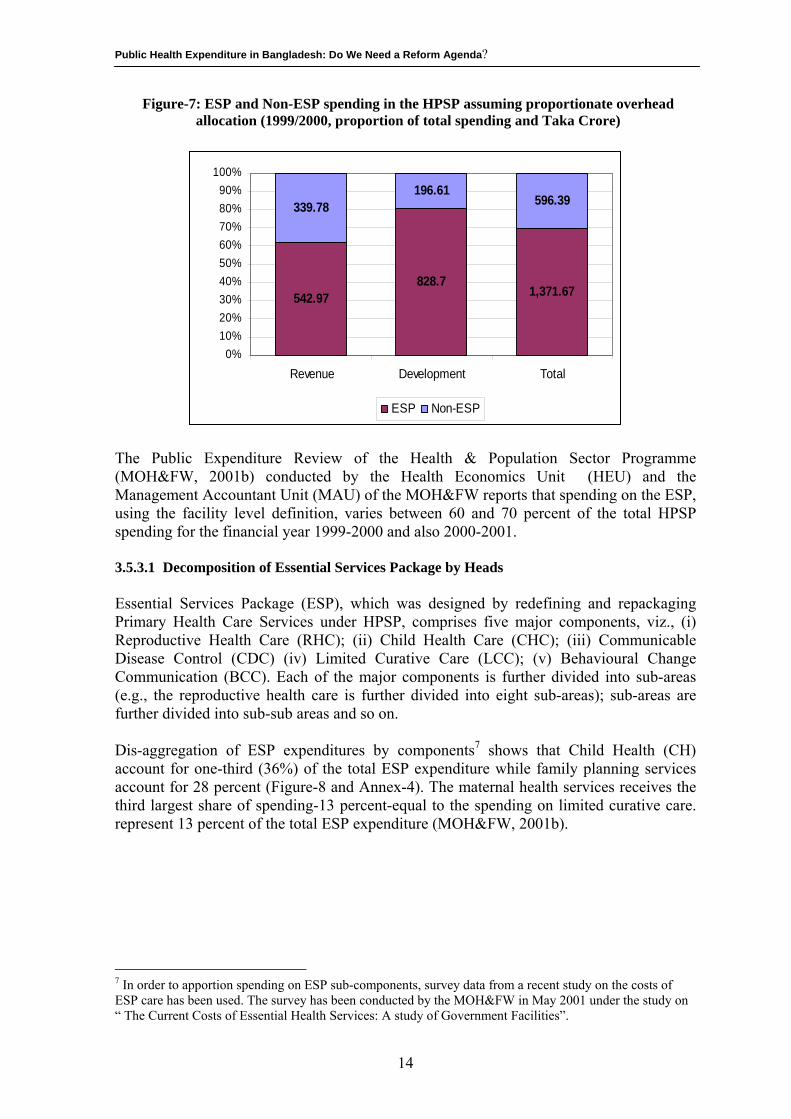
Essential Services Package (ESP), functionally, is defined as comprising all services delivered at the Upazila level and below and this definition is to disaggregate expenditures within various budgets. HPSP is differentiated into three cost elements: ESP services, non-ESP services and overhead costs6. In total expenditure of HPSP for the year of 2000-2001, ESP accounts for just over 62 percent without overheads and around 70 percent (Figure-7) with overheads (MOH&FW, 2001b). In the revenue budget, non-ESP cost account for between 50 to 60 percent and in the development budget, the cost for ESP services is around 80 percent (MOH&FW, 2001b)
6 The overhead category includes substantial expenditure that supports both ESP and non-ESP activities. Examples are various research and training activities, MIS and procurement.
13
Public Health Expenditure in Bangladesh: Do We Need a Reform Agenda?
Figure-7: ESP and Non-ESP spending in the HPSP assuming proportionate overhead allocation (1999/2000, proportion of total spending and Taka Crore)
542.97828.7
1,371.67
339.78196.61
596.39
0%10%20%30%40%50%60%70%80%90%
100%
Revenue Development Total
ESP Non-ESP
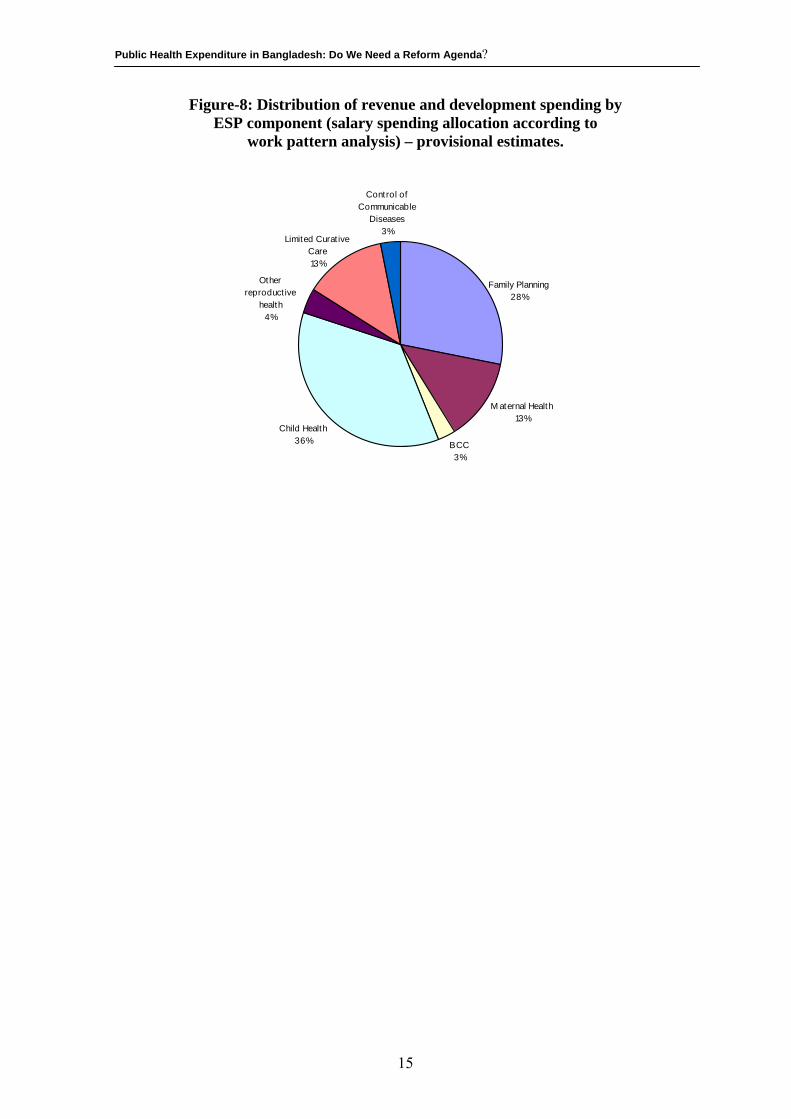
The Public Expenditure Review of the Health & Population Sector Programme (MOH&FW, 2001b) conducted by the Health Economics Unit (HEU) and the Management Accountant Unit (MAU) of the MOH&FW reports that spending on the ESP, using the facility level definition, varies between 60 and 70 percent of the total HPSP spending for the financial year 1999-2000 and also 2000-2001. 3.5.3.1 Decomposition of Essential Services Package by Heads Essential Services Package (ESP), which was designed by redefining and repackaging Primary Health Care Services under HPSP, comprises five major components, viz., (i) Reproductive Health Care (RHC); (ii) Child Health Care (CHC); (iii) Communicable Disease Control (CDC) (iv) Limited Curative Care (LCC); (v) Behavioural Change Communication (BCC). Each of the major components is further divided into sub-areas (e.g., the reproductive health care is further divided into eight sub-areas); sub-areas are further divided into sub-sub areas and so on. Dis-aggregation of ESP expenditures by components7 shows that Child Health (CH) account for one-third (36%) of the total ESP expenditure while family planning services account for 28 percent (Figure-8 and Annex-4). The maternal health services receives the third largest share of spending-13 percent-equal to the spending on limited curative care. represent 13 percent of the total ESP expenditure (MOH&FW, 2001b).
7 In order to apportion spending on ESP sub-components, survey data from a recent study on the costs of ESP care has been used. The survey has been conducted by the MOH&FW in May 2001 under the study on “ The Current Costs of Essential Health Services: A study of Government Facilities”.
14
Public Health Expenditure in Bangladesh: Do We Need a Reform Agenda?
Figure-8: Distribution of revenue and development spending by ESP component (salary spending allocation according to
work pattern analysis) – provisional estimates.
M aternal Health13%
BCC3%
Child Health36%
Other reproduct ive
health4%
Limited Curat ive Care13%
Control of Communicable
Diseases3%
Family Planning28%
15
Public Health Expenditure in Bangladesh: Do We Need a Reform Agenda?
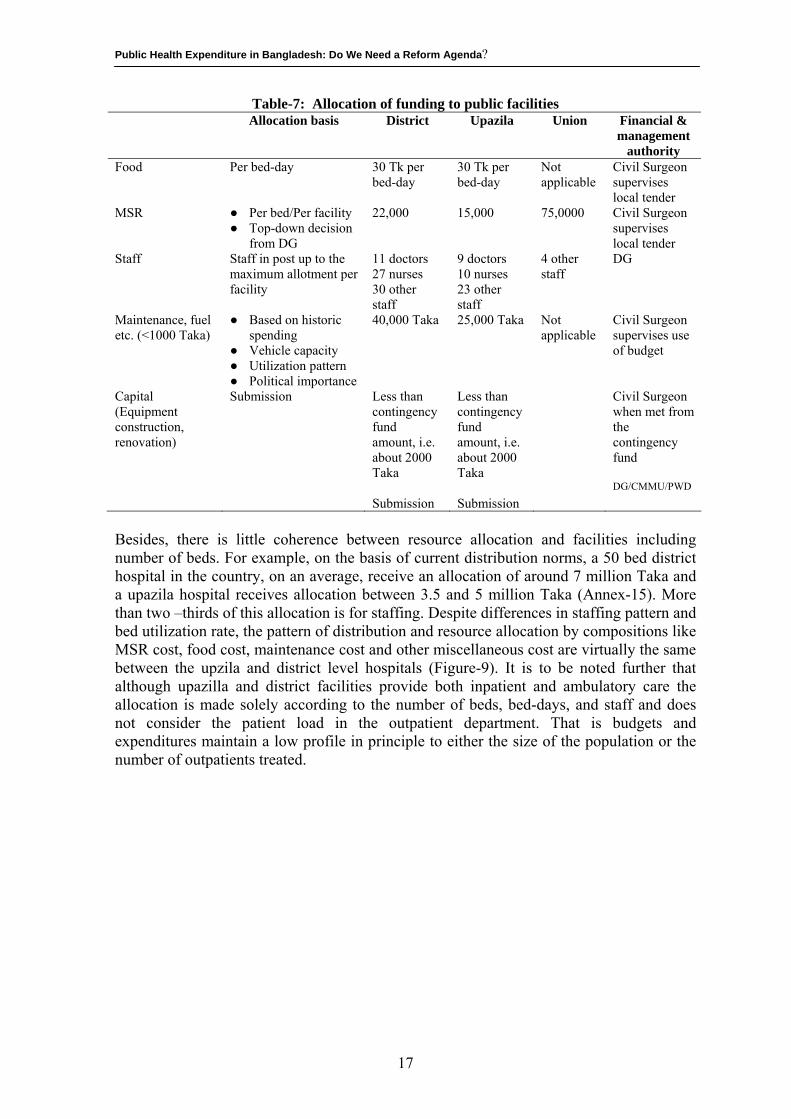
4. DISTRIBUTION OF PUBLIC HEALTH EXPENDITURE The analysis of public expenditure by activity and line items provides an aggregate picture of how public funds are allocated. Inasmuch as the central objective of the HPSP of the government remains to target public health services on the most vulnerable: women, children and the poor, it is important to assess the extent to which this is actually taking place through the allocation of public subsidies as indicated by the use of services by these target groups. Mapping the flow of public funds through the system to the final beneficiaries of service using dis-aggregated data on spending and users, therefore, provide a valuable tool to assess how much the public health spending is being distributed according to need. 4.1 Resource allocation in Bangladesh: Current methods Resources are currently allocated to districts and upazilas, in the country, largely according to the size of inpatient facilities and numbers of staff in post. This leads to wide differences in district per capita allocations in both the revenue and (government) development budget. These differences do not appear to be explained by differences in health need. Indeed analysis suggests that the allocations have no significant positive relationship to health need and may even be inversely related to general deprivation of the area (Ensor et al, 2001). Budgets for most categories of regular expenditure in Bangladesh are determined centrally (Ensor et al, 2001). The system can best be characterized as line budgets based on capacity and historically determined normativs. Line budgets mean that resources are allocated for specific line items (e.g. diet, MSR, etc) and virement between lines is not possible. Once budgets have been agreed with the Ministry of Finance, it is very difficult to move funding between lines. The MOH&FW is permitted to move funding only within the same broad economic code (e.g. within staff pay and allowance or within supplies) No movement is permitted from the pay code to another code (Ensor et al, 2001). Capacity and historic normative mean that budget setting is based both on the size of physical capacity as measured by the number of facilities, staff or beds and also funding provided to the same facilities in previous years. Historic pattern flows are taken into account in setting the budgets for diets. The distribution of beds and facilities is extremely important in determining the level of of funding for each area. Revenue funding for inpatient facilities is largely determined by the number of beds and staff (Table-7). An upazila level hospital with a 31 bed facility receives the same allocation (30 taka per bed day) as that of a district hospital with twice or in some instances, 3-4 times the number of beds that a upazaila hospital has. Because of relatively large number of beds in the district hospitals in comparison to upazila hospitals, the per bed allocation for MSR in the district hospitals in the country, currently, is Tk. 22,000 against Taka 15,000 per bed in the upazila hospitals.
16
Public Health Expenditure in Bangladesh: Do We Need a Reform Agenda?
Table-7: Allocation of funding to public facilities Allocation basis District Upazila Union Financial &
management authority
Food Per bed-day 30 Tk per bed-day
30 Tk per bed-day
Not applicable
Civil Surgeon supervises local tender
MSR ● Per bed/Per facility ● Top-down decision
from DG
22,000 15,000 75,0000 Civil Surgeon supervises local tender
Staff Staff in post up to the maximum allotment per facility
11 doctors 27 nurses 30 other staff
9 doctors 10 nurses 23 other staff
4 other staff
DG
Maintenance, fuel etc. (<1000 Taka)
● Based on historic spending
● Vehicle capacity ● Utilization pattern ● Political importance
40,000 Taka 25,000 Taka Not applicable
Civil Surgeon supervises use of budget
Capital (Equipment construction, renovation)
Submission Less than contingency fund amount, i.e. about 2000 Taka Submission
Less than contingency fund amount, i.e. about 2000 Taka Submission
Civil Surgeon when met from the contingency fund DG/CMMU/PWD
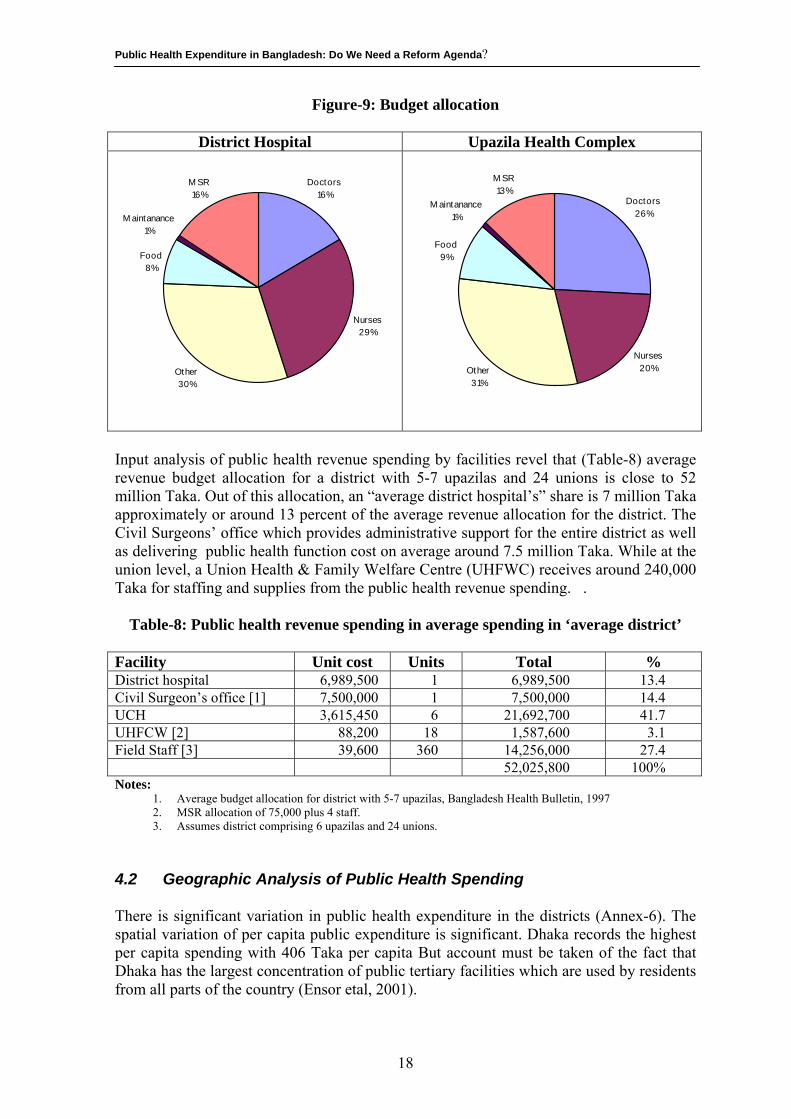
Besides, there is little coherence between resource allocation and facilities including number of beds. For example, on the basis of current distribution norms, a 50 bed district hospital in the country, on an average, receive an allocation of around 7 million Taka and a upazila hospital receives allocation between 3.5 and 5 million Taka (Annex-15). More than two –thirds of this allocation is for staffing. Despite differences in staffing pattern and bed utilization rate, the pattern of distribution and resource allocation by compositions like MSR cost, food cost, maintenance cost and other miscellaneous cost are virtually the same between the upzila and district level hospitals (Figure-9). It is to be noted further that although upazilla and district facilities provide both inpatient and ambulatory care the allocation is made solely according to the number of beds, bed-days, and staff and does not consider the patient load in the outpatient department. That is budgets and expenditures maintain a low profile in principle to either the size of the population or the number of outpatients treated.
17
Public Health Expenditure in Bangladesh: Do We Need a Reform Agenda?
Figure-9: Budget allocation
District Hospital Upazila Health Complex
Doctors16%
Nurses29%
Other30%
M SR16%
Food8%
M aintanance1%
Doctors26%
Nurses20%Other
31%
M SR13%
Food9%
M aintanance1%
Input analysis of public health revenue spending by facilities revel that (Table-8) average revenue budget allocation for a district with 5-7 upazilas and 24 unions is close to 52 million Taka. Out of this allocation, an “average district hospital’s” share is 7 million Taka approximately or around 13 percent of the average revenue allocation for the district. The Civil Surgeons’ office which provides administrative support for the entire district as well as delivering public health function cost on average around 7.5 million Taka. While at the union level, a Union Health & Family Welfare Centre (UHFWC) receives around 240,000 Taka for staffing and supplies from the public health revenue spending. .
Table-8: Public health revenue spending in average spending in ‘average district’ Facility Unit cost Units Total % District hospital 6,989,500 1 6,989,500 13.4 Civil Surgeon’s office [1] 7,500,000 1 7,500,000 14.4 UCH 3,615,450 6 21,692,700 41.7 UHFCW [2] 88,200 18 1,587,600 3.1 Field Staff [3] 39,600 360 14,256,000 27.4 52,025,800 100% Notes:
1. Average budget allocation for district with 5-7 upazilas, Bangladesh Health Bulletin, 1997 2. MSR allocation of 75,000 plus 4 staff. 3. Assumes district comprising 6 upazilas and 24 unions.
4.2 Geographic Analysis of Public Health Spending There is significant variation in public health expenditure in the districts (Annex-6). The spatial variation of per capita public expenditure is significant. Dhaka records the highest per capita spending with 406 Taka per capita But account must be taken of the fact that Dhaka has the largest concentration of public tertiary facilities which are used by residents from all parts of the country (Ensor etal, 2001).
18
Public Health Expenditure in Bangladesh: Do We Need a Reform Agenda?
In all divisions, with the exception of Chittagong, the “ capital district” has highest per capita expenditure, reflecting higher concentration of facilities. In Chittagong, the districts of Rangamati, Bhandarban and Cox’s Bazar all have higher expenditures than Chittagong itself, largely because of additional allocations given to the hill tract areas. Outside Dhaka, districts continue to exhibit considerable variation. Spending during 1999-2000 ranged from 54 Taka (Gazipur) to 256 Taka (Bandarban) per head. Variation in spending is apparent both within divisions and between divisions. Within each division, spending tends to be higher in districts with medical colleges. These higher allocations reflect both the training function of these institutions and also the fact that they serve patients from surrounding districts. Yet, even outside the districts with medical college hospitals, substantive variations persist with the maximum allocation to district exceeding the minimum by between 50 and 100 percent in most divisions. One of the most important questions which remains unanswered after the analysis of geographic resource allocation is the extent to which these allocations reflect need for services and to what extent they reflect existing levels of capacity. No clear correlation between allocations and health status of the division is apparent. For instance, Sylhet, which receives a relatively low allocation, has the highest child and infant mortality rate and fertility rate of all the divisions (MOH&FW, 2000). The financial allocation of public health resources at the district level do not reflect health needs of the districts, as has been summarised in the following table (Table-9)
Table-9: Per capita MOHFW spending and divisional demographic features
Division Total per capita MOHFW spending (development and
revenue)
Total per capita GOB plus
reimbursed RPA allocations
IMR CMR Fertility Rate
CPR Percent not
vaccinated
Dhaka 207.2 156.6 90.8 130.0 3.2 50.0 14.9 Chittagong 126.1 94.7 76.8 131.3 4.1 37.0 15.6 Khulna 118.6 89.0 75.2 86.8 2.5 62.0 3.1 Barisal 137.0 102.9 86.3 119.5 3.3 49.0 6.2 Sylhet 125.1 94.0 138.0 179.1 4.2 20.0 22.4 Total 149.5 127.8 3.27 49.2 12.0 Coefficient of variation
0.25 0.25 0.25 0.23 0.20 0.34 0.63
Source: Public Expenditure Review of the Health and Population Sector 1998-1999, Health Economics Unit, Ministry of Health and Family Welfare, p-16, January 2000.
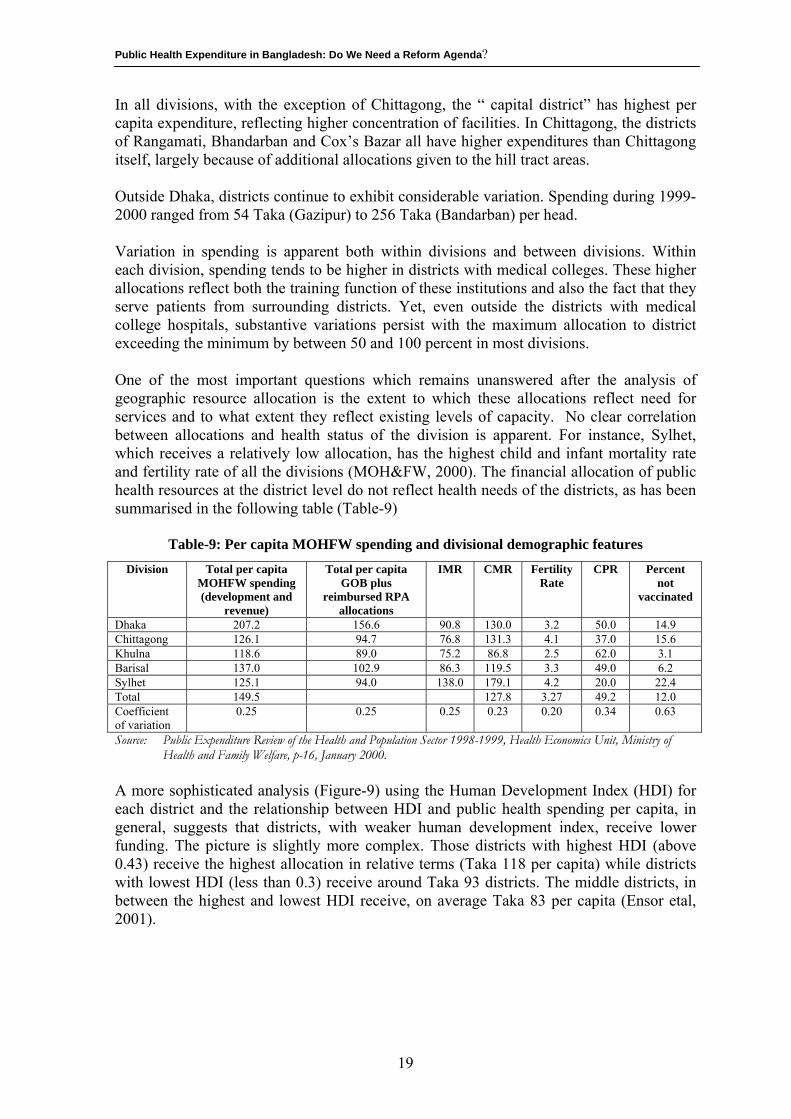
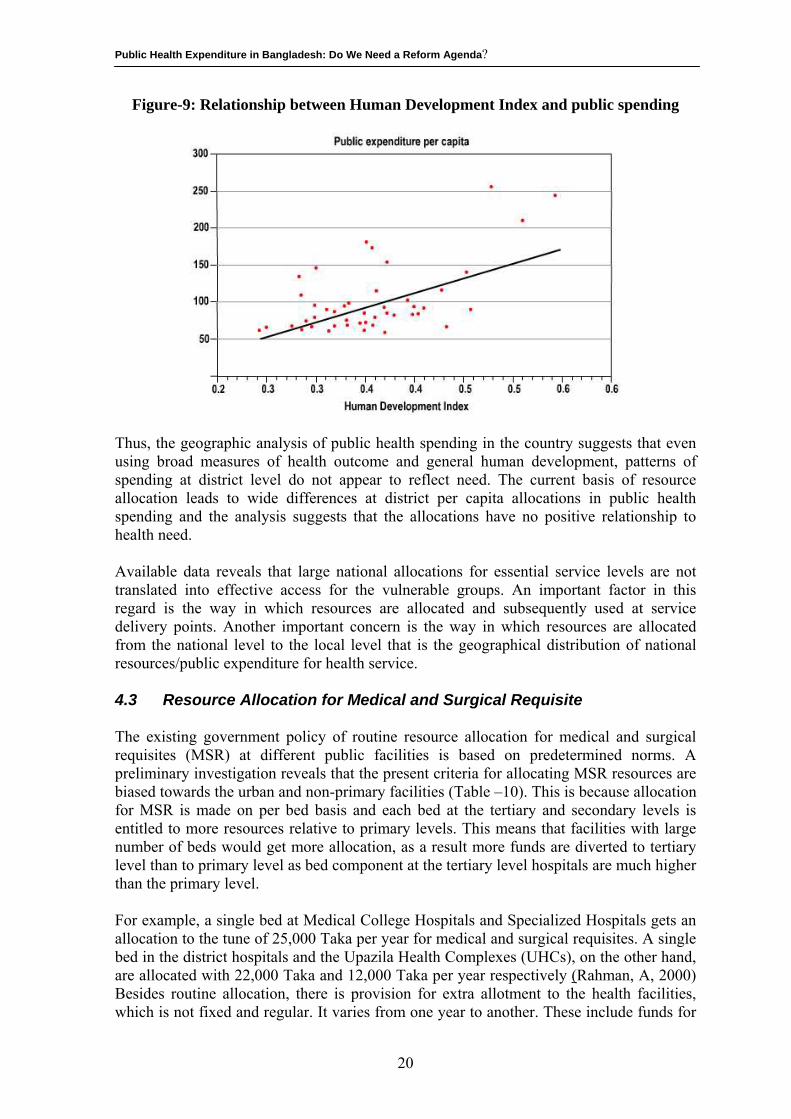
A more sophisticated analysis (Figure-9) using the Human Development Index (HDI) for each district and the relationship between HDI and public health spending per capita, in general, suggests that districts, with weaker human development index, receive lower funding. The picture is slightly more complex. Those districts with highest HDI (above 0.43) receive the highest allocation in relative terms (Taka 118 per capita) while districts with lowest HDI (less than 0.3) receive around Taka 93 districts. The middle districts, in between the highest and lowest HDI receive, on average Taka 83 per capita (Ensor etal, 2001).
19
Public Health Expenditure in Bangladesh: Do We Need a Reform Agenda?
Figure-9: Relationship between Human Development Index and public spending
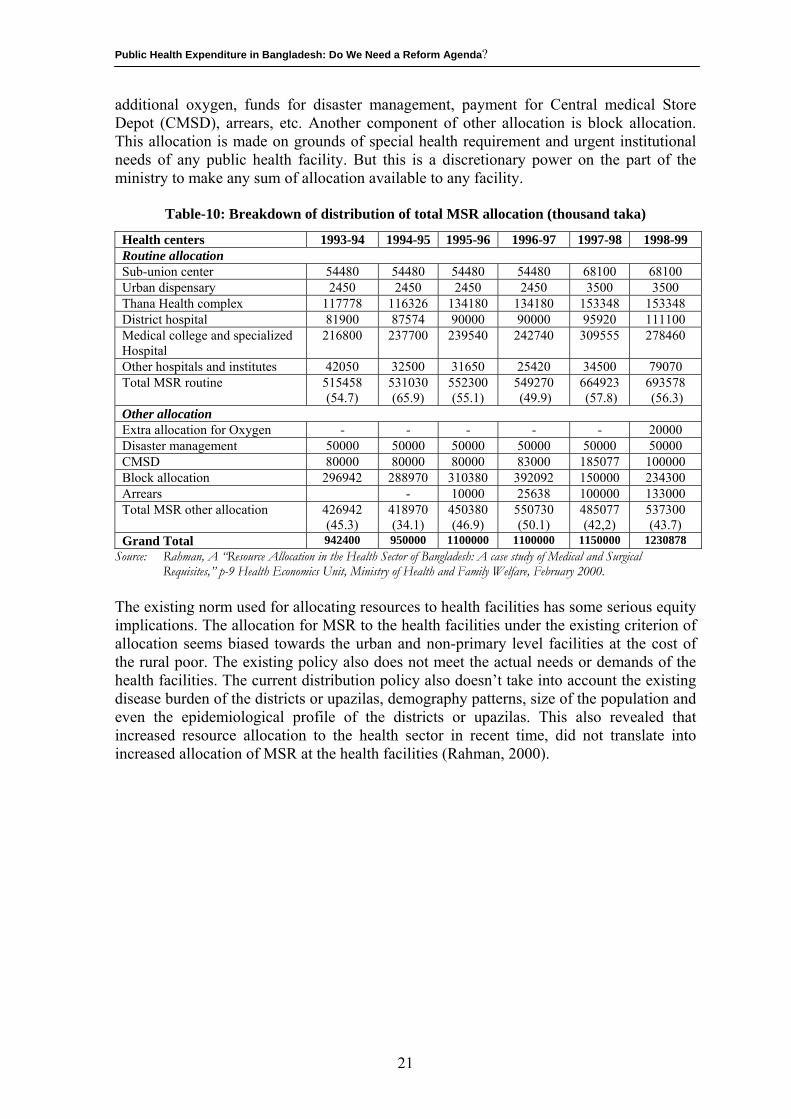
Thus, the geographic analysis of public health spending in the country suggests that even using broad measures of health outcome and general human development, patterns of spending at district level do not appear to reflect need. The current basis of resource allocation leads to wide differences at district per capita allocations in public health spending and the analysis suggests that the allocations have no positive relationship to health need. Available data reveals that large national allocations for essential service levels are not translated into effective access for the vulnerable groups. An important factor in this regard is the way in which resources are allocated and subsequently used at service delivery points. Another important concern is the way in which resources are allocated from the national level to the local level that is the geographical distribution of national resources/public expenditure for health service. 4.3 Resource Allocation for Medical and Surgical Requisite The existing government policy of routine resource allocation for medical and surgical requisites (MSR) at different public facilities is based on predetermined norms. A preliminary investigation reveals that the present criteria for allocating MSR resources are biased towards the urban and non-primary facilities (Table –10). This is because allocation for MSR is made on per bed basis and each bed at the tertiary and secondary levels is entitled to more resources relative to primary levels. This means that facilities with large number of beds would get more allocation, as a result more funds are diverted to tertiary level than to primary level as bed component at the tertiary level hospitals are much higher than the primary level. For example, a single bed at Medical College Hospitals and Specialized Hospitals gets an allocation to the tune of 25,000 Taka per year for medical and surgical requisites. A single bed in the district hospitals and the Upazila Health Complexes (UHCs), on the other hand, are allocated with 22,000 Taka and 12,000 Taka per year respectively (Rahman, A, 2000) Besides routine allocation, there is provision for extra allotment to the health facilities, which is not fixed and regular. It varies from one year to another. These include funds for
20
Public Health Expenditure in Bangladesh: Do We Need a Reform Agenda?
additional oxygen, funds for disaster management, payment for Central medical Store Depot (CMSD), arrears, etc. Another component of other allocation is block allocation. This allocation is made on grounds of special health requirement and urgent institutional needs of any public health facility. But this is a discretionary power on the part of the ministry to make any sum of allocation available to any facility.
Table-10: Breakdown of distribution of total MSR allocation (thousand taka)
Health centers 1993-94 1994-95 1995-96 1996-97 1997-98 1998-99 Routine allocation Sub-union center 54480 54480 54480 54480 68100 68100 Urban dispensary 2450 2450 2450 2450 3500 3500 Thana Health complex 117778 116326 134180 134180 153348 153348 District hospital 81900 87574 90000 90000 95920 111100 Medical college and specialized Hospital
216800 237700 239540 242740 309555 278460
Other hospitals and institutes 42050 32500 31650 25420 34500 79070 Total MSR routine 515458
(54.7) 531030 (65.9)
552300 (55.1)
549270 (49.9)
664923 (57.8)
693578 (56.3)
Other allocation Extra allocation for Oxygen - - - - - 20000 Disaster management 50000 50000 50000 50000 50000 50000 CMSD 80000 80000 80000 83000 185077 100000 Block allocation 296942 288970 310380 392092 150000 234300 Arrears - 10000 25638 100000 133000 Total MSR other allocation 426942
(45.3) 418970 (34.1)
450380 (46.9)
550730 (50.1)
485077 (42,2)
537300 (43.7)
Grand Total 942400 950000 1100000 1100000 1150000 1230878 Source: Rahman, A “Resource Allocation in the Health Sector of Bangladesh: A case study of Medical and Surgical
Requisites,” p-9 Health Economics Unit, Ministry of Health and Family Welfare, February 2000. The existing norm used for allocating resources to health facilities has some serious equity implications. The allocation for MSR to the health facilities under the existing criterion of allocation seems biased towards the urban and non-primary level facilities at the cost of the rural poor. The existing policy also does not meet the actual needs or demands of the health facilities. The current distribution policy also doesn’t take into account the existing disease burden of the districts or upazilas, demography patterns, size of the population and even the epidemiological profile of the districts or upazilas. This also revealed that increased resource allocation to the health sector in recent time, did not translate into increased allocation of MSR at the health facilities (Rahman, 2000).
21
Public Health Expenditure in Bangladesh: Do We Need a Reform Agenda?
5. DISTRIBUTIONAL IMPLICATIONS OF PUBLIC HEALTH SPENDING
In order to address the issue to see how the “ gross” benefits from governments spending such as health are distributed across various income (expenditure ) groups, empirical evidences have been drawn from various studies on household expenditures conducted by Bangladesh Bureau of Statistics (BBS) including the “ benefit incidence analysis (BIA) “ conducted by the Bangladesh Institute of Development Studies (BIDS) and also by the Health Economic Unit (HEU) of the MOH&FW. Such analysis helps to measure the direct income benefit from public health programmes as well as address the issue of re-orientation of public spending. 5.1. Who is benefited from the public spending in Bangladesh: Findings
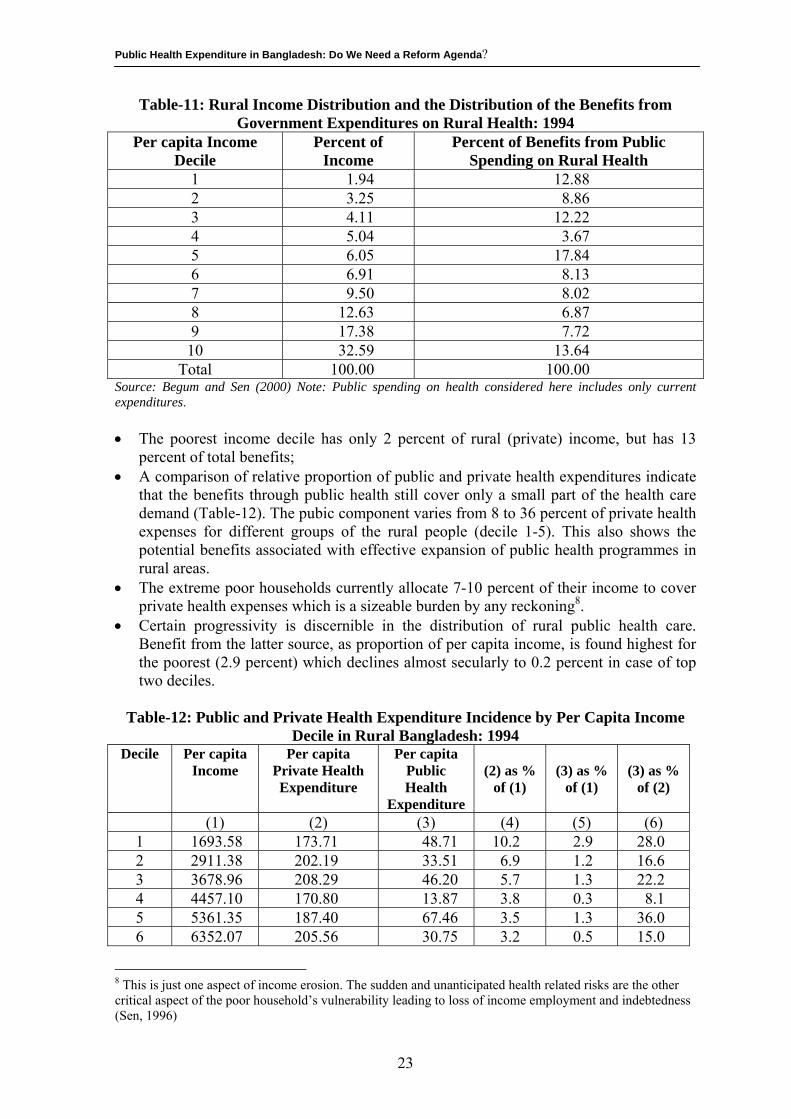
from the Benefit Incidence Analysis (BIA) In conducting the BIA, the BIDS (Chowdhury and Sen, 1997) estimated the gross allocations on health facilities from the macro budgetary data. The BIDS study only conisdered revenue expenditures for estimation of health subsidies. The information on household “ use” of public health services has been measured from the unpublished primary survey data collected by BIDS on a project on poverty monitoring. The survey-based figure of average annual visits per rural person has been used to approximate the total visits to government health facility by rural population. Combining this information, the BIDS calculated from the macro budgetary data that the “gross” subsidy per rural visit to government health facility was Tk. 211 (Begum and Sen, 2000). Evaluating the distribution of spending (i.e., how much of the total public expenditure is received by each income decile) and also through determining what proportion of each decile’s income is represented by public spending on health, the BIA of the BIDS found out: As per the current pattern of utilization of public health facility in rural areas of Bangladesh, the highest benefit is received by the fifth income decile (having 17.8 % of the total transfers). Households located at the top income decile receives slightly higher amount of benefits compared with the poorest decile (13.6 % versus 12.8%). However the emerging pattern is generally pro-poor (Table-11). The share of rural poor in the total stream of benefits from public health spending was about 57 percent which was much higher than the matched figure observed for income distribution (i.e., 22 %)
22
Public Health Expenditure in Bangladesh: Do We Need a Reform Agenda?
Table-11: Rural Income Distribution and the Distribution of the Benefits from Government Expenditures on Rural Health: 1994
Per capita Income Decile
Percent of Income
Percent of Benefits from Public Spending on Rural Health
1 1.94 12.88 2 3.25 8.86 3 4.11 12.22 4 5.04 3.67 5 6.05 17.84 6 6.91 8.13 7 9.50 8.02 8 12.63 6.87 9 17.38 7.72 10 32.59 13.64
Total 100.00 100.00 Source: Begum and Sen (2000) Note: Public spending on health considered here includes only current expenditures. • The poorest income decile has only 2 percent of rural (private) income, but has 13
percent of total benefits; • A comparison of relative proportion of public and private health expenditures indicate
that the benefits through public health still cover only a small part of the health care demand (Table-12). The pubic component varies from 8 to 36 percent of private health expenses for different groups of the rural people (decile 1-5). This also shows the potential benefits associated with effective expansion of public health programmes in rural areas.
• The extreme poor households currently allocate 7-10 percent of their income to cover private health expenses which is a sizeable burden by any reckoning8.
• Certain progressivity is discernible in the distribution of rural public health care. Benefit from the latter source, as proportion of per capita income, is found highest for the poorest (2.9 percent) which declines almost secularly to 0.2 percent in case of top two deciles.
Table-12: Public and Private Health Expenditure Incidence by Per Capita Income
Decile in Rural Bangladesh: 1994 Decile Per capita
Income Per capita
Private Health Expenditure
Per capita Public Health
Expenditure
(2) as %
of (1)
(3) as %
of (1)
(3) as %
of (2)
(1) (2) (3) (4) (5) (6) 1 1693.58 173.71 48.71 10.2 2.9 28.0 2 2911.38 202.19 33.51 6.9 1.2 16.6 3 3678.96 208.29 46.20 5.7 1.3 22.2 4 4457.10 170.80 13.87 3.8 0.3 8.1 5 5361.35 187.40 67.46 3.5 1.3 36.0 6 6352.07 205.56 30.75 3.2 0.5 15.0
8 This is just one aspect of income erosion. The sudden and unanticipated health related risks are the other critical aspect of the poor household’s vulnerability leading to loss of income employment and indebtedness (Sen, 1996)
23
Public Health Expenditure in Bangladesh: Do We Need a Reform Agenda?
7 7930.18 194.14 32.59 2.4 0.4 16.8 8 9986.57 251.23 25.79 2.5 0.3 10.3 9 14291.59 297.74 27.50 2.1 0.2 9.2 10 26915.58 626.57 51.66 2.3 0.2 8.2 All 8317.66 251.11 37.82 3.0 0.5 15.1
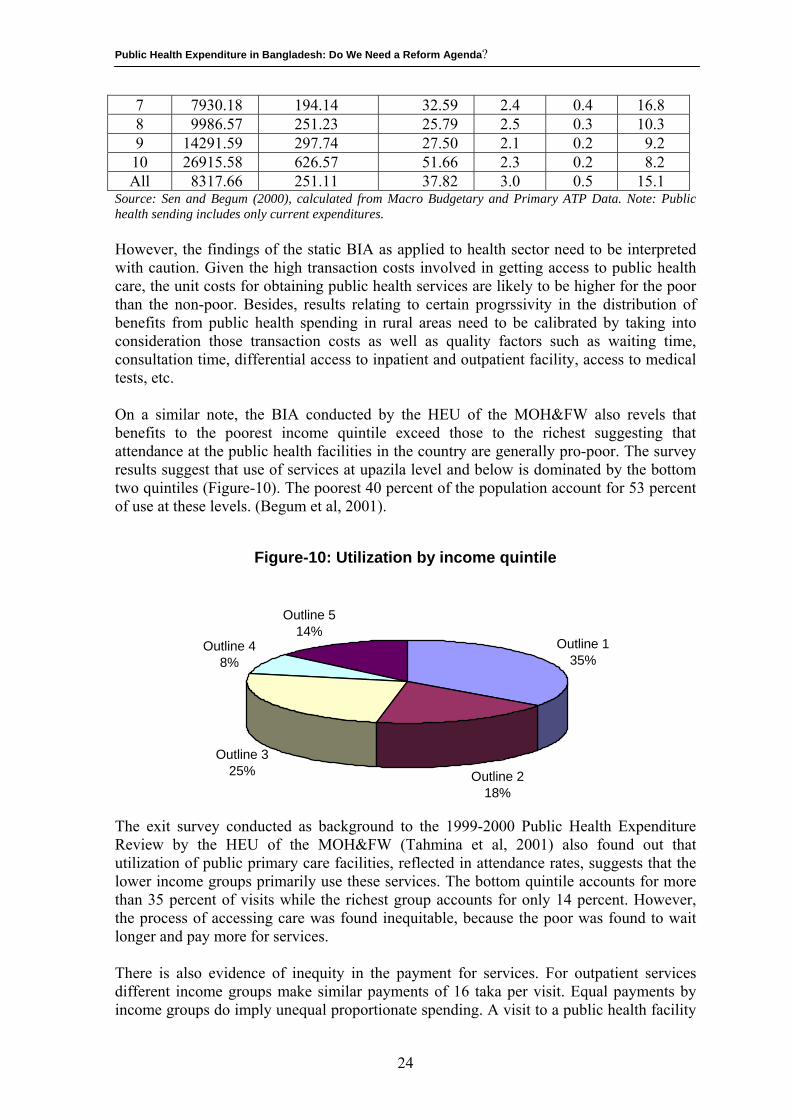
Source: Sen and Begum (2000), calculated from Macro Budgetary and Primary ATP Data. Note: Public health sending includes only current expenditures. However, the findings of the static BIA as applied to health sector need to be interpreted with caution. Given the high transaction costs involved in getting access to public health care, the unit costs for obtaining public health services are likely to be higher for the poor than the non-poor. Besides, results relating to certain progrssivity in the distribution of benefits from public health spending in rural areas need to be calibrated by taking into consideration those transaction costs as well as quality factors such as waiting time, consultation time, differential access to inpatient and outpatient facility, access to medical tests, etc. On a similar note, the BIA conducted by the HEU of the MOH&FW also revels that benefits to the poorest income quintile exceed those to the richest suggesting that attendance at the public health facilities in the country are generally pro-poor. The survey results suggest that use of services at upazila level and below is dominated by the bottom two quintiles (Figure-10). The poorest 40 percent of the population account for 53 percent of use at these levels. (Begum et al, 2001).
Figure-10: Utilization by income quintile
Outline 135%
Outline 218%
Outline 325%
Outline 48%
Outline 514%
The exit survey conducted as background to the 1999-2000 Public Health Expenditure Review by the HEU of the MOH&FW (Tahmina et al, 2001) also found out that utilization of public primary care facilities, reflected in attendance rates, suggests that the lower income groups primarily use these services. The bottom quintile accounts for more than 35 percent of visits while the richest group accounts for only 14 percent. However, the process of accessing care was found inequitable, because the poor was found to wait longer and pay more for services. There is also evidence of inequity in the payment for services. For outpatient services different income groups make similar payments of 16 taka per visit. Equal payments by income groups do imply unequal proportionate spending. A visit to a public health facility
24
Public Health Expenditure in Bangladesh: Do We Need a Reform Agenda?
costs a poor household about 19 percent of per capita household income compared to 4 percent for the richest quartile (Begum et al, 2001). 5.2 Who pays more and how much for health care costs?: Evidences
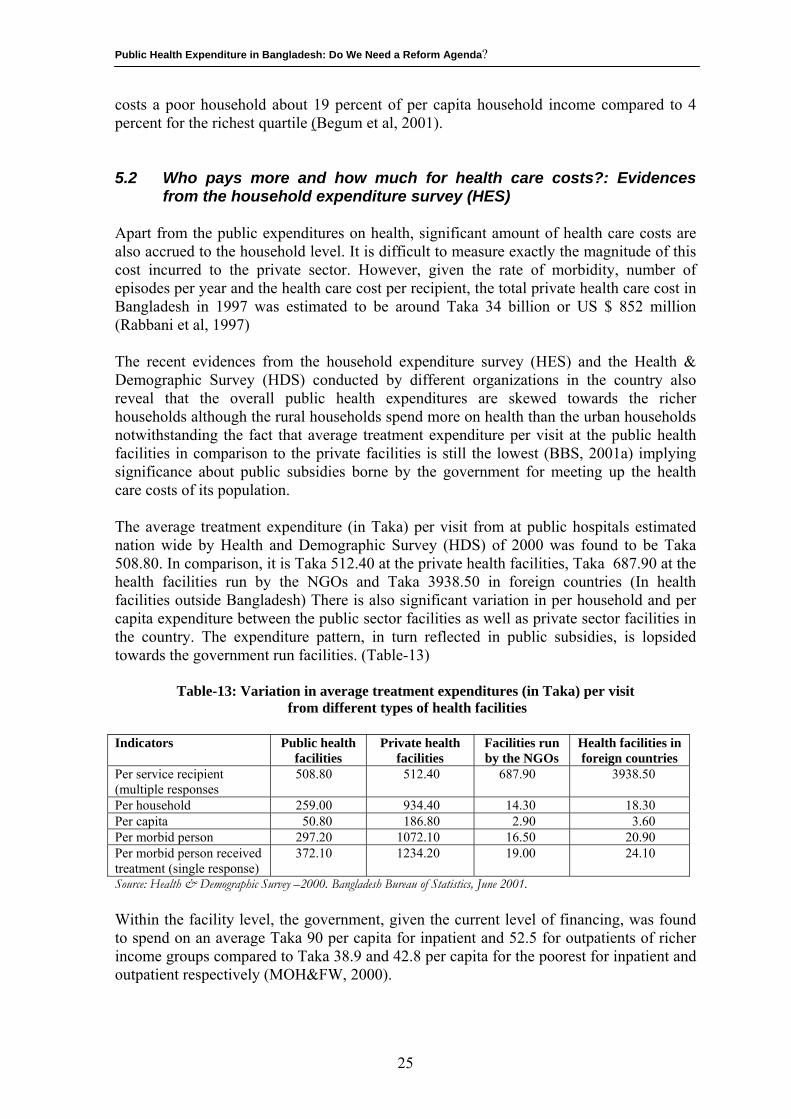
from the household expenditure survey (HES) Apart from the public expenditures on health, significant amount of health care costs are also accrued to the household level. It is difficult to measure exactly the magnitude of this cost incurred to the private sector. However, given the rate of morbidity, number of episodes per year and the health care cost per recipient, the total private health care cost in Bangladesh in 1997 was estimated to be around Taka 34 billion or US $ 852 million (Rabbani et al, 1997) The recent evidences from the household expenditure survey (HES) and the Health & Demographic Survey (HDS) conducted by different organizations in the country also reveal that the overall public health expenditures are skewed towards the richer households although the rural households spend more on health than the urban households notwithstanding the fact that average treatment expenditure per visit at the public health facilities in comparison to the private facilities is still the lowest (BBS, 2001a) implying significance about public subsidies borne by the government for meeting up the health care costs of its population. The average treatment expenditure (in Taka) per visit from at public hospitals estimated nation wide by Health and Demographic Survey (HDS) of 2000 was found to be Taka 508.80. In comparison, it is Taka 512.40 at the private health facilities, Taka 687.90 at the health facilities run by the NGOs and Taka 3938.50 in foreign countries (In health facilities outside Bangladesh) There is also significant variation in per household and per capita expenditure between the public sector facilities as well as private sector facilities in the country. The expenditure pattern, in turn reflected in public subsidies, is lopsided towards the government run facilities. (Table-13)
Table-13: Variation in average treatment expenditures (in Taka) per visit from different types of health facilities
Indicators Public health
facilities Private health
facilities Facilities run by the NGOs
Health facilities in foreign countries
Per service recipient (multiple responses
508.80 512.40 687.90 3938.50
Per household 259.00 934.40 14.30 18.30 Per capita 50.80 186.80 2.90 3.60 Per morbid person 297.20 1072.10 16.50 20.90 Per morbid person received treatment (single response)
372.10 1234.20 19.00 24.10
Source: Health & Demographic Survey –2000. Bangladesh Bureau of Statistics, June 2001. Within the facility level, the government, given the current level of financing, was found to spend on an average Taka 90 per capita for inpatient and 52.5 for outpatients of richer income groups compared to Taka 38.9 and 42.8 per capita for the poorest for inpatient and outpatient respectively (MOH&FW, 2000).
25
Public Health Expenditure in Bangladesh: Do We Need a Reform Agenda?
The Morbidity and Health Status Survey (MHSS) of Bangladesh Bureau of Statistics estimated the total health care expenditure by all dwelling households in the country (excluding the institutional and floating population) during 1994-1995 (mid February through mid January) to be around Tk. 3789 crores or around 2.3% of GDP (Rabbani et al, 1997). At the household level, the total expenditures by rural households was estimated to be around Taka 2767 crores or 73 percent of the national total and expenditures by urban households was estimated to be around Taka 1022 crores or around 27% of the national total. The urban households on the average were found to spend relatively more on services (46% of the total expenditures) like physicians fee, diagnostic fees, etc while rural households spend proportionately more on medicine (66% of the total rural expenditure). Analyzing the data sets of HES9 conducted by the Bangladesh Bureau of Statistics another study on the “ Household Expenditure Behaviour” conducted by the Institute of Health Economics (IHE) of the University of Dhaka (Jahan, 2002) found out a positive association between household income and expenditure on medical care. The other important findings of the study are: • Households, on an average, allocate 1.5–4 percent of their income to health care
except for the poorest income group which spend a larger proportion of their income on health care (about 7.3 %);
• Expenditure on health care by rural households is more income inelastic than by urban households and expenditure on women is more income elastic than the expenditure on men;
• Gender inequality exists in household’s contribution to health care in bottom three income quintiles;
5.3 Who bears the burden of high costs of ill health and at what price? The fact that the rural households, on an average, spend more on health care expenditure than the urban households and that the poorer income groups, proportionately, spend a larger portion of their income on health care costs bear significant implications on the quality of life of the rural poor households. This is particularly important in the context of Bangladesh as evidences have been drawn that the high costs of ill health puts an additional and often excessive financial burden on households, particularly on the rural households leading to the curtailment of other well-being of life. This even sometimes initiates a downward spiral of further poverty and in series (Begum, 1996). In a country like Bangladesh where 48 percent of the population live below the poverty line10 and where 77 percent of the population live in the rural areas (BBS, 2001b), it is often the rural poor people who become the worst sufferers of high cost of ill health. Poverty has been found to be associated with higher incidence of sickness and diseases. Both the BBS and BIDS data have pointed to much higher morbidity and mortality rates among the hard core poor vis-à-vis moderate and non-poor (Sen, 1997). 9 The data contains details socio-economic variables relevant to health care for 7,420 sample households comprising of 39.043 individuals. 10 The Bangladesh Bureau of Statistics use per capita calories intake as national poverty standards. Those with less than 2,122 kcal/day/person is regarded as living below the poverty line.
26
Public Health Expenditure in Bangladesh: Do We Need a Reform Agenda?
The rural people, on average, incur an expenditure of Taka 342 on acute illness. The figure is Taka 2680 in case of major illness. The figures quite clearly indicate that while ill-health restrict work-days causing wage loss to the people particularly to the poor ones, it at the same time imposes on them an additional burden in terms of treatment cost. While investigating the source of treatment expenditure further, the study (Begum, 1996) has revealed that in about 57 percent cases, the rural households meet treatment expenses of the acute illness from running income but in more than 40 percent cases, they either dispose-off assets including the productive ones or incur loan. The situation is worse in case of major illness and for the poor. However, more startling observation is that even non-poor households are not fully able to bear the burden of treatment without taking any economic risk. Despite evidences favouring greater public health spending benefits to the rural poor people from the public health facilities in the country and low treatment expenditure in the government run facilities, the government’s efforts in minimizing the financial risks and economic burden of rural poor people from the costs if ill health have borne little fruits due to gross underutilization of the existing public health facilities in the country. Since the mid eighties, the access of the rural population to public health care has remained extremely limited in the country, being restricted to only 12 percent of the rural households (Sen, 1997). Even at that low level, the access to public health is declining over time. There are evidences that supply side constraints like lack of adequate equipment and non-availability of drugs and medical supplies including poor personnel management and unhealthy attitudes and practices of the personnel in the government sector are primarily responsible for this dwindling utilization. As regards the economic consequences of ill-health on individuals and households, precise data are absent. However, Begum, 1996 estimated that: Nearly all households in rural areas, one time or other in a year, incur about 15 percent of total expenditure made by the household. The share goes upto 25 percent for poorest section of the rural people; and more than third household in a year in rural area face economic crisis due to ill health of the household members and this remains a major cause of economic deterioration among them. In meeting the treatment expenditure for both acute and major illness, as conceivable, the poorest people are at much higher risk than their non-poor counterparts. The study also found out that nearly 90 percent of the health care needs of the rural people are met by the private sector, more precisely by the untrained/unqualified private practitioners, in exchange of payment. 5.4 Interface between health and poverty: What public health
programmes can do? Lack of adequate health care represents a particular source of income erosion for the poor, particularly the hard core segment of it. Poor health burden represent not only 7-10 percent of the hard core poor’s income, the dynamic implications of ill-health are even greater. The health hazard-related risk events explain, on average, 16 percent of all cases of downward movement along the poverty spiral. For non-poor households who slipped
27
Public Health Expenditure in Bangladesh: Do We Need a Reform Agenda?
subsequently into hard-core poverty, the share of health-related causes was as high as 21 percent (Sen, 1997). Acute vulnerability of the poor households to sudden and unanticipated health related shocks leads not only to loss of income and employment, but also to increased indebtedness associated with the raising of coping costs. Thus, even for households who are otherwise classified as non-poor as per the income criteria, ill health has emerged as a prime concern and an important explanatory of downward mobility. As noted under the BIA, benefit from the public health spending is quite low, representing only 0.5 percent of the rural household income. The incidence of such spending, as proportion of income however, displays a certain progressivity. It is found highest for the poorest decile (2.9 percent) declining almost secularly to 0.2 percent in the case of top two deciles which shows the potential re-distributive benefits associated with effective expansion of public health programmes. 5.5 ESP Cost Analysis: who bears the cost and what proportion? Cost of Essential Services Package at Upazila level which is the total of national or actual expenditure incurred on and/or attributable to the ESP services at Upazila level and proportion of costs incurred at central level and/or at the District level attributable to ESP services at Upazila level has been studied by Ferdousi in her study on “ The current costs of essential health services-a study of government facilities (Ferdousi, S 2001). The costs have been classified primarily according to the category of inputs devoted to service activities. These broad inputs/cost eliminates upon which expenditures are incurred on are: (i) Staff cost; (ii) Commodities and Consumable cost; (iii) Usage cost of Equipment; (iv) Usage cost of Furniture and Physical Structures; (v) Overhead cost at UHC level and (vi) Super-overhead cost. An overall picture of ESP costing is presented in Table-14 in light of the foregoing analysis. Here cost of service for each component of ESP as well as share of different inputs specific to that component have been presented in a matrix form.
Table-14: Breakdown of average monthly total cost of ESP at Upazila Health Complex by Components and by Inputs
Input Average monthly patient
No.
Staff cost Tk.
Commodities &
Consumable cost
Tk.
Usage cost of
equipment Tk.
Usage cost of
Furniture & physical structures
Tk.
Overhead cost at UHC Tk.
Super-overhead
cost Tk.
Total ESP cost Tk.
ESP cost per patient
Tk.
Reproductive Health Care
6,052 120,924 54756 24051 2154 25606 18710 246200 40.68
Maternal Health 1,140 54837 17903 23165 524 5786 4248 106464 93.41 Family Planning 4,17 41976 30039 875 1327 15743 11995 101956 24.40 Others 734 24112 6813 10 302 4076 2467 37781 51.48 Child Health Care 5,967 138909 69452 4093 2707 33771 24890 273822 45.89 Communicable Disease Control
297 14787 9890 4608 225 1949 1854 33313 111.99
Limited Curative Care
1,876 82280 21184 1065 1109 12878 9074 127591 68.02
Support Service 18 823 1079 0 4 0 22 1928 - Total ESP 14,210 357,724 156,360 33,817 6,199 74,204 54,550 682,854 48.05
Source: Ferdousi, S. The current costs of essential health services-a study of government facilities. Health Economics Unit, MOH&FW. Research Paper-25
28
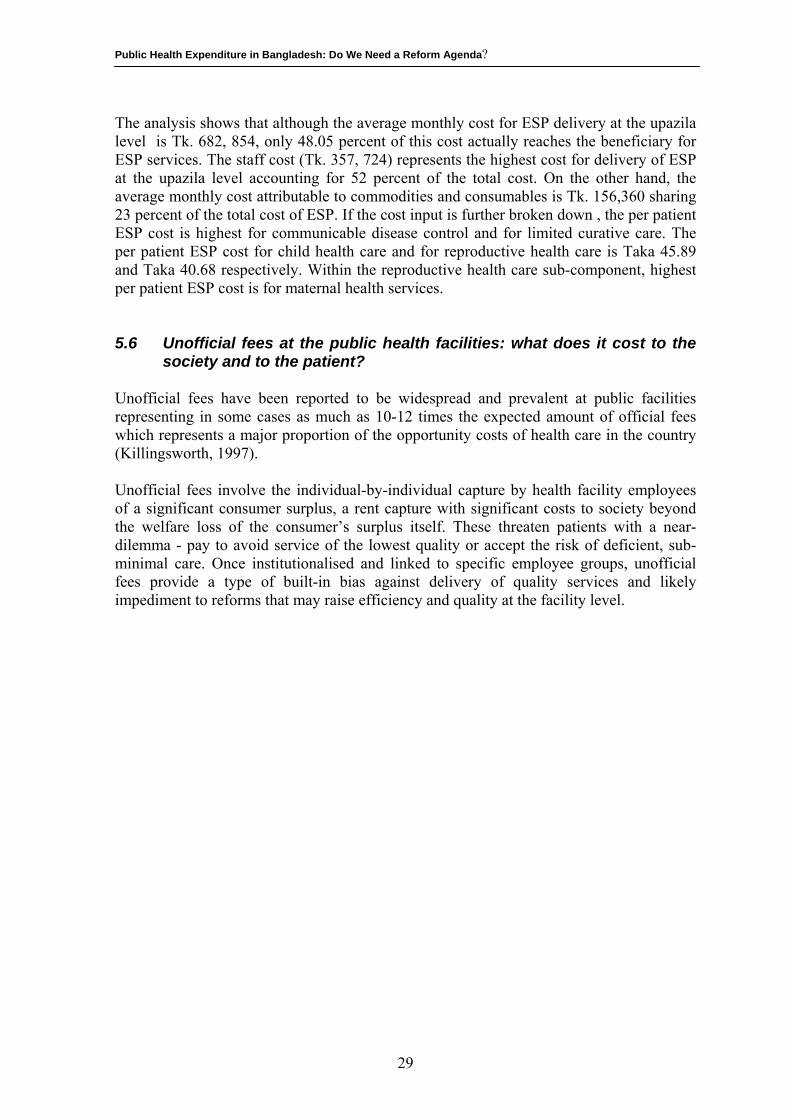
Public Health Expenditure in Bangladesh: Do We Need a Reform Agenda?
The analysis shows that although the average monthly cost for ESP delivery at the upazila level is Tk. 682, 854, only 48.05 percent of this cost actually reaches the beneficiary for ESP services. The staff cost (Tk. 357, 724) represents the highest cost for delivery of ESP at the upazila level accounting for 52 percent of the total cost. On the other hand, the average monthly cost attributable to commodities and consumables is Tk. 156,360 sharing 23 percent of the total cost of ESP. If the cost input is further broken down , the per patient ESP cost is highest for communicable disease control and for limited curative care. The per patient ESP cost for child health care and for reproductive health care is Taka 45.89 and Taka 40.68 respectively. Within the reproductive health care sub-component, highest per patient ESP cost is for maternal health services. 5.6 Unofficial fees at the public health facilities: what does it cost to the
society and to the patient? Unofficial fees have been reported to be widespread and prevalent at public facilities representing in some cases as much as 10-12 times the expected amount of official fees which represents a major proportion of the opportunity costs of health care in the country (Killingsworth, 1997). Unofficial fees involve the individual-by-individual capture by health facility employees of a significant consumer surplus, a rent capture with significant costs to society beyond the welfare loss of the consumer’s surplus itself. These threaten patients with a near-dilemma - pay to avoid service of the lowest quality or accept the risk of deficient, sub-minimal care. Once institutionalised and linked to specific employee groups, unofficial fees provide a type of built-in bias against delivery of quality services and likely impediment to reforms that may raise efficiency and quality at the facility level.
29
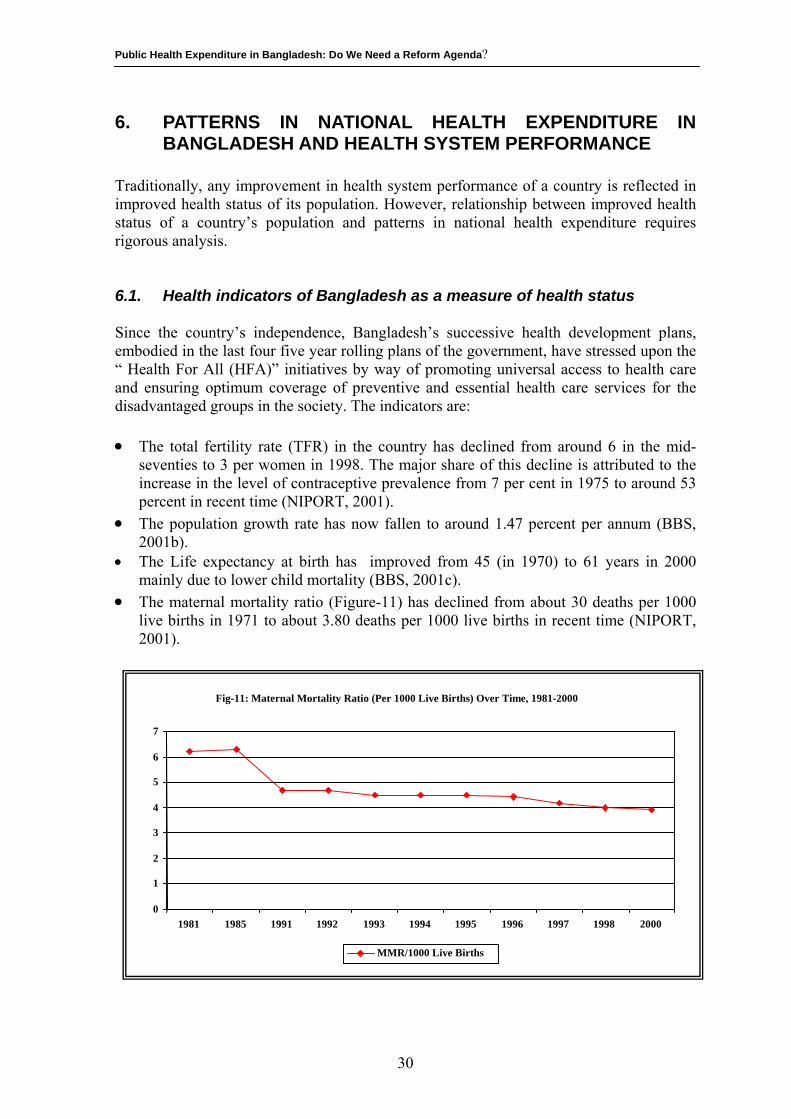
Public Health Expenditure in Bangladesh: Do We Need a Reform Agenda?
6. PATTERNS IN NATIONAL HEALTH EXPENDITURE IN BANGLADESH AND HEALTH SYSTEM PERFORMANCE
Traditionally, any improvement in health system performance of a country is reflected in improved health status of its population. However, relationship between improved health status of a country’s population and patterns in national health expenditure requires rigorous analysis. 6.1. Health indicators of Bangladesh as a measure of health status Since the country’s independence, Bangladesh’s successive health development plans, embodied in the last four five year rolling plans of the government, have stressed upon the “ Health For All (HFA)” initiatives by way of promoting universal access to health care and ensuring optimum coverage of preventive and essential health care services for the disadvantaged groups in the society. The indicators are: •
•
•
The total fertility rate (TFR) in the country has declined from around 6 in the mid-seventies to 3 per women in 1998. The major share of this decline is attributed to the increase in the level of contraceptive prevalence from 7 per cent in 1975 to around 53 percent in recent time (NIPORT, 2001). The population growth rate has now fallen to around 1.47 percent per annum (BBS, 2001b).
• The Life expectancy at birth has improved from 45 (in 1970) to 61 years in 2000 mainly due to lower child mortality (BBS, 2001c). The maternal mortality ratio (Figure-11) has declined from about 30 deaths per 1000 live births in 1971 to about 3.80 deaths per 1000 live births in recent time (NIPORT, 2001).
Fig-11: Maternal Mortality Ratio (Per 1000 Live Births) Over Time, 1981-20000 1 2 3 4 5 6 7
1981 1985 1991 1992 1993 1994 1995 1996 1997 1998 2000
MMR/1000 Live Births
30
Public Health Expenditure in Bangladesh: Do We Need a Reform Agenda?
•
•
Starting from as low as only 10-12% in 1985, the percentage of children fully immunized against six preventable diseases (measles, TB, Polio, whooping cough, and tetanus) within one year of age has increased to about 68-70% in recent time (DGHS, 2002). Infant mortality has dropped (Figure-12) from around 150 in 1971 to around 57 per 1000 live births (BBS, 2001c).
Notandcomheain hrichare gaincom
6.2
Theranghea10 y(Raineqthe globsystBan
Fig-12: Infant Mortality Rate (Per 1000 Live Births ) Over Time, 1970-19980 20 40 60 80
100 120 140 160
1970 1974 1981 1985 1991 1992 1993 1994 1995 1996 1997 1998
IMR/1000 live births
withstanding the above achievements, the mortality and morbidity patterns of women children is the country is still far from expectation. The public health burdens of monly prevalent infectious diseases, nutrition deficient disorders and reproductive
lth infections are still unacceptably high in the country. There are also major disparities ealth outcomes between men and women between rural and urban areas and between and poor (World Bank, 2001). These growing health risks of the women and children still a major concern to the government particularly in its efforts towards sustaining s in child survival and reducing child and maternal mortality coming, mostly, from municable diseases and malnutrition
Measure of Health System Performance: using WHO’s core performance criteria
World Health Report-2000 (WHO, 2000) has put Bangladesh amongst the middle e of countries (Rank 88 amongst the 191 countries) on overall performance of the
lth system. The healthy life expectancy, measured by DALE, for both sexes is around ears less: healthy life expectancy is 50.1 years for males and 49.8 years for females.
nk 140 amongst the 191 countries) However, the report suggests quite substantial ualities in child survival across the population in Bangladesh. It lies in the middle of range in the South-East Asian Countries and in the lower achieving half of countries ally (rank 125). Summarizing all the measures into a composite measure of health em achievement, i.e. the overall health system attainment index (estimates for 1997), gladesh lies among the lower achieving range of countries (rank 131). Moreover, the
31
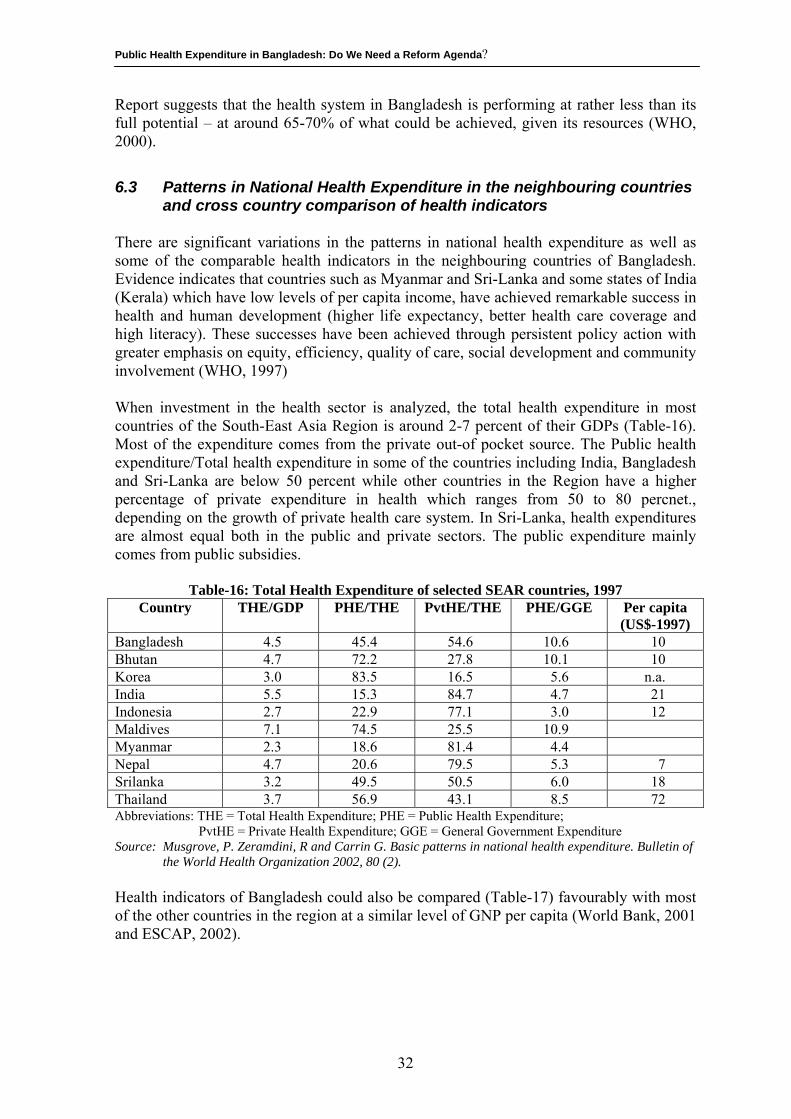
Public Health Expenditure in Bangladesh: Do We Need a Reform Agenda?
Report suggests that the health system in Bangladesh is performing at rather less than its full potential – at around 65-70% of what could be achieved, given its resources (WHO, 2000).
6.3 Patterns in National Health Expenditure in the neighbouring countries and cross country comparison of health indicators
There are significant variations in the patterns in national health expenditure as well as some of the comparable health indicators in the neighbouring countries of Bangladesh. Evidence indicates that countries such as Myanmar and Sri-Lanka and some states of India (Kerala) which have low levels of per capita income, have achieved remarkable success in health and human development (higher life expectancy, better health care coverage and high literacy). These successes have been achieved through persistent policy action with greater emphasis on equity, efficiency, quality of care, social development and community involvement (WHO, 1997) When investment in the health sector is analyzed, the total health expenditure in most countries of the South-East Asia Region is around 2-7 percent of their GDPs (Table-16). Most of the expenditure comes from the private out-of pocket source. The Public health expenditure/Total health expenditure in some of the countries including India, Bangladesh and Sri-Lanka are below 50 percent while other countries in the Region have a higher percentage of private expenditure in health which ranges from 50 to 80 percnet., depending on the growth of private health care system. In Sri-Lanka, health expenditures are almost equal both in the public and private sectors. The public expenditure mainly comes from public subsidies.
Table-16: Total Health Expenditure of selected SEAR countries, 1997 Country THE/GDP PHE/THE PvtHE/THE PHE/GGE Per capita
(US$-1997) Bangladesh 4.5 45.4 54.6 10.6 10 Bhutan 4.7 72.2 27.8 10.1 10 Korea 3.0 83.5 16.5 5.6 n.a. India 5.5 15.3 84.7 4.7 21 Indonesia 2.7 22.9 77.1 3.0 12 Maldives 7.1 74.5 25.5 10.9 Myanmar 2.3 18.6 81.4 4.4 Nepal 4.7 20.6 79.5 5.3 7 Srilanka 3.2 49.5 50.5 6.0 18 Thailand 3.7 56.9 43.1 8.5 72 Abbreviations: THE = Total Health Expenditure; PHE = Public Health Expenditure; PvtHE = Private Health Expenditure; GGE = General Government Expenditure Source: Musgrove, P. Zeramdini, R and Carrin G. Basic patterns in national health expenditure. Bulletin of
the World Health Organization 2002, 80 (2). Health indicators of Bangladesh could also be compared (Table-17) favourably with most of the other countries in the region at a similar level of GNP per capita (World Bank, 2001 and ESCAP, 2002).
32
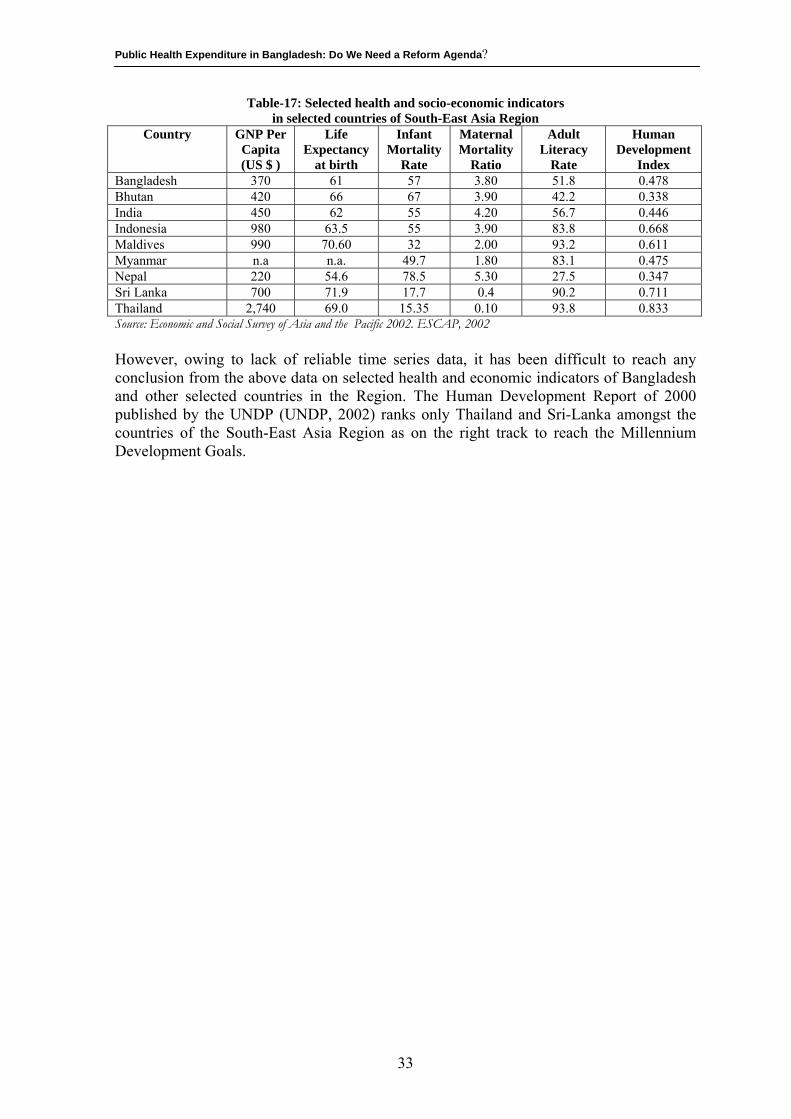
Public Health Expenditure in Bangladesh: Do We Need a Reform Agenda?
Table-17: Selected health and socio-economic indicators in selected countries of South-East Asia Region
Country GNP Per Capita (US $ )
Life Expectancy
at birth
Infant Mortality
Rate
Maternal Mortality
Ratio
Adult Literacy
Rate
Human Development
Index Bangladesh 370 61 57 3.80 51.8 0.478 Bhutan 420 66 67 3.90 42.2 0.338 India 450 62 55 4.20 56.7 0.446 Indonesia 980 63.5 55 3.90 83.8 0.668 Maldives 990 70.60 32 2.00 93.2 0.611 Myanmar n.a n.a. 49.7 1.80 83.1 0.475 Nepal 220 54.6 78.5 5.30 27.5 0.347 Sri Lanka 700 71.9 17.7 0.4 90.2 0.711 Thailand 2,740 69.0 15.35 0.10 93.8 0.833 Source: Economic and Social Survey of Asia and the Pacific 2002. ESCAP, 2002 However, owing to lack of reliable time series data, it has been difficult to reach any conclusion from the above data on selected health and economic indicators of Bangladesh and other selected countries in the Region. The Human Development Report of 2000 published by the UNDP (UNDP, 2002) ranks only Thailand and Sri-Lanka amongst the countries of the South-East Asia Region as on the right track to reach the Millennium Development Goals.
33
Public Health Expenditure in Bangladesh: Do We Need a Reform Agenda?
7. Concluding Observations: Do We Need Alternative Strategies?
Despite, Bangladesh making some strides in the area of health development and population control over the past decade or so, many of the achievements in health care over the past few decades have not reached the poorest among the poor. The lowest quintile income group experiences markedly worse conditions than others. In comparison to other countries in the Region, Bangladesh lag far behind with respect to critical health indicators such as maternal and infant mortality and life expectancy. It is highly unlikely that Bangladesh would be able to achieve the UN Millennium Development Goals by the turn of this decade (UNDP, 2002). On the external front, the country is further restrained by the apprehension of falling official development assistance, since almost 38 percent of the public spending on health is currently financed by external assistance, as the global aid programmes are failing the world’s poorest people (Mckenna, 2002) and the rich countries are lagging far behind the current United Nation’s target for overseas aid to the tune of 0.7% of the country’s gross domestic product (Eaton, 2002). Nevertheless, the low income base as well as the low proportion of GDP spent on health should not be the deterrence to devoting more public resources to health as cross country experiences have clearly shown that mere accumulation of national wealth is not sufficient to deal with poverty as a health risk. Cuntries with low per capita income such as the Indian State of Kerala, Sri-Lanka, China and Costa Rica have achieved impressive health gains through committing to equity and economic distributive justice (Ncayiyana, JD 2002) This means that apart from addressing issues like unequal access to potential health care, developing coherent and equitable national health systems what is more important for Bangladesh is how the available resources are utilized in the socially productive way, redirecting resources to areas where maximum public health benefits can be accrued. This particularly highlights that the overall budget structure in Bangladesh needs reforms, particularly towards a decentralized resource allocation system. The question that still remains unanswered is how to achieve that goal to what context that is achievable. 7.1. Existing resource allocation and budgeting system The existing resource allocation and budgeting system in Bangladesh is, currently, based upon budgetary demand covering both the development and revenue sides of the budget. In the Bangladesh public sector, the terms revenue and development budgets are used to denote what elsewhere may be known as the recurrent and capital budgets. The system was designed to be ‘‘top-bottom. ’’ No clear policy guidelines or estimates of future financial availability are applied in drawing up the budgets. While some norms are deployed, it is widely recognized that these bear little relation to real needs, as has been seen in the earlier section of this report. Although adjustment is made centrally in recognition of new facilities, the main allocative driver is the historical budget rather than health or health service needs. This leads to the practice of budget holders using the virement process (transfer of items from one financial
34
Public Health Expenditure in Bangladesh: Do We Need a Reform Agenda?
account to another) to try to adjust budgets after they have been set, rather than formulating robust initial budgets, even though virement is itself a cumbersome process.. 7.2. Overall budget structure One of the issues surrounding the development of resource allocation processes relates to the complexity of the relationships between the existing budgets. Annual Development Programme (ADP) is controlled by Planning Ministry. In theory an ADP comprises a number of planning proposals, which set out the development and revenue implications of a project for overall approval. In practice the revenue implications are considered less critically at the time of the ADP. The number and type of budgets tend to cause confusion, particularly in terms of the relationship between development items and on-going revenue items. First, as a result of the stringent controls on the use of the permanent revenue budget by the Finance Ministry, a habit has arisen of using the development budget to finance what effectively are ongoing revenue items. Second, the parallel nature of the revenue budgets leads to complexities in budgeting procedures and a danger of overemphasis on process rather than strategy. In addition, the lack of linkage between development and revenue budgeting has led to an over-extension of future revenue requirements. The products of all these are budgets and patterns of resource allocation with high degrees of inequity and inefficiency. The budgets that result as a part of this process are: • Inefficient between-line items, particularly between salary and non-salary items. • Inequitable between similar service units. For example, allocations to hospitals with
apparently similar capacity or demands (as indicated by the number of beds or utilization levels).
• Inequitable between populations with apparently similar health needs. The above-mentioned constraints clearly indicate that the allocative system was not working in a way that would either induce efficient practice or promote equity between districts, regardless of how the latter was defined and measured. Overall, the budgeting and resource allocation system is viewed as an obstacle rather than a support to need-responsive health care. 7.3. Alternative suggestions for allocative system11 Four potential allocative models are discussed below which could be the starting point for bringing the required reforms in the overall process of budgeting for public expenditure on health in the country: 7.3.1. Model A: Incrementalist (current model) The present public spending, in practice, is based on the previous year’s allocation (or expenditure), increased pro rata, though the possibility exists for new budgets to be added through the annual schedule of new expenditure. Though this approach is administratively simple and non-threatening it neither promotes efficiency nor equity.
11 The Sections 7.3 to 7.6 draws on Green et al (2000).
35
Public Health Expenditure in Bangladesh: Do We Need a Reform Agenda?
7.3.2. Model B: Health facility requirement . Under this model, budgets would be set to ensure that the major existing primary and secondary level facilities are provided with adequate resources to allow them to operate effectively and more efficiently. This would not lead to an improvement in the distribution of resources between districts. However, it would improve the quality of care at existing facilities, and indeed provides rewards to facilities with high utilization rates. This particular model also ensures that budgets take into account the real costs and utilization rates of existing facilities. However, to avoid major swings in allocation to different districts, which might run counter to equity, ceilings on increases would need to be set. Such ceilings could initially be based on a crude per capita basis and would take into account absorptive capacity. Explicit prioritization would also need to be made between facilities within districts, as this approach on its own will not lead necessarily to adequate overall resource levels in districts. Districts would have to make their own prioritization decisions between facilities, based on their assessment of differential need. Some training would be required for district managers and central staff, but the close links to existing facilities would mean that it was politically acceptable and intuitively understandable. 7.3.3. Model C: Health services requirement The third approach is an enhancement of the second. Through strong links into district planning, budgets are tied more closely to the overall health service requirements of the district population, rather than the health facility requirements. Districts, which, through the planning process, are considered to be underserved, would receive particular planning attention and above average allocation growth rates. Development expenditure that is related to plans, and subsequent revenue implications, would be a major mechanism for this. Judgments as to which districts were underserved, and to what degree, would be formed on the basis of similar information to that in Model D (e.g. population and morbidity), but would not be tied formally into a formula. There would be similar implementation implications as to Model B, but an additional need for strengthened central planning capacity. 7.3.4. Model D: Population based resource allocation The final model involves the allocation of resources on the basis of population, possibly weighted by factors such as age, sex, specific health needs, density, cross-boundary flows and different costs of health care delivery. Under this, district managers set specific budgets within an overall allocation provided by the formula. The main strength of this model lies in the potential to promote equity. Similar training requirements to those of the other models would be needed. However, the weaknesses in the current information system constitute a major constraint to this model. Furthermore the political opposition from ‘‘losing’’ districts could be major obstacle. Each of the resource allocation models has advantages and disadvantages. While there was
36
Public Health Expenditure in Bangladesh: Do We Need a Reform Agenda?
general support for Model D in principle, it may be felt that it would be impossible to introduce in the short-term, largely as a result of the lack of confidence in the data and associated political implications. A progressive movement towards Model D can be chosen as the current incrementalist approach (Model A) is widely regarded as inappropriate. Development of better systems to meet the operating requirements of current facilities (Model B) would improve their technical efficiency and engender support in the system for the budgeting process. However, it may be recognized that this should only be an intermediate step since this, by itself, will not overcome the inefficient and inequitable distribution of current primary and secondary level resources. Model C (through its strong emphasis on links between planning and budgeting) would allow a greater development of health needs sensitivity and responsiveness. The last stage in the progression towards full budgetary decentralization would involve the allocation of resources on the basis of population, weighted to incorporate other aspects of need (Model D). 7.4. Supporting components for development of chosen allocative system There are various components which would be required in order to develop the chosen allocative system, including those discussed below: Improved information As has been suggested by many that information systems appropriate to the development of a decentralized resource allocation system may not be available and will need to be developed through both routine data collection and research. Studies have to be undertaken to develop a range of unit costs of routine activities in primary level facilities and district hospitals. The first of these studies would provide important information on the actual costs and ‘‘standard’’ levels of resources for primary facilities, taking account of utilization, case mix and other district level costs such as supervision and monitoring. The difference between actual costs and standard requirements gives an indication of the ‘‘funding gap’’ to be filled if services are to run at an improved level of efficiency under Model B. Differential funding needs can be calculated on a district basis and under-funding of existing facilities occurring in the primary health sector can now be estimated. This would permit the use of a policy of differential growth (based on the relative size of the gap) to under-resourced areas, rather than achieving resource shifts by cutting absolute allocations to ‘‘over’’-resourced areas. This, it may be hoped, would minimize political opposition from ‘‘losing’’ districts. Decentralization is often interpreted as a weakening of the central position. Instead, a change in role is needed, with concomitant energy put into a redevelopment of this role. Annual guidelines would provide specific guidance on service policy, and broad service delivery targets. All these elements are combined to form the district planning and budgeting guidelines, designed to be issued annually to budget holders by the central health-planning unit. In developing these it is proposed, inter alia, that: no district would be allowed to suffer a real net loss in resource levels; targets would be set to guide
37
Public Health Expenditure in Bangladesh: Do We Need a Reform Agenda?
managers in the line item allocation of funds within their overall budget: in particular, these would focus on increasing the size of the non-salary budget; hospitals and central programmes would receive increases in line with inflation. Development of district planning and budgeting systems. One of the key rationales for the development of a decentralized system is the ability to develop plans for districts based on their specific needs, within an overall policy envelope. A district planning cycle would enables district officers to relate their identified health problems to implementable solutions. Service managers are to be encouraged to define objectives linked to interventions and activities for the coming three years. Using the resource guidelines and financial information, they are then able to develop more rational and appropriate development and revenue budgets. These budgets can then be submitted to the centre for checking and consolidation prior to submission to the Ministry of Finance. 7.5 Suggested process for change in allocative system The above section has outlined the technical work to be carried out to develop an improved allocative system, consistent with the stated decentralization aims. District plans and development budgets are to be developed on pilot basis in selected districts. Gradualism should be the norm rather than the a complete overturn. Adequate time is to be given set to prepare and to submit a worked proposal. By concentrating resources on a limited number of districts it would be possible to provide greater support for the development of their budgeting and planning capacity. However, the general problem of frequent staff transfers should be avoided. Furthermore, it is to be ensured that the concentration on trial districts may not gave rise to suspicions that the allocation system might favour such districts in terms of the overall level of resources. One useful framework for analysis of the sort of policy changes is to assess not only the policy content but also the context, processes, and actors. The focus of the work in the area should not only be on the content of the reform to the allocative and budget system, with considerable attention being paid to alternative models and their technical robustness, but also the context in which the reforms are being proposed, paying particular attention to the wider government planning and budgeting systems, information availability, and skill levels. 7.6 Change in the decision making culture The culture of centralized decision-making and an attendant procedurally driven bureaucracy, coupled with the frequent transfer of staff, means that decentralization both challenges the organizational and management culture and is in fact high risk, albeit with high potential returns in terms of health impact. The process of change to a new system requires support at all levels. in designing, it has to be always recognized the sources of resistance to decentralization broadly, and budgeting and resource allocation in particular. The level and sources of resistance to new systems
38
Public Health Expenditure in Bangladesh: Do We Need a Reform Agenda?
would not be underestimated. Various actors can be identified as perceiving the process as threatening. These include the following: the senior professionals in the Health Directorate concerned at a loss of role, status and power; clerical staff currently responsible for centralized budgeting concerned about the development of a system which may sideline them; and other central departments, most importantly the Ministry of Finance, concerned about the potential dangers of decentralization. In addition, politicians able to use the current allocative system as a means of maintaining a political base may be resistant. Underpinning all of this is the critical issue as to whether there is shared understanding of and genuine support for equity, the main driving force behind a needs based resource allocation system. First, it is easy to underestimate the various sources and depth of resistance. Greater attention needs to be given to the political dimensions of such projects, to seek ownership of the process of change. While resource allocation may appear as a ‘‘technical’’ issue, it clearly is much more than that. Furthermore, the type of changes involved in a new resource allocation system may be viewed as technically challenging by staff with little management, let alone economic, training and as such resisted. Under such circumstances, it is to be recognized that the processes of change may need to be slower to develop a critical mass for change. This unfortunately, does not accord easily with the time horizons of most projects. Second, it needs to be recognized that, in decentralization, as much attention needs to be given to supporting the necessary changes at the centre as at the periphery. While the district staff embraced the technical proposals, the major resistance was encountered at the centre. Third, it is worth recognizing the difficulty of reforming one element of the public sector in isolation. Many of the problems faced by the health sector were shared by, or arose from, other sectors. It is certainly arguable that single-sector reform may not be feasible, though it can also be argued that a single-sector ‘‘lead’’ may be necessary to pilot new government-wide approaches. Within the health sector itself, it may be that in areas such as resource allocation reform, changes need to be introduced simultaneously across the system rather than through trial districts.
__________________
39
Public Health Expenditure in Bangladesh: Do We Need a Reform Agenda?
9. Reference:
Bangladesh Bureau of Statistics. 2001a. Report of the Health & Demography Survey-2000. BBS, Dhaka, Bangladesh.
Bangladesh Bureau of Statistics. 2001b. Preliminary Report of Bangladesh Population Census-20001. BBS, Dhaka, Bangladesh.
Bangladesh Bureau of Statistics. 2001c. Pocket Statistical Year Book of Bangladesh-2000. BBS, Dhaka, Bangladesh.
Barkat, A. 1997. “Governance in Health Sector”. In: Sobhan, R (ed.), The Crisis of Governance, Centre for Policy Dialogue and University Press Limited, Dhaka, Bangladesh.
Begum, Sharifa and Binayak Sen 2000. Not quite, Not Enough: Financial Allocation and the Distribution of Resources in the Health Sector. BIDS, Dhaka, Bangladesh
Begum, Sharifa. 1996. “Health Dimensions of Poverty” In: Rahman, Hossain Zillur, Mahbub Hossain, and Binayak Sen (ed.), 1987-94: Dynamics of Rural Poverty in Bangladesh. Bangladesh Institute of Development Studies (BIDS), Dhaka, Bangladesh.
Begum, Tahmina. Liaquat, Q. Begum, S. Moral, H. Ensor, T and Dave, P. 2001. Who benefits from public health expenditure? Health Economics Unit, PRU, Ministry of Health & Family Welfare. Government of Bangladesh. Research Paper No.22.
Castro-Leal. F. Dayton, J. Demry, L and Mehra, K. 2000. Public spending on health care in Africa: do the poor benefit. Bulletin of the World Health Organization, 2000, 78(1)
Chowdhury O.H and Binayak Sen 1997. Role of Public Expenditure in Poverty Alleviations in Bangladesh. BIDS, Dhaka, Bangladesh (Mimeo)
District Health Services Society. 1976. Sharing Resources for Health in England.
Resource Allocation Working Party, London, UK..
Directorate General of Health Services. 1998. Bangladesh Health Bulletin 1996. DGHS, Dhaka, Bangladesh.
Directorate General of Health Services. 2002. National EPI Evaluation Coverage Survey of 2001. DGHS. Dhaka, Bangladesh.
Eaton L. 2002. WHO calls for new pact on health care. News). British Medical Journal. 325: 10 (6 July)
Economic and Social Commission for Asia and the Pacific. 2002. Economic and Social Survey of Asia and the Pacific 2002. ESCAP, Bangkok, Thailand.
Ensor, T. Hossain, Ata. Liaquat, Q. Begum, S and Moral, H. 2001. Geographic Resource Allocation in Bangladesh. Health Economics Unit, PRU, Ministry of Health & Family Welfare. Government of Bangladesh. Research Paper No.21.
40
Public Health Expenditure in Bangladesh: Do We Need a Reform Agenda?
Ferdousi, Shawkat Ali. 2001. The current costs of essential health services-a study of government facilities. Health Economic Unit, PRU, Ministry of Health & Family Welfare. Government of Bangladesh. Research Paper No.25.
Green, Andrew, B. Ali, A. Naeem, and D. Ross. 2000. Resource allocation and budgetary mechanisms for decentralized health systems: experiences from Balochistan, Pakistan. Bulletin of the World Health Organization. 2000, 78 (8)
Islam, M and A Barkat. 2001. Revenue Expenditure of the Unproductive Sector in the Budget of Bangladesh versus Human Development: A Concept paper. Bangladesh Economics Association, Dhaka, Bangladesh.
Jahan, Nahid Akhtar. 2002. An analysis of household health care expenditure behaviour in Bangladesh. Institute of Health Economics, University of Dhaka. Dhaka, Bangladesh (Mimeo)
Killingsworth, J. 1997. Unofficial Fees at Health Care Facilities in Bangladesh: Price Equity and Institutional Issues. Health Economics Unit, PRU, Ministry of Health & Family Welfare. Government of Bangladesh. Research Paper No.10.
Ministry of Health & Family Welfare. 1998a. Health & Population Sector Programme (1998-2003). Programme Implementation Plan. MOH&FW. Dhaka, Bangladesh.
Ministry of Health & Family Welfare. 1998b. Bangladesh National Health Account 1996/97. MOH&FW. Dhaka, Bangladesh.
Ministry of Health & Family Welfare. 2000 Public Expenditure Review of the Health & Population Sector, 1998/9. Health Economics Unit, Management Accounting Unit. Ministry of Health & Family Welfare. Government of Bangladesh. Research Paper No.17.
Ministry of Health & Family Welfare. 2001a. Health & Population Sector Programme (1998-2003). Revised Programme Implementation Plan. MOH&FW. Dhaka, Bangladesh.
Ministry of Health & Family Welfare. 2001b. Public Expenditure Review of the Health & Population Sector Programme. Health Economics Unit, Management Accounting Unit. Ministry of Health & Family Welfare. Government of Bangladesh. Research Paper No.19.
Musgrove, Philip. Zeramdini, R and Carrin, Guy. 2002. Basic patterns in national expenditure. Bulletin of the World Health Organization, 2002, 80(2)
National Institute of Population Research and Training. 2001. Bangladesh Demographic and Health Survey 1999-2000. NIPORT, Dhaka, Bangladesh.
Ncayiyana, JD. 2002. Africa can solve its own health problems. (editorial). British Medical Journal. 324: 688-689 (23 March)
Ncayiyana, JD. 2002. Africa can solve its own health problems. (editorial). British Medical Journal. 324: 688-689 (23 March)
Rabbani AKM, Hosain, and S Islam AKMT. 1997. “Health Care Expenditures in Bangladesh” In: Waliul Islam, M Mahmud Khan & M. Shahadat Hossain (ed.), Health Situation and Health Care Expenditure in Bangladesh. Bangladesh Bureau of Statistics. Dhaka, Bangladesh
41
Public Health Expenditure in Bangladesh: Do We Need a Reform Agenda?
Rahman, A. 2000. Resource Allocation in Health Sector Bangladesh: A case study of Medical and Surgical Requisites. Health Economics Unit, MOH&FW. Dhaka. Bangladesh.
Save the Children (UK). 2001. Basic Services-Financing Advocacy Strategy (Draft). SCF(UK). London, UK.
Sen Binayak. 1997. Health & Poverty in the Context of Country Development Strategy: A Case Study on Bangladesh. WHO. Geneva. Macroeconomics, Health & Development Series no: 26.
United Nations Development Programme. 2002. Human Development Report 2002. UNDP. Dhaka, Bangladesh
World Bank. 2001. Health Futures in Bangladesh: Some Key Issues and Options. The World Bank Office, Dhaka, Bangladesh..
World Health Organization. 1997. Health Sector Reform: Report of the Fiftieth Session of WHO Regional Committee. WHO Regional Office for South-East Asia. New Delhi, India
World Health Organization. 1999. Health Situation in the Southeast Asia region 1994-1997. WHO Regional Office for South-East Asia. New Delhi, India.
World Health Organization. 2000. World Health Report 2000- Health Systems: Improving Performance. WHO. Geneva.
42
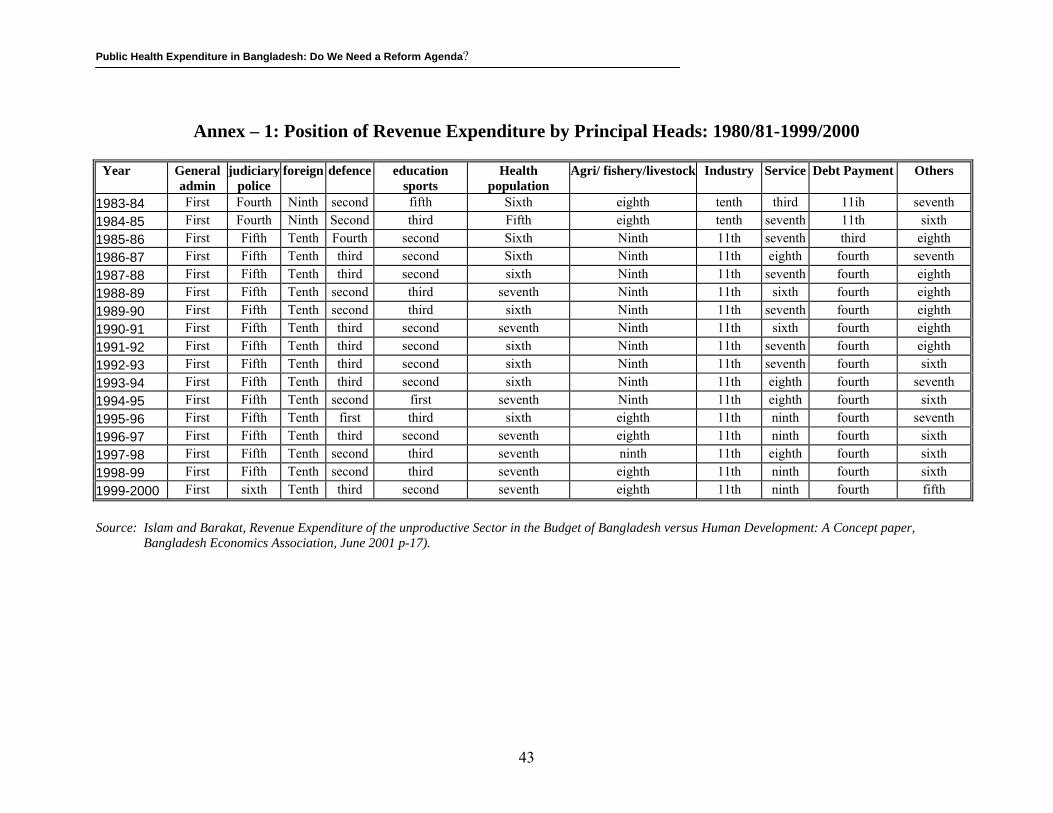
Public Health Expenditure in Bangladesh: Do We Need a Reform Agenda?
Annex – 1: Position of Revenue Expenditure by Principal Heads: 1980/81-1999/2000 Year
General admin
judiciary police
foreign defence education sports
Health population
Agri/ fishery/livestock Industry Service Debt Payment Others
1983-84 First Fourth Ninth second fifth Sixth eighth tenth third 11ih seventh1984-85 First Fourth Ninth Second third Fifth eighth tenth seventh 11th sixth1985-86 First Fifth Tenth Fourth second Sixth Ninth 11th seventh third eighth1986-87 First Fifth Tenth third second Sixth Ninth 11th eighth fourth seventh1987-88 First Fifth Tenth third second sixth Ninth 11th seventh fourth eighth1988-89 First Fifth Tenth second third seventh Ninth 11th sixth fourth eighth1989-90 First Fifth Tenth second third sixth Ninth 11th seventh fourth eighth1990-91 First Fifth Tenth third second seventh Ninth 11th sixth fourth eighth1991-92 First Fifth Tenth third second sixth Ninth 11th seventh fourth eighth1992-93 First Fifth Tenth third second sixth Ninth 11th seventh fourth sixth1993-94 First Fifth Tenth third second sixth Ninth 11th eighth fourth seventh1994-95 First Fifth Tenth second first seventh Ninth 11th eighth fourth sixth1995-96 First Fifth Tenth first third sixth eighth 11th ninth fourth seventh1996-97 First Fifth Tenth third second seventh eighth 11th ninth fourth sixth1997-98 First Fifth Tenth second third seventh ninth 11th eighth fourth sixth1998-99 First Fifth Tenth second third seventh eighth 11th ninth fourth sixth1999-2000 First sixth Tenth third second seventh eighth 11th ninth fourth fifth
Source: Islam and Barakat, Revenue Expenditure of the unproductive Sector in the Budget of Bangladesh versus Human Development: A Concept paper,
Bangladesh Economics Association, June 2001 p-17).
43
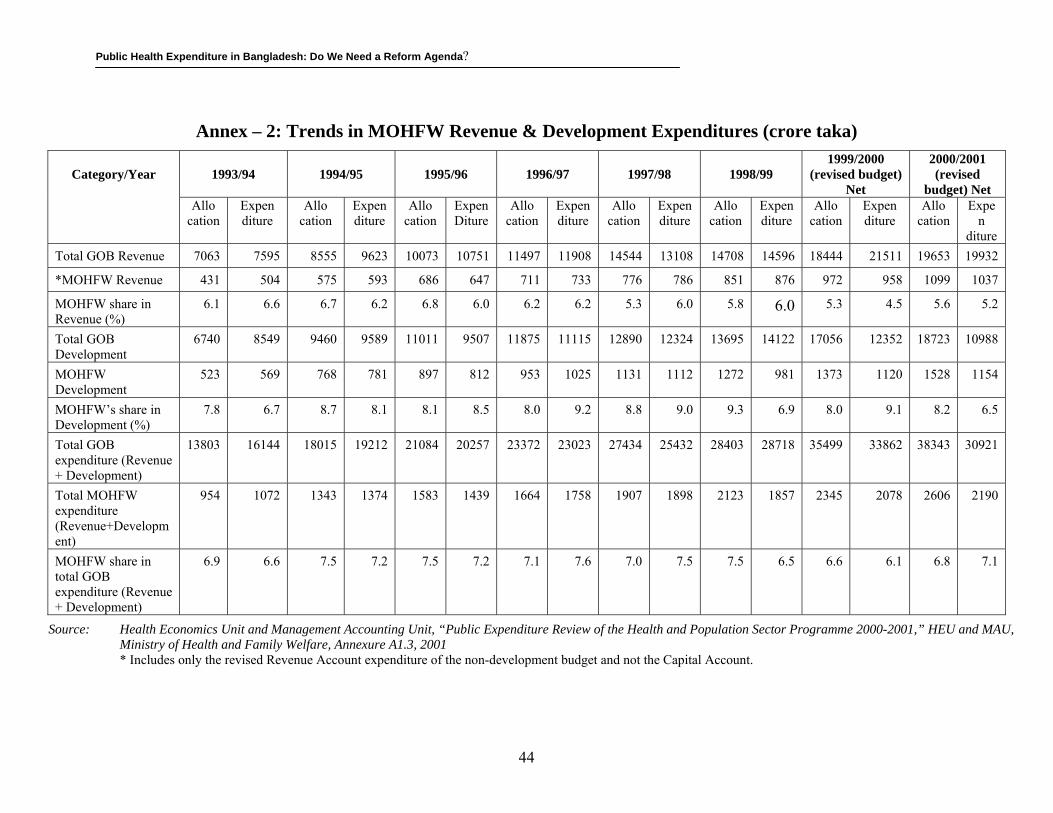
Public Health Expenditure in Bangladesh: Do We Need a Reform Agenda?
Annex – 2: Trends in MOHFW Revenue & Development Expenditures (crore taka)
Category/Year
1993/94
1994/95
1995/96
1996/97
1997/98
1998/99
1999/2000 (revised budget)
Net
2000/2001 (revised
budget) Net Allo Expen
cation diture Allo
cation Expen diture
Allo cation
Expen Diture
Allo cation
Expen diture
Allo cation
Expen diture
Allo cation
Expen diture
Allo cation
Expen diture
Allo cation
Expen
diture Total GOB Revenue 7063 7595 8555 9623 10073 10751 11497 11908 14544 13108 14708 14596 18444 21511 19653 19932
*MOHFW Revenue 431 504 575 593 686 647 711 733 776 786 851 876 972 958 1099 1037
MOHFW share in Revenue (%)
6.1 6.6 6.7 6.2 6.8 6.0 6.2 6.2 5.3 6.0 5.8 6.0 5.3 4.5 5.6 5.2
Total GOB Development
6740 8549 9460 9589 11011 9507 11875 11115 12890 12324 13695 14122 17056 12352 18723 10988
MOHFW Development
523 569 768 781 897 812 953 1025 1131 1112 1272 981 1373 1120 1528 1154
MOHFW’s share in Development (%)
7.8 6.7 8.7 8.1 8.1 8.5 8.0 9.2 8.8 9.0 9.3 6.9 8.0 9.1 8.2 6.5
Total GOB expenditure (Revenue + Development)
13803 16144 18015 19212 21084 20257 23372 23023 27434 25432 28403 28718 35499 33862 38343 30921
Total MOHFW expenditure (Revenue+Development)
954 1072 1343 1374 1583 1439 1664 1758 1907 1898 2123 1857 2345 2078 2606 2190
MOHFW share in total GOB expenditure (Revenue + Development)
6.9 6.6 7.5 7.2 7.5 7.2 7.1 7.6 7.0 7.5 7.5 6.5 6.6 6.1 6.8 7.1
Source: Health Economics Unit and Management Accounting Unit, “Public Expenditure Review of the Health and Population Sector Programme 2000-2001,” HEU and MAU, Ministry of Health and Family Welfare, Annexure A1.3, 2001 * Includes only the revised Revenue Account expenditure of the non-development budget and not the Capital Account.
44
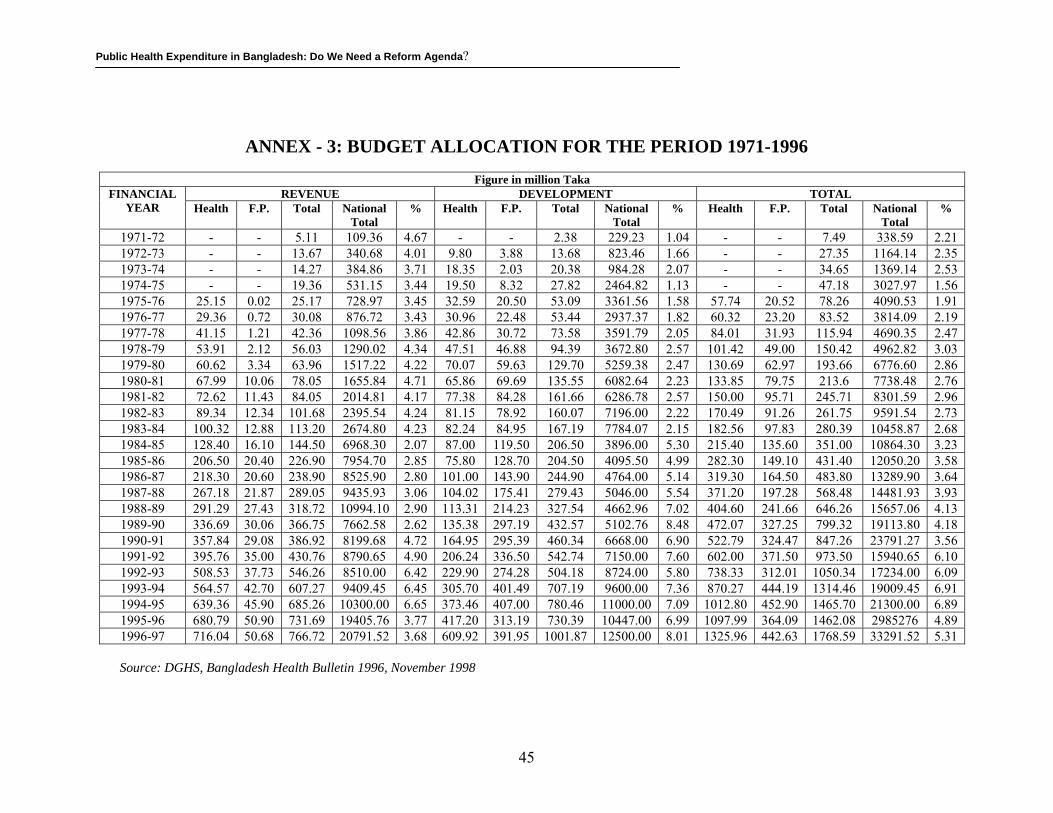
Public Health Expenditure in Bangladesh: Do We Need a Reform Agenda?
ANNEX - 3: BUDGET ALLOCATION FOR THE PERIOD 1971-1996
Figure in million Taka
REVENUE DEVELOPMENT TOTALFINANCIAL YEAR Health F.P. Total National
Total % Health F.P. Total National
Total % Health F.P. Total National
Total %
1971-72 - - 5.11 109.36 4.67 - - 2.38 229.23 1.04 - - 7.49 338.59 2.211972-73 - - 13.67 340.68 4.01 9.80 3.88 13.68 823.46 1.66 - - 27.35 1164.14 2.351973-74 - - 14.27 384.86 3.71 18.35 2.03 20.38 984.28 2.07 - - 34.65 1369.14 2.531974-75 - - 19.36 531.15 3.44 19.50 8.32 27.82 2464.82 1.13 - - 47.18 3027.97 1.561975-76 25.15 0.02 25.17 728.97 3.45 32.59 20.50 53.09 3361.56 1.58 57.74 20.52 78.26 4090.53 1.911976-77 29.36 0.72 30.08 876.72 3.43 30.96 22.48 53.44 2937.37 1.82 60.32 23.20 83.52 3814.09 2.191977-78 41.15 1.21 42.36 1098.56 3.86 42.86 30.72 73.58 3591.79 2.05 84.01 31.93 115.94 4690.35 2.471978-79 53.91 2.12 56.03 1290.02 4.34 47.51 46.88 94.39 3672.80 2.57 101.42 49.00 150.42 4962.82 3.031979-80 60.62 3.34 63.96 1517.22 4.22 70.07 59.63 129.70 5259.38 2.47 130.69 62.97 193.66 6776.60 2.861980-81 67.99 10.06 78.05 1655.84 4.71 65.86 69.69 135.55 6082.64 2.23 133.85 79.75 213.6 7738.48 2.761981-82 72.62 11.43 84.05 2014.81 4.17 77.38 84.28 161.66 6286.78 2.57 150.00 95.71 245.71 8301.59 2.961982-83 89.34 12.34 101.68 2395.54 4.24 81.15 78.92 160.07 7196.00 2.22 170.49 91.26 261.75 9591.54 2.731983-84 100.32 12.88 113.20 2674.80 4.23 82.24 84.95 167.19 7784.07 2.15 182.56 97.83 280.39 10458.87 2.681984-85 128.40 16.10 144.50 6968.30 2.07 87.00 119.50 206.50 3896.00 5.30 215.40 135.60 351.00 10864.30 3.231985-86 206.50 20.40 226.90 7954.70 2.85 75.80 128.70 204.50 4095.50 4.99 282.30 149.10 431.40 12050.20 3.581986-87 218.30 20.60 238.90 8525.90 2.80 101.00 143.90 244.90 4764.00 5.14 319.30 164.50 483.80 13289.90 3.641987-88 267.18 21.87 289.05 9435.93 3.06 104.02 175.41 279.43 5046.00 5.54 371.20 197.28 568.48 14481.93 3.931988-89 291.29 27.43 318.72 10994.10 2.90 113.31 214.23 327.54 4662.96 7.02 404.60 241.66 646.26 15657.06 4.131989-90 336.69 30.06 366.75 7662.58 2.62 135.38 297.19 432.57 5102.76 8.48 472.07 327.25 799.32 19113.80 4.181990-91 357.84 29.08 386.92 8199.68 4.72 164.95 295.39 460.34 6668.00 6.90 522.79 324.47 847.26 23791.27 3.561991-92 395.76 35.00 430.76 8790.65 4.90 206.24 336.50 542.74 7150.00 7.60 602.00 371.50 973.50 15940.65 6.101992-93 508.53 37.73 546.26 8510.00 6.42 229.90 274.28 504.18 8724.00 5.80 738.33 312.01 1050.34 17234.00 6.091993-94 564.57 42.70 607.27 9409.45 6.45 305.70 401.49 707.19 9600.00 7.36 870.27 444.19 1314.46 19009.45 6.911994-95 639.36 45.90 685.26 10300.00 6.65 373.46 407.00 780.46 11000.00 7.09 1012.80 452.90 1465.70 21300.00 6.891995-96 680.79 50.90 731.69 19405.76 3.77 417.20 313.19 730.39 10447.00 6.99 1097.99 364.09 1462.08 2985276 4.891996-97 716.04 50.68 766.72 20791.52 3.68 609.92 391.95 1001.87 12500.00 8.01 1325.96 442.63 1768.59 33291.52 5.31
Source: DGHS, Bangladesh Health Bulletin 1996, November 1998
45
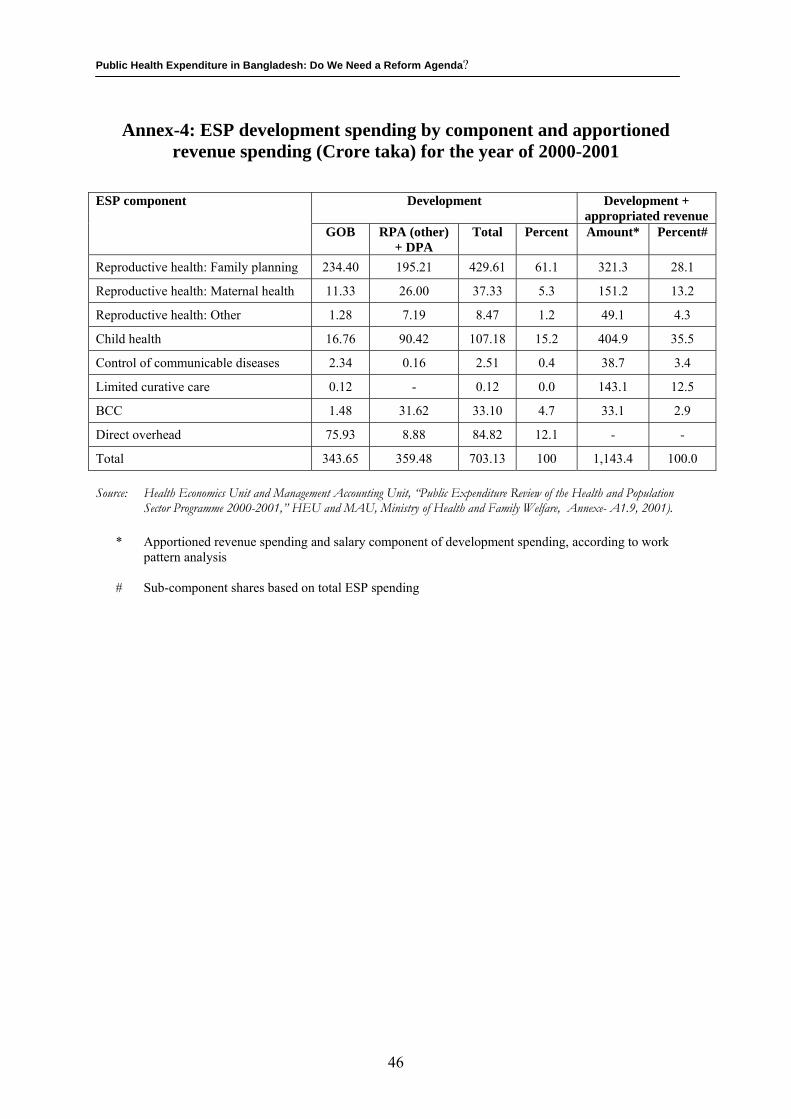
Public Health Expenditure in Bangladesh: Do We Need a Reform Agenda?
Annex-4: ESP development spending by component and apportioned revenue spending (Crore taka) for the year of 2000-2001
Development Development + appropriated revenue
ESP component
GOB RPA (other) + DPA
Total Percent Amount* Percent#
Reproductive health: Family planning 234.40 195.21 429.61 61.1 321.3 28.1
Reproductive health: Maternal health 11.33 26.00 37.33 5.3 151.2 13.2
Reproductive health: Other 1.28 7.19 8.47 1.2 49.1 4.3
Child health 16.76 90.42 107.18 15.2 404.9 35.5
Control of communicable diseases 2.34 0.16 2.51 0.4 38.7 3.4
Limited curative care 0.12 - 0.12 0.0 143.1 12.5
BCC 1.48 31.62 33.10 4.7 33.1 2.9
Direct overhead 75.93 8.88 84.82 12.1 - -
Total 343.65 359.48 703.13 100 1,143.4 100.0 Source: Health Economics Unit and Management Accounting Unit, “Public Expenditure Review of the Health and Population
Sector Programme 2000-2001,” HEU and MAU, Ministry of Health and Family Welfare, Annexe- A1.9, 2001). * Apportioned revenue spending and salary component of development spending, according to work
pattern analysis # Sub-component shares based on total ESP spending
46
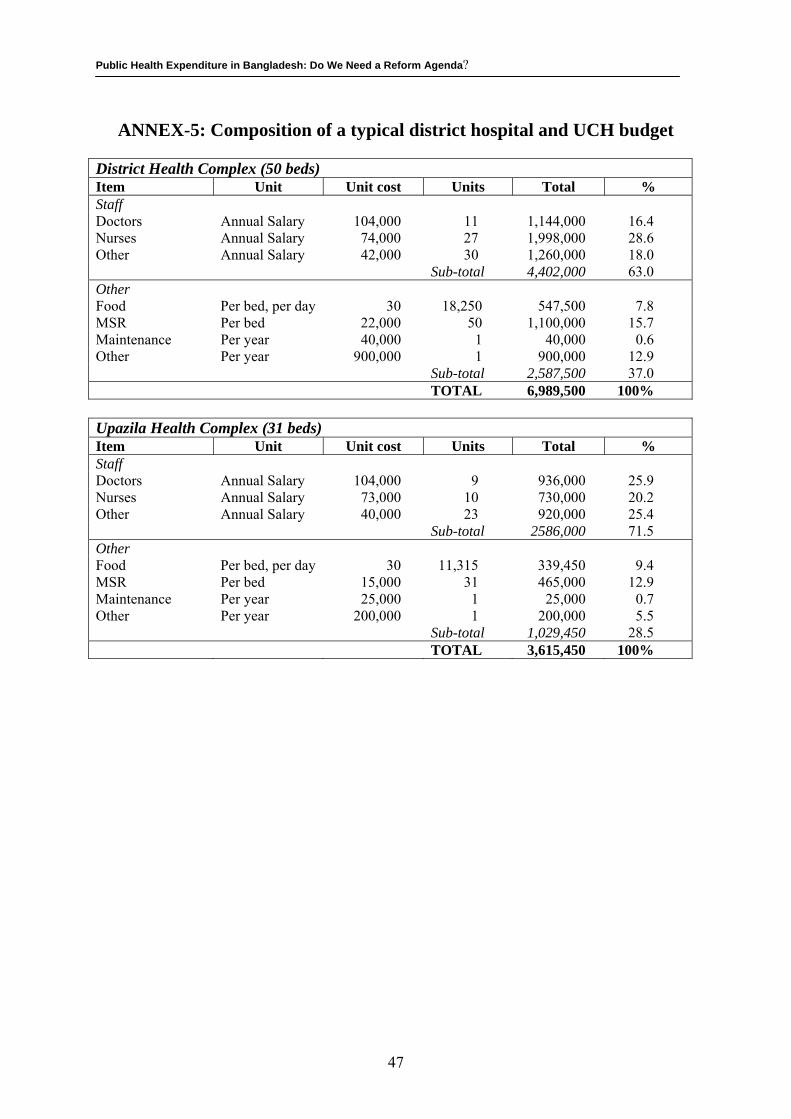
Public Health Expenditure in Bangladesh: Do We Need a Reform Agenda?
ANNEX-5: Composition of a typical district hospital and UCH budget District Health Complex (50 beds) Item Unit Unit cost Units Total % Staff Doctors Annual Salary 104,000 11 1,144,000 16.4 Nurses Annual Salary 74,000 27 1,998,000 28.6 Other Annual Salary 42,000 30 1,260,000 18.0 Sub-total 4,402,000 63.0 Other Food Per bed, per day 30 18,250 547,500 7.8 MSR Per bed 22,000 50 1,100,000 15.7 Maintenance Per year 40,000 1 40,000 0.6 Other Per year 900,000 1 900,000 12.9 Sub-total 2,587,500 37.0 TOTAL 6,989,500 100% Upazila Health Complex (31 beds) Item Unit Unit cost Units Total % Staff Doctors Annual Salary 104,000 9 936,000 25.9 Nurses Annual Salary 73,000 10 730,000 20.2 Other Annual Salary 40,000 23 920,000 25.4 Sub-total 2586,000 71.5 Other Food Per bed, per day 30 11,315 339,450 9.4 MSR Per bed 15,000 31 465,000 12.9 Maintenance Per year 25,000 1 25,000 0.7 Other Per year 200,000 1 200,000 5.5 Sub-total 1,029,450 28.5 TOTAL 3,615,450 100%
47
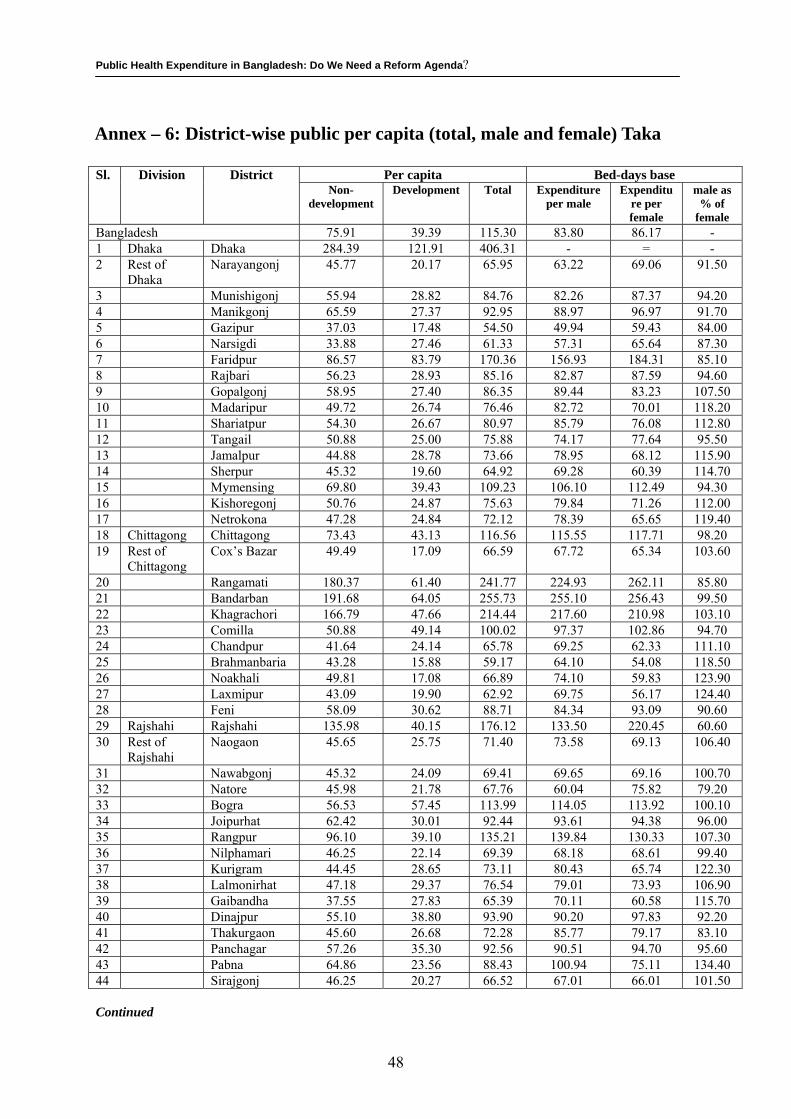
Public Health Expenditure in Bangladesh: Do We Need a Reform Agenda?
Annex – 6: District-wise public per capita (total, male and female) Taka
Per capita Bed-days base Sl. Division District Non-
development Development Total Expenditure
per male Expenditu
re per female
male as % of
female Bangladesh 75.91 39.39 115.30 83.80 86.17 - 1 Dhaka Dhaka 284.39 121.91 406.31 - = - 2 Rest of
Dhaka Narayangonj 45.77 20.17 65.95 63.22 69.06 91.50
3 Munishigonj 55.94 28.82 84.76 82.26 87.37 94.20 4 Manikgonj 65.59 27.37 92.95 88.97 96.97 91.70 5 Gazipur 37.03 17.48 54.50 49.94 59.43 84.00 6 Narsigdi 33.88 27.46 61.33 57.31 65.64 87.30 7 Faridpur 86.57 83.79 170.36 156.93 184.31 85.10 8 Rajbari 56.23 28.93 85.16 82.87 87.59 94.60 9 Gopalgonj 58.95 27.40 86.35 89.44 83.23 107.50 10 Madaripur 49.72 26.74 76.46 82.72 70.01 118.20 11 Shariatpur 54.30 26.67 80.97 85.79 76.08 112.80 12 Tangail 50.88 25.00 75.88 74.17 77.64 95.50 13 Jamalpur 44.88 28.78 73.66 78.95 68.12 115.90 14 Sherpur 45.32 19.60 64.92 69.28 60.39 114.70 15 Mymensing 69.80 39.43 109.23 106.10 112.49 94.30 16 Kishoregonj 50.76 24.87 75.63 79.84 71.26 112.00 17 Netrokona 47.28 24.84 72.12 78.39 65.65 119.40 18 Chittagong Chittagong 73.43 43.13 116.56 115.55 117.71 98.20 19 Rest of
Chittagong Cox’s Bazar 49.49 17.09 66.59 67.72 65.34 103.60
20 Rangamati 180.37 61.40 241.77 224.93 262.11 85.80 21 Bandarban 191.68 64.05 255.73 255.10 256.43 99.50 22 Khagrachori 166.79 47.66 214.44 217.60 210.98 103.10 23 Comilla 50.88 49.14 100.02 97.37 102.86 94.70 24 Chandpur 41.64 24.14 65.78 69.25 62.33 111.10 25 Brahmanbaria 43.28 15.88 59.17 64.10 54.08 118.50 26 Noakhali 49.81 17.08 66.89 74.10 59.83 123.90 27 Laxmipur 43.09 19.90 62.92 69.75 56.17 124.40 28 Feni 58.09 30.62 88.71 84.34 93.09 90.60 29 Rajshahi Rajshahi 135.98 40.15 176.12 133.50 220.45 60.60 30 Rest of
Rajshahi Naogaon 45.65 25.75 71.40 73.58 69.13 106.40
31 Nawabgonj 45.32 24.09 69.41 69.65 69.16 100.70 32 Natore 45.98 21.78 67.76 60.04 75.82 79.20 33 Bogra 56.53 57.45 113.99 114.05 113.92 100.10 34 Joipurhat 62.42 30.01 92.44 93.61 94.38 96.00 35 Rangpur 96.10 39.10 135.21 139.84 130.33 107.30 36 Nilphamari 46.25 22.14 69.39 68.18 68.61 99.40 37 Kurigram 44.45 28.65 73.11 80.43 65.74 122.30 38 Lalmonirhat 47.18 29.37 76.54 79.01 73.93 106.90 39 Gaibandha 37.55 27.83 65.39 70.11 60.58 115.70 40 Dinajpur 55.10 38.80 93.90 90.20 97.83 92.20 41 Thakurgaon 45.60 26.68 72.28 85.77 79.17 83.10 42 Panchagar 57.26 35.30 92.56 90.51 94.70 95.60 43 Pabna 64.86 23.56 88.43 100.94 75.11 134.40 44 Sirajgonj 46.25 20.27 66.52 67.01 66.01 101.50 Continued
48
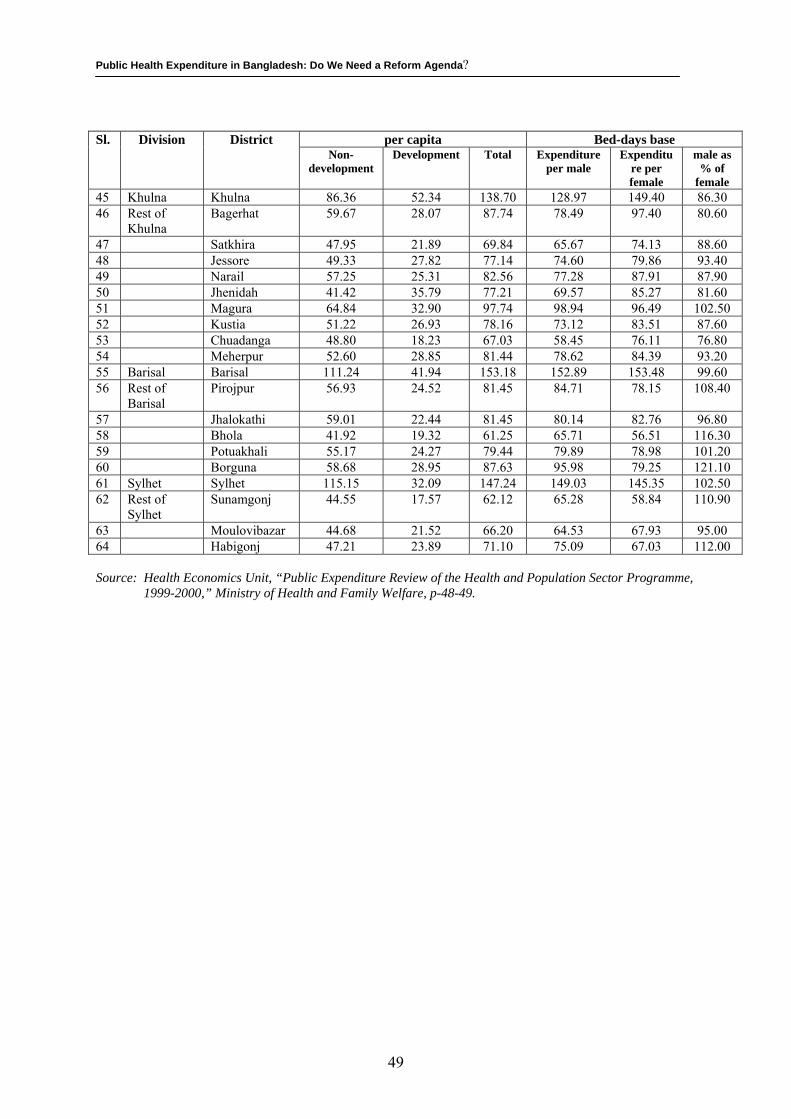
Public Health Expenditure in Bangladesh: Do We Need a Reform Agenda?
per capita Bed-days base Sl. Division District Non-
development Development Total Expenditure
per male Expenditu
re per female
male as % of
female 45 Khulna Khulna 86.36 52.34 138.70 128.97 149.40 86.30 46 Rest of
Khulna Bagerhat 59.67 28.07 87.74 78.49 97.40 80.60
47 Satkhira 47.95 21.89 69.84 65.67 74.13 88.60 48 Jessore 49.33 27.82 77.14 74.60 79.86 93.40 49 Narail 57.25 25.31 82.56 77.28 87.91 87.90 50 Jhenidah 41.42 35.79 77.21 69.57 85.27 81.60 51 Magura 64.84 32.90 97.74 98.94 96.49 102.50 52 Kustia 51.22 26.93 78.16 73.12 83.51 87.60 53 Chuadanga 48.80 18.23 67.03 58.45 76.11 76.80 54 Meherpur 52.60 28.85 81.44 78.62 84.39 93.20 55 Barisal Barisal 111.24 41.94 153.18 152.89 153.48 99.60 56 Rest of
Barisal Pirojpur 56.93 24.52 81.45 84.71 78.15 108.40
57 Jhalokathi 59.01 22.44 81.45 80.14 82.76 96.80 58 Bhola 41.92 19.32 61.25 65.71 56.51 116.30 59 Potuakhali 55.17 24.27 79.44 79.89 78.98 101.20 60 Borguna 58.68 28.95 87.63 95.98 79.25 121.10 61 Sylhet Sylhet 115.15 32.09 147.24 149.03 145.35 102.50 62 Rest of
Sylhet Sunamgonj 44.55 17.57 62.12 65.28 58.84 110.90
63 Moulovibazar 44.68 21.52 66.20 64.53 67.93 95.00 64 Habigonj 47.21 23.89 71.10 75.09 67.03 112.00 Source: Health Economics Unit, “Public Expenditure Review of the Health and Population Sector Programme,
1999-2000,” Ministry of Health and Family Welfare, p-48-49.
49