Embed Size (px)
Citation preview
Public Health, Energy &
Climate Change A Maryland Statewide Survey | Fall 2015
Investigators:
Karen Akerlof, PhD
Edward Maibach, MPH, PhD
George Mason University
Center for Climate Change Communication
4400 University Dr., MS 6A8
Fairfax, VA 22030
[email protected], (703) 993-6667
Peter Winch, MD, MPH
Cindy Parker, MD, MPH
Johns Hopkins Bloomberg
School of Public Health
615 North Wolfe Street
Baltimore, MD 21205
[email protected]; [email protected]
This survey was funded by the Town Creek Foundation of Easton, MD. We thank the
Foundation and Executive Director Stuart Clarke for their support. We also thank members of
the Climate Communication Consortium of Maryland (climatemaryland.org), many of whom
assisted in the development of the survey.
The research was made possible by the expertise and hard work of many individuals, including
a team of students at George Mason University. Paige Frasier and Bill Rohring provided
invaluable help in coordinating the survey’s fielding. They – with additional assistance provided
by Mason undergraduate and graduate students Caroline Boules, Premchand Chandra, Aiya Al-
Beyati, Refka Al-Beyati, Kristina Clarin, NahJah Gardiner, Brittany Grutter, Danielle Kirby,
Deanna Kirby, Stacy Nelson, Emily Novack, Nathalie Rosado-Burgos, Amy Rose, Pary Shuaib,
Olivia Stanford, Batel Yona, Roxana Kazemi, Elloise Lotoc, and Suzanne Hewitt – assembled the
mailings over a series of long weekends. Paul Weiss from Emory University provided statistical
support for the weights. Paul Delamater from George Mason University provided assistance in
mapping the survey data. Any errors are those of the authors.
Credits, cover photo:
Crystal Romeo-Upperman, doctoral student at the University of Maryland School of Public
Health and program manager at the Maryland Department of Health and Mental Hygiene, holds
an inhaler in front of a magnified image of pollen grains. Photographer, David Harp.
Suggested citation:
Akerlof, K., Winch, P., Parker, C., & Buckland, A. (2015). Public health, energy & climate change,
fall 2015. Fairfax, VA: Center for Climate Change Communication, George Mason University.
Table of Contents
Executive Summary ......................................................................................................................... 1
1. Most say air pollution and chemicals are the top threats to their health .......................... 5
Majorities of Eastern Shore residents say flooding and sea-level rise put them at risk ....... 5
Climate change is recognized as a personal health threat by most ...................................... 5
2. Wind and solar energy are not perceived as harmful to health; coal, oil, and nuclear
power are perceived as harmful ........................................................................................... 8
Substantial percentages say they don’t know the health effects of energy sources ............ 8
Wood fuel is perceived as harmful to health ........................................................................ 8
3. Majorities say they are concerned about the effects of air pollution, yet few rate their
air quality as poor ............................................................................................................. 10
Residents rank home air quality the highest ....................................................................... 10
4. Many Marylanders experience chronic health conditions and prolonged stress ............ 12
More than a third of Marylanders diagnosed with asthma suffered an attack in recent
months ................................................................................................................................. 12
Half of household members with asthma are children, including a quarter under age 6 .. 12
A quarter of asthmatic household members have lost days of work, school or other
activities ............................................................................................................................... 13
A majority have experienced prolonged stress in the past year ......................................... 13
5. Majorities say reducing air pollution and decreasing rates of respiratory disease should
be high priorities for the state ............................................................................................ 15
6. People believe that their health – and that of their communities – is vulnerable and
harmed by climate change .................................................................................................. 16
Marylanders say climate change is already harming them and others
in the state ........................................................................................................................... 15
7. Allergies and respiratory problems top the list of ways residents think their health will
worsen due to climate change ............................................................................................ 18
8. Study methodology ............................................................................................................. 19
Appendices .................................................................................................................................... 21
Data tables ................................................................................................................... 22
Sample demographics .................................................................................................. 25
1 | Public Health, Energy & Climate, 2015 | A Maryland Statewide Survey
Executive Summary
In 2009, the U.S. Environmental Protection
Agency found that the greenhouse gases
that cause climate change endanger human
health and welfare,1 making climate change
not just an environmental issue, but a public
health concern.
Human health is directly and indirectly
affected by climate change through higher
temperatures, extreme weather, declines in
water availability and the productivity of
food systems, and increased air pollution.
The combustion of fossil fuels by motor
vehicles and power plants emits climate
change-causing pollution along with other
types of air contaminants that directly harm
people’s health. By reducing the emissions
that cause climate change, we also lessen
other types of pollution from the same
sources, resulting in immediate
improvements in health and well-being.
Maryland has been working to clean up its
air through policies like the Clean Cars Act
and the Healthy Air Act. The latter regulates
coal-fired plant emissions and instructs the
state to participate in a regional market-
based trading system for climate change-
causing emissions. Much of Maryland’s air
pollution originates in other states; yet even
so, Maryland has claimed recent successes
in lowering air pollution rates.2
1 Endangerment and cause or contribute findings for greenhouse gases under section 202(a) of the Clean Air Act, 74 Fed. Reg. 66496-99. (Dec. 2009) 2 U.S. EPA. (2015). Clean data determination [Baltimore, 8-hour ozone]. Available at http://www3.epa.gov/airquality/greenbk/adden.html
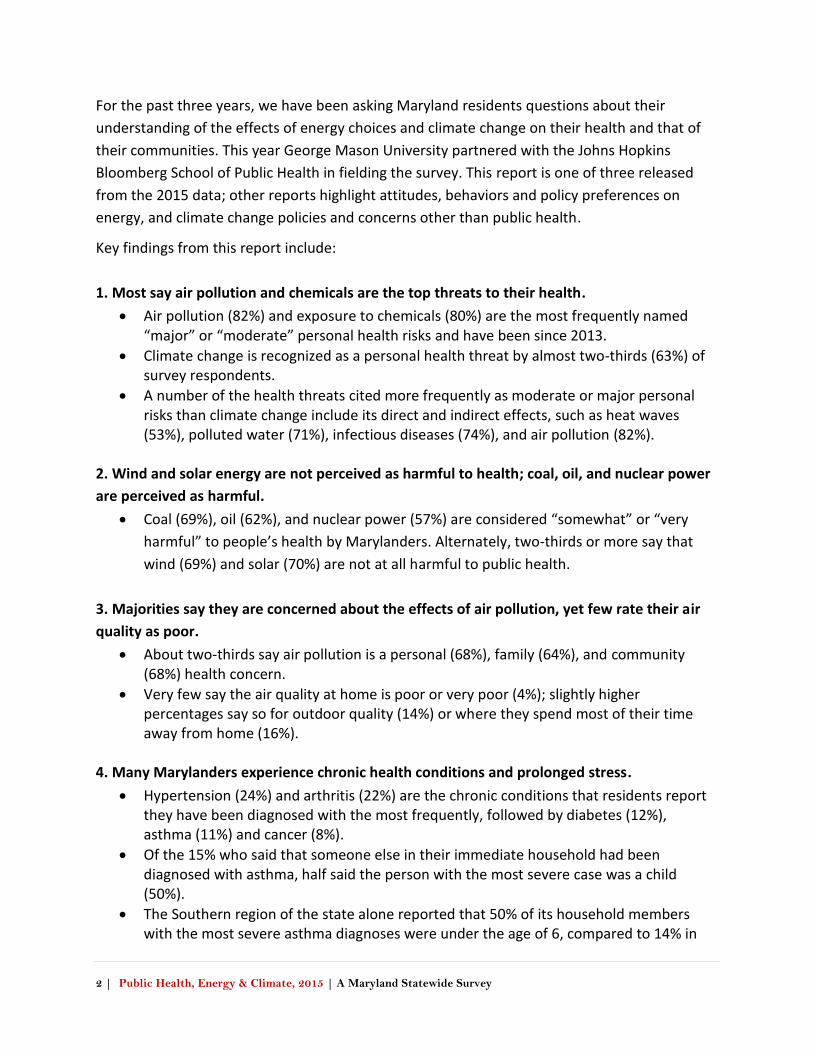
Fast facts on climate and health
The reduction of greenhouse gas emissions through the Greenhouse Gas Reduction Act Plan also lowers other pollutants that harm air and water quality and human health.
Power generation and transportation are the primary sources of Maryland’s greenhouse gas emissions and other air pollutants that affect a diverse array of human systems (i.e., neurological, cardiovascular, respiratory, immune and reproductive).
Heat is the leading cause of deaths related to weather in the United States. Heat waves increase death rates especially in the elderly and other susceptible populations including children, the mentally ill, those with pre-existing conditions like heart and lung diseases, and those who have occupations that expose them to heat stresses.
Every year, air pollution contributes to the top four leading causes of death in Maryland.a
About half of all deaths in Maryland are due to heart disease, cancer, stroke and chronic obstructive heart disease – conditions made worse by air pollution.a
Air pollution is thought to contribute to asthma suffered by one in nine children in Maryland.b
Poor air quality is associated with a higher risk of pre-term birth and birth defects.c
a Maryland Department of Health and Mental Hygiene. (2012). Maryland vital statistics annual report, 2012. Baltimore, MD: Vital Statistics Administration, DHMH. Available at http://www.dhmh.maryland.gov/ vsa/Documents/12annual.pdf b Centers for Disease Control. (2013). Child current asthma prevalence rate by state or territory: BRFSS 2013. Available at www.cdc.gov/asthma/brfss /2013/child/c4.pdf c Nieuwenhuijsen, M. J., Dadvand, P., Grellier, J., Martinez, D., & Vrijheid, M. (2013). Environmental risk factors of pregnancy outcomes: a summary of recent meta-analyses of epidemiological studies. Environ Health, 12(1), 6.
2 | Public Health, Energy & Climate, 2015 | A Maryland Statewide Survey
For the past three years, we have been asking Maryland residents questions about their
understanding of the effects of energy choices and climate change on their health and that of
their communities. This year George Mason University partnered with the Johns Hopkins
Bloomberg School of Public Health in fielding the survey. This report is one of three released
from the 2015 data; other reports highlight attitudes, behaviors and policy preferences on
energy, and climate change policies and concerns other than public health.
Key findings from this report include:
1. Most say air pollution and chemicals are the top threats to their health.
Air pollution (82%) and exposure to chemicals (80%) are the most frequently named “major” or “moderate” personal health risks and have been since 2013.
Climate change is recognized as a personal health threat by almost two-thirds (63%) of survey respondents.
A number of the health threats cited more frequently as moderate or major personal risks than climate change include its direct and indirect effects, such as heat waves (53%), polluted water (71%), infectious diseases (74%), and air pollution (82%).
2. Wind and solar energy are not perceived as harmful to health; coal, oil, and nuclear power
are perceived as harmful.
Coal (69%), oil (62%), and nuclear power (57%) are considered “somewhat” or “very
harmful” to people’s health by Marylanders. Alternately, two-thirds or more say that
wind (69%) and solar (70%) are not at all harmful to public health.
3. Majorities say they are concerned about the effects of air pollution, yet few rate their air
quality as poor.
About two-thirds say air pollution is a personal (68%), family (64%), and community (68%) health concern.
Very few say the air quality at home is poor or very poor (4%); slightly higher percentages say so for outdoor quality (14%) or where they spend most of their time away from home (16%).
4. Many Marylanders experience chronic health conditions and prolonged stress.
Hypertension (24%) and arthritis (22%) are the chronic conditions that residents report they have been diagnosed with the most frequently, followed by diabetes (12%), asthma (11%) and cancer (8%).
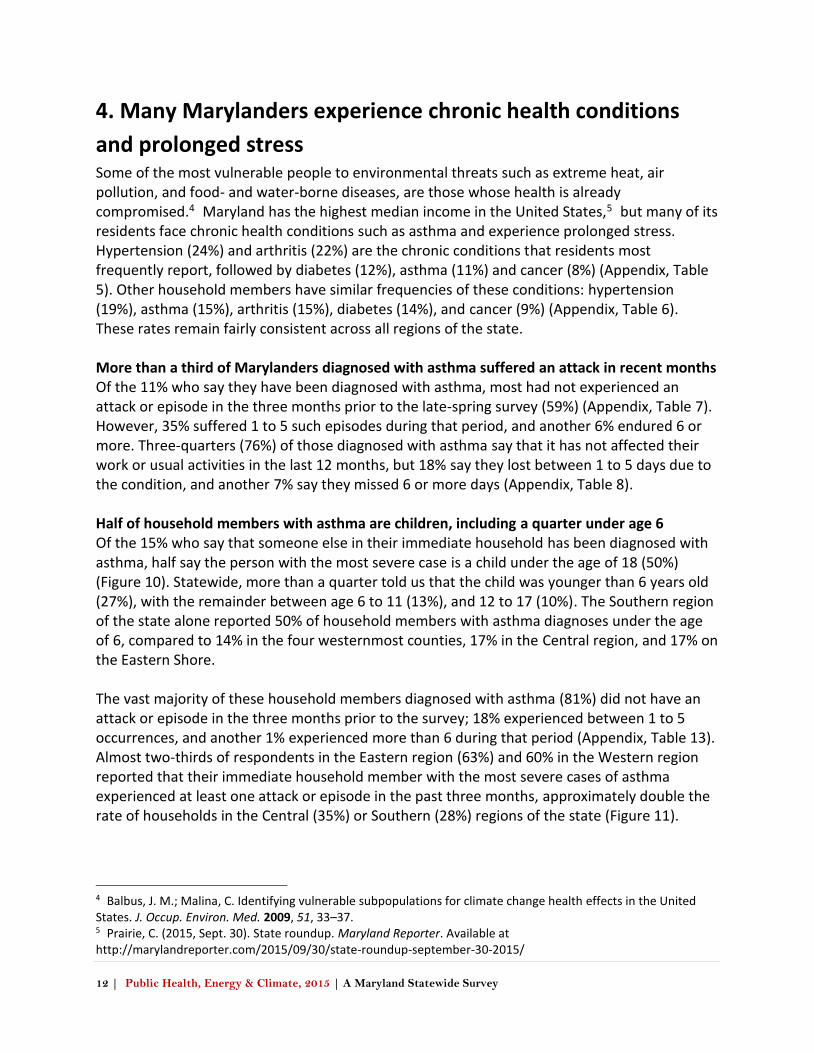
Of the 15% who said that someone else in their immediate household had been diagnosed with asthma, half said the person with the most severe case was a child (50%).
The Southern region of the state alone reported that 50% of its household members with the most severe asthma diagnoses were under the age of 6, compared to 14% in
3 | Public Health, Energy & Climate, 2015 | A Maryland Statewide Survey
the four westernmost counties, 17% in the Central region, and 17% on the Eastern Shore.
5. Majorities say reducing air pollution and decreasing rates of respiratory disease should be
high priorities for the state.
More than half of Marylanders say the General Assembly and Governor should make lowering the state’s rate of asthma and respiratory disease (59%) and reducing air pollution (68%) a high or very high priority.
More than half of residents in each of the four regions of the state say respiratory diseases should be a top priority (Western, 51%; Central, 61%; Southern, 51%; Eastern, 58%).
6. Marylanders say that their health – and that of their communities – is vulnerable and
harmed by climate change.
About 7 in 10 Marylanders say they (72%), people in their households (68%), and those
in their communities (69%) are vulnerable to the potential health impacts of climate
change.
More than two-thirds say that climate change is already harming them (67%), their
community (67%), and people in Maryland (68%).
7. Allergies and respiratory problems top the list of ways residents think their health will
worsen due to climate change.
More than half of Marylanders say climate change will worsen allergies (69%), respiratory and breathing problems (62%), injuries from storms or other extreme weather (58%), and heat stroke 57%).
Food- and water-borne illness (48%), infectious diseases (37%), and mental health disorders (24%) are less commonly associated with climate change.
Study methodology
The survey was mailed to 6,401 households in the state of Maryland, randomly selected from
within each of four regions of the state (Figure 1). We sampled at the regional level to ensure
the final data were generalizable to these distinctly different geographic and cultural areas, as
well as to the state as a whole. Data were weighted at both the state and regional levels in
accordance with U.S. Census population distributions. Households that responded to the survey
in 2013 and 2014 were not re-contacted in 2015. The survey was fielded from April 11 to June
24 with a response rate of 27%. The unweighted sample margin of error is +/- 2.5 percentage
points at the 95% confidence interval for the state and less than +/- 5.7 percentage points for
each region (Study methodology, p. 19).
4 | Public Health, Energy & Climate, 2015 | A Maryland Statewide Survey
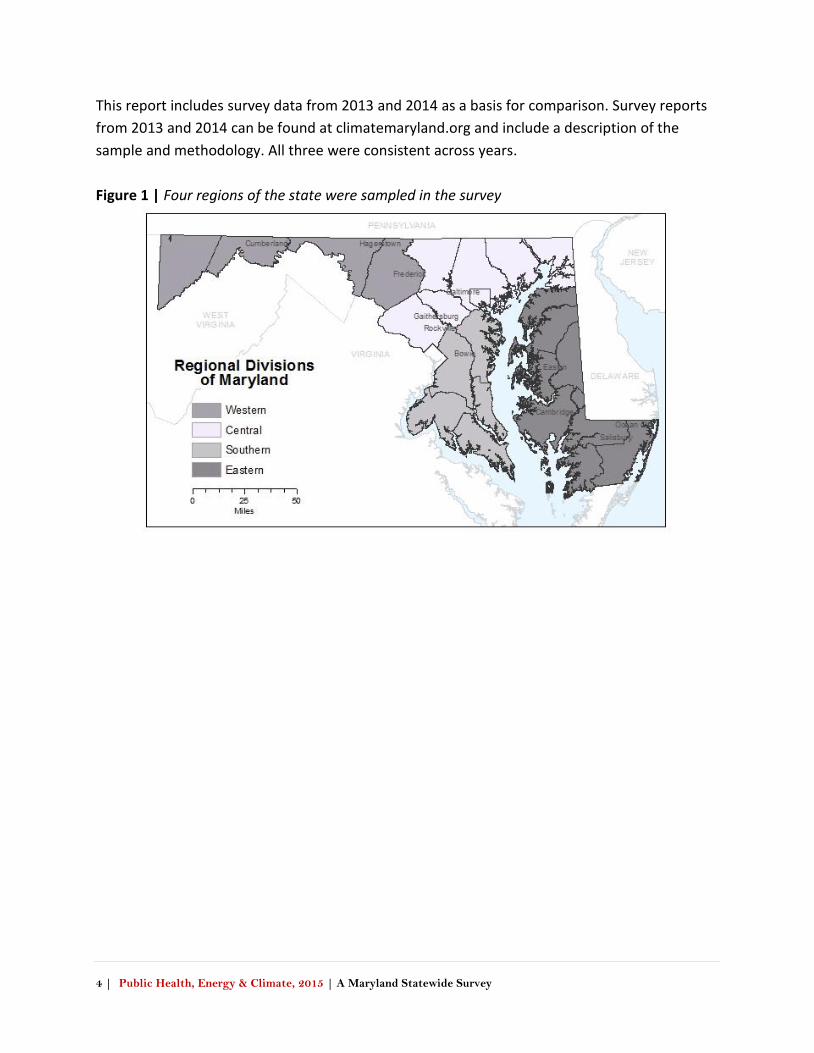
This report includes survey data from 2013 and 2014 as a basis for comparison. Survey reports
from 2013 and 2014 can be found at climatemaryland.org and include a description of the
sample and methodology. All three were consistent across years.
Figure 1 | Four regions of the state were sampled in the survey
5 | Public Health, Energy & Climate, 2015 | A Maryland Statewide Survey
1. Most say air pollution and chemicals are the top threats to
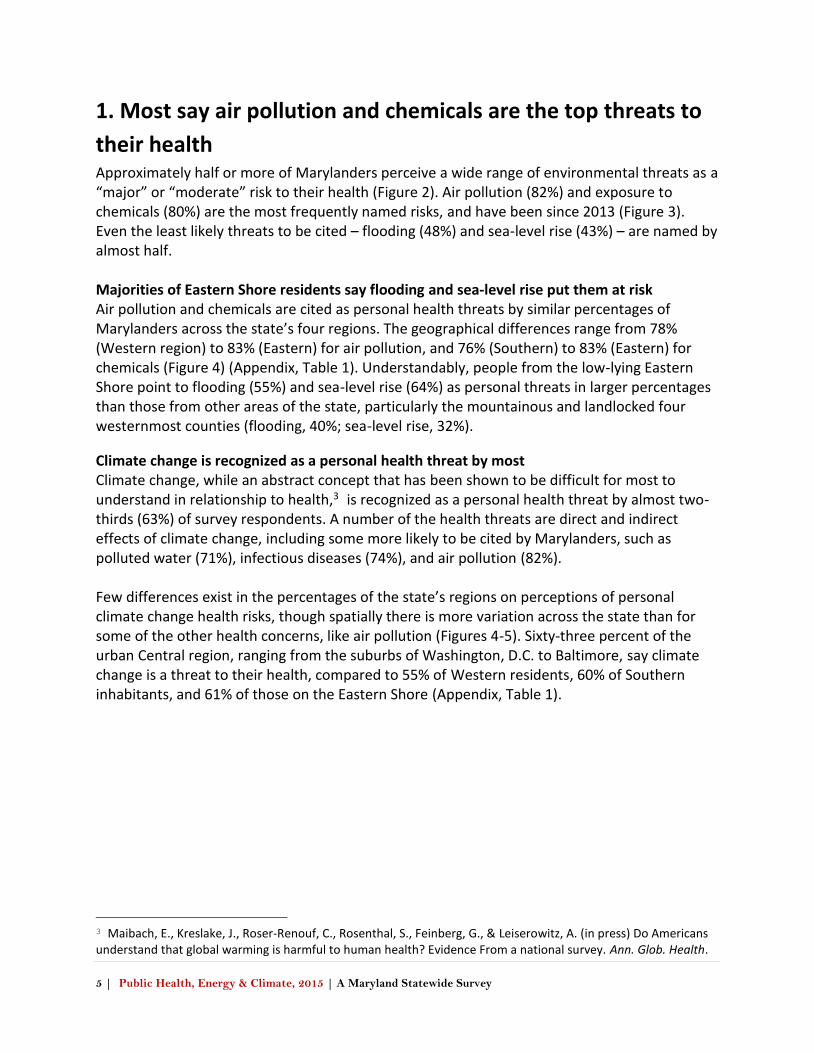
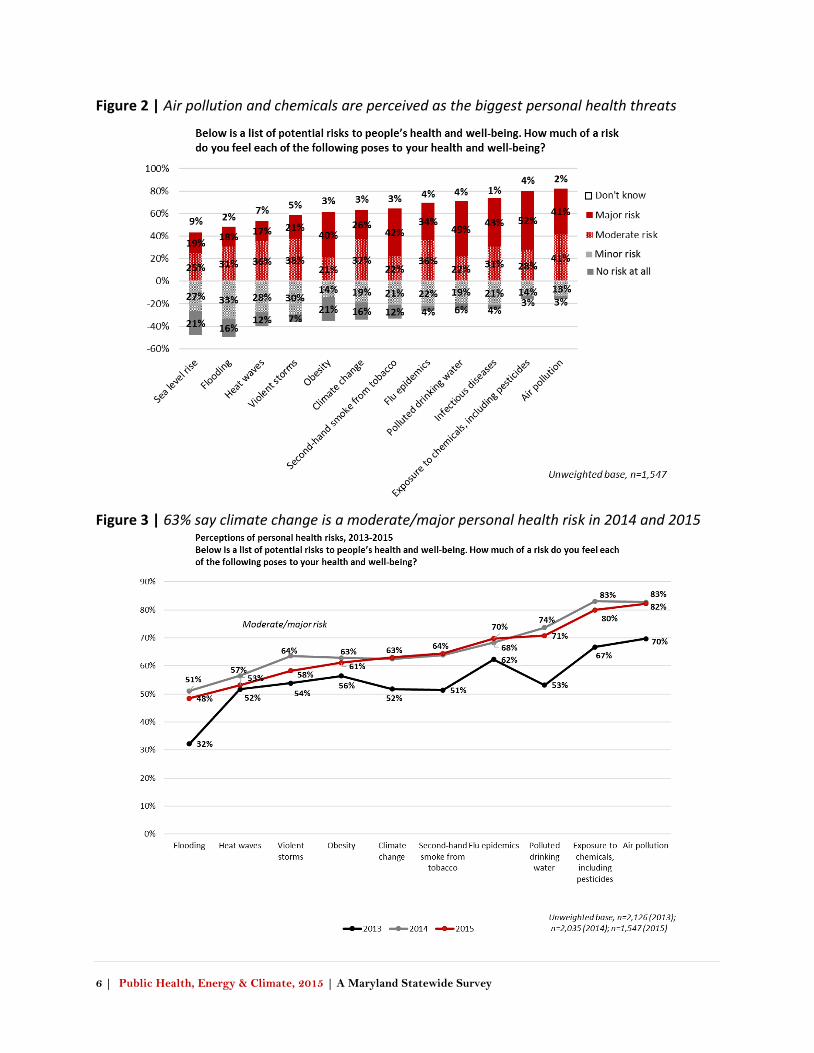
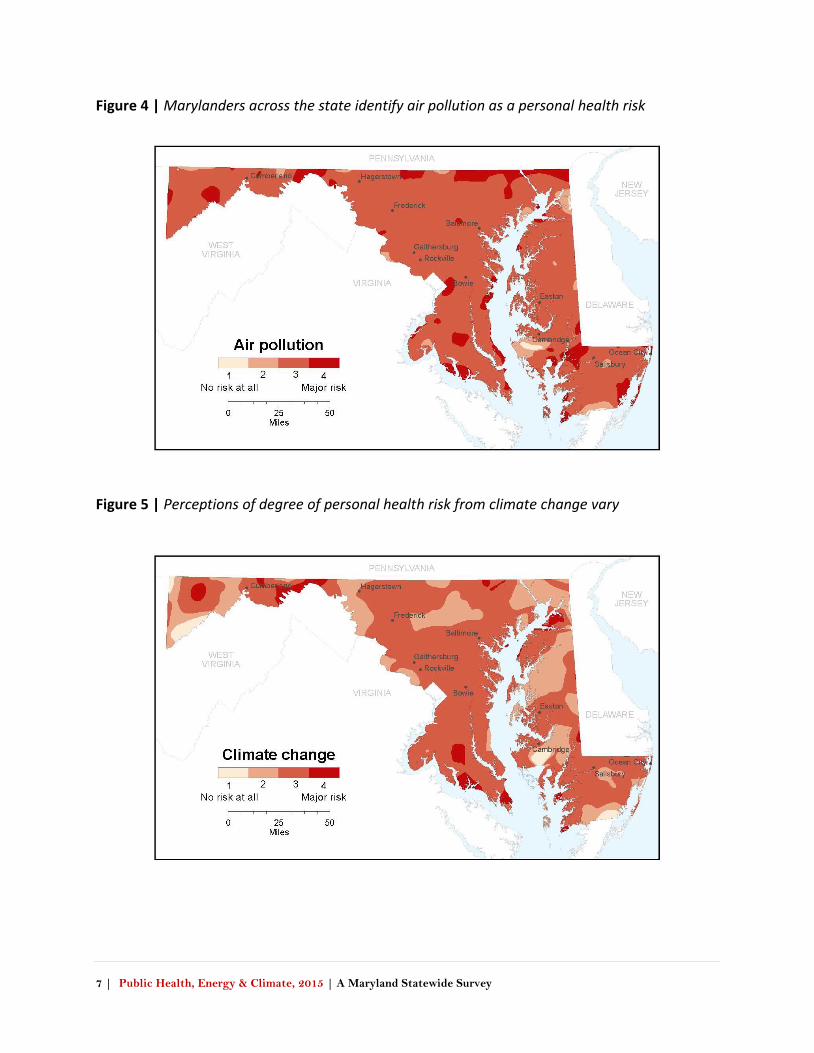
their health Approximately half or more of Marylanders perceive a wide range of environmental threats as a “major” or “moderate” risk to their health (Figure 2). Air pollution (82%) and exposure to chemicals (80%) are the most frequently named risks, and have been since 2013 (Figure 3). Even the least likely threats to be cited – flooding (48%) and sea-level rise (43%) – are named by almost half. Majorities of Eastern Shore residents say flooding and sea-level rise put them at risk Air pollution and chemicals are cited as personal health threats by similar percentages of Marylanders across the state’s four regions. The geographical differences range from 78% (Western region) to 83% (Eastern) for air pollution, and 76% (Southern) to 83% (Eastern) for chemicals (Figure 4) (Appendix, Table 1). Understandably, people from the low-lying Eastern Shore point to flooding (55%) and sea-level rise (64%) as personal threats in larger percentages than those from other areas of the state, particularly the mountainous and landlocked four westernmost counties (flooding, 40%; sea-level rise, 32%).
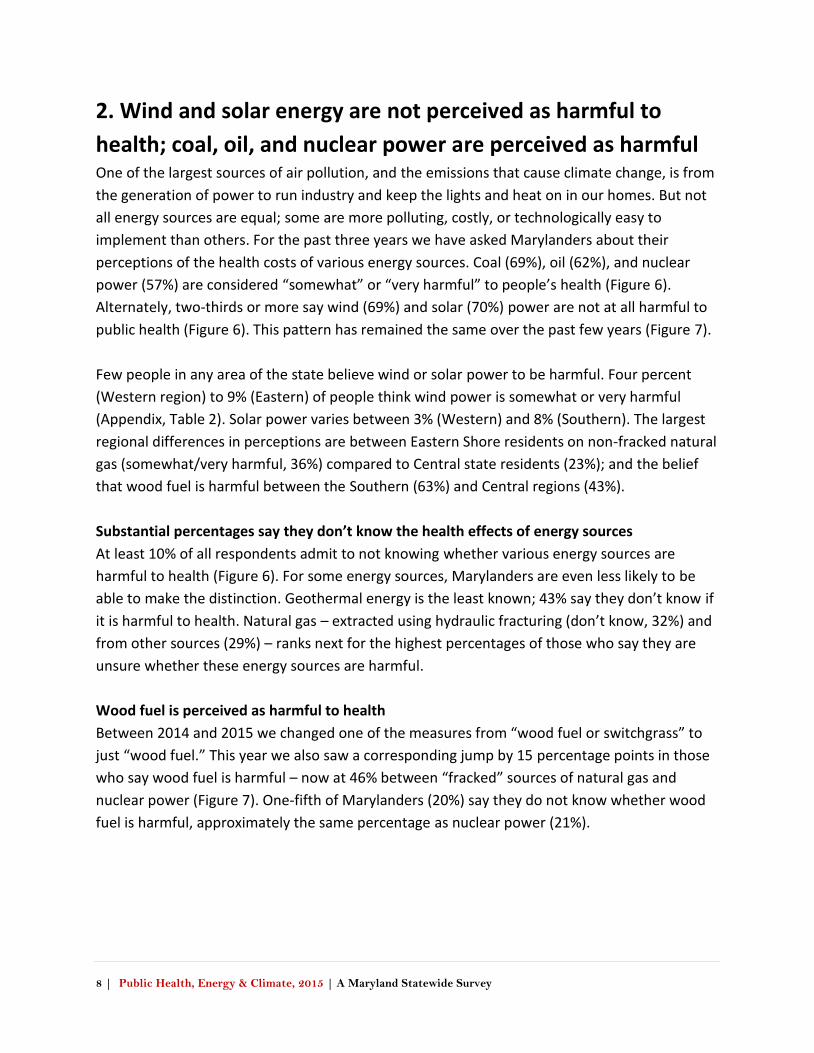
Climate change is recognized as a personal health threat by most Climate change, while an abstract concept that has been shown to be difficult for most to understand in relationship to health,3 is recognized as a personal health threat by almost two-thirds (63%) of survey respondents. A number of the health threats are direct and indirect effects of climate change, including some more likely to be cited by Marylanders, such as polluted water (71%), infectious diseases (74%), and air pollution (82%). Few differences exist in the percentages of the state’s regions on perceptions of personal climate change health risks, though spatially there is more variation across the state than for some of the other health concerns, like air pollution (Figures 4-5). Sixty-three percent of the urban Central region, ranging from the suburbs of Washington, D.C. to Baltimore, say climate change is a threat to their health, compared to 55% of Western residents, 60% of Southern inhabitants, and 61% of those on the Eastern Shore (Appendix, Table 1).
3 Maibach, E., Kreslake, J., Roser-Renouf, C., Rosenthal, S., Feinberg, G., & Leiserowitz, A. (in press) Do Americans understand that global warming is harmful to human health? Evidence From a national survey. Ann. Glob. Health.
6 | Public Health, Energy & Climate, 2015 | A Maryland Statewide Survey
Figure 2 | Air pollution and chemicals are perceived as the biggest personal health threats
Figure 3 | 63% say climate change is a moderate/major personal health risk in 2014 and 2015
7 | Public Health, Energy & Climate, 2015 | A Maryland Statewide Survey
Figure 4 | Marylanders across the state identify air pollution as a personal health risk
Figure 5 | Perceptions of degree of personal health risk from climate change vary
8 | Public Health, Energy & Climate, 2015 | A Maryland Statewide Survey
2. Wind and solar energy are not perceived as harmful to
health; coal, oil, and nuclear power are perceived as harmful One of the largest sources of air pollution, and the emissions that cause climate change, is from
the generation of power to run industry and keep the lights and heat on in our homes. But not
all energy sources are equal; some are more polluting, costly, or technologically easy to
implement than others. For the past three years we have asked Marylanders about their
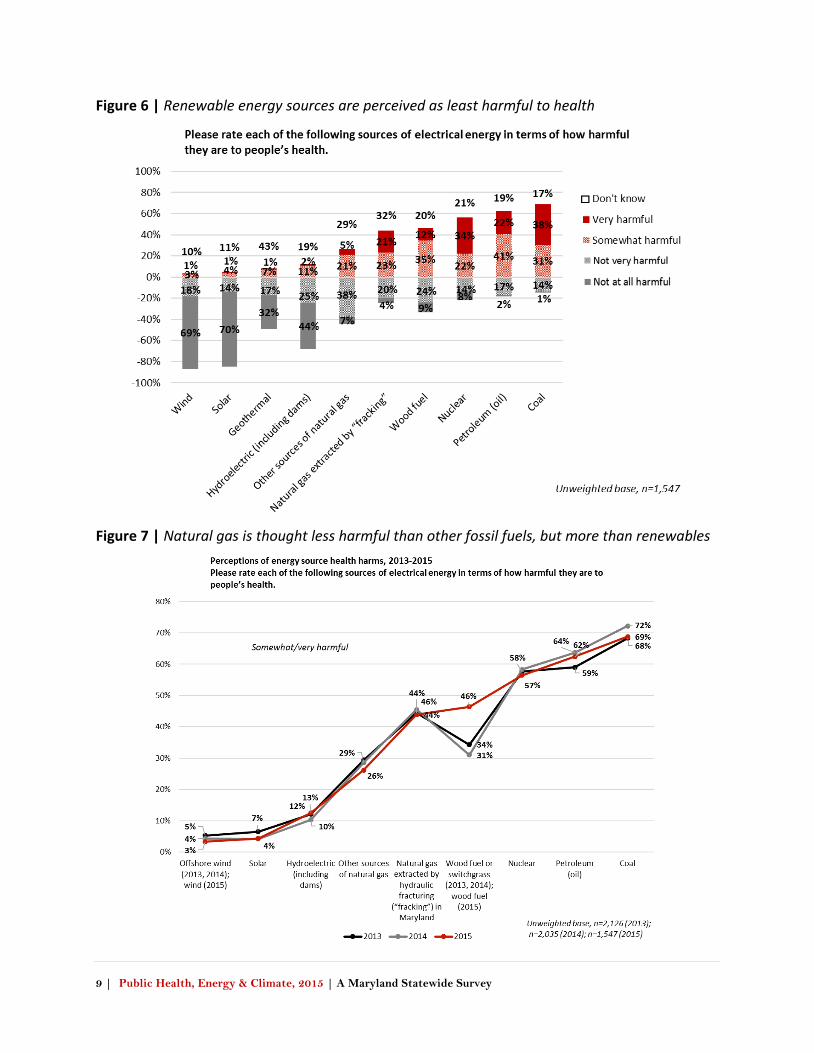
perceptions of the health costs of various energy sources. Coal (69%), oil (62%), and nuclear
power (57%) are considered “somewhat” or “very harmful” to people’s health (Figure 6).
Alternately, two-thirds or more say wind (69%) and solar (70%) power are not at all harmful to
public health (Figure 6). This pattern has remained the same over the past few years (Figure 7).
Few people in any area of the state believe wind or solar power to be harmful. Four percent
(Western region) to 9% (Eastern) of people think wind power is somewhat or very harmful
(Appendix, Table 2). Solar power varies between 3% (Western) and 8% (Southern). The largest
regional differences in perceptions are between Eastern Shore residents on non-fracked natural
gas (somewhat/very harmful, 36%) compared to Central state residents (23%); and the belief
that wood fuel is harmful between the Southern (63%) and Central regions (43%).
Substantial percentages say they don’t know the health effects of energy sources
At least 10% of all respondents admit to not knowing whether various energy sources are
harmful to health (Figure 6). For some energy sources, Marylanders are even less likely to be
able to make the distinction. Geothermal energy is the least known; 43% say they don’t know if
it is harmful to health. Natural gas – extracted using hydraulic fracturing (don’t know, 32%) and
from other sources (29%) – ranks next for the highest percentages of those who say they are
unsure whether these energy sources are harmful.
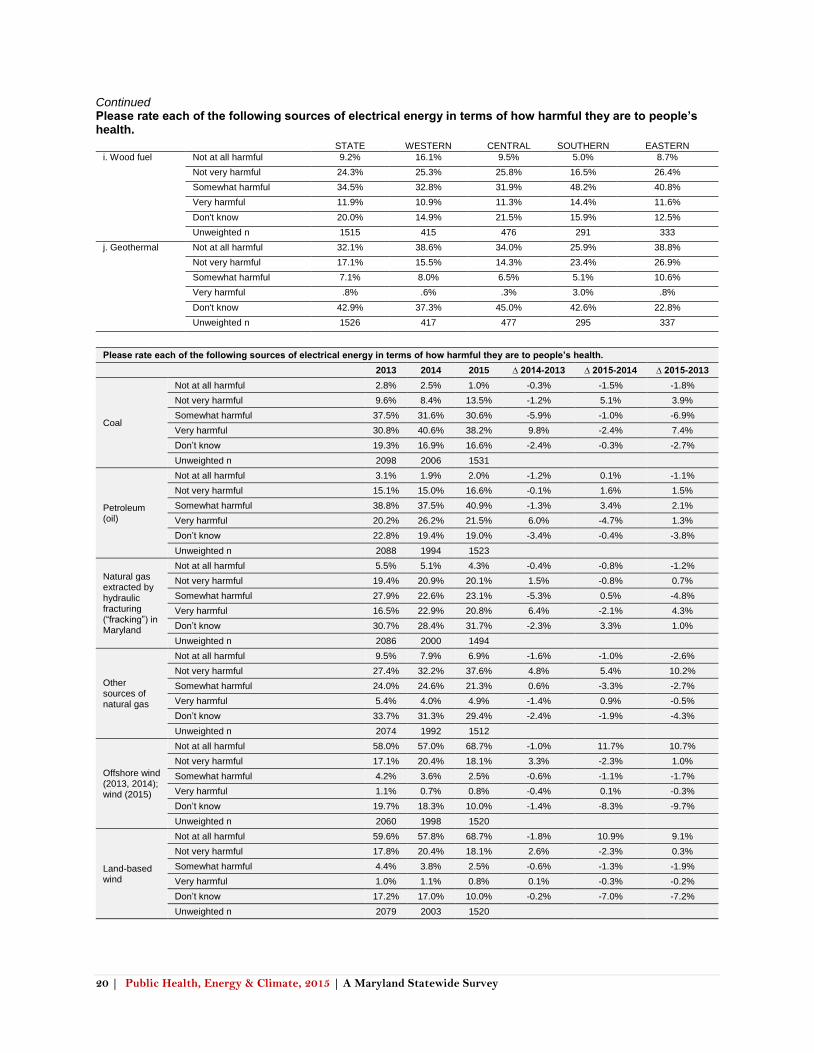
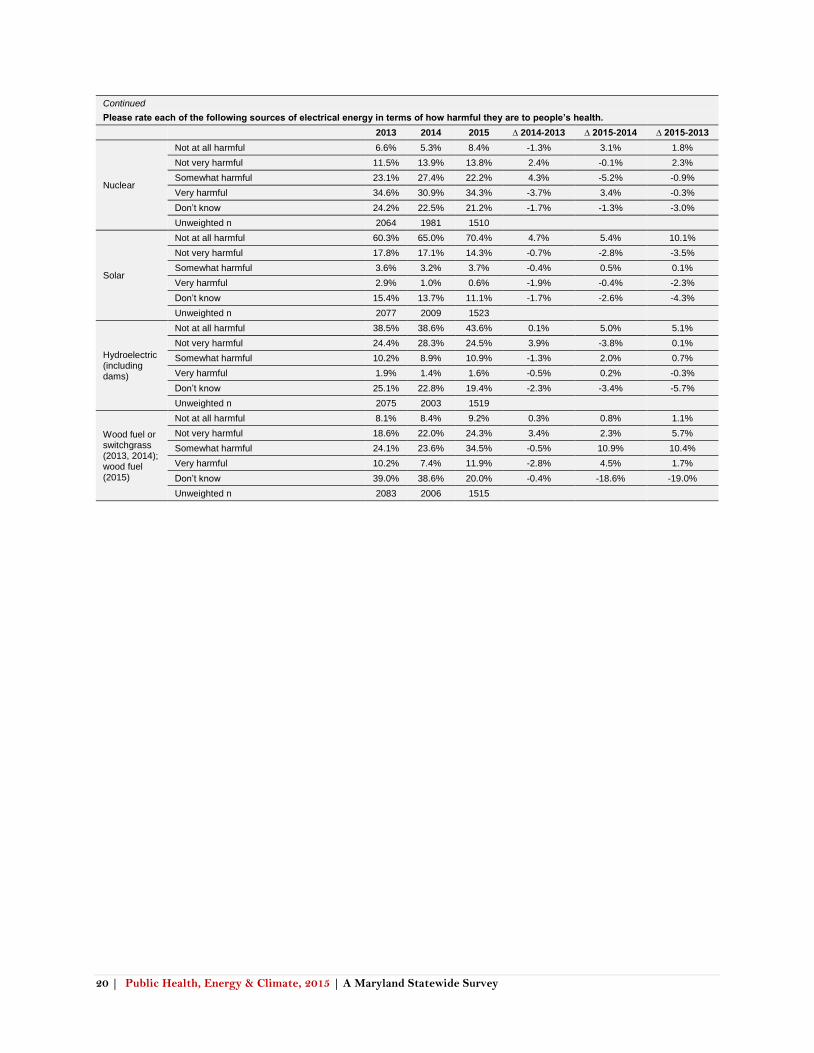
Wood fuel is perceived as harmful to health
Between 2014 and 2015 we changed one of the measures from “wood fuel or switchgrass” to
just “wood fuel.” This year we also saw a corresponding jump by 15 percentage points in those
who say wood fuel is harmful – now at 46% between “fracked” sources of natural gas and
nuclear power (Figure 7). One-fifth of Marylanders (20%) say they do not know whether wood
fuel is harmful, approximately the same percentage as nuclear power (21%).
9 | Public Health, Energy & Climate, 2015 | A Maryland Statewide Survey
Figure 6 | Renewable energy sources are perceived as least harmful to health
Figure 7 | Natural gas is thought less harmful than other fossil fuels, but more than renewables
10 | Public Health, Energy & Climate, 2015 | A Maryland Statewide Survey
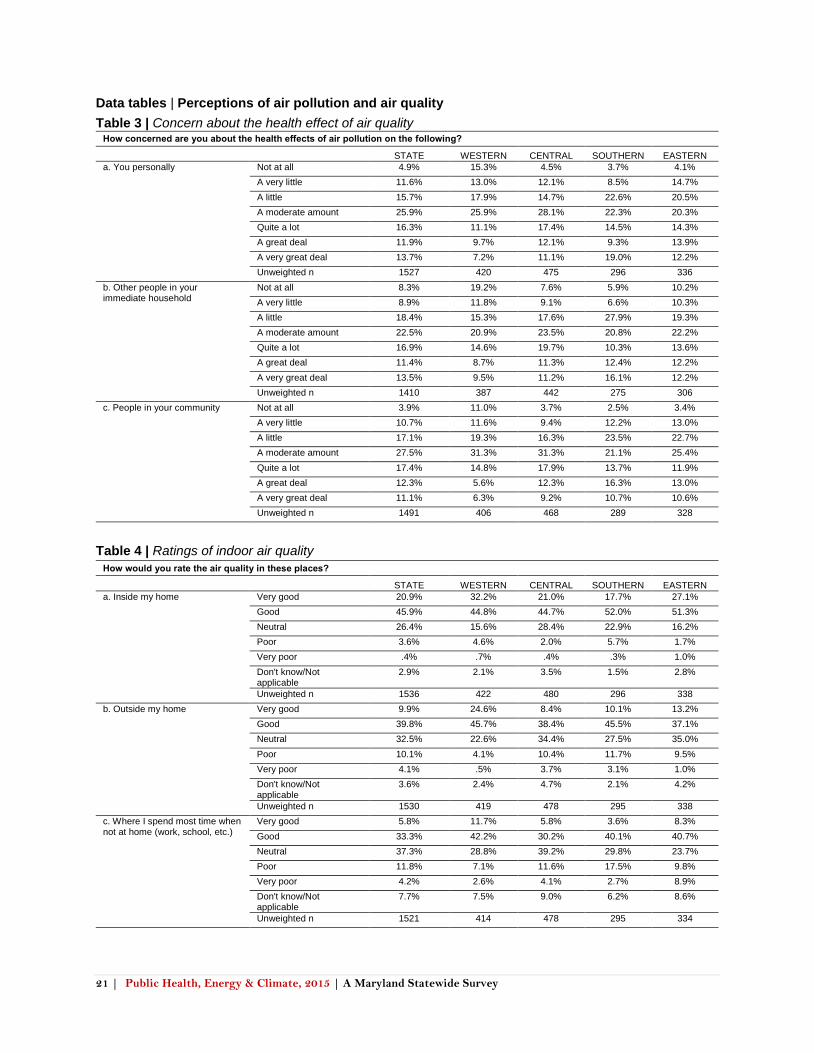
3. Majorities say they are concerned about the effects of air
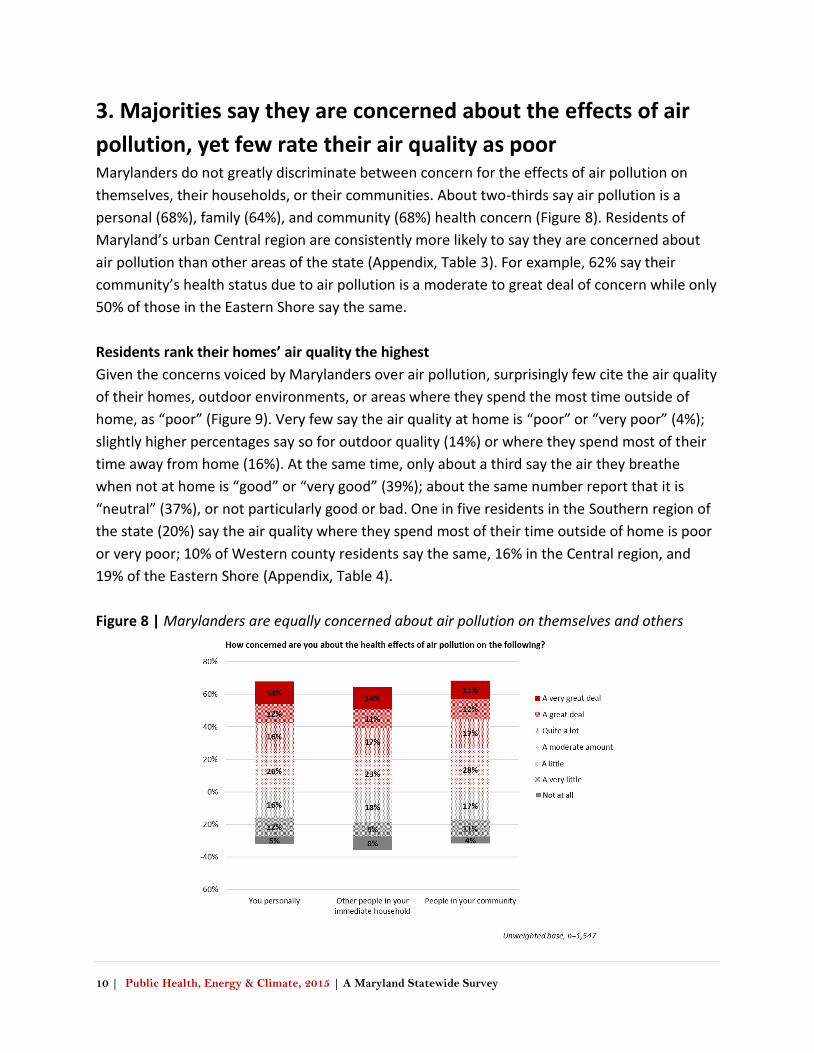
pollution, yet few rate their air quality as poor Marylanders do not greatly discriminate between concern for the effects of air pollution on
themselves, their households, or their communities. About two-thirds say air pollution is a
personal (68%), family (64%), and community (68%) health concern (Figure 8). Residents of
Maryland’s urban Central region are consistently more likely to say they are concerned about
air pollution than other areas of the state (Appendix, Table 3). For example, 62% say their
community’s health status due to air pollution is a moderate to great deal of concern while only
50% of those in the Eastern Shore say the same.
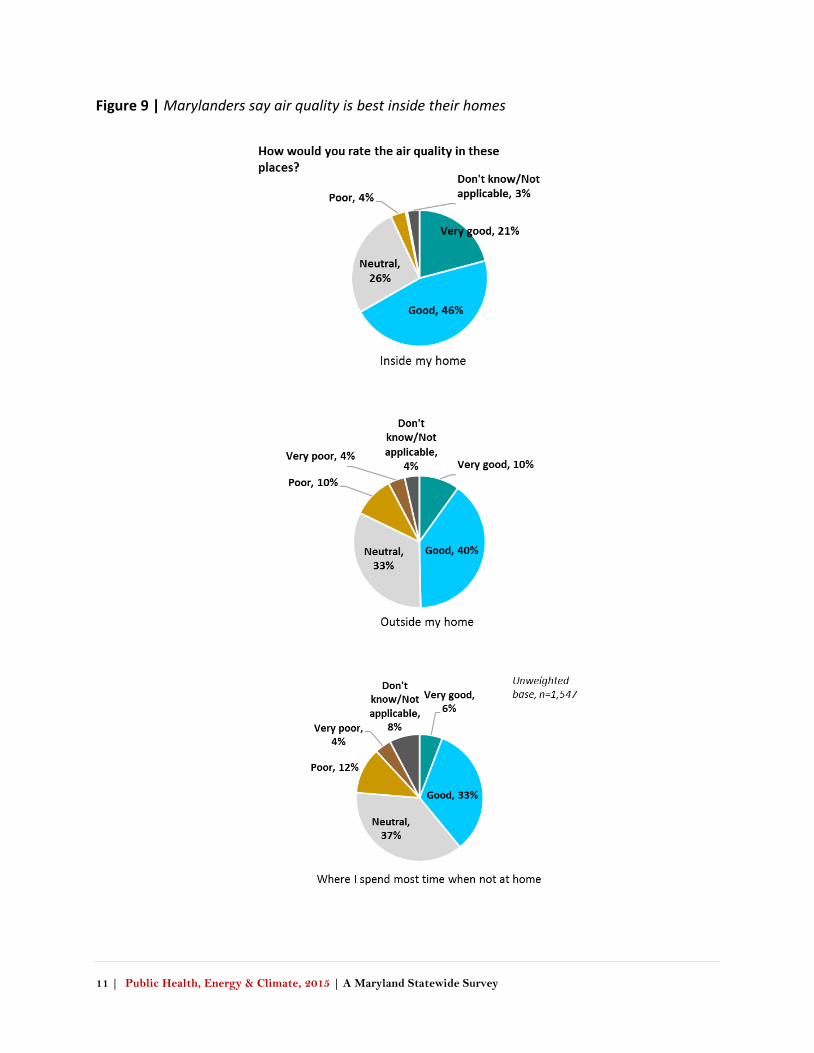
Residents rank their homes’ air quality the highest
Given the concerns voiced by Marylanders over air pollution, surprisingly few cite the air quality
of their homes, outdoor environments, or areas where they spend the most time outside of
home, as “poor” (Figure 9). Very few say the air quality at home is “poor” or “very poor” (4%);
slightly higher percentages say so for outdoor quality (14%) or where they spend most of their
time away from home (16%). At the same time, only about a third say the air they breathe
when not at home is “good” or “very good” (39%); about the same number report that it is
“neutral” (37%), or not particularly good or bad. One in five residents in the Southern region of
the state (20%) say the air quality where they spend most of their time outside of home is poor
or very poor; 10% of Western county residents say the same, 16% in the Central region, and
19% of the Eastern Shore (Appendix, Table 4).
Figure 8 | Marylanders are equally concerned about air pollution on themselves and others
11 | Public Health, Energy & Climate, 2015 | A Maryland Statewide Survey
Figure 9 | Marylanders say air quality is best inside their homes
12 | Public Health, Energy & Climate, 2015 | A Maryland Statewide Survey
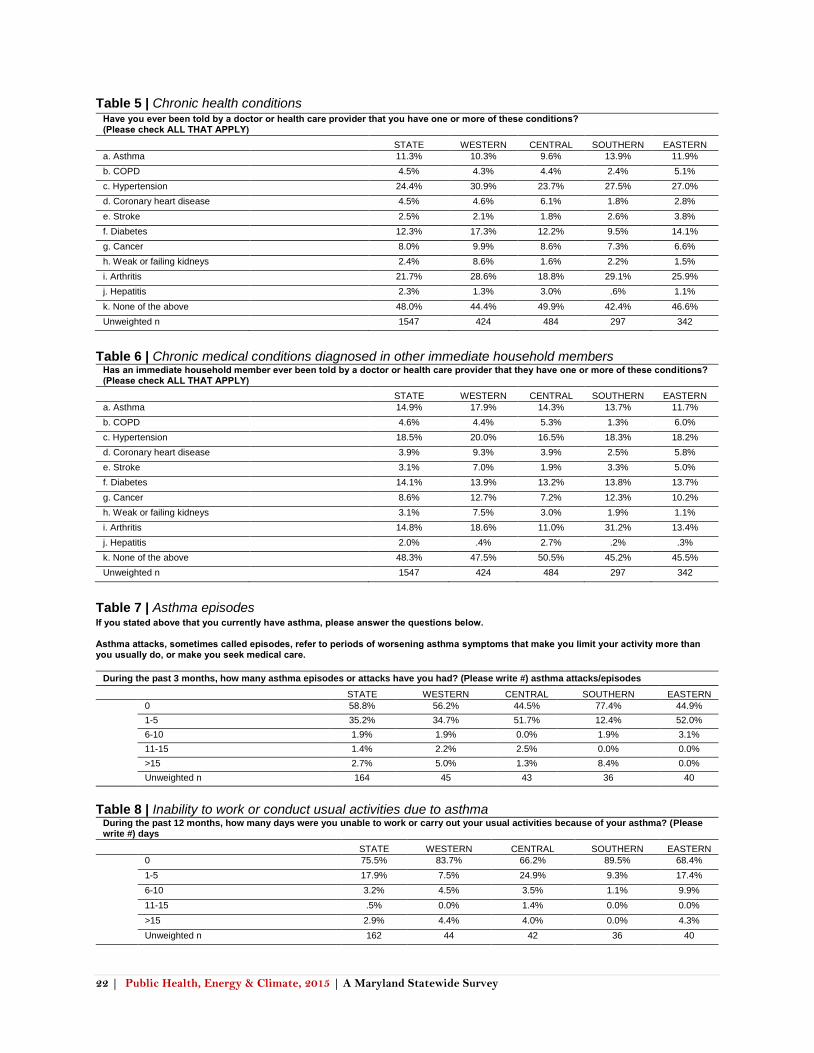
4. Many Marylanders experience chronic health conditions
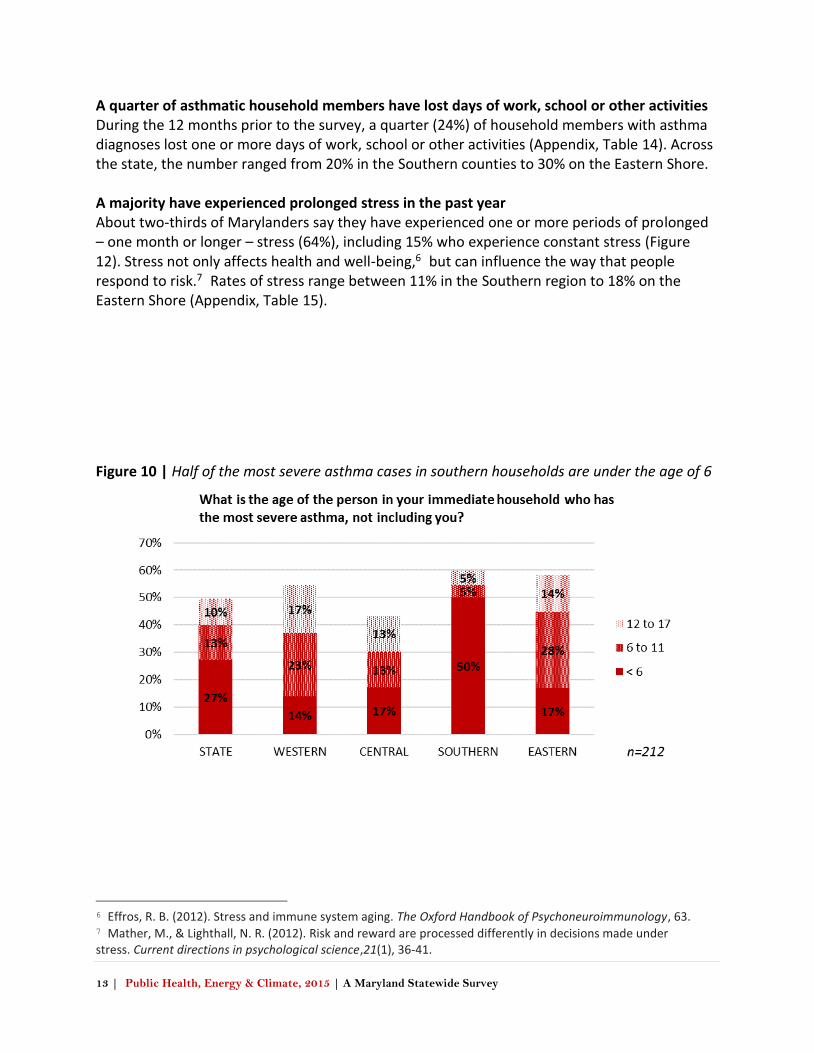
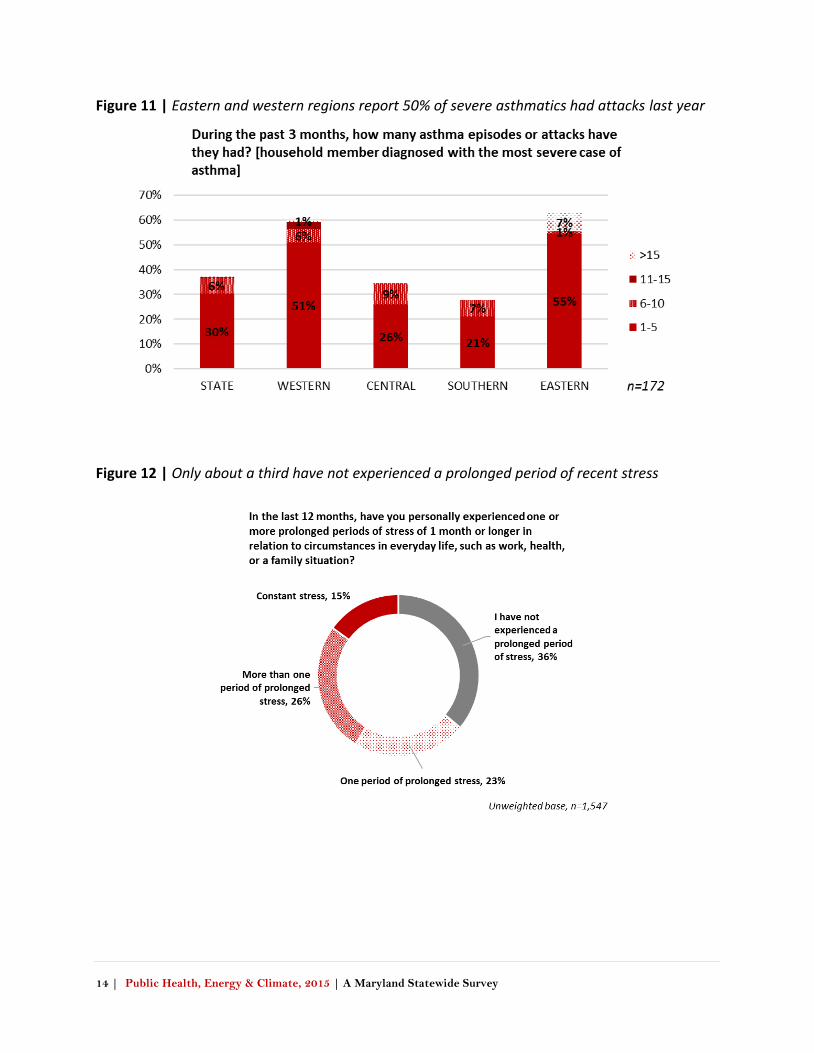
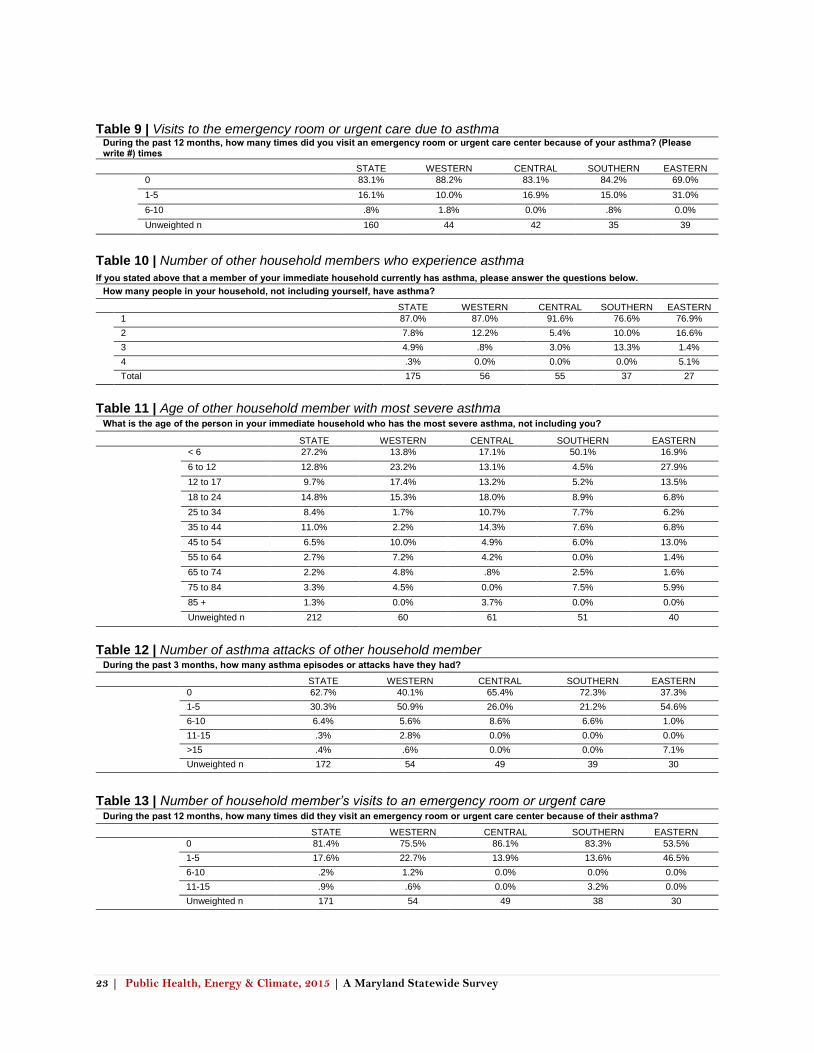
and prolonged stress Some of the most vulnerable people to environmental threats such as extreme heat, air pollution, and food- and water-borne diseases, are those whose health is already compromised.4 Maryland has the highest median income in the United States,5 but many of its residents face chronic health conditions such as asthma and experience prolonged stress. Hypertension (24%) and arthritis (22%) are the chronic conditions that residents most frequently report, followed by diabetes (12%), asthma (11%) and cancer (8%) (Appendix, Table 5). Other household members have similar frequencies of these conditions: hypertension (19%), asthma (15%), arthritis (15%), diabetes (14%), and cancer (9%) (Appendix, Table 6). These rates remain fairly consistent across all regions of the state. More than a third of Marylanders diagnosed with asthma suffered an attack in recent months Of the 11% who say they have been diagnosed with asthma, most had not experienced an attack or episode in the three months prior to the late-spring survey (59%) (Appendix, Table 7). However, 35% suffered 1 to 5 such episodes during that period, and another 6% endured 6 or more. Three-quarters (76%) of those diagnosed with asthma say that it has not affected their work or usual activities in the last 12 months, but 18% say they lost between 1 to 5 days due to the condition, and another 7% say they missed 6 or more days (Appendix, Table 8). Half of household members with asthma are children, including a quarter under age 6 Of the 15% who say that someone else in their immediate household has been diagnosed with asthma, half say the person with the most severe case is a child under the age of 18 (50%) (Figure 10). Statewide, more than a quarter told us that the child was younger than 6 years old (27%), with the remainder between age 6 to 11 (13%), and 12 to 17 (10%). The Southern region of the state alone reported 50% of household members with asthma diagnoses under the age of 6, compared to 14% in the four westernmost counties, 17% in the Central region, and 17% on the Eastern Shore. The vast majority of these household members diagnosed with asthma (81%) did not have an attack or episode in the three months prior to the survey; 18% experienced between 1 to 5 occurrences, and another 1% experienced more than 6 during that period (Appendix, Table 13). Almost two-thirds of respondents in the Eastern region (63%) and 60% in the Western region reported that their immediate household member with the most severe cases of asthma experienced at least one attack or episode in the past three months, approximately double the rate of households in the Central (35%) or Southern (28%) regions of the state (Figure 11).
4 Balbus, J. M.; Malina, C. Identifying vulnerable subpopulations for climate change health effects in the United States. J. Occup. Environ. Med. 2009, 51, 33–37. 5 Prairie, C. (2015, Sept. 30). State roundup. Maryland Reporter. Available at http://marylandreporter.com/2015/09/30/state-roundup-september-30-2015/
13 | Public Health, Energy & Climate, 2015 | A Maryland Statewide Survey
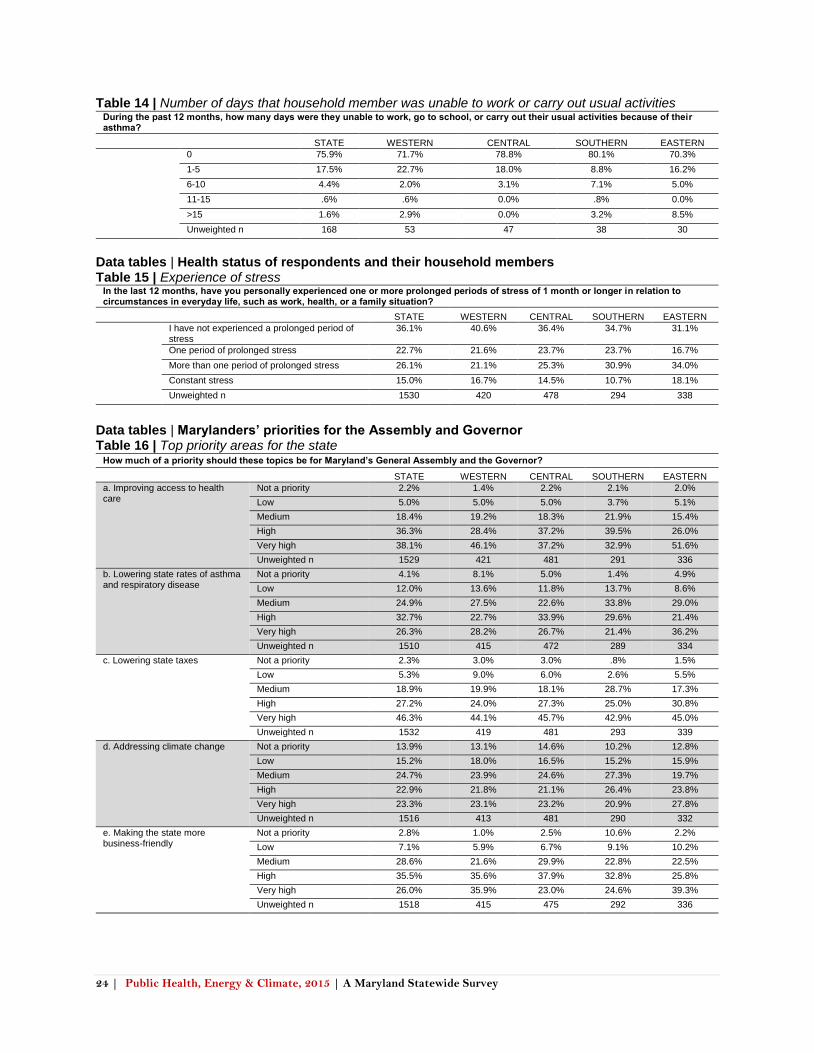
A quarter of asthmatic household members have lost days of work, school or other activities During the 12 months prior to the survey, a quarter (24%) of household members with asthma diagnoses lost one or more days of work, school or other activities (Appendix, Table 14). Across the state, the number ranged from 20% in the Southern counties to 30% on the Eastern Shore. A majority have experienced prolonged stress in the past year About two-thirds of Marylanders say they have experienced one or more periods of prolonged – one month or longer – stress (64%), including 15% who experience constant stress (Figure 12). Stress not only affects health and well-being,6 but can influence the way that people respond to risk.7 Rates of stress range between 11% in the Southern region to 18% on the Eastern Shore (Appendix, Table 15).
Figure 10 | Half of the most severe asthma cases in southern households are under the age of 6
6 Effros, R. B. (2012). Stress and immune system aging. The Oxford Handbook of Psychoneuroimmunology, 63. 7 Mather, M., & Lighthall, N. R. (2012). Risk and reward are processed differently in decisions made under stress. Current directions in psychological science,21(1), 36-41.
14 | Public Health, Energy & Climate, 2015 | A Maryland Statewide Survey
Figure 11 | Eastern and western regions report 50% of severe asthmatics had attacks last year
Figure 12 | Only about a third have not experienced a prolonged period of recent stress
15 | Public Health, Energy & Climate, 2015 | A Maryland Statewide Survey
5. Majorities say reducing air pollution and decreasing rates of
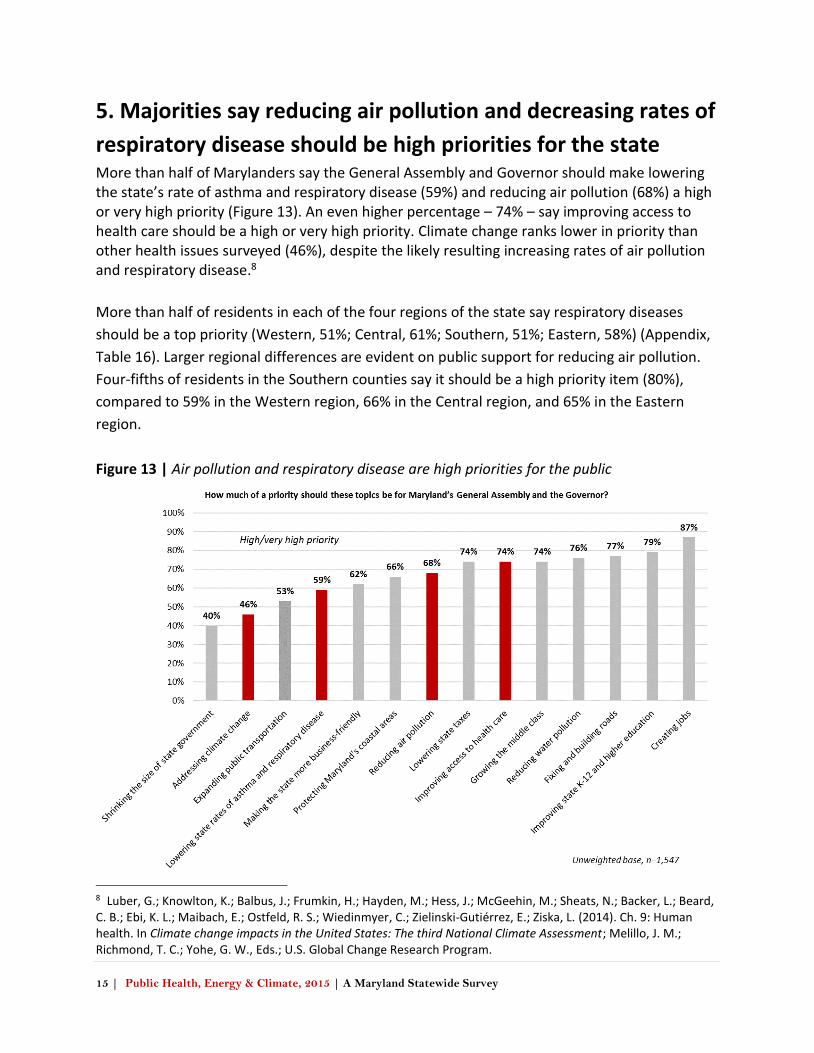
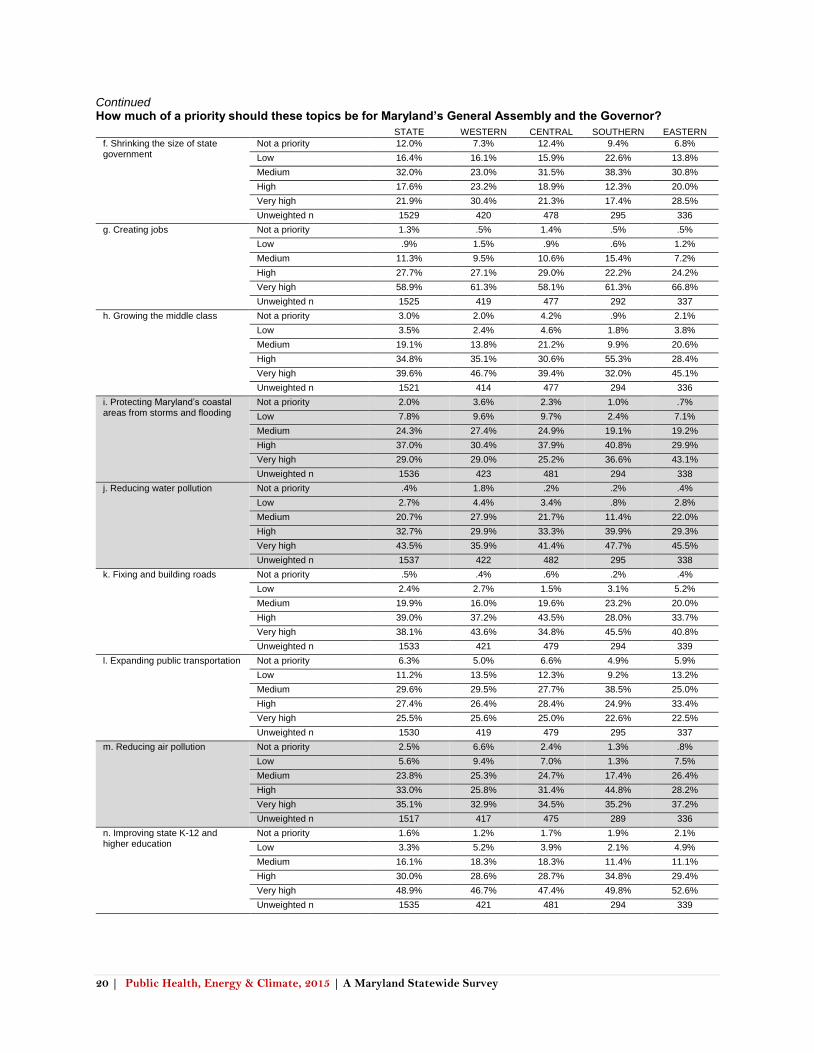
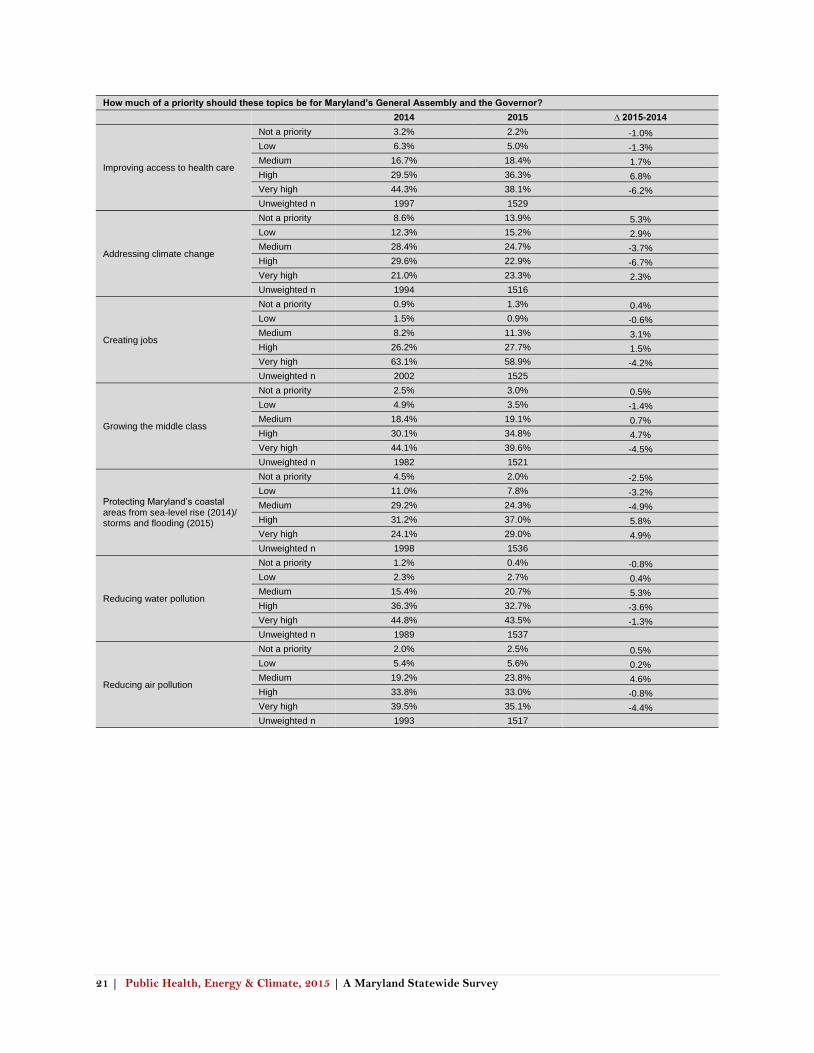
respiratory disease should be high priorities for the state More than half of Marylanders say the General Assembly and Governor should make lowering the state’s rate of asthma and respiratory disease (59%) and reducing air pollution (68%) a high or very high priority (Figure 13). An even higher percentage – 74% – say improving access to health care should be a high or very high priority. Climate change ranks lower in priority than other health issues surveyed (46%), despite the likely resulting increasing rates of air pollution and respiratory disease.8
More than half of residents in each of the four regions of the state say respiratory diseases
should be a top priority (Western, 51%; Central, 61%; Southern, 51%; Eastern, 58%) (Appendix,
Table 16). Larger regional differences are evident on public support for reducing air pollution.
Four-fifths of residents in the Southern counties say it should be a high priority item (80%),
compared to 59% in the Western region, 66% in the Central region, and 65% in the Eastern
region.
Figure 13 | Air pollution and respiratory disease are high priorities for the public
8 Luber, G.; Knowlton, K.; Balbus, J.; Frumkin, H.; Hayden, M.; Hess, J.; McGeehin, M.; Sheats, N.; Backer, L.; Beard, C. B.; Ebi, K. L.; Maibach, E.; Ostfeld, R. S.; Wiedinmyer, C.; Zielinski-Gutiérrez, E.; Ziska, L. (2014). Ch. 9: Human health. In Climate change impacts in the United States: The third National Climate Assessment; Melillo, J. M.; Richmond, T. C.; Yohe, G. W., Eds.; U.S. Global Change Research Program.
16 | Public Health, Energy & Climate, 2015 | A Maryland Statewide Survey
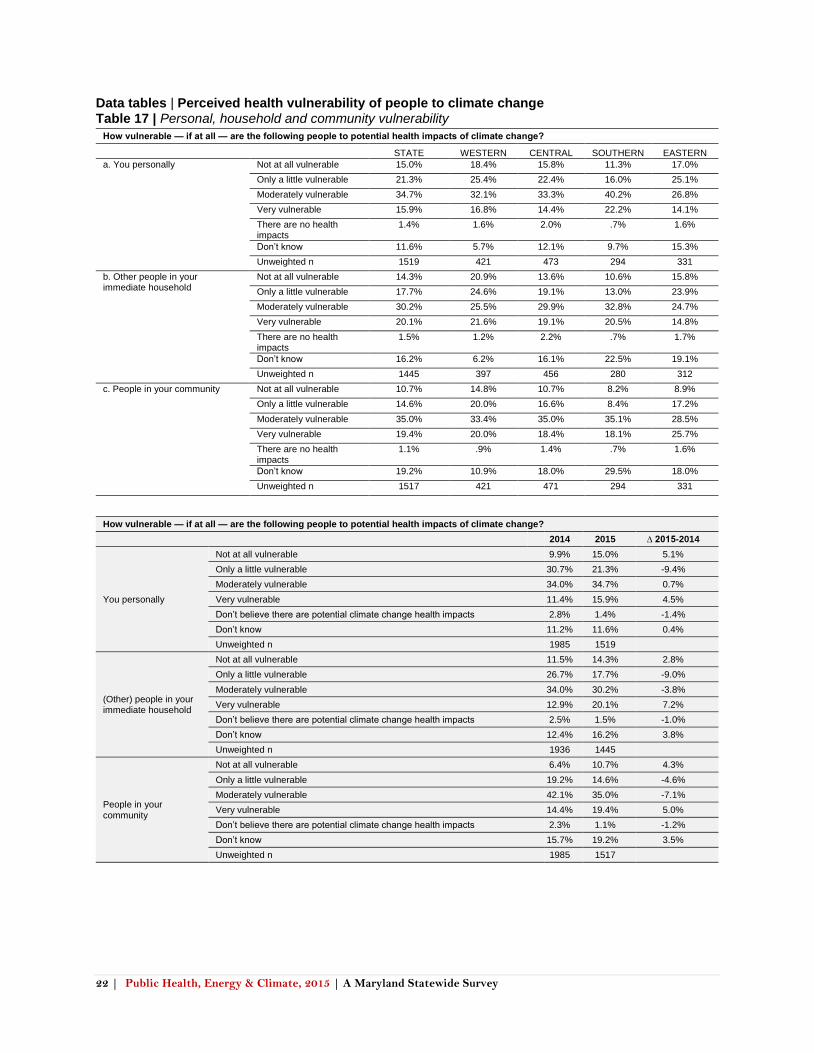
6. People believe that their health – and that of their
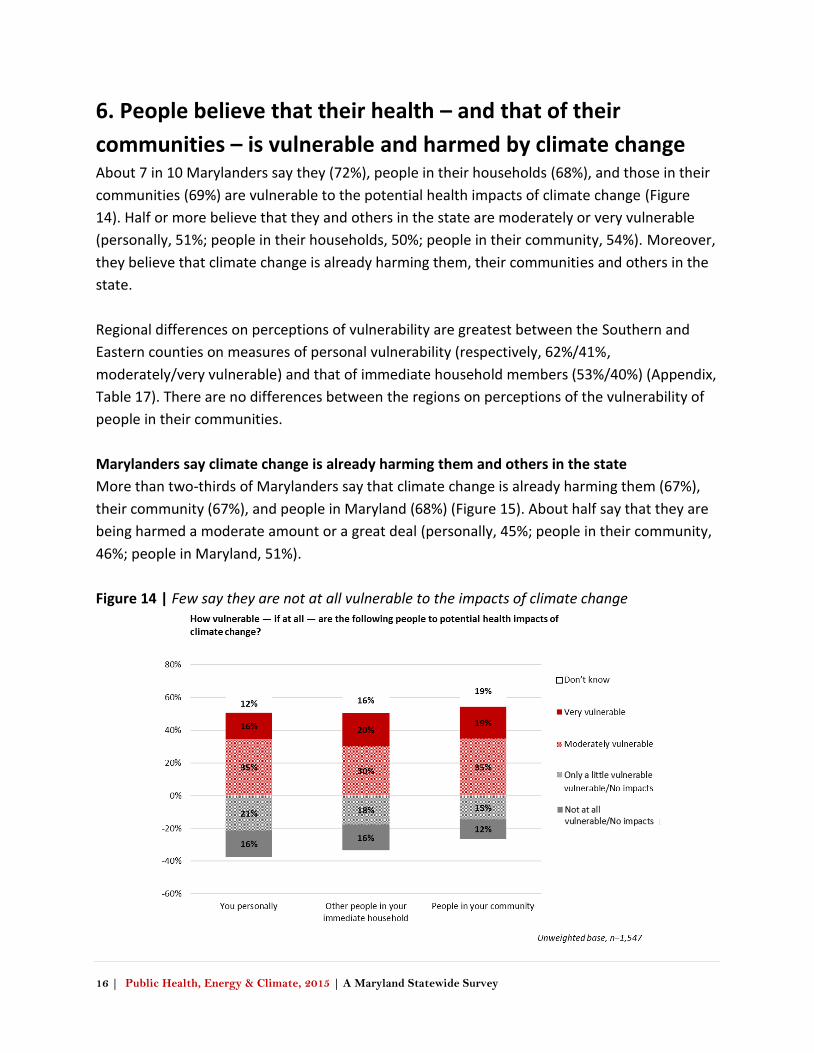
communities – is vulnerable and harmed by climate change About 7 in 10 Marylanders say they (72%), people in their households (68%), and those in their
communities (69%) are vulnerable to the potential health impacts of climate change (Figure
14). Half or more believe that they and others in the state are moderately or very vulnerable
(personally, 51%; people in their households, 50%; people in their community, 54%). Moreover,
they believe that climate change is already harming them, their communities and others in the
state.
Regional differences on perceptions of vulnerability are greatest between the Southern and
Eastern counties on measures of personal vulnerability (respectively, 62%/41%,
moderately/very vulnerable) and that of immediate household members (53%/40%) (Appendix,
Table 17). There are no differences between the regions on perceptions of the vulnerability of
people in their communities.
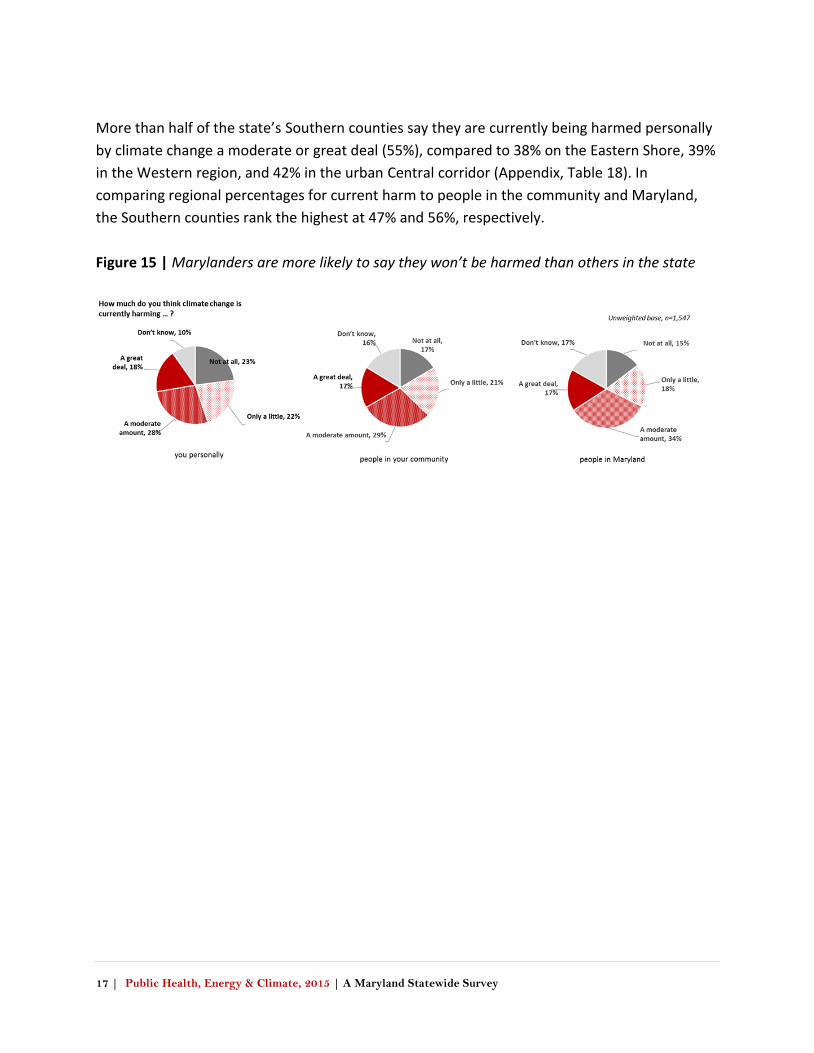
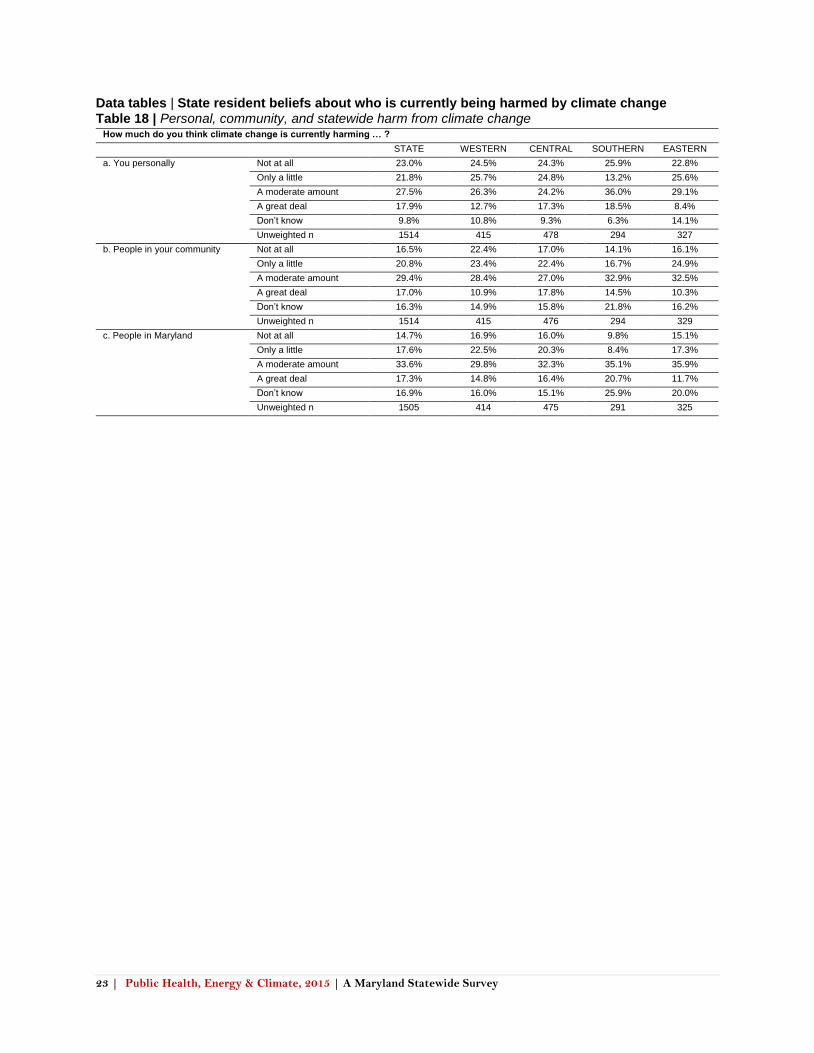
Marylanders say climate change is already harming them and others in the state
More than two-thirds of Marylanders say that climate change is already harming them (67%),
their community (67%), and people in Maryland (68%) (Figure 15). About half say that they are
being harmed a moderate amount or a great deal (personally, 45%; people in their community,
46%; people in Maryland, 51%).
Figure 14 | Few say they are not at all vulnerable to the impacts of climate change
17 | Public Health, Energy & Climate, 2015 | A Maryland Statewide Survey
More than half of the state’s Southern counties say they are currently being harmed personally
by climate change a moderate or great deal (55%), compared to 38% on the Eastern Shore, 39%
in the Western region, and 42% in the urban Central corridor (Appendix, Table 18). In
comparing regional percentages for current harm to people in the community and Maryland,
the Southern counties rank the highest at 47% and 56%, respectively.
Figure 15 | Marylanders are more likely to say they won’t be harmed than others in the state
18 | Public Health, Energy & Climate, 2015 | A Maryland Statewide Survey
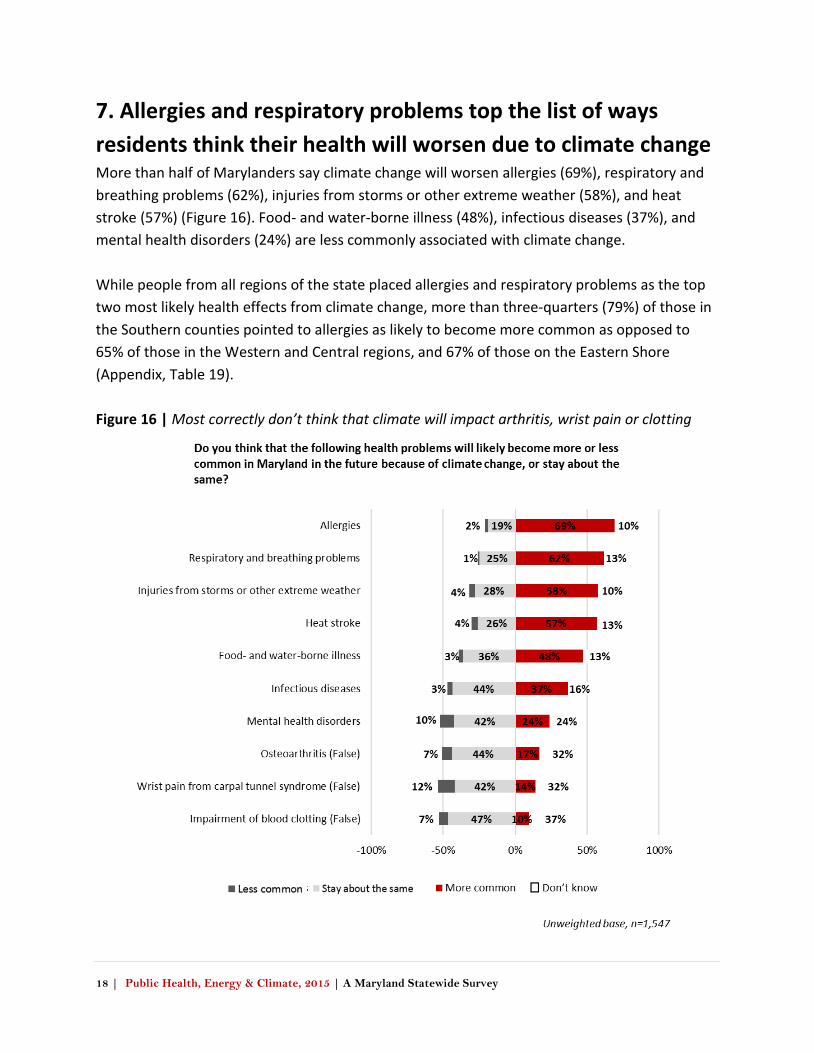
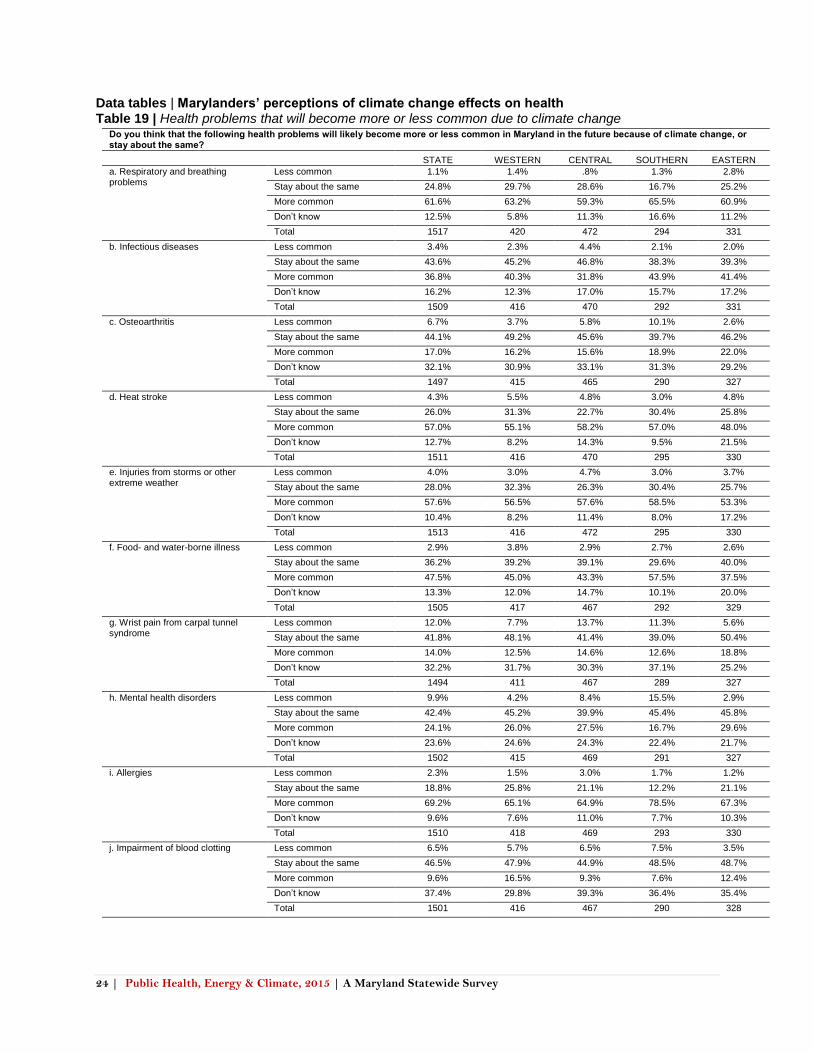
7. Allergies and respiratory problems top the list of ways
residents think their health will worsen due to climate change More than half of Marylanders say climate change will worsen allergies (69%), respiratory and
breathing problems (62%), injuries from storms or other extreme weather (58%), and heat
stroke (57%) (Figure 16). Food- and water-borne illness (48%), infectious diseases (37%), and
mental health disorders (24%) are less commonly associated with climate change.
While people from all regions of the state placed allergies and respiratory problems as the top
two most likely health effects from climate change, more than three-quarters (79%) of those in
the Southern counties pointed to allergies as likely to become more common as opposed to
65% of those in the Western and Central regions, and 67% of those on the Eastern Shore
(Appendix, Table 19).
Figure 16 | Most correctly don’t think that climate will impact arthritis, wrist pain or clotting
19 | Public Health, Energy & Climate, 2015 | A Maryland Statewide Survey
8. Study methodology This study was conducted by George Mason University’s Center for Climate Change
Communication in partnership with the Johns Hopkins Bloomberg School of Public Health to
explore Marylanders’ views on public health, energy and the environment. The survey
instrument was developed at George Mason University, partially based on questions used in
the Climate Change in the American Mind national surveys run by the Yale Project on Climate
Change Communication (http://environment.yale.edu/ climate-communication/) and George
Mason’s Center for Climate Change Communication (http://climatechange
communication.org/). The mail survey consisted of 48 questions, and took approximately 20
minutes to complete.
For reporting purposes, the data have been broken into three separate documents on
Marylanders’ attitudes, behaviors and policy preferences regarding public health and climate
change, energy, and climate change generally.
The unweighted sample margin of error is +/- 2.5 percentage points at the 95% confidence
interval for the state and less than +/- 5.7 percentage points for each region. (See Table 1)
Sampling design; fielding
The survey was mailed to 6,401 households in the state of Maryland, randomly selected from
within each of four regions of the state from Survey Sampling International household address
databases, based primarily on U.S. Postal Service delivery route information. We sampled at the
regional level to ensure the final data were generalizable to these distinctly different
geographic and cultural areas of the state, as well as the state as a whole. The sample size for
the Central region of the state was higher relative to the other three regions because it
accounts for more than half of the state’s population. Households that responded to the survey
in 2013 and 2014 were not re-contacted in 2015.
The survey was fielded from April 11 to June 24, 2015. Each household was sent up to four
mailings: an announcement letter introducing the survey (April 11), a copy of the survey with a
$2 bill as a thank you (April 20), a reminder postcard (May 4), and a follow-up survey (May 18).
(As a point of comparison, the previous surveys were fielded from March 28 to June 4, 2013,
and March 17 to June 10, 2014, 2014. Methodology for the 2013 and 2014 surveys is available
within those reports at climatemaryland.org.) In order to achieve randomization of respondents
within each household, we requested that the person with the most recent birthday complete
the survey. Households that completed and returned the survey were taken off of subsequent
mailing lists.
20 | Public Health, Energy & Climate, 2015 | A Maryland Statewide Survey
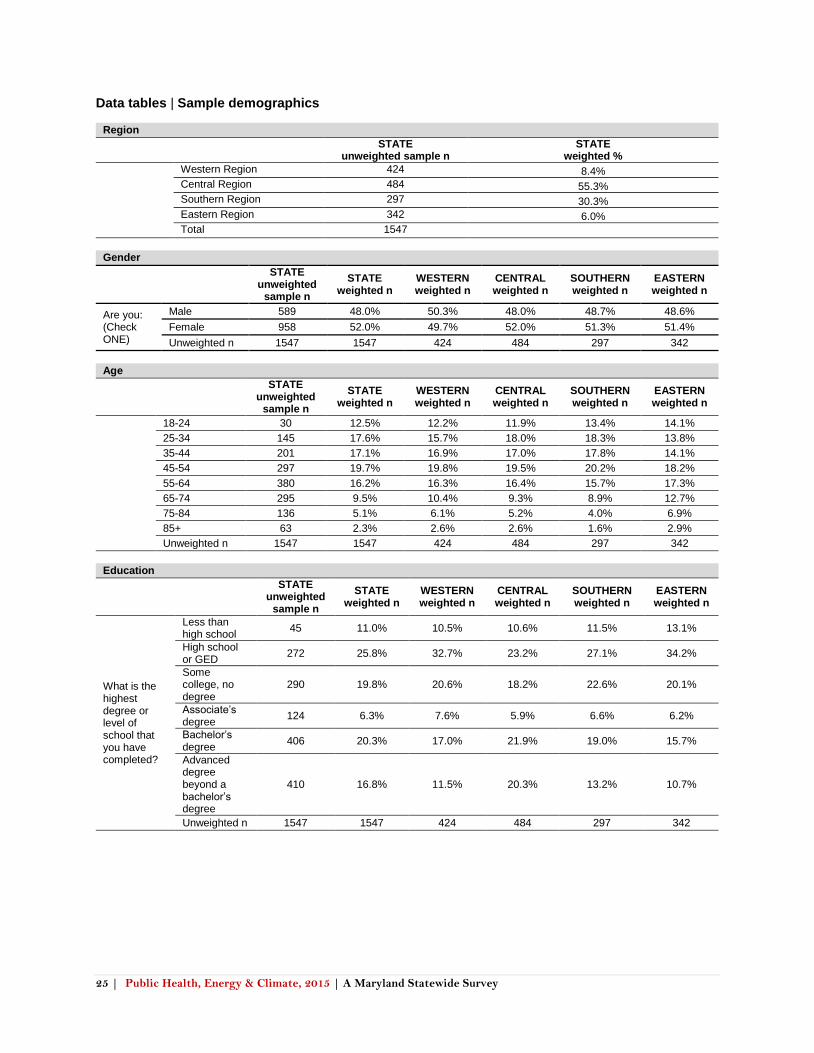
Weighting
The data tables report percentages for the state and each region. State data were weighted for
regional representation, gender, age, and education level based on 3-year American
Community Survey data from the U.S. Census Bureau. Each region’s data were also weighted
for the same demographic variables. Base unweighted sample sizes for each question are
reported in addition to the weighted percentages. Respondents who did not provide regional,
gender, age or education level data were dropped from the data set. This lowered the number
of respondents by 64 cases. (The overall response rate for the study before those cases were
dropped was 28%.) Please see the demographics section of the appendix for more information
on the characteristics of the survey sample pre- and post-weighting.
Institutional Review Board
The study was reviewed by Institutional Review Boards for both George Mason University
(Protocol #8508) and Johns Hopkins Bloomberg School of Public Health (Protocol #00006315).
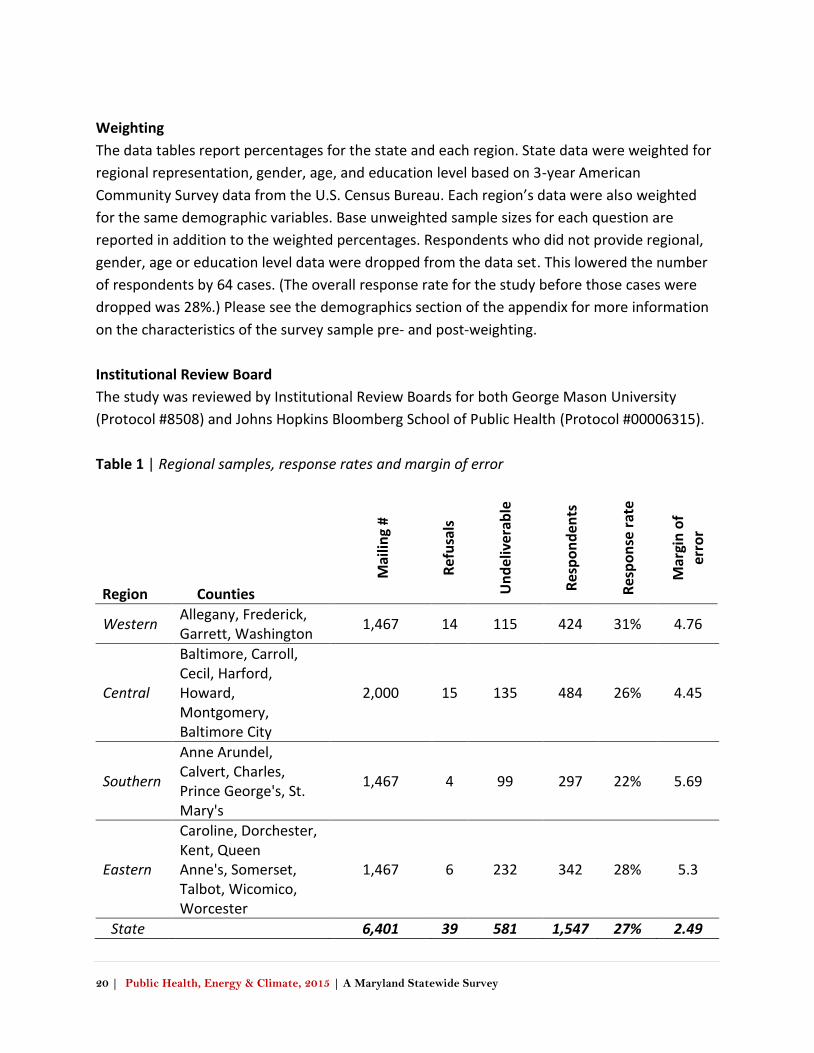
Table 1 | Regional samples, response rates and margin of error
Region Counties
Mai
ling
#
Ref
usa
ls
Un
del
iver
able
Res
po
nd
ents
Res
po
nse
rat
e
Mar
gin
of
erro
r
Western Allegany, Frederick, Garrett, Washington
1,467 14 115 424 31% 4.76
Central
Baltimore, Carroll, Cecil, Harford, Howard, Montgomery, Baltimore City
2,000 15 135 484 26% 4.45
Southern
Anne Arundel, Calvert, Charles, Prince George's, St. Mary's
1,467 4 99 297 22% 5.69
Eastern
Caroline, Dorchester, Kent, Queen Anne's, Somerset, Talbot, Wicomico, Worcester
1,467 6 232 342 28% 5.3
State 6,401 39 581 1,547 27% 2.49
21 | Public Health, Energy & Climate, 2015 | A Maryland Statewide Survey
Appendices – Data tables – Sample demographics
22 | Public Health, Energy & Climate, 2015 | A Maryland Statewide Survey
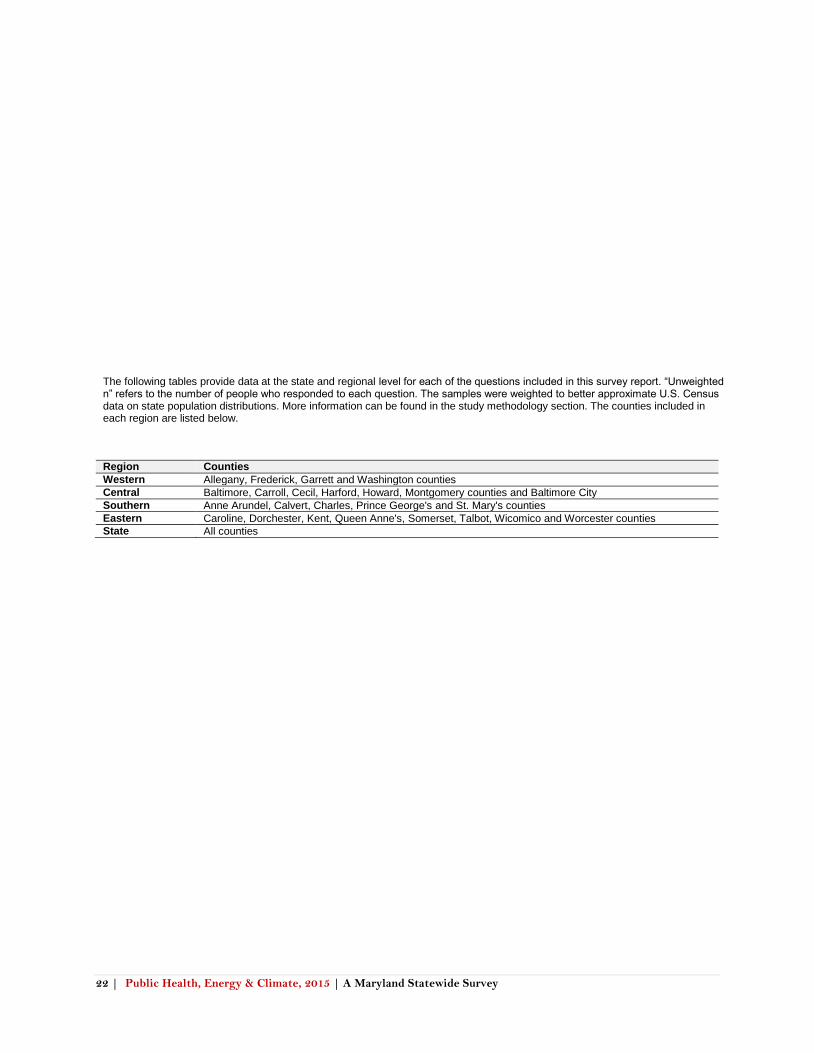
The following tables provide data at the state and regional level for each of the questions included in this survey report. “Unweighted n” refers to the number of people who responded to each question. The samples were weighted to better approximate U.S. Census data on state population distributions. More information can be found in the study methodology section. The counties included in each region are listed below.
Region Counties
Western Allegany, Frederick, Garrett and Washington counties
Central Baltimore, Carroll, Cecil, Harford, Howard, Montgomery counties and Baltimore City
Southern Anne Arundel, Calvert, Charles, Prince George's and St. Mary's counties
Eastern Caroline, Dorchester, Kent, Queen Anne's, Somerset, Talbot, Wicomico and Worcester counties
State All counties
23 | Public Health, Energy & Climate, 2015 | A Maryland Statewide Survey
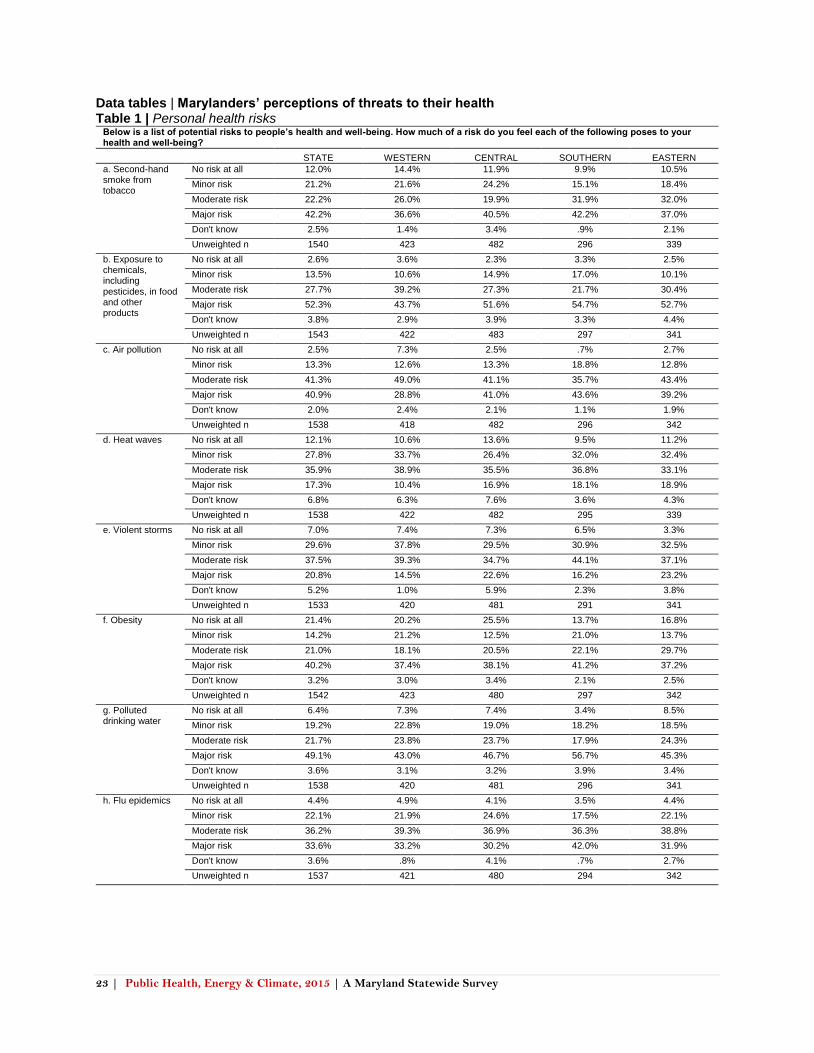
Data tables | Marylanders’ perceptions of threats to their health Table 1 | Personal health risks
Below is a list of potential risks to people’s health and well-being. How much of a risk do you feel each of the following poses to your health and well-being?
STATE WESTERN CENTRAL SOUTHERN EASTERN
a. Second-hand smoke from tobacco
No risk at all 12.0% 14.4% 11.9% 9.9% 10.5%
Minor risk 21.2% 21.6% 24.2% 15.1% 18.4%
Moderate risk 22.2% 26.0% 19.9% 31.9% 32.0%
Major risk 42.2% 36.6% 40.5% 42.2% 37.0%
Don't know 2.5% 1.4% 3.4% .9% 2.1%
Unweighted n 1540 423 482 296 339
b. Exposure to chemicals, including pesticides, in food and other products
No risk at all 2.6% 3.6% 2.3% 3.3% 2.5%
Minor risk 13.5% 10.6% 14.9% 17.0% 10.1%
Moderate risk 27.7% 39.2% 27.3% 21.7% 30.4%
Major risk 52.3% 43.7% 51.6% 54.7% 52.7%
Don't know 3.8% 2.9% 3.9% 3.3% 4.4%
Unweighted n 1543 422 483 297 341
c. Air pollution No risk at all 2.5% 7.3% 2.5% .7% 2.7%
Minor risk 13.3% 12.6% 13.3% 18.8% 12.8%
Moderate risk 41.3% 49.0% 41.1% 35.7% 43.4%
Major risk 40.9% 28.8% 41.0% 43.6% 39.2%
Don't know 2.0% 2.4% 2.1% 1.1% 1.9%
Unweighted n 1538 418 482 296 342
d. Heat waves No risk at all 12.1% 10.6% 13.6% 9.5% 11.2%
Minor risk 27.8% 33.7% 26.4% 32.0% 32.4%
Moderate risk 35.9% 38.9% 35.5% 36.8% 33.1%
Major risk 17.3% 10.4% 16.9% 18.1% 18.9%
Don't know 6.8% 6.3% 7.6% 3.6% 4.3%
Unweighted n 1538 422 482 295 339
e. Violent storms No risk at all 7.0% 7.4% 7.3% 6.5% 3.3%
Minor risk 29.6% 37.8% 29.5% 30.9% 32.5%
Moderate risk 37.5% 39.3% 34.7% 44.1% 37.1%
Major risk 20.8% 14.5% 22.6% 16.2% 23.2%
Don't know 5.2% 1.0% 5.9% 2.3% 3.8%
Unweighted n 1533 420 481 291 341
f. Obesity No risk at all 21.4% 20.2% 25.5% 13.7% 16.8%
Minor risk 14.2% 21.2% 12.5% 21.0% 13.7%
Moderate risk 21.0% 18.1% 20.5% 22.1% 29.7%
Major risk 40.2% 37.4% 38.1% 41.2% 37.2%
Don't know 3.2% 3.0% 3.4% 2.1% 2.5%
Unweighted n 1542 423 480 297 342
g. Polluted drinking water
No risk at all 6.4% 7.3% 7.4% 3.4% 8.5%
Minor risk 19.2% 22.8% 19.0% 18.2% 18.5%
Moderate risk 21.7% 23.8% 23.7% 17.9% 24.3%
Major risk 49.1% 43.0% 46.7% 56.7% 45.3%
Don't know 3.6% 3.1% 3.2% 3.9% 3.4%
Unweighted n 1538 420 481 296 341
h. Flu epidemics No risk at all 4.4% 4.9% 4.1% 3.5% 4.4%
Minor risk 22.1% 21.9% 24.6% 17.5% 22.1%
Moderate risk 36.2% 39.3% 36.9% 36.3% 38.8%
Major risk 33.6% 33.2% 30.2% 42.0% 31.9%
Don't know 3.6% .8% 4.1% .7% 2.7%
Unweighted n 1537 421 480 294 342
20 | Public Health, Energy & Climate, 2015 | A Maryland Statewide Survey
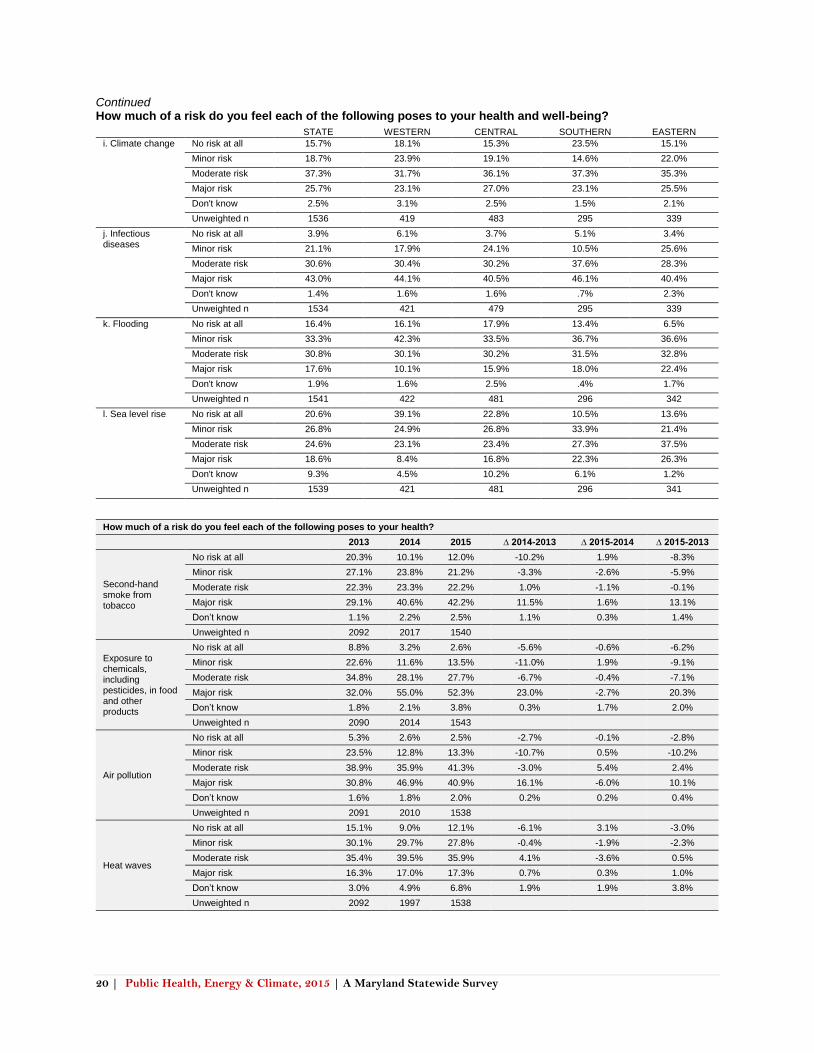
Continued How much of a risk do you feel each of the following poses to your health and well-being?
STATE WESTERN CENTRAL SOUTHERN EASTERN
i. Climate change No risk at all 15.7% 18.1% 15.3% 23.5% 15.1%
Minor risk 18.7% 23.9% 19.1% 14.6% 22.0%
Moderate risk 37.3% 31.7% 36.1% 37.3% 35.3%
Major risk 25.7% 23.1% 27.0% 23.1% 25.5%
Don't know 2.5% 3.1% 2.5% 1.5% 2.1%
Unweighted n 1536 419 483 295 339
j. Infectious diseases
No risk at all 3.9% 6.1% 3.7% 5.1% 3.4%
Minor risk 21.1% 17.9% 24.1% 10.5% 25.6%
Moderate risk 30.6% 30.4% 30.2% 37.6% 28.3%
Major risk 43.0% 44.1% 40.5% 46.1% 40.4%
Don't know 1.4% 1.6% 1.6% .7% 2.3%
Unweighted n 1534 421 479 295 339
k. Flooding No risk at all 16.4% 16.1% 17.9% 13.4% 6.5%
Minor risk 33.3% 42.3% 33.5% 36.7% 36.6%
Moderate risk 30.8% 30.1% 30.2% 31.5% 32.8%
Major risk 17.6% 10.1% 15.9% 18.0% 22.4%
Don't know 1.9% 1.6% 2.5% .4% 1.7%
Unweighted n 1541 422 481 296 342
l. Sea level rise No risk at all 20.6% 39.1% 22.8% 10.5% 13.6%
Minor risk 26.8% 24.9% 26.8% 33.9% 21.4%
Moderate risk 24.6% 23.1% 23.4% 27.3% 37.5%
Major risk 18.6% 8.4% 16.8% 22.3% 26.3%
Don't know 9.3% 4.5% 10.2% 6.1% 1.2%
Unweighted n 1539 421 481 296 341
How much of a risk do you feel each of the following poses to your health?
2013 2014 2015 ∆ 2014-2013 ∆ 2015-2014 ∆ 2015-2013
Second-hand smoke from tobacco
No risk at all 20.3% 10.1% 12.0% -10.2% 1.9% -8.3%
Minor risk 27.1% 23.8% 21.2% -3.3% -2.6% -5.9%
Moderate risk 22.3% 23.3% 22.2% 1.0% -1.1% -0.1%
Major risk 29.1% 40.6% 42.2% 11.5% 1.6% 13.1%
Don’t know 1.1% 2.2% 2.5% 1.1% 0.3% 1.4%
Unweighted n 2092 2017 1540
Exposure to chemicals, including pesticides, in food and other products
No risk at all 8.8% 3.2% 2.6% -5.6% -0.6% -6.2%
Minor risk 22.6% 11.6% 13.5% -11.0% 1.9% -9.1%
Moderate risk 34.8% 28.1% 27.7% -6.7% -0.4% -7.1%
Major risk 32.0% 55.0% 52.3% 23.0% -2.7% 20.3%
Don’t know 1.8% 2.1% 3.8% 0.3% 1.7% 2.0%
Unweighted n 2090 2014 1543
Air pollution
No risk at all 5.3% 2.6% 2.5% -2.7% -0.1% -2.8%
Minor risk 23.5% 12.8% 13.3% -10.7% 0.5% -10.2%
Moderate risk 38.9% 35.9% 41.3% -3.0% 5.4% 2.4%
Major risk 30.8% 46.9% 40.9% 16.1% -6.0% 10.1%
Don’t know 1.6% 1.8% 2.0% 0.2% 0.2% 0.4%
Unweighted n 2091 2010 1538
Heat waves
No risk at all 15.1% 9.0% 12.1% -6.1% 3.1% -3.0%
Minor risk 30.1% 29.7% 27.8% -0.4% -1.9% -2.3%
Moderate risk 35.4% 39.5% 35.9% 4.1% -3.6% 0.5%
Major risk 16.3% 17.0% 17.3% 0.7% 0.3% 1.0%
Don’t know 3.0% 4.9% 6.8% 1.9% 1.9% 3.8%
Unweighted n 2092 1997 1538
20 | Public Health, Energy & Climate, 2015 | A Maryland Statewide Survey
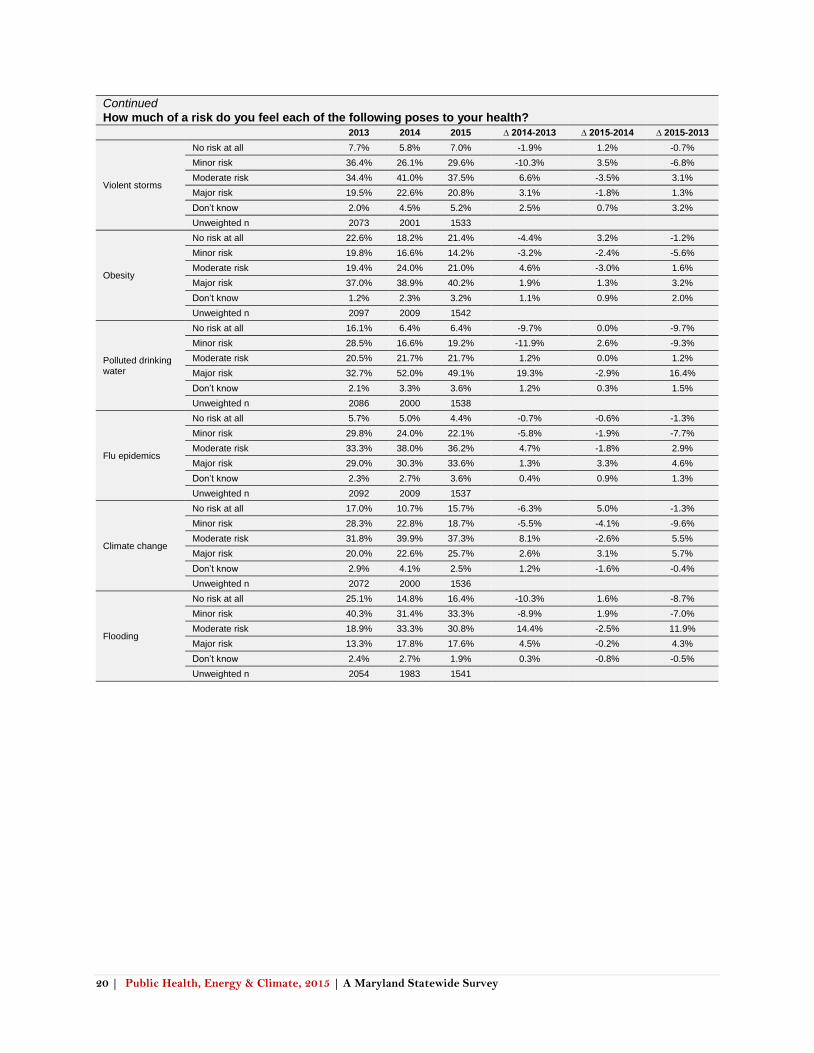
Continued
How much of a risk do you feel each of the following poses to your health?
2013 2014 2015 ∆ 2014-2013 ∆ 2015-2014 ∆ 2015-2013
Violent storms
No risk at all 7.7% 5.8% 7.0% -1.9% 1.2% -0.7%
Minor risk 36.4% 26.1% 29.6% -10.3% 3.5% -6.8%
Moderate risk 34.4% 41.0% 37.5% 6.6% -3.5% 3.1%
Major risk 19.5% 22.6% 20.8% 3.1% -1.8% 1.3%
Don’t know 2.0% 4.5% 5.2% 2.5% 0.7% 3.2%
Unweighted n 2073 2001 1533
Obesity
No risk at all 22.6% 18.2% 21.4% -4.4% 3.2% -1.2%
Minor risk 19.8% 16.6% 14.2% -3.2% -2.4% -5.6%
Moderate risk 19.4% 24.0% 21.0% 4.6% -3.0% 1.6%
Major risk 37.0% 38.9% 40.2% 1.9% 1.3% 3.2%
Don’t know 1.2% 2.3% 3.2% 1.1% 0.9% 2.0%
Unweighted n 2097 2009 1542
Polluted drinking water
No risk at all 16.1% 6.4% 6.4% -9.7% 0.0% -9.7%
Minor risk 28.5% 16.6% 19.2% -11.9% 2.6% -9.3%
Moderate risk 20.5% 21.7% 21.7% 1.2% 0.0% 1.2%
Major risk 32.7% 52.0% 49.1% 19.3% -2.9% 16.4%
Don’t know 2.1% 3.3% 3.6% 1.2% 0.3% 1.5%
Unweighted n 2086 2000 1538
Flu epidemics
No risk at all 5.7% 5.0% 4.4% -0.7% -0.6% -1.3%
Minor risk 29.8% 24.0% 22.1% -5.8% -1.9% -7.7%
Moderate risk 33.3% 38.0% 36.2% 4.7% -1.8% 2.9%
Major risk 29.0% 30.3% 33.6% 1.3% 3.3% 4.6%
Don’t know 2.3% 2.7% 3.6% 0.4% 0.9% 1.3%
Unweighted n 2092 2009 1537
Climate change
No risk at all 17.0% 10.7% 15.7% -6.3% 5.0% -1.3%
Minor risk 28.3% 22.8% 18.7% -5.5% -4.1% -9.6%
Moderate risk 31.8% 39.9% 37.3% 8.1% -2.6% 5.5%
Major risk 20.0% 22.6% 25.7% 2.6% 3.1% 5.7%
Don’t know 2.9% 4.1% 2.5% 1.2% -1.6% -0.4%
Unweighted n 2072 2000 1536
Flooding
No risk at all 25.1% 14.8% 16.4% -10.3% 1.6% -8.7%
Minor risk 40.3% 31.4% 33.3% -8.9% 1.9% -7.0%
Moderate risk 18.9% 33.3% 30.8% 14.4% -2.5% 11.9%
Major risk 13.3% 17.8% 17.6% 4.5% -0.2% 4.3%
Don’t know 2.4% 2.7% 1.9% 0.3% -0.8% -0.5%
Unweighted n 2054 1983 1541
21 | Public Health, Energy & Climate, 2015 | A Maryland Statewide Survey
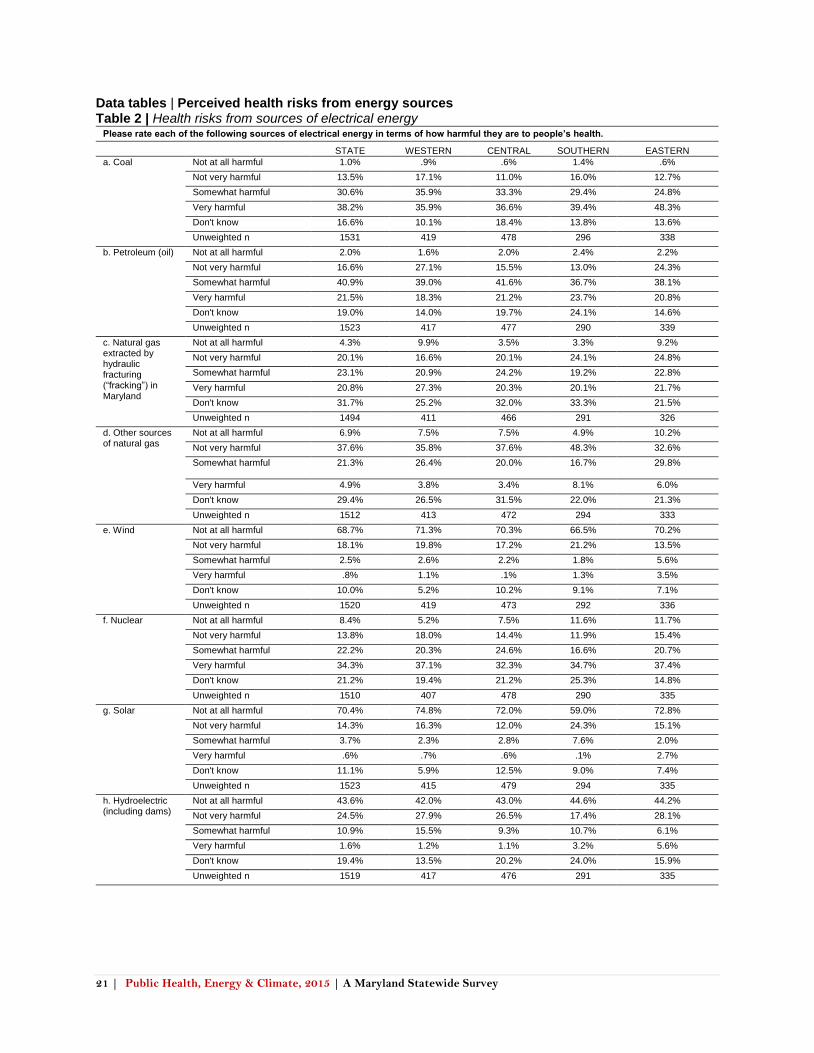
Data tables | Perceived health risks from energy sources Table 2 | Health risks from sources of electrical energy
Please rate each of the following sources of electrical energy in terms of how harmful they are to people’s health.
STATE WESTERN CENTRAL SOUTHERN EASTERN
a. Coal Not at all harmful 1.0% .9% .6% 1.4% .6%
Not very harmful 13.5% 17.1% 11.0% 16.0% 12.7%
Somewhat harmful 30.6% 35.9% 33.3% 29.4% 24.8%
Very harmful 38.2% 35.9% 36.6% 39.4% 48.3%
Don't know 16.6% 10.1% 18.4% 13.8% 13.6%
Unweighted n 1531 419 478 296 338
b. Petroleum (oil) Not at all harmful 2.0% 1.6% 2.0% 2.4% 2.2%
Not very harmful 16.6% 27.1% 15.5% 13.0% 24.3%
Somewhat harmful 40.9% 39.0% 41.6% 36.7% 38.1%
Very harmful 21.5% 18.3% 21.2% 23.7% 20.8%
Don't know 19.0% 14.0% 19.7% 24.1% 14.6%
Unweighted n 1523 417 477 290 339
c. Natural gas extracted by hydraulic fracturing (“fracking”) in Maryland
Not at all harmful 4.3% 9.9% 3.5% 3.3% 9.2%
Not very harmful 20.1% 16.6% 20.1% 24.1% 24.8%
Somewhat harmful 23.1% 20.9% 24.2% 19.2% 22.8%
Very harmful 20.8% 27.3% 20.3% 20.1% 21.7%
Don't know 31.7% 25.2% 32.0% 33.3% 21.5%
Unweighted n 1494 411 466 291 326
d. Other sources of natural gas
Not at all harmful 6.9% 7.5% 7.5% 4.9% 10.2%
Not very harmful 37.6% 35.8% 37.6% 48.3% 32.6%
Somewhat harmful 21.3% 26.4% 20.0% 16.7% 29.8%
Very harmful 4.9% 3.8% 3.4% 8.1% 6.0%
Don't know 29.4% 26.5% 31.5% 22.0% 21.3%
Unweighted n 1512 413 472 294 333
e. Wind Not at all harmful 68.7% 71.3% 70.3% 66.5% 70.2%
Not very harmful 18.1% 19.8% 17.2% 21.2% 13.5%
Somewhat harmful 2.5% 2.6% 2.2% 1.8% 5.6%
Very harmful .8% 1.1% .1% 1.3% 3.5%
Don't know 10.0% 5.2% 10.2% 9.1% 7.1%
Unweighted n 1520 419 473 292 336
f. Nuclear Not at all harmful 8.4% 5.2% 7.5% 11.6% 11.7%
Not very harmful 13.8% 18.0% 14.4% 11.9% 15.4%
Somewhat harmful 22.2% 20.3% 24.6% 16.6% 20.7%
Very harmful 34.3% 37.1% 32.3% 34.7% 37.4%
Don't know 21.2% 19.4% 21.2% 25.3% 14.8%
Unweighted n 1510 407 478 290 335
g. Solar Not at all harmful 70.4% 74.8% 72.0% 59.0% 72.8%
Not very harmful 14.3% 16.3% 12.0% 24.3% 15.1%
Somewhat harmful 3.7% 2.3% 2.8% 7.6% 2.0%
Very harmful .6% .7% .6% .1% 2.7%
Don't know 11.1% 5.9% 12.5% 9.0% 7.4%
Unweighted n 1523 415 479 294 335
h. Hydroelectric (including dams)
Not at all harmful 43.6% 42.0% 43.0% 44.6% 44.2%
Not very harmful 24.5% 27.9% 26.5% 17.4% 28.1%
Somewhat harmful 10.9% 15.5% 9.3% 10.7% 6.1%
Very harmful 1.6% 1.2% 1.1% 3.2% 5.6%
Don't know 19.4% 13.5% 20.2% 24.0% 15.9%
Unweighted n 1519 417 476 291 335
20 | Public Health, Energy & Climate, 2015 | A Maryland Statewide Survey
Continued Please rate each of the following sources of electrical energy in terms of how harmful they are to people’s health.
STATE WESTERN CENTRAL SOUTHERN EASTERN
i. Wood fuel Not at all harmful 9.2% 16.1% 9.5% 5.0% 8.7%
Not very harmful 24.3% 25.3% 25.8% 16.5% 26.4%
Somewhat harmful 34.5% 32.8% 31.9% 48.2% 40.8%
Very harmful 11.9% 10.9% 11.3% 14.4% 11.6%
Don't know 20.0% 14.9% 21.5% 15.9% 12.5%
Unweighted n 1515 415 476 291 333
j. Geothermal Not at all harmful 32.1% 38.6% 34.0% 25.9% 38.8%
Not very harmful 17.1% 15.5% 14.3% 23.4% 26.9%
Somewhat harmful 7.1% 8.0% 6.5% 5.1% 10.6%
Very harmful .8% .6% .3% 3.0% .8%
Don't know 42.9% 37.3% 45.0% 42.6% 22.8%
Unweighted n 1526 417 477 295 337
Please rate each of the following sources of electrical energy in terms of how harmful they are to people’s health.
2013 2014 2015 ∆ 2014-2013 ∆ 2015-2014 ∆ 2015-2013
Coal
Not at all harmful 2.8% 2.5% 1.0% -0.3% -1.5% -1.8%
Not very harmful 9.6% 8.4% 13.5% -1.2% 5.1% 3.9%
Somewhat harmful 37.5% 31.6% 30.6% -5.9% -1.0% -6.9%
Very harmful 30.8% 40.6% 38.2% 9.8% -2.4% 7.4%
Don’t know 19.3% 16.9% 16.6% -2.4% -0.3% -2.7%
Unweighted n 2098 2006 1531
Petroleum (oil)
Not at all harmful 3.1% 1.9% 2.0% -1.2% 0.1% -1.1%
Not very harmful 15.1% 15.0% 16.6% -0.1% 1.6% 1.5%
Somewhat harmful 38.8% 37.5% 40.9% -1.3% 3.4% 2.1%
Very harmful 20.2% 26.2% 21.5% 6.0% -4.7% 1.3%
Don’t know 22.8% 19.4% 19.0% -3.4% -0.4% -3.8%
Unweighted n 2088 1994 1523
Natural gas extracted by hydraulic fracturing (“fracking”) in Maryland
Not at all harmful 5.5% 5.1% 4.3% -0.4% -0.8% -1.2%
Not very harmful 19.4% 20.9% 20.1% 1.5% -0.8% 0.7%
Somewhat harmful 27.9% 22.6% 23.1% -5.3% 0.5% -4.8%
Very harmful 16.5% 22.9% 20.8% 6.4% -2.1% 4.3%
Don’t know 30.7% 28.4% 31.7% -2.3% 3.3% 1.0%
Unweighted n 2086 2000 1494
Other sources of natural gas
Not at all harmful 9.5% 7.9% 6.9% -1.6% -1.0% -2.6%
Not very harmful 27.4% 32.2% 37.6% 4.8% 5.4% 10.2%
Somewhat harmful 24.0% 24.6% 21.3% 0.6% -3.3% -2.7%
Very harmful 5.4% 4.0% 4.9% -1.4% 0.9% -0.5%
Don’t know 33.7% 31.3% 29.4% -2.4% -1.9% -4.3%
Unweighted n 2074 1992 1512
Offshore wind (2013, 2014); wind (2015)
Not at all harmful 58.0% 57.0% 68.7% -1.0% 11.7% 10.7%
Not very harmful 17.1% 20.4% 18.1% 3.3% -2.3% 1.0%
Somewhat harmful 4.2% 3.6% 2.5% -0.6% -1.1% -1.7%
Very harmful 1.1% 0.7% 0.8% -0.4% 0.1% -0.3%
Don’t know 19.7% 18.3% 10.0% -1.4% -8.3% -9.7%
Unweighted n 2060 1998 1520
Land-based wind
Not at all harmful 59.6% 57.8% 68.7% -1.8% 10.9% 9.1%
Not very harmful 17.8% 20.4% 18.1% 2.6% -2.3% 0.3%
Somewhat harmful 4.4% 3.8% 2.5% -0.6% -1.3% -1.9%
Very harmful 1.0% 1.1% 0.8% 0.1% -0.3% -0.2%
Don’t know 17.2% 17.0% 10.0% -0.2% -7.0% -7.2%
Unweighted n 2079 2003 1520
20 | Public Health, Energy & Climate, 2015 | A Maryland Statewide Survey
Continued
Please rate each of the following sources of electrical energy in terms of how harmful they are to people’s health.
2013 2014 2015 ∆ 2014-2013 ∆ 2015-2014 ∆ 2015-2013
Nuclear
Not at all harmful 6.6% 5.3% 8.4% -1.3% 3.1% 1.8%
Not very harmful 11.5% 13.9% 13.8% 2.4% -0.1% 2.3%
Somewhat harmful 23.1% 27.4% 22.2% 4.3% -5.2% -0.9%
Very harmful 34.6% 30.9% 34.3% -3.7% 3.4% -0.3%
Don’t know 24.2% 22.5% 21.2% -1.7% -1.3% -3.0%
Unweighted n 2064 1981 1510
Solar
Not at all harmful 60.3% 65.0% 70.4% 4.7% 5.4% 10.1%
Not very harmful 17.8% 17.1% 14.3% -0.7% -2.8% -3.5%
Somewhat harmful 3.6% 3.2% 3.7% -0.4% 0.5% 0.1%
Very harmful 2.9% 1.0% 0.6% -1.9% -0.4% -2.3%
Don’t know 15.4% 13.7% 11.1% -1.7% -2.6% -4.3%
Unweighted n 2077 2009 1523
Hydroelectric (including dams)
Not at all harmful 38.5% 38.6% 43.6% 0.1% 5.0% 5.1%
Not very harmful 24.4% 28.3% 24.5% 3.9% -3.8% 0.1%
Somewhat harmful 10.2% 8.9% 10.9% -1.3% 2.0% 0.7%
Very harmful 1.9% 1.4% 1.6% -0.5% 0.2% -0.3%
Don’t know 25.1% 22.8% 19.4% -2.3% -3.4% -5.7%
Unweighted n 2075 2003 1519
Wood fuel or switchgrass (2013, 2014); wood fuel (2015)
Not at all harmful 8.1% 8.4% 9.2% 0.3% 0.8% 1.1%
Not very harmful 18.6% 22.0% 24.3% 3.4% 2.3% 5.7%
Somewhat harmful 24.1% 23.6% 34.5% -0.5% 10.9% 10.4%
Very harmful 10.2% 7.4% 11.9% -2.8% 4.5% 1.7%
Don’t know 39.0% 38.6% 20.0% -0.4% -18.6% -19.0%
Unweighted n 2083 2006 1515
21 | Public Health, Energy & Climate, 2015 | A Maryland Statewide Survey
Data tables | Perceptions of air pollution and air quality
Table 3 | Concern about the health effect of air quality
How concerned are you about the health effects of air pollution on the following?
STATE WESTERN CENTRAL SOUTHERN EASTERN
a. You personally Not at all 4.9% 15.3% 4.5% 3.7% 4.1%
A very little 11.6% 13.0% 12.1% 8.5% 14.7%
A little 15.7% 17.9% 14.7% 22.6% 20.5%
A moderate amount 25.9% 25.9% 28.1% 22.3% 20.3%
Quite a lot 16.3% 11.1% 17.4% 14.5% 14.3%
A great deal 11.9% 9.7% 12.1% 9.3% 13.9%
A very great deal 13.7% 7.2% 11.1% 19.0% 12.2%
Unweighted n 1527 420 475 296 336
b. Other people in your immediate household
Not at all 8.3% 19.2% 7.6% 5.9% 10.2%
A very little 8.9% 11.8% 9.1% 6.6% 10.3%
A little 18.4% 15.3% 17.6% 27.9% 19.3%
A moderate amount 22.5% 20.9% 23.5% 20.8% 22.2%
Quite a lot 16.9% 14.6% 19.7% 10.3% 13.6%
A great deal 11.4% 8.7% 11.3% 12.4% 12.2%
A very great deal 13.5% 9.5% 11.2% 16.1% 12.2%
Unweighted n 1410 387 442 275 306
c. People in your community Not at all 3.9% 11.0% 3.7% 2.5% 3.4%
A very little 10.7% 11.6% 9.4% 12.2% 13.0%
A little 17.1% 19.3% 16.3% 23.5% 22.7%
A moderate amount 27.5% 31.3% 31.3% 21.1% 25.4%
Quite a lot 17.4% 14.8% 17.9% 13.7% 11.9%
A great deal 12.3% 5.6% 12.3% 16.3% 13.0%
A very great deal 11.1% 6.3% 9.2% 10.7% 10.6%
Unweighted n 1491 406 468 289 328
Table 4 | Ratings of indoor air quality How would you rate the air quality in these places?
STATE WESTERN CENTRAL SOUTHERN EASTERN
a. Inside my home Very good 20.9% 32.2% 21.0% 17.7% 27.1%
Good 45.9% 44.8% 44.7% 52.0% 51.3%
Neutral 26.4% 15.6% 28.4% 22.9% 16.2%
Poor 3.6% 4.6% 2.0% 5.7% 1.7%
Very poor .4% .7% .4% .3% 1.0%
Don't know/Not applicable
2.9% 2.1% 3.5% 1.5% 2.8%
Unweighted n 1536 422 480 296 338
b. Outside my home Very good 9.9% 24.6% 8.4% 10.1% 13.2%
Good 39.8% 45.7% 38.4% 45.5% 37.1%
Neutral 32.5% 22.6% 34.4% 27.5% 35.0%
Poor 10.1% 4.1% 10.4% 11.7% 9.5%
Very poor 4.1% .5% 3.7% 3.1% 1.0%
Don't know/Not applicable
3.6% 2.4% 4.7% 2.1% 4.2%
Unweighted n 1530 419 478 295 338
c. Where I spend most time when not at home (work, school, etc.)
Very good 5.8% 11.7% 5.8% 3.6% 8.3%
Good 33.3% 42.2% 30.2% 40.1% 40.7%
Neutral 37.3% 28.8% 39.2% 29.8% 23.7%
Poor 11.8% 7.1% 11.6% 17.5% 9.8%
Very poor 4.2% 2.6% 4.1% 2.7% 8.9%
Don't know/Not applicable
7.7% 7.5% 9.0% 6.2% 8.6%
Unweighted n 1521 414 478 295 334
22 | Public Health, Energy & Climate, 2015 | A Maryland Statewide Survey
Table 5 | Chronic health conditions Have you ever been told by a doctor or health care provider that you have one or more of these conditions? (Please check ALL THAT APPLY)
STATE WESTERN CENTRAL SOUTHERN EASTERN
a. Asthma 11.3% 10.3% 9.6% 13.9% 11.9%
b. COPD 4.5% 4.3% 4.4% 2.4% 5.1%
c. Hypertension 24.4% 30.9% 23.7% 27.5% 27.0%
d. Coronary heart disease 4.5% 4.6% 6.1% 1.8% 2.8%
e. Stroke 2.5% 2.1% 1.8% 2.6% 3.8%
f. Diabetes 12.3% 17.3% 12.2% 9.5% 14.1%
g. Cancer 8.0% 9.9% 8.6% 7.3% 6.6%
h. Weak or failing kidneys 2.4% 8.6% 1.6% 2.2% 1.5%
i. Arthritis 21.7% 28.6% 18.8% 29.1% 25.9%
j. Hepatitis 2.3% 1.3% 3.0% .6% 1.1%
k. None of the above 48.0% 44.4% 49.9% 42.4% 46.6%
Unweighted n 1547 424 484 297 342
Table 6 | Chronic medical conditions diagnosed in other immediate household members
Has an immediate household member ever been told by a doctor or health care provider that they have one or more of these conditions? (Please check ALL THAT APPLY)
STATE WESTERN CENTRAL SOUTHERN EASTERN
a. Asthma 14.9% 17.9% 14.3% 13.7% 11.7%
b. COPD 4.6% 4.4% 5.3% 1.3% 6.0%
c. Hypertension 18.5% 20.0% 16.5% 18.3% 18.2%
d. Coronary heart disease 3.9% 9.3% 3.9% 2.5% 5.8%
e. Stroke 3.1% 7.0% 1.9% 3.3% 5.0%
f. Diabetes 14.1% 13.9% 13.2% 13.8% 13.7%
g. Cancer 8.6% 12.7% 7.2% 12.3% 10.2%
h. Weak or failing kidneys 3.1% 7.5% 3.0% 1.9% 1.1%
i. Arthritis 14.8% 18.6% 11.0% 31.2% 13.4%
j. Hepatitis 2.0% .4% 2.7% .2% .3%
k. None of the above 48.3% 47.5% 50.5% 45.2% 45.5%
Unweighted n 1547 424 484 297 342
Table 7 | Asthma episodes If you stated above that you currently have asthma, please answer the questions below. Asthma attacks, sometimes called episodes, refer to periods of worsening asthma symptoms that make you limit your activity more than you usually do, or make you seek medical care.
During the past 3 months, how many asthma episodes or attacks have you had? (Please write #) asthma attacks/episodes
STATE WESTERN CENTRAL SOUTHERN EASTERN
0 58.8% 56.2% 44.5% 77.4% 44.9%
1-5 35.2% 34.7% 51.7% 12.4% 52.0%
6-10 1.9% 1.9% 0.0% 1.9% 3.1%
11-15 1.4% 2.2% 2.5% 0.0% 0.0%
>15 2.7% 5.0% 1.3% 8.4% 0.0%
Unweighted n 164 45 43 36 40
Table 8 | Inability to work or conduct usual activities due to asthma
During the past 12 months, how many days were you unable to work or carry out your usual activities because of your asthma? (Please write #) days
STATE WESTERN CENTRAL SOUTHERN EASTERN
0 75.5% 83.7% 66.2% 89.5% 68.4%
1-5 17.9% 7.5% 24.9% 9.3% 17.4%
6-10 3.2% 4.5% 3.5% 1.1% 9.9%
11-15 .5% 0.0% 1.4% 0.0% 0.0%
>15 2.9% 4.4% 4.0% 0.0% 4.3%
Unweighted n 162 44 42 36 40
23 | Public Health, Energy & Climate, 2015 | A Maryland Statewide Survey
Table 9 | Visits to the emergency room or urgent care due to asthma
During the past 12 months, how many times did you visit an emergency room or urgent care center because of your asthma? (Please write #) times
STATE WESTERN CENTRAL SOUTHERN EASTERN
0 83.1% 88.2% 83.1% 84.2% 69.0%
1-5 16.1% 10.0% 16.9% 15.0% 31.0%
6-10 .8% 1.8% 0.0% .8% 0.0%
Unweighted n 160 44 42 35 39
Table 10 | Number of other household members who experience asthma
If you stated above that a member of your immediate household currently has asthma, please answer the questions below.
How many people in your household, not including yourself, have asthma?
STATE WESTERN CENTRAL SOUTHERN EASTERN
1 87.0% 87.0% 91.6% 76.6% 76.9%
2 7.8% 12.2% 5.4% 10.0% 16.6%
3 4.9% .8% 3.0% 13.3% 1.4%
4 .3% 0.0% 0.0% 0.0% 5.1%
Total 175 56 55 37 27
Table 11 | Age of other household member with most severe asthma
What is the age of the person in your immediate household who has the most severe asthma, not including you?
STATE WESTERN CENTRAL SOUTHERN EASTERN
< 6 27.2% 13.8% 17.1% 50.1% 16.9%
6 to 12 12.8% 23.2% 13.1% 4.5% 27.9%
12 to 17 9.7% 17.4% 13.2% 5.2% 13.5%
18 to 24 14.8% 15.3% 18.0% 8.9% 6.8%
25 to 34 8.4% 1.7% 10.7% 7.7% 6.2%
35 to 44 11.0% 2.2% 14.3% 7.6% 6.8%
45 to 54 6.5% 10.0% 4.9% 6.0% 13.0%
55 to 64 2.7% 7.2% 4.2% 0.0% 1.4%
65 to 74 2.2% 4.8% .8% 2.5% 1.6%
75 to 84 3.3% 4.5% 0.0% 7.5% 5.9%
85 + 1.3% 0.0% 3.7% 0.0% 0.0%
Unweighted n 212 60 61 51 40
Table 12 | Number of asthma attacks of other household member
During the past 3 months, how many asthma episodes or attacks have they had?
STATE WESTERN CENTRAL SOUTHERN EASTERN
0 62.7% 40.1% 65.4% 72.3% 37.3%
1-5 30.3% 50.9% 26.0% 21.2% 54.6%
6-10 6.4% 5.6% 8.6% 6.6% 1.0%
11-15 .3% 2.8% 0.0% 0.0% 0.0%
>15 .4% .6% 0.0% 0.0% 7.1%
Unweighted n 172 54 49 39 30
Table 13 | Number of household member’s visits to an emergency room or urgent care
During the past 12 months, how many times did they visit an emergency room or urgent care center because of their asthma?
STATE WESTERN CENTRAL SOUTHERN EASTERN
0 81.4% 75.5% 86.1% 83.3% 53.5%
1-5 17.6% 22.7% 13.9% 13.6% 46.5%
6-10 .2% 1.2% 0.0% 0.0% 0.0%
11-15 .9% .6% 0.0% 3.2% 0.0%
Unweighted n 171 54 49 38 30
24 | Public Health, Energy & Climate, 2015 | A Maryland Statewide Survey
Table 14 | Number of days that household member was unable to work or carry out usual activities
During the past 12 months, how many days were they unable to work, go to school, or carry out their usual activities because of their asthma?
STATE WESTERN CENTRAL SOUTHERN EASTERN
0 75.9% 71.7% 78.8% 80.1% 70.3%
1-5 17.5% 22.7% 18.0% 8.8% 16.2%
6-10 4.4% 2.0% 3.1% 7.1% 5.0%
11-15 .6% .6% 0.0% .8% 0.0%
>15 1.6% 2.9% 0.0% 3.2% 8.5%
Unweighted n 168 53 47 38 30
Data tables | Health status of respondents and their household members Table 15 | Experience of stress
In the last 12 months, have you personally experienced one or more prolonged periods of stress of 1 month or longer in relation to circumstances in everyday life, such as work, health, or a family situation?
STATE WESTERN CENTRAL SOUTHERN EASTERN
I have not experienced a prolonged period of stress
36.1% 40.6% 36.4% 34.7% 31.1%
One period of prolonged stress 22.7% 21.6% 23.7% 23.7% 16.7%
More than one period of prolonged stress 26.1% 21.1% 25.3% 30.9% 34.0%
Constant stress 15.0% 16.7% 14.5% 10.7% 18.1%
Unweighted n 1530 420 478 294 338
Data tables | Marylanders’ priorities for the Assembly and Governor Table 16 | Top priority areas for the state
How much of a priority should these topics be for Maryland’s General Assembly and the Governor?
STATE WESTERN CENTRAL SOUTHERN EASTERN
a. Improving access to health care
Not a priority 2.2% 1.4% 2.2% 2.1% 2.0%
Low 5.0% 5.0% 5.0% 3.7% 5.1%
Medium 18.4% 19.2% 18.3% 21.9% 15.4%
High 36.3% 28.4% 37.2% 39.5% 26.0%
Very high 38.1% 46.1% 37.2% 32.9% 51.6%
Unweighted n 1529 421 481 291 336
b. Lowering state rates of asthma and respiratory disease
Not a priority 4.1% 8.1% 5.0% 1.4% 4.9%
Low 12.0% 13.6% 11.8% 13.7% 8.6%
Medium 24.9% 27.5% 22.6% 33.8% 29.0%
High 32.7% 22.7% 33.9% 29.6% 21.4%
Very high 26.3% 28.2% 26.7% 21.4% 36.2%
Unweighted n 1510 415 472 289 334
c. Lowering state taxes Not a priority 2.3% 3.0% 3.0% .8% 1.5%
Low 5.3% 9.0% 6.0% 2.6% 5.5%
Medium 18.9% 19.9% 18.1% 28.7% 17.3%
High 27.2% 24.0% 27.3% 25.0% 30.8%
Very high 46.3% 44.1% 45.7% 42.9% 45.0%
Unweighted n 1532 419 481 293 339
d. Addressing climate change Not a priority 13.9% 13.1% 14.6% 10.2% 12.8%
Low 15.2% 18.0% 16.5% 15.2% 15.9%
Medium 24.7% 23.9% 24.6% 27.3% 19.7%
High 22.9% 21.8% 21.1% 26.4% 23.8%
Very high 23.3% 23.1% 23.2% 20.9% 27.8%
Unweighted n 1516 413 481 290 332
e. Making the state more business-friendly
Not a priority 2.8% 1.0% 2.5% 10.6% 2.2%
Low 7.1% 5.9% 6.7% 9.1% 10.2%
Medium 28.6% 21.6% 29.9% 22.8% 22.5%
High 35.5% 35.6% 37.9% 32.8% 25.8%
Very high 26.0% 35.9% 23.0% 24.6% 39.3%
Unweighted n 1518 415 475 292 336
20 | Public Health, Energy & Climate, 2015 | A Maryland Statewide Survey
Continued How much of a priority should these topics be for Maryland’s General Assembly and the Governor?
STATE WESTERN CENTRAL SOUTHERN EASTERN
f. Shrinking the size of state government
Not a priority 12.0% 7.3% 12.4% 9.4% 6.8%
Low 16.4% 16.1% 15.9% 22.6% 13.8%
Medium 32.0% 23.0% 31.5% 38.3% 30.8%
High 17.6% 23.2% 18.9% 12.3% 20.0%
Very high 21.9% 30.4% 21.3% 17.4% 28.5%
Unweighted n 1529 420 478 295 336
g. Creating jobs Not a priority 1.3% .5% 1.4% .5% .5%
Low .9% 1.5% .9% .6% 1.2%
Medium 11.3% 9.5% 10.6% 15.4% 7.2%
High 27.7% 27.1% 29.0% 22.2% 24.2%
Very high 58.9% 61.3% 58.1% 61.3% 66.8%
Unweighted n 1525 419 477 292 337
h. Growing the middle class Not a priority 3.0% 2.0% 4.2% .9% 2.1%
Low 3.5% 2.4% 4.6% 1.8% 3.8%
Medium 19.1% 13.8% 21.2% 9.9% 20.6%
High 34.8% 35.1% 30.6% 55.3% 28.4%
Very high 39.6% 46.7% 39.4% 32.0% 45.1%
Unweighted n 1521 414 477 294 336
i. Protecting Maryland’s coastal areas from storms and flooding
Not a priority 2.0% 3.6% 2.3% 1.0% .7%
Low 7.8% 9.6% 9.7% 2.4% 7.1%
Medium 24.3% 27.4% 24.9% 19.1% 19.2%
High 37.0% 30.4% 37.9% 40.8% 29.9%
Very high 29.0% 29.0% 25.2% 36.6% 43.1%
Unweighted n 1536 423 481 294 338
j. Reducing water pollution Not a priority .4% 1.8% .2% .2% .4%
Low 2.7% 4.4% 3.4% .8% 2.8%
Medium 20.7% 27.9% 21.7% 11.4% 22.0%
High 32.7% 29.9% 33.3% 39.9% 29.3%
Very high 43.5% 35.9% 41.4% 47.7% 45.5%
Unweighted n 1537 422 482 295 338
k. Fixing and building roads Not a priority .5% .4% .6% .2% .4%
Low 2.4% 2.7% 1.5% 3.1% 5.2%
Medium 19.9% 16.0% 19.6% 23.2% 20.0%
High 39.0% 37.2% 43.5% 28.0% 33.7%
Very high 38.1% 43.6% 34.8% 45.5% 40.8%
Unweighted n 1533 421 479 294 339
l. Expanding public transportation Not a priority 6.3% 5.0% 6.6% 4.9% 5.9%
Low 11.2% 13.5% 12.3% 9.2% 13.2%
Medium 29.6% 29.5% 27.7% 38.5% 25.0%
High 27.4% 26.4% 28.4% 24.9% 33.4%
Very high 25.5% 25.6% 25.0% 22.6% 22.5%
Unweighted n 1530 419 479 295 337
m. Reducing air pollution Not a priority 2.5% 6.6% 2.4% 1.3% .8%
Low 5.6% 9.4% 7.0% 1.3% 7.5%
Medium 23.8% 25.3% 24.7% 17.4% 26.4%
High 33.0% 25.8% 31.4% 44.8% 28.2%
Very high 35.1% 32.9% 34.5% 35.2% 37.2%
Unweighted n 1517 417 475 289 336
n. Improving state K-12 and higher education
Not a priority 1.6% 1.2% 1.7% 1.9% 2.1%
Low 3.3% 5.2% 3.9% 2.1% 4.9%
Medium 16.1% 18.3% 18.3% 11.4% 11.1%
High 30.0% 28.6% 28.7% 34.8% 29.4%
Very high 48.9% 46.7% 47.4% 49.8% 52.6%
Unweighted n 1535 421 481 294 339
21 | Public Health, Energy & Climate, 2015 | A Maryland Statewide Survey
How much of a priority should these topics be for Maryland’s General Assembly and the Governor?
2014 2015 ∆ 2015-2014
Improving access to health care
Not a priority 3.2% 2.2% -1.0%
Low 6.3% 5.0% -1.3%
Medium 16.7% 18.4% 1.7%
High 29.5% 36.3% 6.8%
Very high 44.3% 38.1% -6.2%
Unweighted n 1997 1529
Addressing climate change
Not a priority 8.6% 13.9% 5.3%
Low 12.3% 15.2% 2.9%
Medium 28.4% 24.7% -3.7%
High 29.6% 22.9% -6.7%
Very high 21.0% 23.3% 2.3%
Unweighted n 1994 1516
Creating jobs
Not a priority 0.9% 1.3% 0.4%
Low 1.5% 0.9% -0.6%
Medium 8.2% 11.3% 3.1%
High 26.2% 27.7% 1.5%
Very high 63.1% 58.9% -4.2%
Unweighted n 2002 1525
Growing the middle class
Not a priority 2.5% 3.0% 0.5%
Low 4.9% 3.5% -1.4%
Medium 18.4% 19.1% 0.7%
High 30.1% 34.8% 4.7%
Very high 44.1% 39.6% -4.5%
Unweighted n 1982 1521
Protecting Maryland’s coastal areas from sea-level rise (2014)/ storms and flooding (2015)
Not a priority 4.5% 2.0% -2.5%
Low 11.0% 7.8% -3.2%
Medium 29.2% 24.3% -4.9%
High 31.2% 37.0% 5.8%
Very high 24.1% 29.0% 4.9%
Unweighted n 1998 1536
Reducing water pollution
Not a priority 1.2% 0.4% -0.8%
Low 2.3% 2.7% 0.4%
Medium 15.4% 20.7% 5.3%
High 36.3% 32.7% -3.6%
Very high 44.8% 43.5% -1.3%
Unweighted n 1989 1537
Reducing air pollution
Not a priority 2.0% 2.5% 0.5%
Low 5.4% 5.6% 0.2%
Medium 19.2% 23.8% 4.6%
High 33.8% 33.0% -0.8%
Very high 39.5% 35.1% -4.4%
Unweighted n 1993 1517
22 | Public Health, Energy & Climate, 2015 | A Maryland Statewide Survey
Data tables | Perceived health vulnerability of people to climate change Table 17 | Personal, household and community vulnerability
How vulnerable — if at all — are the following people to potential health impacts of climate change?
STATE WESTERN CENTRAL SOUTHERN EASTERN
a. You personally Not at all vulnerable 15.0% 18.4% 15.8% 11.3% 17.0%
Only a little vulnerable 21.3% 25.4% 22.4% 16.0% 25.1%
Moderately vulnerable 34.7% 32.1% 33.3% 40.2% 26.8%
Very vulnerable 15.9% 16.8% 14.4% 22.2% 14.1%
There are no health impacts
1.4% 1.6% 2.0% .7% 1.6%
Don’t know 11.6% 5.7% 12.1% 9.7% 15.3%
Unweighted n 1519 421 473 294 331
b. Other people in your immediate household
Not at all vulnerable 14.3% 20.9% 13.6% 10.6% 15.8%
Only a little vulnerable 17.7% 24.6% 19.1% 13.0% 23.9%
Moderately vulnerable 30.2% 25.5% 29.9% 32.8% 24.7%
Very vulnerable 20.1% 21.6% 19.1% 20.5% 14.8%
There are no health impacts
1.5% 1.2% 2.2% .7% 1.7%
Don’t know 16.2% 6.2% 16.1% 22.5% 19.1%
Unweighted n 1445 397 456 280 312
c. People in your community Not at all vulnerable 10.7% 14.8% 10.7% 8.2% 8.9%
Only a little vulnerable 14.6% 20.0% 16.6% 8.4% 17.2%
Moderately vulnerable 35.0% 33.4% 35.0% 35.1% 28.5%
Very vulnerable 19.4% 20.0% 18.4% 18.1% 25.7%
There are no health impacts
1.1% .9% 1.4% .7% 1.6%
Don’t know 19.2% 10.9% 18.0% 29.5% 18.0%
Unweighted n 1517 421 471 294 331
How vulnerable — if at all — are the following people to potential health impacts of climate change?
2014 2015 ∆ 2015-2014
You personally
Not at all vulnerable 9.9% 15.0% 5.1%
Only a little vulnerable 30.7% 21.3% -9.4%
Moderately vulnerable 34.0% 34.7% 0.7%
Very vulnerable 11.4% 15.9% 4.5%
Don’t believe there are potential climate change health impacts 2.8% 1.4% -1.4%
Don’t know 11.2% 11.6% 0.4%
Unweighted n 1985 1519
(Other) people in your immediate household
Not at all vulnerable 11.5% 14.3% 2.8%
Only a little vulnerable 26.7% 17.7% -9.0%
Moderately vulnerable 34.0% 30.2% -3.8%
Very vulnerable 12.9% 20.1% 7.2%
Don’t believe there are potential climate change health impacts 2.5% 1.5% -1.0%
Don’t know 12.4% 16.2% 3.8%
Unweighted n 1936 1445
People in your community
Not at all vulnerable 6.4% 10.7% 4.3%
Only a little vulnerable 19.2% 14.6% -4.6%
Moderately vulnerable 42.1% 35.0% -7.1%
Very vulnerable 14.4% 19.4% 5.0%
Don’t believe there are potential climate change health impacts 2.3% 1.1% -1.2%
Don’t know 15.7% 19.2% 3.5%
Unweighted n 1985 1517
23 | Public Health, Energy & Climate, 2015 | A Maryland Statewide Survey
Data tables | State resident beliefs about who is currently being harmed by climate change Table 18 | Personal, community, and statewide harm from climate change
How much do you think climate change is currently harming … ?
STATE WESTERN CENTRAL SOUTHERN EASTERN
a. You personally Not at all 23.0% 24.5% 24.3% 25.9% 22.8%
Only a little 21.8% 25.7% 24.8% 13.2% 25.6%
A moderate amount 27.5% 26.3% 24.2% 36.0% 29.1%
A great deal 17.9% 12.7% 17.3% 18.5% 8.4%
Don’t know 9.8% 10.8% 9.3% 6.3% 14.1%
Unweighted n 1514 415 478 294 327
b. People in your community Not at all 16.5% 22.4% 17.0% 14.1% 16.1%
Only a little 20.8% 23.4% 22.4% 16.7% 24.9%
A moderate amount 29.4% 28.4% 27.0% 32.9% 32.5%
A great deal 17.0% 10.9% 17.8% 14.5% 10.3%
Don’t know 16.3% 14.9% 15.8% 21.8% 16.2%
Unweighted n 1514 415 476 294 329
c. People in Maryland Not at all 14.7% 16.9% 16.0% 9.8% 15.1%
Only a little 17.6% 22.5% 20.3% 8.4% 17.3%
A moderate amount 33.6% 29.8% 32.3% 35.1% 35.9%
A great deal 17.3% 14.8% 16.4% 20.7% 11.7%
Don’t know 16.9% 16.0% 15.1% 25.9% 20.0%
Unweighted n 1505 414 475 291 325
24 | Public Health, Energy & Climate, 2015 | A Maryland Statewide Survey
Data tables | Marylanders’ perceptions of climate change effects on health Table 19 | Health problems that will become more or less common due to climate change
Do you think that the following health problems will likely become more or less common in Maryland in the future because of climate change, or stay about the same?
STATE WESTERN CENTRAL SOUTHERN EASTERN
a. Respiratory and breathing problems
Less common 1.1% 1.4% .8% 1.3% 2.8%
Stay about the same 24.8% 29.7% 28.6% 16.7% 25.2%
More common 61.6% 63.2% 59.3% 65.5% 60.9%
Don’t know 12.5% 5.8% 11.3% 16.6% 11.2%
Total 1517 420 472 294 331
b. Infectious diseases Less common 3.4% 2.3% 4.4% 2.1% 2.0%
Stay about the same 43.6% 45.2% 46.8% 38.3% 39.3%
More common 36.8% 40.3% 31.8% 43.9% 41.4%
Don’t know 16.2% 12.3% 17.0% 15.7% 17.2%
Total 1509 416 470 292 331
c. Osteoarthritis Less common 6.7% 3.7% 5.8% 10.1% 2.6%
Stay about the same 44.1% 49.2% 45.6% 39.7% 46.2%
More common 17.0% 16.2% 15.6% 18.9% 22.0%
Don’t know 32.1% 30.9% 33.1% 31.3% 29.2%
Total 1497 415 465 290 327
d. Heat stroke Less common 4.3% 5.5% 4.8% 3.0% 4.8%
Stay about the same 26.0% 31.3% 22.7% 30.4% 25.8%
More common 57.0% 55.1% 58.2% 57.0% 48.0%
Don’t know 12.7% 8.2% 14.3% 9.5% 21.5%
Total 1511 416 470 295 330
e. Injuries from storms or other extreme weather
Less common 4.0% 3.0% 4.7% 3.0% 3.7%
Stay about the same 28.0% 32.3% 26.3% 30.4% 25.7%
More common 57.6% 56.5% 57.6% 58.5% 53.3%
Don’t know 10.4% 8.2% 11.4% 8.0% 17.2%
Total 1513 416 472 295 330
f. Food- and water-borne illness Less common 2.9% 3.8% 2.9% 2.7% 2.6%
Stay about the same 36.2% 39.2% 39.1% 29.6% 40.0%
More common 47.5% 45.0% 43.3% 57.5% 37.5%
Don’t know 13.3% 12.0% 14.7% 10.1% 20.0%
Total 1505 417 467 292 329
g. Wrist pain from carpal tunnel syndrome
Less common 12.0% 7.7% 13.7% 11.3% 5.6%
Stay about the same 41.8% 48.1% 41.4% 39.0% 50.4%
More common 14.0% 12.5% 14.6% 12.6% 18.8%
Don’t know 32.2% 31.7% 30.3% 37.1% 25.2%
Total 1494 411 467 289 327
h. Mental health disorders Less common 9.9% 4.2% 8.4% 15.5% 2.9%
Stay about the same 42.4% 45.2% 39.9% 45.4% 45.8%
More common 24.1% 26.0% 27.5% 16.7% 29.6%
Don’t know 23.6% 24.6% 24.3% 22.4% 21.7%
Total 1502 415 469 291 327
i. Allergies Less common 2.3% 1.5% 3.0% 1.7% 1.2%
Stay about the same 18.8% 25.8% 21.1% 12.2% 21.1%
More common 69.2% 65.1% 64.9% 78.5% 67.3%
Don’t know 9.6% 7.6% 11.0% 7.7% 10.3%
Total 1510 418 469 293 330
j. Impairment of blood clotting Less common 6.5% 5.7% 6.5% 7.5% 3.5%
Stay about the same 46.5% 47.9% 44.9% 48.5% 48.7%
More common 9.6% 16.5% 9.3% 7.6% 12.4%
Don’t know 37.4% 29.8% 39.3% 36.4% 35.4%
Total 1501 416 467 290 328
25 | Public Health, Energy & Climate, 2015 | A Maryland Statewide Survey
Data tables | Sample demographics
Region
STATE
unweighted sample n STATE
weighted %
Western Region 424 8.4%
Central Region 484 55.3%
Southern Region 297 30.3%
Eastern Region 342 6.0%
Total 1547
Gender
STATE
unweighted sample n
STATE weighted n
WESTERN weighted n
CENTRAL weighted n
SOUTHERN weighted n
EASTERN weighted n
Are you: (Check ONE)
Male 589 48.0% 50.3% 48.0% 48.7% 48.6%
Female 958 52.0% 49.7% 52.0% 51.3% 51.4%
Unweighted n 1547 1547 424 484 297 342
Age
STATE
unweighted sample n
STATE weighted n
WESTERN weighted n
CENTRAL weighted n
SOUTHERN weighted n
EASTERN weighted n
18-24 30 12.5% 12.2% 11.9% 13.4% 14.1%
25-34 145 17.6% 15.7% 18.0% 18.3% 13.8%
35-44 201 17.1% 16.9% 17.0% 17.8% 14.1%
45-54 297 19.7% 19.8% 19.5% 20.2% 18.2%
55-64 380 16.2% 16.3% 16.4% 15.7% 17.3%
65-74 295 9.5% 10.4% 9.3% 8.9% 12.7%
75-84 136 5.1% 6.1% 5.2% 4.0% 6.9%
85+ 63 2.3% 2.6% 2.6% 1.6% 2.9%
Unweighted n 1547 1547 424 484 297 342
Education
STATE
unweighted sample n
STATE weighted n
WESTERN weighted n
CENTRAL weighted n
SOUTHERN weighted n
EASTERN weighted n
What is the highest degree or level of school that you have completed?
Less than high school
45 11.0% 10.5% 10.6% 11.5% 13.1%
High school or GED
272 25.8% 32.7% 23.2% 27.1% 34.2%
Some college, no degree
290 19.8% 20.6% 18.2% 22.6% 20.1%
Associate’s degree
124 6.3% 7.6% 5.9% 6.6% 6.2%
Bachelor’s degree
406 20.3% 17.0% 21.9% 19.0% 15.7%
Advanced degree beyond a bachelor’s degree
410 16.8% 11.5% 20.3% 13.2% 10.7%
Unweighted n 1547 1547 424 484 297 342
26 | Public Health, Energy & Climate, 2015 | A Maryland Statewide Survey
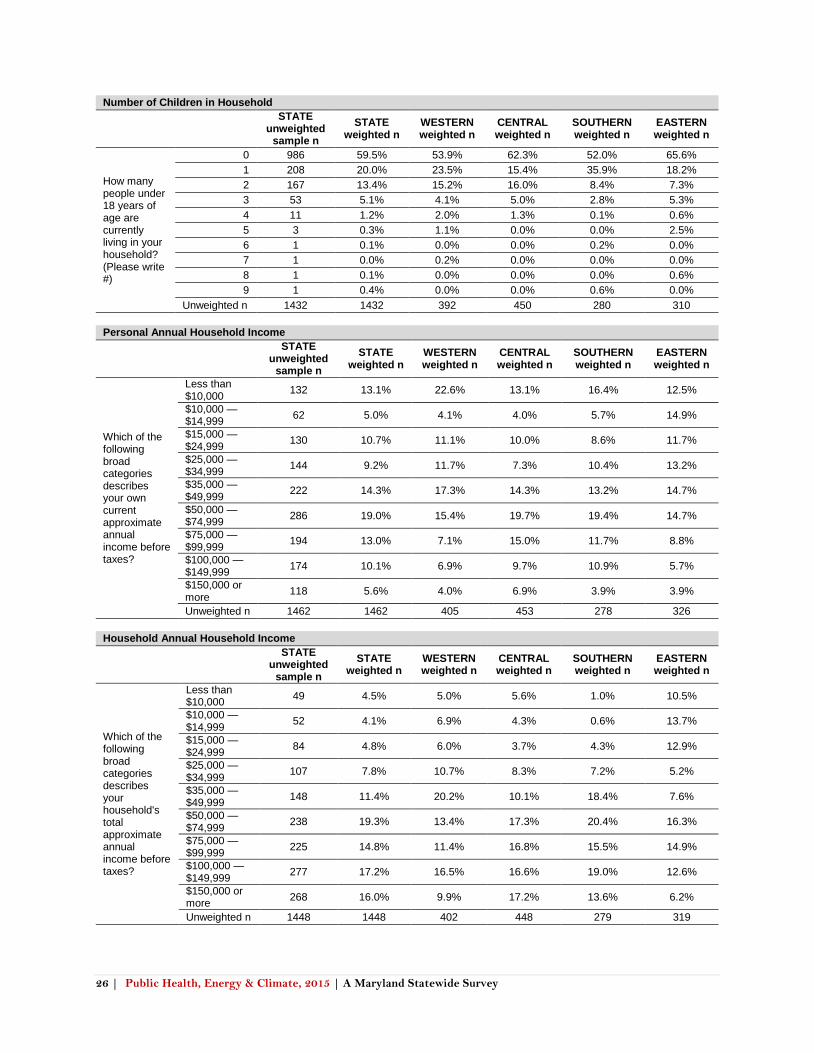
Number of Children in Household
STATE
unweighted sample n
STATE weighted n
WESTERN weighted n
CENTRAL weighted n
SOUTHERN weighted n
EASTERN weighted n
How many people under 18 years of age are currently living in your household? (Please write #)
0 986 59.5% 53.9% 62.3% 52.0% 65.6%
1 208 20.0% 23.5% 15.4% 35.9% 18.2%
2 167 13.4% 15.2% 16.0% 8.4% 7.3%
3 53 5.1% 4.1% 5.0% 2.8% 5.3%
4 11 1.2% 2.0% 1.3% 0.1% 0.6%
5 3 0.3% 1.1% 0.0% 0.0% 2.5%
6 1 0.1% 0.0% 0.0% 0.2% 0.0%
7 1 0.0% 0.2% 0.0% 0.0% 0.0%
8 1 0.1% 0.0% 0.0% 0.0% 0.6%
9 1 0.4% 0.0% 0.0% 0.6% 0.0%
Unweighted n 1432 1432 392 450 280 310
Personal Annual Household Income
STATE
unweighted sample n
STATE weighted n
WESTERN weighted n
CENTRAL weighted n
SOUTHERN weighted n
EASTERN weighted n
Which of the following broad categories describes your own current approximate annual income before taxes?
Less than $10,000
132 13.1% 22.6% 13.1% 16.4% 12.5%
$10,000 — $14,999
62 5.0% 4.1% 4.0% 5.7% 14.9%
$15,000 — $24,999
130 10.7% 11.1% 10.0% 8.6% 11.7%
$25,000 — $34,999
144 9.2% 11.7% 7.3% 10.4% 13.2%
$35,000 — $49,999
222 14.3% 17.3% 14.3% 13.2% 14.7%
$50,000 — $74,999
286 19.0% 15.4% 19.7% 19.4% 14.7%
$75,000 — $99,999
194 13.0% 7.1% 15.0% 11.7% 8.8%
$100,000 — $149,999
174 10.1% 6.9% 9.7% 10.9% 5.7%
$150,000 or more
118 5.6% 4.0% 6.9% 3.9% 3.9%
Unweighted n 1462 1462 405 453 278 326
Household Annual Household Income
STATE
unweighted sample n
STATE weighted n
WESTERN weighted n
CENTRAL weighted n
SOUTHERN weighted n
EASTERN weighted n
Which of the following broad categories describes your household's total approximate annual income before taxes?
Less than $10,000
49 4.5% 5.0% 5.6% 1.0% 10.5%
$10,000 — $14,999
52 4.1% 6.9% 4.3% 0.6% 13.7%
$15,000 — $24,999
84 4.8% 6.0% 3.7% 4.3% 12.9%
$25,000 — $34,999
107 7.8% 10.7% 8.3% 7.2% 5.2%
$35,000 — $49,999
148 11.4% 20.2% 10.1% 18.4% 7.6%
$50,000 — $74,999
238 19.3% 13.4% 17.3% 20.4% 16.3%
$75,000 — $99,999
225 14.8% 11.4% 16.8% 15.5% 14.9%
$100,000 — $149,999
277 17.2% 16.5% 16.6% 19.0% 12.6%
$150,000 or more
268 16.0% 9.9% 17.2% 13.6% 6.2%
Unweighted n 1448 1448 402 448 279 319
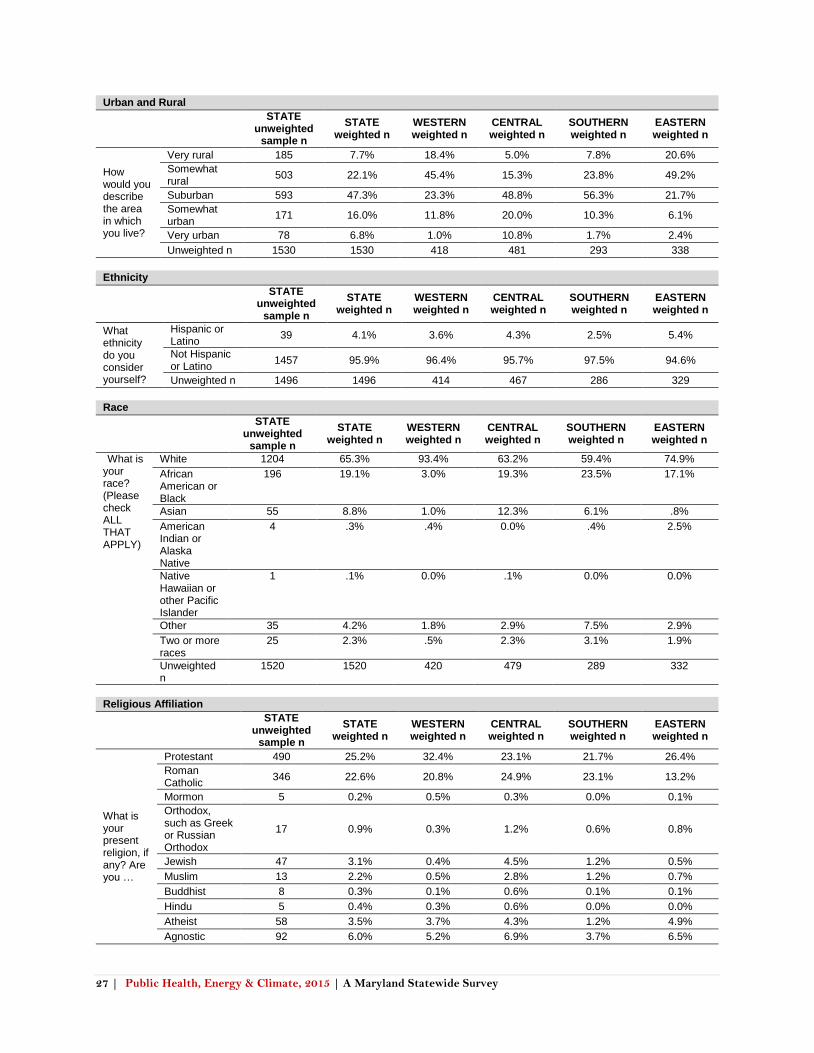
27 | Public Health, Energy & Climate, 2015 | A Maryland Statewide Survey
Urban and Rural
STATE
unweighted sample n
STATE weighted n
WESTERN weighted n
CENTRAL weighted n
SOUTHERN weighted n
EASTERN weighted n
How would you describe the area in which you live?
Very rural 185 7.7% 18.4% 5.0% 7.8% 20.6%
Somewhat rural
503 22.1% 45.4% 15.3% 23.8% 49.2%
Suburban 593 47.3% 23.3% 48.8% 56.3% 21.7%
Somewhat urban
171 16.0% 11.8% 20.0% 10.3% 6.1%
Very urban 78 6.8% 1.0% 10.8% 1.7% 2.4%
Unweighted n 1530 1530 418 481 293 338
Ethnicity
STATE
unweighted sample n
STATE weighted n
WESTERN weighted n
CENTRAL weighted n
SOUTHERN weighted n
EASTERN weighted n
What ethnicity do you consider yourself?
Hispanic or Latino
39 4.1% 3.6% 4.3% 2.5% 5.4%
Not Hispanic or Latino
1457 95.9% 96.4% 95.7% 97.5% 94.6%
Unweighted n 1496 1496 414 467 286 329
Race
STATE unweighted
sample n
STATE weighted n
WESTERN weighted n
CENTRAL weighted n
SOUTHERN weighted n
EASTERN weighted n
What is your race? (Please check ALL THAT APPLY)
White 1204 65.3% 93.4% 63.2% 59.4% 74.9%
African American or Black
196 19.1% 3.0% 19.3% 23.5% 17.1%
Asian 55 8.8% 1.0% 12.3% 6.1% .8%
American Indian or Alaska Native
4 .3% .4% 0.0% .4% 2.5%
Native Hawaiian or other Pacific Islander
1 .1% 0.0% .1% 0.0% 0.0%
Other 35 4.2% 1.8% 2.9% 7.5% 2.9%
Two or more races
25 2.3% .5% 2.3% 3.1% 1.9%
Unweighted n
1520 1520 420 479 289 332
Religious Affiliation
STATE
unweighted sample n
STATE weighted n
WESTERN weighted n
CENTRAL weighted n
SOUTHERN weighted n
EASTERN weighted n
What is your present religion, if any? Are you …
Protestant 490 25.2% 32.4% 23.1% 21.7% 26.4%
Roman Catholic
346 22.6% 20.8% 24.9% 23.1% 13.2%
Mormon 5 0.2% 0.5% 0.3% 0.0% 0.1%
Orthodox, such as Greek or Russian Orthodox
17 0.9% 0.3% 1.2% 0.6% 0.8%
Jewish 47 3.1% 0.4% 4.5% 1.2% 0.5%
Muslim 13 2.2% 0.5% 2.8% 1.2% 0.7%
Buddhist 8 0.3% 0.1% 0.6% 0.1% 0.1%
Hindu 5 0.4% 0.3% 0.6% 0.0% 0.0%
Atheist 58 3.5% 3.7% 4.3% 1.2% 4.9%
Agnostic 92 6.0% 5.2% 6.9% 3.7% 6.5%
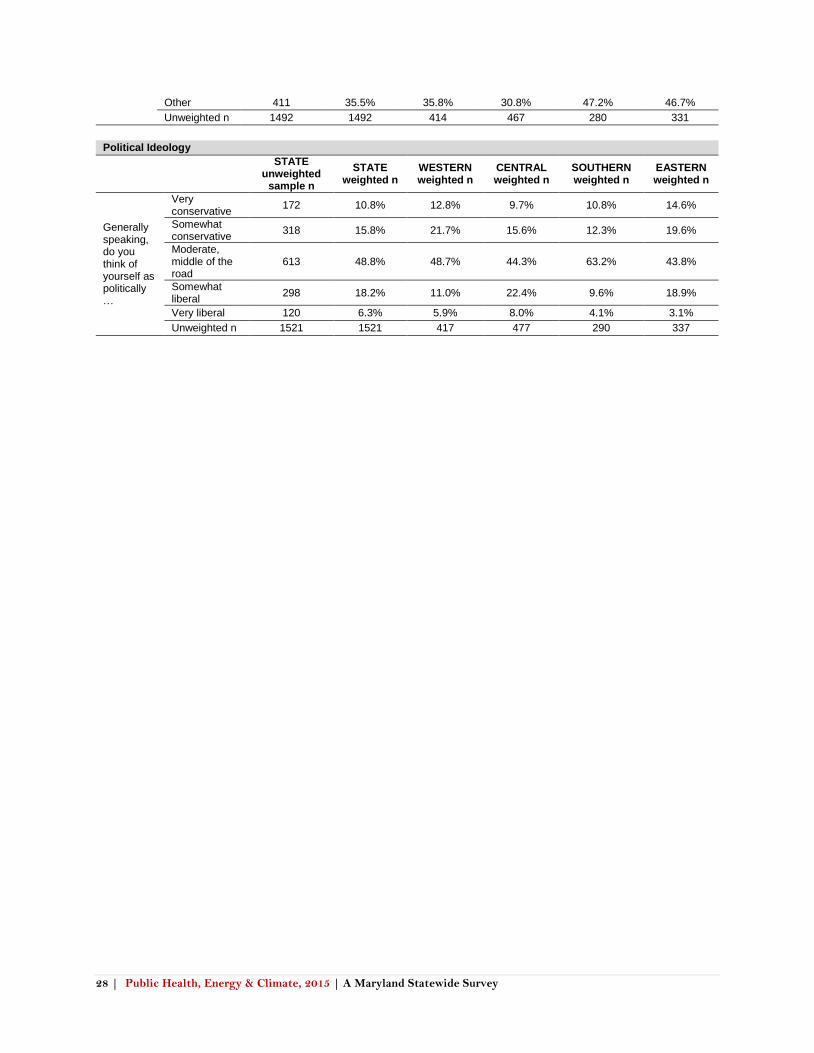
28 | Public Health, Energy & Climate, 2015 | A Maryland Statewide Survey
Other 411 35.5% 35.8% 30.8% 47.2% 46.7%
Unweighted n 1492 1492 414 467 280 331
Political Ideology
STATE
unweighted sample n
STATE weighted n
WESTERN weighted n
CENTRAL weighted n
SOUTHERN weighted n
EASTERN weighted n
Generally speaking, do you think of yourself as politically …
Very conservative
172 10.8% 12.8% 9.7% 10.8% 14.6%
Somewhat conservative
318 15.8% 21.7% 15.6% 12.3% 19.6%
Moderate, middle of the road
613 48.8% 48.7% 44.3% 63.2% 43.8%
Somewhat liberal
298 18.2% 11.0% 22.4% 9.6% 18.9%
Very liberal 120 6.3% 5.9% 8.0% 4.1% 3.1%
Unweighted n 1521 1521 417 477 290 337

29 | Public Health, Energy & Climate, 2015 | A Maryland Statewide Survey