Embed Size (px)
Citation preview

Public Health Education Collaborative
August 3rd, 2010
1

Welcome
2
Sylvia EstafanHealth Education Administration
…Your one-stop shop for all your health education needs.

Introductions
• Name
• Title
• Organization
3
Housekeeping
• Bathrooms
• Sign-in/Sign-out
• CHES
• CEUs
• Evaluations
• Food
• Photos for The Voice and DPH
4

Ground Rules
• Limit cell phone use
• Respect time
• Raise hands for questions/comments
• Respect one another
• Agree to disagree
• Differentiate between fact and opinion
5
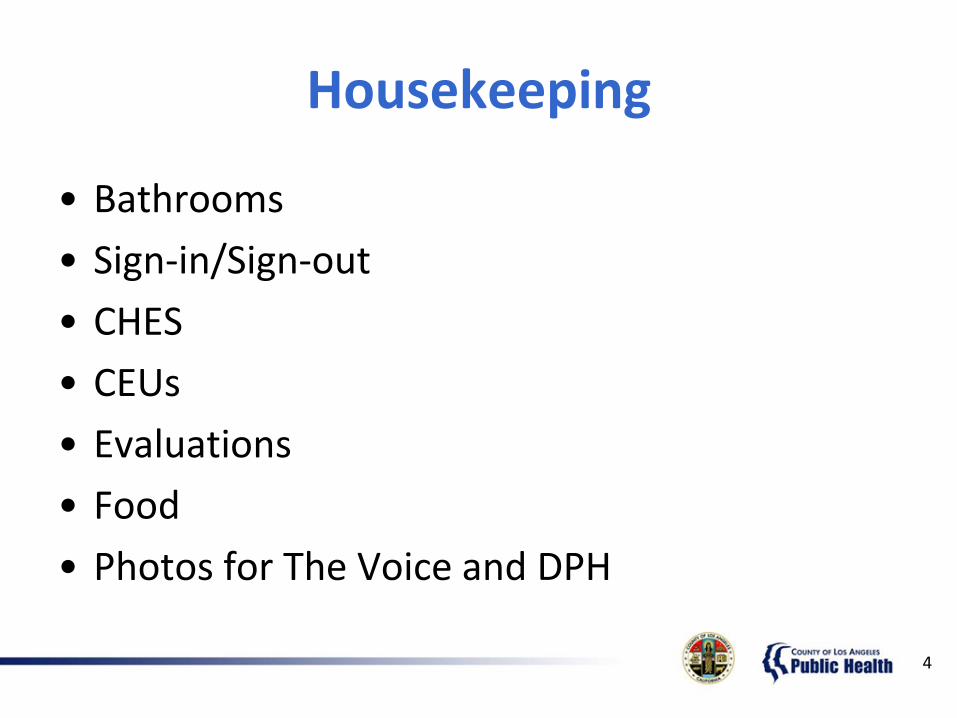
Morning Agenda
6
Timeframe Content
9:00am-9:30am Introductions and Overview
9:30am-10:15am National Health Education Week
10:15am-11:00am Diabetes Awareness
11:00am-11:15am Wellness Break
11:15am-12:00pm Minority Health Jeopardy Game
12:00pm-1:00pm Lunch

Afternoon Agenda
7
Timeframe Content
1:00pm-1:15pm Wellness Break
1:15pm-2:15pm Women’s Health Disparities, Indicators, and Programs
2:15pm-2:30pm Wrap-up & Evaluations
2:30pm-3:30pm- CHS Website Redesign

Today’s Key ObjectivesBy the end of this session, participants will be able to…1. Identify the purpose of National Health Education Week.
2. List at least one activity taking place during National Health Education Week.
3. List three potential health effects of diabetes.
4. List three diabetes management techniques.
5. Distinguish between the two types of diabetes.
6. List at least one program managed by the Office of Women’s Health.
7. Identify at least one indicator that disproportionately affects women’s health in LA County.
8. Discuss recommendations to address health disparities that affect women’s health in LA County.
8

National Health Education Week
Paula MillerAcute Communicable Disease Control
Sylvia EstafanHealth Education Administration
9

National Health Education Week: Background
• Since 1995, it has been celebrated during the third week of October (10/17-10/23)
• Sponsored by health education-related professional organizations (SOPHE, NCHE)
• Each year the theme focuses national attention on a major public health issue
• Promotes understanding of the role of health education in promoting the public’s health
10

National Health Education Week: Planning Considerations
• What do we want to accomplish?
– Clarify what a health educator does in LA County?
– Increase awareness about health education’s role in DPH? LA County?
– Recognize staff?
• How do we want to accomplish our objectives?
11

National Health Education Week: Ideas
• Article in The Voice to increase knowledge about health education's role in DPH
• Memo from Dr. Jonathan Fielding to acknowledge health education week
• Health Educator highlight on the Local 721 website
• Recognition or other event(s) during the third week of October
• Other ideas?
12
Diabetes Awareness
Caroline Gutierrez
Kaiser Permanente
13

Diabetes Awareness

Diabetes Awareness
What is Diabetes?

Diabetes Awareness
• Diabetes is a life long (chronic) illness
• Over 20 million people have Diabetes
Many are undiagnosed
• Latinos are the number one group at risk

Diabetes Awareness
Diabetes and related conditions
• Type 1
• Type 2
• Pre-Diabetes
• Gestational Diabetes

Diabetes Awareness
• Your body changes
most foods into
glucose (sugar)
• Insulin is a hormone
that helps glucose
move into your cells
• When your body does not make or use enough insulin, glucose cannot get into the cell properly

Diagnosing Diabetes
How do you know you have diabetes?
• Blood sugar 126 mg/dl or higher on two
fasting lab tests
• Blood sugar 200 mg/dl or higher with
symptoms on one random test
• Hemoglobin A1C (HbA1C) of 6.7 or more
Risk Factors for Developing Diabetes
Risk factors you cannot change:
• Age
• Family History
• Ethnicity

Risk Factors for Developing Diabetes
Risk factors you can change:

Risk Factors for Delevoping Diabetes
Risk factors you can change:
• Being overweight
• No regular exercise
• Stress

Risk Factors for Developing Diabetes
Other situations:
• Gestational diabetes
• Delivery of a baby weighing more than 9
pounds
• Illness

Complications of Diabetes
Do you know someone with
complications of diabetes?

Complications of Diabetes
Complications of Diabetes include:
• Cardiovascular Disease
• Kidney Failure
• Loss of Vision
• Neuropathy (nerve damage)
• Amputation

Symptoms of Diabetes
• Fatigue
• Thirst (extreme)
• Urination (extreme)
• Blurred Vision
• Dry, itchy skin
• Hunger (extreme)
• Weight loss (unexplained)
• Poor healing of skin
• Vaginal infections
• No symptoms!

Symptoms of Diabetes
See your doctor!

Managing Diabetes
Basic Diabetes Management
• Eat Healthy
• Monitor blood sugar at home
• Exercise
• Medication

Managing Diabetes
Eat Healthy
• Smaller meals throughout the day
• Avoid junk food
• Do not skip meals
• Control weight

Managing Diabetes
Monitor your blood sugar
• Test twice per day
• Test 2 hours after a meal
• Test more if there is a change in your
routine
• Keep a log to share with your doctor

Managing Diabetes
Exercise
Any exercise is good, but aerobic is best!
Walking Stair climbing
Running Dancing
Cycling Swimming
Managing Diabetes
Exercise
• Start with 5 – 10 minutes per day
• Work up to 30 – 60 minutes per day
• Check with your doctor before you start

Managing Diabetes
Medications
• Oral medications
• Insulin injections

Managing Diabetes
Work with your healthcare team
• Primary Care Doctor
• Diabetes Educator
• Nutrition Educator
Remember you are the captain of the team!

Kaiser Permanente Resources
• Kaiser Permanente Healthy Living
Programs and Health Coaching:
• 1-866-402-4320
• Tobacco Cessation
• Weight loss
• Exercise

Kaiser Permanente Resources
Register on KP.org
• Refill prescriptions
• Get your lab results
• Make routine appointments
• Email your doctor
• Health Risk Assessment

Thank you

Minority Health Jeopardy
Sylvia EstafanHealth Education Administration
38

Lunch
39

Wellness Activity
Erika Siever
Health Education Administration
40

Women’s Health Disparities, Indicators, and Programs
41
Elizabeth Stillwell
Rita SinghalOffice of Women’s Health

Addressing Health Disparities among
Women in Los Angeles County:
The Role of the Office of Women‟s HealthLos Angeles County Department of Public Health
Rita Singhal, MD, MPH,
Medical Director, Office of Women‟s Health
Elizabeth Stillwell, RN
Public Health Education Collaborative
Tuesday, August 3, 2010

Diversity of Women in LA County
• Half of almost 10 million residents are female
• Aging population – 16% are 65+ years, more women than men (12%)
• Over 65% are women of color
• 40% are foreign born
– 77% of foreign born living in the US ≥ 10 years
• Almost 1 in 4 women have less than a high school education
• Over half of women are living at <200% FPL

Health of Women in LA County
• One in 5 women report fair/poor health status
• 21% of women 18-64 years are uninsured
• Leading cause of death and premature death
– Coronary Heart Disease – mortality declined by
34% from 1997 to 2006
• Increasing rates of: obesity, diabetes, high
cholesterol, hypertension
• „All-cancer‟ mortality as high as heart disease
mortality

Question
Women living at <100% FPL fare significantly
poorer compared to other women for all of the
following health indicators EXCEPT?
A – Health status
B – Difficulty accessing care
C – Fruits and vegetables consumption
D – Pap test screening
E – Diabetes

The Dramatic Influence of Poverty
• Most health indicators negatively affected by poverty
– Poorer health status
– More difficulty accessing health care
– Poorer health behaviors
• Highest consumption of fast food, lowest levels of physical activity
– Poorer health outcomes
• Diabetes, Obesity, Heart Disease, Depression
• Direct, linear association for most indicators

34.1
24.8
16.6
7.9
0
5
10
15
20
25
30
35
40
FPL <100% FPL 100-199% FPL 200-299% FPL ≥300%
Pe
rce
nt
Fair/Poor Health Status Among Womenin Los Angeles County by
Federal Poverty Level (FPL)

39.7
64.2
48.2
30.0
52.5
35.4
13.3
38.1
18.7
4.4
23.6
10.9
0
10
20
30
40
50
60
70
Uninsured No Dental Insurance Difficulty Accessing Care
Pe
rce
nt
Insurance and Health Care Access Among Women in Los Angeles County by Federal
Poverty LevelFPL <100% FPL 100-199% FPL 200-299% FPL ≥300%

32.7
13.0
9.6
19.1
23.8
8.0
9.2
16.618.7
10.3
7.6
13.714.5
5.65.2
15.7
0
5
10
15
20
25
30
35
Obesity Diabetes Heart Disease Depression
Pe
rce
nt
Health Conditions Among Women in Los Angeles County by Federal Poverty Level (FPL)
FPL <100% FPL 100-199% FPL 200-299% FPL ≥300%

Social & Physical Environment
• Poor health behaviors among poorest women
– 46% are minimally active or inactive
– Only 13% consume 5+ servings of f & v/day
– 38% eat fast food at least once/week
– 40% drink soda or sweetened drink/day
• Influence of physical environment
– Only 30% report access to fresh fruits & vegetables
– 75% report safe places play for children
– 71% report neighborhoods safe from crime

Question
Latinas fare significantly poorer compared to
every other ethnic groups for all of the following
health indicators EXCEPT?
A – Health status
B – Difficulty accessing care
C – Poverty
D – Education level
E – Obesity

Disparities Among Latinas
• Report the poorest health status among all ethnic groups
• Report poorer access to care
– 1/3 lack health insurance
– 40% report difficulty accessing care
• Contributing Factors
– 75% are living at <200% FPL
– 50% have less than a high school education
• Despite being youngest population
– High rates of obesity and diabetes

20.3 21.3
27.9
18.218.7
30.4
15.9 15.2
22.0
27.0
34.6
41.4
14.1
5.7
13.4
0
5
10
15
20
25
30
35
40
45
Fair/Poor Health Status Uninsured Difficulty Accessing Care
Pe
rce
nt
Health Status and Health Care Access among Women in Los Angeles County by Ethnicity
Los Angeles County Women Asian/Pacific Islander Black Latina White

28.4
23.5
19.5
8.9
28.3
8.1
49.9 49.8
7.2
3.3
0
10
20
30
40
50
60
FPL < 100% Less than HS Education
Pe
rce
nt
Poverty and Education Level Among Womenin Los Angeles County by Ethnicity
Los Angeles County Women Asian/Pacific Islander Black Latina White

Question
Which of the following statements regarding the
health of black women in LA County is FALSE?
A – They have the highest mortality rates of heart
disease and diabetes.
B – One in 5 report smoking cigarettes.
C – They have the highest percentage of having no
regular source of care
D – Over 1 in 4 report experiencing IPV since age 18

Disparities Among Black Women• Highest mortality rates
– Heart Disease, Stroke
– Diabetes
– All Cancers
– Maternal and Infant
• Unique barriers to health
– Smoking
– Communicable diseases
– Exposure to violence
• Report better health care access and health status

135
40
21
133
91
39
13
89
200
59
38
180
104
33 31
109
146
39
16
150
0
50
100
150
200
250
Coronary heart disease Stroke Diabetes All cancers
Ag
e-a
dju
ste
d r
ate
per
100,0
00
Mortality Rates From Chronic Diseases Among Women in Los Angeles County by Ethnicity
Los Angeles County Women Asian/Pacific Islander Black Latina White
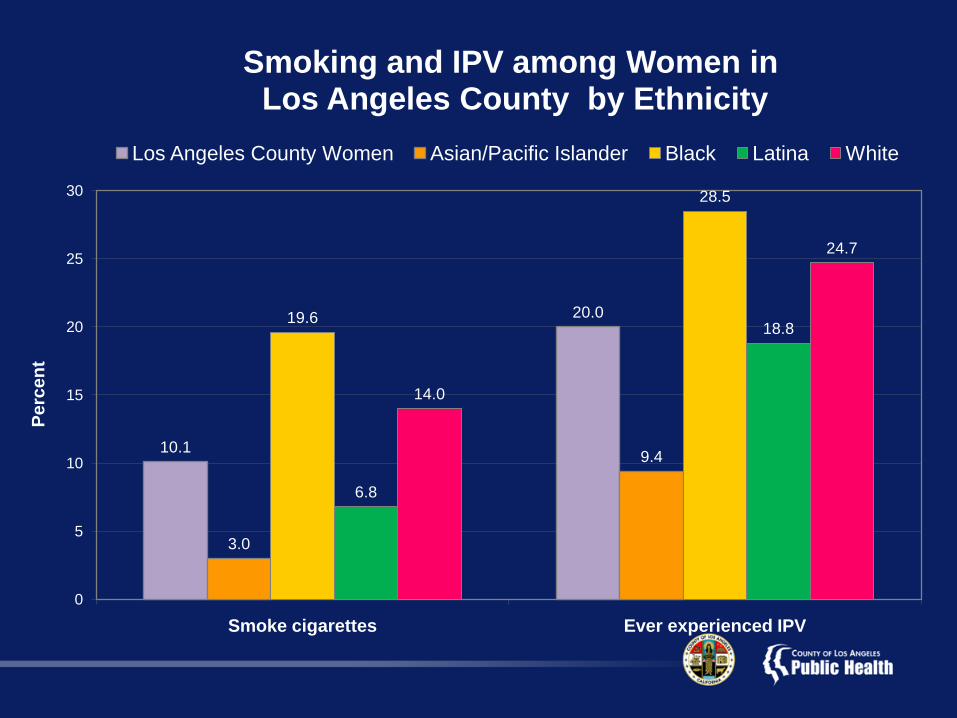
10.1
20.0
3.0
9.4
19.6
28.5
6.8
18.8
14.0
24.7
0
5
10
15
20
25
30
Smoke cigarettes Ever experienced IPV
Pe
rce
nt
Smoking and IPV among Women inLos Angeles County by Ethnicity
Los Angeles County Women Asian/Pacific Islander Black Latina White

Question
Which of the following statements regarding the
health of Asian/Pacific Islander women in LA
County is FALSE?
A –Highest percentage of meeting physical activity
recommendations
B – Less than 1 in 2 have been vaccinated for
pneumonia (only 65 years and older)
C – Almost 1 in 5 have no regular source of care.
D – Lowest rates of cervical, breast and colorectal
cancer screening

Disparities Among Asian/Pacific
Islander Women
• Heterogeneous group – Hidden disparities– Vietnamese women higher rates of poverty
– Korean women lowest rates of self-rated health status
• Important to examine these ethnic groups individually
• Low rates of having a regular source of care and receiving preventive services
• Rates of health insurance above overall rates
• Low physical activity and fruits/vegetable consumption
• Has not translated to poorer health outcomes

84.4
73.7
60.5
69.966.9
52.5
86.7
76.1
70.3
86.7
72.3
54.5
87.1
76.7
65.1
0
10
20
30
40
50
60
70
80
90
100
Pap test in past 3 years Mammo in past 2 years Met CRC screening guidelines
Pe
rce
nt
Receipt of Preventive Screenings Among Women in Los Angeles County by Ethnicity
Los Angeles County Women Asian/Pacific Islander Black Latina White

41.5
18.4
47.6
12.8
45.5
11.8
42.7
14.7
36.9
26.2
0
5
10
15
20
25
30
35
40
45
50
Minimally Active/Inactive 5+ Servings Fruits/Vegetables
Pe
rce
nt
Physical Activity and Fruits/Vegetable Consumption among Women in Los Angeles
County by Ethnicity
Los Angeles County Women Asian/Pacific Islander Black Latina White

Special Health Topics
• Women 65 years and
older
• Women with a
disability
• Uninsured women
• Lesbian and bisexual
women

11.78.9
35.4
2.9
24.4 24.1
41.8
7.4
32.3
41.0
56.7
21.2
0
10
20
30
40
50
60
Fair/Poor Health Status Living with a Disability Minimally Active/Inactive Heart Disease
Pe
rce
nt
Health Indicators for Women in Los Angeles County by Age
Age 18-39 years Age 40-64 years Age 65+ years

16.9
13.4
19.4
7.4
29.0
47.3
30.2
20.8
0
5
10
15
20
25
30
35
40
45
50
Experienced violence Fair/Poor Health Status Obesity Frequent Mental Distress
Pe
rce
nt
Health Indicators for Women in Los Angeles County by Disability Status
Women without Disabilities Women with Disabilities

69.6
26.7
21.6
54.0
35.1
30.3
42.2
68.4
15.3
8.8
43.8
79.1
0
10
20
30
40
50
60
70
80
90
Difficulty Accessing Care
Fair/Poor Health Status Flu Vaccine past year Mammo in past 2 years
Pe
rce
nt
Health Indicators for Women in Los Angeles County by Insurance Status
No Insurance Medi-Cal Private

9.1
18.0
9.6 11.0
70.1
38.0
30.7
24.0
0
10
20
30
40
50
60
70
80
Discrimination due to SO
Delayed Medical Care Current Smoker Major Depression
Pe
rce
nt
Health Indicators for Women in Los Angeles County by Sexual Orientation
Heterosexual Lesbian and Bisexual

Conclusion
• Diverse population with unique health needs
• Chronic diseases represent major disease
burden
• Poverty has a significant impact on all
domains of health and is an important source
of disparities
• Improvements in health lie in improving the
social and physical environment of women

Office of Women‟s Health
• Established October 1998
• To improve the health status of women
• Serve as the focal point for promoting county programs and policies related to women‟s health
• Women‟s Health Policy Council advisory board

Objectives of Office
• Develop a clearer understanding of the health
issues of women
• Prioritize health needs of women with focus on
vulnerable populations
• Develop and implement women‟s health policy
initiatives
• Increase coordination and collaboration between
departments

Work to Date
• Past & Ongoing Projects
– 1-800-Hotline
– Cervical Cancer Prevention and
Education Initiative
– Women‟s Health Mobile Clinic
Outreach Program
– Prevention Matters!
– Heart Disease Risk Assessment
– Health Indicators for Women Reports
– 2007 Women‟s Health Policy Summit

Informing Healthcare Policy
• What are the priorities of Women‟s Health?
– Decreasing health disparities
• What are the key health issues?
– Chronic Diseases
• Heart disease, cancer, depression
– Access to Health Care/Insurance
• Preventive services
– Social and Physical Environment
• Safer and healthier communities
• Critical not to cut services, initiatives, programs that ameliorate disparities

Prevention Matters!• Multi-cultural, multi-lingual umbrella campaign on
prevention, education and screening
• Low-income women, 35 years of age and older
• Reduce the burden of chronic disease
• Focus on heart disease and cancer
• Goals: Raise awareness, increase access to screenings,
promote healthy lifestyles, promote advocacy and policy
opportunities

Campaign Components
• Community Partners network
– >400 Educational, clinical, outreach, advocacy community based organizations
– Serve at grassroots level to bring campaign to constituents
• Community dialogues
– Talking with the health experts; attended by community leaders and health educators
– “Making Data Come Alive” – May 18th
– Woman and Aging/Health Care Reform –October 5th

Campaign Components
• 1-800 Hotline
– Provides information, referrals and appointments in 7 languages
• Heart disease risk assessment
– Web based assessment given to hotline callers
– Tailored education messages based on identified risk factors
• Every Woman for Life
– Education on breast and cervical cancer screening
– Encourage and facilitate appointments
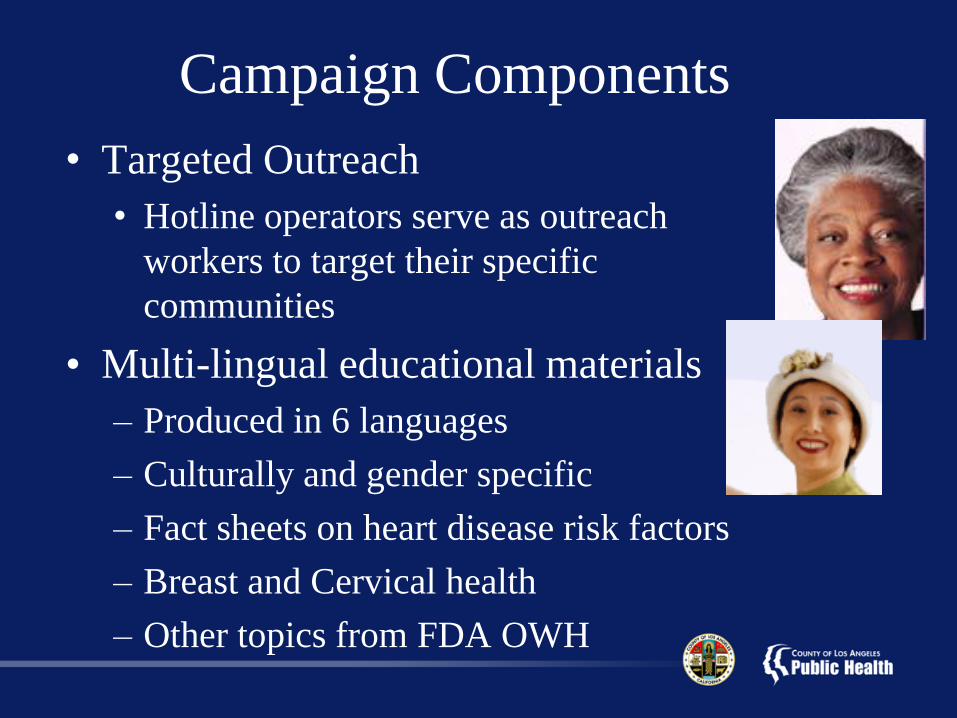
Campaign Components
• Targeted Outreach
• Hotline operators serve as outreach
workers to target their specific
communities
• Multi-lingual educational materials
– Produced in 6 languages
– Culturally and gender specific
– Fact sheets on heart disease risk factors
– Breast and Cervical health
– Other topics from FDA OWH

Summit Implementation
• 2007 Women‟s Health Policy Summit - >400 county/
community stakeholders produced 48 recommendations
• 50 Member Summit Implementation Taskforce
• Hired Implementation Coordinator
• 9 Active Working Groups
– Education and Training
– Women‟s Health Data
– Sexual Orientation and
Gender Identity
– Violence and Health
– Disability and Access
– Women and Aging
– Reproductive Health and
the Environment
– Worksite Wellness
– Adolescence and Health
Relationships

What You Can Do• Promote the 1-800 hotline and it‟s services
• Attend current or future community dialogues
• Participate on Summit Leadership Taskforce committees
• Spread the word about health disparities among women in the County
• Invite community agencies to become community partners

http://publichealth.lacounty.gov/owh/index.htm
Rita Singhal, MD, MPH, Medical [email protected]
626-569-3816
Office of Women’s Health
Elizabeth Stillwell, [email protected]
626-569-3818

80
Upcoming Collaboratives
Date Time Location
September 7 9am – 4pmCalifornia Endowment 1000 N. Alameda Ave, LA 90012Big Sur Room
October 5TBD
TBD

Wrap-Up & Evaluations
Sylvia EstafanHealth Education Administration
81

82
Thank You!

CHS Website Re-Design Committee
83