Embed Size (px)
Citation preview
CHAPTER 20Public Goods and Externalities
How may public goods and externalities
adversely affect the way resources are
allocated by markets and what are the
possible remedies, government regulation
among others, to such impediments to
economic efficiency?
Chapter Outline
20.1 What Are Public Goods?The Free-Rider ProblemApplication 20.1 An Online Horror Tale
20.2 Efficiency in the Provision of a Public GoodApplication 20.2 Promoting Truthful Revelation in ChinaEfficiency in Production and Distribution PatentsApplication 20.3 Napster: Nipping or Nudging Economic Efficiency?
20.3 ExternalitiesExternal CostsApplication 20.4 Traffic Externalities: Their Causes and Some Potential CuresApplication 20.5 Non-Free California FreewaysExternal Benefits
20.4 Externalities and Property RightsApplication 20.6 Radio Waves and Property RightsApplication 20.7 “O Give Me Property Rights . . .”The Coase Theorem
20.5 Controlling Pollution, RevisitedThe Market for Los Angeles Smog
543
Learning Objectives• Explain what economists mean by the term “public goods” and how the free-
rider problem inhibits the provision of the efficient output of such goods.• Define external benefits and external costs and show how their presence
results in nonoptimal output levels for goods characterized by such aspects.• Show how clearly defined and enforced property rights can resolve externality
problems and thereby ensure an efficient outcome.• Demonstrate how air pollution can more efficiently be controlled through the
establishment of an overall industry pollution target and the assignment oftradeable emissions permits to the industry’s firms.
s we have seen in several of this book’s preceding chapters, government interventionin markets may fail to promote economic efficiency. For example, Chapter 10 showed
how rent control and a quota on sugar imports can diminish the total surplus realized bymarket participants as a group. Without discounting the impediments to efficiency that maybe associated with government intervention, this chapter looks at two important reasonswhy markets left to themselves may also not function efficiently: public goods and externali-ties. Public goods are those that benefit all consumers, such as national defense. A publicgood will be undersupplied by a market when consumers cannot be excluded from sharing inits benefits and thus have no incentive to pay for its production.
Externalities are present when all of the costs or benefits of a good are not fully borne bythe participants in the market for it. For example, an oil refinery may not have to pay forsome of the air pollution generated by its production process and may consequently produce
Apublic goodsthose goods that benefitall consumers, such asnational defense
externalitiesthe harmful or beneficialside effects of marketactivities that are notfully borne or realized bymarket participants
544 Chapter Twenty • Public Goods and Externalities •
more oil than is economically efficient. Individuals may not obtain a flu shot if some of thebenefits of the vaccination against such a communicable disease accrue to society at largerather than fully to them.
When public goods or externalities lead markets to generate an inefficient allocation ofresources, government can intervene, at least in theory, with an appropriate policy that willimprove things. This chapter analyzes how public goods and externalities may adversely af-fect the way resources are allocated by markets as well as the remedies, government regula-tion among others, to such impediments to economic efficiency.
20.1 What Are Public Goods?
The term public good, as used by economists, does not necessarily refer to a good provided bythe government. Instead, economists define a public good by the characteristics of the gooditself. Two are important: nonrival consumption and nonexclusion.
A good is nonrival in consumption if, with a given level of production, consumption byone person need not diminish the quantity consumed by others. Although this definitionmay sound peculiar, such goods do exist. Consider a nuclear submarine that reduces the like-lihood of enemy attack. Your property and person are protected, and so are others’. The pro-tection you receive in no way diminishes the extent to which others are protected. Anotherexample is a flood control project that reduces the probability of flood damage. Less flooddamage to one home does not mean more flood damage to another; all persons in a givenarea simultaneously benefit in the form of a reduced likelihood of flooding.
In effect, nonrival consumption means potential simultaneous consumption of a good bymany persons. By contrast, most goods are rival in consumption. For a given level of produc-tion of shoes (or soft drinks, T-shirts, cars, or hamburgers), the more you consume, the less isavailable for others. In these cases consumption is rival because the economic system mustration output among competing (rival) consumers. When a good is nonrival in consump-tion, the good need not be rationed. Once it is produced, the good can be made available toall consumers without affecting any individual’s consumption level.
The second characteristic of a public good is nonexclusion. Nonexclusion means thatconfining a good’s benefits (once produced) to selected persons is impossible, or prohibi-tively costly. Thus, a person can benefit from a good’s production regardless of whether he orshe pays for it. Although the concepts of nonrivalry and nonexclusion often go together,they are distinct. Nonrivalry means that consumption by one person need not interfere withconsumption of others; although a good may be nonrival in consumption, restricting con-sumption to selected persons may still be possible.
For example, when a Web site is posted, anyone with Internet access can go to the Website and view its contents without interfering with another person’s ability to view the samesite. (An exception would be if the site suddenly got a huge number of hits, overloading theserver.) It is possible to deliberately exclude access to a Web site, however, and in fact, it isoften done. The Web site for the Wall Street Journal, for instance, www.wsj.com, includes“Free Content” that may be accessed by anyone. However, only subscribers can access moredetailed information, such as front-page stories from the Journal. Clicking on those areasbrings up the message, “The page you requested is available only to subscribers.” Subscribersmust supply a user number and a password, and nonsubscribers are denied access. The Webillustrates how some things can be nonrival and yet have the possibility of exclusion. Thus,it does not meet the criteria to be a public good.
In contrast, national defense is an example of a good with both characteristics. A givendefense effort protects (or endangers) everyone simultaneously, and to limit the protectionto certain people is impossible. The benefits of defense are thus nonrival to the population,and exclusion of selected persons is infeasible.
nonrival inconsumptiona condition in which agood with a given level ofproduction, if consumedby one person, can also beconsumed by others
nonexclusiona condition in whichconfining a good’sbenefits, once produced,to selected persons isimpossible orprohibitively costly
• What Are Public Goods? 545
A good that is nonrival in consumption and has high exclusion costs creates problems fora market system. Once such a good is produced, many people will automatically benefit re-gardless of whether they pay for it, because they cannot be excluded. As we will see, this fea-ture makes it unlikely that private producers will provide the good efficiently.
The Free-Rider ProblemEven when a public good is worth more to people than it costs to produce, private marketsmay fail to provide it. To see why, consider the construction of a dam that will lessen theprobability of flooding for a community’s residents; the dam is a public good for the resi-dents. It may have a total cost of $1,000,000, and business firms will be willing to build it ifsomeone will provide the funds. If 10 persons live in the community and the benefit of thedam to each person is $200,000, then the total benefit of the dam to all 10 residents is$2,000,000—twice as much as it costs. All 10 people would be better off if each contributed$100,000 to finance construction costs, since each would then receive a benefit valued at$200,000 from the dam.
Even though it is in each resident’s interest to have the dam built, there is a goodchance that it won’t be built if private markets are relied upon to organize the construc-tion. To finance the dam, residents must jointly agree to contribute, but many will real-ize that they get the benefit of the dam once built, regardless of whether they contributetoward its construction. Each resident, therefore, has an incentive to understate what the damis worth in an effort to secure the benefit at a lower, or zero, cost. If enough people behavethis way—as a free rider—voluntary contributions will be insufficient to finance thedam and it won’t be built. Viewing the provision of public goods as a prisoner’s dilemma,free riding is the equivalent of “cheating” in the prisoner’s dilemma game discussed inChapter 14.
When public goods are involved, free riding is rational, but it hinders the ability of pri-vate markets to cater efficiently to the demand for a public good. In the example just dis-cussed, enough people could conceivably contribute so that the dam would be financed byvoluntary agreements. With just 10 people involved, only a small number need to agree tocontribute. The severity of the free-rider problem, however, varies with the number of peo-ple involved. The larger the number of people receiving benefits from a public good, the lesslikely that voluntary cooperation will ensure its provision.
As the group size increases, it is more likely that everyone will behave like a free rider, and thepublic good will not be provided. To illustrate, let’s change our example slightly and assumethat a dam now benefits 1,000 people, each by $2,000. (Note that the total benefit is still$2,000,000, just as before.) In this case, faced with deciding whether or how much to con-tribute voluntarily, each person will realize that one single contribution has virtually no ef-fect on whether the dam is built. Put differently, the outcome depends mainly on what theother 999 people do, and whether any one person contributes will not affect the others’ de-cisions. In this case each person gets the same benefit whether or not any contribution ismade, and choosing not to contribute is the most rational behavior. Because this is true foreveryone, few people will contribute, and the good likely will not be provided.
Many real-world examples provide evidence of free-rider behavior with public goods. Aparticularly clear-cut example occurred in 1970 (before mandatory pollution controls)when General Motors tried to market pollution control devices for automobiles at a priceof $20. The emission controls would have reduced the pollution emitted by 30 to 50 per-cent. Pollution abatement is, of course, a public good, at least over a certain geographicarea. It is reasonable to suppose that the benefits of a 30 to 50 percent reduction in auto-mobile pollution far outweighed the cost of $20 per car. Yet GM withdrew the device fromthe market because of poor sales. This example illustrates the large-group free-rider prob-lem at work. Everyone might have been better off if all drivers used the device, but it was
free ridera consumer who has an incentive tounderestimate the valueof a good in order tosecure its benefits at alower, or zero, cost
Application 20.1
n 2000, horror writer Stephen King became thefirst major author to self-publish online.1 King
asked readers to pay him a dollar for each chapter of aserial e-novel, titled “The Plant,” they downloaded and
I warned that he would not post new installments unlesshe received payments for at least 75 percent of thedownloads. Voluntary contributions for King’s e-novelappeared to be plagued by the free-rider problem as only46 percent of the downloads were paid for. Kingpromptly called it quits on publishing “The Plant” on-line in order to work on other, more conventional booksfrom which it is easier to exclude non-payers.
546 Chapter Twenty • Public Goods and Externalities •
not in the interest of any single person to purchase it because the overall level of air qualitywould not be noticeably improved as a result of any one individual’s action.
When the benefits of a public good are nonrival over a large group, private markets prob-ably will not provide it. Even if some amount of the public good is provided through thecontributions of a few people, it will be at a suboptimal quantity. This result is true evenwhen it is in the interest of people to have the good provided—that is, even when the bene-fits exceed the costs. Competitive markets cannot in general supply public goods efficiently.This fact provides a major justification for considering governmental alternatives. In thedam example of 1,000 persons, for instance, the government could levy a tax of $1,000 oneach person and use the $1,000,000 in tax revenue to finance the dam. Each person wouldbe made better off by this policy, receiving $2,000 of benefit from the dam at a cost of$1,000 in taxes. The government expenditure of $1,000,000 on the dam would lead to amore efficient allocation of resources than reliance on private markets.
Application 20.1 An Online Horror Tale
1“A Stephen King Online Horror Tale Turns Into a Mini-Disaster,”New York Times on the Web, November 29, 2000.
social marginalbenefit curvethe demand curve for apublic good
20.2 Efficiency in the Provision of a Public Good
What is the efficient output of a public good? As usual, we must compare the marginal bene-fit and marginal cost associated with different levels of output. The marginal cost of a publicgood is the opportunity cost of using resources to produce that good rather than others, justas it is in the case of the nonpublic, or private, goods discussed in previous chapters. Becauseof the nonrival nature of the benefits of a public good, though, its marginal benefit differsfrom that of a private good. With a good like a cheeseburger, the marginal benefit of produc-ing an additional unit is the value of the cheeseburger to the single person who consumes it.With a public good like defense, the marginal benefit is not the marginal value to any oneperson alone because many people benefit simultaneously from the same unit. Instead, wemust add the marginal benefits of every person who values the additional unit of defense,and the resulting sum indicates the combined willingness of the public to pay for more de-fense—that is, its marginal benefit.
Figure 20.1 shows how we derive the demand, or social marginal benefit curve for a publicgood like submarines. For simplicity, assume that only two people, Ted and Jane, benefit fromthe defense services of submarines. Each person has a demand curve for submarines, shown as dT
and dJ. These demand curves are derived from each person’s indifference curves, just as wouldtheir demand curves for a private good. Recall that the height of a consumer’s demand curve in-dicates the marginal benefit of another unit of the good. To derive the social, or combined, demandcurve, we must add the marginal benefits of the two consumers. Geometrically, the combined de-
• Efficiency in the Provision of a Public Good 547
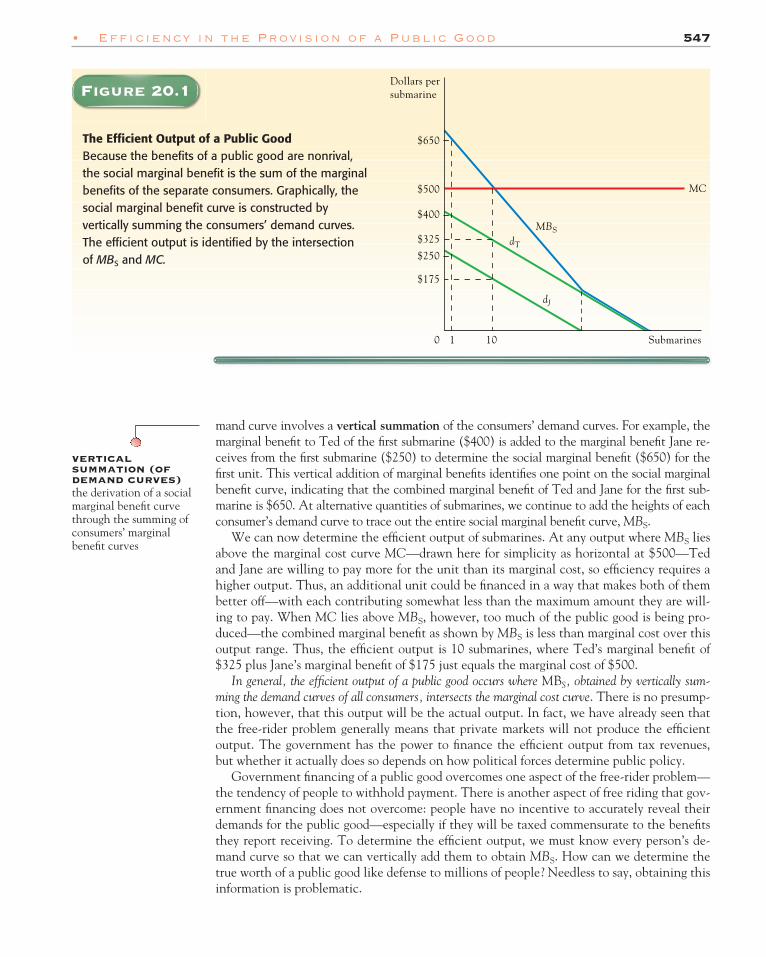
mand curve involves a vertical summation of the consumers’ demand curves. For example, themarginal benefit to Ted of the first submarine ($400) is added to the marginal benefit Jane re-ceives from the first submarine ($250) to determine the social marginal benefit ($650) for thefirst unit. This vertical addition of marginal benefits identifies one point on the social marginalbenefit curve, indicating that the combined marginal benefit of Ted and Jane for the first sub-marine is $650. At alternative quantities of submarines, we continue to add the heights of eachconsumer’s demand curve to trace out the entire social marginal benefit curve, MBS.
We can now determine the efficient output of submarines. At any output where MBS liesabove the marginal cost curve MC—drawn here for simplicity as horizontal at $500—Tedand Jane are willing to pay more for the unit than its marginal cost, so efficiency requires ahigher output. Thus, an additional unit could be financed in a way that makes both of thembetter off—with each contributing somewhat less than the maximum amount they are will-ing to pay. When MC lies above MBS, however, too much of the public good is being pro-duced—the combined marginal benefit as shown by MBS is less than marginal cost over thisoutput range. Thus, the efficient output is 10 submarines, where Ted’s marginal benefit of$325 plus Jane’s marginal benefit of $175 just equals the marginal cost of $500.
In general, the efficient output of a public good occurs where MBS, obtained by vertically sum-ming the demand curves of all consumers, intersects the marginal cost curve. There is no presump-tion, however, that this output will be the actual output. In fact, we have already seen thatthe free-rider problem generally means that private markets will not produce the efficientoutput. The government has the power to finance the efficient output from tax revenues,but whether it actually does so depends on how political forces determine public policy.
Government financing of a public good overcomes one aspect of the free-rider problem—the tendency of people to withhold payment. There is another aspect of free riding that gov-ernment financing does not overcome: people have no incentive to accurately reveal theirdemands for the public good—especially if they will be taxed commensurate to the benefitsthey report receiving. To determine the efficient output, we must know every person’s de-mand curve so that we can vertically add them to obtain MBS. How can we determine thetrue worth of a public good like defense to millions of people? Needless to say, obtaining thisinformation is problematic.
The Efficient Output of a Public GoodBecause the benefits of a public good are nonrival,the social marginal benefit is the sum of the marginalbenefits of the separate consumers. Graphically, thesocial marginal benefit curve is constructed byvertically summing the consumers’ demand curves.The efficient output is identified by the intersectionof MBS and MC.
Figure 20.1
verticalsummation (ofdemand curves)the derivation of a socialmarginal benefit curvethrough the summing ofconsumers’ marginalbenefit curves
Figure 20.1
Application 20.2
n the early 1900s, the government of China usedthe value of a citizen’s house and land-holdings as a
proxy to determine the tax levied for benefits derived bythe citizen from the public goods provided by the govern-ment. To promote truthful reporting by citizens of thevalue of their property, the Chinese government em-
I ployed a creative enforcement mechanism. It reserved theright to purchase a citizen’s property at the value of theproperty reported by the citizen for tax reasons. Any in-centive to understate property values for tax reasons thuswas counteracted by the potential that one’s propertycould be confiscated at a loss by government authorities.
548 Chapter Twenty • Public Goods and Externalities •
For example, to obtain the efficient output level of a public good such as the one depictedin Figure 20.1, the government can tax people according to the heights of their reportedmarginal benefit curves. Thus, for 10 submarines, Ted and Jane are taxed $325 and $175 perunit, respectively. The total amount paid in taxes ($500 per submarine) is just sufficient tocover the marginal cost of producing an additional submarine at the efficient output of 10.
Where citizens are taxed according to their reported marginal benefit curves, however,they have an incentive to understate their benefits. For example, Jane may be tempted tosay that she gets no benefit from submarines (and thus pays no taxes) and free ride on anypayments made by Ted—since any submarines Ted pays for through taxes also benefitJane. Ted has the same incentive to understate the benefit he gets from submarines. Un-derstatement of demand implies suboptimal provision of the public good.
Application 20.2 Promoting Truthful Revelation in China
Efficiency in Production and DistributionIn Chapter 19, we pointed out that there are three conditions for efficiency. These condi-tions also apply to public goods. So far, we have emphasized only the condition for an effi-cient level of output. A second condition is that the output be produced by using the leastcostly combination of inputs. In Figure 20.1, that condition is implicit in the assumptionthat a marginal cost of $500 is the minimum cost necessary to produce a submarine. Thethird condition relates to the efficient distribution of the good among consumers. For a pri-vate good this condition requires an equality of marginal rates of substitution. But how is apublic good rationed efficiently?
With a public good there is no rationing problem. If 10 submarines are produced, both Tedand Jane simultaneously benefit, and the benefit to one in no way diminishes the benefit tothe other. For example, suppose it were possible in some hard-to-imagine way to have Tedprotected by 10 submarines but Jane protected by only 5. In other words, if exclusion werepossible, would there be any advantage in excluding Jane from the services of all 10 sub-marines? The answer is no, because when 10 submarines are available, Jane’s receiving theservices of only 5 does not make any more submarines available for Ted. Consequently, Janeis harmed, and no one benefits. By definition, this outcome is clearly inefficient.
Recall our definition of a public good as one characterized by nonrival consumption andnonexclusion. When a good has both characteristics, it would be impossible to exclude any-one from its benefits, even if we wanted to. What about a good with nonrival benefits whereexclusion is possible? The analysis above suggests that it is inefficient to exclude anyone even ifwe could. Before accepting that as a general rule, let’s examine an important public policyissue dealing with a good where benefits are nonrival but exclusion is possible.
• Efficiency in the Provision of a Public Good 549
PatentsAs explained in Chapter 11, a patent grants temporary legal monopoly power to an inven-tor. A patent gives the inventor the right to make and sell some new product or to use somenew production process for a period of 17 years. But what do patents have to do with the ex-otic world of nonrival benefits and nonexclusion? Surely, you say, a vibrating toilet seat(patent number 3,244,168, granted in 1966) is not a public good.
Admittedly, most of the products granted patents are not themselves public goods. Butwhat about the knowledge required to make, for example, a vaccine to prevent AIDS? Thisknowledge of “how to do it” has nonrival benefits. Once the knowledge exists, any numberof people can use it without interfering with each other’s use. One person’s use of this spe-cial knowledge does not leave less for someone else. Simultaneous consumption of knowl-edge is therefore possible, but could people be excluded from its use? Whether exclusion ispossible depends on the type of knowledge involved, but in some cases the use of knowledgecan be prohibited if producing or selling its tangible embodiment is made illegal. For exam-ple, if it is illegal for you to manufacture and sell the AIDS vaccine, you would be effectivelyexcluded from using the knowledge of how to make it. This is exactly what patents do. Theyexclude all but the inventor from making use of the knowledge he or she produced.
Thus, at least some types of knowledge have nonrival benefits, but exclusion is possible. Nowlet’s consider efficiency in resource allocation in connection with knowledge. Although newknowledge is sometimes produced by accident, much of it results from expenditures on researchand development. In making such expenditures, the efficient output of new knowledge requiresthat resources be devoted to producing it and is accomplished by equating the vertically summedmarginal benefits with marginal cost, just as in Figure 20.1. Yet once the knowledge exists, usingit efficiently requires that no one be excluded. Both aspects of efficiency are important.
To see how this discussion relates to patents, suppose that the inventor of an AIDS vac-cine could not exclude others from copying and selling the product. Would the inventor de-vote a million dollars to develop such a vaccine? If this investment were successful, otherswould immediately copy and sell it, driving the price down to a level that just covered pro-duction cost and leaving no way for the inventor to recoup research costs. For this reason in-ventors would have little financial incentive to produce the knowledge in the first place,even though that knowledge might be highly beneficial. Too few resources would be de-voted to research and development, because those who bear the costs could not charge oth-ers who use the knowledge for the benefit they receive. In other words, private marketswould not produce the efficient quantity of the public good, new knowledge.
Patents can encourage a greater, more efficient output of new knowledge. Because inven-tors receive a temporary monopoly right, they get a return above the cost of producing newproducts to compensate for the research costs. The prospect of this gain stimulates inventorsto devote resources to the production of new knowledge. This example illustrates how pri-vate markets can produce a good with nonrival benefits when exclusion is possible.
Encouraging a greater, more efficient output is the beneficial result of using patents, butthere is a cost. Once the new knowledge is produced, it is inefficiently employed, since somepeople are legally excluded from using it. That is, the AIDS-preventing vaccine will be mo-nopolistically produced for 17 years, which inefficiently restricts the use, or consumption, ofthe vaccine. This cost must be weighed against the gain—namely, that the vaccine mightnever have been developed without the incentive created by patent protection.
Private markets can produce goods with nonrival benefits when exclusion is possible, asthe patent example shows. Private markets, however, do not function with perfect efficiencybecause of the exclusion of some people who could potentially benefit. Whether it is possi-ble to devise a better arrangement is uncertain and requires a more detailed case-by-caseevaluation. In any event, the degree of inefficiency in market provision for a nonrival goodwill be far less when exclusion is possible than when it is not. The combination of the

Application 20.3
opyrights are intended to encourage the produc-tion of music, literature, and art by granting cre-
ators an exclusive right to publish, sell, and reproducetheir works for a set time period. Like patents, copy-rights require a dynamic versus static efficiency trade-off. This is because while copyrights promote theproduction of music, literature, and art from a dynamicperspective, once a work has been produced, copyrightsalso exclude some people who might benefit from hear-ing a particular song or reading a given novel.
Napster provides a recent example of the (sometimessubtle) efficiency considerations associated with copy-rights.2 The brainchild of 18-year-old college drop-outShawn Fanning, Napster was launched in 1999 as an Inter-net service letting users download songs at no charge fromother users’ hard drives. The first example of a peer-to-peer(P2P) Internet service, Napster acquired 25 million userswithin a year of its inception and quickly drew the atten-tion of the $40-billion-in-annual-revenues music industry.
Represented by the Recording Industry Associationof America (RIAA), the music industry argued thatNapster facilitated the theft of musical property, hadcost the industry more than $300 million in lost sales asof the year 2000, and should be shut down. The bandMetallica and rapper Dr. Dre brought lawsuits againstNapster for copyright infringement. In support of the ar-gument that Napster would diminish the incentive toproduce music, the RIAA presented evidence from re-tail-store tracker SoundScan. The evidence showed thatcompact disc sales fell in the year 2000 by 13 percent atstores within one mile of Wired magazine’s Top-40“wired” colleges and those near colleges with Napster-induced network overloading problems.
Not all artists, however, opposed the continuedgrowth of Napster. In fact, the band Limp Bizkit and
C rapper Chuck D. argued that Napster would spur salesrevenue by providing a try-before-you-buy service to in-dividuals who might not otherwise become exposed to aparticular artist’s work. Chuck D. pointed to overallcompact disc sales growing by $500 million in 2000, thesame year that witnessed the dramatic increase in usersof Napster and rival P2P service providers such asGnutella and Aimster.
Indeed, it could be argued that the lower reproduc-tion and distribution costs brought about by the Internetand technological innovations such as Napster may,over the long run, represent more of an opportunitythan a threat to the music industry. By analogy, econo-mists Hal Varian and Carl Shapiro of the University ofCalifornia at Berkeley point out that, contrary to lead-ing to the demise of the movie industry as initially pre-dicted, video cassette recorders have proven to be aboon to it. Similarly, the Internet and technological in-novations such as Napster promise to broaden the mar-ket for music. Industry sales and profits thus mayincrease as long as producers are adept at setting theterms and conditions that maximize the value of theirintellectual property—that is, as long as exclusion re-mains possible.
The music industry succeeded in getting Napster shutdown through a court order in July 2001 because Nap-ster operated central servers that tracked and controlledthe transfer of files between users. However, new filesharing services, such as KazaA, Grokster, and Mor-pheus, soon sprang up and the same legal objections thatfelled Napster could not be raised. This is becauseKazaA, Grokster, and Morpheus provide software thatindividual digital-music fans can use to access MP3 filesfrom other users with the same software. Given thatKazaA, Grokster, and Morpheus had a combined total of70 million users by the fall of 2002 (three times as manyas Napster in its heyday), the challenges they pose for,or perhaps, the opportunities they bring to the music in-dustry appear to be significant.
550 Chapter Twenty • Public Goods and Externalities •
nonrival and nonexclusion characteristics creates more severe problems for market provi-sion, and in this case a more active role for government may be required. No one has deter-mined, for example, how national defense could be provided by private markets.
Application 20.3 Napster: Nipping or Nudging Economic Efficiency?
2This application is based on: Carl Shapiro and Hal R. Varian, Infor-mation Rules (Boston: Harvard Business School Press, 1999); and “TheNew Napsters,” Fortune, August 12, 2002, pp. 115–116.
• Externalities 551
20.3 Externalities
Sometimes, in the process of producing or consuming certain goods, harmful or beneficialside effects called externalities are borne by people not directly involved in the market ex-changes. These side effects are called external benefits when the effects are positive and ex-ternal costs when they are negative. The term externality is used because these effects arefelt beyond, or are external to, the parties directly involved in generating the effects.
Immunization against a contagious disease is a good example of a consumption activitythat involves external benefits. For instance, if Barney decides to get an inoculation, he ben-efits directly because his chance of contracting the disease is reduced. This benefit is not theexternal benefit, since Barney himself receives it. The external benefit is the one other peo-ple receive in the form of a reduced likelihood they will catch the disease because an inocu-lated Barney is less likely to transmit it. The central point is that Barney’s decision aboutwhether to be inoculated is unlikely to be swayed by how his inoculation affects other peo-ple: he is concerned mainly with the effect on his own health. Thus, the benefit his inocula-tion creates for others is external to, and doesn’t influence, his decision.
Pollution provides a classic example of an external cost. Driving a car or operating a fac-tory with a smoking chimney pollutes the atmosphere that others breathe; thus, the opera-tion of a car or factory imposes costs on people not directly involved in the activity.Similarly, operating a boom box or motorcycle produces a level of noise that is often irritat-ing to those nearby, just as the noise level of an airplane may be annoying to people livingnear airports. Congestion is also an external cost: when a person drives during rush hour, theroad becomes more congested, not only for this person but for other drivers as well.
At a formal level, externalities and public goods are very similar, and recognizing the similar-ity makes understanding externalities easier. If Barney is inoculated against a contagious disease,there are nonrival benefits: both he and others simultaneously benefit from his inoculation. Inaddition, to exclude other people from the benefits would be very difficult. When a person pro-duces new knowledge, this action confers an external benefit on others who can use the knowl-edge profitably. Pollution is also like a public good (except here it should perhaps be called apublic bad) since there are nonrival costs. A large number of people are simultaneously harmedif the atmosphere is polluted, and, obviously, to have the atmosphere in a particular area pol-luted for some and not for others would be difficult. The sole distinction between externalitiesand public goods is that external effects are unintended side effects of activities undertaken forother purposes. People don’t pollute because they enjoy breathing polluted air; they simply wantto transport themselves conveniently in a car from one place to another.
Externalities are likely to lead to an inefficient allocation of resources, just as public goods do.Market demands and supplies will reflect the benefits and costs of market participants only;the benefits and costs that fall on others will not be taken into account in determining re-source allocation. For example, Barney may decide against being inoculated because the im-provement in his health is not worth the extra cost. If the benefits of improved health forothers are added to his benefit, the combined benefit might exceed the cost. In this caseBarney’s decision to not be inoculated would represent an inefficient use of resources.
External CostsA closer look at a case involving external costs will help clarify the issues involved. Supposethat firms in a constant-cost competitive industry produce some type of waste materials as abyproduct of their activities. They dispose of these wastes by dumping them in a nearbyriver. From the firms’ point of view, this method of disposal is the least costly. People livingdownstream, however, suffer, because the river no longer serves recreational purposes. Thefirms impose external costs on those living downstream. Because these external costs are nottaken into account by the firms, the allocation of resources is inefficient.
externalbenefitspositive side effects ofordinary economicactivities
external costsnegative side effects ofordinary economicactivities
552 Chapter Twenty • Public Goods and Externalities •
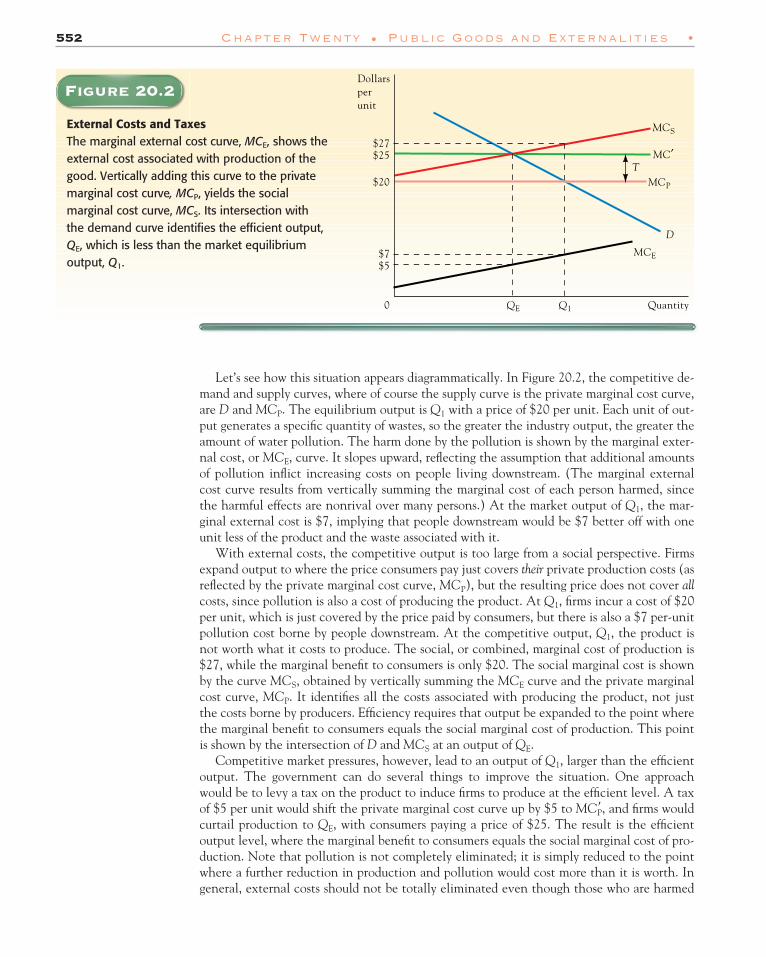
Let’s see how this situation appears diagrammatically. In Figure 20.2, the competitive de-mand and supply curves, where of course the supply curve is the private marginal cost curve,are D and MCP. The equilibrium output is Q1 with a price of $20 per unit. Each unit of out-put generates a specific quantity of wastes, so the greater the industry output, the greater theamount of water pollution. The harm done by the pollution is shown by the marginal exter-nal cost, or MCE, curve. It slopes upward, reflecting the assumption that additional amountsof pollution inflict increasing costs on people living downstream. (The marginal externalcost curve results from vertically summing the marginal cost of each person harmed, sincethe harmful effects are nonrival over many persons.) At the market output of Q1, the mar-ginal external cost is $7, implying that people downstream would be $7 better off with oneunit less of the product and the waste associated with it.
With external costs, the competitive output is too large from a social perspective. Firmsexpand output to where the price consumers pay just covers their private production costs (asreflected by the private marginal cost curve, MCP), but the resulting price does not cover allcosts, since pollution is also a cost of producing the product. At Q1, firms incur a cost of $20per unit, which is just covered by the price paid by consumers, but there is also a $7 per-unitpollution cost borne by people downstream. At the competitive output, Q1, the product isnot worth what it costs to produce. The social, or combined, marginal cost of production is$27, while the marginal benefit to consumers is only $20. The social marginal cost is shownby the curve MCS, obtained by vertically summing the MCE curve and the private marginalcost curve, MCP. It identifies all the costs associated with producing the product, not justthe costs borne by producers. Efficiency requires that output be expanded to the point wherethe marginal benefit to consumers equals the social marginal cost of production. This pointis shown by the intersection of D and MCS at an output of QE.
Competitive market pressures, however, lead to an output of Q1, larger than the efficientoutput. The government can do several things to improve the situation. One approachwould be to levy a tax on the product to induce firms to produce at the efficient level. A taxof $5 per unit would shift the private marginal cost curve up by $5 to and firms wouldcurtail production to QE, with consumers paying a price of $25. The result is the efficientoutput level, where the marginal benefit to consumers equals the social marginal cost of pro-duction. Note that pollution is not completely eliminated; it is simply reduced to the pointwhere a further reduction in production and pollution would cost more than it is worth. Ingeneral, external costs should not be totally eliminated even though those who are harmed
MC�P,
Figure 20.2Figure 20.2
External Costs and TaxesThe marginal external cost curve, MCE, shows theexternal cost associated with production of thegood. Vertically adding this curve to the privatemarginal cost curve, MCP, yields the socialmarginal cost curve, MCS. Its intersection with the demand curve identifies the efficient output,QE, which is less than the market equilibriumoutput, Q1.

Application 20.4
hile an individual motorist’s decision to drive atrush hour may cost only a few extra minutes of
commuting time, the external congestion costs imposedby such motorists as a group can add up to millions ofdollars per year in a major urban area. As noted in Ap-plication 1.3, an average driver in the Los Angeles areaspends 56 hours a year stuck in traffic at a cost of $1,000per person in wasted time and gas.3
Beyond congestion costs, rush-hour commuters payfor only a fraction of what they impose on the commu-nity at large in terms of road construction and pollutioncosts. For example, significant road construction subsi-dies exist to better accommodate the needs of rush-hourdrivers. According to one study, the subsidy totals $500annually per rush-hour commuter in the Los Angelesarea. Overall, California state gasoline taxes amount toonly one-sixtieth of the estimated cost that rush-hourdrivers impose on the community at large in terms ofcongestion, road construction, and pollution costs.
Some examples from overseas suggest mechanisms bywhich motorists could be held more fully accountable forthe burden they impose on a community. Hong Kong, forexample, undertook an electronic road pricing experi-ment in the mid-1980s. Cars were equipped with an elec-tronic license plate (at a cost of $20 each) making themautomatically detectable to computerized sensors locatedthroughout the city’s streets. A computer recorded theirmovements and tallied the tolls exacted on different citystreets, billing car owners monthly based on streets trav-eled, days of the week, and times of day.
Singapore’s efforts to control traffic are legendaryfor promoting free-flowing roads and cleaner air and
W also for their draconian methods of enforcement.Whereas the neighboring capitals of Southeast Asiasuch as Bangkok, Thailand, and Jakarta, Indonesia, arenotorious for their smog and day-long gridlock, Singa-pore’s policies keep the skies clean and rush-hour traf-fic delays to a minimum. Among the policies is arequirement that cars entering the city center pay anElectronic Road Price (ERP) that varies in amount de-pending on the time of day. For example, the ERP is:$2.50 from 8–9 AM; $2 for 9–9:30 AM and 6–6:30 PM;$1.50 from 5:30–6 PM; $1 from 9:30–10 AM, 12:30–5:30PM, and 6:30–7 PM; $0.50 from 7:30–8 AM; and free atall other times.
The government of Singapore also adds on morethan 200 percent in duties to every auto’s purchaseprice. Moreover, every car owner must pay a sizable an-nual road use tax (analogous to a registration fee in theUnited States) to operate a vehicle. The road tax on asmall Toyota is $800. When even the sizable costs ofpurchasing an automobile failed to curb the growth incar ownership, Singapore began limiting the absolutenumber of cars that can be sold in any year to 50,000.The quota is designed to keep new purchases to 4 per-cent of the total cars on the road.
The top speed limit on the island of Singapore is setat 45 miles per hour, to promote safe driving andthereby minimize the chance of accident-related trafficjams. Taxis are required to have a chime built into theirdashboards that sounds continuously and annoyinglywhen the speed limit is violated. Trucks are mandatedto have a yellow light on their roofs that is activatedwhen the speed limit is exceeded. Police, as well as hid-den cameras hooked up to remotely operated radars, areemployed to catch traffic violators. If speeding is caughton camera, a ticket is sent to the violator by mail withindays of the infraction.
• Externalities 553
might like to see them reduced to zero. Instead, the gain from reduced pollution to peopledownstream must be weighed against the cost to consumers of reduced output.
In this example we assumed that each unit of output is invariably associated with a cer-tain amount of pollution. In the more general case the amount of pollution per unit of out-put is variable. Automobiles, for example, can produce various amounts of emissions. Whenthis situation is the relevant case, as it usually is, the tax should be levied on pollution itself,not on the product. Then, as discussed in Chapter 8, firms have an incentive to curtail pol-lution—the external cost—in the least costly manner.
Application 20.4 Traffic Externalities: Their Causesand Some Potential Cures
3This example is based on “In Singapore Driving a Car is Easy butOwning a Car Isn’t,” Los Angeles Times, August 17, 1991, pp. A1 andA14; and www.gov.gg/lta/2_ERP/Main.html.
554 Chapter Twenty • Public Goods and Externalities •
Application 20.5
n recent decades, the price of highway construc-tion in the United States has skyrocketed while
the state and federal gasoline tax revenues used to fi-nance such construction have diminished (because ofimprovements in the fuel efficiency of automobiles). Inlight of these trends, questions have begun to emergewhether American drivers will be able to continue rely-ing on the government to provide free use of a suffi-ciently uncongested highway system that keeps pacewith a growing population.
To address the dilemma, Orange County in SouthernCalifornia began building a series of toll roads in themid-1990s that could be a model for future highways.4
The plan is for the tool roads to be paid for by the dri-vers who use them. That is, individual drivers confront asystem of “congestion prices” that vary from 25 cents to$5 per use depending on both the length of the particu-
I lar toll road and the amount of other traffic on the road.The congestion prices are adjusted continuously, ease ofuse is promoted through automation (cars can beequipped with transponders that automatically bill dri-vers’ accounts for usage and thus do not require stops attoll plazas), and carpooling is encouraged (through aprice of zero).
Critics liken the experimental toll roads to a politeform of “highway robbery.” One policymaker has be-moaned the attempt to chip away at the concept of freeroads, one of the last things shared equally by the richand the poor. He goes on to argue, “I don’t like specialroads being developed for richer people, while ordinarypeople end up with potholes and congestion.”
Most drivers, however, seem to accept the concept asa means to ensure continuation of the Californialifestyle they have come to expect. As one legal secre-tary who uses the toll road almost daily puts it, “I loveit . . . It’s expensive, but when you measure that againstthe frustration of being stuck on the freeway, it’s worthit. It’s cheaper than therapy.”
Application 20.5 Non-free California Freeways
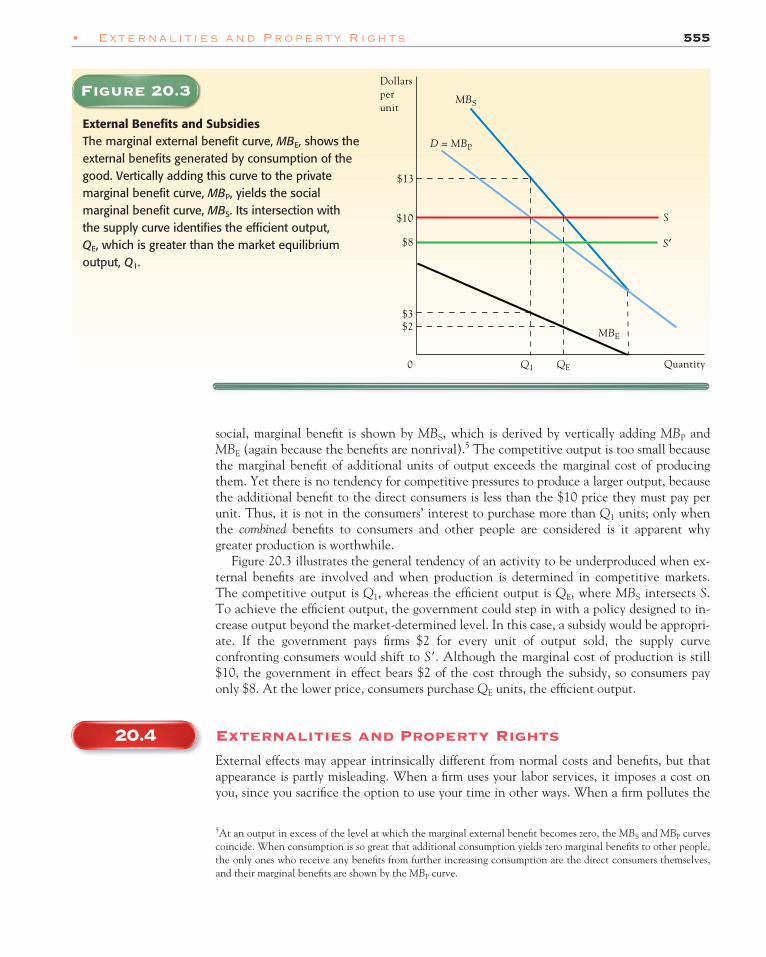
External BenefitsExternal benefits can be analyzed in a similar fashion. Let’s suppose that the consumption ofsome product generates external benefits—that is, people other than the direct consumers ofthe product benefit from its consumption. Some economists have argued that education maybe such a product if a better-educated citizen not only makes himself or herself better off inthe process but also the society of which he or she is a part. In Figure 20.3, the competitivesupply and demand curves where demand identifies the private marginal benefit, are S andMBP. The private marginal benefit curve, MBP, reflects the marginal benefits of the goodonly to the consumers of the product, and its intersection with the supply curve determinesthe market equilibrium with an output of Q1 and a price of $10. The marginal external ben-efit curve, MBE, shows the external benefits per unit of consumption. This curve is derivedby vertically summing the demands of people other than the immediate consumers of theproduct. Vertical summation is used because people other than direct consumers simultane-ously receive benefits—that is, the benefits are nonrival.
When external benefits exist, the competitive output is inefficient. At Q1, the marginalbenefit to consumers of another unit of the product is $10, as given by the height of the MBP
curve. If another unit is consumed, people other than the direct consumers also receive amarginal benefit valued at $3, as shown by the height of MBE at Q1. Thus, the combinedmarginal benefit for all those affected by consumption of another unit is $13, and thisamount exceeds the $10 marginal cost of producing an additional unit. The combined, or
4This application is based on “Tolls Seen as Road to Expansion,” LosAngeles Times, March 23, 1997, pp. A3 and A29.
• Externalities and Property Rights 555
social, marginal benefit is shown by MBS, which is derived by vertically adding MBP andMBE (again because the benefits are nonrival).5 The competitive output is too small becausethe marginal benefit of additional units of output exceeds the marginal cost of producingthem. Yet there is no tendency for competitive pressures to produce a larger output, becausethe additional benefit to the direct consumers is less than the $10 price they must pay perunit. Thus, it is not in the consumers’ interest to purchase more than Q1 units; only whenthe combined benefits to consumers and other people are considered is it apparent whygreater production is worthwhile.
Figure 20.3 illustrates the general tendency of an activity to be underproduced when ex-ternal benefits are involved and when production is determined in competitive markets.The competitive output is Q1, whereas the efficient output is QE, where MBS intersects S.To achieve the efficient output, the government could step in with a policy designed to in-crease output beyond the market-determined level. In this case, a subsidy would be appropri-ate. If the government pays firms $2 for every unit of output sold, the supply curveconfronting consumers would shift to S�. Although the marginal cost of production is still$10, the government in effect bears $2 of the cost through the subsidy, so consumers payonly $8. At the lower price, consumers purchase QE units, the efficient output.
20.4 Externalities and Property Rights
External effects may appear intrinsically different from normal costs and benefits, but thatappearance is partly misleading. When a firm uses your labor services, it imposes a cost onyou, since you sacrifice the option to use your time in other ways. When a firm pollutes the
Figure 20.3
5At an output in excess of the level at which the marginal external benefit becomes zero, the MBS and MBP curvescoincide. When consumption is so great that additional consumption yields zero marginal benefits to other people,the only ones who receive any benefits from further increasing consumption are the direct consumers themselves,and their marginal benefits are shown by the MBP curve.
Figure 20.3
External Benefits and SubsidiesThe marginal external benefit curve, MBE, shows theexternal benefits generated by consumption of thegood. Vertically adding this curve to the privatemarginal benefit curve, MBP, yields the socialmarginal benefit curve, MBS. Its intersection withthe supply curve identifies the efficient output, QE, which is greater than the market equilibriumoutput, Q1.
river passing by your home, it imposes a cost on you, since you sacrifice the option to use theriver for recreation. These costs are not fundamentally different: they both imply that youare unable to use economic resources in other, valuable, ways. Why, then, do we call pollu-tion, but not the firm’s employment of your labor services, an external cost?
One glaring difference in these two cases is that the firm must pay you for your labor ser-vices, but you are not compensated when the river is polluted. Since the firm must pay youat least enough to persuade you to give up alternative uses of your time, it will have an in-centive to take this cost into account in deciding whether to employ you; that is, when thefirm bears a direct cost associated with the use of a resource, that cost enters into its produc-tion decision. But if the firm can use the river in a way that harms you without compensat-ing you for the damage, it has no reason to consider this cost in making its outputdecision—the firm treats the river as a zero-priced input.
Why must the firm pay to use your labor services but not to use the river? Fundamentally,the answer to this question involves property rights to the use of economic resources. You havewell-defined and legally enforceable rights to your own labor services, meaning that no one canuse them without securing your permission, which is normally acquired by paying you. Thereare, however, no such clearly defined property rights to the water that flows past your home. Infact, ownership of the river and who has the right to decide how it will be used are uncertain.Consequently, the firm can use it as a convenient garbage dump. If you had property rights topure water flowing past your home, the firm would have to buy your permission to dump wastein the river. The firm might still pollute, but would do so only if the gain from polluting wasgreater than the compensation required to be paid. The situation would then be just analogousto the case of labor services. Pollution would no longer be a cost external to the firm’s calcula-tions; the cost would be taken into account, and the allocation of resources would be efficient.
Reasoning along these lines suggests that externalities are intimately connected with theway property rights are defined. Indeed, in most cases dealing with externalities, we can usu-ally trace the source of the problem to an absence or inappropriate assignment of propertyrights. Accordingly, the government may not need to use taxes, subsidies, or regulation atall; it may only have to define and enforce property rights, and the resulting market ex-changes will produce an efficient resource allocation.
As an example, imagine a beautiful beach on the California coast and suppose that noone owns it, just as no one owns the river. How will this scarce economic resource be used?It is not beyond fancy to conceive of masses of people crowding the beach trying to enjoythe sand, sun, and surf. Radios could blare, dune buggies roar up and down the beach, dirtbikes spray sand, litter lie strewn across the beach, and surfboards crash into swimmers. Ex-ternalities would be rampant.
Most would agree that this is not an efficient use of scarce oceanfront property, but be-cause no one owns it, no one has an incentive to see the beach used in the most valuableway. The situation is far different when someone has property rights to the beach. In thatcase, use of the property will be guided by whoever pays the most for its use—that is, by whobenefits most. The owner may still use the property as a beach, but now it will be operateddifferently. Admission might be charged, which will diminish the overcrowding that reducesthe attractiveness of the nonowned beach. The owner might enforce rules regarding radios,litter, surfboards, and so on, further enhancing the benefits to consumers. In short, the ex-ternal cost is no longer external when someone owns the beach. The owner has an incen-tive to see that the beach yields as much benefit to consumers as possible, since they willthen pay more for its use.
The beach example is hypothetical, but it helps explain why some highways, parks, andbeaches are overcrowded and inefficiently utilized. “Publicly owned” property is, in effect,sometimes owned by no one, in the sense that no one has the incentive and the right to seethat it is used in the most valuable way.
556 Chapter Twenty • Public Goods and Externalities •
Application 20.6
adio began to be used commercially near the be-ginning of the twentieth century. In the early years
there was no government involvement at all. Anyonewho wanted to broadcast a message could build or buy atransmitter and broadcast on any frequency. The resultwas described by one observer as follows:
The chaos . . . as more and more enthusiastic pio-neers entered the field of radio was indescribable.Amateurs crossed signals with professional broad-casters. Many of the professionals broadcast on thesame wavelength and either came to a gentlemen’sagreement to divide the hours of broadcasting orblithely set about cutting one another’s throats bybroadcasting simultaneously. Listeners thus experi-enced the annoyance of trying to hear one programagainst the raucous background of another.6
The market could not function properly because noone owned the resources involved—the individual wave-
R lengths. The “chaos” could have been avoided by creat-ing legally enforceable property rights in wavelengthsand letting the market determine who would use the var-ious frequencies.
The Federal Radio Commission (FRC) was estab-lished in 1927 to assign and enforce property rights infrequencies. It was succeeded by the Federal Communi-cations Commission (FCC) in 1934. Eventually, the twoagencies ended up taking a more active role in regulatingthe broadcast spectrum than advocated by most econo-mists. For example, instead of assigning and enforcingproperty rights to the spectrum based on the willingnessof various broadcasters to pay for it, the regulatory agen-cies set aside specified amounts of bandwidth for varioustypes of uses (that is, a certain amount of bandwidth forradio broadcasting, VHF television broadcasting, UHFtelevision broadcasting, and eventually services such ascellular telephones). Moreover, license awards and theapproval of license sales came to be based on the extentto which broadcasters were deemed by the governmentregulatory agencies to serve the “public interest” ratherthan just economic efficiency.
• Externalities and Property Rights 557
Application 20.6 Radio Waves and Property Rights
6Ronald H. Coase, “The Federal Communications Commission,” Jour-nal of Law and Economics, 2 No. 2 (October 1959), pp. 1–40.
Application 20.7
he importance of well-defined and legally enforce-able property rights as a mechanism to avoid exter-
nalities is illustrated by the different fates of buffalo andcow herds in the late 1800s. In the case of the buffalo,property rights were not well defined and legally en-forceable. They were, however, in the case of cow herds.The result was predictable and has been recounted inthe following poem by Nobel Prize-winning economist,Ken Boulding:
T “Ode to Property Rights”
The buffalo, nobody’s propertyWent o’er the plains, clippity cloppityIn thunderous herds, where now only birdsFly and rabbits go hippity, hoppity.
The cow, now, is kept on the farmAnd flourished and came to no harmFor its owners to thriveHad to keep it aliveSo property worked like a charm.
Application 20.7 “O Give Me Property Rights . . . ”
558 Chapter Twenty • Public Goods and Externalities •
The Coase TheoremThese examples suggest that the assignment of property rights can make an important con-tribution to resolving issues involving externalities—but who is to have exactly what rightto use the resource in question? Should a factory have the right to discharge smoke into theatmosphere, or should a nearby resident have the right to pure air? A case can certainly bemade that both of these parties have a reasonable claim to use the atmosphere for their ownpurposes, yet giving the resident the right to clean air denies the factory the right to use asmokestack, and vice versa.
Ronald Coase addressed this issue in one of the most widely read papers in the history ofeconomics.7 Coase developed his analysis by considering a rancher and a farmer with adjoin-ing properties. The rancher’s cattle occasionally stray onto the farmer’s property and destroysome of the crops—an external cost associated with cattle raising if this cost is not properlytaken into account. Now suppose the farmer has the right to grow crops in a trample-freeenvironment. The rancher would then be legally liable for the damage caused by the stray-ing cattle. Since the rancher will have to compensate the farmer for the crop damage, thecost of straying cattle will become a direct cost to the rancher and will be taken into ac-count in the rancher’s production decision. An efficient outcome will result, probably oneinvolving fewer straying cattle.
This conclusion is familiar, but Coase went further and argued that even if the rancher werenot liable for damages, an efficient outcome would still result! This situation corresponds to giv-ing the rancher the right to allow his or her cattle to stray. Coase explained that the farmerthen has an incentive to offer to pay the rancher to reduce the number of straying cattle be-cause a reduction in crop damage increases the farmer’s profit. The harm done by straying cattlenecessarily implies that the farmer will be willing to pay something to avoid that harm. Anagreement would therefore be struck that would reduce cattle straying to the efficient level.
As far as efficiency is concerned, the Coase theorem states that whether the farmer or therancher is initially assigned the property rights doesn’t matter. As long as the rights are clearly de-fined and enforced, bargaining between the parties can ensure an efficient outcome. The distributionaleffects, though, depend on the exact definition of property rights. If the rancher is liable, therancher will compensate the farmer; alternatively, if the rancher is not liable, the farmer willpay the rancher to reduce the cattle straying. In both cases cattle straying and crop damage arereduced to the efficient level, but different people bear the cost and secure the benefit.
Simply assigning property rights, however, will not resolve all externality problems. Inthe case discussed earlier, a firm pollutes a river and many people living downstream areharmed. If downstream residents are given the right to have clean river water, would bar-gaining between parties lead to an efficient level of water pollution? Most likely not. This isbecause thousands of people are affected by the pollution, and a firm would have to negoti-ate an agreement with all of them simultaneously to be allowed to pollute. Whenever the ef-fects are nonrival over a large group and exclusion is not feasible, the free-rider problem hinders theprocess of achieving agreement among all concerned. The negotiation process likely would be socostly and time consuming as to become a practical impossibility. Consequently, with suchan assignment of property rights, there would be no pollution in the river—but that may beas inefficient as (or perhaps even more inefficient than) allowing the firm to pollute freely.
Our earlier conclusion that markets would be inefficient is correct, therefore, in the casewhere the external effects simultaneously fall on many people. Assigning property rights cansolve externality problems when there are small numbers of parties involved but not as read-ily when there are large numbers, because of the free-rider problem. Many issues of great im-portance, such as defense, pollution, and police protection, are large-group externalities or
Coase theoremthe idea that as long asproperty rights are clearlydefined and enforced,bargaining between twoparties can ensure anefficient outcome
7Ronald H. Coase, “The Problem of Social Cost,” Journal of Law and Economics, 3 No. 2 (October 1960), pp. 1–45.

• Controlling Pollution, Revisited 559
public goods, and private markets are thus unlikely to function effectively in these areaswithout some form of government intervention.
20.5 Controlling Pollution, Revisited
Perfect competition ensures efficiency in industry output if demand and supply curve heightsreflect the full marginal benefits and costs associated with a particular product. There arecases, however, where assuming that demand and supply curve heights reflect a product’s fullmarginal benefits and costs is not valid. Oil refineries, for example, may not be fully ac-countable for the costs associated with their productive activities. The refineries, that is,may not have to pay for the air pollution caused by their operations and imposed on sur-rounding communities.
As we saw earlier in this chapter, when demand and supply curve heights do not reflect aproduct’s full marginal benefits and costs, the industry output attained by perfect competi-tion is generally not efficient. Still, even if an industry does not attain efficiency in outputbecause certain benefits and costs are external to the decisionmaking of consumers andfirms, perfect competition results in efficiency in production. The industry output that isproduced, in other words, is produced at lowest possible cost even though it may not be theefficient output.
To see how competition ensures production efficiency even if output efficiency is not at-tained, reconsider the case of two oil refineries first introduced in Chapter 8. Refineries Aand B are located in the Los Angeles basin. Suppose they impose air pollution costs thatthey do not have to pay for on their surrounding communities. As a result, the firms’ indi-vidual output decisions are based on only part of the costs associated with their productiveactivities and (as we saw in Section 20.3) the realized industry output is not efficient.
Policymakers may seek to ensure that the refineries account for the costs of their air pol-lution by levying a tax per unit of air pollution emitted. The tax creates an incentive foreach refinery to curtail pollution, because the refinery saves the amount of the tax per unitof pollution not emitted. If reducing pollution by one unit costs the refinery less than thetax, the refinery has an incentive to engage in pollution abatement.
The appropriate tax policymakers should levy per pollution unit to ensure output effi-ciency may, of course, be difficult to determine. Regardless of the amount of the tax, how-ever, the total amount of pollution abatement across all refineries in response to the tax willbe produced at lowest possible cost (will achieve efficiency in production) if perfect compe-tition prevails.
Say that a tax of $3,000 per unit of air pollution emitted is imposed on refinery A. Figure20.4 shows how such a tax would affect the level of air pollution. As in Chapter 8, pollutionis measured from right to left, and the refineries’ marginal cost curves for pollution abate-ment are shown as MCA and MCB. (Ignore refinery B for the moment.) A tax of $3,000 perunit of pollution can be shown as a horizontal line at $3,000. A refinery’s total tax liability is$3,000 times the number of units of air pollution. If refinery A continues to pollute at its ini-tial level, 0P1 (when there was no pollution tax), it will have to pay a tax equal to 0T($3,000) times 0P1, which is the area 0TT1P1.
The tax gives refinery A an incentive to curtail pollution, because each abatement unitsaves $3,000 in taxes. Looked at from left to right, the horizontal line T1T is like a demandcurve for pollution abatement: It shows a gain in net revenue of $3,000 per unit of abatementproduced. Thus, refinery A faces a horizontal demand curve for abatement, and its marginalcost curve indicates the cost of abatement. To maximize profit, the refinery has a strong in-centive to curtail pollution. Specifically, if the refinery can eliminate a unit of pollution forless than $3,000, doing so adds more to net revenue (reducing taxes by $3,000) than it adds

560 Chapter Twenty • Public Goods and Externalities •
to cost. In the interest of profit, refinery A will curtail pollution to 0X1 (producing P1X1 inabatement), where the marginal cost of abatement exactly equals the $3,000 per-unit tax.Cutting back further is not worthwhile because the cost of more abatement exceeds the taxsaving. With pollution of 0X1 refinery A still pays total taxes of 0TNX1, but this sum is signif-icantly less than the tax cost associated with the initial pollution level 0P1.
8
Now let’s turn to refinery B. The same analysis is relevant for refinery B, which has an in-centive to cut back pollution to 0X2, where its marginal cost of abatement equals the $3,000per-unit tax. Note what this means: refinery A and refinery B are both operating at an abate-ment level where marginal cost equals $3,000. Their marginal costs are the same, which im-plies that the total amount of abatement of 350 units (P1X1 � 300 � 150 � 150 units byrefinery A plus P2X2 � 250 � 50 � 200 units by refinery B) is achieved in the least costlyway. And this outcome happens without the government’s knowing either refinery’s mar-ginal cost curve. By applying the same tax to both refineries, the government gives each re-
A Tax on PollutionA per-unit tax on pollution makes refineries competitive producers of pollutionabatement. With a tax of $3,000 per unit of pollution, refinery A produces P1X1 abatementunits (0X1 pollution units), and refinery B produces P2X2 abatement units (0X2 pollutionunits).
8This analysis does not show how the pollution tax affects the refinery in its product market. Of course, the tax in-creases production cost and shifts the cost curves upward. To be accurate here, we should explicitly assume that thetax is not so large that it becomes unprofitable for the refinery to stay in business.
Figure 11.2Figure 20.4
• Controlling Pollution, Revisited 561
finery the same incentive to curtail pollution. The result is efficient coordination of their in-dependent production decisions.
To better understand why the total cost of achieving 350 abatement units is minimizedby relying on incentives and competitive market forces, consider a reallocation of abate-ment units among the two refineries. For example, consider what happens if refinery A pro-duces 50 additional units and refinery B produces 50 fewer units (so combined outputremains unchanged). Refinery A’s production cost goes up by the sum of the marginal costof each unit from 151 to 200, shown by area X1NRX. Refinery B’s production cost falls bythe sum of the marginal cost of each unit it ceases to produce, shown by area XULX2. Be-cause refinery A’s cost increase exceeds refinery B’s cost saving (as can be seen in Figure 20.4by recalling that the widths of the shaded areas are equal), the total cost of producing 350abatement units is higher under such a reallocation. Similar reasoning shows that any otherway of having the refineries produce a total of 350 abatement units results in a higher totalproduction cost than that achieved by the competitive refineries individually choosing theirprofit-maximizing outputs.
The foregoing discussion indicates why many economists favor taxation as a pollutioncontrol strategy. Notwithstanding the difficulty of determining the “appropriate” level of thetax that will result in efficiency in output (a tax that equals the marginal external costs asso-ciated with pollution), a pollution tax effectively creates market incentives for firms to re-duce pollution in the least costly manner and thereby ensures efficiency in production.Moreover, the size of the tax can be changed to regulate the amount of pollution: a largertax per unit will reduce pollution further.
In the United States, most environmental policies rely on a command-and-control ap-proach: regulations and quantity limitations rather than taxes. Many economists have beencritical of these non-market-oriented policies, in part because they believe the taxation ap-proach can achieve the same results at lower cost. And the taxation approach is more than atheorist’s pipe dream. Germany, for example, has successfully used pollution taxes to regu-late waste discharge into the Ruhr River for over 50 years.
The Market for Los Angeles SmogAn alternative market-oriented approach to controlling pollution involves the setting of anoverall industry pollution level, with each firm receiving permits to emit a certain amount ofpollution units and allowing firms to exchange their permits. This Coasean approach has re-cently been adopted by policymakers in an attempt to control smog in the Los Angelesbasin. Tradable permits to pollute have been issued to each of the 390 companies producingfour or more tons of emissions annually. The overall emission level allowed through the per-mits is set below the existing level and will be further reduced each year so that by the year2004, nitrogen oxides are cut by 75 percent and sulfur oxides by 60 percent. Pollution per-mits are allocated across firms more or less according to their existing emissions.
The recently established L.A. smog market allows an overall emission target to beachieved in the least costly manner. To see why, suppose that in our simple example thegoal is to reduce air pollution by 350 units (the same reduction achieved by a tax of $3,000per emission unit) and that the two refineries are issued tradable permits to emit 100 pollu-tion units each (200 total units across the two refineries). As shown in Figure 20.4, with nopollution control whatsoever, 550 pollution units would be produced—300 by refinery A(0P1) and 250 by refinery B (0P2).
Under the tradable-permit scheme, the potential exists for mutual gains from trade be-tween the two refineries. This is because at its allotted 100 emission units, refinery A’s mar-ginal abatement cost (TA) exceeds refinery B’s abatement cost (TB). Since, at the margin,refinery A is willing to pay more to increase its emission (cutting its abatement costs TA)than refinery B needs to be paid to decrease its emission (incurring abatement costs TB),

562 Chapter Twenty • Public Goods and Externalities •
there is room for the two refineries to exchange pollution permits for a price somewhere be-tween TA and TB, making both sides better off.
Of course, the exact price at which the permits will be exchanged will depend on, amongother things, the bargaining abilities of the two refineries. Moreover, the bounds around theexchange price will narrow as more permits are sold by refinery B to refinery A. The boundsaround the exchange price will narrow because as refinery A buys more permits, the maxi-mum amount it is willing to pay per permit declines from TA; the cost of abatement to refin-ery A decreases as it pollutes more and moves to the left along its marginal cost ofabatement curve. In addition, as refinery B sells additional permits, the minimum amount itneeds to be paid for each rises from TB; the cost of abatement to refinery B rises as it pollutesless and moves right along its marginal cost curve.
How many permits will be exchanged? The total will be 50 in the case depicted in Figure20.4. When refinery B sells this many permits to refinery A, their marginal costs of abate-ment are identical. Refinery B, because it has the lower marginal cost of abatement curve,ends up emitting 0X2 (50) pollution units, abating P2X2 (250 � 50 � 200) units, and havinga marginal cost of abatement of T1. Refinery A ends up emitting 0X1 (150) pollution units,abating P1X1 (300 � 150 � 150) units, and having a marginal cost of abatement of T1. Theprice for the fiftieth exchanged pollution permit equals $3,000 since it is perfectly con-stricted by the two refineries’ marginal costs of abatement (that is, T1).
By generating the “proper” marginal permit price (“proper” in terms of achieving anoverall level of 200 pollution units and 350 units of pollution abatement) and confrontingboth refineries with that price, the L.A. smog market ensures attainment of the overall emis-sion target in the least costly way. If, instead of allowing permit trading, regulators limitedeach refinery to 100 pollution units, the total abatement cost would be higher. That effi-ciency in production would not be served through such a command-and-control device isevidenced by the fact that in Figure 20.4 the cost to refinery A of reducing its pollution from150 to 100 units (area X1NRX) exceeds the cost to refinery B of reducing its pollution from100 to 50 units (area XULX2). The same overall emission target of 200 units can thus beachieved at lower total cost if refinery A is allowed to emit 150 units and refinery B is per-mitted 50 units.
In sum, market-based pollution control mechanisms such as tradable emission permits orper-emission-unit taxes promote efficiency in production. Although such mechanisms donot necessarily guarantee the attainment of output efficiency, they do ensure that any abate-ment amount produced by an industry is produced at lowest possible cost.
The cost savings associated with market-based pollution control mechanisms can be sub-stantial in the real world. For example, economists have estimated that the L.A. smog mar-ket saves $1,000 per year in abatement costs per resident household relative to a policy ofmandating proportional, across-the-board reductions in emissions and not allowing pollu-tion permit trading.9 Significant abatement cost savings could also be realized if emissiontrading programs were more broadly implemented on a national as well as internationalbasis. For example, according to the consulting firm Charles River Associates, the cost forreducing greenhouse-gas emissions according to the Kyoto Protocol (a greenhouse-gas re-duction treaty signed in 1997 as part of the United Nations Framework Convention on Cli-mate Change) is estimated to be $280 per ton if no trading in emissions permits is allowed.By contrast, the estimated cost drops to $60 per ton if a completely open market in emis-sions permits is authorized.10
9David Harrison, Jr. and Albert L. Nichols, Market-Based Approaches to Reduce the Cost of Clean Air in California’sSouth Coast Basin (Cambridge, Mass.: National Economic Research Associates, November 1990).10“Letting the Free Market Clear the Air,” Business Week, November 6, 2000, pp. 200–204.

• Review Questions and Problems 563
Among some of the other market-oriented pollution control mechanisms with whichpolicymakers have experimented over the past three decades are “bubbles,” through which afirm can treat an existing plant with multiple emission sources as if it were a single source—a bubble allows a firm to adjust its various emission sources to meet an overall emission tar-get for the plant in the least costly manner; banking of pollution abatement credits, wherebya firm can hold onto emission reduction credits for future use or sale; and offsetting—amajor new emission source in regions failing to meet national air quality standards can com-pensate for its added pollution with emission reductions of an equal or greater amountachieved through internal or external trades. All of these market-based approaches promisesignificant efficiencies in production over the more commonly employed command-and-control mechanisms for dealing with pollution.
Summary
• Public goods are characterized by nonrival consump-tion and nonexclusion. When a good has these two char-acteristics, the free-rider problem arises and makes itdifficult to ensure that the efficient quantity will be pro-duced through voluntary arrangements.• An efficient output of a public good is that at whichthe vertically summed demand curves of individuals inter-sect the marginal cost, or supply, curve.• Externalities are the harmful or beneficial side effects ofmarket activities that are borne or realized by people notdirectly involved in the market exchanges. They representcosts or benefits that are not incorporated in the private
supply and demand curves that guide economic activity.Once again, the result is an inefficient resource allocation.• In some cases it is only necessary to define propertyrights appropriately for externalities to be taken into ac-count. In other cases, principally those involving largenumbers of people, this solution will likely not work andother types of government policies should be considered.• With regard to accounting for the externalities associ-ated with air pollution, government policies that can pro-mote efficiency in production include per-emission-unittaxes and tradable permits to emit a certain amount ofpollution.
Review Questions and Problems
Questions and problems marked with an asterisk have solutions given inAnswers to Selected Problems at the back of the book (pages 584–585).
20.1. What two characteristics define a public good? Which ofthe following are public goods: parks, police services, welfarepayments to the poor, production of energy, space exploration?
20.2. Why will private markets produce an inefficient output ofa public good? Explain how the efficient level of a public good isdetermined.
20.3. What is meant by the “free-rider” problem? How does itrelate to the provision of public goods? How can it be overcome?
*20.4. Suppose there are three consumers—two “hawks” andone “dove.” The dove receives negative benefits from (is harmedby) national defense, but the hawks value defense. Show graphi-cally how an efficient output of defense is determined in thiscase.
20.5. From a public good perspective, critique the use of patents.
20.6. “External costs are bad, and government intervention toreduce them is justified. External benefits, however, are good,and there is no reason for government intervention in thiscase.” Evaluate these statements.
20.7. Education is sometimes cited as a source of external bene-fits. In what way, if at all, does your receiving a college educa-tion benefit other people?
*20.8. Suppose that property rights change so that students nolonger have exclusive rights to the use of lecture notes they takein classes. (All notes are collected after class, and anyone canborrow notes for 24 hours on a first-come, first-served basis.)How would this policy affect note taking, class attendance, andstudying? Would students learn more or less? What does this ex-ample illustrate about the relationship between externalities andproperty rights?
564 Chapter Twenty • Public Goods and Externalities •
20.9. A piece of state legislation proposes banning smoking innearly all public facilities and private businesses. The major ar-gument for the bill is that it “is needed to protect nonsmokersfrom the health hazards of cigarettes.” Prepare an evaluation ofthe economic case for this legislation. (Assume that smoking ad-versely affects the health of nearby nonsmokers.)
*20.10. “When public goods or externalities lead to inefficientresource allocation, government intervention is justified.” Is it?Why?
20.11. In an otherwise competitive economy there is an exter-nality in the form of pollution. Show what the private marketequilibrium implies in terms of where we are on (or inside of)the welfare frontier.
20.12. In Figure 20.2, suppose the government placed a quotainstead of a tax on the output of the product that limited outputto a maximum of QE. Would this policy achieve an efficient al-location of resources?
20.13. In discussing Figure 20.3, the text states that the privateequilibrium output, Q1, is inefficient. By definition, inefficiencyis supposed to mean that everyone could be better off with a dif-ferent allocation of resources. Does the subsidy shown in the di-agram benefit everyone, including the taxpayer who pays tofinance it? If not, what type of policy could be used that wouldbenefit everyone?
20.14. A miracle drug that cures obesity is developed and pro-duced competitively at a constant cost to producers of 10 centsper dose. The companies that produce the drug, however, dis-charge chemical wastes resulting from the production processinto the nation’s rivers. The damage to the economy in terms ofreduced commercial and recreational use of the waterways is es-timated to be 1 cent per dose. The social demand for the drug isQ � 1,000,000 � 10,000P, where Q indicates the number ofdoses produced and P is the price per dose measured in cents.a. How much of the miracle drug is produced? At what price?
Give both numerical and graphical answers.b. An economist testifies before Congress that obesity cures are
being overproduced and sold too cheaply. What price andquantity do you think the economist would advocate? Whatis she likely to estimate as the cost to the economy of thesupposed overproduction? Give numerical and graphicalanswers.
c. The economist argues that a tax should be placed on everyunit of output that is accompanied by a waste discharge.What size tax per unit of output would an efficiency-seekingeconomist advocate? With this tax, what would the priceand output be for the miracle drug? Give both numerical andgraphical answers.
20.15. Suppose that in the preceding problem drug producersinvent another production process that discharges no waste andcan be used at a constant cost of 10.6 cents per dose.a. What will the price and output of the miracle drug be if the
tax advocated in part (c) of the preceding problem is imposed?
b. What will the price and output be if the no-discharge processhad a cost of 11.4 cents per dose?
c. Suppose that the production cost under the new process risesto 13 cents per unit and producers are forbidden to use theoriginal waste-discharging process. What price and outputwill result? By the economist’s criteria, are there appropriateamounts of obesity cures and pollution? What is the dead-weight loss, if any, that results? Give both numerical andgraphical answers.
20.16. Comment on the following hypothetical remarks by theCongressional representatives who questioned the economist inProblem 20.14. Do you agree or disagree? (You don’t have toplay the role of an economist in your answer.)
Senator Anthony: “No value can be placed on the benefit thisdrug brings to humanity.”
Senator Loeb: “The cure for obesity should be provided freelyto all who need it.”
20.17. Distinguish between efficiency in production and effi-ciency in output. Can an industry achieve efficiency in produc-tion and still produce at an inefficient output level? Explain.
20.18. Explain why efficiency in production is not realized ifboth refineries in Figure 20.4 are limited to emitting 100 pollu-tion units each.
20.19. A clothing factory is located downwind from a coppersmelting plant. The copper smelting plant emits particulatesinto the air that cause $100,000 in damage per year to the cloth-ing factory in terms of fabric discoloration. The plant couldeliminate its emissions of particulates by installing a superiorscrubbing technology at a cost of $50,000 per year. Existing reg-ulations do not prohibit the emission of these particulates. Theonly way to remedy the inefficiency associated with the emis-sions is through government intervention. True or false? Explainyour answer.
20.20. The defense services provided by submarines are a pub-lic good. Suppose that the equation relating the marginal benefitTed derives from the quantity of submarines produced (Q) isMB � 600 � 10Q. The equation relating the marginal benefitJane derives from submarines is MB � 400 � 10Q. The mar-ginal cost of producing each submarine is a constant $400.a. If Ted and Jane are the only two individuals who benefit
from the defense services provided by submarines, what is theefficient output of submarines?
b. Without any coordination between Ted and Jane and/orgovernment intervention, what will be the output of sub-marines? Explain your answer. What will be the size of anyresulting inefficiency?
c. Suggest a taxing scheme to ensure the attainment of effi-ciency in the provision of submarines.
d. Suppose that the defense services afforded by submarines arestill nonrival in consumption but that the cost of excluding ademander is zero. If submarines are produced by a monopolistpracticing third-degree price discrimination (that is, a pro-

• Review Questions and Problems 565
ducer that charges different prices to different demanders),what will be the profit-maximizing output and price that themonopolist will charge Ted and Jane? How does your answercompare to that in part (a)?
20.21. Much public debate has focused on the external costsassociated with smoking. Explain why there may also be an ex-ternal benefit from smoking in that smokers die at an earlier agethan nonsmokers.
20.22. The United Nations Kyoto Protocol of 1997 requiresmost industrial nations to reduce their carbon dioxide and othergreenhouse-gas emissions during the ensuing decade to about 5percent of 1990 levels. Explain why such a policy is inefficient.
20.23. As cellular or mobile phones proliferate rapidly, withmore than 100 million U.S. users, so do complaints about cellphone rudeness. “No Cell Phones” signs are popping up all over.Restaurants, theaters, libraries, museums, and doctors’ officeshave banned the devices. Explain why, using the concept of ex-ternalities.
20.24. As of the late 1990s, there had been instances of Rus-sians shooting at Japanese, Tunisians shooting at Italians, andPortuguese shooting at Spaniards. This is just a partial list of theheated conflicts occurring on the high seas between aggressivefishing fleets and well-armed navy and coast guard vessels jeal-ously protecting a lucrative and declining resource. At thesource of the conflict appears to be the inability to define prop-erty rights to fish. Explain why.
20.25. The military alliance NATO (North Atlantic TreatyOrganization) was formed during the Cold War to prevent mili-tary action against its member states by the former SovietUnion. During its heyday, the seven countries belonging toNATO with the largest gross national products (GNPs) spent
7.8 percent of their combined GNP on defense. The seven na-tions with the smallest GNPs spent only 4.3 percent. Provide aneconomic explanation for this phenomenon.
20.26. When film crews rent a house to shoot a scene for amovie, external costs may be imposed on neighboring house-holds in the forms of occupied/blocked parking spaces, brightlights, and explosions. Relying on the Coase theorem, explainwhy neighbors have been known to go to some unusual lengths(revving up lawn mowers or stereos, turning on leaf blowers,blowing foghorns, and banging garbage pail lids against irongates) in cases such as this, especially when filmmakers are aboutto start shooting a scene.
20.27. In 2002, some firms in the music industry began sellingCDs designed to make it impossible for buyers to copy musicfrom the CDs to their personal computers, exchange songs overthe Internet, or transfer material from the CDs to portable MP3players. Will the spread of such copy-protection technology pro-mote efficiency? Explain why or why not.
20.28. Because the federal government covered the lion’s shareof the costs, Los Angeles built the 17.4-mile-long Red Line sub-way system in the 1990s at a cost of $4.7 billion ($270 millionper mile). The fully allocated costs are estimated to be $1.15 perpassenger mile, whereas the fare is $0.07 per mile for the 17.4-mile-long Red Line journey. Using a graph, explain why outputefficiency was or was not served by the subway’s construction.(Note: to cover the city’s portion of the construction costs, localbus fares were raised, and daily bus ridership declined by more inthe wake of the fare increase than the number of residents tak-ing the Red Line on an average day.)
20.29. Should entrance fees be charged at our nation’s parks?Explain why or why not?