Embed Size (px)
Citation preview

Georgia State University Georgia State University
ScholarWorks @ Georgia State University ScholarWorks @ Georgia State University
Public Management and Policy Dissertations
12-7-2012
Public Financing of Risky Early-Stage Technology Public Financing of Risky Early-Stage Technology
Reynold V. Galope Georgia State University
Follow this and additional works at: https://scholarworks.gsu.edu/pmap_diss
Recommended Citation Recommended Citation Galope, Reynold V., "Public Financing of Risky Early-Stage Technology." Dissertation, Georgia State University, 2012. https://scholarworks.gsu.edu/pmap_diss/46
This Dissertation is brought to you for free and open access by ScholarWorks @ Georgia State University. It has been accepted for inclusion in Public Management and Policy Dissertations by an authorized administrator of ScholarWorks @ Georgia State University. For more information, please contact [email protected].

PUBLIC FINANCING OF RISKY EARLY-STAGE TECHNOLOGY
A Dissertation
Presented to
The Academic Faculty
by
Reynold V. Galope
In Partial Fulfillment
of the Requirements for the Degree
Doctor of Philosophy in Public Policy
Georgia Institute of Technology and Georgia State University
December 2012
Copyright © 2012 by Reynold Galope

PUBLIC FINANCING OF RISKY EARLY-STAGE TECHNOLOGY
Approved by:
Dr. Susan E. Cozzens, Advisor
School of Public Policy
Georgia Institute of Technology
Dr. Julia E. Melkers
School of Public Policy
Georgia Institute of Technology
Dr. Gregory B. Lewis
Andrew Young School of Policy Studies
Georgia State University
Dr. Jerry G. Thursby
Ernest Scheller Jr. College of Business
Georgia Institute of Technology
Dr. Diana M. Hicks
School of Public Policy
Georgia Institute of Technology
Date Approved: July 25, 2012

To my parents, aunt, and sisters,
and to Jem and our kids, Reine and Josh

iv
ACKNOWLEDGEMENTS
I have always taken pride in performing certain jobs and tasks including research
and analysis independently. But I welcome exceptions from time to time. This
dissertation project is definitely superior to the one I have initially envisioned because of
the insights generously shared by my dissertation committee: Susan Cozzens, Diana
Hicks, Gregory Lewis, Julia Melkers, and Jerry Thursby.
I am deeply grateful to Dr. Cozzens, my dissertation chair and mentor, for her
invaluable guidance and encouragement throughout this dissertation process. Her
organizational and management skill and timely and pithy feedback transformed my
proposal to a completed dissertation in less than one year. Dr. Cozzens is appointed
Vice-Provost of Graduate Education and Faculty Affairs of the Georgia Institute of
Technology this summer. Susan, it was indeed an honor having you as my dissertation
director.
I am also very thankful to Dr. Lewis, Ph.D. program director and now department
chair, for all his time and effort in ensuring that we succeed in this rigorous doctoral
program. I have no doubt that I won the Excellence in Teaching award from the Andrew
Young School of Policy Studies for teaching Policy Data Analysis in spring 2011 by
attending his class in Advanced Research Methods I and volunteering to be his graduate
teaching assistant in his master-level statistics courses since 2010. I am a much better
teacher and policy researcher because of his influence. Drs. Hicks, Melkers, and Thursby
also significantly enhanced the quality of this dissertation research; truth be told, I can

v
cite specific sections, tables, and even figures that I produced and/or revised in the
dissertation because of your technical inputs and advice.
I have also benefitted immensely from my interactions with faculty members,
colleagues, and friends in Georgia Tech’s School of Public Policy (SPP), Program in
Science, Technology, and Innovation Policy (STIP), Technology Policy and Assessment
Center (TPAC), and Georgia State’s Department of Public Management and Policy
(PMAP).
I am grateful to the Ewing Marion Kauffman Foundation for granting me access
to the confidential Kauffman Firm Survey data, and more specifically, to Alicia Robb,
E.J. Reedy, Tim Mulcahy, Johannes Fernandes-Huessy, Ayesha Mahmoud, and Nour
Abdul-Razzak for their assistance in the NORC Data Enclave. The U.S. Small Business
Administration, through FOIA request, provided me the SBIR recipient dataset.
I am indebted to the Fulbright Commission and the Philippine-American
Educational Foundation for realizing my dream to pursue post-graduate studies in the
United States. My Fulbright fellowship has been life-changing and I look forward to
“paying it forward” by contributing to policy research and teaching in the Philippines and
the larger Asia-Pacific region.
Finally, thank you to Jem, Reine, and Josh for your unconditional love and
support. You have been my constant source of strength throughout this long and arduous
but rewarding journey to the Ph.D. [R.V.G.]

vi
TABLE OF CONTENTS
Page
ACKNOWLEDGEMENTS iv
LIST OF TABLES viii
LIST OF FIGURES ix
LIST OF SYMBOLS AND ABBREVIATIONS x
SUMMARY xi
CHAPTER
1 INTRODUCTION 1
1.1 Background and Motivation 1
1.2 The Small Business Innovation Research Program 3
1.3 Research Questions 5
1.4 Potential Contributions to the Literature and Relevance to Policy 5
1.5 Organization of the Study 10
2 RELATED LITERATURE 12
2.1 Theoretical Link between Public R&D Support Programs and Firm
Outputs and Outcomes 12
2.2 Related Studies 24
2.3 Summary Discussion 30
3 METHODOLOGY 32
3.1 The Neyman-Rubin-Holland Counterfactual Framework of Causal
Analysis 32
3.2 Solving the “Missing Data” Problem in Counterfactual Causal
Analysis 35
3.3 Achieving Conditional Independence or Ignorability of Treatment
Assignment 37

vii
4 DATA AND MODELS 49
4.1 Implementing Semiparametric Matching Estimators and Related
Treatment Effect Estimators 49
4.2 Data and Sample 53
4.3 Propensity Score Model 55
5 DESCRIPTIVE STATISTICS AND SBIR SELECTION MODEL 62
5.1 Treated Sample 62
5.2 Comparison of the Treated Sample with Potential Controls 67
5.3 SBIR Treatment Selection Analysis 70
5.4 Discussion 76
6 TREATMENT EFFECT ON POST-ENTRY PERFORMANCE 82
6.1 Outcome Variables by Treatment Status 82
6.2 Results of Propensity Score Matching 87
6.3 Treatment Effect Estimates 89
6.4 Discussion 95
7 SUMMARY, CONCLUSION, AND THEORETICAL AND POLICY
IMPLICATIONS 102
APPENDIX A: Variable Definitions – Baseline Characteristics 115
APPENDIX B: Variable Definitions - Outcomes 116
APPENDIX C: SBA Transmittal Letter of SBIR Recipient Dataset 117
APPENDIX D: STATA Outputs for ATT Estimates 118
APPENDIX E: Prior R&D and SBIR Studies 120
REFERENCES 125

viii
LIST OF TABLES
Page
Table 5.1: Baseline Characteristics of Twenty Five SBIR-
financed Small Business Start-ups 63
Table 5.2: Distribution of Educational Levels of Owners of
SBIR-financed Small Business Start-ups 65
Table 5.3: Distribution of Volume of Patents of SBIR-financed
Small Business Start-ups 65
Table 5.4: Agency Funding Sources of SBIR-financed Small
Business Start-ups 65
Table 5.5: Baseline Characteristics of Small Business Start-ups
by Treatment Status 68
Table 5.6: SBIR Program Selection – Logistic Regression
Results 72
Table 5.7: Statistical Significance of Groups of Covariates 76
Table 6.1: Binary Outcome Variables by Treatment Status
before Matching 84
Table 6.2.1: R&D Performance in 2008 by Treatment Status 85
Table 6.2.2: Innovation Propensity in 2009 by Treatment Status 85
Table 6.2.3: Licensing of Patents in 2009 by Treatment Status 85
Table 6.2.4: Borrowing from Government Agencies in 2009 by
Treatment Status 86
Table 6.3: Odds Ratio by Treatment Status 86
Table 6.4: Interval-level Outcome Variables by Treatment
Status 86
Table 6.5: Difference in Covariate Means after Matching 88
Table 6.6.1: ATT Estimates: R&D and Innovation 91
Table 6.6.2: ATT Estimates: External Capital Infusion and Other
Outcome Variables 92

ix
LIST OF FIGURES
Page
Figure 4.1: Propensity Score Model 56
Figure 6.1: Additionality Effect of SBIR Grants 92
Figure 6.2: Private R&D Expenditure in 2008 by Treatment Status 99
Figure 4.2: Distribution of Propensity Scores After Matching 55

x
LIST OF SYMBOLS AND ABBREVIATIONS
AMD Advanced Micro Devices
ATE Average Treatment Effect
ATT Average Treatment Effect on the Treated
CIA Conditional Independence Assumption
CIS Community Innovation Survey
CLRM Classical Linear Regression Model
EU European Union
GDP Gross Domestic Product
KFS Kauffman Firm Survey
MLE Maximum Likelihood Estimation
NORC National Opinion Research Center
NRH Neyman-Rubin-Holland
OECD Organization for Economic Cooperation and Development
OLS Ordinary Least Squares
PSM Propensity Score Matching
R&D Research and Development
SBA Small Business Administration
SBIR Small Business Innovation Research Program
STTR Small Business Technology Transfer Program
SUTVA Stable Unit Treatment Value Assumption
USPTO United States Patent and Trademark Office
xi
SUMMARY
This dissertation examines the role of public investments in inducing small firms
to develop risky, early-stage technologies. It contributes to expanding our understanding
of the consequences of research, innovation, and entrepreneurship policies and programs
by investigating in more depth the effect of the Small Business Innovation Research
(SBIR) program on the innovation effort, ability to attract external capital, and other
metrics of post-entry performance of small business start-ups using a new sample and
estimation approach.
Unlike prior R&D subsidy studies that concentrated almost exclusively on
European countries, this dissertation focused on small business start-ups in the United
States using a new scientific survey of new firms. It integrated the Kauffman Firm
Survey (KFS) from the Ewing Marion Kauffman Foundation with the SBIR recipient
dataset from the U.S. Small Business Administration (SBA) and used advances in
statistical matching to achieve better comparability between the treated and control
groups of small business start-ups. The integrated KFS-SBA dataset, which contains
both recipient and non-recipient small firms, and statistical matching allowed us to
empirically construct the counterfactual outcomes of SBIR recipients.
This dissertation balanced the pre-treatment characteristics of SBIR recipients
and non-recipients through propensity score matching (PSM). It constructed the
comparison sample by identifying non-recipients with nearly identical propensity scores
as those of SBIR recipients. Consistent with the propensity score theorem, observations
with the same distribution of propensity scores have the same distribution of observable

xii
characteristics. PSM made the comparison and treatment samples homogenous except in
SBIR program exposure, making the fundamental assumption of ignorability of treatment
assignment more plausible.
Using the realized outcomes of observationally similar non-recipient start-ups as
the counterfactual outcomes of SBIR recipients, we found empirical evidence of the input
additionality effect of the SBIR program. Had they not applied for and granted SBIR
R&D subsidies, recipient start-ups would have spent only $185,000 in R&D, but with
SBIR their R&D effort was significantly increased to $663,000, on average. The
treatment effects analyses also found a significant positive effect of SBIR on innovation
propensity and employment. However, it appears that public co-financing of commercial
R&D has crowded-out privately financed R&D of small business start-ups in the United
States. A dollar of SBIR subsidy decreased firm-financed R&D by about $0.16.
Contrary to prior SBIR studies, we did not find any significant “halo effect” or
“certification effect” of receiving an SBIR award on attracting external capital. However,
we discovered a different certification effect of the SBIR program: SBIR grantees are
more likely to attract external patents. This finding also confirms that innovation requires
a portfolio of internal and external knowledge assets as theorized by David Teece and his
colleagues.
This dissertation’s empirical results may be relevant to the Small Business
Administration, SBIR participating agencies, the U.S. Congress, other federal, state and
local policymakers, small high-tech start-ups, and scholars in the field of science,
technology, and innovation policy.

1
CHAPTER 1
INTRODUCTION
1.1. Background and Motivation
Innovation is the single most important determinant of long-run productivity
growth and improved standards of living (Abramovitz, 1956; Baumol, 2010; Boskin &
Lau, 1990; Lerner, 2009; Romer, 1986, 1990; Solow, 1956, 1957; Tassey, 1997). The
belief in the value of innovation in economic growth is not mere “technological
optimism” as Cohen and Noll (1991) put it, drawing at least from the economic success
of the United States through the 21st century. The importance of technology-based
growth, however, does not necessarily provide sufficient incentive for the private market
to invest in innovation (Arrow, 1962; Lerner, 2009). Accordingly, the public sector has
participated in the development of technological innovations by funding basic research1,
sponsoring technology research that supports agency missions2 and mandates (e.g.
national defense, health care, development of efficient energy sources), and increasingly,
by providing R&D tax credits, encouraging cooperative research arrangements among
firms, supporting technology transfer from academic to industrial laboratories, and
cofinancing commercial R&D.3 These policy interventions are intended to sustain
technological change and progress. The strategic importance of continuous technology
1 The assumption here is that the pipeline or linear model of innovation (Bush, 1945) is true, i.e., results of
academic research drive the production of new products and processes in the commercial sector. 2 It assumes a spin-off model of innovation, that is, military technologies and other agency mission-oriented
technologies diffuse to the private sector that will, in turn, develop commercial applications. 3 This is not an exhaustive list of research, technology, and innovation policy tools.

2
development and innovation is further highlighted by global competition. For decades,
other economies like Japan and South Korea have invested significantly in human and
physical capital and developed the capability to innovate (not just imitate) in current
technologies, leading to what Tassey (2007) called “convergence in national
technological capacity”. Continuing U.S. technological superiority cannot be assumed.
It is critical that its national innovation system continuously provide mechanisms to
encourage the steady production of new technology assets as a foundation for future
economic growth.
Small and new enterprises have contributed significantly to the national
innovation effort. In the 20th
century, half of the most important inventions and
innovations in the U.S. originated from small businesses or independent inventors
(Wetzel, 1982 as cited by Van Osnabrugge & Robinson, 2000).4 In a more recent study,
Breitzman and Hicks (2008) found that small businesses are more productive in
generating patents than their larger counterparts. A more nuanced conclusion is
provided by Acs and Audretsch (1990), who showed that small firms contribute to
innovation more than large firms in a number of industries, such as electronics and
computing equipment, process control instruments, synthetic rubber, fluid meters and
counting devices, engineering and scientific instruments, and measuring and controlling
devices.5 Small firms are more innovative than their larger counterparts in specific
4 This finding is hardly novel. As early as 1958, Jewkes and his colleagues documented that major
innovations were developed outside of large firms. 5 Large firms, on the other hand, are more innovative in tires and inner tubes, agricultural chemicals,
general industrial machinery, food products machinery, ammunition, paper industries machinery, primary
metal products, among others (Acs & Audretsch, 1990).

3
industries leading to a “division of labor” between small and large firms in innovation.
This “division of labor” was validated by recent studies; for example, Almeda and Kogut
(1997) showed that small business start-ups innovate in less crowded technological fields
while large firms contribute in established or mature fields. Another important
contribution of small firms and start-ups is job creation. Small firms create more new
jobs than they eliminate. Birch (1979, 1981), using Duns & Bradstreet (D&B) data, first
documented that small firms created most new jobs. While Birch’s study was not
without critics, his major finding was substantiated and verified by subsequent studies.
Especially during economic recessions, small and young firms are a net generator of jobs,
unlike large and established firms, which cut more jobs than they create (Armington,
Robb & Acs, 1999; Small Business Administration, 2009).
The Small Business Innovation Research (SBIR) program is a U.S. federal policy
intervention that co-finances technology development with small enterprises, i.e., firms
with less than 500 employees. This dissertation examines the effectiveness of the SBIR
in inducing innovation effort among small business start-ups using a new sample and
methods motivated by the counterfactual approach to causation.
1.2. The Small Business Innovation Research Program
SBIR is a well-established U.S. federal program. The U.S. Congress established
SBIR through the Small Business Act of 1982. It is a government R&D subsidy program
to small firms. By lowering the cost of R&D, SBIR can encourage small firms to
undertake R&D more intensively.

4
The four goals of the SBIR are (1) to stimulate technological innovation, (2) to
use small businesses to meet federal research and development needs, (3) to encourage
participation by minority and disadvantaged persons in technological innovation, and
(4) to increase private sector commercialization of innovations derived from federal
research and development (P.L. 97-219).
SBIR is the largest federal R&D program for small and medium-sized enterprises,
with funding exceeding $1 billion annually. Eleven federal agencies participate in the
SBIR program: Department of Agriculture, Department of Commerce, Department of
Defense, Department of Education, Department of Energy, Department of Health and
Human Services, Department of Transportation, Environmental Protection Agency,
National Aeronautics and Space Administration, National Science Foundation, and
Department of Homeland Security. The Small Business Innovation Development Act as
amended mandates these agencies to set aside 2.5 percent of their extramural R&D funds
to implement SBIR.
The SBIR grants are awarded in two phases. Phase I R&D awards grants select
small firms up to $150,000 for the short-term investigation of the scientific and technical
merit and feasibility of a research idea. Phase II awards additional federal funds up to
$750,000 each to develop Phase 1 research ideas that have strong commercial potential.
Phase III, for which no SBIR funds are awarded, focuses on private commercialization of
Phase II projects.
5
1.3. Research Questions
This dissertation addresses the following research questions:
1. What are the characteristics of small business start-ups that received SBIR
program funds? Do recipient small business start-ups differ significantly
from non-recipient start-ups?
2. What are the most important attributes of small business start-ups that
contribute to successful SBIR application and selection?
3. Does the SBIR increase the R&D effort and innovation propensities of small
business start-ups?
4. Does the SBIR expand the capacity of small business start-ups to attract
external capital?
5. Does the SBIR have a positive effect on other metrics of post-entry
performance of small business start-ups such as sales and employment size?
1.4. Potential Contribution to the Literature and Policy Relevance
This dissertation examines the role of public investments in inducing small firms
to develop early-stage technologies. It improves upon previous studies that investigated
the effect of SBIR by using a new sample and a new estimation approach. Most prior
SBIR studies have only looked at recipient-firms. Relying on program recipients’ report
of their pay-off from participating in public programs may result in an upward bias in the
estimation of the program effect (Storey, 2002). More importantly, samples that only
contain recipient firms cannot test the program effect of public financing programs.
Policy evaluation must always address the counterfactual outcome: what would have

6
happened without the policy intervention? It thus requires observationally similar cases
that did not receive the intervention or treatment.6 Two SBIR studies (Lerner, 1999;
Wallsten, 2000) used both recipient- and non-recipient firms, but constructed their
sample by manually combining recipient and non-recipient firms. The use of rejected
firms and firms that may not be eligible to participate in the SBIR program most likely
did not lead to unit homogeneity between participating and non-participating small firms,
which is a critical requirement for meaningful comparisons of mean outcomes between
groups (Gelman & Hill, 2007). This dissertation can potentially fill up this void by
building a new dataset of recipient and non-recipient small business start-ups.
Unlike prior evaluation studies, this study uses an inflow sample of small business
start-ups. This inflow sample is a panel study of a cohort of firms that all started business
operations in 2004. The main methodological advantage of an inflow sample is that it
can rule out confounding effects of macroeconomic variables, as all businesses in the
sample have been exposed to the same external factors. This inflow sample of start-ups
is integrated with the SBIR recipient database to identify small high-tech business start-
ups that received public financing from SBIR. As far as I know, this research is the first
effort to integrate SBIR recipient data with a new sample of business start-ups. Thus, the
resultant dataset is an important addition to the data infrastructure for research,
6 Treatment is defined broadly in the methodology literature. It can be a drug or a new therapy
administered to patients, a training program offered to displaced workers, or an educational innovation
applied to a set of students.

7
innovation, and entrepreneurship policy studies.7 Following Hall (2008) and Jaffe
(1999), this dissertation attempts to simulate an experimental setting in order to construct
the counterfactual outcomes of small business start-ups that received public financing.
The study’s empirical model follows the counterfactual approach to causation. Treating
policy and program evaluation as a “missing data” problem, the model uses data from
observationally similar non-recipient small business start-ups to impute the value of the
unobserved counterfactual outcomes of new small high-tech firms that received public
financing.
While this dissertation’s estimation approach is applied to the evaluation of a
federal technology program, it has wide applicability to other policy fields. Its emphasis
on comparing comparable groups (achieved through statistical matching) and controlling
for macroeconomic variables (by using an inflow or cohort sample) is relevant to the
practice of policy and program evaluation, specifically on methods to improve the
internal validity of treatment effect estimates.
Only a few evaluation studies have focused on the role of public financing on
small business start-ups. The focus of this research is early-stage technology
development by small business start-ups. From a Schumpeterian perspective, small
business start-ups are agents of technical change because of their propensity to introduce
new products and processes in emerging or less-crowded technological fields. These new
technologies can potentially supersede current technologies and in the process, redefine
7 Subject to the disclosure and confidentiality policies of the Kauffman Foundation and the National
Opinion Research Center (NORC), the integrated dataset can be made available to other NORC researchers
to further understand the production of new technologies by small business entrants.

8
new market opportunities than can sustain the innovating firm’s and the nation’s
technological leadership and global competitiveness. The unique integrated dataset of
small business start-ups allows the examination of the effect of public financing on risky
early-stage development of technology.
In the 1980s, the U.S. government enacted a series of policy interventions to
facilitate technological breakthroughs and innovations including the Bayh-Dole Act, the
Stevenson-Wydler Act, the American Competitiveness Act, and the Small Business
Development Act (which established the SBIR). The perception at that time was that the
U.S. was losing its technological leadership and global competitiveness. These
technology initiatives received bipartisan support. Increasingly, however, policymakers
have demanded empirical evidence on the effectiveness and efficiency of these
technology policy interventions. The main pressure point is the federal fiscal deficit that
stood at 10 percent of gross domestic product (GDP) in 2009 and is projected to continue
in the next decade (Congressional Budget Office, 2011). The higher the fiscal deficit
becomes, the stronger the demand for cuts in public programs, which include support for
research and innovation in small businesses. Two parallel movements in the public
sector, evidence-based policy and performance management, are also gathering
momentum (Cozzens & Melkers, 1997; Heinrich, 2007; Shapira & Kuhlmann, 2003).
The demand to tie rigorous evidence and metrics (on which policy interventions work
and do not work) with decisions about program design, funding and management
highlights the importance of building and expanding our knowledge base on the
performance of these technology policy initiatives. The termination of the Advanced
Technology Program (ATP) in 2007 is testament to the greater scrutiny of public

9
investments in commercial R&D. Although the SBIR has been reauthorized multiple
times since its creation in 1982, the U.S. Congress has been lukewarm to recent
initiatives to extend the program (Schacht, 2011).8
This dissertation furthers our understanding of the consequences of research,
innovation, and entrepreneurship policies and programs. More fundamentally, it
addresses whether a market failure exists in the production of early-stage technologies,
that is, small high-tech business start-ups underinvest in productive capabilities to
generate new technologies. An answer to this question is necessary to determine if
technology policy interventions are matched with actual market failures and not with
theoretically derived and assumed private underinvestment in R&D (Tassey, 2007). If
firms do not underinvest in R&D, public resources are funding infra-marginal R&D
projects (Wallsten, 2000), that is, R&D projects that would have been undertaken by
small firms even without SBIR funding support. On the other hand, if firms underinvest
in R&D, the economy is less likely to discover new technologies that may undergird its
future economic growth and material prosperity. Firms that applied for but were not
awarded with R&D funds either scaled back or abandoned the R&D project altogether,
affecting innovation outputs and outcomes (Feldman & Kelley, 2003).
The treatment selection model identifies the characteristics of small business start-
ups that contribute to successful SBIR application, selection, and participation, and thus
expands our understanding of the characteristics of small high-tech start-ups that self-
8 In 2011, SBIR was temporarily extended by Public Law 112-17. It was officially extended for another 6
years, ending September 30, 2017, after H.R. 1540 (The National Defense Authorization Act for Fiscal
Year 2012) was approved and signed into law by President Obama in December 21, 2011.
10
select into SBIR and at the same time are adjudged potentially innovative by SBIR
federal agencies. The results may also inform firm-level strategy. For example, it is
possible that, ceteris paribus, start-ups that are located in knowledge networks like those
found in California and Massachusetts are more likely to receive SBIR funding. It is also
possible that all other relevant factors considered, start-ups that have produced patents are
more likely to receive SBIR funding. The first result would suggest the importance of
locating in knowledge-dense networks that facilitate innovations and the second result
would suggest the importance of demonstrating absorptive capacity to increase the
likelihood of participating in public financing programs. The development of productive
capabilities (Teece, 1986; Winter, 2003) creates opportunities for the innovating firm to
outcompete other firms in the industry. The innovating enterprise must use everything at
its disposal, i.e., all resources available within its local knowledge network and the
overall national innovation system to improve its productive capabilities. Public
resources from federal agencies that support enterprise innovation are one of the available
resources that can be tapped to strengthen the dynamic capabilities of firms. This
dissertation contributes to our understanding of how SBIR resources may or may not
strengthen the productive capabilities of small business start-ups.
1.5. Organization of the Study
Chapter Two reviews the theoretical and empirical literature on the effect of
research and innovation policies and programs on firm outcomes and identifies gaps in
the literature that the dissertation can potentially address. Chapter Three discusses the
counterfactual approach to causation, specifically the assumptions needed to apply the
11
approach to treatment effects analysis. Chapter Four discusses the implementation of
matching and related estimators in causal analysis, the sample used in this study, and the
empirical model of treatment selection and estimation. Chapter Five presents descriptive
statistics and the results of the SBIR treatment selection model. Chapter Six discusses
the empirical evidence on the treatment effect of the SBIR program on post-entry
performance of small business start-ups. Chapter Seven provides the conclusions and
theoretical and policy implications of the study as well as recommendations for future
research.
12
CHAPTER 2
RELATED LITERATURE
This chapter reviews the theoretical and empirical literature on the effect of public
programs that support research and innovation in the commercial sector. The first section
presents the theoretical link between research, innovation, and technology policies that
directly support private R&D and firm outcomes. The second section summarizes the
key findings of studies that examine the impact of these policies and programs. The final
section summarizes how this dissertation research extends or advances prior research.
2.1. Theoretical Link Between Public R&D Support Programs and Firm
Outcomes
The theoretical support for public R&D programs originates from two research
streams in economics: (1) the market failure argument derived from mainstream general
equilibrium theory, and (2) the systems failure argument from the emerging evolutionary
economic theory of technical change. The following discussion centers on market and
systems failure in the generation of new technology by small firms and new enterprises.
2.1.1. Market Failure in the Production of Commercially Useful Knowledge
The more often used economic rationale for the public financing of commercial
R&D is the market failure argument (Feldman & Kogler, 2008; Steinmuller, 2010)
derived through formal economic modeling (Hall, 2008) that dates back to Arrow’s
(1962) seminal article on the economics of inventive ideas.

13
The knowledge required by firms to produce innovation is not like any other
economic commodity. Although it can be traded or exchanged like conventional
economic goods, the economic incentive to produce commercially useful knowledge is
significantly weaker because innovators cannot realize a reasonable rate of return from
their innovative activities (Geroski, 1995). This is called the problem of appropriability,
which results from the three generic sources of market failure: (1) indivisibilities,
(2) public goods and externalities, and (3) uncertainties (Arrow, 1962; Dasgupta &
David, 1987; Geroski, 1995; Hall, 2008).
2.1.1.1. Indivisibilities
Undertaking R&D needs large fixed costs to set up the required technical
manpower, facilities, and equipment. Firms may have to commit at least a “critical
minimum level of innovation effort” (Metcalfe, 1995, p. 424) before R&D programs are
expected to produce desired innovation outputs. The minimum scale requirement for
R&D to be productive is higher for firms competing in the high-technology sector than
their counterparts in the traditional sectors. For example, R&D projects in the high-
technology sector may require specialized equipment or facility or a specific set of
competencies from the R&D team,9 which becomes part of the fixed cost of R&D. The
minimum level of R&D effort results in indivisibilities, i.e., R&D facilities, equipment,
and highly technical manpower can only be used efficiently when they are used at full
capacity. Alternatively stated, the production of innovation is characterized by
9 For example, research in nanotechnologies is increasingly multidisciplinary.
14
economies of scale (Cohen, 2001): the average cost of producing new product prototypes
or production techniques or both declines as the firm engages in more R&D. The
presence of large fixed cost and economies of scale implies that large firms may be more
efficient than small firms in conducting R&D and in introducing innovations into the
economy. The idea that large establishments are the most powerful drivers of
technological progress can be credited back to Schumpeter (1942) and, more recently, to
Galbraith (1967) and Lucas (1978). There are reasons why generating innovations is
more efficient in large enterprises, that is, why average cost declines as R&D effort
intensifies in large enterprises. Large firms possess complementary assets (e.g. large
marketing and legal departments) that facilitate the production and protection of
innovation (Teece, 1986; Winter, 2003). Large and established firms can also take
advantage of experience and cumulative learning to screen out technological dead-ends
allowing them to focus on more promising and feasible R&D projects. Small firms and
start-ups, on the other hand, have limited financial and human resources to support R&D
(Acs, 1999) and cannot enjoy economies of scale at lower levels of R&D effort. In sum,
the minimum size of R&D teams and indivisible R&D facilities (Metcalfe, 1995)
discourage firms, especially small business start-ups, from producing more innovation.
2.1.1.2. Public Goods and Positive Spillover Effects
Knowledge derived from either academic research or industrial R&D has
properties of a public good, that is, it is both non-rival and partially non-excludable.10
10
A pure public good is both non-rival and non-excludable.

15
Knowledge is non-rival because it is not diminished by extensive use. For example, the
technique to produce Intel microchips or the process to compress Seagate’s hard disks
remains effective regardless of the number of times it is used in production, even by
Intel’s and Seagate’s competitors. This is akin to the consumption of national defense, a
traditional example used in textbook exposition of a public good: when residents of the
state of Georgia consume or enjoy the benefits of a strong U.S. national defense system,
it does not mean that the residents of other states enjoy less national defense. Most
economic goods like personal computers, food, automobiles are rival goods.11
If
knowledge is non-rival then the marginal cost of an additional user is technically zero,
but more realistically, close to zero, because the transmission of knowledge is not
costless. As such, the private market will not provide knowledge resources efficiently
when the price is set close to its marginal cost. Secondly, knowledge is partially non-
excludable, that is, it is difficult to exclude others from using it. The standard solution to
non-excludability is the establishment of property rights, of which patents and copyrights
are prime examples. Without secure property rights, a Silicon Valley start-up, for
example, may not be able to preclude other firms from reverse-engineering and copying
its new product or production technique. In the absence of a patent regime, competitors
will just wait for innovating firms and copy their innovative ideas, discouraging firms
from investing in R&D. In short, non-excludability (or even partial non-excludability)
encourages free riders to an innovation, weakening the general incentive to produce
commercially useful knowledge.
11
If there is only one Dell desktop PC in a Best Buy store and John bought it, it means that Jane will not be
able to buy and enjoy the benefits of using the PC.

16
Closely related to non-excludability is the positive spillover effect of innovative
ideas. The knowledge produced by a firm may be useful not only to other present or
future R&D projects of the firm but also to other firms as well as scientists and engineers
in universities and public R&D laboratories. For example, advances in microchip
technology by Intel will benefit its competitors as well as manufacturers of personal
computers like Dell, Acer, and Apple. A new commercial technology may also advance
fundamental understanding of how the physical world works, and thus help extend the
frontiers of scientific knowledge. Thus, from a larger societal point of view, a new
product or process benefits not only the innovating firm but also other actors in the
national economy and even the larger global economy. Due to this positive spillover
effect, the marginal social benefit of the innovation is larger than the marginal private
benefit that accrues to the innovator. Because the innovating firm only considers its
marginal private benefit, it produces potentially commercially useful knowledge below
the socially optimal level.12
The strength of the U.S. patent system may be insufficient to encourage small
firm innovation. Cooper (2003) argued that small and new enterprises lack both (1) legal
resources to protect their innovation from imitation, and (2) the market power to extract
monopoly rents from their newly introduced innovation. Moreover, the patent system
provides protection in only a very limited number of sectors (Geroski, 1995). The
12
Another example of an economic good with positive externality effects is basic education. The whole
economy/society benefits when its citizens/residents consume more basic education as the latter is
associated with more responsible citizenship and greater productivity. But because the individual only
considers the benefit that he will enjoy with each additional year of basic education, and not the additional
benefit that the whole society will enjoy, he is likely to consume less basic education than what the whole
economy desires.
17
calculation of a lower marginal private benefit (due to non-excludability and spillover
effects) by small firms and start-ups further lowers their innovation output away from the
socially optimal level of innovation. Instead of performing more R&D, small enterprises
may just rely on knowledge spillovers from academic research to generate innovative
outputs (Feldman, 1994).13
2.1.1.3. Risks and Uncertainties
The risks and uncertainties associated with the process of generating innovation
involve both (1) the outputs of R&D and (2) the financing of R&D activities. The two
are inextricably linked because the second proceeds from the first. Innovative activities
are difficult to finance because their output is highly uncertain.
The difficulty in financing innovation projects arises from the (1) technical,
(2) market, and (3) competitive uncertainties in the production of innovation. First, the
output of R&D is not a monotonic function of R&D inputs. Without dynamic
capabilities and complementary assets (Nelson, 1996; Teece, 1986), firms cannot easily
translate more R&D inputs into more innovation outputs. The creative process involved
in innovation has a random element; business experimentation involves a lot of trial-and-
error and the desired outputs and outcomes may not be achieved on the first few attempts.
Second, the product prototype may not work on a commercial scale; for example, it may
not be amenable to mass production, limiting market potential. In addition, the newly
13
This assumes that academic research is linearly connected with product and process innovations at the
firm level. It also presupposes sufficient absorptive capacity of small and new firms to capture the
economic benefits of academic research.
18
introduced product may not enjoy market demand at a volume sufficient to recoup the
cost of R&D. As Bhide (2008) has argued convincingly, firm innovation also involves
significant risk-taking on the part of consumers; for example, personal computers and
mobile phones (and now, smart phones) may not have been successful commercially
without consumers taking risks that these new high-tech products have important
personal economic uses. Third, the possibility remains that a competing firm develops a
similar or more superior product or technology, limiting the returns to R&D or, worse,
driving the firm out of the market. These uncertainties drive private enterprises to
become risk-averse, discriminating against high-risk but potentially high-return R&D
projects. Risk-averse businesses tend to produce only incremental innovation, not
radical, cutting-edge, new-to-the-world innovation. Worse, they may opt to place their
bets on the status quo, ignoring, for example, new production methods that have been
tried, tested, and used by other firms. These strategic decisions that are influenced by a
negative risk evaluation affect long-run productive capabilities for innovation.
The technical, market, and competitive uncertainties of engaging in R&D and
innovation are more pronounced in small firms and start-ups than in large and established
firms. Business start-ups may not possess sufficient absorptive capacity to develop the
intended products and processes and the experience and network to take these
innovations successfully to the market. More fundamentally, they may lack market
research capability to establish demand before developing the intended new product or
technology.
The second aspect is the uncertainty that results from the information
asymmetry between entrepreneurs and providers of capital including banks and external

19
investors (e.g. venture capitalists and angel investors), leading to a higher cost of external
capital (Hubbard, 1998). Financiers may be reluctant to extend credit in the absence of a
credible market signal of the quality and prospect of the firm’s innovation project. When
the innovation project is perceived as risky, capital providers usually require an extra
premium to extend credit, pushing up the cost of external capital. Toole and Turvey
(2009) have argued that information asymmetries in the financing of innovation are more
problematic for small R&D performing firms. This problem is compounded when the
stage of technology development cycle is factored in. Cooper (2003) found that small
businesses do not have sufficient funding at the early stage of R&D, implying that capital
providers are risk-averse in extending credit to innovation projects that are not “near-
market” (Lerner, 1999; Shane, 2004). This leads to a substantial “financing gap”
(Branscomb & Auerswald, 2003) that deprives firms that are willing to assume a portion
of the risks the resources to develop early-stage technologies.
When external capital is difficult to secure, firms may rely only on internal
capital. But internal capital is also limited, especially to small business start-ups. When
external capital from financiers is prohibitively high and internal capital from the
entrepreneurs themselves is limited, economically viable R&D projects may not be
undertaken, generating a social welfare loss.
2.1.2. Systems Failure
The evolutionary economic theory of economic change and the systems theory of
innovation (Dahlman & Nelson, 1995; Lundvall, 1992; Metcalfe, 1995; Nelson, 1993;
Nelson & Winter, 1982) provide a much broader justification for technology and

20
innovation policy, arguing that firms, especially small firms, have to conduct research
and development (R&D) on their own and experiment on their own, in order to
strengthen their absorptive capacities (Cohen & Levinthal, 1990), necessary to
understand the current technological frontier, and access relevant technologies externally.
These theories do not consider uncertainties, information spillovers, and the public good
nature of knowledge as market failures. They argue instead that these so-called market
failures are fundamental features of the market system (Metcalfe, 2007, 1995), and as
such, they do not justify the adoption and implementation of technology policies to
correct these market “imperfections.”
Evolutionary theory perceives the generation and diffusion of innovation as a
systems problem. Economically useful knowledge is not produced and disseminated
when the system of innovation fails. Metcalfe (2007) identified at least two ways in
which the innovation system may fail: (1) knowledge actors are missing, and
(2) connections among producers of knowledge, among users of knowledge, and between
producers and users of knowledge are absent. Thus, a firm may fail to produce
innovation if its (1) absorptive capacity and (2) connection with knowledge producers
and users in the innovation system are missing or not functioning. One of the means to
increase absorptive capacity and connect with other system innovation actors is to
conduct R&D. Systems theory suggests policy interventions to shoulder private sector
risks in performing innovative activities to raise the experimental behavior of firms
(Metcalfe, 2007), expand their absorptive capacity, and induce them to network with
other users and producers of innovation as well as capital providers.

21
2.1.3. SBIR as a Solution to the Appropriability Problem and System Failure
The SBIR is an R&D subsidy to small firms, specifically to small high-tech firms.
It can be construed as a government venture capital initiative where public financing
underwrite the research and development of early-stage technologies and processes
(Branscomb & Keller, 1998; Lerner, 1999). As Borrus and Stowsky (1999) put it,
technology programs like the SBIR, which stimulate the development of new industrial
technologies, could be regarded as bets on the country’s technological future.
The SBIR subsidy helps small firms satisfy the required minimum scale of R&D
(e.g. minimum size and competence of the R&D team) necessary to achieve results. It
allows, for example, the hiring of university scientists or engineers to spearhead or
support its R&D effort. More importantly, the SBIR grant may also enable the recipient
small firm to engage in more R&D projects and thus utilize whatever R&D facility and
equipment it has set up originally to full capacity. Engaging in more R&D projects while
utilizing the same level of resources the firm possessed prior to the SBIR grant decreases
the unit cost of innovation to be derived from the new and more intensified R&D effort.
The recipient’s innovative effort becomes less costly at a larger scale of R&D, which is
exactly the competitive advantage of large firms with large R&D departments over small
firms with meager R&D budgets.
Public financing shifts the recipient-firm’s marginal cost to the right (David, Hall
& Toole, 2000; Metcalfe, 1995) pushing its innovation effort theoretically up to a level
that closes the gap between the private level and the “socially optimal level” of R&D.
The economy-wide benefits of more small firms conducting R&D in the high-technology
sector as a result of the availability of SBIR grants multiply when the knowledge derived

22
from publicly co-financed R&D spills over to other users and producers of innovations.
Public financing also alleviates the risks and uncertainties of the outcomes of R&D effort.
By providing small firms the opportunity to engage in longer-term R&D, SBIR enables
recipients to have a better estimate of the reward and risk of developing their intended
new products or processes. Using the SBIR research grant, a better evaluation of the
probability of technical and market success will encourage the recipient small firm to
further develop the technology in the future with or without public financing. The
prospect of having federal agencies procure the proposed technology to pursue their
agency missions also lowers market uncertainties for some SBIR-financed research
projects. The increase in the innovation effort of recipient firms as a result of public
financing alleviating the problems of indivisibilities, technology spillovers, and negative
risk evaluation is the so-called additionality effect of research, innovation, and
technology policies (Clarysse, Wright, & Mustar, 2009; Georghiou, 2002).
The SBIR program offers financing to new innovative small enterprises to
develop unproven but promising technologies (Toole & Czarnitzki, 2007). The
availability of public financing to small high tech firms at the seed or start-up stage of
technology development, a critical stage in which private investors like venture capitalists
are still reluctant to participate (Cooper, 2003), encourages small enterprises to pursue
technological innovations (Gonzalez, Jaumandreu & Pazo, 2005).
The SBIR grant can also have a halo or certification effect specifically in the
application for external capital (Lerner, 1999; Link & Scott, 2010). Recipient small firms
can leverage their SBIR awards to signal the “viability of the project and the company”
(Siegel, Wessner, Binks, & Lockett, 2003, p. 124). SBIR’s certification effect is similar

23
to the warranty effect in Akerlof’s (1970) “lemons” market problem14
; the SBIR funding
certifies that the innovation project is not a “lemon” and thus is worthy of capital infusion
or credit extension at a rate lower than what would be possible when the capital providers
do not have a hint on the quality of the innovation project. Using a Net Present Value
model, Toole and Turvey (2009, p. 45) have shown that when initial public investment
(such as that provided by SBIR grants) are used “to support research necessary to reduce
technical and market uncertainties,” capital providers will be encouraged to undertake
follow-on investment. Thus, SBIR funding helps address the information asymmetry
problem by certifying that the proposed new technology is both (a) “scientifically sound”
and (b) “commercially promising” (Feldman & Kogler, 2008, p. 442), providing the extra
push to financiers to extend additional capital funding. Lerner (1999) showed that small
firms that received SBIR grants are three times more likely than non-recipients to attract
venture capital, a finding validated by a more recent study by Toole and Turvey (2009)
who documented that SBIR Phase I grants have a positive effect on receiving follow-on
external private investment.
From an evolutionary economic perspective and national innovation systems
approach, which rejects the role of public policy to achieve an “optimal” state of the
innovation system, R&D subsidy programs like the SBIR are meant to “influence the
nature of the knowledge base of the firm” and to “increase absorptive capacity” (Soete,
Verspagen & Weel, 2010, p. 1169). The innovation system fails when producers of
innovation, which are generally firms, do not have the capacity to translate or at least
14
The product warranty certifies that the product is not a lemon.
24
adapt existing innovations and research produced by other firms, universities, and other
research institutes to products, processes, marketing strategies, or organizational forms
that can increase their own productivity and competitive advantage. The SBIR grant
enables small firms to experiment with new processes, technologies, and organizational
forms providing a critical opportunity for firms to learn by doing. Not all firm
innovations are derived entirely from R&D; they also originate among others from the
production floor, interactions between technical and nontechnical personnel, and
interactions with users and customers. SBIR funding can have long-run learning effects
that enhance the efficiency of future R&D programs of the recipient firm (David, Hall &
Toole, 2000).
This dissertation focuses on testing the additionality and certification effects of
the SBIR program as well as its effects on other metrics of post-entry performance like
sales and employment size.
2.2. Related Studies
2.2.1. R&D Subsidy Studies
Existing research on the public financing of enterprise innovation has focused on
testing the input additionality of R&D subsidies, asking whether public support for
commercial R&D stimulates or crowds-out private R&D spending. [For a review of
R&D studies, see David, Hall, and Toole, 2000; and Klette, Møen, and Griliches, 2000.]
Research and innovation policy evaluation studies have concentrated almost
exclusively on European countries, due in large part to data availability. For example,
Aerts and Czarnitzi (2004) evaluated the impact of R&D programs in Belgium; Czarnitzi

25
and Licht (2006) and Hussinger (2008) in Germany; Clausen (2009) in Norway; and
Busom (2000) and Gonzalez and Pazo (2008) in Spain. Since 1993, the European Union
(EU) has conducted Community Innovation Surveys (CIS), which gather information to
measure the effect of public funding on firm innovation inputs, outputs, and outcomes.15
The U.S. does not have a comparable national firm innovation survey.16
The only US
firm survey that comes close to the CIS, which uses the Oslo Manual to measure
innovation input and outputs, is the Georgia Manufacturing Survey conducted by the
Georgia Tech Enterprise Innovation Institute. A number of studies have also focused on
other member-countries of the Organization for Economic Cooperation and Development
(OECD) using national R&D and innovation surveys of firms: Ozcelik and Taymaz
(2008) on Turkey, Hall and Maffioli (2008) on Chile, Berube and Mohnen (2009) on
Canada, Koga (2005) on Japan, and Lee and Cin (2010) on Korea.
These evaluation studies used cross-section, pooled cross-section, or panel data in
their empirical analysis of the additionality effect of R&D subsidy programs. In terms of
methods, most of these R&D subsidy studies have recognized the endogeneity of R&D
subsidy programs. R&D subsidies are endogenous primarily because they are not
randomly provided to firms. Firms self-select into these public subsidy programs.
Accordingly, firms that apply for public financing are systematically different from those
15
The CIS includes questions on product and process innovation, innovation activity and expenditure on
R&D, effects of innovation, innovation cooperation, and public funding of innovation. The CIS contains
the necessary information to measure the effect of public funding on firm innovation inputs, outputs, and
outcomes. The 4th CIS was carried out in 2005 in 27 EU member states and three European Free Trade
Area and EU candidate countries (OECD, accessed August 2010). 16
The National Science Foundation (NSF) has sponsored a new Business R&D and Innovation Survey
(BRDIS) which measures new variables like worldwide R&D expenses, R&D employee headcount, R&D
expenses, and share of R&D devoted to new business areas and new science or technology activities. The
NSF has released preliminary results from this survey.

26
that did not seek public funding.17
The second consideration is the selection guidelines
and criteria of R&D-granting agencies; winning applicants are more likely to differ from
losing applicants in a number of important ways. In short, program or treatment selection
is correlated with both observable and unobservable firm characteristics. R&D studies
have used rigorous statistical and econometric techniques like propensity score matching,
instrumental variable estimation, and fixed effects panel data analysis to address the
endogeneity issues that result from the nonrandom selection of firms into R&D support
programs.
The key finding from these R&D studies is that subsidized firms would have
invested significantly less in R&D without the subsidy. However, not all studies
concluded the absence of crowding-out. For example, Busom (2000) found that complete
crowding-out cannot be ruled out in 30 percent of its Spanish sample while Clausen
(2009) provided evidence that “development” subsidies in Norway substituted for private
R&D spending. A subset of these studies also looked at the effect of R&D grants on
other firm outputs and outcomes but did not find conclusive results. For example,
Czarnitzi and Licht (2006) found a significant effect of public subsidies on patenting
application among firms in Eastern Germany while Aerts and Czarnitzi (2004) did not
find any significant difference in patenting behavior between subsidized and non-
subsidized firms in Belgium.
17
In the same manner, individuals who self-select themselves into a public job retraining program are
systematically different from those that did not opt to participate in the program.

27
2.2.2. SBIR Studies
This section reviews the data and statistical methods used by studies that
specifically evaluated the SBIR.
The early evaluation of SBIR was provided by Lerner (1999), Wallsten (2000),
Link and Scott (2000), Audretsch, Wiegand and Wiegand (2002), and Audretsch, Link
and Scott (2002). Lerner (1999) is the first attempt to evaluate the long-term impact of
the SBIR program, with observations spanning over 10 years from 1983 to 1997. Its
sample included (a) 541 small firms that received Phase II awards and (b) a comparison
sample that received only Phase I awards, small firms matched on firm size and industry
classification, and another set of small firms matched on firm size and geographical
location. Lerner showed that SBIR-supported firms grew significantly faster in both
volume of employment and sales than non-recipient small firms of similar geographic
location and industry classification. He also found that SBIR awards interacted with local
venture capital activity, that is, recipients had better sales and employment outcomes only
in areas with substantial venture capital activity. SBIR had no impact on firm outcomes
in areas where few institutions that provide external capital funding operate.
Wallsten (2000), in contrast, is a short-term evaluation of SBIR in terms of its
input additionality effect. Its sample included (a) 367 small firms that received at least
one SBIR award for the period 1990-92 and (b) comparison sample of small firms
composed of 90 rejected firms (i.e., firms that applied for SBIR funding but was not
awarded) and 22 eligible firms that did not apply for SBIR funding. Using an
instrumental variable approach, he showed that SBIR crowded-out firm-financed R&D,
disconfirming the input additionality hypothesis.

28
Wallsten (2000) and Lerner (1999) artificially constructed their comparison
samples. The treatment sample and the comparison sample were obtained from different
distributions. Manually matching on industry classification and geographic location may
not have been sufficient to remove the endogeneity bias that results from the nonrandom
selection of SBIR awardees.
Audretsch, Wiegand and Wiegand (2002), Audretsch, Link and Scott (2002), and
Link and Scott (2000) only used SBIR recipients in their empirical analysis. The first
study used (a) case studies of 12 SBIR recipient firms and (b) a mail survey of another 20
SBIR recipient firms in Indiana to show that SBIR influenced the career paths of
academic scientists and engineers to form new firms. The second study used tobit
regression on 112 Department of Defense (DOD)-supported SBIR recipients to show that
SBIR-supported firms commercialized new products and services developed through
SBIR funding. Link and Scott (2000) also interviewed SBIR awardees for 44 projects
and estimated that the social rate of return of SBIR funding was at least 84 percent, that
is, SBIR projects were socially valuable.
The main disadvantage of the second set of studies is that the sample was
restricted to SBIR-supported small firms. By design, these studies are reflexive studies
or before-and-after studies; the small firms themselves were used as controls. The
weakness of these reflexive studies is that they cannot rule out selection and endogeneity
bias (Rossi, Lipsey, & Freeman, 2004). It was possible that SBIR-supported firms
commercialized the products and processes they generated through SBIR because they
spent more in R&D, had a more capable management team, were more networked, were
located in regions where external financing was easier to secure, and a host of other firm-

29
level and location-specific factors that positively impact firm performance. Comparing
the performance of small firms before and after SBIR funding does not also rule out
simultaneity; more innovative firms are more likely to receive SBIR funding and to be
more innovative in the future. In short, in the presence of selection and simultaneity,
studies that used only recipient firms are seldom internally valid; we cannot rule out the
effect of other factors outside of the SBIR award. More rigorous alternative methods to
the reflexive approach are methods motivated by the counterfactual approach to
causation, which will be discussed in the next chapter. The counterfactual approach to
causation compares the post-funding outcomes of SBIR-financed small firms with the
post-funding outcomes of observationally similar or comparable group of small firms that
did not receive R&D subsidy.
Lerner’s study used non-statistical matching to construct a comparison sample for
541 SBIR-recipient firms. The idea was to balance the characteristics of the two groups
(i.e., the recipient firms and the matched firms) before their outcomes were compared.
However, the study used only two variables simultaneously (i.e., firm size and industry
classification, and firm size and geographical location) to find non-SBIR firms that
matched the SBIR-funded firms on these two attributes. It is clearly an attempt to
construct the counterfactual outcome of SBIR-funded firms (instead of just comparing
their pre- and post-funding outcomes as is practiced in before-and-after studies), but
matching only on two variables may not be sufficient to control for endogeneity or
selection bias. The SBIR-supported firms and non-supported firms may still be
systematically different from each other even when firm size and geographical location
(and firm size and industry classification) were controlled for at the baseline. For

30
example, SBIR-financed firms may be older, have spent more R&D, have a higher ratio
of scientific and technical personnel (as opposed to non-technical and administrative
personnel), grown faster, and a host of other factors that confound the cause-and-effect
relationship between SBIR funding and firm performance. Controlling these other
factors in a regression framework may not be enough (Gellman and Hill, 2007; Ho, Imai,
King & Stuart, 2007). Wallsten (2000) also constructed a comparison sample that
included rejected firms and potentially eligible firms that did not apply for SBIR funding.
The comparison sample may not have come from the same distribution as that of the
treated sample. It is also possible that since the two groups of firms are not balanced in
pre-treatment characteristics, the regression was forced to infer beyond the data. As we
will see in the next chapter, differences in pre-treatment characteristics between recipient
and non-recipient firms makes the empirical results dependent on functional forms (Ho,
Imai, King & Stuart, 2007).
2.3. Summary Discussion
Most SBIR studies only used recipient or treated firms in the empirical analysis.
The survey methodology literature (or even the economics literature on games and
strategy) finds that asking program recipients to report the pay-off from participating in
public programs (or any other programs for that matter in which they will potentially
benefit in the future) may result in an upward bias in the estimation of the treatment
effect parameter. Two SBIR studies, specifically Lerner (1999) and Wallsten (2000),
used non-recipient firms and employed techniques like instrumental variable estimation
and non-statistical matching to address the endogeneity of R&D subsidy. However, the

31
two studies combined the recipient sample with non-recipient sample that are not
identically and independently distributed. The use of rejected firms and firms that may
not be eligible to participate in the SBIR program most likely did not lead to unit
homogeneity between treated and untreated firms, which is a requirement for meaningful
comparisons of mean outcomes between groups (Gelman & Hill, 2007).
Advances in the micro-econometrics of program evaluation can better handle
endogeneity and support the requirement of achieving unit homogeneity between groups
to allow more meaningful causal inferences. A key implication of Lerner (1999) and
Wallsten (2000) is the need to use better data to establish causal connections between
public R&D subsidy programs and firm innovation and productivity. Empirical analysis
of program effects using both recipient and non-recipient firms that are part of the same
random sample of firms (like in EU’s CIS) is a significant improvement over synthetic
samples that are manually combined as if they came from the same distribution. This
dissertation merges the Kaufmann Firm Survey, which is a survey of firms founded in
2004 and subjected to follow-up surveys in 2006, 2007, 2008, and 2009, with federal
program databases to identify surveyed firms that received public R&D funding from
SBIR. The merged dataset is a unique inflow sample of small firms that either receive or
did not receive SBIR funding from the federal government.
Thus, this dissertation contributes to the literature on research and innovation
policies and programs by measuring the treatment effect of the SBIR program using a
better sample (i.e., an inflow sample of firms from the same random sample) and more
rigorous methods from the advances in the micro-econometrics of treatment, policy, and
program evaluation.

32
CHAPTER 3
METHODOLOGY
3.1.The Neyman-Rubin-Holland Counterfactual Framework of Causal Analysis
This dissertation seeks to identify the causal impact of a federal research and
innovation program on firm-level outcomes.
A widely-accepted approach to causality is the counterfactual approach, which
can be traced back to Lewis (1973). Dissatisfied with the regularity approach to causality
that requires universal conjunction of events to identify causes and effects, Lewis (1973)
redefined “X has caused Y” as “Y would not have occurred if it were not for X” (Pearl,
2009; Guo & Fraser, 2010). Thus, the counterfactual approach to causality considers
what would happen if X did not occur. Before causality can be attributed from X to Y,
Lewis (1973) requires the following two conditions (1) Y increased as a result of X, and
(2) Y did not increase because X is not present. In short, the presence of X should
produce a net effect in Y and its absence a zero net effect. To establish that X has caused
Y, it is not enough to demonstrate that X and Y occurred together; the second condition,
which is the counterfactual condition, must also be true. To establish that the second
condition is true, Lewis’s (1973) approach is to identify the “closest possible world,”
where X does not occur, and observe that Y does not also occur. To illustrate, following
Brady (2008), if X is a government training program and Y is earnings, then the “closest
possible world” can be defined as the world where the government training program does
not occur but everything else (e.g. macroeconomic environment) is similar. Following
Lewis (1973), (1) if in the factual world both government training (X) and increase in

33
earnings (effect on Y) occurred, and at the same time, (2) if in the “counterfactual” world
(where everything else is similar with the factual world) except for the absence of the
government training program, earnings did not increase, then one can argue that the
government training program (X) causes earnings (Y) to increase.
In statistics, the counterfactual approach to causation was further developed by
Neyman (1923), Rubin (1974), and Holland (1986). Thus, the counterfactual framework
is commonly known as the Neyman-Rubin-Holland (NRH) counterfactual framework of
causal analysis or treatment effects analysis.
The NRH counterfactual framework assumes that every individual in the target
population has two potential outcomes, i.e., (1) potential outcome with the treatment18
and (2) potential outcome without the treatment (Cameron & Trivedi, 2005; Morgan &
Winship, 2007; Woolridge, 2002). For this reason, the NRH counterfactual framework is
also known as the potential outcomes framework. A causal effect or treatment effect is
defined as the difference between the two potential outcomes. Following the standard
formalization of potential outcomes, let Yi1 denote the potential outcome for unit i if the
unit receives the treatment (or participates in a program) and Yi0 denote the potential
outcome for the same unit if it does not receive the treatment (or does not participate in a
program). Also, let Ti be a treatment indicator which is equal to 1 if unit i is treated and 0
otherwise. Thus, the individual causal or treatment effect (ITE) i can be defined
formally as:
ITE = i = Yi1 - Yi0 [1]
18
A treatment can be a drug or a new therapy administered to patients, a training program offered to
displaced workers, or an educational innovation applied to a set of students.

34
The observed (or realized) outcome Y for individual i is:
Yi = TiYi1 + (1-T)Yi0 [2]
Yi = Yi1 if Ti=1
Yi = Yi0 if Ti=0
Extending this definition for a single individual to a set of individuals, we may
define the average treatment effect (ATE) as the difference between the mean potential
outcomes, or more formally:
ATE = E(i) = E(Yi1 ׀ Ti=1) - E(Yi0 ׀ Ti=0) [3]
We can also define the average treatment effect on the treated (ATT). ATE and
ATT represent closely related but different population parameters. ATE is the average
causal effect of the treatment on randomly selected individuals in the target population.
ATT, on the other hand, is the average causal effect for those that receive the treatment or
participate in a program, i.e., those who have a high probability of receiving the treatment
or program. ATT is equal to ATE conditional on T being equal to unity. Thus, ATT can
be defined as:
ATT = E(i ׀ Ti=1)
= E(Yi1 ׀ Ti=1 ) - E(Yi0 ׀ Ti=1) [4]
The so-called fundamental problem of causal inference (Holland, 1986) arises
because only one of the potential outcomes is observable for each individual. We cannot
observe both potential outcomes simultaneously. The counterfactual outcome, by
definition, is not observable. This is the central challenge of program evaluation or
treatment effects analysis. Let us consider both cases. First, if the individual participates
in a program (or receives a treatment), the first term Yi1 of Equation 1 is observable but

35
the second term Yi0 is not. Likewise, if the individual is not a program participant (and
therefore, not in the treatment state), the second term is observable but the first term is
not. Thus, using the NRH definition of causal connection, there is no direct way to
identify the individual treatment effect for any particular case.
By extension, the average causal effect ATE or ATT cannot also be estimated
because only one of the two average potential outcomes [i.e., either E(Yi1) or E(Yi0) and
either E(Yi1 ׀T=1 ) or E(Yi0 ׀T=1] is observable. In short, the causal inference problem is
a “missing data” problem. As a result, the researcher cannot directly compare the
observed factual outcome and the unobserved counterfactual outcome in order to infer
causal effect (Brady & Collier, 2004).
3.2.Solving the “Missing Data” Problem in Counterfactual Causal Analysis
Finding a solution to the “missing data” problem is akin to being able to identify
Lewis’s “closest possible world.” Finding an empirical surrogate for Lewis’s
counterfactual world is finding a substitute for the counterfactual outcome of interest.
A set of assumptions has to be made to apply the NRH counterfactual framework
in program evaluation or treatment effects analysis (Guo & Fraser, 2010; Sekhon, 2008).
Without these assumptions, one cannot use observable outcomes as substitutes for
unobservable counterfactual outcomes or make valid comparisons between observed
outcomes of two groups.
The first assumption is the Stable Unit Treatment Value Assumption (SUTVA),
which assumes that the potential outcomes of individuals is unchanged (hence, “stable”)
regardless of the changes in treatment status of other individuals (Morgan & Winship,

36
2007). That is, the treatment assignment for one individual does not influence the
outcome of another (Gelman & Hill, 2007). According to Heckman (2005), SUTVA
rules out the following two situations: (1) effect of treatment assignment patterns on
potential outcomes, and (2) social interaction and general equilibrium effects. First,
SUTVA is valid when potential outcomes do not vary with treatment assignment
patterns. Morgan and Winship’s (2007) example when SUTVA is violated is the
situation in which potential outcomes change with the number of treated individuals,
leading to the treatment becoming more or less effective as more individuals participate
in the treatment. Second, SUTVA is valid if the gain/loss an individual obtains from the
treatment/program does not spill over to other individuals. The assumption is thus
violated when a treated individual interacts with an untreated individual benefitting the
latter. Without the SUTVA, it would be difficult to uniquely define individual causal
effect (Brady, 2008). For example, if treated individuals interacted with untreated
individuals and spillover effects cannot be ruled out, then it would be difficult to isolate
the treatment effect from the spillover effect. Lewis’ “closest possible world” where
everything else is the same except for the treatment is not achieved because the factual
world and the empirical surrogate of the counterfactual world might also be the same in
treatment status as a result of the spillover or interaction effect.
The second assumption is the conditional independence assumption (CIA) or
ignorability of treatment assumption, which can be formally expressed as:
(Y0, Y1) ╨ T ׀ X, or [5.a]
(Y0, Y1) ⊥ T ׀ X [5.b]

37
The CIA assumes that conditional on observed covariates X, the treatment and
potential outcomes are independent. Put differently, treatment assignment or treatment
status conveys no information about the values of the potential outcomes after observable
characteristics X are held constant. It thus implies that participation in the program or
treatment does not depend on expected outcomes, after controlling for the variations in
outcomes dues to differences in X (Cameron & Trivedi, 2005). The CIA is also called
“selection on observables” because the conditioning covariates are assumed to be known,
observed, and measured without error (Barnow, Cain, & Goldberger, 1980). If the CIA
holds then the treated individuals and untreated individuals will come to have the same
mean values of Y0 and Y1 (Collier, Brady & Seawright, 2004). This solves the “missing
data” problem, because if the CIA holds, we can swap the observed outcomes of
untreated individuals for the unobserved counterfactual outcome of treated individuals
and the observed outcomes of treated individuals with the unobserved counterfactual
outcomes of untreated individuals. To summarize, causal inferences can only be made
when both the SUTVA and the CIA are plausible.
3.3. Achieving Conditional Independence or Ignorability of Treatment
Assignment
3.3.1 Experimental Studies
The most effective way of achieving conditional independence or ignorability of
treatment assignment is through an experimental research design.

38
The key feature of the experimental design is randomization, i.e., experiments
randomly assign individuals to either the treatment or control group.19
Randomization
ensures that the potential outcomes are independent of treatment. Knowing whether an
individual receives treatment conveys no information whatsoever about his potential
outcome under the treated state Yi1 or about his potential outcome under the control state
Yi0. If treatment is not randomly assigned, it is possible that individuals who think they
will gain more from the treatment will self-select themselves into the treatment, and
accordingly, knowing an individual’s treatment status may convey information about his
potential outcomes, and thus treatment and outcomes are not independent.
An experimental research design does not only satisfy the CIA [i.e., (Y0, Y1) ╨ T ׀
X]; it satisfies a stronger unconditional independence assumption [i.e., (Y0, Y1) ╨ T],
which is also called full independence assumption. Full independence implies
conditional independence.20
If (Y0, Y1) and T are independent, then the mean potential
outcomes of the treated and untreated groups in an experiment are equal. More formally,
E(Yi1 ׀ Ti=1) = E(Yi1 ׀ Ti=0) = E(Yi ׀ Ti=1) [6.a]
E(Yi0 ׀ Ti=1) = E(Yi0 ׀ Ti=0) = E(Yi ׀ Ti=0) [6.b]
Equation 6.a states that the expected potential outcome of the treated when they
are actually treated is equal to the expected potential outcome of the untreated had they
been treated. If this is the case, then we can use the observed outcome of the treated as
empirical substitute for the unobserved counterfactual outcome of the untreated had they
19
The classic experimental design also features measurement of the outcome variable before and after the
intervention. 20
If variables X and Y are independent, then E(Y ׀ X) = E(Y).

39
been treated. Equation 6.b states that the expected potential outcome of the untreated
when not treated is equal to the expected potential outcome of the treated had they not
been treated. The implication is that we can also substitute the observed outcome of the
untreated for the unobserved counterfactual outcome of treated had they not been treated.
Thus, in experimental studies, in which the research design ensures that the treatment
assignment and the outcomes are independent, the group mean difference of the treated
and untreated groups can identify the ATE defined earlier in Equation 3:
ATE = E(Yi1 ׀ Ti=1) - E(Yi0 ׀ Ti=0)
= E(Yi ׀ Ti=1) - E(Yi ׀ Ti=0) by Eq. 6.a and 6.b
ATE EstimatorEXPERIMENTS = E(YTREATED) - E(YCONTROL) [7]
= E(Yi1) - E(Yi0)
Experimental studies supply the correct unobserved counterfactual, thus solving
the “missing data” problem in causal analysis. The group mean difference between the
treatment and control groups [i.e., E(Yi1) - E(Yi0)] provides consistent and valid estimates
of the ATE.
3.3.2 Observational Studies
Experiments are usually not feasible in public policy research. For example, it is
not normally politically acceptable to randomize participation to welfare and anti-poverty
programs, labor training programs, support programs for businesses, or any other public
programs for that matter.21
Politics usually allow individuals of the target population to
21
Randomization has been allowed in some education innovation programs.

40
self-select themselves into federal, state, or local public programs that they deem
beneficial for themselves. Using randomization, the government, for example, may
award welfare programs only to select qualified applicants while keeping other qualified
applicants in the control group. This is neither ethically nor politically acceptable,
especially in democratic polities. In the context of this dissertation, an experimental
research design to estimate the causal effect of research and innovation policies and
programs is also very difficult to implement politically because it may require, for
example, not awarding R&D program funds to “winning” firms and/or awarding program
funds to “losing” firms just to establish the net contribution of the program to important
output and outcome measures. For all these reasons, policy researchers usually work
with observational or non-experimental data in evaluating public policies and programs.
Rosenbaum (2002, vii) defines an observational study as “an empiric
investigation of treatments, policies, or exposures and the effects they cause… [where]
the investigator cannot control the assignment of treatments to subjects.”
In observational studies, the investigator has no direct control on the allocation of
individuals to treatment or non-treatment states (Cox & Reid, 2000) and accordingly,
treatments are observed (hence, the term “observational”) rather than assigned (Gelman
& Hill, 2007; Brady & Collier, 2004). In short, random assignment is missing. The data
from the KFS survey individually or in combination with other datasets that can identify
firms that benefitted from federal S&T programs is an observational data.
Without random assignment, the CIA assumption does not hold in observational
studies. Therefore, using the group mean difference between treated and untreated
groups cannot identify the ATE. This study follows Morgan and Winship (2007) and

41
calls the difference in observed outcomes of the treated and untreated groups (in
observational studies) the naïve estimator. In this case, we substitute (1) the unobserved
counterfactual outcome of the treated group [i.e., E(Yi0 ׀ Ti=0)] with the observed
outcome of the untreated group [i.e., E(Yi ׀ Ti=0)] and (2) the unobserved counterfactual
outcome of the untreated group [i.e., E(Yi1 ׀ Ti=0)] with the observed outcome of the
treated group [i.e., E(Yi ׀ Ti=1)]. The naïve estimator does not consistently estimate ATE
because (1) E(Yi0 ׀ Ti=0) and E(Yi ׀ Ti=0) and (2) E(Yi1 ׀ Ti=0) and E(Yi ׀ Ti=1) are
rarely equivalent when the CIA assumption is not plausible, and thus the “missing data”
problem is unsolved. The realized outcome of the treated group cannot substitute for the
unobserved counterfactual outcome of untreated group, while the realized outcome of the
untreated group cannot swap for the unobserved counterfactual outcome of the treated
group as in Equations 6.a and 6.b in experimental studies when the independence
assumption holds. The naïve estimator will include a bias, as shown by Angrist and
Pischke (2009):
ATENAIVE = E(Yi ׀ Ti=1) - E(Yi1 ׀ Ti=0)
= [E(Yi1׀ Ti=1) - E(Yi0 ׀ Ti=1)] + [E(Yi0 ׀ Ti=1) - E(Yi0 ׀ Ti=0)] [8]
= ATT + Selection Bias
When the CIA does not hold, the naïve estimator will include a selection bias in
its estimation of ATE. When the CIA holds, the last two terms [i.e., E(Yi0 ׀ Ti=1) - E(Yi0
Ti=0)] of the second line of Equation 8 becomes zero because they will both be equal to ׀
E(Yi ׀ Ti=1) when potential outcomes are independent of the treatment assignment. See
Equations [6.a] and [6.b].

42
The last two terms in Equation [8] is the difference in Yi0s between those who are
treated and those who are not. This is the difference in potential untreated outcome
between the two groups. The selection bias (that results from the difference in Yi0s of the
two groups) can be either positive or negative. If the treated group has higher values of
Yi0s than the untreated group, the selection bias is positive, leading to an overestimation
of the average causal effect. This happens, for example, when those who self-select (or
are selected by program administrators) and eventually admitted to say, a public training
program are those who are better educated than those who did not participate in the
program. The potential outcomes of the better-educated treated group are expected to be
higher than that of the untreated group. In this case, treatment assignment is not
ignorable or is not independent of outcomes; the value of the treatment indicator can
yield information on the value of the potential outcomes. A simple difference in group
means will overestimate ATE. In the same vein, if the treated group has lower values of
Yi0s than the untreated group, the selection bias is negative, yielding an underestimation
or even the elimination of the average causal effect altogether. Using the same example,
a negative selection bias occurs when those who self-select into the job training program
have lower levels of education than those who did not participate in the program.
Letting p equal the proportion of individuals who receives treatment, Morgan and
Winship (2007) further decomposed the naïve estimator into ATE, differential treatment
effect bias, and baseline bias as follows22
:
ATENAIVE = E(Yi ׀ Ti=1) - E(Yi1 ׀ Ti=0)
22
It can be deduced from Morgan & Winship’s (2007) and Angrist & Pischke (2009) decomposition of the
naïve estimator that ATE = ATT + Differential Treatment Effect Between Treated and Untreated Cases.

43
= ATE + (1-p)[ E(i ׀Ti=1) - E(i ׀Ti=0)]
+ [E(Yi0 ׀ Ti=1) - E(Yi0 ׀ Ti=0)] [9]
= ATE + Differential Treatment Effect Bias + Baseline Bias
The differential treatment effect bias is equal to the difference of the treatment
effect between those who self-select into the treatment and those who decided not to
receive treatment. Using the same example above, this type of bias results when the
outcomes of those who are treated increase more than the outcomes of those who are not
treated. In short, the treated participants are more likely to benefit from the treatment
than the untreated participants would if the latter get treated. The baseline bias is
equivalent to the selection bias of Angrist and Pischke (2009) in Equation [8].
To solve selection bias in observational studies, one of the techniques is
covariance control23
either through (1) regression analysis or (2) matching. Angrist and
Pischke (2009) believes that when the CIA and other assumptions of the CLRM24
hold,
the OLS estimate of the coefficient of a binary treatment variable in a regression of a set
of observable attributes X and the treatment variable on an outcome variable can have a
causal interpretation. The strict exogeneity assumption in CLRM is often expressed as
E(εi ׀X) = 0, which also implies that (1) the unconditional mean of the error term is zero,
and (2) the observed covariates X are orthogonal to the error term, that is, E(xjεi) = 0
(Hayashi, 2000). Thus, strict exogeneity assumes the absence of (1) omitted variable
bias, (2) simultaneity, (3) measurement error, (4) sample selection, and
23
Other methods include (1) Heckman’s sample selection model, (2) instrumental variable approach, and
(3) regression discontinuity design. 24
A model is set of restrictions on or assumptions about the joint distributions of the outcome and
explanatory variables (Hayashi, 2000).

44
(5) contemporaneous dependence (Cameron & Trivedi, 2005; Greene, 2003; Woolridge,
2002; Hayashi, 2000), or in the context of Barnow, Cain, and Goldberger’s (1980)
“selection on observables,” covariates X are known and observed. When the assumptions
of the CLRM hold (which include strict exogeneity), the regression coefficient in the
following linear regression model is an unbiased estimate of the average treatment effect
(Angrist & Pischke, 2009):
Yi = τ+ Ti + Xi’γ + εi [10]
The estimate of the parameter is obtained by minimizing the error sum of
squares. Assuming X is a vector of explanatory variables including the treatment
variable T, the OLS estimate of is:
^= (X’X)
T X’Y [11]
The basic assumption that the outcome variable is linear in the treatment variable
may not be plausible in causal analysis. The linearity assumption means that the
treatment variable has a constant marginal effect on the expected values of the outcome
variable Y. This is violated, for example, when the treatment effect is higher for those
who receive the treatment than those who did not receive the treatment had they been
treated. This is the case of differential treatment effect between treated and untreated
cases as discussed above. In causal analysis, a heterogeneous treatment effect is a more
plausible assumption than a constant or homogenous treatment effect. The linearity
assumption of the CLRM is often violated in treatment effects analysis.
More fundamentally, the strict exogeneity assumption in the CLRM model with a
treatment indicator as one of the predictor variables may be very difficult to defend.
Heckman and Robb’s (1989, 1986, 1985 as cited by Morgan and Winship, 2007)

45
decomposition of the ATE coefficient in an OLS regression model showed that OLS will
most likely have an omitted variable bias (and thus violate the strict exogeneity
assumption and the CIA) because of the absence of the variable to measure individual’s
anticipation of the treatment effect, which theoretically is a significant predictor of
outcomes. If this is the case, then the selection is on unobservables (and not on
observables), yielding an omitted variable bias, or simply endogeneity bias. For this
reason, the treatment variable is often modeled as endogenous in causal analysis, and not
as an exogenous variable as in OLS models. Parametric estimators like the OLS are
model dependent and thus, susceptible to bias when the model is misspecified (Ho, Imai,
King, & Stuart, 2007).
Gelman and Hill (2007, p.199) have also shown that “causal inferences are
cleanest if the units receiving treatment are comparable to those receiving the control.”
They believe that it is difficult to control for the confounding covariates through OLS
regression when the distribution of the covariates differ across treatment status.
Moreover, Lee (2005) has argued that regression analysis forces the researcher to
compare incomparable units, and thus the statistical technique is incompatible with the
effort to find the “closest possible world.” This is the reason why Ho, Imai, King and
Stuart (2007) have recommended balancing the data before performing regression
analysis.
An alternative to regression analysis is matching, a method motivated directly by
the counterfactual approach to causation. It aim is to reorganize the original sample
(Gelman & Hill, 2007), or more specifically, to create a synthetic sample (Cameron &
Trivedi, 2005) or a strategic subsample (Morgan & Winship, 2007) that includes a

46
comparison group that is similar in observational attributes to the treated sample. All
treated cases are retained and all unmatched untreated cases (i.e., untreated cases that are
not observationally similar with any of the treated cases) are dropped from this synthetic
sample. The sample of well-matched untreated units can serve as empirical surrogate for
the control group that is constructed by randomization in experimental settings. In this
sense, matching can be construed as an attempt to mimic the randomization process in
experimental studies (Khandker, Koolwal, & Samad, 2010) or to create a “quasi-
experimental contrast” (Morgan & Winship, 2007) by balancing observed covariates X
across treatment status. To review, the consequences of randomization are (1) the
independence of treatment assignment and outcomes, and (2) the balancing of observed
covariates X and unobserved factors ε between treatment and control groups. When the
two groups are balanced and under specific assumptions, the remaining differences in
observed average outcomes between treated and untreated observations can be construed
as the causal or treatment effect.
Once the matched comparison sample has been constructed out of the larger
dataset, causal parameters can be identified by a sample difference in average outcomes
of the two groups. An alternative technique is to use standard regression methods (e.g.,
linear regression, logistic regression) to estimate treatment effect in the area of overlap
(Gelman & Hill, 2007; Ho, Imai, King, & Stuart, 2007).
Matching assumes, in addition to SUTVA and the CIA, that an overlap exists
between the distributions of observed covariates X of the treated and untreated cases.
More formally, the overlap assumption is expressed as:
O<Pr(T=1 ׀ X)<1 [12]
47
The overlap condition requires that there be untreated cases that have the same
covariate distribution as the treated cases. If this assumption is violated, there will be
treated observations that cannot find a good match among the untreated observations.
The CIA and the overlap assumption constitute what Rosenbaum and Rubin (1983) calls
the “strong ignorability of assignment” assumption, which is necessary for identifying the
treatment effect.
Heckman et. al (1998) showed that in the estimation of ATT, the CIA can be
relaxed to mean independence, that is, the untreated outcomes are the same across
treatment states. More formally,
Yi0 ╨ T ׀ X [13]
which implies that,
E(Yi0 ׀ Ti=1, Xi) = E(Yi0 ׀ Ti=0, Xi) = E(Yi0 ׀ Xi) [14]
The ATT as defined in [4] can thus be estimated by:
ATT EstimatorMATCHING = EXi ׀T=1 [E(Yi ׀ Ti=1, Xi) - E(Yi ׀ Ti=0, Xi) [15]
The outer expectation in [15] is taken over the distribution of Xi ׀T=1, that is, the
distribution of observed X in the treatment group. The overlap condition for identifying
ATT requires that the support of X for the treated sample be a subset of the support of X
for the untreated sample (Sekhon, 2008). This implies that untreated observations whose
covariate values are outside of common support will be dropped in the estimation of
ATT. Only treated cases and matched untreated cases are retained in the analysis.
Dropping observations outside of common support will improve unit homogeneity
between treated and untreated cases, making policy and program evaluation more
meaningful (Guo & Fraser, 2010). In addition, Rosenbaum (2005) has shown that

48
improving unit homogeneity25
(a) not only reduces variability of the estimates of
treatment effects, (b) but also their sensitivity to unobserved bias.
One of the advantages of matching estimators is that it is nonparametric. Unlike
the OLS estimator, it avoids the assumption that the treatment effect enters the
conditional mean function linearly (Cameron & Trivedi, 2005). More importantly, since
matching excludes observations outside of common support, the analyst is not forced to
compare incomparable units (Lee, 2005) making causal inferences more meaningful
(Guo & Fraser, 2010). It is also a especially useful method if ATT is the parameter of
interest. In policy analysis and evaluation, we are less concerned about the effect of the
policy, program, or treatment on a randomly selected member of the population, which
the ATE parameter represents. In most cases, the more relevant parameter is ATT, which
the matching estimator (and its variants) can identify.
This dissertation uses matching estimators to construct the counterfactual
outcomes of small business start-ups that received SBIR funding to measure the effect of
public financing on the development of risky early-stage technology.
25
Rubin (1974) and Holland’s (1986) definition of unit homogeneity is sufficient to allow causal inference
without the CIA (Collier, Seawright, & Munck, 2004).

49
CHAPTER 4
DATA AND MODELS
4.1. Implementing Propensity Score Matching and Related Estimators
This dissertation takes advantage of advances in statistical matching techniques to
estimate the causal effect of SBIR on firm outcomes. It also combines matching with
regression-based methods. Following Ho, Imai, King, and Stuart (2007), I also use
standard regression models (e.g. linear and logistic regressions) to estimate the effect of
SBIR after balancing the data. This is to ensure comparison between comparable groups
(following the Neyman-Rubin-Holland counterfactual approach) when performing
regression analysis.
The central idea of matching is to control for observable heterogeneity by finding
in the untreated group “look-alikes” of treated participants. When implemented
manually, matching is a tedious exercise. In practice, matching directly on observable
attributes becomes more difficult the larger the set of covariates to match. This is called
the “Curse of Attribute Dimensionality”. For illustration purposes, let us assume that we
are looking for a “look-alike” or a match of a small business start-up that has 10
employees, is located in California, is currently competing in the computer equipment
industry, performs in-house R&D, recorded a profit in 2005, and is managed by its
owner-founder who has a postgraduate degree. Finding a close match (much less an
exact match) of this SBIR-recipient small firm is very difficult if not impossible. This
dimensionality problem can be significantly reduced by matching on the propensity
score, i.e., the conditional probability of treatment or program participation. Thus,

50
instead of an empirical strategy of constructing a comparison group with identical
covariates X, the alternative strategy, which this dissertation adopts, requires a
comparison group that has a similar distribution of covariates X with that of the treatment
group by matching on the propensity score. The propensity score is formally expressed
as:
Propensity Score = P(T=1׀ X) [16]
Thus, propensity score matching (PSM), which originated from Rosenbaum and
Rubin (1983), is a statistical method to match treated and untreated cases on the basis of
the propensity score, which is a scalar variable, instead of manually matching on a vector
of variables. If the strong ignorability of assignment assumption26
holds, the use of the
matched comparison group to construct the counterfactual outcome of treated cases is
sufficient to remove selection bias, yielding a valid and consistent estimate of the mean
impact of treatment (Heckman et. al, 1998; Rosenbaum and Rubin, 1983).
To summarize, the aim of matching is to balance the covariate distribution
between the treated sample and the matched comparison sample. An important statistical
result from Rosenbaum and Rubin (1983) is that it is enough to match on the conditional
probability of treatment or the propensity score. On average, observations with the same
distribution of propensity scores will have the same distribution of observed covariates X.
Thus, matching on propensity scores, the ATT estimator in [14] can be reexpressed as:
ATT EstimatorPSM = EP(Xi ׀T=1) [E(Yi ׀ Ti=1, Xi) - E(Yi ׀ Ti=0, Xi)] [17]
26
Strong ignorability of assignment assumes both (1) presence of overlap and (2) mean independence. See
Equations 12-15 on pages 46-47.

51
The PSM estimator of ATT in [17] implies that untreated observations whose
propensity scores are outside the support of the propensity scores of the treated
observations will be discarded.
To implement PSM, this dissertation followed the following matching protocol
(Caliendo and Kopeinig, 2008, 2005) to construct the comparison group for treated firms.
First, I divided small business start-ups into (1) those that receive SBIR financing (the
treatment group) and (2) those that did not (potential control group). Second, I ran a
logistic regression to model the participation of small business start-ups in the SBIR
program and obtain estimates of their propensity scores. PSM predicted the probabilities
of participation (propensity scores) of both treated and untreated small business start-ups
using relevant covariates to be discussed in section 4.3. The propensity score model
included variables that affect both treatment assignment and outcomes (Rosenbaum &
Rubin, 1983; Gelman &Hill, 2007).
Third, I excluded from the sample non-recipient small business start-ups whose
propensity scores are either (1) lower than the minimum propensity score of the recipient
small firms or (2) higher than the maximum propensity score of the recipient firms to
satisfy the key identifying assumption of the PSM estimator, which is the presence of a
“common support” between the two groups.
Fourth, I paired each participant i with some group of comparable non-
participants on the basis of the estimated propensity scores. I used the nearest neighbor
matching algorithm i.e., search for non-participant j with the closest propensity score. I
followed Abadie and Imbens (2002) who suggested using four matches for each treated
participant.

52
Fifth, I assessed matching quality. The matching procedure should balance the
distribution of the relevant independent variables in both the treatment and the
comparison group. After the matching, the covariates should be balanced in both groups
and hence no significant difference should be found. If there are significant differences,
covariate balancing is not completely successful and remedial measures are necessary.
For instance, Caliendo and Kopeinig (2005) recommended including high-order
polynomial terms and/or cross-product interaction terms in the estimation of the
propensity score to improve the match between the treatment and comparison groups.
Sixth, I computed the treatment effect as the difference between the mean
outcome of the treatment group and the mean outcome of the comparison group.
Specifically, the input additionality effect is the difference in the mean R&D
expenditures of SBIR recipients and the mean R&D expenditures of observationally
similar non-recipient small business start-ups and the certification effect is the difference
in mean external financing. Estimating the treatment effect on other firm-level outcomes
(e.g. employment and innovation propensities) followed the same approach. For
statistical inference, the standard error of the treatment effect was estimated using Abadie
and Imbens’ (2006) bias-corrected variance estimator.
In the treatment effects analyses, the size of the comparison and treated
subsamples varies from one model to another. PSM balances the covariate distribution of
the recipient and non-recipient groups by dropping untreated observations that are not
observationally similar to the treated cases. Recipient small firms that are off common
support and those with missing values for a particular outcome variable will also be
dropped from the treatment effects analyses.

53
Finally, following Ho, Imai, King, and Stuart (2007) and Gelman and Hill (2007),
I also estimated the treatment effect by using regression-based methods after the
observable characteristics of the treated and matched comparison subsamples.
Regression analysis was only applied within the common support of X between the two
groups. For example, a linear regression as in [10] can be estimated. In the case of a
dichotomous outcome variable, the following logistic regression where is the key
parameter of interest can be fitted by maximum likelihood estimation.
log (Yi/1-Yi) = τ+ Ti + Zi’γ + εi [18]
In a regression framework, the estimate of the treatment effect is the coefficient
() of the binary treatment variable T. The regression coefficient is interpreted as the
difference in mean outcomes between SBIR recipients and non-recipients, holding
constant a set of confounding variables Z in the model. For statistical inference, the OLS
variance estimate V(α^) is:
V(α^) = s
2 (X’X)
-1 [19]
where the estimate of the error variance (s2) = SSE/(n-k) = e’e/(n-k).
27
4.2. Data and Sample
The data for this study comes from the Kauffman Firm Survey (KFS). The
Kauffman Foundation has granted me access to their confidential KFS micro-data
through the data enclave managed by the National Opinion Research Center (NORC).
27
SSE is the sum of squared error, n is the sample size, and k is the number of regressors including the
constant.

54
The KFS is an inflow sample of 4,928 businesses founded in 2004 and tracked ever since.
In an inflow sample, data collection is based on a random sample of all individuals (in
this case, firms) entering the state of interest (in this case, entrepreneurship or operating a
business) and followed until some pre-specified date, or until the spell ends (Jenkins,
2004). In short, the KFS is a longitudinal survey of the same cohort of firms that started
operation in 2004. From a research design standpoint, this inflow sample or cohort
sample structure ensures that the start-up firms faced the same external environment
during their founding year and subsequent years of operation. For example, using an
inflow sample we can dismiss the confounding effect of macroeconomic variables such
as inflation rate, interest rate, or consumer confidence because all members of the
inflow/cohort sample have been exposed to the same external factors since their founding
in 2004. In contrast, using a standard population sample based on a general survey of
firms, we might be comparing a small firm founded in 1980 and a second small firm
founded in 1990. The economic environment in the 1980s is different from that of the
1980s. An inflow or cohort sampling design minimizes confounding factors such as the
effect of a more favorable external environment on starting a business.
I also requested the Small Business Administration (SBA) to provide me a
datasheet of SBIR and STTR recipients from 2004-08.28
The start period of the SBIR
recipient database coincides with the start of the KFS. To identify start-ups in the KFS
sample that also received SBIR financing, I requested the Kauffman Foundation and the
28
SBA provided the data through formal Freedom of Information Act (FOIA) request. I purchased the data
from SBA for $400.

55
Mathematica Policy Research29
to integrate the KFS and the SBIR recipient datasets.
The data integration used the Data Universal Numbering System (DUNS) number of the
sample firms as merging variable. The DUNS number is a unique numeric identifier
assigned to a single business entity making it an ideal merging variable. The integrated
dataset identified 25 small business start-ups that received SBIR financing to develop
new technologies in 2007-08. In the empirical analysis, each of these 25 recipient small
business start-ups is matched with at most four (4) observationally similar non-recipient
small business start-ups.
I restricted the sample of potential controls to small firms. I dropped from the
analysis all start-ups that have more than 500 employees prior to the 2007-08 treatment
period.
4.3. Propensity Score Model
This dissertation estimates the effect of receiving SBIR financing on firm-level
innovation inputs, outputs, and outcomes of small business start-ups. The primary
estimator is the propensity score matching (PSM) estimator. As discussed in Section 4.1,
the propensity score model includes covariates that affect both program participation and
selection and firm-level outcomes (Rosenbaum & Rubin, 1983; Gelman & Hill, 2007).
29
Mathematica conducted the KFS survey for the Kauffman Foundation.
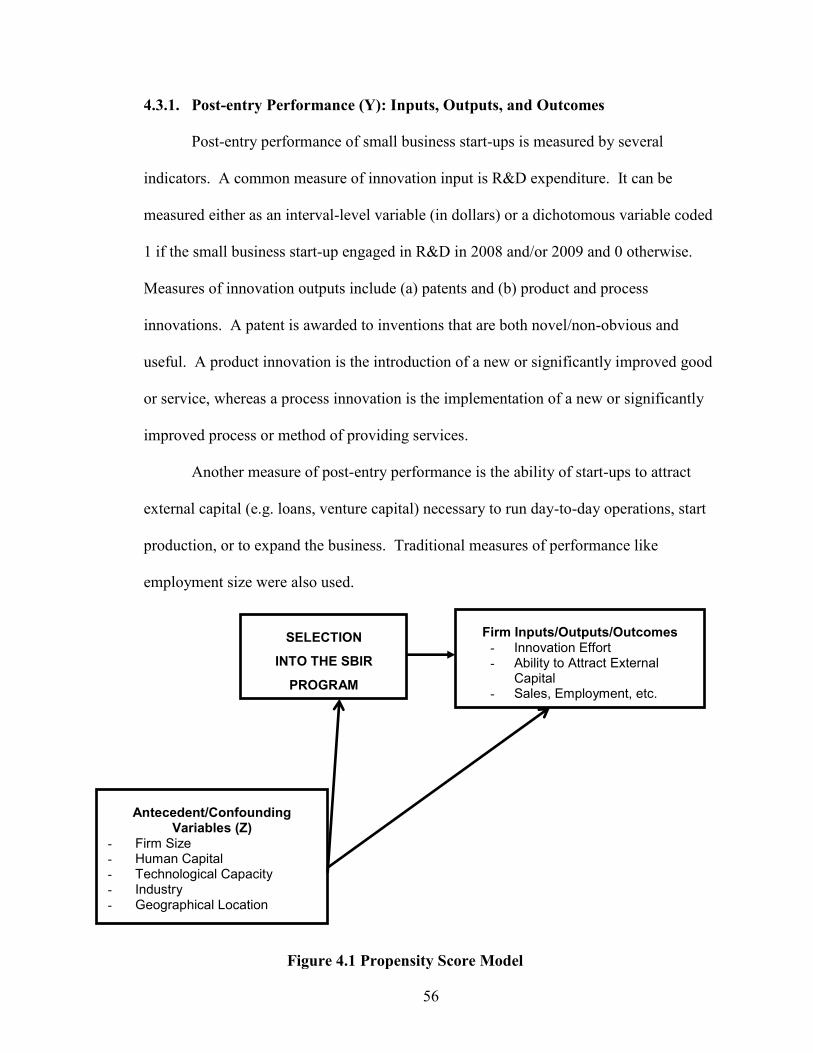
56
4.3.1. Post-entry Performance (Y): Inputs, Outputs, and Outcomes
Post-entry performance of small business start-ups is measured by several
indicators. A common measure of innovation input is R&D expenditure. It can be
measured either as an interval-level variable (in dollars) or a dichotomous variable coded
1 if the small business start-up engaged in R&D in 2008 and/or 2009 and 0 otherwise.
Measures of innovation outputs include (a) patents and (b) product and process
innovations. A patent is awarded to inventions that are both novel/non-obvious and
useful. A product innovation is the introduction of a new or significantly improved good
or service, whereas a process innovation is the implementation of a new or significantly
improved process or method of providing services.
Another measure of post-entry performance is the ability of start-ups to attract
external capital (e.g. loans, venture capital) necessary to run day-to-day operations, start
production, or to expand the business. Traditional measures of performance like
employment size were also used.
Figure 4.1 Propensity Score Model
SELECTION
INTO THE SBIR
PROGRAM
Firm Inputs/Outputs/Outcomes
- Innovation Effort - Ability to Attract External
Capital - Sales, Employment, etc.
Antecedent/Confounding Variables (Z)
- Firm Size
- Human Capital - Technological Capacity
- Industry
- Geographical Location

57
4.3.2. Treatment Variable (T)
The treatment variable is a binary variable coded 1 if the small business start-up
received SBIR/STTR funding in the 2007-08 period and 0 otherwise.
4.3.3. Covariates (X) that Affect Both Treatment Selection (T) and Post-entry
Performance (Y)
I hypothesize that selection into the SBIR/STTR program as well as post-entry
performance are affected by the start-up’s size, human capital, technological capacity,
industry, and location of operation.
4.3.3.1. Firm Size
Larger business start-ups have more resources to attract quality manpower,
withstand random shocks in the external environment, and raise more capital for
operation, production, and expansion. Larger firms are also more likely to possess
specialized complementary assets (e.g. specialized channels of information) to
successfully commercialize a new production technique or product prototype (Teece,
1986).
Firm size can also serve as proxy for the start-up’s efficiency and ability to
compete (Bruderl, Presisendorfer & Ziegler, 1992). Starting a new enterprise is
inherently risky; thus, firms that have larger resource endowments in their initial years
may be firms that are more confident about the efficiency of their production levels and
more optimistic ex-ante about their probability of success in the market. If efficiency and
ability to compete underlie the choice of a start-up’s initial size, then external parties can

58
use firm size to draw inferences about the quality of the firm. Unlike established small
businesses, start-ups do not have a track record to speak of when applying for an SBIR
grant. SBIR reviewers can use firm size as one of the filters to separate start-ups that
have the potential to take advantage of the R&D grant from those that do not. Firm size
is measured by the number of employees of the start-up at the start of its business
operations in 2004.
4.3.3.2. Human Capital of the Entrepreneur
Human capital refers to the knowledge, skills, and experience that the founders or
owners of the start-up possess. It increases the ability of the start-up to compete
successfully. At a strategic level, the knowledge assets of the entrepreneur are critical in
searching for and recognizing new business opportunities that are commercially
promising (Shane, 2000). Research in entrepreneurship and creativity has shown that the
breadth of one’s training and experience strengthens the ability to relate two seemingly
unrelated concepts to create something novel and useful. At the operational level,
greater human capital of the founders increases firm productivity. Owners with more
knowledge and experience are more efficient in organizing and more capable at attracting
clients and external support (e.g. loans, research grants). More knowledgeable and
experienced entrepreneurs also bring with them best-practice organizational routines that
are important in running day-to-day operations and planning for the long-term (e.g. new
markets to exploit and new products and processes to develop). In short, like firm size,
the founders’ human capital can proxy for the expected productivity or efficiency of the
new enterprise. Banks, venture capitalists, and other capital providers as well as SBIR

59
grant reviewers can use observable characteristics like the founder’s human capital to
infer about the quality of the business start-up. I measured human capital by the level of
education and prior work experience of the start-up’s founders.
4.3.3.3. Technological Capacity
Technological capacity refers to the ability of the start-up to generate potentially
commercially useful research. This is typically measured by prior performance of R&D
and patent production. Engaging in R&D is an important innovative activity because it
increases absorptive capacity. A firm’s innovation and over-all performance is also a
function of its ability to scan and exploit the research and innovation of other economic
actors in the country or abroad to generate new or better products and processes. For
example, the compression of hard disk by Seagate, which is very successful
commercially, was derived from the research on giant magneto resistance by two Nobel
laureates in physics from France and Germany. A firm cannot take advantage of the
innovative ideas of other economic agents without the absorptive capacity to understand
the basic science and potential commercial application of these ideas. I measured the
start-up’s technological capacity with prior performance of R&D and the number of
patents it owned and/or produced. Because current technological capacity is a good
predictor of future innovative activities and outputs, I expect reviewers of SBIR grant
applications to favor small business start-ups that have engaged in R&D and/or have
produced intermediate innovation outputs like patents.

60
4.3.3.4. Industry
The value of R&D and innovation varies from one industry to another. Thus, new
technology influences post-entry performance of firms differently. In terms of program
selection, I expect SBIR funds of the top five participating agencies (i.e., DOD, DHHS,
NASA, DOE, and NSF) to accrue disproportionately to small businesses that propose to
perform R&D in areas aligned with the federal missions and mandates of these agencies.
Based on Black (2004) and Feldman (1994), I created the following seven categorical
variables on industrial classification: (1) pharmaceuticals, (2) chemicals, (3) machinery,
(4) electronics, (5) electrical equipment, (6) medical and surgical equipment, and
(7) R&D and engineering services with other sectors as the omitted or reference category.
I expect small business start-ups operating within these seven high-technology sectors to
have greater propensity to apply and be selected into the SBIR program and better post-
entry performance than their counterparts from traditional sectors.
4.3.3.5. Geographical/Locational Effects
Finally, geographical context matters in the post-entry performance of small
business start-ups. Empirical studies have shown that R&D spillovers are prevalent and
their magnitude may be quite large. For example, Jaffe (1986) estimated that firms
generated on average 0.60 patent per $1 million of R&D expenditure of other firms.
More specifically, Jaffe, Trajtenberg, and Henderson (2002) found that R&D spillovers
are localized, i.e., firms from the same state or metropolitan region benefit from each
other’s innovation. Knowledge spillovers are localized because knowledge is sticky (von
Hippel, 1998). Firms need both explicit and tacit knowledge as they go about thinking of

61
new products and processes that can strengthen their competitive advantage. Tacit
knowledge, in contrast to explicit knowledge, lacks extensive codification and thus is not
easily transferable. When knowledge is sticky, the degree of difficulty and cost of
transfer are high. This is so because learning is not just gaining new information; it is
more about building new competencies and learning new skills and applications, which
can be accomplished through “learning-by-interacting” (Lundvall, 1992). The transfer of
tacit knowledge is thus higher in states, regions, or local innovation systems where the
intensity of R&D by firms, universities, and government laboratories is also high.
Greater R&D intensity also attracts highly skilled technical manpower further improving
the efficiency of conducting R&D and other innovative activities. I thus expect start-ups
that are located in states that spend more in R&D to have greater propensity to develop
innovative ideas, prepare stronger SBIR research grant proposals, receive SBIR funding,
and perform better post-entry than their counterparts in states that are less known for their
R&D activities (e.g. Wyoming and South Dakota).

62
CHAPTER 5
DESCRIPTIVE STATISTICS AND THE SBIR PROGRAM
SELECTION MODEL
Chapter Five presents descriptive statistics and results of the SBIR treatment
selection model. The descriptive analysis discusses the characteristics of small business
start-ups prior to receiving SBIR financing and compares and contrasts the same with that
of more than 4,000 potential control firms from the KFS sample. The treatment selection
analysis using a logistic regression model identifies important characteristics of small
business start-ups that contributed to successful SBIR application, selection and
participation.
5.1 The Treated Sample
Table 5.1 on page 63 presents the baseline characteristics of the 25 SBIR-financed
small business start-ups using data from the Kauffman Foundation and the Small
Business Administration. Most small business start-ups that received R&D grants from
SBIR had at most one employee when they started operation in 2004. Only 28 percent of
recipient start-ups had at least two employees and only one hired more than ten
employees initially. The median and mean number of employees of the treated sample
are one and 1.7 employees respectively.

63
Table 5.1 Baseline Characteristics of Twenty Five SBIR-Financed Small Business
Start-ups
Baseline Characteristics
(2004)
Mean Minimum
Value
Maximum
Value
Standard
Deviation
Firm Size Number of Employees
1.68
(1.00)
0.00
15.00
3.17
Human Capital Post-Graduate Education
Industry Experience
0.80
14.4
(15.0)
0.00
0.00
1.00
30.00
0.41
9.24
Technological Capacity Prior R&D Performance Number of Patents
Positive Sales
0.68 3.24
(0.00)
0.65
0.00
0.00
0.00
1.00
35.00
1.00
0.48
7.22
0.49
High-Tech Industry
Pharmaceutical
Chemicals
Machinery
Electronics
Electrical Equipment
Medical/Surgical Equipment
R&D Services
0.08
0.08
0.08
0.24
0.04
0.12
0.28
0.00
0.00
0.00
0.00
0.00
0.00
0.00
1.00
1.00
1.00
1.00
1.00
1.00
1.00
0.28
0.28
0.28
0.44
0.20
0.33
0.21
Geographical Location
Location in R&D Intensive
States (e.g. CA, MA)
0.80
0.00
1.00
0.41
SBA Data Minority Ownership
Women Ownership
0.52
0.56
0.00
0.00
1.00
1.00
0.51
0.51
Note: Statistics in parentheses are median values.

64
Eighty percent of the first owners of SBIR recipients have at least a postgraduate
degree. The median is the master’s degree category and the mode is more impressive at
the doctorate degree category. See Table 5.2 on page 65. The owners of recipient start-
ups are not only highly educated but also have vast and extensive industry experience.
Seventy two percent of owners have at least ten years of experience in the same industry
as his firm is competing in. Only one out of 25 owners did not have any industry
experience. The mean and median length of industry experience of owners of the treated
sample are 14.4 and 15 years respectively.
Seventeen out of 25 (or 68 percent of SBIR recipients) conducted R&D right at
the start of their operation in 2004. In terms of intermediate outputs, close to one-half of
the treated sample already had a patent before the treatment period. See Table 5.3 on
page 65. Ownership of patents indicates that several treated start-ups might have been
spin-off firms from larger firms or new firms established by academic scientists and
engineers who had rights to these patents prior to the start-ups’ formation. Of treated
start-ups with at least one patent, 83 percent had more than one patent and 25 percent had
more than five patents. Three treated start-ups had 8, 11, and 35 patents respectively.
R&D performance and ownership of patents at the start of business operations can signal
potential for future innovations.
Seven SBIR recipient start-ups are operating in R&D and engineering services
and six are electronics firms. The other 40 percent are in surgical and medical equipment
(12 percent), pharmaceuticals (8 percent), chemicals (8 percent), machinery (8 percent),
and electrical equipment (4 percent). Other SBIR recipients (8 percent) are in broad
woven fabric mills and business support services.

65
Table 5.2 Distribution of Level of Education of Owners of SBIR-financed Small
Business Start-ups
Level of Education Valid Percent Cumulative
Percent
Bachelor’s Degree 8.00 8.00
Some Graduate School but No Degree 12.00 20.00
Master’s Degree 36.00 56.00
Doctorate or Professional School 44.00 100.00
Table 5.3 Distribution of Volume of Patents of SBIR-financed Small Business Start-
ups in 2004
Number of Patents Valid Percent Cumulative Percent
0 52.00 52.00
1 8.00 60.00
2 8.00 68.00
3 8.00 76.00
5 12.00 88.00
8 4.00 92.00
11 4.00 96.00
35 4.00 100.00
Table 5.4 Agency Funding Sources of SBIR-financed Small Business Start-ups
Agency Valid Percent Cumulative Percent
DOD only 36.00 36.00
HHS only 24.00 60.00
NSF only 12.00 72.00
DOE only 4.00 76.00
USDA only 4.00 80.00
DOD and NSF 12.00 92.00
HHS and NSF 4.00 96.00
DOD, HHS and NSF 4.00 100.00

66
Twenty SBIR recipients (or 80 percent of the entire treated sample) located their
businesses in R&D intensive states. Twenty one (or 84 percent) are located in
metropolitan or urban areas.
Using data from the Small Business Administration, I will also describe the 25
treated firms in terms of their funding agencies and minority and gender ownerships.
Twenty SBIR recipients received funding from a single agency, four from two agencies,
and one from three agencies. For single-agency SBIR recipients, nine received SBIR
R&D grants from the Department of Defense (DoD), six from the Department of Health
and Human Services (HHS), three from the National Science Foundation (NSF), and one
each from the Department of Energy (DOE) and the Department of Agriculture (USDA).
Three recipient start-ups received funding from both DOD and NSF and a fourth start-up
obtained the R&D subsidy from both the NSF and HHS. The lone treated start-up with
three agency sources of funding received grants from the DOD, HHS, and NSF. Fifty-
two percent of the treated start-ups are minority-owned (i.e., at least one of the owners is
non-White) and fifty-six percent are women-owned (i.e., at least one of the owners is a
woman).
In summary, this analysis not only provides a descriptive account of the types of
small business start-ups that received SBIR R&D subsidies, it also suggests areas to
which the study’s empirical findings can be generalized. The univariate descriptive
analysis of SBIR recipients suggests that the study’s empirical findings (i.e., the SBIR
program selection analysis and the treatment effects analysis) may be limited to start-ups
that operate in electronics, R&D and engineering services, medical and surgical
equipment, pharmaceuticals, chemicals, and electrical equipment and to start-ups that

67
conduct industrial R&D associated with the agency missions and focus research areas of
the DOD, HHS, NSF, and to a limited extent that of the DOE and USDA.
5.2 Comparison of the Treated Sample and Potential Controls
As Table 5.5 on page 68 shows, untreated small business start-ups (that can
potentially serve as controls in the treatment effects analyses) differ in a lot of ways from
the twenty five start-ups that received SBIR financing in 2007-08.
In terms of human capital, the recipient or treated sample is four times more likely
than the untreated sample to have owners with a postgraduate education or training.
Moreover, the owner-entrepreneurs of SBIR recipients had longer experience in the
industry where the start-up is operating and competing. Graduate training (whether it be
a research degree in science and engineering or a professional degree like an MBA) and
prior industry experience of the entrepreneur or primary owner are measures of
capabilities that help in sensing and seizing opportunities from new technologies, product
prototypes, or new services.
Recipient small business start-ups also have a significant initial advantage in
technological capacity. SBIR-financed start-ups are more than three times more likely to
conduct R&D than the untreated group. Start-ups that received R&D subsidies also had
been more productive generating intermediate innovation outputs, specifically patents.
On average, treated start-ups have more than three patents at the end of 2004, while a
majority of the potential controls did not produce or at least purchase a license for a
patent.

68
Table 5.5 Baseline Characteristics by Treatment Status
Baseline Characteristics
(2004)
Potential
Controls
(n=4,000+)
Treated
Small
Business
Start-ups
(n=25)
Difference p-value
Firm Size Number of Employees
1.94
1.68
0.26
0.840
Human Capital Post-Graduate Education Industry Experience
0.20 0.55
0.80 0.72
-0.60
-0.17
0.000 0.095
Technological Capacity Prior R&D Performance Number of Patents Positive Sales
0.21 0.15 0.91
0.68 3.24 0.65
-0.47
-3.09
0.26
0.000 0.000 0.000
High-Tech Industry
Pharmaceutical
Chemicals
Machinery
Electronics
Electrical Equipment
Medical/Surgical Equipment
R&D Services
0.01
0.02
0.04
0.04
0.01
0.002
0.20
0.08
0.08
0.08
0.24
0.04
0.12
0.28
-0.07
-0.06
-0.04
-0.20
-0.03
-0.118
-0.08
0.000
0.014
0.350
0.000
0.204
0.020
0.346
Geographical Location
Location in R&D Intensive
States (e.g. CA, MA)
0.84
0.80
0.04
0.594
69
A significantly larger proportion of SBIR-backed start-ups are in the fields of
pharmaceuticals, chemicals, electronics, and medical/surgical equipment. A larger
percentage of treated start-ups are also operating in other high-tech areas like machinery,
electrical equipment, and R&D and engineering services, but the differences in
proportions between recipient and non-recipient start-ups are not significantly different
from zero.
Untreated start-ups, in contrast, have an advantage over SBIR recipients in
employment size, sales performance, and location in R&D intensive states. Ninety one
percent of the potential controls sold goods and/or services in 2005 compared to only 65
percent of SBIR-financed small business start-ups. The 25 percentage point advantage of
untreated start-ups over their treated counterparts is statistically significant (p<0.001).
However, the same cannot be said of firm size and location advantages of non-recipient
start-ups. On average, untreated and treated start-up had 1.9 and 1.7 employees in their
initial year of operation, but this difference is both substantively and statistically
negligible (p<0.85). The potential controls are four percentage points more likely to
locate their operations in top R&D performing states like California and Massachusetts
than did SBIR recipients, but this difference is also not statistically significant (p<0.60).
We cannot rule out the possibility that such difference across treatment status is due to
random chance.

70
5.3 SBIR Treatment Selection Analysis
This section identifies the most important firm-level characteristics that contribute
to successful application and selection into the SBIR program. The analysis is interesting
for many reasons, chief of which is the fact that the program selection model involves
small firms that were new to the industry at that time and thus had no prior track record
or established reputation to stand on. A track record of success (or at least a strong
indication of potential to succeed) is important in securing scarce R&D resources. Table
5.6 on page 72 shows the empirical results of the treatment selection analysis, reporting
logit coefficients as well as unstandardized and standardized odds ratios.
In the sample, employment size has a negative effect on the probabilities of being
awarded an SBIR grant in 2007-08. Start-ups with more employees are less likely to be
selected into the SBIR program. The estimated standard error, however, is too large to
generalize such a conclusion from the sample back to the larger population from which
the KFS sample was drawn. The same is true for the industry experience of the
owners/entrepreneurs: it had the expected sign but the estimated logit coefficient is also
not statistically significant. The estimate of its impact or effect is less than two standard
errors from zero, indicating that random chance or variation cannot be ruled out as an
explanation for the difference in the likelihood of being awarded an SBIR subsidy
between start-ups that have owners with at least 10 years of industry experience and those
that do not, all things being equal. It is possible that this type of human capital of small
business start-ups do not have an effect on the odds and probabilities of receiving an
SBIR award.

71
The level of education of the start-ups’ owners has a positive impact on the
likelihood of receiving an SBIR subsidy. The odds that a start-up whose owner has a
postgraduate degree or training will receive an SBIR grant are 7.3 times as high as the
odds of a start-up without an owner with such advanced academic training, all things
being equal. Conducting R&D at the start of operations also predicts a start-up’s
selection into the SBIR program. A start-up’s odds of receiving SBIR if it performed
prior R&D are 3.6 times as high as the odds of a non-R&D performing start-up, holding
the other variables in the selection model constant. The number of patents a start-up
possessed at the initial year of operation also positively impacts the likelihood of being
granted an R&D subsidy from the SBIR program. As the number of patents rises by one,
the odds of receiving an SBIR award rises by 4 percent, ceteris paribus.
SBIR selection is also a function of the type of industry where the start-up operates and
competes. As expected most industries that are classified as high-tech have a significant
advantage in securing SBIR funds over traditional sectors like agriculture and mining and
the services sector like education and banking and finance. The odds of a start-up
operating in the pharmaceuticals, chemicals, machinery, electronic, electrical equipment,
and medical/surgical equipment industries of receiving an SBIR grant respectively are
26.5, 27.3, 15.4, 25.6, 20.6 and 186.5 times as high as the odds of a start-up in the low-
technology sector. The differences in the odds of six high-tech sectors and the traditional
sectors, which is the omitted category, are all significant at the 5 percent level. In
contrast, start-ups in R&D and engineering services have no significant odds advantage
in securing SBIR subsidy over traditional and service sectors.

72
Table 5.6 SBIR Program or Treatment Selection Model
Variables Logit
Coefficient
(b)
Odds
Ratio
(eb)
Standardized
Odds Ratio
(ebStdX
)
Z-statistics p-value
Firm Size Number of Employees
-0.03
0.97
1.20
-0.48
(0.068)
0.634
Human Capital Post-Graduate Education
Industry Experience
1.99
0.22
7.33
1.24
2.27
1.11
3.63
(0.549)
0.43
(0.507)
0.000
0.667
Technological Capacity Prior R&D Performance
Number of Patents
Positive Sales
1.28
0.04
-1.15
3.60
1.04
0.32
1.70
1.10
1.38
2.53
(0.506)
1.87
(0.088)
-2.23
(0.518)
0.011
0.061
0.026
High-Tech Industry
Pharmaceutical
Chemicals
Machinery
Electronics
Electrical Equipment
Medical/Surgical Equipment
R&D Services
3.28
3.31
2.74
3.24
3.02
5.23
1.38
26.51
27.27
15.45
25.64
20.55
186.51
3.98
1.33
1.50
1.73
1.82
1.40
1.30
1.75
3.03
(1.081)
3.12
(1.059)
2.51
(1.091)
3.74
(0.808)
2.38
(1.271)
4.57
(1.144)
1.60
(0.861)
0.002
0.002
0.012
0.000
0.017
0.000
0.109
Geographical Location
Location in R&D Intensive
States (e.g. CA, MA)
-1.00
0.37
1.44
-1.77
(0.564)
0.077
N=3,886, LR =103.49, Prob>LR=0.000. Standard errors are in parentheses.

73
Geographical location is statistically significant at the less restrictive 10 percent
level.30
The odds of a start-up that is located in R&D intensive states like California and
Massachusetts receiving an SBIR grant are only 0.37 times as high as the odds of a start-
up operating in states that conduct less R&D. This result may provide empirical evidence
for the distributional function of the SBIR program. SBIR R&D subsidy grants are more
likely to be distributed to small business start-ups that lack the advantage of knowledge
spillovers from intense research and development activities of universities, research
laboratories, and firms within their respective local innovation systems.
Using standardized odds ratios, the postgraduate education of the start-ups’
owners has the strongest impact on the odds of being selected into the SBIR program,
followed by operating in the electronics sector. Among covariates with significant logit
coefficients, the number of patents that a start-up possessed prior to application appears
to have the weakest impact; a one standard deviation increase in the volume of patents
increases the odds of receiving SBIR only by 10 percent. Having sales, on the other
hand, decreases the odds of being granted an SBIR subsidy by 38 percent.
Before I discuss the effect of covariates on the probabilities of being selected into
the SBIR program, a digression into a few fundamental assumptions of the logistic
regression model may be in order. The logistic regression model estimated by maximum
likelihood estimation (MLE), in contrast to the linear probability model (LPM) estimated
by Ordinary Least Squares (OLS), assumes a nonlinear and non-additive effect of the
30
Assuming the null hypothesis, there is one out of ten chance of concluding that the odds advantages are
real when in fact there are no differences between the odds and probabilities of receiving SBIR funds
between the two geographical locations in the larger population, holding the rest of the variables in the
selection model constant.

74
explanatory variables on the probability of receiving an SBIR grant. LPM’s linearity
assumption means that a one-unit change in one of the covariates, say X1, has a constant
marginal effect on the predicted probabilities of the dichotomous outcome variable. A
nonlinear assumption that the effect of Xk on predicted probabilities would be larger near
the floor or ceiling than near the middle makes more theoretical sense. In a model
explaining selection into the SBIR program, it is more reasonable to assume that an
increase in patents from 3 to 4 will have a smaller impact on predicted probabilities of
SBIR participation than an increase in patents from 0 to 1 or 34 to 35. LPM’s additivity
assumption means that the predicted values of the dichotomous outcome variable depend
on the sum of the marginal effects of all explanatory variables from X1, X2 to Xk.31
A
non-additive assumption also make much more theoretical sense because it seems more
likely that if one of the explanatory variables (say X1) has reached a sufficiently high
level to push the predicted probability near 0 or 1, the effects of other covariates from X2
to Xk cannot have much influence. In the SBIR selection model, if the number of patents
reaches a sufficiently high level, it is very reasonable to assume that the other Xs will
have little influence on predicted probabilities of SBIR selection. This is the same as
saying that the effect of Xk on predicted probabilities depend on the prior values of Xk.
Because the effect on probabilities from a one-unit increase in Xk is nonlinear and
non-additive, there are multiple ways of presenting probabilities changes in logistic
regression analysis. Most of these methods calculate probability changes as Xk increases
by one-unit while holding the rest of the variables in the model constant at their means
31
At extreme values of the Xs, LPM’s additivity assumption may force predicted probabilities above 1 or
below 0, outside the range of a probability.

75
(Lewis, 2012). Since most of the explanatory variables in the SBIR selection model are
dichotomous or a group of dummy variables, it is not meaningful to hold these variables
at their means. Instead, I chose a base start-up, calculated its predicted probability of
being selected into the SBIR program, and changed one or more variables at a time. The
base start-up is a small firm that is owned by an individual with advanced postgraduate
training, performed R&D at the initial year of operation, had three patents in the same
period, and is operating or competing in the electronics sector. The predicted probability
of this start-up is 21.0 percent. The predicted probability of a start-up with the same set
of characteristics but without an owner who has an advanced academic training is 3.5
percent or a drop of 17.5 percentage points. A start-up with the same set of
characteristics but did not perform R&D only has a 6.9 percent chance of being awarded
an SBIR subsidy or a decrease in probability by 14.1 percentage points. A start-up that
differs with the base start-up only on the fact that it operates in the low-technology sector
has a predicted probability of only 0.6 percent or a drop of 20.4 percentage points. These
effects on probability changes are consistent with the effects on the odds of being
selected into the SBIR program.
In addition to the tests of single coefficients using the Wald test, I also performed
a significance tests for three groups of variables. See Table 5.7 on page 76. The test of
human capital variables indicates that these variables are jointly significant at the 0.01
level. We have sufficient evidence from the sample data that not all human capital
variables (i.e., education of owner, industry experience of owner, and number of
employees) have zero effect on the odds and probabilities of receiving SBIR award. The
same can be said of the technological capacity variables (i.e., prior performance of R&D,

76
volume of patents, and sales). Finally, the seven industrial dummies are jointly
significant; at least one of the high-tech sectors have a differential effect on the odds and
probabilities of SBIR selection relative to that of the traditional sector and the service
sector.
The likelihood ratio test rejects the null hypothesis that all the variables included
in the logistic regression model have no effect on SBIR selection. See Table 5.6 on page
72.
Table 5.7 Significance Tests of Groups of Covariates
Groups of Variables Degree of
Freedom
LR Chi-square
statistics (χ2*
)
Prob>χ2*
Human Capital Variables including
Number of Employees
3 13.78 0.003
Technological Capacity Variables 3 15.25 0.002
Industrial Classification Dummy
Variables
7 31.94 0.000
Note: The null hypothesis is the logit coefficients of the variables are simultaneously
zero.
5.4 Discussion
Financially successful start-ups are significantly different from the typical or
average start-up (Shane, 2008 ). The application for public financing for R&D
specifically SBIR grants tells the same story: those who applied for and were eventually
granted with SBIR funds are significantly different from the typical start-up that started
operation in 2004.
As expected, the training and education (p<0.001) of owners of small business
start-ups significantly predict SBIR selection. As previously discussed in more detail in
the previous chapter, the education of the entrepreneurs captures the cognitive ability to

77
sense and seize technological opportunities that others may fail to perceive as both
technically feasible and commercially promising. These promising technology research
areas are pursued and proposed by highly educated entrepreneurs and are also more likely
to have been judged technically and commercially sound by grant reviewers of SBIR
participating agencies. Because the breadth of one’s training and education can increase
the ability to combine unrelated concepts to create something that consumers value, it is
thus plausible that highly educated entrepreneurs are more creative, more sophisticated in
packaging R&D grant proposals, more technically savvy in pointing to the technological
gaps that their proposed R&D will fill, and thus, tend to be more successful in SBIR
application and selection. Secondly, the entrepreneur’s advanced level of education can
also serve as proxy for the extent of his or her network in the scientific or academic
community. The priority research areas of SBIR participating agencies are not created in
a vacuum; they consider technical inputs from academic scientists and engineers as well
as entrepreneurs in the high-technology business sector. Highly educated entrepreneurs
are more likely to interact with this network of scholars/researchers and high-technology
entrepreneurs, and thus, may be more likely to spot opportunities within current priority
SBIR research areas. For entrepreneurs who used to be a member of the academic and
scientific community (as Ph.D. students and/or university professors/researchers), it is
plausible that they may have directly or indirectly provided inputs to SBIR research
areas.
As also expected, performing R&D (p<0.05) and owning knowledge assets,
specifically patents (p<0.10), increase the likelihood of receiving SBIR grants. There are
at least two reasons for this empirical result: internal and external. First, those who

78
perform R&D are more likely to sense technological dead-ends, and thus, are more likely
to propose technologically sound SBIR proposals. This ability to separate technically
promising areas from technological dead-ends, which can be acquired by performing
R&D right at the start of business operations, increases the probability of SBIR funding.
The external reason has something to do with the reputation of the proponent small firm.
Reviewers of SBIR grant applications are more likely to favor proponents who have
engaged in R&D, believing that R&D experience increases the firm’s absorptive
capacity, which enhance success in producing innovations from R&D grants. In addition
to indicating successful innovation record, owning patents may further encourage firms to
apply for R&D grants. Because innovation is highly complex, that is, it might take a
combination of multiple patents to produce a product, process, or service that consumers
value, it is plausible that patent-owning start-ups are thinking of generating new patents
(out of the public R&D grant), which they will combine with what they currently own to
generate innovation. In sum, patent owners are more likely to sense they need a portfolio
of knowledge assets to produce innovation, and thus, are more likely to exploit external
R&D resources (e.g. SBIR grants) in order to be more successful in orchestrating inputs
for innovation.
The industry where the start-up chose to compete or operate significantly predicts
the probability of SBIR participation. The odds of receiving SBIR funds of small
business start-ups in the pharmaceutical (p<0.01), chemical (p<0.01), machinery
(p<0.05), electronics (p<0.001), electrical equipment (p<0.05), and medical and surgical
equipment (p<0.001) are at least 15 times as high as the odds of those in the traditional
sectors including the services sector. Of course, this empirical result is hardly surprising.
79
The goal of the SBIR is to stimulate technological innovation, specifically along the
mission areas of the 11 participating SBIR agencies. The seven high-tech industries are
more likely to correspond with the federal missions and mandates of at least the top five
SBIR agencies: DOD, HHS/NIH, NASA, DOE, and NSF. Ninety-six percent (i.e., 24 out
of 25) of SBIR recipient small business start-ups obtained their SBIR R&D funding
either from the DOD, HHS/NIH, NSF and DOE or a combination of these.
The hypothesis that firm size (p<0.70) positively contributes to SBIR selection is
not supported. A possible reason is that basic technology research by start-ups is owner-
specific. The quality of SBIR grant proposals may depend on the owner-entrepreneur
more than his or her own employees. The industry experience (p<0.70) of the owner,
however, does not matter in SBIR selection. While we hypothesized that more
experienced entrepreneurs were more likely to bring with them best-practice
organizational routines that are important in running day-to-day operations including
R&D, these routines may not be that important in developing quality proposals and
therefore in obtaining SBIR awards. Surprisingly, start-ups without sales (p<0.05) are
more likely to receive SBIR awards. I can proffer at least two explanations. First, start-
ups that are looking at long-term R&D as their source of future competitive advantage are
more likely to forego production and sales in favor of more R&D. Second, small firms
without any short-term inclination or plan to sell goods and services are being created by
opportunistic entrepreneurs just for the sole purpose of securing SBIR funds. These two
explanations/hypotheses can be tested in future research on SBIR recipient firms.
Finally, there is some evidence that geographical location (p<0.10) matters, but
surprisingly, it works at the opposite direction, that is, start-ups in states that are known

80
for R&D and innovative activities are less likely to receive SBIR grants. The literature
on knowledge and technological spillovers (Jaffe & Trajtenberg, 2002) predicts that the
innovating firm benefits from the R&D conducted by universities, government research
laboratories, and other firms within its local innovation system. These spillovers will
enhance the quality of firms’ R&D including their proposal for public R&D grants. It
appears that a different mechanism might be at play here. First, start-ups in less R&D
intensive locations may correctly perceive that they are at a disadvantage (due to less
technological spillovers) and decide to conduct more R&D on their own with the help of
federal R&D grants. Thus, it is plausible that start-ups at less R&D intensive states are
more likely to apply for SBIR grant in order to conduct R&D on their own instead of
relying on research spillovers, which may or may not come (Feldman, 1994). Second,
SBIR participating agencies may also sense that small firms in locations with few
technological spillovers are at a disadvantage and may decide to distribute SBIR awards
evenly between R&D intensive states (e.g. CA and MA) and those that are not well
known for their R&D activities, without having to sacrifice the quality of funded SBIR
R&D projects. The empirical finding that SBIR funding (at least for small business start-
ups) are geographically distributed or dispersed is important. It can offer a political
explanation why the SBIR continues as a federal technology program while others like
the Advanced Technology Program (ATP) have been terminated. Start-ups from states
(e.g. Wyoming and South Dakota) that are not known for their R&D may also benefit
from the SBIR program.32
Specifically for the KFS-SBA dataset, start-ups from Utah,
32
South Dakota and Wyoming, ranked 50th
and 51st in R&D performance respectively, spent only $149

81
Vermont, South Carolina, and Montana also received SBIR funding.33
Elected political
representatives in the U.S. Congress are more likely to support public programs that
benefit their respective constituencies.
million and $98 million in 2004. In contrast, California spent $59.6 billion in R&D in the same period. 33
Montana is ranked 48th
in R&D performance, spending only $295 million in 2004. The 25th
ranked state,
Missouri, spent $ 3 billion in R&D in the same period.

82
CHAPTER 6
TREATMENT EFFECT ON POST-ENTRY PERFORMANCE
Chapter Six discusses the empirical evidence on the treatment effect of the SBIR
program on the innovation effort, external capital infusion, and other metrics of post-
entry performance like sales and employment size of small business start-ups.
6.1 Outcome Variables by Treatment Status
Table 6.1 on page 84 presents statistics on binary outcome variables by treatment
status. Except for two variables (i.e., borrowing from banks and licensing out of patents
in 2009), all differences in proportions with respect to relevant outcome variables
between treated and untreated small business start-ups are statistically significant at the 1
percent level.
While SBIR recipients are 9.2 percentage points more likely to license out a
patent in 2009 than non-recipients, the difference is not significant at the 5 percent level.
Table 6.3 on page 86 shows the ratio of the odds of licensing out a patent between
recipient and non-recipient start-ups, which is also not statistically significant. Treated
and untreated start-ups are also equally likely to borrow from banks in 2009, one year
after the treatment period (odds ratio =0.95, p<0.97).
Focusing only on outcome variables that are significantly different across
treatment status, Tables 6.2.1 to 6.2.4 on pages 85-86 present two-way contingency table
analyses of the relationship or association between receiving SBIR funding and (a) R&D
performance in 2008; (b) innovation propensity in 2009; (c) licensing-in of patents in

83
2009; and (d) loan borrowings from government agencies in 2009. Table 6.3 on page 86
also provides the odds advantages of SBIR recipients over non-recipients on the same set
of outcome variables.
With a gamma statistic of 0.95, receiving SBIR grant and the performance of
R&D in 2008 are strongly positively related. SBIR grantees are 72.6 percentage points
more likely to engage in R&D in 2008 than non-recipients (p<0.001). The introduction
of innovation in 2009 and receiving SBIR in 2007-08 are also strongly positively related
in the sample (gamma=0.80). The odds that a SBIR grantee introduced an innovation in
2009 were more than nine times as high as the odds of a non-grantee (p<0.001).
Interestingly, SBIR recipients were 24.7 percentage points more likely to license in a
patent in 2009 than did non-recipients (p<0.001). The positive association between the
two variables is strong with a gamma statistic of 0.91. Finally, the odds of the treated
group borrowing from government agencies was almost 20 times as high as the odds of
the untreated group (p<0.01).
Table 6.4 on page 86 presents tests of differences in interval-level outcome
variables between treated start-ups and the potential control group. On average, the
treated subsample spent $691,623 in R&D in 2008 while the potential control group spent
only $18,490. This difference is statistically significant at the 0.1 percent level. In terms
of intermediate innovation outputs, SBIR recipients had, on average, about a four patent
advantage over non-grantees in 2009, and this difference is also statistically significant at
the 0.1 percent level. In terms of firm size, non-recipients had grown to about four
employees in 2009 while recipients to nine employees, on average. The five-employee

84
advantage in 2009 of the treated group over the potential control group is statistically
significant at the 5 percent level.
Table 6.1 Binary Outcome Variables by Treatment Status before Matching
Outcome Variables
(2008-09)
Potential
Controls
Treated Difference
in
Proportions
z statistic p-
value
R&D Performance 0.169 0.895 -0.726 -8.303 0.000
Introduction of Innovation 0.142 0.600 -0.458 -5.819 0.000
Licensing- out of Patents
0.096
0.188
-0.092
-1.09
0.138
Licensing- in of Patents in
2009
0.016
0.263
-0.247
-8.147
0.000
External Capital from Family,
Friends, Other Individuals in
2009
0.041
0.000
0.041
0.803
0.789
External Capital from
Government Agencies in 2009
0.003
0.056
-0.053
-3.86
0.000
External Capital from Banks in
2009
0.058
0.056
0.002
0.045
0.518
External Capital from Gov’t,
Banks and Other Financial
institutions
0.070
0.167
-0.097
-1.592
0.056
External Capital from All
Sources in 2008
0.147
0.176
-0.029
-0.346
0.364
External Capital from All
Sources in 2009
0.154
0.200
-0.046
-0.491
0.312

85
Table 6.2.1 R&D Performance in 2008 by Treatment Status
Treatment Status
Total
0
Non-
recipients
1
SBIR
Recipients
R&D
Performance in
2008
0 No Column Percentage 83.1% 10.5% 82.6%
1 Yes Column Percentage 16.9% 89.5% 17.4%
Total Column Percentage 100.0% 100.0% 100.0%
γ=0.9532; chi-square statistic = 68.94, p<0.000
Table 6.2.2 Innovation Propensity in 2009 by Treatment Status
Treatment Status
Total
0
Non-
recipients
1
SBIR
Recipients
Introduction of
Innovation in
2009
0 No Column Percentage 85.8% 40.0% 85.6%
1 Yes Column Percentage 14.2% 60.0% 14.4%
Total Column Percentage 100.0% 100.0% 100.0%
γ =0.801, χ2 statistic = 33.86, p<0.000
Table 6.2.3 Licensing-in of Patents in 2009 by Treatment Status
Treatment Status
Total
0
Non-
recipients
1
SBIR
Recipients
License-out
Patents in 2009
0 No Column Percentage 98.4% 73.7% 98.2%
1 Yes Column Percentage 1.6% 26.3% 1.8%
Total Column Percentage 100.0% 100.0% 100.0%
γ =0.9142, χ2statistic = 66.38, p<0.000

86
Table 6.2.4 Borrowing from Government Agencies in 2009 by Treatment Status
Treatment Status
Total
0
Non-
recipients
1
SBIR
Recipients
Borrow from
Government
Agencies in 2009
0 No Column Percentage 99.7% 94.4% 99.7%
1 Yes Column Percentage 0.3% 5.6% 0.3%
Total Column Percentage 100.0% 100.0% 100.0%
γ =0.90, χ2 statistic = 14.88, p<0.000; p<0.06 (Fisher’s exact test)
Table 6.3 Odds Ratio by Treatment Status
Outcome Variables (2008-09) Odds
Ratio
z statistic p-value
R&D Performance 41.7 4.98
0.000
Introduction of Innovation 9.05 4.81 0.000
Licensing- out of Patents 2.18 1.07 0.286
Licensing- in of Patents 22.3 5.69 0.000
External Capital from
Government Agencies
19.95 2.73 0.006
External Capital from Banks 0.95 -0.05 0.964
External Capital from Gov’t,
Banks and Other Financial
institutions
2.65 1.53 0.126
External Capital in 2008 1.25 0.35 0.730
External Capital in 2009 1.37 0.49 0.625
Table 6.4 Interval-level Outcome Variables by Treatment Status
Outcome Variables
(2008-09)
Untreated Treated Difference
in Means
t
statistic
p-
value
R&D Expenditure in 2008 18,490.4 691,622.6 - 671,132.2 -10.71 0.000
Number of Employees in 2009 3.93 9.05 -5.12 -1.82 0.035
Number of Patents in 2009 3.19 7.07 -3.87 -3.41 0.001
87
6.2 Propensity Score Matching
The bivariate descriptive and inferential analyses using contingency tables and
test of differences in proportions and means between treated and untreated small business
start-ups through chi-square, z, and t tests are not rigorous because antecedent variables
that may covary with both treatment status and relevant outcome variables like R&D
expenditures and innovation propensities have not been controlled for. As shown in
Table 5.5 on page 68, treated and untreated small business start-ups significantly differed
in baseline characteristics that can potentially confound the relationship between
treatment status and outcome variables.
I controlled for potential confounders through propensity score matching. I
predicted the propensity score (or probability of treatment selection) of all small business
start-ups in the KFS sample and match SBIR recipients with non-recipients with the
nearest propensity scores using the nearest-neighbor matching algorithm. The propensity
score model or treatment selection model fits the data well (likelihood ratio χ2= 103.49,
p<0.001).
More than 4,000 start-ups that did not receive SBIR funding are matched with the
treated subsample. Consistent with the propensity score theorem (Pearl, 2009), units with
identical or nearly identical propensity scores have, on average, the same distribution of
covariates, which in this case, are antecedent variables that confound the relationship
between receiving SBIR subsidy and firm-level outcomes. Table 6.5 on page 88 presents
the test of differences in means and proportions of these explanatory variables. The null
hypotheses cannot be rejected at the 5 percent level indicating that the distributions of

88
human capital, technological capacity, geographical location, and industrial classification
are not significantly different across treatment status.
Table 6.5 Difference in Means of Covariate after Matching
Baseline Characteristics
(2004)
Matched
Comparison
Group
Treated
Small
Business
Start-ups
Difference p-value
Firm Size Number of Employees
1.25
1.17
0.08
0.891
Human Capital Post-Graduate Education Industry Experience
0.68 0.82
0.83 0.72
-0.15
0.10
0.219 0.394
Technological Capacity Prior R&D Performance Number of Patents Positive Sales
0.53 1.96 0.65
0.61 1.94 0.72
-0.08
0.02
-0.07
0.529 0.995 0.566
High-Tech Industry
Pharmaceutical
Chemicals
Machinery
Electronics
Electrical Equipment
Medical/Surgical Equipment
R&D Services
0.11
0.07
0.07
0.21
0.11
0.05
0.19
0.06
0.11
0.06
0.22
0.06
0.11
0.28
0.05
-0.04
0.01
-0.01
0.05
-0.06
0.09
0.527
0.577
0.828
0.916
0.527
0.386
0.444
Geographical Location
Location in R&D Intensive
States (e.g. CA, MA)
0.74
0.72
0.02
0.903

89
6.3 Treatment Effects Estimates
Tables 6.6.1 and 6.6.2.on pages 91-92 present the results of the treatment effects
analyses. For comparison purposes, the analyses provide three treatment effect estimates:
(1) estimate from the naïve estimator, derived as the difference in group means between
SBIR recipients and all potential controls; (2) estimate from propensity score matching,
which is the difference in group means between SBIR recipients and their well-matched
non-recipient counterparts; and (3) estimate from OLS regression within common
support, i.e., the estimate from fitting a least squares regression using only data from the
homogenous sample of recipient start-ups and their observationally similar non-recipient
counterparts.
The size of the treated and matched comparison subsamples differ from one
model to another. For example, Model I has a total of 75 observations while Model VI
only includes 72 cases. As discussed in the methods and data chapters, treatment effect
analyses through PSM drop treated or untreated observations whose propensity scores are
off common support. All cases with missing values in a particular variable are also
excluded from the estimation of the ATT. For example, in Model I, one treated
observation was dropped from the analysis because it is off common support (i.e., PSM
did not find any counterfactual for this SBIR recipient firm), six had missing values in the
outcome variable and any of the covariates balanced in the SBIR selection model and
thus were also excluded, and only 57 untreated cases have the same covariate distribution
as the 18 treated cases retained in the analysis.
As expected, SBIR recipients are more likely to perform R&D in 2008 than
observationally-similar start-ups that did not obtain an SBIR R&D subsidy. Focusing on

90
the PSM estimator, 19 out of 57 matched non-recipients (or 33 percent) performed R&D
in 2008 compared to almost 89 percent of SBIR recipients. This 56 percentage point
difference in the probability of small business start-ups to conduct R&D in 2008 is
statistically significant at the 0.1 percent level. The odds of an SBIR recipient
performing R&D in 2008 is 16 times as high as the odds of a non-recipient (p<0.001),
holding constant human capital, technological capacity, geographical location, and
industrial classification. The OLS estimate of the same probability difference is close at
49 percentage points (p<0.001).
How much is the actual R&D expenditure advantage of treated start-ups?
Without propensity score matching, the estimate of the advantage is $672,092 (p<0.001).
After balancing the covariates, the treatment effect estimate is reduced to $477,900, but it
remains statistically significant at the 5 percent level. On average, SBIR recipient start-
ups spent $663,379 while their observationally similar non-recipient counterparts spent
only $185,479. See Figure 6.1 on page 92. The OLS estimate of the R&D expenditure
advantage of SBIR recipients over non-recipients is slightly smaller at $442,412
(p<0.05). In Model III in which the outcome variable is the natural logarithm of the total
R&D expenditure in 2008, SBIR recipient start-ups spent at least 234 percent more in
R&D than their observationally similar non-recipient counterparts.
SBIR recipients also have a decisive advantage over their observationally-similar non-
recipient counterparts in the introduction of product and process innovations in 2009.
PSM and OLS estimate that SBIR-financed start-ups are 33 and 39 percentage points
respectively more likely to introduce innovation in 2009 than start-ups not supported by
the R&D subsidy program for small businesses (p< 0.01). The odds of the treated

91
subsample in introducing innovation are about four times as high as the odds of the
matched untreated subsample.
Table 6.6.1 Average Treatment Effects on the Treated (ATT) Estimates: R& D and Innovation
Models Outcome
Variable
Treated
Subsample
Matched
Untreated
Subsample
Total
Sample
Size
Treatment Effect Estimate
Naïve
Estimator
PSM
Estimator
Regression
within
Common
Support
Model I R&D
Performance in
2008
18 57 75 0.73***
(8.57)
0.56***
(4.80)
0.49***
(5.15)
Model II R&D
Expenditure in
2008
18 57 75 672,092***
(10.31)
477,900*
(2.00)
442,412*
(1.97)
Model III Log R&D
Expenditure in
2008
12 35 47 3.56***
(6.73)
2.55***
(3.74)
2.34**
(3.36)
Model IV Innovation
Propensity in
2009
18 49 67 0.47***
(5.51)
0.33*
(2.18)
0.39*
(2.36)
Model V Licensing-out
of Patents
13 26 39 0.09
(0.098)
0.19+
(1.46)
0.16
(1.25)
Model VI Licensing-in of
Patents
18 54 72 0.25***
(8.36)
0.22*
(2.20)
0.16*
(1.72)
Model
VII
Patent Size 11 17 28 3.98**
(3.38)
1.34
(0.75)
0.83
(0.40)
Model
VIII
R&D
Performance in
2009
17 52 69 0.73***
(8.38)
0.43***
(3.96)
0.41***
(3.55)
Model IX R&D
Expenditure in
2009
17 55 72 609,597**
(2.47)
270,388
(0.48)
446,644+
(1.33)
Note: significant at ***0.1%, **1%, *5%, and +10%; numbers in parentheses are t-statistics
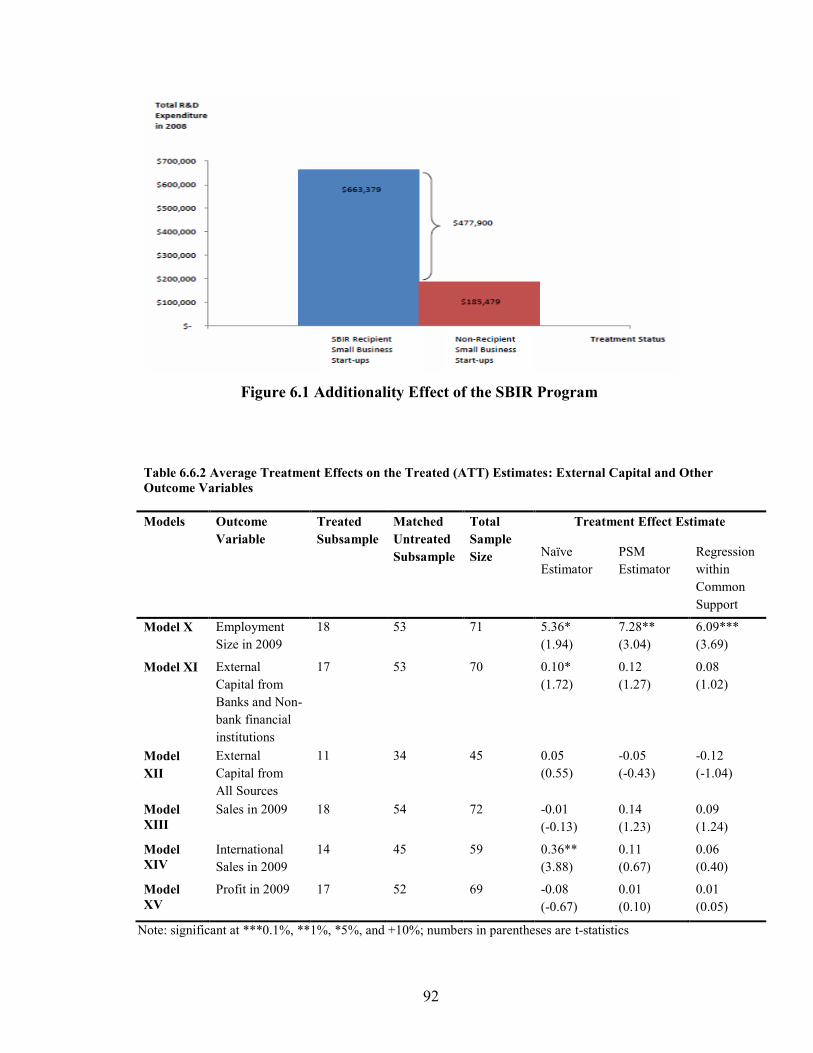
92
Table 6.6.2 Average Treatment Effects on the Treated (ATT) Estimates: External Capital and Other
Outcome Variables
Models Outcome
Variable
Treated
Subsample
Matched
Untreated
Subsample
Total
Sample
Size
Treatment Effect Estimate
Naïve
Estimator
PSM
Estimator
Regression
within
Common
Support
Model X Employment
Size in 2009
18 53 71 5.36*
(1.94)
7.28**
(3.04)
6.09***
(3.69)
Model XI External
Capital from
Banks and Non-
bank financial
institutions
17 53 70 0.10*
(1.72)
0.12
(1.27)
0.08
(1.02)
Model
XII
External
Capital from
All Sources
11 34 45 0.05
(0.55)
-0.05
(-0.43)
-0.12
(-1.04)
Model
XIII Sales in 2009 18 54 72 -0.01
(-0.13)
0.14
(1.23)
0.09
(1.24)
Model
XIV International
Sales in 2009
14 45 59 0.36**
(3.88)
0.11
(0.67)
0.06
(0.40)
Model
XV Profit in 2009 17 52 69 -0.08
(-0.67)
0.01
(0.10)
0.01
(0.05)
Note: significant at ***0.1%, **1%, *5%, and +10%; numbers in parentheses are t-statistics
Figure 6.1 Additionality Effect of the SBIR Program

93
I also examined the propensity of small business start-ups to license-in external
patents and to license-out their own patents in 2009. The treatment effect estimate
without matching is an 9 percentage point advantage of treated small business start-ups in
licensing-out their own patents to other firms, but is not statistically significant (p<0.50).
After balancing the confounders, the estimated average treatment effect on the treated is
substantially higher at 19 percentage points and is now statistically significant at the 5
percent level. A very interesting finding is that SBIR recipients are more likely to
license-in external patents. After balancing the data, the treatment effect of SBIR
financing on the probability of licensing-out own patents is 22 percentage points, which
is statistically significant at the 5 percent level. The point estimate of OLS is lower at 16
percentage points but still significant at the 5 percent level due to lower estimated
standard error than that obtained from the difference in group means after propensity
score matching.
The naïve estimator put the post-treatment employment size advantage of SBIR
recipients at 5.4 employees (p<0.05). However, when observable characteristics were
balanced through propensity score matching, the firm size advantage of SBIR-backed
start-ups grew to 7.3 employees (p<0.01). On average, the treated subsample had 9.4
employees in 2009 while non-recipients had only 2.2 employees. Least squares
regression analysis within common support estimates the size advantage of SBIR
recipients at 6.1 employees (p<0.01), which is very close to the PSM estimate. In Table
6.5 on page 88, the treated and the matched untreated start-ups, by force of statistical
matching, started on an equal footing in employment size. Both started at about one
employee in 2004 (p<0.50). But after five years, SBIR recipients grew to about nine

94
employees or more than an eight-fold increase. On the other hand, their observationally
similar counterparts only managed to grow from about one employee in 2004 to about
two employees in 2009, or only a two-fold increase.
Contrary to expectations, the treatment effect estimates of SBIR financing on
attracting capital are not statistically significant. SBIR-financed small business start-ups
are about 12 percentage points more likely to obtain additional capital from banks,
government agencies, and other non-bank financial institutions, but such an advantage is
not statistically significant (p<0.25). Moreover, the sample data shows that SBIR
recipient are even slightly less likely than observationally-similar non-recipient start-ups
to obtain capital from all external sources including family, friends, and other
individuals34
(p<0.80). When all sources of external capital are taken into account (i.e.
loans from family, friends, other individuals, government agencies, banks, and non-bank
financial institutions), there is almost no difference in the ability of treated and untreated
small business start-ups to attract external capital (p<0.60).
Does the effect of SBIR on R&D performance persist one year after the treatment
period? SBIR recipients are 41 or 43 percentage points (OL and PSM estimates
respectively) more likely to engage in R&D in 2009 than their observationally-similar
non-recipient counterparts (p<0.0001). On average, SBIR-financed small business start-
ups also outspent their non-recipient counterparts by $446,644 (OLS estimate) but such
an R&D expenditure advantage is only marginally significant at the 10 percent level due
to a smaller sample size and by extension, larger standard errors.
34
Other individuals include business angels.

95
6.4 Discussion
Without controlling for variables that covary with both SBIR selection and post-
treatment performance, SBIR recipient and non-recipient small business start-ups
significantly differ in relevant outcome variables. SBIR grantees are more likely to
perform R&D (p<0.001), introduce product and/or process innovations (p<0.001),
license-in external patents (p<0.001), obtain external capital from government agencies
(p<0.001), and borrow from banks and non-bank financial institutions (p<0.10) after
receiving the R&D subsidy. Publicly-funded start-ups also spend more in R&D
(p<0.001), had more patents (p<0.01), and hired more employees (p<0.05).
To make the conditional independence assumption (CIA) or ignorability of
treatment assignment assumption plausible in this observational or non-experimental
study35
, we balanced the covariates that we think affect both treatment selection and post-
treatment outcomes. We constructed a comparison sample that includes non-recipient
start-ups that are observationally similar to SBIR recipient start-ups by matching on their
propensity scores. Consistent with the propensity score theorem (Pearl, 2009), SBIR
recipient and non-recipient start-ups that have almost identical propensity scores are, on
average, have the same covariate distribution. After propensity score matching, the
matched comparison group and the treatment group are not significantly different in
terms of firm size, human capital, technological capacity, industrial classification, and
geographical location. It is as if this select group of start-ups had been randomly
35
For a detailed discussion of the ignorability of treatment assignment, see Chapter 3.

96
assigned to either the treatment or comparison group36
, making the assumption that
treatment assignment is ignorable or independent of outcomes plausible. In this synthetic
sample of treated and matched untreated start-ups, firm size, human capital, technological
capacity, industrial classification, and geographical location do not predict SBIR
selection. Neither group had an advantage in terms of the number of employees
(p<0.90), the education (p<0.30) and industry experience (p<0.40) of the
owners/entrepreneurs, prior R&D experience (p<0.60), number of patents (p<0.995),
sales (p<0.60), industrial classification (at least p<0.40), and geographical location
(p<0.95).
Because the CIA or ignorability of treatment assignment holds, the observed
outcome of the untreated group can serve as empirical proxy for the unobserved outcome
of the treated group. We then estimated the ATT as the difference in post-treatment
outcomes of the treated and matched comparison subsamples.
The certification hypothesis is not supported by the data. We predicted that SBIR
recipients would use their SBIR awards to signal the viability of their innovation projects
and their respective companies in order to attract external capital. SBIR recipients are 8-
12 percentage points more likely to obtain external capital from banks and non-bank
financial institutions in 2009, but such external capital infusion advantage is not
statistically significant. We also found that non-recipient start-ups are equally likely to
obtain external capital from all sources (including family, friends, and other individuals)
as SBIR recipient start-ups. It is possible that SBIR funding obviates the need for
36
In experimental studies, random assignment ensures that outcomes are independent of treatment.

97
external capital and/or recipient small business start-ups have not sufficiently expanded
after five years to warrant external capital infusion.
There is empirical evidence to support the additionality hypothesis using the KFS-
SBIR data. SBIR recipient start-ups are 56 percentage points (p<0.001) more likely to
engage in R&D in 2008 than their observationally similar non-recipient counterparts.
More specifically, SBIR grantees, on average, spent $663,379 in R&D in 2008 while
matched non-grantees spent only $185,479. Assuming the mean independence
assumption37
(Heckman, 1998), SBIR recipient start-ups would have spent only $185,479
in R&D had they not applied for and obtained subsidy from the SBIR program. The
extra $477,90038
(p<0.05) can be construed as the input additionality effect of the SBIR
program. The SBIR program raised the R&D effort of recipient start-ups from $185,479
to $663,379. The expectation is better R&D is being conducted at a higher R&D effort of
$663,379. Economies of scale support this conclusion. While R&D outputs are not a
monotonic function of R&D inputs, an R&D effort of $663,379 most likely would have
satisfied Metcalfe’s (1995) critical minimum level of R&D effort necessary to produce
desired innovation outputs.
There is also indication of the output additionality of the SBIR. Grantees are at
least 33 percentage points (p<0.05) more likely to introduce product and/or process
innovations in 2009. Interestingly, SBIR recipients are about 20 percentage points
(p<0.05) more likely to purchase a license to use external patents. This could be
37
The mean independence assumption only assumes that the untreated outcomes are the same across
treatment states, that is, E(Yi0 ׀ Ti=1, Xi) = E(Yi0 ׀ Ti=0, Xi) = E(Yi0 ׀ Xi). See Chapter 3. 38
The OLS estimate within common support is $442,412 (p<0.05).
98
evidence of the orchestration activities of enterprises to produce innovation and gain a
unique competitive advantage. Due to the complexity of the innovation process, the
possession of one or two patents may not be sufficient to produce an innovation that will
enjoy robust consumer demand. To produce a good or service with high value-added
(from the consumer’s perspective), the firm may have to combine its own internal
knowledge assets with that of external parties: other firms, government laboratories,
universities, or individuals. Purchasing a license to use an external patent is a mechanism
to outsource complementary assets (Teece, 2009) through open innovation (Chesbrough,
2003).
From Table 6.6.1 on page 91 and Figure 6.1 on page 92, we established that SBIR
recipient start-ups would have spent only $185,469 in R&D in 2008 had they not
received SBIR program funds. This empirical result prompts the question, what was the
actual private R&D expenditure of SBIR recipient start-ups in 2008? On average, SBIR
recipients had been granted $553,991 in R&D subsidies in 2008. See Figure 6.2 on page
99. Thus, SBIR recipients spent only $109,398 in R&D in addition to what they received
as SBIR subsidy. This is interesting because as we discussed earlier assuming mean
independence, SBIR recipients would have spent $185,479 without the SBIR subsidy, but
with SBIR, they opted to decrease out-of-pocket R&D expenditure to $109,398, a
decrease by more than $75,000, on average. Is this empirical evidence of crowding out?
It could be. The infusion of public financing through the SBIR subsidy decreased private
contribution to R&D. However, it is entirely plausible that such a decrease in privately-
financed R&D only followed from what the recipient firms thought was their “optimal
level” of R&D effort for that particular period. After they secured about $550,000 in

99
SBIR R&D subsidy, they might have thought, correctly or incorrectly, that adding
$185,000 (instead of $109,000) would not have mattered. The SBIR subsidy may have
already satisfied what the firm perceived as the critical minimum level or optimal level of
R&D that they did not find value in adding more private funds. This has important
implications for the design of innovation policies and programs like the SBIR.
However, we have to acknowledge that it is possible that the crowding-out effect
of the SBIR program has been overestimated. The quantification of privately financed
R&D by SBIR recipient start-ups rests on the untestable assumption that the SBIR R&D
subsidy of about $554,000,39
on average, received in 2008 was spent for R&D in the
same year. If SBIR recipients only used a portion of the SBIR subsidy in 2008, then the
crowding out effect is smaller than what we estimated at about $75,000, on average.
39
The ability of small businesses to secure SBIR funds from multiple agency sources at different phases of
SBIR funding makes it possible for a small business start-up to receive more than $500,000 in R&D
subsidy.
Figure 6.2 Private R&D Expenditure by Treatment Status
100
Finally, the estimation of the average treatment effect on the treated (ATT) of the
SBIR program rests on the assumption that SBIR selection is based on observable
characteristics. While we used advances in statistical matching to establish the
counterfactual outcomes of SBIR recipients, our method does not guarantee that our
treatment effect estimates are bias free. As program evaluators, analysts, and policy
researchers, we have to acknowledge that estimates of observational studies or non-
experimental studies are always susceptible to bias. In this dissertation, if SBIR selection
is a function of unobservables (e.g. motivation of the owner-entrepreneur) or other
observable characteristics that the KFS and SBA datasets did not measure and therefore
were not controlled for in the selection model, then our estimates may include a bias.
Our hope is that this bias is small enough so as not to change our qualitative conclusion
that SBIR positively affects R&D effort, innovation propensity, employment size, and the
orchestration of internal and external knowledge assets to produce innovation. We have
theoretical reasons to believe that this is the case. For illustration purposes, let us assume
that SBIR selection is also a function of the quality of the submitted SBIR proposal,
which is unobserved. It is reasonable to assume that the distribution of the quality of the
SBIR proposal is the same across treatment status, that is, SBIR recipients and
observationally similar non-recipients have the same probability of generating quality
SBIR proposals. If the treated and matched comparison groups are equally likely to have
this unobserved characteristic, the omitted variable does not result to unobserved bias.
SBIR recipient and non-recipients who have the same covariate distribution in firm size,
education and experience of the owner-entrepreneur, R&D performance, possession of
external knowledge assets, sales, industrial classification, and geographical location are

101
more likely to have the same probability of producing quality SBIR proposals than
treated and untreated groups that significantly vary in observable characteristics. This is
an untestable but very plausible assumption. In matching, observations with the same
distribution of observable characteristics are more likely to have the same distribution of
unobserved characteristics (Rosenbaum, 2005).

102
CHAPTER 7
SUMMARY, CONCLUSION, AND THEORETICAL AND POLICY
IMPLICATIONS
Chapter Seven provides the conclusions and theoretical and policy implications of
this study as well as recommendations for future research. The study’s conclusions and
implications may be relevant to the Small Business Administration, SBIR participating
agencies, the U.S. Congress, other research and innovation policymakers, and small
business start-ups.
This objective of this dissertation is to contribute to expanding our knowledge
base on the consequences of research and innovation policies and programs. While we
agree that these public policies and programs can be construed as technological bets on
our collective economic future (Borrus & Stowsky, 1999), the payoffs from these bets
should at least be non-negative. As of this writing, the Manchester Institute of
Innovation Research (MIoIR) of the University of Manchester has embarked on putting
together a compendium of evidence on innovation policy interventions like the
establishment of science parks to build local innovative clusters, fiscal incentives for
R&D, public venture capital investment, and innovation procurement programs. This
dissertation could be seen as part of this larger effort to identify more systematically
which policies that encourage and promote innovation work and which do not,
specifically by examining in more depth the Small Business Innovation Research (SBIR)
program.

103
This dissertation advances the literature on federal technology policies in general
and the SBIR program in particular in at least three ways. First, unlike R&D subsidy
studies that focused almost exclusively on EU countries primarily due to the availability
of national and regional innovation surveys, this dissertation focused on small business
start-ups in the United States using a new scientific survey of new firms. It examined the
effect of a federal R&D subsidy program on the innovation effort and other metrics of
post-entry performance of start-up enterprises. Second, unlike SBIR studies that used
only recipient firms in their empirical analyses, this dissertation built a new dataset, or
more precisely, integrated two new datasets that ultimately included both recipient and
non-recipient small firms. SBIR studies whose samples did not include non-recipient
firms cannot establish the counterfactual outcomes of SBIR recipients had they not
applied for and granted R&D funds. In the counterfactual approach to causal inference,
the determination that program X causes outcome Y requires that (1) outcome Y was
produced in the presence of program X, and (2) outcome Y was not produced in the
absence of program X. Both conditions must be established empirically before one can
attribute post-program outcomes to the implementation of the program. Using only SBIR
recipients does not completely satisfy the second condition. In reflexive studies, pre-
program outcomes of recipients cannot serve as their valid and unbiased counterfactual
outcomes had they not received the R&D subsidy. This dissertation, as far as we know,
is the first effort to establish the counterfactual outcomes of small business start-ups that
received SBIR R&D grants. It attempted to achieve this objective in a two-step process:
(1) datasets integration, and (2) statistical matching. We requested the Kauffman
Foundation permission to use the confidential version of the Kauffman Firm Survey

104
dataset that is available in the NORC data enclave. We also requested the SBA to
provide us a SBIR recipient dataset and the Mathematica Policy Research to integrate the
same with the KFS. The integrated KFS-SBA dataset, which identified small business
start-ups that received SBIR funding, and at the same time, contained thousands of small
firms that could serve as potential controls for SBIR recipients allowed us to empirically
construct the counterfactual outcomes of SBIR recipients. Third, unlike SBIR studies
that manually and artificially combined recipient and non-recipient small firms, this
dissertation’s sample of treated and untreated small business start-ups was drawn from
the same probability sample of new enterprises. Thus, the two groups of small firms
came from the same or identical distribution. In addition, this study used advances in
statistical matching to achieve better comparability between the two groups of small
business start-ups.
For program evaluators who lack experimental data, achieving comparability
between treated and control groups, which is a key requirement before one can make
meaningful causal inferences, can be implemented through statistical matching,
specifically in this dissertation, matching on the propensity score. If it can be shown that
program selection is a function of observable characteristics and that these covariates are
balanced after PSM, then it could be argued that selection bias is controlled for or at least
minimized when estimating the causal effect of a policy, program, or project. Estimates
from non-experimental methods (like PSM) can be offered as tentative estimates of the
treatment effect of a policy or program until they are confirmed or refuted by more
rigorous evaluation methods like an experimental research design or a regression
discontinuity design.
105
This dissertation has shown that small business start-ups that received SBIR R&D
grants are significantly different from the typical start-up that did not apply and/or
selected for SBIR funding. The entrepreneur-owners of SBIR recipients have more
advanced academic training and longer industry experience than the average or typical
entrepreneur. Moreover, SBIR recipient-firms have a higher propensity to perform R&D
and are more likely to own intellectual property at the start of their business operations in
2004. In short, small business start-ups that eventually received SBIR grants started at a
higher technological trajectory than did the typical start-up, an empirical finding that
fundamentally proceeded from the fact that most SBIR recipients in the KFS-SBA
sample competes or operates in the pharmaceutical, chemicals, machinery, electronics,
electrical equipment, medical and surgical equipment, and R&D and engineering
industries. However, recipients do not have size and locational advantages over typical
start-ups: recipient and non-recipient start-ups started their operations, on average, with
close to two employees and are also equally likely to locate their businesses in R&D
intensive states like California and Massachusetts. SBIR grantees, though, were less
likely to generate sales at their first year of operations than their non-recipient
counterparts.
All the significantly different baseline attributes between SBIR recipients and
non-recipients, as expected, figured prominently in SBIR selection. The odds of
receiving SBIR grant of a small business start-up whose owner has a post-graduate
education is more than nine times as high as the odds of a start-up without an owner with
the same advanced level of academic training. The odds of being granted SBIR R&D
subsidies are also higher for those who had prior R&D experience and for those who had

106
patents at the start of their business operations. Start-ups that are operating in the high-
technology sector (i.e., pharmaceuticals, chemicals, machinery, electronics, electrical
equipment, and medical/surgical equipment) are also more likely to receive SBIR funds
than start-ups in the traditional sectors (e.g. agriculture, mining) and the services sector.
Surprisingly, start-ups that did not sell goods and services are less likely to receive SBIR
grants. Interestingly, location matters but at a different direction: start-ups located in
states that are not known for their R&D performance are more likely to receive SBIR
funding. Firm size did not appear to affect the probability of receiving SBIR award.
From the determinants of SBIR program selection, we derive the following
theoretical and policy implications and areas for future research.
First, prior R&D and innovation record are a market signal on the ability of start-
ups to innovate. It is not entirely accurate that small business start-ups do not have a
track record to stand on when applying or competing for scarce public R&D resources
against established businesses. Performing R&D right at the start of business operations
can signal the start-up’s intent to continue performing R&D in the future. SBIR
participating agencies judge R&D performers more favorably. Because learning is
cumulative, success in producing knowledge assets and innovation in the past underpin
future innovation performance. Having patents signals the knowledge and experience the
firm’s owners have acquired over time. These patents may have been applied for and
approved by the United States Patent and Trademark Office (USPTO) prior to the
establishment of the firm (e.g. when the owner was still affiliated in a university as a
graduate student or a faculty member), but just the same, it sends a credible signal that

107
the small business start-up has learned something substantial in the past and is able to
pursue and produce innovation in the future.
Second, there is evidence of the distributional function of the SBIR program.
Start-ups in states that are not known for R&D (e.g. Wyoming, South Dakota, Montana)
are not less likely than their counterparts in R&D intensive states (e.g. California,
Michigan, Massachusetts) to receive SBIR funding. Scholars in political science and
policy studies may want to study the factors influencing the dispersion of SBIR awards.
Qualitative studies can probe in more depth the decision of SBIR agencies how to
distribute SBIR R&D awards geographically. For example, it is possible that the first n
percent of SBIR funds goes to the most qualified small businesses and the remaining (1-
n) percent to the not-so-quality technology R&D proposals but were submitted by small
firms in less R&D intensive states. These are conjectures and hypotheses that may be
validated or disconfirmed by follow-up studies.
Finally, start-ups that do not generate sales may be more likely to receive SBIR
funding. This result can be interpreted in at least two ways. First, those that perform
R&D are more likely to forego generating sales; their primary intent is to invest in
knowledge asset production before introducing a new product or service in the market.
Alternatively, these small firms may have been established primarily for the purpose of
securing public R&D grants. They may not have the objective of directly selling goods
and services themselves; instead, they use firm formation as a mechanism to siphon
federal R&D resources. This is a hypothesis that can be further investigated in greater
depth by follow-up studies. From a normative standpoint where the production of
knowledge is a policy goal, it is not necessarily economically inefficient to use public

108
resources to do more R&D, produce knowledge assets out of it, and perhaps in the future
license these assets out to other firms that may value the R&D outputs (e.g. patents) more
than the original researcher or inventor. Using federal R&D resources only for the sole
purpose of conducting R&D and producing knowledge assets without the clear intent to
directly commercialize these assets may not necessarily be a weakness in the innovation
system. This is a fertile area for future research utilizing the NIS approach.
After estimating the SBIR program selection model, we employed propensity
score matching to balance pre-treatment characteristics of SBIR recipients and non-
recipients. We constructed the comparison sample by identifying non-recipients with
nearly identical propensity scores as that of SBIR recipients. Consistent with the
propensity score theorem (Rosenbaum & Rubin, 1983; Pearl, 2009), observations with
the same distribution of propensity scores have the same distribution of observable
characteristics. PSM made the comparison and treatment samples homogenous except in
SBIR program exposure, making the fundamental assumption of ignorability of treatment
assignment in causal studies more plausible. Achieving or at least improving
homogeneity between groups not only reduces variability of the estimates of treatment
effects but also their sensitivity to unobserved bias. We also used parametric models as
robustness check of the PSM estimates.
Using the realized outcomes of observationally similar non-recipient start-ups as
the counterfactual outcomes of SBIR recipients had they not received SBIR funds, we
found empirical evidence of the input additionality effect of the SBIR program. Had they
not applied for and granted SBIR R&D subsidies, recipient start-ups would have spent
only $185,000 in R&D, but with SBIR their R&D effort was significantly increased to

109
$663,000. The expectation is SBIR recipients are undertaking more risky but higher
return innovation projects with the R&D subsidy. The input additionality effect of SBIR
is consistent with the findings of Aerts and Schmidt (2008), Czarnitzki and Licht (2006),
Gonzalez and Pazo (2008), and Ozcelik and Taymaz (2007) that R&D subsidy programs
in Europe, specifically in Germany, Spain, and Turkey, have a positive effect on total
R&D expenditure and intensity. Please see Appendix E for a more detailed description
of the data, methods, and findings of these R&D subsidy and SBIR evaluation studies.
However, it appears that public co-financing of commercial R&D has crowded-
out privately financed R&D of small business start-ups in the United States. Without
SBIR funding, recipient start-ups are expected to spend about $185,000 in R&D, but with
the R&D subsidy, their privately-financed R&D decreased to $109,000. A dollar of
R&D subsidy decreased privately-financed R&D by about $0.16. This finding calls into
question the size of SBIR grants and the absence of a requirement for private R&D funds.
Receiving more than $400,000 of SBIR grants may have decreased the need to shell out
private funds for R&D. This problem may have proceeded from the fact that small firms
can receive grants from multiple agency sources. SBA may have to reexamine its policy
regarding multiple agencies (e.g. DOD, NIH, NSF) funding the same technology research
and the size of the grants. Requiring recipients to shoulder a certain percentage of the
R&D project cost may ensure a truly private-public co-financing of early-stage, pre-
competitive technology research.
That the SBIR subsidy decreased private R&D expenditures runs counter to the
findings of several R&D studies (Hussinger, 2008; Lee & Cin, 2010; Koga, 2005; and
Ozcelik & Taymaz, 2008) that public R&D grants induce additional company-funded

110
R&D activities. Two studies that support this dissertation’s finding on public R&D
partially substituting for privately financed R&D are Gonzalez and Pazo (2008) who
found that public funds do not significantly stimulate private R&D expenditures and
Wallsten (2000) who showed that the size of SBIR grants significantly decreased firm-
financed R&D of small businesses in the U.S.
This study’s estimate of the crowding-out effect of SBIR on privately-financed
R&D is smaller than what Wallsten (2000) found using a sample of 81 SBIR recipients
and non-recipients. His 3SLS estimate showed that a dollar of SBIR subsidy decreased
firm-financed R&D by $0.82. The difference in the magnitude of the crowding-out
estimates may be due to differences in estimation methods and the populations from
which the samples were drawn. This dissertation focused on the effect of SBIR on small
business start-ups while Wallsten (2000) on the general population of small firms that are
eligible to apply for SBIR grants. As shown previously, young and small firms may be
more innovative than their more established and older counterparts, and thus may be less
likely to decrease privately-financed R&D with the receipt of the SBIR subsidy than the
latter. The hypothesis that the crowding-out effect of public R&D grants is smaller in
start-up enterprises than in older small firms can be tested in future studies.
We also found significant output additionality of SBIR. Recipient start-ups are
more likely to introduce process and/or product innovations 1 to 2 years after receiving
R&D subsidy. This finding is consistent with Berube and Mohnen (2009), who found
that firms that receive R&D subsidies in Canada are more likely to introduce product
innovations and generate sizable revenues from them. Future studies may explore the

111
actual mechanisms through which the SBIR grant directly contributed to the production
of these innovations.
SBIR recipients grew significantly faster than non-recipients in terms of
employment size at least one year after receiving the R&D subsidy. This empirical
finding may indicate that SBIR program funds can help in augmenting scientific and
technical personnel and possibly, in hiring complementary human resources like
marketing researchers.
Contrary to the findings of Lerner (1999) and Toole and Turvey (2009) that the
SBIR award positively impacts follow-on venture capital financing, we did not observe
any significant “halo effect” or “certification effect” of receiving an SBIR award on
attracting external capital, regardless of the source of this external capital. The SBIR
subsidy may obviate the need for external private capital. That is, as internal resources
for R&D are freed up, SBIR recipients can redeploy these resources for marketing,
production, and operations. The new firm may not have grown and expanded enough to
warrant external capital infusion. These hypotheses can be further examined in future
studies on the medium- and long-run certification effects of the SBIR. Another reason
why previous studies found a significant certification effect of the SBIR on external
capital while this study did not is sample size. For example, Lerner (1999) found that
SBIR recipients were 1.4 percentage points more likely to attract venture capital
financing than the matched small firms, and this small effect was statistically significant
because the study used a large sample of 1,193 small firms. On the other hand, we found
that SBIR recipients are 12 percentage points more likely to attract external capital than

112
non-recipients but such outcome advantage is not statistically significant because of a
larger standard error due to a smaller sample size.
While we did not find a significant “halo” effect of SBIR on attracting external
capital, we discovered a different certification effect of the program. Start-ups that
received SBIR grants are more likely to attract external patents. This finding can indicate
that the SBIR award certifies the quality of the company and the innovation project that
the recipient is undertaking through the SBIR subsidy. As such, individuals, government
laboratories, and companies that own patents may be more willing to license their
knowledge assets to this group of small firms that they believe will be more successful in
using their patents to produce innovations. More successful use of these external patents
by “certified” SBIR grantees translates to a more steady revenue stream of royalties by
these patent holders.
That SBIR grantees are more likely to outsource complementary assets is
empirical evidence of the orchestration activities for innovation of SBIR recipients. This
empirical finding is important for two reasons. At the firm level, it indicates that
innovation requires a combination of internal and external knowledge assets.
Competitive advantage may not lie in knowledge assets produced by private R&D
investment and/or public R&D subsidy. It is now increasingly defined by the firm’s
ability to orchestrate an internal-external portfolio of knowledge assets (Chesbrough,
2003; Teece, 2009). It will be very interesting to see future studies examining whether
start-ups that orchestrated an internal-external portfolio of knowledge assets are indeed
more innovative and more successful financially. At the SBIR program level, it is not
enough to measure R&D inputs and outputs. It is also critical to look deeper into the
113
orchestration activities of program grantees, that is, how they combine previous
knowledge assets with new knowledge assets generated through the SBIR funding, and
how they integrate both old and new internal assets with external knowledge assets to
produce innovation. Future evaluations of the SBIR should take into account the
complexity of the innovation process. New product prototypes that result from the public
co-financing of private R&D may not be enough to produce innovations that have high
customer value added. The recipient’s ability to procure knowledge externally may be a
positive effect of the public financing of commercial R&D; the public program may
strengthen the grantee’s absorptive capacity to use external technologies. These long-run
effects will benefit the innovation economy in the long-run, at least from an evolutionary
economic perspective.
Our empirical results highlight the importance of looking at innovation policy
instruments not solely as “correctives to market failures.” Theoretically and empirically,
R&D subsidies (which the SBIR program provides) can help recipient-firms satisfy the
minimum scale of R&D, close the gap between private and socially optimal level of
R&D, and alleviate the risks and uncertainties of the outcomes of the innovation effort,
thus correcting market failures in the production of commercially-useful knowledge.
But, these policy instruments are more than correctives to indivisibilities, positive
spillover effects, and uncertainties. More importantly, they are a mechanism to bring
together the state, the private sector, and the R&D community to identify technological
challenges, solutions, and breakthroughs together (Whitford & Shrank, 2011). The
STTR requirement to small recipient-firms to have a university partner to conduct R&D
supported by federal R&D grants is a welcome adjustment to the SBIR.

114
Increasingly, the SBIR and other innovation policies and programs should be
construed as an attempt to apply networks in the governance of the innovation system.
Relying on hierarchies and the state machinery to identify the technological need and
solutions of the national economy was discredited a long time ago with the collapse of
most socialist and communist regimes. Dependence on the private market is also not
reliable because the private sector also tends to be myopic: it cannot see all technological
possibilities and potential breakthroughs using the profit motive lens alone. It might take
the concerted effort of the state, the private sector, and the academic/scientific/research
community to govern the production and distribution of knowledge assets that underpin
global competitive advantage. Future evaluations should treat the SBIR program in this
regard. [R.V.G.]

115
APPENDIX A
VARIABLE DEFINITIONS – BASELINE CHARACTERISTICS
Variables Type Definition
Firm Size Number of Employees
Interval
number of employees the start-up had in
2004
Human Capital Post-Graduate Education
Industry Experience
Binary
Binary
coded 1 if the owner/entrepreneur has a
master’s or doctorate degree, 0 otherwise coded 1 if the owner/entrepreneur has at
least 10 years of industry experience, 0
otherwise
Technological Capacity Prior R&D Performance Number of Patents Positive Sales
Binary
Interval
Binary
coded 1 if the start-up performed R&D in
2004, 0 otherwise number of patents the start-up owned in
2004 coded 1 if the start-up sold goods and
services in 2004, 0 otherwise
High-Tech Industry Pharmaceutical Chemicals Machinery Electronics Electrical Equipment Medical/Surgical Equipment R&D Services
Binary
Binary
Binary
Binary
Binary
Binary
Binary
coded 1 if the start-up is a
pharmaceutical firm, 0 otherwise coded 1 if the start-up is a chemicals
firm, 0 otherwise coded 1 if the start-up is a machinery
firm, 0 otherwise coded 1 if the start-up is an electronics
firm, 0 otherwise coded 1 if the start-up is an electrical
equipment firm, 0 otherwise coded 1 if the start-up is a medical and
surgical equipment firm, 0 otherwise coded 1 if the start-up is a R&D and
engineering services firm, 0 otherwise
Geographical Location Location in R&D Intensive
States (e.g. CA, MA)
Binary
coded 1 if the start-up is located in the
top 25 R&D intensive states, 0 otherwise

116
APPENDIX B
VARIABLE DEFINITIONS – OUTCOMES
Variables Type Definition
R&D and Innovation R&D Performance in 2008 R&D Expenditure in 2008 Innovation Propensity in 2009 Licensing-out of Patents in
2009 Licensing-in of Patents in 2009
Patent Size in 2009 R&D Performance in 2009 R&D Expenditure in 2009
Binary
Interval
Binary
Binary
Binary
Interval
Binary
Interval
coded 1 if the start-up performed R&D in
2008, 0 otherwise amount of total R&D expenditure in
2008 (in US$) coded 1 if the start-up introduced new
product or process in 2009, 0 otherwise coded 1 if the start-up licensed out own
patent in 2009, 0 otherwise coded 1 if the start-up purchased a
license to use external patent in 2009, 0
otherwise number of patents that start-up had in
2009 coded 1 if the start-up performed R&D in
2009, 0 otherwise amount of total R&D expenditure in
2009 (in US$)
External Capital Infusion External Capital – Banks and
Non-bank in 2009
External Capital – All Sources
in 2009
Binary
Binary
coded 1 if the start-up obtained capital
from a bank or non-bank financial
institution in 2009, 0 otherwise coded 1 if the start-up obtained capital
from a bank or non-bank financial
institution, government agencies, family,
friends, and other individuals in 2009, 0
otherwise Employment, Sales, and
Profit Employment Size 2009 Positive Sales in 2009 International Sales in 2009
Profit in 2009
Interval
Binary
Binary
Binary
number of employees the start-up had in
2009 coded 1 if the start-up sold goods and
services in 2009, 0 otherwise coded 1 if the start-up sold goods and
services in the global market in 2009, 0
otherwise coded 1 if the start-up had a profit in
2009, 0 otherwise

117
APPENDIX C
SBA TRANSMITTAL LETTER OF SBIR RECIPIENT DATASET

118
APPENDIX D
STATA OUTPUTS OF ATT ESTIMATES
Logistic regression Number of obs = 3886
LR chi2(14) = 103.49
Prob > chi2 = 0.0000
Log likelihood = -89.168019 Pseudo R2 = 0.3672
------------------------------------------------------------------------------
treat | Odds Ratio Std. Err. z P>|z| [95% Conf. Interval]
-------------+----------------------------------------------------------------
c5_num_emp~0 | .9681393 .0659015 -0.48 0.634 .8472203 1.106316
post_grad_~0 | 7.326652 4.021197 3.63 0.000 2.498779 21.48243
work_exp_o~m | 1.243486 .6300084 0.43 0.667 .4606618 3.3566
f19_res_de~0 | 3.601529 1.820901 2.53 0.011 1.336987 9.701677
patent_0 | 1.039199 .0213459 1.87 0.061 .9981926 1.08189
d6_have_sa~1 | .31545 .1632708 -2.23 0.026 .1143839 .8699534
pharma | 26.50903 28.64539 3.03 0.002 3.188555 220.3909
chemicals | 27.2729 28.88152 3.12 0.002 3.422344 217.3396
machinery | 15.44698 16.85112 2.51 0.012 1.820823 131.0448
electronics | 25.63623 22.25904 3.74 0.000 4.675046 140.5797
electric_e~p | 20.55 26.12688 2.38 0.017 1.700632 248.321
medical_eq~p | 186.5064 213.3442 4.57 0.000 19.81558 1755.42
RDservices | 3.97611 3.424582 1.60 0.109 .7350677 21.50747
top25RD_04 | .3687238 .2080946 -1.77 0.077 .1219869 1.114523
------------------------------------------------------------------------------
----------------------------------------------------------------------------------------
Variable Sample | Treated Controls Difference S.E. T-stat
----------------------------+-----------------------------------------------------------
f19a_res_dev_a~4 Unmatched | 691622.632 19531.0647 672091.567 65157.96 10.31
ATT | 663379.444 185479 477900.444 239183.689 2.00
----------------------------+-----------------------------------------------------------
Note: Sample S.E.
psmatch2: | psmatch2: Common
Treatment | support
assignment | Off suppo On suppor | Total
-----------+----------------------+----------
Untreated | 0 2,394 | 2,394
Treated | 1 18 | 19
-----------+----------------------+----------
Total | 1 2,412 | 2,413
----------------------------------------------------------------------------------------
Variable Sample | Treated Controls Difference S.E. T-stat
----------------------------+-----------------------------------------------------------
f19_res_dev_4 Unmatched | .894736842 .164315353 .730421489 .08527729 8.57
ATT | .888888889 .333333333 .555555556 .115620308 4.80
----------------------------+-----------------------------------------------------------
Note: Sample S.E.
psmatch2: | psmatch2: Common
Treatment | support
assignment | Off suppo On suppor | Total
-----------+----------------------+----------
Untreated | 0 2,410 | 2,410
Treated | 1 18 | 19
-----------+----------------------+----------
Total | 1 2,428 | 2,429

119
----------------------------------------------------------------------------------------
Variable Sample | Treated Controls Difference S.E. T-stat
----------------------------+-----------------------------------------------------------
c5_num_employe~5 Unmatched | 9.05263158 3.69642857 5.35620301 2.76719271 1.94
ATT | 9.44444444 2.16666667 7.27777778 2.39597022 3.04
----------------------------+-----------------------------------------------------------
Note: Sample S.E.
psmatch2: | psmatch2: Common
Treatment | support
assignment | Off suppo On suppor | Total
-----------+----------------------+----------
Untreated | 0 2,240 | 2,240
Treated | 1 18 | 19
-----------+----------------------+----------
Total | 1 2,258 | 2,259
----------------------------------------------------------------------------------------
Variable Sample | Treated Controls Difference S.E. T-stat
----------------------------+-----------------------------------------------------------
did_innovation_5 Unmatched | .631578947 .162790698 .46878825 .085092633 5.51
ATT | .666666667 .333333333 .333333333 .152903988 2.18
----------------------------+-----------------------------------------------------------
Note: Sample S.E.
psmatch2: | psmatch2: Common
Treatment | support
assignment | Off suppo On suppor | Total
-----------+----------------------+----------
Untreated | 0 3,655 | 3,655
Treated | 1 18 | 19
-----------+----------------------+----------
Total | 1 3,673 | 3,674
----------------------------------------------------------------------------------------
Variable Sample | Treated Controls Difference S.E. T-stat
----------------------------+-----------------------------------------------------------
d5_a_lic_in_pa~5 Unmatched | .263157895 .015274034 .247883861 .029656548 8.36
ATT | .277777778 .055555556 .222222222 .100969452 2.20
----------------------------+-----------------------------------------------------------
Note: Sample S.E.
psmatch2: | psmatch2: Common
Treatment | support
assignment | Off suppo On suppor | Total
-----------+----------------------+----------
Untreated | 0 2,226 | 2,226
Treated | 1 18 | 19
-----------+----------------------+----------
Total | 1 2,244 | 2,245

120
APPENDIX E
SELECTED PRIOR R&D SUBSIDY AND SBIR EVALUATION
STUDIES
Author Sample/Data Method Dependent
Variable Finding Comparison with this Dissertation
Aerts and Schmidt (2008)
EU CIS III and IV
PSM and DID
R&D Expenditure R&D Intensity
On average, a Flemish company that receives a subsidy spends 0.837 million EUR (65%) more on R&D, compared to the situation where it would not have received the subsidy. German subsidized firms spend, on average, 3.232 million EUR more than non-subsidized firms. On average, the R&D intensity of German and Flemish funded companies is 64-100% higher than the R&D intensity of non-funded companies. Funded firms are significantly more R&D active than non-funded firms.
This dissertation found that, on average, SBIR recipient start-ups spent about $480,000 more in R&D than did observationally similar non-recipient start-ups. Both Aerts and Schmidt (2008) and this dissertation used PSM to establish the counterfactual outcomes of funded firms.
Berube and Mohnen (2009)
Canadian Survey of Innovation
PSM
Product Innovations
Percent of Revenue due to Product Innovations
Positive Effect
This dissertation found that SBIR recipient start-ups are 33 percentage points more likely to introduce product and/or process innovations than observationally similar non-recipient start-ups. It supports the finding of Berube and Mohnen (2009) that
R&D programs can have a positive effect on product innovations.
Czarnitzki and Licht (2006)
Mannheim Innovation Panel
PSM
R&D Expenditure Innovation Expenditure Patent Applications
Positive effect on R&D expenditure, innovation expenditure, and patent applications
This dissertation also found that SBIR recipient start-ups are more R&D active than observationally similar non-recipient start-ups. However, we did not find a significant effect of SBIR subsidy on patent size partly due to (a) a smaller sample size and by extension, larger

121
standard errors and (b) a shorter time frame of the study. Czarnitzki and Licht (2006) used four waves (i.e. 1994, 1996, 1998, and 2000) of the Mannheim Innovation Panel.
Gonzalez and Pazo (2007)
Spanish Firm Survey
PSM
Total R&D effort Private R&D Effort
R& D subsidies have a positive and significant effect on total R&D effort. That is, firms add the amount of subsidies to their private budget, not substituting private R&D investment by public funds Public funds do not significantly stimulate private expenditures
This dissertation also found that public R&D subsidy from SBIR did not substitute for private R&D investment. Specifically, SBIR recipient start-ups spent about $110,000 on top of the R&D subsidy received from SBIR. Like Gonzalez and Pazo (2007), we also found that SBIR subsidy did not stimulate private R&D expenditure. In the sample, a dollar of SBIR subsidy reduced private R&D expenditure by $0.16. Both Gonzalez and Pazo (2007) and this dissertation used PSM to establish the counterfactual outcomes of firms that received R&D subsidy.
Hussinger (2008)
EU CIS
Heckman's Selection Model
Net R&D Expenditure (i.e. Total R&D minus government R&D grant) New Product Sales
R&D subsidy has a positive effect on private R&D expenditure Public R&D subsidies stimulate additional private R&D investment. A multiplier effect in the sense that EUR1 public R&D funding generates more than EUR1 private R&D expenses. There is a positive effect of publicly stimulated R&D investment on new product sales
Unlike Hussinger (2008), this dissertation did not find a positive effect on private R&D expenditure. Hussinger (2008) found a multiplier effect of public R&D subsidy on private R&D investment of German
manufacturing firms while this dissertation found a crowding-out effect of the SBIR subsidy. While this dissertation found a significant positive effect of SBIR subsidy on the introduction of product and process innovations, we did not observe any significant program effect on sales 1-2 years after the subsidy. The difference in results could be due

122
to different (a) mechanisms in selecting German manufacturing firms and U.S. small firms that receive R&D subsidy, (b) design of the R&D subsidy programs between the two countries, and (c) study time frames. Hussinger (2008) used a 1992-2000 panel data of German manufacturing firms.
Koga (2005)
Panel Data of Japanese high-technology start-ups
Fixed Effects Panel Data Analysis
Company-funded R&D
The evidence is consistent with the complement hypothesis, i.e., that publicly-funded R&D does promote private R&D.
This dissertation found that $1 of SBIR subsidy decreased private R&D by $0.16. The difference in results is due to different designs of the two R&D programs, i.e., the SBIR program in the US and the SRDCT program in Japan. SRDCT only covers up to 50% of total R&D expenditures of recipient small firms while SBIR does not require a matching R&D expenditure counterpart from recipient small firms.
Lee and Cin (2010)
Panel Data on Korean Manufacturing Firms
2SLS and 2-step Tobit
Private R&D expenditure
Government R&D subsidies in Korea induce additional company-funded R&D activities, rather than displace private R&D investment of the SMEs.
This dissertation found that the SBIR subsidy crowded out private R&D investment. The difference in empirical results could be attributed to design differences between the Korean R&D subsidy program for new technology development and technology transfer and the U.S. SBIR program.
Lerner (1999)
541 SBIR recipients + 891 matched firms
OLS Regression after matching on firm size and industry classification and firm size and geographical location
Sales Employment Attracting VC funding
Positive effect of SBIR on sales and employment but only in areas with substantive VC activity SBIR recipients are 1.4 percentage points (p<0.01) more likely to receive VC funding than matched non-recipient small firms
This dissertation found that SBIR recipients are 14 percentage points more likely to generate sales and 11 percentage points more likely to generate international sales 1-2 years after receiving the subsidy than their observationally similar non-recipient counterparts, but these outcome advantages are not statistically significant due to smaller sample size and thus, larger

123
variances of the treatment effect estimates. Like Lerner (1999), we found a positive effect of SBIR on employment size. Unlike Lerner (1999), we did not find a significant positive certification effect of SBIR on attracting external, regardless of the source of external capital. However, we found a different form of certification effect of the program: SBIR recipients are more likely to outsource external knowledge assets. This finding implies that the SBIR award certifies the quality of the recipient-company improving its ability to persuade other innovators to license out their patents to the SBIR grantee. The difference in results could be due to differences in matching method and sample. This dissertation used statistical matching to balance 14 observable characteristics of recipient and non-recipient start-ups before the treatment effect of SBIR was estimated. Lerner (1999) matched only on firm size, industrial classification, and geographical location.
Ozcelik and Taymaz (2008)
Turkish Annual Survey of Manufacturing Industries
PSM
R&D intensity, Own R&D Intensity
Positive effect on both R&D intensity and own R&D intensity
This dissertation found that the SBIR subsidy did not have a positive effect on firm-financed R&D of small business start-ups. R&D subsidy program in Turkey provides grants that support only up to 50 percent of total R&D expenditure while SBIR does not have this requirement. The SBIR grant can fund up to 100 percent of total firm R&D.
Toole and Turvey (2009)
10,914 SBIR grantees 1983-1999
Probit regression
VC capital
Size of Phase 1 dollars positively affects follow-on VC investment Receiving Phase II positively affects follow-
This dissertation did not find a significant positive certification effect of SBIR on attracting external,

124
on VC investment Number of Phase 1 and Phase 2 awards negatively affects follow-on VC investment
regardless of the source of external capital. What we found instead was a different form of certification effect: SBIR recipients are more likely to outsource external knowledge assets. This finding implies that the SBIR award certifies the quality of the recipient-company improving its ability to persuade other innovators to license out their patents to the SBIR grantee. Toole and Turvey (2009) used only SBIR grantees in their empirical analysis.
Wallsten (2000)
367 SBIR recipients; 90 rejected firms; 22 "eligible" firms that did not apply for SBIR funding. Final sample: 81
IV/3SLS
Firm-financed R&D Employment
One SBIR dollar is correlated with a reduction of $0.82 (p<0.01) in firm-financed R&D No effect on employment
This dissertation also found that the SBIR subsidy is associated with a reduction of privately financed R&D. The difference between the two studies is in the size of the crowding-out effect. Wallsten (2000) found that $1 of SBIR subsidy decreased firm-financed R&D by $0.82 while this dissertation found a smaller crowding-out effect of $0.16. The difference could be due to the sample used by the two studies. This dissertation’s sample included only start-up firms while Wallsten (2000) drew a sample from the population of both young and established/older small firms. PSM estimates ATT while IV estimates LATE.

125
REFERENCES
Abramovitz, M. (1956). Resource and Output Trends in the United States since 1870.
American Economic Review, 46, 5-23.
Acs, Z.J. (Eds.). (1999). Are Small Firms Important: Their Role and Impact. Norwell,
MA: Kluwer Academic Publishers.
Acs Z.J., & Audretsch, D.B. (1990). Innovation and Small Firms. Cambridge, MA: The
MIT Press.
Aerts, K., & Czarnitzki, D. (2004). Using Innovation Survey Data to Evaluate R&D
Policy: The Case of Belgium. ZEW Discussion Paper 04-55.
Aerts, K., & Schmidt, T. (2008). Two for the price of one? Additionality effects of R&D
subsidies: A comparison between Flanders and Germany. Research Policy, 37(5),
806-822.
Akerlof, G. (1970). The market for 'lemons': quality, uncertainty, and the market
mechanism. Quarterly Journal of Economics, 84, 488-500.
Almeda, P., & Kogut, B. (1997). The Exploration of Technological Diversity and the
Geographic Location of Innovation. Small Business Economics, 9(1), 21-31.
Angrist, J. D., & Pischke, J.-S. (2009). Mostly Harmless Econometrics: An Empiricist
Companion. Princeton: Princeton University Press.
Armington, C., Robb, A., & Acs, Z. (1999). Measures of Job Flow Dynamics in the U.S.
U.S. Census Bureau Working Paper.
Arrow, K. J. (1962). Economic Welfare and the Allocation of Resources for Invention. In
R. R. Nelson (Ed.), The Rate and Direction of Inventive Activity (pp. 609-625).
Princeton: Princeton University Press.
Audretsch, D. B., Link, A. N., & Scott, J. T. (2002). Public/private technology
partnerships: evaluating SBIR-supported research. Research Policy, 31(1), 145-
158.
Audretsch, D. B., Weigand, J., & Weigand, C. (2002). The impact of the SBIR on
creating entrepreneurial behavior. Economic Development Quarterly, 16(1), 32-
38.

126
Auerswald, P., & Branscomb, L. (2003). Valleys of Death and Darwinian Seas:
Financing the Invention to Innovation Transition in the United States. Journal of
Technology Transfer, 28(3-4), 227-239.
Barnow, B. S., Cain, G. G., & Goldberger, A. S. (1980). Issues in the Analysis of
Selectivity Bias. Evaluation Studies Review Annual, 5, 43-59.
Baumol, W. (2010). The Microtheory of Innovative Entrepreneurship. Princeton, NJ:
Princeton University Press.
Berube, C., & Mohnen, P. (2009). Are firms that receive R&D subsidies more
innovative? Canadian Journal of Economics, 42(1), 206-225.
Bhide, A. (2008). The venturesome economy : how innovation sustains prosperity in a
more connected world. Princeton, N.J.: Princeton University Press.
Birch, D (1979). The Job Generation Process. Contract Report to the Department of
Commerce.
Birch, D. (1981). Who Creates Jobs?. Public Interest, 65, 3-14.
Black, G. (2004). The Geography of Small Firm Innovation. Dordrecht, The Netherlands:
Kluwer Academic Publishers.
Block, F., & Keller, M.R. (Eds.). (2011). State of Innovation: The US Government's Role
in Technology Development. Boulder, CO: Paradigm Publishers.
Blundell, R., & Costa Dias, M. (2008). Alternative Approaches to Evaluation in
Empirical Economics. IZA Discussion Paper No. 3800.
Borrus, M., & Stowsky, J. (1999). Technology Policy and Economic Growth. In L.M.
Branscomb & J.H. Keller (Eds.), Investing in Innovation: Creating a Research
and Innovation Policy that Works (pp. 112-139). Cambridge, MA: The MIT
Press.
Boskin, M. & Lau, L. (1990). Post-War Economic Growth in the Group-of-Five
Countries: A New Analysis. Standford Center for Economic Policy Research
Publication No. 217.
Box-Steffensmeier, J. M., Brady, H. E., & Collier, D. (Eds.). (2008). The Oxford
handbook of political methodology. Oxford: Oxford University Press.
Brady, H. E. (2008). Causation and Explanation in Social Science. In J. M. Box-
Steffensmeier, H. E. Brady & D. Collier (Eds.), The Oxford handbook of political
methodology (pp. 217-270). Oxford: Oxford University Press.

127
Brady, H. E., & Collier, D. (Eds.). (2004). Rethinking Social Inquiry: Diverse Tools,
Shared Standards. Oxford: Rowman & Littlefield Publishers, Inc.
Branscomb, L.M., & Florida, R. (1999). Challenges to Technology Policy in a Changing
World. In L.M. Branscomb & J.H. Keller (Eds.), Investing in Innovation:
Creating a Research and Innovation Policy that Works (pp. 112-139). Cambridge,
MA: The MIT Press.
Branscomb, L. M., & Keller, J. (Eds.). (1998). Investing in Innovation: Creating a
Research and Innovation Policy that Works. Cambridge, MA: The MIT Press.
Breitzman, A., & Hicks, D. (2008). An Analysis of Small Business Patents by Industry
and Firm Size . Contract Report to the Small Business Administration.
Bruderl, J., Preisendorfer, P., & Ziegler, R. (1992).Survival Chances of Newly Founded
Business Organizations. American Sociological Review, 57(2), 227-242.
Busom, I. (2000). An Empirical Evaluation of the Effects of R&D Subsidies Economics
of Innovation & New Technology, 9(2), 111-148.
Caliendo, M., & Kopeinig, S. (2005). Some Practical Guidance for the Implementation of
Propensity Score Matching. IZA Discussion Paper No. 158.
Caliendo, M., & Kopeinig, S. (2008). Some practical guidance for the implementation of
propensity score matching. Journal of Economic Surveys, 22(1), 31-72.
Cameron, A. C., & Trivedi, P. K. (2005 ). Microeconometrics: Methods and
Applications. New York: Cambridge University Press.
Chesbrough, H. W. (2003). Open innovation : the new imperative for creating and
profiting from technology. Boston, Mass. :: Harvard Business School Press.
Clarysse, B., Wright, M., & Mustar, P. (2009). Behavioural Additionality of R&D
Subsidies: A Learning Experience. Research Policy,38,1517-1533.
Clausen, T. H. (2009). Do subsidies have positive impacts on R&D and innovation
activities at the firm level? Structural Change and Economic Dynamics, 20(4),
239-253.
Cohen, L.R., & Noll, R.G. (1991 ). The Technology Pork Barrel. Washington, D.C.: The
Brookings Institution.
Cohen, S. I. (2001). Microeconomic policy. London: Routledge.
Cohen, W. M., & Levinthal, D. A. (1989). Innovation and Learning: The Two Faces of
R&D. Economic Journal, 99, 569-596
128
Cohen, W. M., & Levinthal, D. A. (1990). Absorptive Capacity: A New Perspective on
Learning and Innovation. Administrative Science Quarterly, 35(1), 128-152
Collier, D., Brady, H., & Seawright, J. (2004). Sources of Leverage in Causal Inference:
Toward an Alternative View of Methodology. In H. Brady & D. Collier (Eds.),
Rethinking Social Inquiry: Diverse Tools, Shared Standards (pp. 229-266).
Oxford: Rowman & Littlefield Publishers, Inc.
Cooper, R.S. (2003). Purpose and Performance of the Small Business Innovation
Research (SBIR) Program. Small Business Economics, 20, 137-151
Cox, D. R., & Reid, N. (2000). The Theory and Design of Experiments. Boca Raton:
Chapman and Hall/CRC.
Cozzens, S. E., & Melkers, J. E. (1997). Use and Usefulness of Performance Masurement
in State Science and Technology Programs. Policy Studies Journal, 25(3), 425-
435.
Czarnitzki, D., & Licht, G. (2006). Additionality of public R&D grants in a transition
economy. Economics of Transition, 14(1), 101-131.
Dahlman, C. J., & Nelson, R. R. (1995). Social Absorption Capability, National
Innovation Systems and Economic Development. In P.-h. Ku & D. H. Perkins
(Eds.), Social capability and long-term economic growth (pp. 82-122). New York:
St. Martin's Press.
Dasgupta, P., & David, P. A. (1987). Information Disclosure and the Economics of
Science and Technology. In G. R. Feiwel (Ed.), Arrow and the Ascent of Modern
Economic Theory (pp. 519-542). London: Macmillan Press.
David, P. A., Hall, B. H., & Toole, A. A. (2000). Is public R&D a complement or
substitute for private R&D? A review of the econometric evidence. Research
Policy, 29(4-5), 497-529.
Edquist, C. (Ed.). (1997). Systems of Innovation: Technologies, Institutions, and
Organizations. New York: Routledge.
Essama-Nssah, B. (2006). Propensity Score Matching and Policy Impact Analysis: A
Demonstration in EViews. WPS 3877.
Feldman, M.P. (1994). The Geography of Innovation. Dordrecht, The Netherlands:
Kluwer Academic Publishers.
Feldman, M. P., & Kelley, M. P. (2003). Leveraging Research and Development:
Assessing the Impact of the U.S. Advanced Technology Program. Small Business
Economics, 20(2), 153-165.

129
Feldman, M. P., & Kogler, D. F. (2008). The contribution of public entities to innovation
and technological change. In S. Shane (Ed.), Handbook of Technology and
Innovation Management (pp. 431-459). Chichester: John Wiley & Sons Ltd.
Galbraith, J. K. (1967). The New Industrial State. Boston, MA: Houghton Mifflin.
Gelman, A., & Hill, J. (2007). Data Analysis Using Regression and
Multilevel/Hierarchical Models. New York: Cambridge University Press.
Georghiou, L. (2002). Impact and Additionality of Innovation Policy. IWT Studies 40.
Geroski, P. (1995). Markets for Technology: Knowledge, Innovation and Appropriability.
In P. Stoneman (Ed.), Handbook of the Economics of Innovation and
Technological Change. Oxford: Blackwell Publishers Ltd.
González, X., Jaumandreu, J., & Pazó, C. (2005). Barriers to Innovation and Subsidy
Effectiveness? The RAND Journal of Economics, 36(4), 930-950.
González, X., & Pazó, C. (2008). Do public subsidies stimulate private R&D spending?
Research Policy, 37(3), 371-389.
Greene, W. H. (2003). Econometric analysis (5th ed.). Upper Saddle River, N.J.: Prentice
Hall.
Guo, S., & Fraser, M. W. (2010). Propensity Score Analysis: Statistical Methods and
Applications. Thousand Oaks, CA: SAGE Publications, Inc.
Hall, B. H. (2008). The Financing of Innovation. In S. Shane (Ed.), Handbook of
Technology and Innovation Management (pp. 409-429). Chichester: John Wiley
& Sons Ltd.
Hall, B. H., & Maffioli, A. (2008). Evaluating the impact of technology development
funds in emerging economies: evidence from Latin America. European Journal of
Development Research, 20(2), 172-198.
Hayashi, F. (2000). Econometrics. Princeton, N.J.: Princeton University Press.
Heckman, J. J., Ichimura, H., & Todd, P. (1998). Matching as an econometric evaluation
estimator. Review of Economic Studies, 65(2), 261-294.
Heinrich, C.J. (2007). Evidence-based Policy and Performance Management: Challenges
and Prospects in Two Parallel Movements. The American Review of Public
Administration, 37(3), 255-277.

130
Ho, D. E., Imai, K., King, G., & Stuart, E. A. (2007). Matching as nonparametric
preprocessing for reducing model dependence in parametric causal inference.
Political Analysis, 15(3), 199-236.
Holland, P. W. (1986). Statistics and Causal Inference. Journal of the American
Statistical Association, 81, 945-970.
Hubbard, R.J. (1998). Capital-market Imperfections and Investment. Journal of
Economic Literature, 36, 193-225.
Hussinger, K. (2008). R&D and Subsidies at the Firm Level: An Application of
Parametric and Semiparametric Two-Step Selection Models. Journal of Applied
Econometrics, 23(6), 729-747.
Jaffe, A.B. (1999). Measurement Issues. In L.M. Branscomb & J.H. Keller (Eds.),
Investing in Innovation: Creating a Research and Innovation Policy that Works
(pp. 112-139). Cambridge, MA: The MIT Press.
Jaffe, A. B. & Trajtenberg, M. (2002). Patents, Citations, and Innovations:A Window on
the Knowledge Economy. Cambridge, MA: The MIT Press.
Jaffe, A.B., Trajtenberg, M., & Henderson, R. (2002). Geographic Localization of
Knowledge Spillovers as Evidenced by Patent Citation. In A.B. Jaffe & M.
Trajtenberg (Eds.), Patents, Citations, and Innovations:A Window on the
Knowledge Economy (pp.155-178). Cambridge, MA: The MIT Press.
Jenkins, S. P. (2004). Survival Analysis. Institute for Social and Economic Research,
University of Essex.
Jewkes J., Sawers, D., & Stillerman, R. (1958). The Sources of Invention. London:
Macmillan.
Khandker, S. R., Koolwal, G. B., & Samad, H. A. (2010). Handbook on Impact
Evaluation: Quantitative Methods and Practice. Washington, D.C.: The World
Bank.
Klette, T. J., Møen, J., & Griliches, Z. (2000). Do subsidies to commercial R&D reduce
market failures? Microeconometric evaluation studies. Research Policy, 29(4-5),
471-495.
Koga, T. (2005). R&D subsidy and self-financed R&D: The case of Japanese high-
technology start-ups. Small Business Economics, 24(1), 53-62.
Lee, E. Y., & Cin, B. C. (2010). The effect of risk-sharing government subsidy on
corporate R&D investment: Empirical evidence from Korea. Technological
Forecasting and Social Change, 77(6), 881-890.

131
Lee, M.-J. (2005). Micro-econometrics for policy, program, and treatment effects.
Oxford: Oxford University Press.
Lerner, J. (1999). The government as venture capitalist: The long-run impact of the SBIR
program. Journal of Business, 72(3), 285-318.
Lerner, J. (2009). Boulevard of Broken Dreams. Princeton: Princeton University Press.
Lewis, D. (1973). Causation. Journal of Philosophy, 70(17), 556-567.
Lewis, G. (2012). Dichotomous Dependent Variables. PMAP 9121 Lecture Notes,
Georgia State University.
Link, A. N., & Scott, J. T. (2010). Government as entrepreneur: Evaluating the
commercialization success of SBIR projects. Research Policy, In Press,
Corrected Proof.
Lucas, R. (1978). On the Size Distribution of Business Firms. The Bell Journal of
Economics, 9, 508-523.
Lundvall, B.-A. (Ed.). (1992). National Systems of Innovation: Towards a Theory of
Innovation and Interactive Learning. London: Pinter Publishers.
Metcalfe, S. (1995). The Economic Foundations of Technology Policy: Equilibrium and
Evolutionary Perspectives. In P. Stoneman (Ed.), Handbook of the economics of
innovation and technological change (pp. 409-557). Oxford, UK: Blackwell.
Metcalfe, S. (2007). Innovation systems, innovation policy and restless capitalism. In F.
Malerba & S. Brusoni (Eds.), Perspectives on innovation (pp. 441-454).
Cambridge, UK: Cambridge University Press.
Morgan, S. L., & Winship, C. (2007). Counterfactuals and Causal Inference: Methods
and Principles for Social Research. New York: Cambridge University Press.
Nelson, R. R. (Ed.). (1993). National Innovation Systems: A Comparative Analysis. New
York: Oxford University Press.
Nelson, R.R. (1996). The Sources of Economic Growth. Cambridge, MA: Harvard
University Press.
Nelson, R. R., & Winter, S. G. (1982). An Evolutionary Theory of Economic Change.
Cambridge, MA: Harvard University Press.
Neyman, J. S. (1923). On the Application of Probability Theory to Agricultural
Experiments. Essay on Principles. Section 9. Statistical Science, 5(4), 465-472.

132
Osnabrugge, M. V., & Robinson, R. J. (2000). Angel Investing. San Francisco: Jossey-
Bass.
Özçelik, E., & Taymaz, E. (2008). R&D support programs in developing countries: The
Turkish experience. Research Policy, 37(2), 258-275.
Pearl, J. (2009). Causality: models, reasoning and interference (2nd ed.). Cambridge:
Cambridge University Press.
Romer, P. (1986). Increasing Returns and Long Run Growth. Journal of Political
Economy, 94(5), 1002-1037.
Romer, P. (1990). Endogenous technical change. Journal of Political Economy, 98(5),
71-102.
Rosenbaum, P. R. (2002). Observational studies (2nd ed.). New York: Springer.
Rosenbaum, P. R., & Rubin, D. B. (1983). The Central Role of the Propensity Score in
Observational Studies. Biometrika, 70(1), 41-55.
Rossi, P. H., Lipsey, M.W., & Freeman, H.E. (2004). Evaluation (7th ed.). Thousand
Oaks, CA: Sage Publications, Inc.
Rubin, D. B. (1974). Estimating Causal Effects of Treatments in Randomized and Non-
randomized Studies. Journal of Educational Psychology, 66, 688-701.
Schacht, W.H. (2011). The Small Business Innovation Research (SBIR) Program:
Reauthorization Efforts. CRS Report for Congress RS22865.
Schumpeter, J. A. (1942). Capitalism, Socialism and Democracy. New York: Harper &
Brothers.
Sekhon, J. S. (2008). The Neyman-Rubin Model of Causal Inference and Estimation via
Matching Methods. In J. M. Box-Steffensmeier, H. E. Brady & D. Collier (Eds.),
The Oxford handbook of political methodology (pp. 271-299). Oxford: Oxford
University Press.
Shane, S. (2008). The illusions of entrepreneurship : the costly myths that entrepreneurs,
investors, and policy makers live by. New Haven: Yale University Press.
Shane, S. (2000). Prior knowledge and the discovery of entrepreneurial activities.
Organization Science, 11, 448-469.
Shapira, P., & Kuhlmann, S. (Eds.). (2003). Learning from Science and Technology
Policy Evaluation:Experiences from the United States and Europe. Cheltenham,
U.K.: Edward Elgar.
133
Siegel, D. S., Wessner, C., Binks, M., & Lockett, A. (2003). Policies Promoting
Innovation in Small Firms: Evidence from U.S. and U.K. Small Business
Economics, 20, 121-127.
Soete, L., Verspagen, B., & Weel, B. T. (2010). Systems of Innovation. In B. H. Hall &
N. Rosenberg (Eds.), Handbooks in economics ; (Vol. II, pp. 1159-1180).
Amsterdam: North Holland.
Solow, R. (1956). A Contribution to the Theory of Economic Growth. Quaterly Jounal of
Economics, 70(1), 65-94.
Solow, R. (1957). Technical change and the aggregate production function. Review of
Economics and Statistics, 39(3), 312-200.
Steinmuller, W. E. (2010). Economics of Technology Policy. In B. H. Hall & N.
Rosenberg (Eds.), Handbooks in economics (Vol. II, pp. 1181-1218). Amsterdam:
North Holland.
Storey, D.J. (2002). Methods of Evaluating the Impact of Public Policies to Support
Small Businesses. International Journal of Entrepreneurship Education, 1(2),
181-202.
Tassey, G. (1997). The Economics of R&D Policy. Wesport, CT: Quorum Books.
Tassey, G. (2007). The Technology Imperative. Northampton, MA: Edward Elgar.
Teece, D. (1986). Profiting from technological innovations: Implications for integration,
collaboration, licensing and public policy. Research Policy, 15, 285-305.
Teece, D.J. (2009). Dynamic Capabilities and Strategic Management. New York: Oxford
University Press.
Toole, A. A., & Czarnitzki, D. (2007). Biomedical academic entrepreneurship through
the SBIR program. Journal of Economic Behavior & Organization, 63(4), 716-
738.
Toole, A. A., & Turvey, C. (2009). How Does Initial Public Financing Influence Private
Incentives for Follow-on Investment in Early-stage Technologies. Journal of
Technology Transfer, 34, 43-58.
Van Osnabrugge, M., & Robinson, R. J. (2000). Angel Investing. San Francisco, CA:
Jossey-Bass.
Wallsten, S. J. (2000). The effects of government-industry R&D programs on private
R&D: the case of the Small Business Innovation Research program. Rand Journal
of Economics, 31(1), 82-100.

134
Winter, S.G. (2003). Understanding Dynamic Capabilities. Strategic Management
Journal, 24, 991-995.
Woolridge, J. (2002). Econometric Analysis of Cross Section and Panel Data.
Cambridge, MA: MIT Press.


![[Preston, 2007] Angel Financing for Entrepreneurs - Early-Stage Funding for Long-Term Success](https://img.pdfslide.us/doc/110x75/55cf883f55034664618ee110/preston-2007-angel-financing-for-entrepreneurs-early-stage-funding-for.jpg)