Embed Size (px)
Citation preview

© Investigaciones Regionales. Monográfico – Páginas 89 a 109Sección PRIMERA PARTE
Public financing and entrepreneurship: behaviourand regional heterogeneity of SMEs*
Antonio García-Tabuencaa, José Luis Crespo-Espertb and Juan R. Cuadrado-Rourac
ABSTRACT: The existence of restrictions for small- and medium-sized enterpri-ses (SMEs) to access long-term credit has led governments to establish institutionalsystems to facilitate such access and reduce the cost of credit, with the conditionthat its feasibility is justified (and assessed) and there are no distortions as regardscompetition. Very few empirical in-depth studies exist regarding this field of aca-demic research, and scarce attention has been paid from a regional perspective.Due to the characteristics of the business structures in the different regions, as wellas the existence of agglomeration economies and the regional dispersion of the en-trepreneurship rate, this paper analyses the effects of the productive financing sup-port model, provided by the Government of Spain, through the Instituto de CréditoOficial (ICO) [Official Credit Institute], on the behaviours and performances of thebeneficiary companies. In the last decade, this source of financing has assigned30,000 million euro. The results show the general acceptance of this policy due toits adaptation to the interests of the companies and its contribution to the improve-ment of the economic-financial efficiency indicators. Regionally, no substantialdifferences have been observed, but the results of this research show a greater con-tribution to the dynamism of the more progressive regions.
JEL classification: G-28, L25, L26, R30.
Key words: Public financing, business efficiency, entrepreneurial activity, regionaldifferences.
a Senior Lecturer of Applied Economics at the University of Alcalá (Madrid, Spain) and Researcher inthe Instituto de Análisis Económico y Social (IAES/SERVILAB). E-mail: [email protected] Senior Lecturer of Business Administration at the University of Alcalá (Madrid, Spain) and Researcherin the Instituto de Análisis Económico y Social (IAES/SERVILAB). E-mail: [email protected] Professor of Applied Economics at the University of Alcalá (Madrid, Spain) and Founder Director inthe Instituto de Análisis Económico y Social (IAES/SERVILAB). [email protected]
Address: Facultad de Ciencias Económicas y Empresariales; Plaza de la Victoria, s/n; 28802 Alcalá deHenares (Madrid). Contact tel.: +34 918 855 225.
Recibido: 19 de enero de 2009 / Aceptado: 3 de junio de 2009
89
06 Garcia Tabuenca 28/9/09 12:24 Página 89
Financiación pública y emprendimiento: comportamientos y heterogeneidadregional de las pequeñas y medianas empresas
RESUMEN: La generalizada aceptación de la existencia de restricciones al acceso alcrédito a largo plazo por parte de las pequeñas y medianas empresas (Pyme), ha indu-cido a los gobiernos al establecimiento de sistemas institucionales que faciliten dichoacceso y abaraten el coste del crédito, siempre que pueda justificarse (y evaluarse) suviabilidad y no introduzcan distorsiones en la competencia. Abundantes estudios hanprofundizado en esta vía de investigación académica, aunque apenas han particulari-zado la perspectiva regional. Debido a las distintas características que presenta la es-tructura empresarial entre las regiones, así como a la existencia de economías deaglomeración y a la dispersión regional de la tasa de empresarialidad, en este trabajose analiza la incidencia del modelo de apoyo a la financiación productiva, proporcio-nada por el gobierno de España, a través del Instituto de Crédito Oficial (ICO), en loscomportamientos y desempeños de las empresas beneficiarias. Esta línea de financia-ción, de intermediación bancaria, ha destinado en la última década casi 30.000 millo-nes de euros. Los resultados arrojan evidencias de la aceptación generalizada de estapolítica por su adecuación a los intereses de las empresas y por su contribución a lamejora de sus indicadores de eficiencia económico-financiera. Regionalmente, no seobservan importantes disimilitudes, pero la investigación detecta una mayor contri-bución al dinamismo de las regiones más avanzadas.
Clasificación JEL: G-28; L25; L26; R30.
Palabras clave: Financiación pública, eficiencia empresarial, actividad emprende-dora, diferencias regionales.
1. Introducción
Since the formulation of the well-known proposition of Modigliani and Miller (1958)on the irrelevance of the financial structure of the company, several authors and nu-merous, relevant papers on business finance have put forward evidence regarding theexistence of financial restrictions on business investment decisions. Among the mostsignificant are Grosman and Hart (1982), Jensen (1986), Bond and Meghir (1994)and Hellwig (1991). In practice, it is accepted that there are no perfect financial mar-kets, therefore, the capital structure of a company is not irrelevant.
As regards the normal functioning of economies, it is acknowledged that the im-provement in competitiveness and the productivity of companies is not so much (or isnot only) a question related to the profitability of the business project measured th-rough the return of its assets, but to the profitability of the resources invested in thebusiness project measured through the financial return. That is to say, when a refe-rence is made to the competitiveness of the company, this is not only done in econo-mic terms but also in financial terms. In other words, the financial yield from the ca-pital invested by the businessman is a powerful incentive when taking decisions on
90 García-Tabuenca, A., Crespo, J. L. and Cuadrado, J. R.
06 Garcia Tabuenca 28/9/09 12:24 Página 90
the commencement or the consolidation of business activity. The difference betweenthe financial yield from the investment made by the businessman and the salary hecould obtain if he chose to work as an employed person constitutes an essential factorwhen assuming the challenge of the risk of being self-employed or the creation ofone’s own company (Praag and Cramer, 2001).
With several nuances, the flaws or imperfections of the market, which hinder freecompetition among companies, are also considered to be accepted. These flaws havebeen studied from several perspectives of economic analysis: agency theory and costs(Jensen and Meckling, 1976; and Ross, 1977), the asymmetric information betweencompanies and financial agents (Leland and Pyle, 1977; and Greenwald, Stiglitz, andWeiss, 1984), other conditioners of the financial intermediaries or the composition ofthe capital (La Porta et al., 1999; and De Miguel and Pindado, 2001), the incentivesin the financial structure of the company (Grosman and Hart, 1982), or due to dimen-sion, where the smaller-sized companies are prejudiced by negative external factorswhich increase the cost of their capital resources and make their products more ex-pensive in the markets (Brewer et al., 1996, Salas, 1996, and Maroto 1997).
With regard to this last flaw, the restrictions on access to credit, especially long-term credit, and its cost, make it difficult for smaller-sized companies to achieve asuitable ratio of financial leverage, which makes possible a financial return greaterthan the performance of the assets. The establishment by governments of institutionalsystems which facilitate such access to credit and reduce its cost has been orientedprecisely to reducing or eliminating this difficulty. This reduced access to financingfor new entrepreneurs and small companies entails restricting or preventing econo-mic development perspectives, the encouragement of innovation and the creation ofemployment which would derive from the consolidation and growth of business pro-jects.
The analysis of the relationships between financing business projects and the sizeof the companies has been studied extensively. However, little in-depth study, ormuch less study, has been carried out of the relationship between financing and loca-lisation (area-region). This is probably due to the fact that such analyses started fromthe presumption that financial globalisation and innovation in financial products uni-formly extended throughout the territories of countries or regions with the same Mo-netary, Economic or Customs, Union.
However, this financial argument could be discriminated by the territorial diffe-rences due to the characteristics of the business structure observed between re-gions, or to the urban-regional environment and their economies of agglomerationwhich work in favour of the creative entrepreneur through the creation of networks(Nijkamp, 2000) or developments of sector clusters or technological and innova-tive environments (Porter, 1998, Costa Campi et al., 2000), or to the difference inthe behaviour of the business rates between regions (Audretsch et al., 2002; Thurikand Verheul, 2002, and García-Tabuenca, Crespo-Espert and Cuadrado-Roura,2007).
Furthermore, there are only very few studies which analyse the behaviour ofcompany financing from a regional perspective, particularly where public supportexists which tries to minimise the deficiencies due to company size.
Public financing and entrepreneurship: behaviour and regional heterogeneity of SMEs 91
06 Garcia Tabuenca 28/9/09 12:24 Página 91
In light of this background, this paper contains five sections and this introductionis the first. The second presents the focus and objectives of the paper; the third givesa general and regional panorama of the empirical case under study; the fourth analy-ses the efficiency of the behaviour of the companies studied. Finally, the fifth pre-sents a summary of the paper and the main conclusions.
2. Objectives, approach and methods
The main objective of this paper is to analyse the behaviour and possible robustnessof companies derived from the business decision to access long-term credit throughthe use of public resources for the financing of Spanish small- and medium-sized en-terprises (SMEs) from a regional perspective. Specifically, a study is carried out forthe decade between 1997 and 2006 of the line of credit ICO-SMEs which the Insti-tuto de Crédito Oficial (ICO) [Oficial Credit Institute] annually places at the disposalof Spanish SMEs, through the bank intermediation mechanism. The mission of theICO is to act as a financial agent of the State and as a development bank in order toencourage certain productive activities1.
Another fundamental objective of this paper is to assess the usefulness of the pu-blic line of credit for company financing, as well as its suitability for the interests ofthe companies and entrepreneurs and other economic agents.
The database of the ICO makes it possible to differentiate the beneficiary compa-nies, among other categories, depending on the regions where they are located (17Autonomous Communities), on their business size (micro-, small and medium-sizedenterprises), and on the legal form they adopt (‘self-employed’ and commercial – li-mited liability, limited and other types of companies). In the present study, only thedifferences among regions are considered, avoiding the companies’ sizes and legalforms.
The regional analysis uses the regional groups established by ‘Eurostat’ in theNUTS-1, which are made up of several administrative regions (Autonomous Com-munities in the case of Spain) with common territorial and socioeconomic characte-ristics in a single region. ‘Eurostat’ considers seven NUTS-1 for Spain: Northwest,Northeast, East, Centre, Madrid, South and the Canary Islands. For the purposes ofthis paper, the Canary Islands, which is a NUTS-1, has been included in the NUTS-1SOUTH.
This analysis focuses on two fields of interest. The first describes the profile andshows the evolution of the almost half a million operations of the ICO-SMEs line of
92 García-Tabuenca, A., Crespo, J. L. and Cuadrado, J. R.
1 Since the start of the nineties, the Instituto de Crédito Oficial (ICO) —the Financial Agency of theState— established a line of credit for small and medium-sized companies to facilitate credit throughbank intermediation, as in other countries in the same environment. The Institute obtains resourcesmainly in the financial markets which are placed at the disposal of the commercial banks interested, th-rough a general and specific agreement, so that these, in a determined maximum period and spread con-ditions as regards the EURIBOR and assuming the risk of the operations, can grant credit to the SMEswhich submit feasible investment projects to them.
06 Garcia Tabuenca 28/9/09 12:24 Página 92

credit executed in the period and of the more than 270,000 beneficiary companies.Also, the level that the companies in the regions have used this line of credit has beenexamined as has the intensity with which the different types of companies have resor-ted to the financing through the intermediation of the ICO.
The second field of interest refers to the performance of the companies througheconomic-financial indicators of business efficiency: economic return, financial re-turn, productivity, EBITDA over total assets and over turnover2. These indicators actas a direct indication of the incentive of the entrepreneur as regards the activity andthe risk assumed. This economic-financial analysis is carried out regionally in orderto segment all the companies benefiting from lines of credit throughout the decadeunder analysis. It also divides the companies depending on the intensity with whichthey use the line of credit: one or more times.
The analysis adopts a counterfactual focus which contrasts the earnings of thecompanies which resorted to the lines of credit (once or on repeated occasions) withthose which did not. To achieve this, control groups with the same segmentation cri-teria were established. Thus, the regional differences in the results of the manage-ment of the companies benefiting from the lines of credit in comparison with the restof the companies in the same region are identified. The analysis makes it possible toverify whether the decision to resort to the ICO-SMEs lines of credit, together withthe rest of the business decisions, generate results which are different from thosecompanies which did not resort to this line of credit.
Due to the possible existence of an endogeneity problem generated by the pre-vious selection of the sample (beneficiary enterprises), the aim of this analysis isnot to establish a causality between public financing and performance, but to com-pare the aggregate results of those companies –measured with the aforementionedindicators- receiving financing (one or more times) and of those which did not. Thepossible endogeneity is due to the fact that the beneficiary companies were selectedby banking intermediaries and were selected depending on their risk level. Thus,the enterprises receiving financing would be those with the best management andsolvency.
Public financing and entrepreneurship: behaviour and regional heterogeneity of SMEs 93
2 The economic and financial ratios of profitability respectively indicate the efficiency of the perfor-mance of the entrepreneur and his corresponding remuneration. The first shows the proper use of tangibleinvestment in fixed and current assets through the quotient of the profit before interest and tax and the to-tal annual average of the assets of the company. The second, defined as the relationship between the netearnings of the company and the equity used, indicates the excess freely disposable by the entrepreneur asremuneration for the risk assumed. Together with the yield, the productivity shows the business efficiency in terms of the use of human capi-tal. It measures the added value obtained per employee and indicates how the suitable combination bet-ween the human factor and the technical structure affects the generation of wealth for the company. As regards the EBITDA (Earnings before interests, taxes, depreciation and amortization), this is the indi-cator which most approximately provides the liquid funds generated by the company not subject to theapplication of accounting criteria for the imputation of amortization and depreciation or to tax criteria,nor to the selection between own financing and external financing in the financial structure of the com-pany. In this study, the total assets and the turnover are relativised: the former represents the generation ofliquidity as regards the total investment of the company and the latter, as regards the earnings obtained.Such relativising is always necessary in order to establish comparisons between companies.
06 Garcia Tabuenca 28/9/09 12:24 Página 93
For these purposes, we have used the aforementioned ICO-Pyme database andthe database Sistema de Análisis de Balances Ibéricos (SABI) [System for the Analy-sis of Iberian Balance Sheets]. The first, including the companies that are beneficia-ries of the ICO-Pyme line between 1997 and 2006, is created on the basis that thesupport provided by the Instituto de Crédito Oficial is available for each of the yearof the series. The SABI database, which is a source of business information fromcommercial registers, includes data on most of the Spanish companies with commer-cial forms. The calculation of the comparative values can only be carried out for theeight years during which this database offered complete information (1999-2006).Based on these values, the average statistical figures which represent the evolutionand tendencies of the indicators mentioned are constructed. This counterfactualanalysis, which contrasts the results of the two groups of companies which accessedthe lines of credit with the results of their respective control groups, is complementedwith a confirmatory analysis which uses the non-parametric contrast test of Kruskal-Wallis.
3. Descriptive panorama of the ICO-SMES line of credit,1997-2006
This section provides a characterisation of the operations and the beneficiaries of theICO-SMEs line of credit throughout the decade from 1997 to 2006. A description isgiven of the use of the line of credit and its evolution, the degree to which the compa-nies in the different regions resorted to use the line of credit and the intensity (one ormore times) with which the types of productive units obtained financing through theintermediation of the ICO.
3.1. Operations and evolution of the ICO-SMEs line of credit
Throughout the mentioned period, the Instituto de Crédito Oficial executed 477,068operations: 25% were assigned to self-employed persons and 75% to commercialcompanies and other legal forms. Of the total number of operations, 53.9% of the be-neficiaries are limited companies, 17.4% are limited liability companies and 3.7% areothers. In this last group, cooperative companies benefited from 1.7% of the total.The total number of resources assigned by the State to the line of credit in the refe-rred to decade was approximately 30,000 million euros. In 2006, approximately7,000 million euros were assigned, which corresponds to 23.9% of the total opera-tions of the decade studied 1997-2006.
As regards NUTS-1, 37.2% of the operations figure in the East regions, and follo-wing this, also with two digits, are the South, Northeast and Centre regions, with19.6%, 13.3% and 13.3% respectively. These are followed by the Madrid and North-west regions, with 8.7% and 7.9%, respectively.
Depending on the number of workers employed by the beneficiaries of the line ofcredit, the operations formalised with productive units which have less than 10 wor-kers entail 61.2% of the total, while the rest, 38.8%, is shared between those which
94 García-Tabuenca, A., Crespo, J. L. and Cuadrado, J. R.
06 Garcia Tabuenca 28/9/09 12:24 Página 94
have more than 9 and less than 50 workers (30.8%), and those with less than 49 wor-kers (8%).
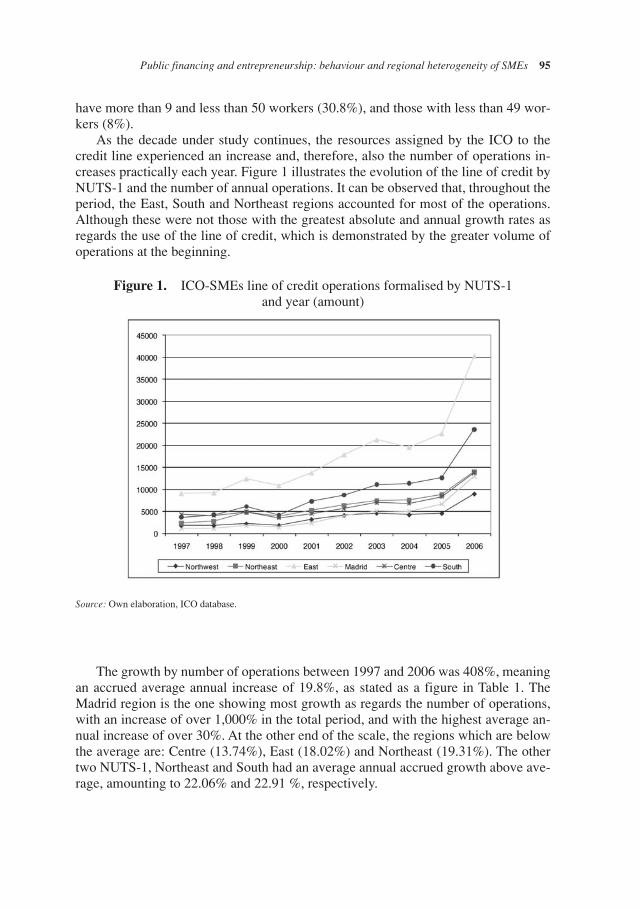
As the decade under study continues, the resources assigned by the ICO to thecredit line experienced an increase and, therefore, also the number of operations in-creases practically each year. Figure 1 illustrates the evolution of the line of credit byNUTS-1 and the number of annual operations. It can be observed that, throughout theperiod, the East, South and Northeast regions accounted for most of the operations.Although these were not those with the greatest absolute and annual growth rates asregards the use of the line of credit, which is demonstrated by the greater volume ofoperations at the beginning.
Public financing and entrepreneurship: behaviour and regional heterogeneity of SMEs 95
Figure 1. ICO-SMEs line of credit operations formalised by NUTS-1 and year (amount)
Source: Own elaboration, ICO database.
The growth by number of operations between 1997 and 2006 was 408%, meaningan accrued average annual increase of 19.8%, as stated as a figure in Table 1. TheMadrid region is the one showing most growth as regards the number of operations,with an increase of over 1,000% in the total period, and with the highest average an-nual increase of over 30%. At the other end of the scale, the regions which are belowthe average are: Centre (13.74%), East (18.02%) and Northeast (19.31%). The othertwo NUTS-1, Northeast and South had an average annual accrued growth above ave-rage, amounting to 22.06% and 22.91 %, respectively.
06 Garcia Tabuenca 28/9/09 12:24 Página 95
3.2. Beneficiaries, intensity as per business density and repeaterbeneficiaries
The 477,068 operations mentioned were carried out with 272,630 productive units(or an average of 1.75 operations per beneficiary). The situation shown by the opera-tions by NUTS-1 is reproduced when the productive beneficiary units are considered.The East region represents 37% of the total number of beneficiaries in the decade andthe South 20.5%, while the Northwest and Madrid demonstrate only 8.7% and 9.1%of the beneficiaries, respectively.
These results and their evolution show variations when, for each segment analy-sed, the beneficiary productive units are compared with those in the business net-work, taking into consideration the fact that the data is provided annually by the Di-rectorio Central de Empresas (DIRCE) [Central Directory of Companies] of theInstituto Nacional de Estadística (INE) [National Institute of Statistics]. Table 2 of-fers these new results: the intensity of the ICO-SMEs line of credit by business den-sity. It should be noted that the DIRCE does not provide data on the agrarian produc-tive units, thus, the corresponding beneficiaries of the ICO, slightly over 20,000 unitsduring the decade under study, were excluded.
The comparison of the total number of units in each NUTS-1 which used the lineof credit compared with the average number of those existing shows that, as an ave-rage in the whole of Spain, almost one in every 10 productive units (9.2%) benefitedin the decade under study. The NUTS-1 regions which most used the line of credit areNortheast (10.6%), East (10.55) and Centre (10.3%) and those which least did so areMadrid (5.8%), Northwest (8.2%) and South (8.7%). In order to deduce whether theline of credit is being used as expected according to its participation in the businessstructure, the relationship between the percentages representing the number of unitsfrom each region using the line of credit divided by the total number of beneficiaryunits in Spain, and the percentage of the productive units in this region divided by thenational total can be used. Thus, a value greater than 100% shows that the NUTS-1uses the line of credit more intensely than was initially expected and an inferior valuedemonstrates that the line of credit is not recurred to sufficiently within this territory.
96 García-Tabuenca, A., Crespo, J. L. and Cuadrado, J. R.
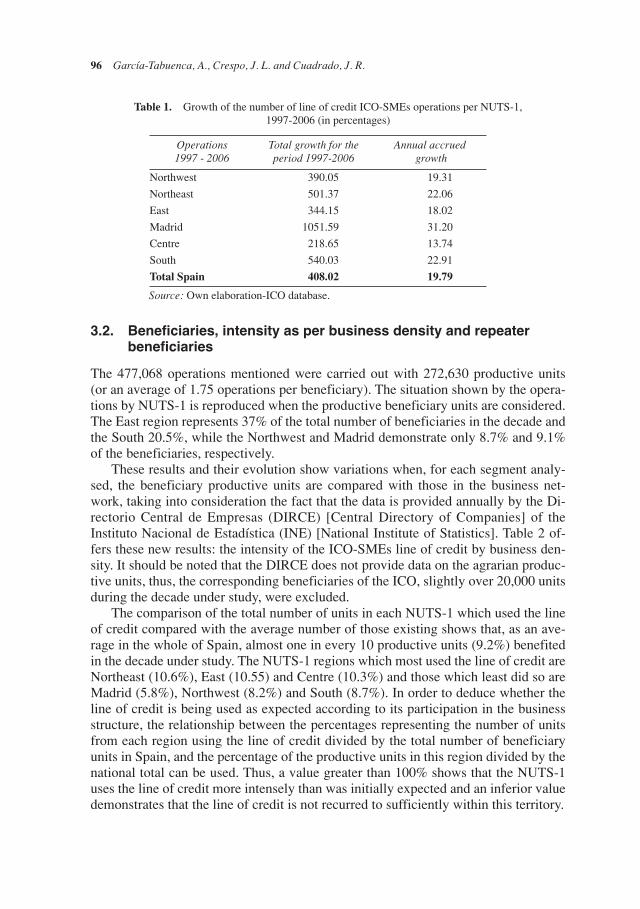
Table 1. Growth of the number of line of credit ICO-SMEs operations per NUTS-1,1997-2006 (in percentages)
Operations 1997 - 2006
Total growth for the period 1997-2006
Annual accruedgrowth
Northwest 390.05 19.31
Northeast 501.37 22.06
East 344.15 18.02
Madrid 1051.59 31.20
Centre 218.65 13.74
South 540.03 22.91
Total Spain 408.02 19.79
Source: Own elaboration-ICO database.
06 Garcia Tabuenca 28/9/09 12:24 Página 96
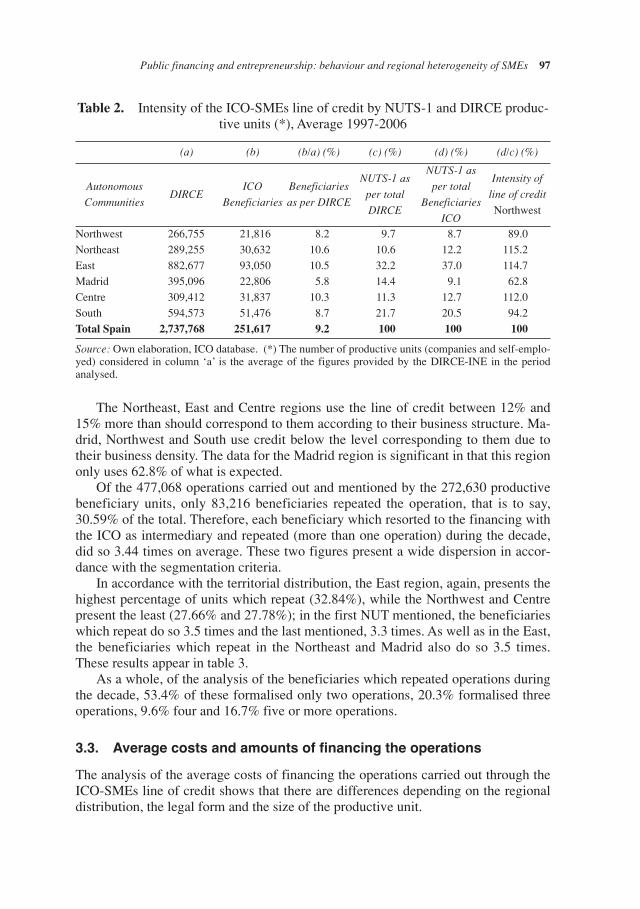
The Northeast, East and Centre regions use the line of credit between 12% and15% more than should correspond to them according to their business structure. Ma-drid, Northwest and South use credit below the level corresponding to them due totheir business density. The data for the Madrid region is significant in that this regiononly uses 62.8% of what is expected.
Of the 477,068 operations carried out and mentioned by the 272,630 productivebeneficiary units, only 83,216 beneficiaries repeated the operation, that is to say,30.59% of the total. Therefore, each beneficiary which resorted to the financing withthe ICO as intermediary and repeated (more than one operation) during the decade,did so 3.44 times on average. These two figures present a wide dispersion in accor-dance with the segmentation criteria.
In accordance with the territorial distribution, the East region, again, presents thehighest percentage of units which repeat (32.84%), while the Northwest and Centrepresent the least (27.66% and 27.78%); in the first NUT mentioned, the beneficiarieswhich repeat do so 3.5 times and the last mentioned, 3.3 times. As well as in the East,the beneficiaries which repeat in the Northeast and Madrid also do so 3.5 times.These results appear in table 3.
As a whole, of the analysis of the beneficiaries which repeated operations duringthe decade, 53.4% of these formalised only two operations, 20.3% formalised threeoperations, 9.6% four and 16.7% five or more operations.
3.3. Average costs and amounts of financing the operations
The analysis of the average costs of financing the operations carried out through theICO-SMEs line of credit shows that there are differences depending on the regionaldistribution, the legal form and the size of the productive unit.
Public financing and entrepreneurship: behaviour and regional heterogeneity of SMEs 97
(a) (b) (b/a) (%) (c) (%) (d) (%) (d/c) (%)
Autonomous
Communities DIRCE
ICO
Beneficiaries
Beneficiaries
as per DIRCE
NUTS-1 as
per total
DIRCE
NUTS-1 as
per total
Beneficiaries
ICO
Intensity of
line of credit
Northwest
Northwest 266,755 21,816 8.2 9.7 8.7 89.0
Northeast 289,255 30,632 10.6 10.6 12.2 115.2
East 882,677 93,050 10.5 32.2 37.0 114.7
Madrid 395,096 22,806 5.8 14.4 9.1 62.8
Centre 309,412 31,837 10.3 11.3 12.7 112.0
South 594,573 51,476 8.7 21.7 20.5 94.2
Total Spain 2,737,768 251,617 9.2 100 100 100
Table 2. Intensity of the ICO-SMEs line of credit by NUTS-1 and DIRCE produc-tive units (*), Average 1997-2006
Source: Own elaboration, ICO database. (*) The number of productive units (companies and self-emplo-yed) considered in column ‘a’ is the average of the figures provided by the DIRCE-INE in the periodanalysed.
06 Garcia Tabuenca 28/9/09 12:24 Página 97
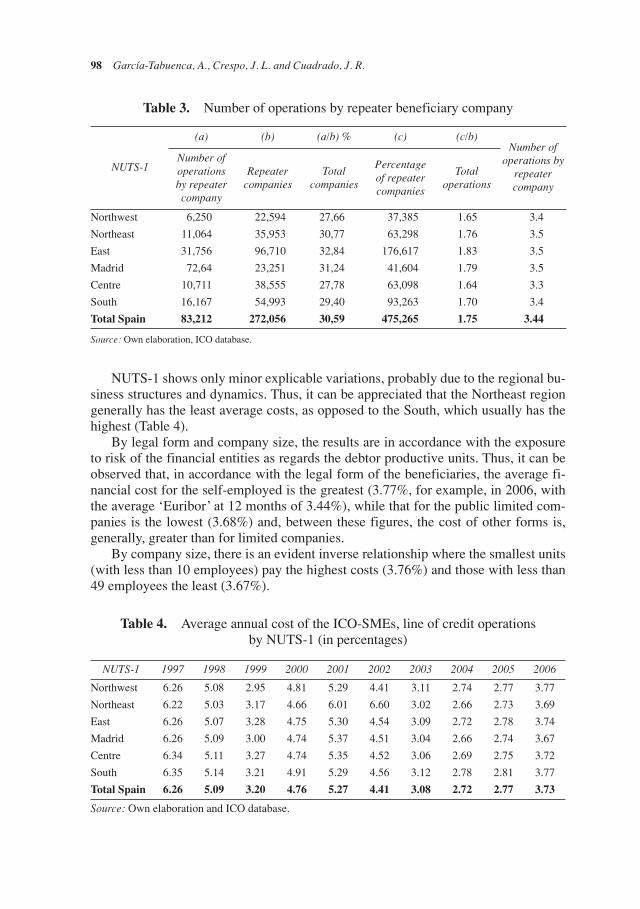
NUTS-1 shows only minor explicable variations, probably due to the regional bu-siness structures and dynamics. Thus, it can be appreciated that the Northeast regiongenerally has the least average costs, as opposed to the South, which usually has thehighest (Table 4).
By legal form and company size, the results are in accordance with the exposureto risk of the financial entities as regards the debtor productive units. Thus, it can beobserved that, in accordance with the legal form of the beneficiaries, the average fi-nancial cost for the self-employed is the greatest (3.77%, for example, in 2006, withthe average ‘Euribor’ at 12 months of 3.44%), while that for the public limited com-panies is the lowest (3.68%) and, between these figures, the cost of other forms is,generally, greater than for limited companies.
By company size, there is an evident inverse relationship where the smallest units(with less than 10 employees) pay the highest costs (3.76%) and those with less than49 employees the least (3.67%).
98 García-Tabuenca, A., Crespo, J. L. and Cuadrado, J. R.
Table 3. Number of operations by repeater beneficiary company
NUTS-1
(a) (b) (a/b) % (c) (c/b)Number of
operations byrepeatercompany
Number ofoperations by repeater company
Repeater companies
Total companies
Percentageof repeater companies
Total operations
Northwest 6,250 22,594 27,66 37,385 1.65 3.4
Northeast 11,064 35,953 30,77 63,298 1.76 3.5
East 31,756 96,710 32,84 176,617 1.83 3.5
Madrid 72,64 23,251 31,24 41,604 1.79 3.5
Centre 10,711 38,555 27,78 63,098 1.64 3.3
South 16,167 54,993 29,40 93,263 1.70 3.4
Total Spain 83,212 272,056 30,59 475,265 1.75 3.44
Source: Own elaboration, ICO database.
NUTS-1 1997 1998 1999 2000 2001 2002 2003 2004 2005 2006
Northwest 6.26 5.08 2.95 4.81 5.29 4.41 3.11 2.74 2.77 3.77
Northeast 6.22 5.03 3.17 4.66 6.01 6.60 3.02 2.66 2.73 3.69
East 6.26 5.07 3.28 4.75 5.30 4.54 3.09 2.72 2.78 3.74
Madrid 6.26 5.09 3.00 4.74 5.37 4.51 3.04 2.66 2.74 3.67
Centre 6.34 5.11 3.27 4.74 5.35 4.52 3.06 2.69 2.75 3.72
South 6.35 5.14 3.21 4.91 5.29 4.56 3.12 2.78 2.81 3.77
Total Spain 6.26 5.09 3.20 4.76 5.27 4.41 3.08 2.72 2.77 3.73
Table 4. Average annual cost of the ICO-SMEs, line of credit operations by NUTS-1 (in percentages)
Source: Own elaboration and ICO database.
06 Garcia Tabuenca 28/9/09 12:24 Página 98
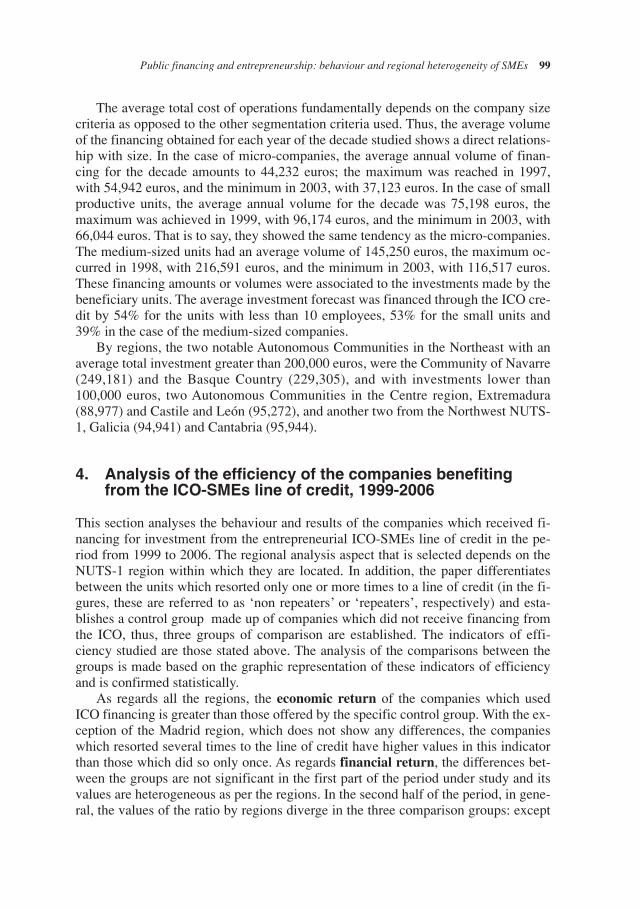
The average total cost of operations fundamentally depends on the company sizecriteria as opposed to the other segmentation criteria used. Thus, the average volumeof the financing obtained for each year of the decade studied shows a direct relations-hip with size. In the case of micro-companies, the average annual volume of finan-cing for the decade amounts to 44,232 euros; the maximum was reached in 1997,with 54,942 euros, and the minimum in 2003, with 37,123 euros. In the case of smallproductive units, the average annual volume for the decade was 75,198 euros, themaximum was achieved in 1999, with 96,174 euros, and the minimum in 2003, with66,044 euros. That is to say, they showed the same tendency as the micro-companies.The medium-sized units had an average volume of 145,250 euros, the maximum oc-curred in 1998, with 216,591 euros, and the minimum in 2003, with 116,517 euros.These financing amounts or volumes were associated to the investments made by thebeneficiary units. The average investment forecast was financed through the ICO cre-dit by 54% for the units with less than 10 employees, 53% for the small units and39% in the case of the medium-sized companies.
By regions, the two notable Autonomous Communities in the Northeast with anaverage total investment greater than 200,000 euros, were the Community of Navarre(249,181) and the Basque Country (229,305), and with investments lower than100,000 euros, two Autonomous Communities in the Centre region, Extremadura(88,977) and Castile and León (95,272), and another two from the Northwest NUTS-1, Galicia (94,941) and Cantabria (95,944).
4. Analysis of the efficiency of the companies benefitingfrom the ICO-SMEs line of credit, 1999-2006
This section analyses the behaviour and results of the companies which received fi-nancing for investment from the entrepreneurial ICO-SMEs line of credit in the pe-riod from 1999 to 2006. The regional analysis aspect that is selected depends on theNUTS-1 region within which they are located. In addition, the paper differentiatesbetween the units which resorted only one or more times to a line of credit (in the fi-gures, these are referred to as ‘non repeaters’ or ‘repeaters’, respectively) and esta-blishes a control group made up of companies which did not receive financing fromthe ICO, thus, three groups of comparison are established. The indicators of effi-ciency studied are those stated above. The analysis of the comparisons between thegroups is made based on the graphic representation of these indicators of efficiencyand is confirmed statistically.
As regards all the regions, the economic return of the companies which usedICO financing is greater than those offered by the specific control group. With the ex-ception of the Madrid region, which does not show any differences, the companieswhich resorted several times to the line of credit have higher values in this indicatorthan those which did so only once. As regards financial return, the differences bet-ween the groups are not significant in the first part of the period under study and itsvalues are heterogeneous as per the regions. In the second half of the period, in gene-ral, the values of the ratio by regions diverge in the three comparison groups: except
Public financing and entrepreneurship: behaviour and regional heterogeneity of SMEs 99
06 Garcia Tabuenca 28/9/09 12:24 Página 99

in the Northwest region, where there are no differences, the beneficiary companiestend to be located below the control group, and the values of those which repeat ope-rations are below those of the companies which only resort to this financing once(Figure 2).
100 García-Tabuenca, A., Crespo, J. L. and Cuadrado, J. R.
Source: Own elaboration, ICO and SABI databases.
Figure 2. Evolution of indicators of profitability of the companies beneficiaries of the ICO-SMEs line of credit, by NUTS-1 regions (in percentages)
Financial return Economic return
06 Garcia Tabuenca 28/9/09 12:24 Página 100
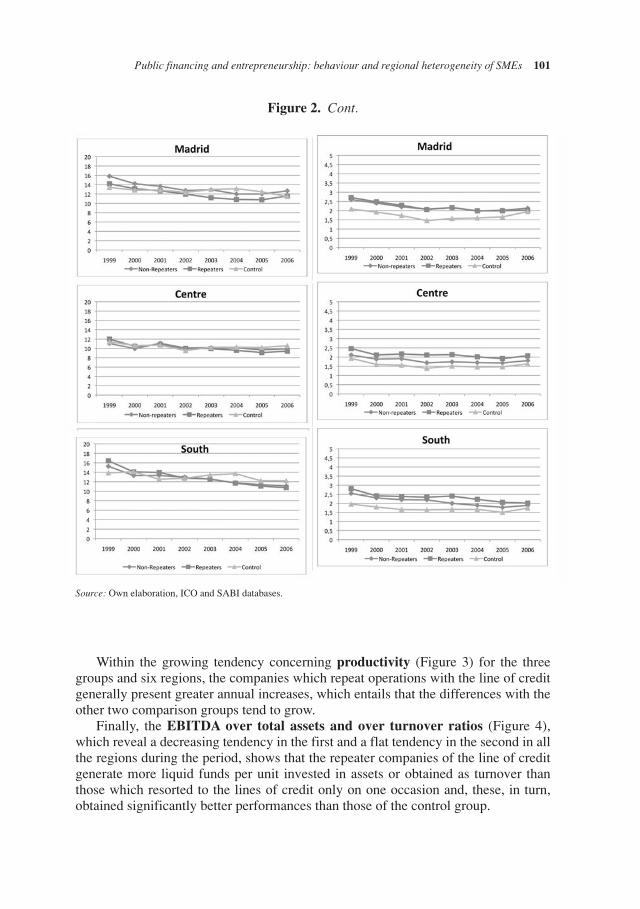
Within the growing tendency concerning productivity (Figure 3) for the threegroups and six regions, the companies which repeat operations with the line of creditgenerally present greater annual increases, which entails that the differences with theother two comparison groups tend to grow.
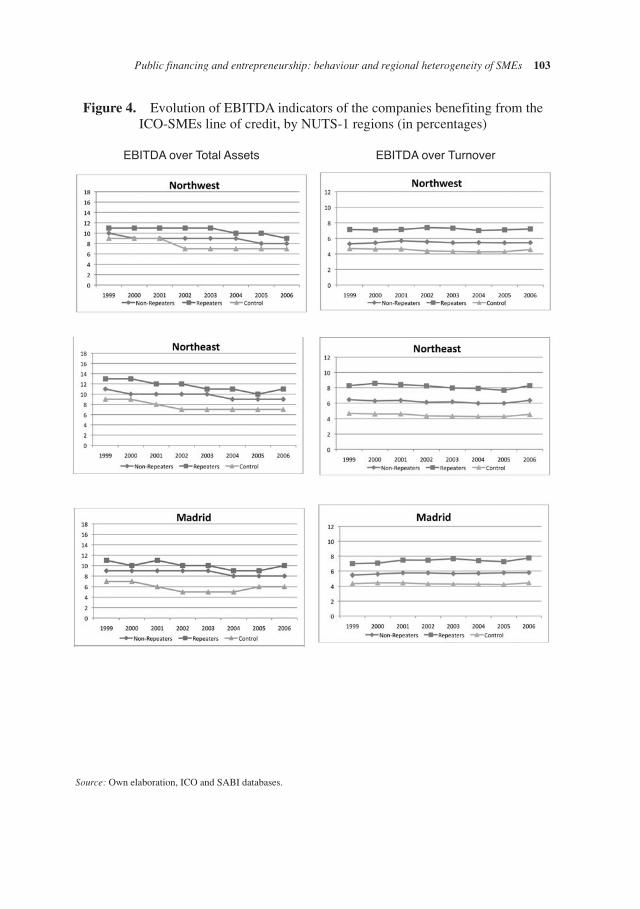
Finally, the EBITDA over total assets and over turnover ratios (Figure 4),which reveal a decreasing tendency in the first and a flat tendency in the second in allthe regions during the period, shows that the repeater companies of the line of creditgenerate more liquid funds per unit invested in assets or obtained as turnover thanthose which resorted to the lines of credit only on one occasion and, these, in turn,obtained significantly better performances than those of the control group.
Public financing and entrepreneurship: behaviour and regional heterogeneity of SMEs 101
Source: Own elaboration, ICO and SABI databases.
Figure 2. Cont.
06 Garcia Tabuenca 28/9/09 12:24 Página 101
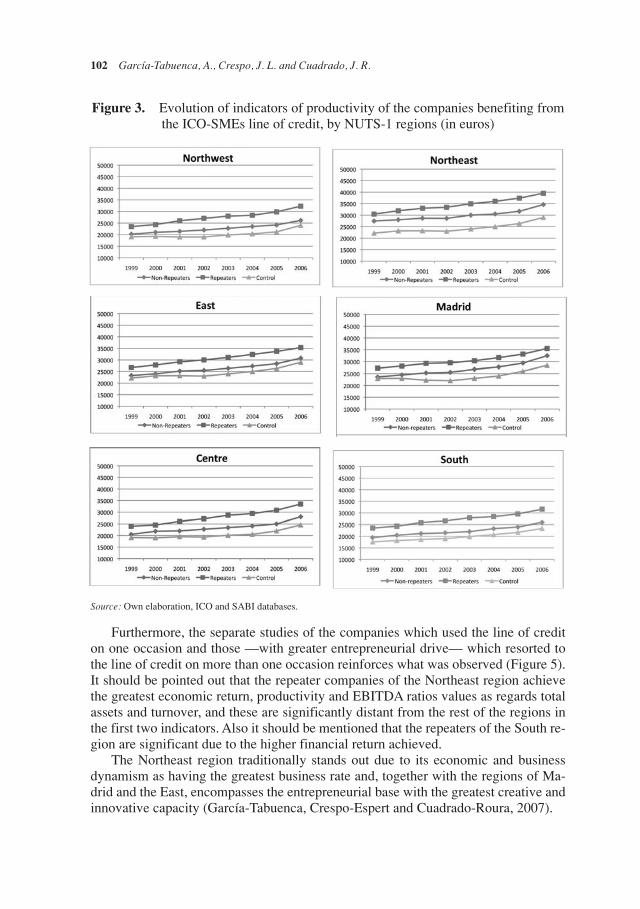
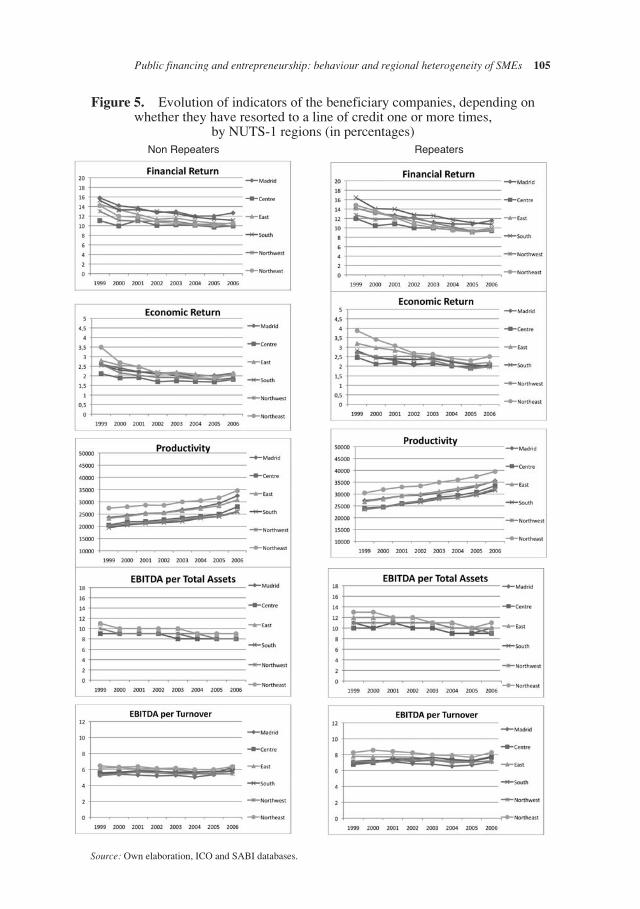
Furthermore, the separate studies of the companies which used the line of crediton one occasion and those —with greater entrepreneurial drive— which resorted tothe line of credit on more than one occasion reinforces what was observed (Figure 5).It should be pointed out that the repeater companies of the Northeast region achievethe greatest economic return, productivity and EBITDA ratios values as regards totalassets and turnover, and these are significantly distant from the rest of the regions inthe first two indicators. Also it should be mentioned that the repeaters of the South re-gion are significant due to the higher financial return achieved.
The Northeast region traditionally stands out due to its economic and businessdynamism as having the greatest business rate and, together with the regions of Ma-drid and the East, encompasses the entrepreneurial base with the greatest creative andinnovative capacity (García-Tabuenca, Crespo-Espert and Cuadrado-Roura, 2007).
102 García-Tabuenca, A., Crespo, J. L. and Cuadrado, J. R.
Figure 3. Evolution of indicators of productivity of the companies benefiting fromthe ICO-SMEs line of credit, by NUTS-1 regions (in euros)
Source: Own elaboration, ICO and SABI databases.
06 Garcia Tabuenca 28/9/09 12:24 Página 102
Public financing and entrepreneurship: behaviour and regional heterogeneity of SMEs 103
Source: Own elaboration, ICO and SABI databases.
Figure 4. Evolution of EBITDA indicators of the companies benefiting from theICO-SMEs line of credit, by NUTS-1 regions (in percentages)
EBITDA over Total Assets EBITDA over Turnover
06 Garcia Tabuenca 28/9/09 12:24 Página 103
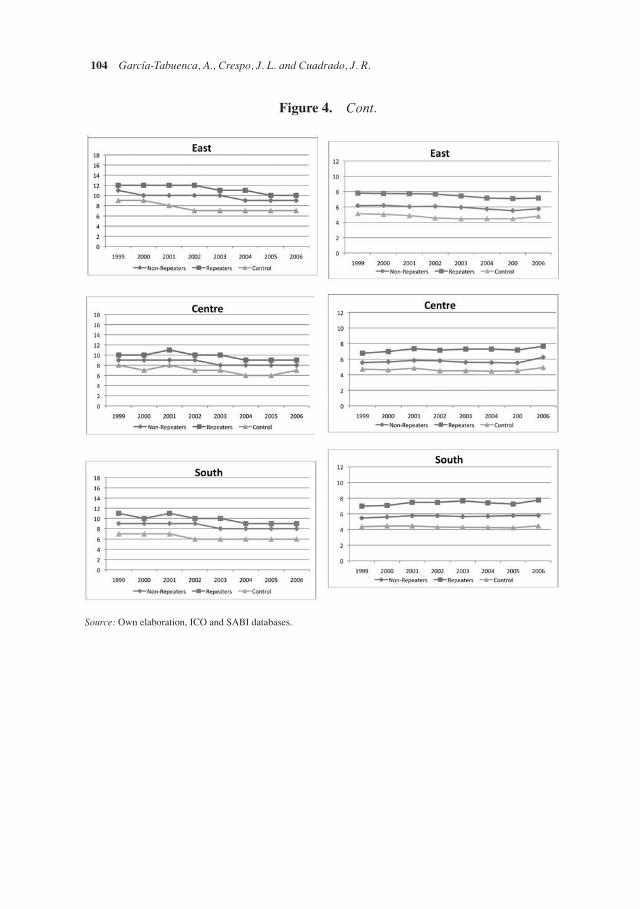
104 García-Tabuenca, A., Crespo, J. L. and Cuadrado, J. R.
Figure 4. Cont.
Source: Own elaboration, ICO and SABI databases.
06 Garcia Tabuenca 28/9/09 12:24 Página 104
Public financing and entrepreneurship: behaviour and regional heterogeneity of SMEs 105
Figure 5. Evolution of indicators of the beneficiary companies, depending onwhether they have resorted to a line of credit one or more times,
by NUTS-1 regions (in percentages)
Source: Own elaboration, ICO and SABI databases.
Non Repeaters Repeaters
06 Garcia Tabuenca 28/9/09 12:24 Página 105

106 García-Tabuenca, A., Crespo, J. L. and Cuadrado, J. R.
In conclusion, from the figure analysis in all the regions, the values shown by theindicators of economic return, productivity and EBITDA ratios over total assetsor over turnover of the repeater beneficiary companies are greater than those of thenon repeaters and, the values of these are greater than the non beneficiaries. Finan-cial return, regardless of the use of the line of credit or the intensity of use, of thecompanies located in the regions is similar. However, in recent years, this indicatortends to be located slightly below that demonstrated by the non-beneficiary compa-nies regarding the greater intensity of the use of the line of credit.
These results are confirmed statistically for all the regions in the indicators wherethe differences arise, except for the financial return, through the non-parametric testof Kruskal Wallis, as shown in Table 5.
NUTS-1Economic Return Financial Return Productivity EBITDAS
Chi-squared Sig Chi-squared Sig Chi-squared Sig Chi-squared Sig
Northwest 188.615 0.000 0.504 0.777 875.485 0.000 580.404 0.000
Northeast 425.442 0.000 10.226 0.006 2680.795 0.000 1058.398 0.000
East 257.137 0.000 84.279 0.000 939.97 0.000 1063.981 0.000
Centre 205.47 0.000 15.209 0.000 1092.689 0.000 578.268 0.000
Madrid 185.559 0.000 30.599 0.000 505.488 0.000 725.147 0.000
South 145.245 0.000 18.219 0.000 844.469 0.000 538.355 0.000
Table 5. Kruskal-Wallis statistical test of the differences between the study groups:repeater and non repeater beneficiaries and control group, by NUTS-1
Level of freedom: 2 in all the analysesLevel of significance for the acceptance of differences: < 0.10.Source: Own elaboration.
5. Summary and conclusions
In the area regarding the evaluation of public policies in support of financing entre-preneurial activity there is a lack of empirical studies in order to contrast the reaso-ning behind these. This study addresses this objective and contributes evidence to ve-rify that the financial support provided by the ICO-SMEs line has a relevant effect onthe efficiency and performance of the receiving companies.
The objective of the ICO-SMEs line of credit is to provide financial support forthe investment assumed by the SMEs applying for the credit. That is to say, to facili-tate long-term financing for the investment of important agents generating employ-ment and social and economic cohesion in Spain. This investment may be assigned tothe renovation of the productive structure of the company or the increase of thisstructure for expansion.
During the period, the ICO-SMEs line of credit financed almost half a million in-vestment operations (477,078) with 272,630 beneficiaries, amounting to almost30,000 million euros. The volume of operations in which the ICO acted as interme-diary increased at an average annual rate of 20%. Almost one of every 10 active Spa-
06 Garcia Tabuenca 28/9/09 12:24 Página 106
Public financing and entrepreneurship: behaviour and regional heterogeneity of SMEs 107
nish companies (self-employed and companies) were beneficiaries of the line of cre-dit on one or several occasions. Three of every 10 companies carried out more thanone operation: those which repeated, on average, did so 3.44 times. The averageamount of the financing obtained through the bank intermediation was 61,851 eurosper operation or 108,231 euros per company, at an average cost adjusted to the inter-bank interest rate.
In small companies and micro-companies, the line of credit has contributed to thefinancing of more than half of their investments, and, as regards the medium-sizedcompanies, almost 40%. The cost of financing has a slight inverse relation with thesize of the company and with the legal form (self-employed and micro-companies arethose with the highest costs, and public limited companies and medium-sized compa-nies are those with the lowest costs).
The paper puts forward fundamental reasons which show adequate compliancewith the objectives laid down by the State and the acceptance of the line of credit bythe entrepreneurs during the period under study. Some of the reasons for this are: 1)the high number of operations and the substantial annual growth rate, 2) the largenumber of beneficiary companies, 3) the significant percentage of Spanish compa-nies which have benefited from these lines of credit, 4) the considerable proportion ofcompanies which repeat the operation, and 5) principally, the acceptance of the cha-racteristics of the costs (financial and transaction) of practically half the investmentsmade.
The results of the efficiency analysis has contributed evidence of this adaptationto public objectives and business acceptance. In fact, the companies which resortedto the line of credit, as a consequence of their decisions and management present bet-ter performances than those which decided not to use these. Although the existence ofcausality cannot be demonstrated, it is likely that the ICO financing has been one ofthe factors which contributed to the efficiency achieved. In this sense, if the objectivewas to confirm causality between the support received and the effects on the compa-nies, we should correct the problem of non-random selection of the sample (due tothe selection of the beneficiaries by the financial intermediaries) by using the laHeckman correction methodology (Heckman, 1979), which reduces the problem ofendogeneity.
These results show that the beneficiary companies achieve greater values in theeconomic efficiency indicators contemplated (economic return and productivity), aswell as the financial efficiency indicators (EBITDA over total assets or over turno-ver), with regard to those results obtained by the companies which did not resort tothe line of credit. The more intensely the beneficiary companies used the line of cre-dit during the period studied, the greater the differences.
Only the financial return indicator shows lower values in the beneficiaries, which,within an entrepreneurial strategy, may be explained by the need that a company hasto increase its sources of financing when the renovation of the components of its pro-ductive structure is addressed or when it contends with a stage of expansion orgrowth (precisely the objective of the line of credit). This increase of resources th-rough debt or the increase in equity entails the need to take on greater financial costsand expenses, which affects the surplus owned. These results of the indicators are
06 Garcia Tabuenca 28/9/09 12:24 Página 107
108 García-Tabuenca, A., Crespo, J. L. and Cuadrado, J. R.
particularly explicit in micro-companies, which are the most numerous beneficiariesof the line of credit, as in the Spanish business structure.
From the regional focus provided by the study, the differences between regionsare scarcely significant as each of the six Spanish NUTS-1 provide the results explai-ned. Only the beneficiary companies of the Northeast region stand out, as they showbetter values in the indicators studied. This region is the one which, in relative terms,used the line of credit most (15% above the representation of its business sector in thenational structure), where the costs of financing the line of credit was lowest in mostof the years in the period, and where the two Autonomous Communities (Navarre andthe Basque Country) with the highest average investment financed per beneficiarycompany are found. The Northeast region has a strong business dynamism. Its com-panies, together with the East and Madrid regions, are those which reach the greatestvalues of financial, return and productivity, and is characterised by having the grea-test rate of entrepreneurship and with an entrepreneurial base with a substantial crea-tive and innovative capacity. The characteristics of the business network of the regionseems to reinforce the disposition of companies and entrepreneurs to use the ICO lineof credit and this benefit the performance of the companies.
In short, in order to encourage entrepreneurial activity, regarding the initiativeswhich instigate the business ventures and those which are more consolidated, greateraccess to long-term resources which can be provided by the public administrationsbecomes a valuable instrument of economic policy. This leads to economic growthand employment and has an impact on entrepreneurial performance depending on theregional dynamics.
5. Bibliografía
Audretsch, D., Thurik, A. R., Verheul, I. and Wennekers, A. (2002): «Entrepreneurship: Determinats andPolicy in a European – US Comparison», Boston/Dordrecht: Kluwer Academic Publisher.
Bond, S. and Meghir, C. (1994): «Dynamic Investment Models and the Firm Financial Policy», Review ofEconomic Studies, 61:197-222.
Brewer III, E., Genay, H., Jackson III, W. and Worthington, P. (1996): «How Are Small Firms Financed?Evidence from Small Business Investment Companies», Economic Perspectives, XX, 6:2-18.
Caminal, R. (1995): «El papel de las restricciones de crédito y las políticas públicas en la financiación delas pequeña y mediana empresa», Papeles de Economía Española, 65, pages 224-234.
Costa Campi, M. T., Duch, N. and Lladòs i Masllorens, J. (2000): «Determinantes de la innovación yefectos sobre la competitividad: el caso de las empresas textiles», Documents de treball IEB, 4.
De Miguel, A. and Pindado, J. (2001): «Determinants of Capital Structure: New Evidence from SpanishPanel Data», Journal of Corporate Finance, 7, pages 77-99.
García-Tabuenca, A., Crespo-Espert, J.L. and Cuadrado-Roura, J.R. (2007): Entrepreneurship, CreativeIndustries and Regional Dynamics in Spain, paper presented in ERSA 47th Congress and ASRDLF44th Congress, Paris, August, 2007.
Greenwald, B, Stiglitz, J.E. and Weiss, A. (1984): «Informational Imperfections in the Capital Market andMacroeconomics Fluctuations», The American Economic Rewiev: Papers and Proceedings of the96th. American Economic Association, May, pages 194-199.
Grossman, S. and Hart, O. (1982): «Corporate Financial Structure and Managerial Incentives», en Mc-Call, J. (ed.), The Economics of Information and Uncertainty, University of Chicago Press, Chicago,pages 107-140.
06 Garcia Tabuenca 28/9/09 12:24 Página 108
Heckman, J. (1979): «Sample selection bias as a specification error». Econometrica, 47:153-61.Hellwig, M. (1991): «Banking, Financial Intermediation and Corporate Finance», en Giovannini, A. y
Mayer C. (eds.), European Financial Integration, Cambridge University Press, Cambridge, pages 32-63.
Jensen, M. (1986): «Agency Cost of Free Cash Flow, Corporate Finance and Takeovers», American Eco-nomic Review, Papers and Proceedings, 76:323-329.
Jensen, M. and Mecklin, W. (1976): «Theory of the Firm: Manager Behaviour, Agency Costs and Analo-gous Situations», Journal of Financial Economics, 3:323-329.
La Porta, R., López De Silanes, F. and Shleifer, A. (1999): «Corporate Ownership around the World»,Journal of Finance, 54,:471-517.
Leland, H. and Pyle, D. (1977): «Information Asymmetries, Financial Structure and Firm Intermedia-tion», Journal of Finance, 50:301-318.
Maroto, J.A. (1997): «Estructura financiera y crecimiento de las Pymes», Economía Industrial, 310:29-40.
Modigliani, F. and Miller, M.H. (1958): «The Cost of Capital , Corporation Finance and the Theory ofInvestment» , The American Economic Review, 48:261-297.
Nijkamp, P. (2000): «Entrepreneurship in a modern network economy», Regional Studies, 37, num. 4, pa-ges 395-405.
Porter, M. E. (1998): «Clusters and the New Economics of Competition», Harvard Business Review, 76,iss. 6, page 77.
Praag, C.M. and Cramer, J. S. (2001): «The Roots of Entrepreneurship and Labour Demand: IndividualAbility and Low Risk Aversion», Economica, Vol. 68, num. 269:45-62.
Ross, S. (1977): «The Determinants of Firm Structure. The Incentive Signal Approach», Bell Journal ofEconomics, 8:23-40.
Salas, V. (1996): «Factores estructurales de la financiación de la pyme: valoración y recomendaciones»,Revista Asturiana de Economía, 6:29-39.
Thurik, R. and Verheul, I. (2002): «The relationships between entrepreneurship and unemployment. Thecase of Spain», Centre for Advanced Small Business Economics. Erasmus University Rotterdam.
Public financing and entrepreneurship: behaviour and regional heterogeneity of SMEs 109
06 Garcia Tabuenca 28/9/09 12:24 Página 109