Embed Size (px)
Citation preview
2015 Ministry of Finance 1 www.finance.gov.lb
Public Finance Annual Review
2015
Public Finance Annual Review 2015
2015 Ministry of Finance 2 www.finance.gov.lb
Table of Content
Public Finance Highlights ............................................................................................................ 4 Section I: Fiscal Overview ........................................................................................................... 6 Section II: Revenue Outcome .......................................................................................................7
Tax Revenues ........................................................................................................................... 8
Non-Tax Revenues .................................................................................................................. 14
Treasury Receipts .................................................................................................................... 14
Section III: Expenditure Outcome ............................................................................................. 15 Current Expenditure................................................................................................................ 17
Current Primary Expenditure .................................................................................................. 17
Capital Expenditure ................................................................................................................ 23 Treasury Expenditure ............................................................................................................. 25
Social Expenditure ................................................................................................................. 25
Section IV: Public Debt Developments ...................................................................................... 27 Local Currency Debt ............................................................................................................... 28
Foreign Currency Debt ........................................................................................................... 34
List of Tables
Table 1: Summary of Fiscal Performance .................................................................................... 6 Table 2: Total Revenues ............................................................................................................... 7 Table 3: Tax Revenues .................................................................................................................. 8 Table 4: Total Imports & Effective VAT Rate .............................................................................. 9 Table 5: Non-Tax Revenues ......................................................................................................... 14 Table 6: Expenditure summary ................................................................................................... 15 Table 7: Expenditure by economic classification ....................................................................... 16 Table 8: Breakdown of Salaries, Wages and Related Benefits (Jan-Dec 2014- Jan-Dec 2015) . 17 Table 9: Breakdown of Transfers to Public Institutions (salaries) ............................................ 18 Table 10: Transfers to EDL ........................................................................................................... 19 Table 11: Breakdown of Article 14 by Economic Classification ................................................. 20 Table 12: Interest Payments ........................................................................................................22 Table 13: Payments to CDR for Construction in Progress ........................................................ 23 Table 14: Payments to Municipalities ........................................................................................ 25 Table 15: Main Social Expenditure ............................................................................................. 26 Table 16: Public Debt Outstanding as of end-December 2015 ................................................. 27 Table 17: Domestic Currency Debt by Holder and Instrument as of end-2015 ........................ 32 Table 18: Evolution of Primary Market Rates ............................................................................ 33 Table 19: Foreign Currency Debt by Holder and Instrument as at end-2015 ........................... 34 Table 20: Lebanon Secondary Market Yields ............................................................................ 38
List of Figures
Figure 1: Fiscal and Primary Balance (2013–2015) ....................................................................... 4 Figure 2: Monthly Fiscal Evolution in 2015................................................................................... 6 Figure 3: Total Revenues as a Percentage of GDP (2006-2015) ................................................. 7 Figure 4: Number of Imported Cars and Private Car Registration Fees – (2006-2015) ............ 10 Figure 5: Property Registration Statistics from Cadaster (2010-2015) ...................................... 10
Public Finance Annual Review 2015
2015 Ministry of Finance 3 www.finance.gov.lb
Error! Bookmark not defined.Figure 6: Total Fees Collected from Sales Transactions, by Region (2014-2015) ...................................................................................................................... 11 Figure 7: Tax on Interest Income, by Institution (2006 - 2015) ................................................. 15 Figure 8: Excises on Tobacco, by Products (2012-2015) ............................................................. 13 Figure 9: Expenditure as a Percentage of Gross Domestic Product ........................................ 15 Figure 10: Debt by Currency and Gross Debt to GDP ................................................................ 27 Figure 11: Average Time to Maturity and Average Cost of Local Currency Debt .................... 29 Figure 12: Local Currency Debt Holdings by Commercial Banks and BDL ............................... 29 Figure 13: Results of 2015 Weekly Auctions .............................................................................. 30 Figure 14: LL Debt Holdings by ‘Other’ Institutions ................................................................... 31 Figure 15: Distribution of LL Debt Holdings ............................................................................... 31 Figure 16: Share of Outstanding TBs from LL Debt .................................................................. 32 Figure 17: Cumulative Rollover Ratios 2014-2015 ...................................................................... 32 Figure 18: TB Yields for Regularly Auctioned Instruments 2011–2014 ..................................... 32 Figure 19: Outstanding Eurobonds and Loans .......................................................................... 35 Figure 20: Composition of Eurobonds end-2015 ....................................................................... 35 Figure 21: Bilateral and Multilateral Loans ................................................................................ 38 Figure 22: Composition of Loans end-2015................................................................................ 38 List of Boxes
Box 1: Impact of commodity prices on imports ...................................................................... 9 Box 1: Voluntary Debt Exchange & New Cash Issuance – November 2015 ...........................36
Public Finance Annual Review 2015
2015 Ministry of Finance 4 www.finance.gov.lb
PUBLIC FINANCE HIGHLIGHTS
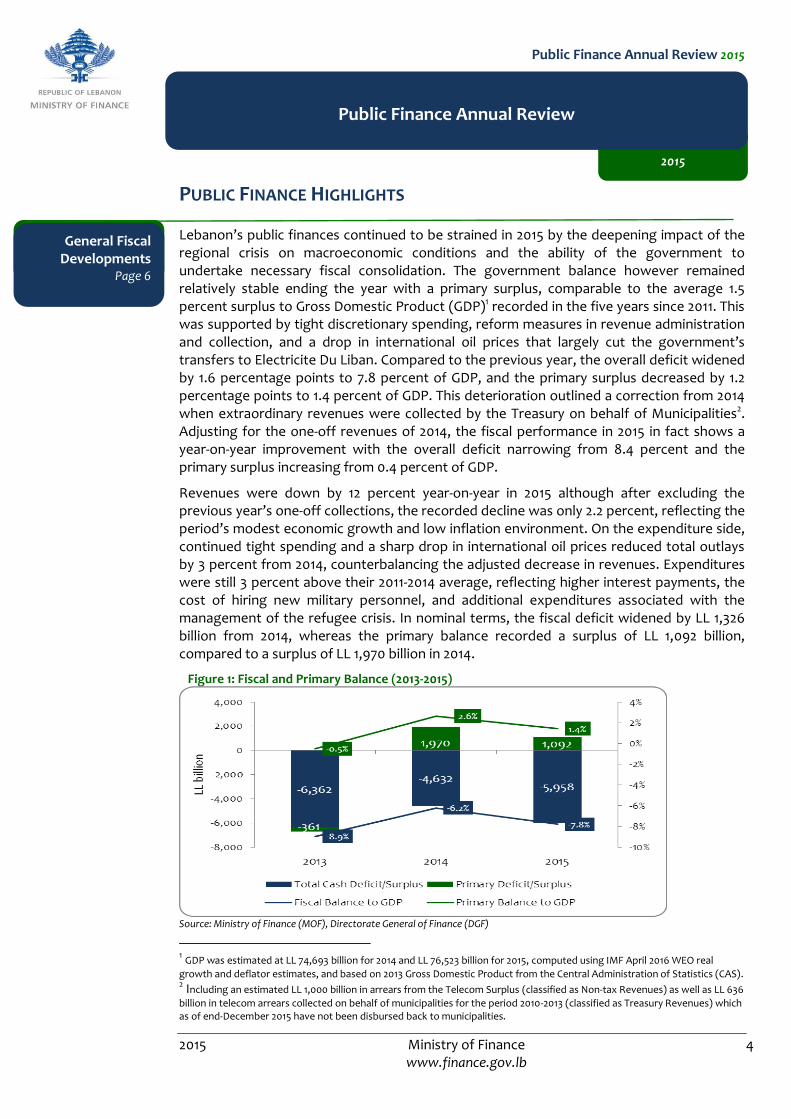
Lebanon’s public finances continued to be strained in 2015 by the deepening impact of the regional crisis on macroeconomic conditions and the ability of the government to undertake necessary fiscal consolidation. The government balance however remained relatively stable ending the year with a primary surplus, comparable to the average 1.5 percent surplus to Gross Domestic Product (GDP)1 recorded in the five years since 2011. This was supported by tight discretionary spending, reform measures in revenue administration and collection, and a drop in international oil prices that largely cut the government’s transfers to Electricite Du Liban. Compared to the previous year, the overall deficit widened by 1.6 percentage points to 7.8 percent of GDP, and the primary surplus decreased by 1.2 percentage points to 1.4 percent of GDP. This deterioration outlined a correction from 2014 when extraordinary revenues were collected by the Treasury on behalf of Municipalities2. Adjusting for the one-off revenues of 2014, the fiscal performance in 2015 in fact shows a year-on-year improvement with the overall deficit narrowing from 8.4 percent and the primary surplus increasing from 0.4 percent of GDP.
Revenues were down by 12 percent year-on-year in 2015 although after excluding the previous year’s one-off collections, the recorded decline was only 2.2 percent, reflecting the period’s modest economic growth and low inflation environment. On the expenditure side, continued tight spending and a sharp drop in international oil prices reduced total outlays by 3 percent from 2014, counterbalancing the adjusted decrease in revenues. Expenditures were still 3 percent above their 2011-2014 average, reflecting higher interest payments, the cost of hiring new military personnel, and additional expenditures associated with the management of the refugee crisis. In nominal terms, the fiscal deficit widened by LL 1,326 billion from 2014, whereas the primary balance recorded a surplus of LL 1,092 billion, compared to a surplus of LL 1,970 billion in 2014.
Figure 1: Fiscal and Primary Balance (2013-2015)
Source: Ministry of Finance (MOF), Directorate General of Finance (DGF)
1 GDP was estimated at LL 74,693 billion for 2014 and LL 76,523 billion for 2015, computed using IMF April 2016 WEO real
growth and deflator estimates, and based on 2013 Gross Domestic Product from the Central Administration of Statistics (CAS). 2 Including an estimated LL 1,000 billion in arrears from the Telecom Surplus (classified as Non-tax Revenues) as well as LL 636
billion in telecom arrears collected on behalf of municipalities for the period 2010-2013 (classified as Treasury Revenues) which as of end-December 2015 have not been disbursed back to municipalities.
General Fiscal Developments
Page 6
2015
Public Finance Annual Review
Public Finance Annual Review 2015
2015 Ministry of Finance 5 www.finance.gov.lb
Total revenues dropped by 12.0 percent in 2015, mostly reflecting a correction from the previous year when one-off collections from the Ministry of Telecommunications were made. Excluding those, total revenues were still down by 2.2 percent, owing to the generally weak economic environment and low inflation levels. Tax revenues were almost unchanged at LL 10,330 billion, almost 13.5 percent of GDP, with modest increases in taxes on Income, Profits, and Capital gains attributable to collection efforts by the tax administration, and offsetting decreases in consumer taxes and taxes on property.
Total expenditures declined by 3 percent to LL 20,393 billion in 2015, or around 26.6 percent of GDP from 28 percent in 2014, as a sharp drop in international oil prices substantially reduced transfers to Electricite Du Liban (EDL), while discretionary spending remained tightly under control. The 46 percent drop in the fuel subsidy was however parially counterbalanced by a LL 408 billion (6.45 percent) increase in interest payments boosted by the growing debt stock, a LL 353 billlion increase in personnel cost (5.2 percent), and a LL 226 billion increase in transfers to municipalities (32 percent).
Outstanding gross public debt reached LL 106,015 billion by end-2015 increasing by 5.6 percent from the previous year. With Nominal GDP increasing at 2.5 percent from 2014, the Debt-to-GDP ratio rose to around 139 percent from 134 percent. Local currency debt accounted for 61 percent of the total increase in public debt, adding LL 3,443 billion, whereas foreign currency debt grew by an equivalent of LL 2,216 billion. Net public debt added 7.4 percent as public sector deposits decreased by LL 738 billion or 5.3 percent.
Revenues Page 7
Expenditure Page 15
Public Debt Development
Page 27
Public Finance Annual Review 2015
2015 Ministry of Finance 6 www.finance.gov.lb
SECTION I: FISCAL OVERVIEW
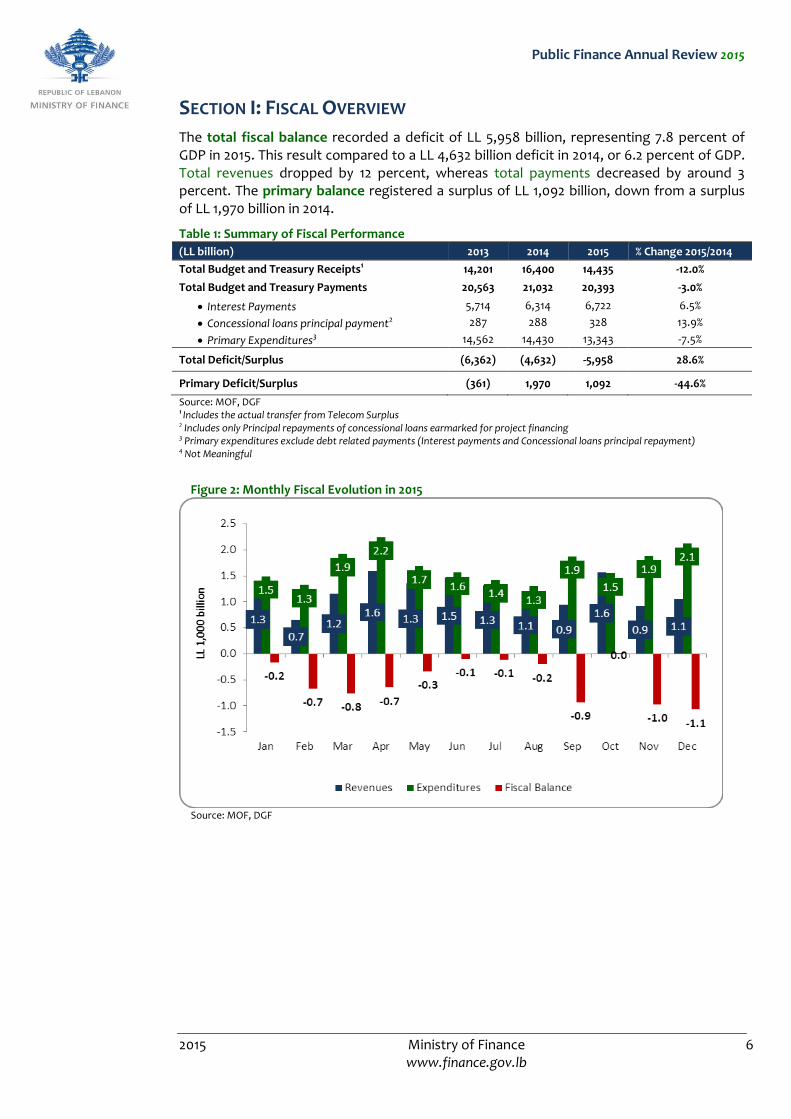
The total fiscal balance recorded a deficit of LL 5,958 billion, representing 7.8 percent of GDP in 2015. This result compared to a LL 4,632 billion deficit in 2014, or 6.2 percent of GDP. Total revenues dropped by 12 percent, whereas total payments decreased by around 3 percent. The primary balance registered a surplus of LL 1,092 billion, down from a surplus of LL 1,970 billion in 2014.
Table 1: Summary of Fiscal Performance
(LL billion) 2013 2014 2015 % Change 2015/2014
Total Budget and Treasury Receipts1 14,201 16,400 14,435 -12.0%
Total Budget and Treasury Payments 20,563 21,032 20,393 -3.0%
Interest Payments 5,714 6,314 6,722 6.5%
Concessional loans principal payment2 287 288 328 13.9%
Primary Expenditures3 14,562 14,430 13,343 -7.5%
Total Deficit/Surplus (6,362) (4,632) -5,958 28.6%
Primary Deficit/Surplus (361) 1,970 1,092 -44.6%
Source: MOF, DGF 1 Includes the actual transfer from Telecom Surplus 2 Includes only Principal repayments of concessional loans earmarked for project financing 3 Primary expenditures exclude debt related payments (Interest payments and Concessional loans principal repayment) 4 Not Meaningful
Figure 2: Monthly Fiscal Evolution in 2015
Source: MOF, DGF
Public Finance Annual Review 2015
2015 Ministry of Finance 7 www.finance.gov.lb
SECTION II: REVENUE OUTCOME
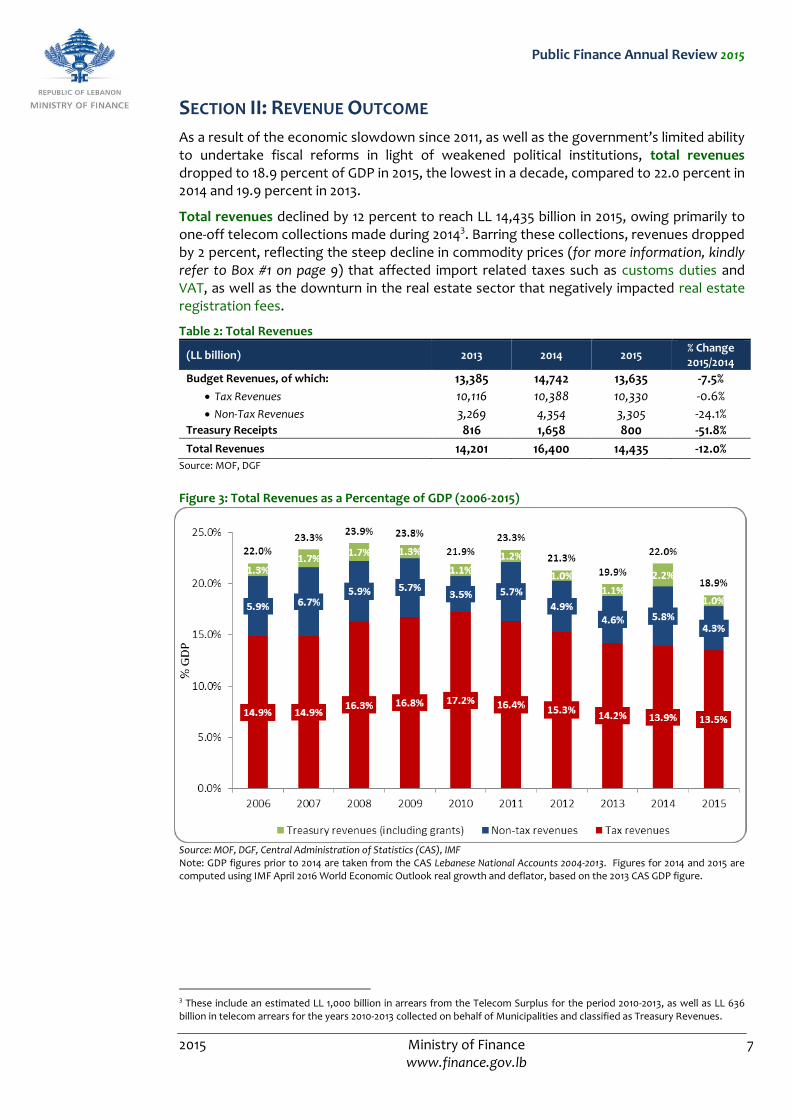
As a result of the economic slowdown since 2011, as well as the government’s limited ability to undertake fiscal reforms in light of weakened political institutions, total revenues dropped to 18.9 percent of GDP in 2015, the lowest in a decade, compared to 22.0 percent in 2014 and 19.9 percent in 2013.
Total revenues declined by 12 percent to reach LL 14,435 billion in 2015, owing primarily to one-off telecom collections made during 20143. Barring these collections, revenues dropped by 2 percent, reflecting the steep decline in commodity prices (for more information, kindly refer to Box #1 on page 9) that affected import related taxes such as customs duties and VAT, as well as the downturn in the real estate sector that negatively impacted real estate registration fees.
Table 2: Total Revenues
(LL billion) 2013 2014 2015 % Change 2015/2014
Budget Revenues, of which: 13,385 14,742 13,635 -7.5%
Tax Revenues 10,116 10,388 10,330 -0.6%
Non-Tax Revenues 3,269 4,354 3,305 -24.1% Treasury Receipts 816 1,658 800 -51.8%
Total Revenues 14,201 16,400 14,435 -12.0% Source: MOF, DGF
Figure 3: Total Revenues as a Percentage of GDP (2006-2015)
Source: MOF, DGF, Central Administration of Statistics (CAS), IMF Note: GDP figures prior to 2014 are taken from the CAS Lebanese National Accounts 2004-2013. Figures for 2014 and 2015 are computed using IMF April 2016 World Economic Outlook real growth and deflator, based on the 2013 CAS GDP figure.
3 These include an estimated LL 1,000 billion in arrears from the Telecom Surplus for the period 2010-2013, as well as LL 636 billion in telecom arrears for the years 2010-2013 collected on behalf of Municipalities and classified as Treasury Revenues.
Public Finance Annual Review 2015
2015 Ministry of Finance 8 www.finance.gov.lb
TAX REVENUES
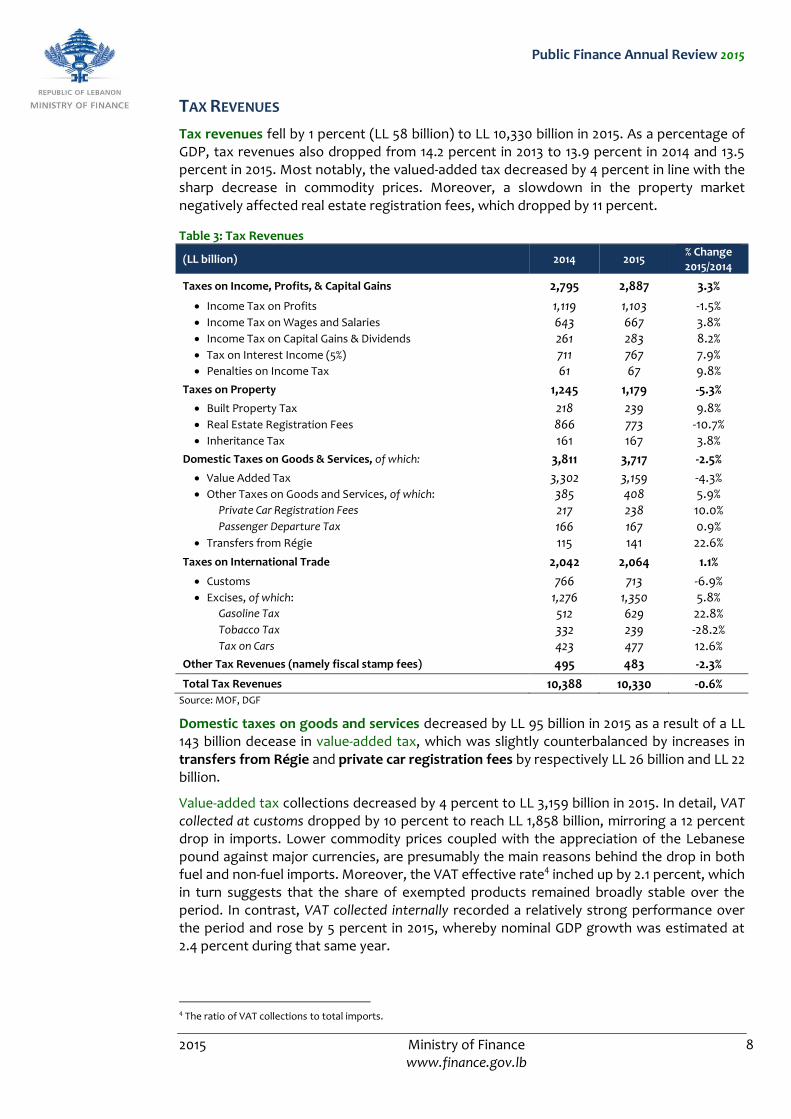
Tax revenues fell by 1 percent (LL 58 billion) to LL 10,330 billion in 2015. As a percentage of GDP, tax revenues also dropped from 14.2 percent in 2013 to 13.9 percent in 2014 and 13.5 percent in 2015. Most notably, the valued-added tax decreased by 4 percent in line with the sharp decrease in commodity prices. Moreover, a slowdown in the property market negatively affected real estate registration fees, which dropped by 11 percent.
Table 3: Tax Revenues
(LL billion) 2014 2015 % Change 2015/2014
Taxes on Income, Profits, & Capital Gains 2,795 2,887 3.3%
Income Tax on Profits 1,119 1,103 -1.5% Income Tax on Wages and Salaries 643 667 3.8% Income Tax on Capital Gains & Dividends 261 283 8.2% Tax on Interest Income (5%) 711 767 7.9% Penalties on Income Tax 61 67 9.8%
Taxes on Property 1,245 1,179 -5.3%
Built Property Tax 218 239 9.8% Real Estate Registration Fees 866 773 -10.7% Inheritance Tax 161 167 3.8%
Domestic Taxes on Goods & Services, of which: 3,811 3,717 -2.5%
Value Added Tax 3,302 3,159 -4.3% Other Taxes on Goods and Services, of which: 385 408 5.9%
Private Car Registration Fees 217 238 10.0% Passenger Departure Tax 166 167 0.9%
Transfers from Régie 115 141 22.6%
Taxes on International Trade 2,042 2,064 1.1%
Customs 766 713 -6.9% Excises, of which: 1,276 1,350 5.8%
Gasoline Tax 512 629 22.8% Tobacco Tax 332 239 -28.2% Tax on Cars 423 477 12.6%
Other Tax Revenues (namely fiscal stamp fees) 495 483 -2.3%
Total Tax Revenues 10,388 10,330 -0.6% Source: MOF, DGF
Domestic taxes on goods and services decreased by LL 95 billion in 2015 as a result of a LL 143 billion decease in value-added tax, which was slightly counterbalanced by increases in transfers from Régie and private car registration fees by respectively LL 26 billion and LL 22 billion.
Value-added tax collections decreased by 4 percent to LL 3,159 billion in 2015. In detail, VAT collected at customs dropped by 10 percent to reach LL 1,858 billion, mirroring a 12 percent drop in imports. Lower commodity prices coupled with the appreciation of the Lebanese pound against major currencies, are presumably the main reasons behind the drop in both fuel and non-fuel imports. Moreover, the VAT effective rate4 inched up by 2.1 percent, which in turn suggests that the share of exempted products remained broadly stable over the period. In contrast, VAT collected internally recorded a relatively strong performance over the period and rose by 5 percent in 2015, whereby nominal GDP growth was estimated at 2.4 percent during that same year.
4 The ratio of VAT collections to total imports.
Public Finance Annual Review 2015
2015 Ministry of Finance 9 www.finance.gov.lb
Box #1: Impact of commodity prices on imports
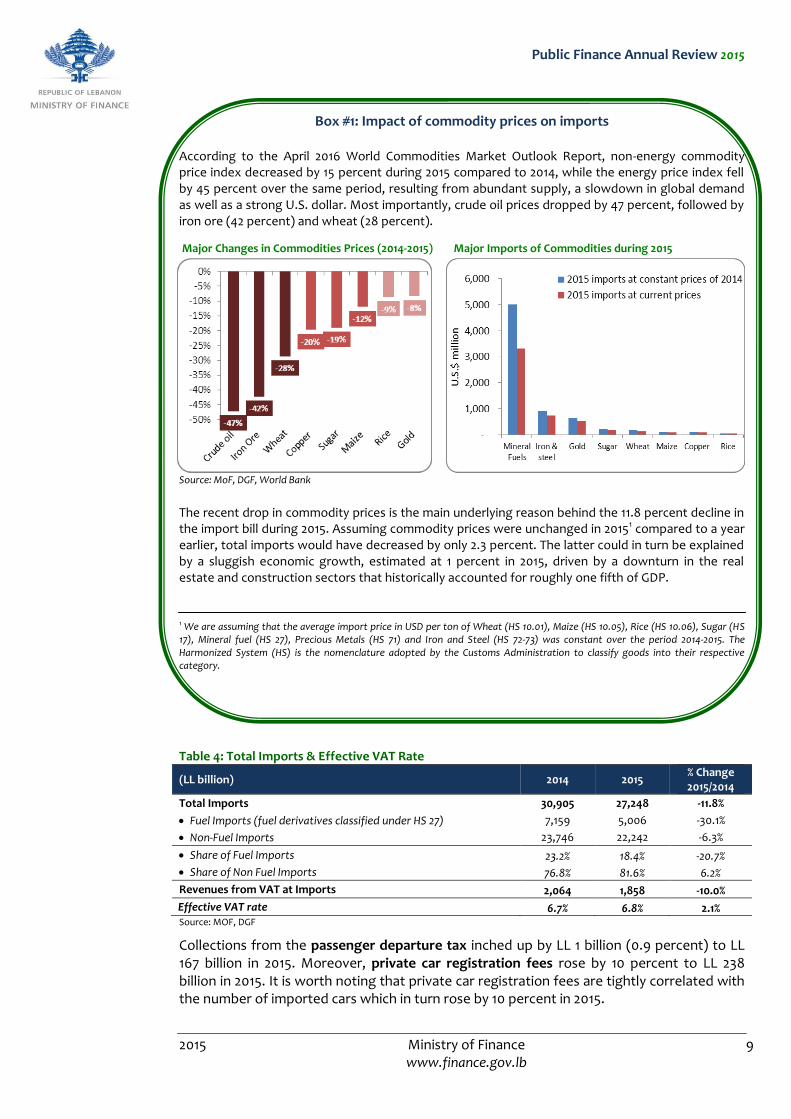
According to the April 2016 World Commodities Market Outlook Report, non-energy commodity price index decreased by 15 percent during 2015 compared to 2014, while the energy price index fell by 45 percent over the same period, resulting from abundant supply, a slowdown in global demand as well as a strong U.S. dollar. Most importantly, crude oil prices dropped by 47 percent, followed by iron ore (42 percent) and wheat (28 percent).
Major Changes in Commodities Prices (2014-2015) Major Imports of Commodities during 2015
Source: MoF, DGF, World Bank The recent drop in commodity prices is the main underlying reason behind the 11.8 percent decline in the import bill during 2015. Assuming commodity prices were unchanged in 20151 compared to a year earlier, total imports would have decreased by only 2.3 percent. The latter could in turn be explained by a sluggish economic growth, estimated at 1 percent in 2015, driven by a downturn in the real estate and construction sectors that historically accounted for roughly one fifth of GDP.
1 We are assuming that the average import price in USD per ton of Wheat (HS 10.01), Maize (HS 10.05), Rice (HS 10.06), Sugar (HS 17), Mineral fuel (HS 27), Precious Metals (HS 71) and Iron and Steel (HS 72-73) was constant over the period 2014-2015. The Harmonized System (HS) is the nomenclature adopted by the Customs Administration to classify goods into their respective category.
Table 4: Total Imports & Effective VAT Rate
(LL billion) 2014 2015 % Change 2015/2014
Total Imports 30,905 27,248 -11.8%
Fuel Imports (fuel derivatives classified under HS 27) 7,159 5,006 -30.1%
Non-Fuel Imports 23,746 22,242 -6.3%
Share of Fuel Imports 23.2% 18.4% -20.7%
Share of Non Fuel Imports 76.8% 81.6% 6.2%
Revenues from VAT at Imports 2,064 1,858 -10.0%
Effective VAT rate 6.7% 6.8% 2.1% Source: MOF, DGF
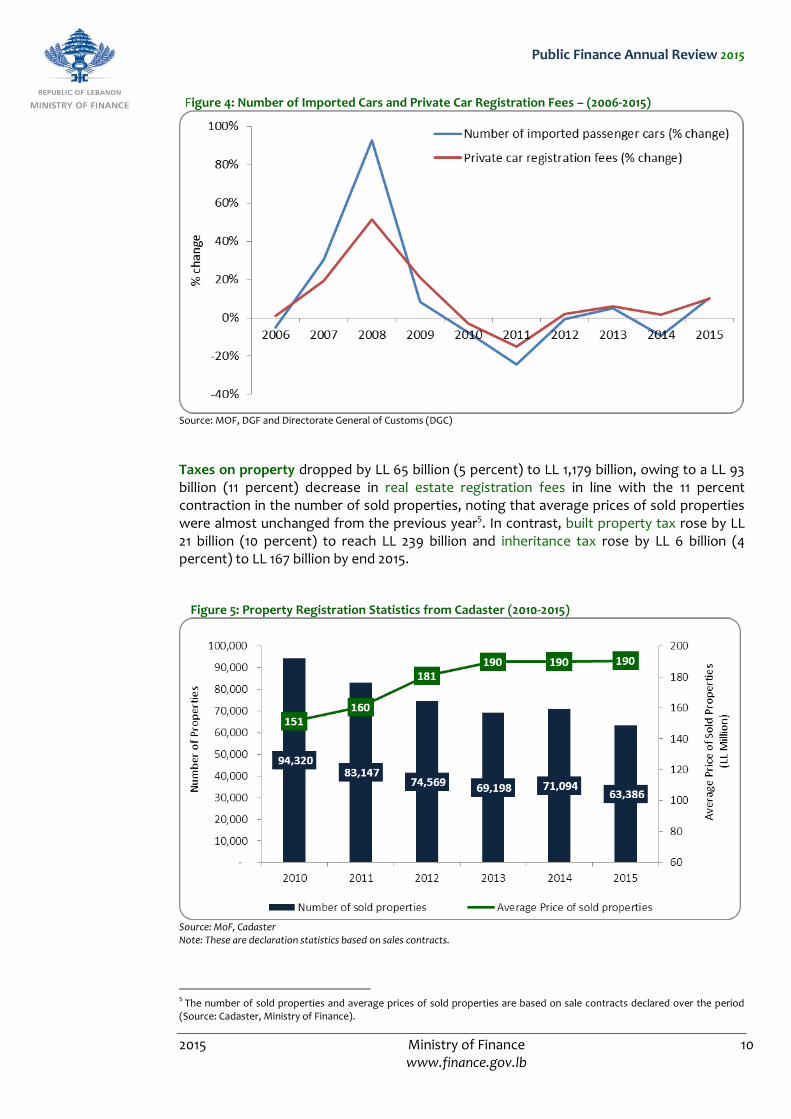
Collections from the passenger departure tax inched up by LL 1 billion (0.9 percent) to LL 167 billion in 2015. Moreover, private car registration fees rose by 10 percent to LL 238 billion in 2015. It is worth noting that private car registration fees are tightly correlated with the number of imported cars which in turn rose by 10 percent in 2015.
Public Finance Annual Review 2015
2015 Ministry of Finance 10 www.finance.gov.lb
Figure 4: Number of Imported Cars and Private Car Registration Fees – (2006-2015)
Source: MOF, DGF and Directorate General of Customs (DGC)
Taxes on property dropped by LL 65 billion (5 percent) to LL 1,179 billion, owing to a LL 93 billion (11 percent) decrease in real estate registration fees in line with the 11 percent contraction in the number of sold properties, noting that average prices of sold properties were almost unchanged from the previous year5. In contrast, built property tax rose by LL 21 billion (10 percent) to reach LL 239 billion and inheritance tax rose by LL 6 billion (4 percent) to LL 167 billion by end 2015.
Figure 5: Property Registration Statistics from Cadaster (2010-2015)
Source: MoF, Cadaster Note: These are declaration statistics based on sales contracts.
5 The number of sold properties and average prices of sold properties are based on sale contracts declared over the period (Source: Cadaster, Ministry of Finance).
Public Finance Annual Review 2015
2015 Ministry of Finance 11 www.finance.gov.lb
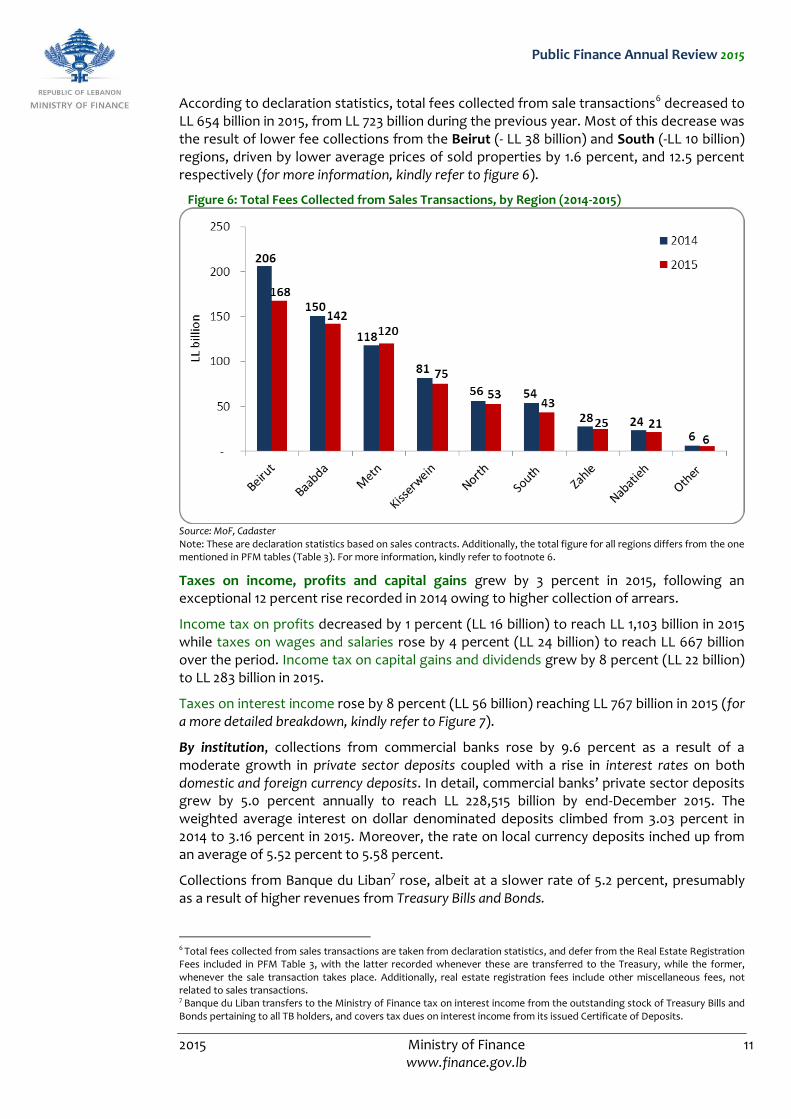
According to declaration statistics, total fees collected from sale transactions6 decreased to LL 654 billion in 2015, from LL 723 billion during the previous year. Most of this decrease was the result of lower fee collections from the Beirut (- LL 38 billion) and South (-LL 10 billion) regions, driven by lower average prices of sold properties by 1.6 percent, and 12.5 percent respectively (for more information, kindly refer to figure 6).
Figure 6: Total Fees Collected from Sales Transactions, by Region (2014-2015)
Source: MoF, Cadaster Note: These are declaration statistics based on sales contracts. Additionally, the total figure for all regions differs from the one mentioned in PFM tables (Table 3). For more information, kindly refer to footnote 6.
Taxes on income, profits and capital gains grew by 3 percent in 2015, following an exceptional 12 percent rise recorded in 2014 owing to higher collection of arrears.
Income tax on profits decreased by 1 percent (LL 16 billion) to reach LL 1,103 billion in 2015 while taxes on wages and salaries rose by 4 percent (LL 24 billion) to reach LL 667 billion over the period. Income tax on capital gains and dividends grew by 8 percent (LL 22 billion) to LL 283 billion in 2015.
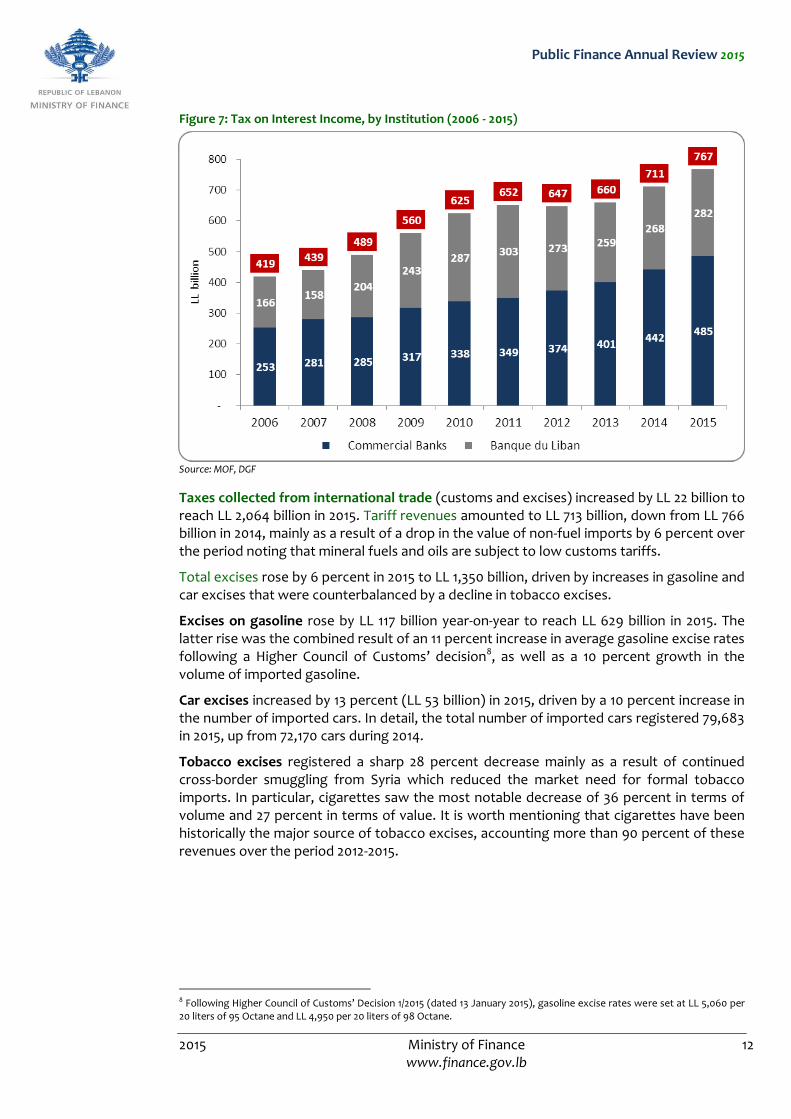
Taxes on interest income rose by 8 percent (LL 56 billion) reaching LL 767 billion in 2015 (for a more detailed breakdown, kindly refer to Figure 7).
By institution, collections from commercial banks rose by 9.6 percent as a result of a moderate growth in private sector deposits coupled with a rise in interest rates on both domestic and foreign currency deposits. In detail, commercial banks’ private sector deposits grew by 5.0 percent annually to reach LL 228,515 billion by end-December 2015. The weighted average interest on dollar denominated deposits climbed from 3.03 percent in 2014 to 3.16 percent in 2015. Moreover, the rate on local currency deposits inched up from an average of 5.52 percent to 5.58 percent.
Collections from Banque du Liban7 rose, albeit at a slower rate of 5.2 percent, presumably as a result of higher revenues from Treasury Bills and Bonds.
6 Total fees collected from sales transactions are taken from declaration statistics, and defer from the Real Estate Registration Fees included in PFM Table 3, with the latter recorded whenever these are transferred to the Treasury, while the former, whenever the sale transaction takes place. Additionally, real estate registration fees include other miscellaneous fees, not related to sales transactions. 7 Banque du Liban transfers to the Ministry of Finance tax on interest income from the outstanding stock of Treasury Bills and Bonds pertaining to all TB holders, and covers tax dues on interest income from its issued Certificate of Deposits.
Public Finance Annual Review 2015
2015 Ministry of Finance 12 www.finance.gov.lb
Figure 7: Tax on Interest Income, by Institution (2006 - 2015)
Source: MOF, DGF
Taxes collected from international trade (customs and excises) increased by LL 22 billion to reach LL 2,064 billion in 2015. Tariff revenues amounted to LL 713 billion, down from LL 766 billion in 2014, mainly as a result of a drop in the value of non-fuel imports by 6 percent over the period noting that mineral fuels and oils are subject to low customs tariffs.
Total excises rose by 6 percent in 2015 to LL 1,350 billion, driven by increases in gasoline and car excises that were counterbalanced by a decline in tobacco excises.
Excises on gasoline rose by LL 117 billion year-on-year to reach LL 629 billion in 2015. The latter rise was the combined result of an 11 percent increase in average gasoline excise rates following a Higher Council of Customs’ decision8, as well as a 10 percent growth in the volume of imported gasoline.
Car excises increased by 13 percent (LL 53 billion) in 2015, driven by a 10 percent increase in the number of imported cars. In detail, the total number of imported cars registered 79,683 in 2015, up from 72,170 cars during 2014.
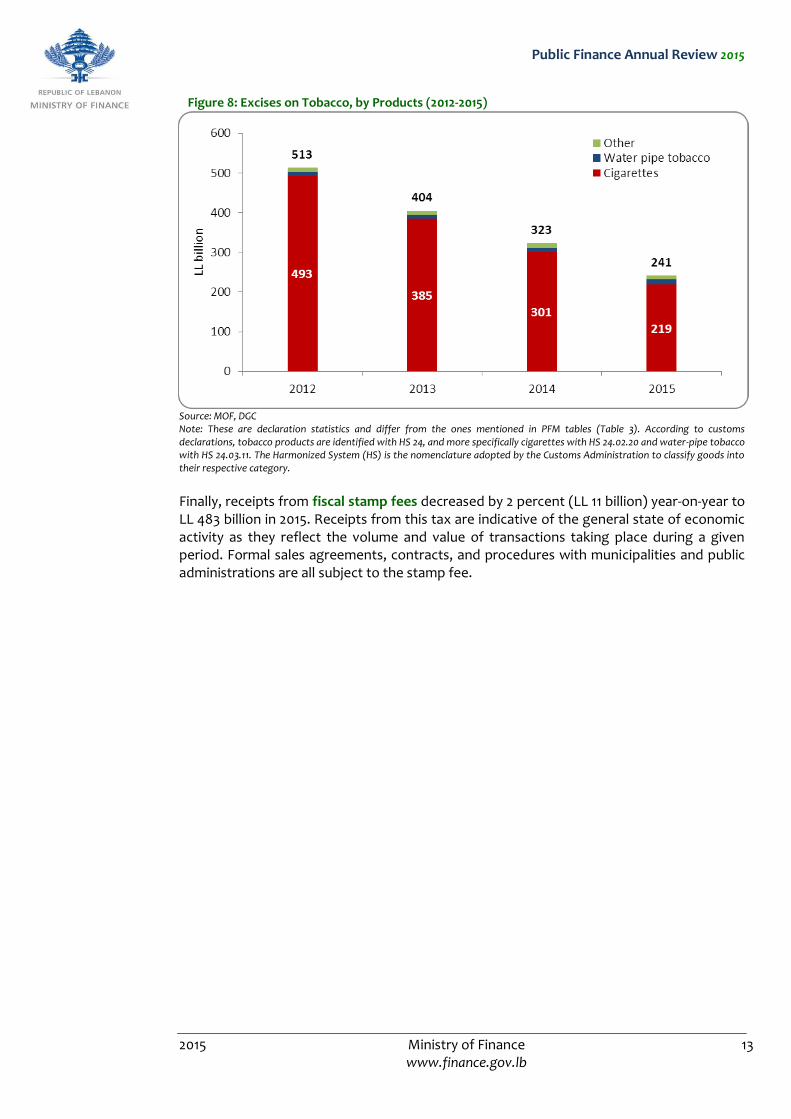
Tobacco excises registered a sharp 28 percent decrease mainly as a result of continued cross-border smuggling from Syria which reduced the market need for formal tobacco imports. In particular, cigarettes saw the most notable decrease of 36 percent in terms of volume and 27 percent in terms of value. It is worth mentioning that cigarettes have been historically the major source of tobacco excises, accounting more than 90 percent of these revenues over the period 2012-2015.
8 Following Higher Council of Customs’ Decision 1/2015 (dated 13 January 2015), gasoline excise rates were set at LL 5,060 per 20 liters of 95 Octane and LL 4,950 per 20 liters of 98 Octane.
Public Finance Annual Review 2015
2015 Ministry of Finance 13 www.finance.gov.lb
Figure 8: Excises on Tobacco, by Products (2012-2015)
Source: MOF, DGC Note: These are declaration statistics and differ from the ones mentioned in PFM tables (Table 3). According to customs declarations, tobacco products are identified with HS 24, and more specifically cigarettes with HS 24.02.20 and water-pipe tobacco with HS 24.03.11. The Harmonized System (HS) is the nomenclature adopted by the Customs Administration to classify goods into their respective category.
Finally, receipts from fiscal stamp fees decreased by 2 percent (LL 11 billion) year-on-year to LL 483 billion in 2015. Receipts from this tax are indicative of the general state of economic activity as they reflect the volume and value of transactions taking place during a given period. Formal sales agreements, contracts, and procedures with municipalities and public administrations are all subject to the stamp fee.
Public Finance Annual Review 2015
2015 Ministry of Finance 14 www.finance.gov.lb
NON-TAX REVENUES
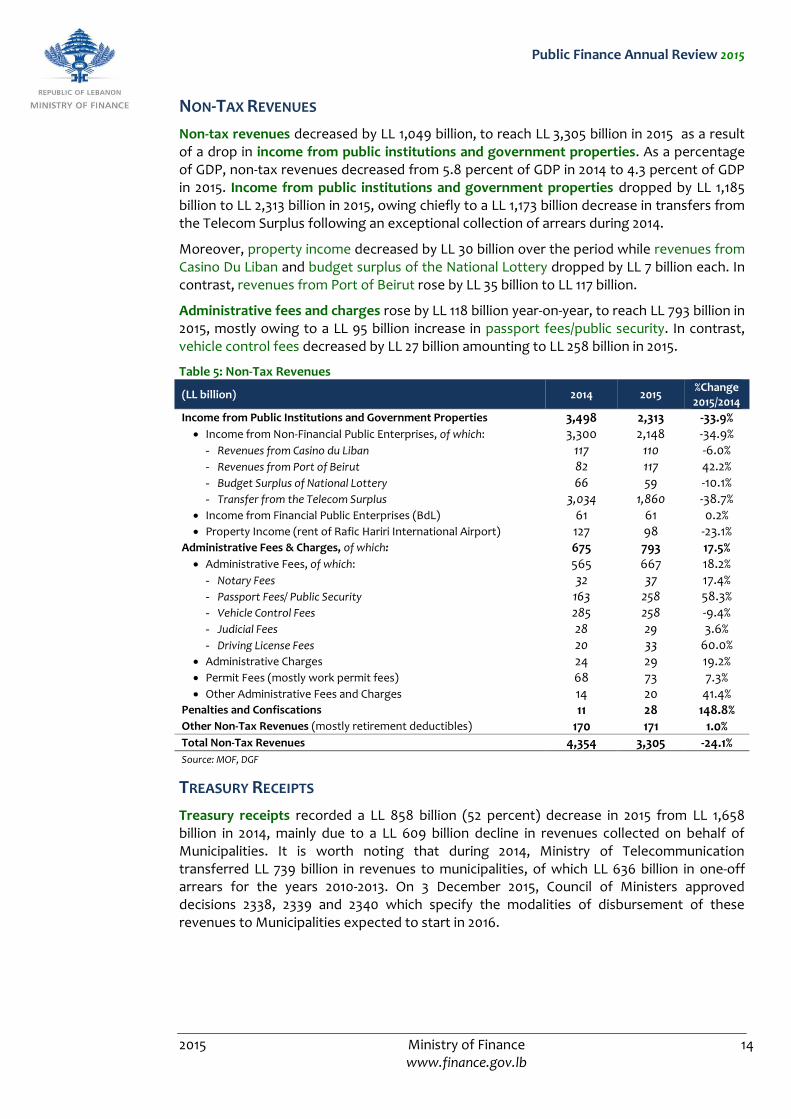
Non-tax revenues decreased by LL 1,049 billion, to reach LL 3,305 billion in 2015 as a result of a drop in income from public institutions and government properties. As a percentage of GDP, non-tax revenues decreased from 5.8 percent of GDP in 2014 to 4.3 percent of GDP in 2015. Income from public institutions and government properties dropped by LL 1,185 billion to LL 2,313 billion in 2015, owing chiefly to a LL 1,173 billion decrease in transfers from the Telecom Surplus following an exceptional collection of arrears during 2014.
Moreover, property income decreased by LL 30 billion over the period while revenues from Casino Du Liban and budget surplus of the National Lottery dropped by LL 7 billion each. In contrast, revenues from Port of Beirut rose by LL 35 billion to LL 117 billion.
Administrative fees and charges rose by LL 118 billion year-on-year, to reach LL 793 billion in 2015, mostly owing to a LL 95 billion increase in passport fees/public security. In contrast, vehicle control fees decreased by LL 27 billion amounting to LL 258 billion in 2015.
Table 5: Non-Tax Revenues
(LL billion) 2014 2015 %Change 2015/2014
Income from Public Institutions and Government Properties 3,498 2,313 -33.9% Income from Non-Financial Public Enterprises, of which: 3,300 2,148 -34.9% - Revenues from Casino du Liban 117 110 -6.0% - Revenues from Port of Beirut 82 117 42.2% - Budget Surplus of National Lottery 66 59 -10.1% - Transfer from the Telecom Surplus 3,034 1,860 -38.7%
Income from Financial Public Enterprises (BdL) 61 61 0.2% Property Income (rent of Rafic Hariri International Airport) 127 98 -23.1%
Administrative Fees & Charges, of which: 675 793 17.5% Administrative Fees, of which: 565 667 18.2% - Notary Fees 32 37 17.4% - Passport Fees/ Public Security 163 258 58.3% - Vehicle Control Fees 285 258 -9.4% - Judicial Fees 28 29 3.6% - Driving License Fees 20 33 60.0%
Administrative Charges 24 29 19.2% Permit Fees (mostly work permit fees) 68 73 7.3% Other Administrative Fees and Charges 14 20 41.4%
Penalties and Confiscations 11 28 148.8% Other Non-Tax Revenues (mostly retirement deductibles) 170 171 1.0% Total Non-Tax Revenues 4,354 3,305 -24.1% Source: MOF, DGF
TREASURY RECEIPTS
Treasury receipts recorded a LL 858 billion (52 percent) decrease in 2015 from LL 1,658 billion in 2014, mainly due to a LL 609 billion decline in revenues collected on behalf of Municipalities. It is worth noting that during 2014, Ministry of Telecommunication transferred LL 739 billion in revenues to municipalities, of which LL 636 billion in one-off arrears for the years 2010-2013. On 3 December 2015, Council of Ministers approved decisions 2338, 2339 and 2340 which specify the modalities of disbursement of these revenues to Municipalities expected to start in 2016.
Public Finance Annual Review 2015
2015 Ministry of Finance 15 www.finance.gov.lb
SECTION III: EXPENDITURE OUTCOME
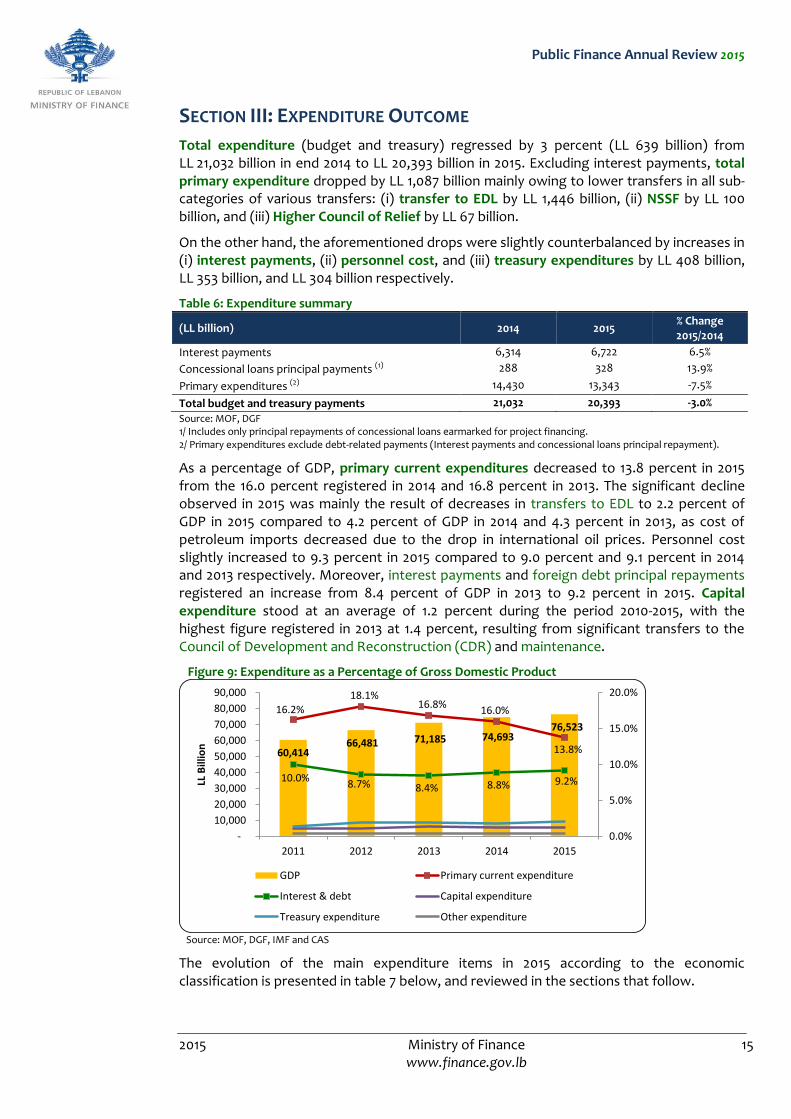
Total expenditure (budget and treasury) regressed by 3 percent (LL 639 billion) from LL 21,032 billion in end 2014 to LL 20,393 billion in 2015. Excluding interest payments, total primary expenditure dropped by LL 1,087 billion mainly owing to lower transfers in all sub-categories of various transfers: (i) transfer to EDL by LL 1,446 billion, (ii) NSSF by LL 100 billion, and (iii) Higher Council of Relief by LL 67 billion.
On the other hand, the aforementioned drops were slightly counterbalanced by increases in (i) interest payments, (ii) personnel cost, and (iii) treasury expenditures by LL 408 billion, LL 353 billion, and LL 304 billion respectively.
Table 6: Expenditure summary
(LL billion) 2014 2015 % Change 2015/2014
Interest payments 6,314 6,722 6.5%
Concessional loans principal payments (1) 288 328 13.9%
Primary expenditures (2) 14,430 13,343 -7.5%
Total budget and treasury payments 21,032 20,393 -3.0%
Source: MOF, DGF 1/ Includes only principal repayments of concessional loans earmarked for project financing. 2/ Primary expenditures exclude debt-related payments (Interest payments and concessional loans principal repayment).
As a percentage of GDP, primary current expenditures decreased to 13.8 percent in 2015 from the 16.0 percent registered in 2014 and 16.8 percent in 2013. The significant decline observed in 2015 was mainly the result of decreases in transfers to EDL to 2.2 percent of GDP in 2015 compared to 4.2 percent of GDP in 2014 and 4.3 percent in 2013, as cost of petroleum imports decreased due to the drop in international oil prices. Personnel cost slightly increased to 9.3 percent in 2015 compared to 9.0 percent and 9.1 percent in 2014 and 2013 respectively. Moreover, interest payments and foreign debt principal repayments registered an increase from 8.4 percent of GDP in 2013 to 9.2 percent in 2015. Capital expenditure stood at an average of 1.2 percent during the period 2010-2015, with the highest figure registered in 2013 at 1.4 percent, resulting from significant transfers to the Council of Development and Reconstruction (CDR) and maintenance.
Figure 9: Expenditure as a Percentage of Gross Domestic Product
60,414 66,481 71,185 74,693
76,523
16.2%18.1%
16.8%16.0%
13.8%
10.0%8.7% 8.4% 8.8% 9.2%
0.0%
5.0%
10.0%
15.0%
20.0%
-
10,000
20,000
30,000
40,000
50,000
60,000
70,000
80,000
90,000
2011 2012 2013 2014 2015
LL B
illio
n
GDP Primary current expenditure
Interest & debt Capital expenditure
Treasury expenditure Other expenditure
Source: MOF, DGF, IMF and CAS
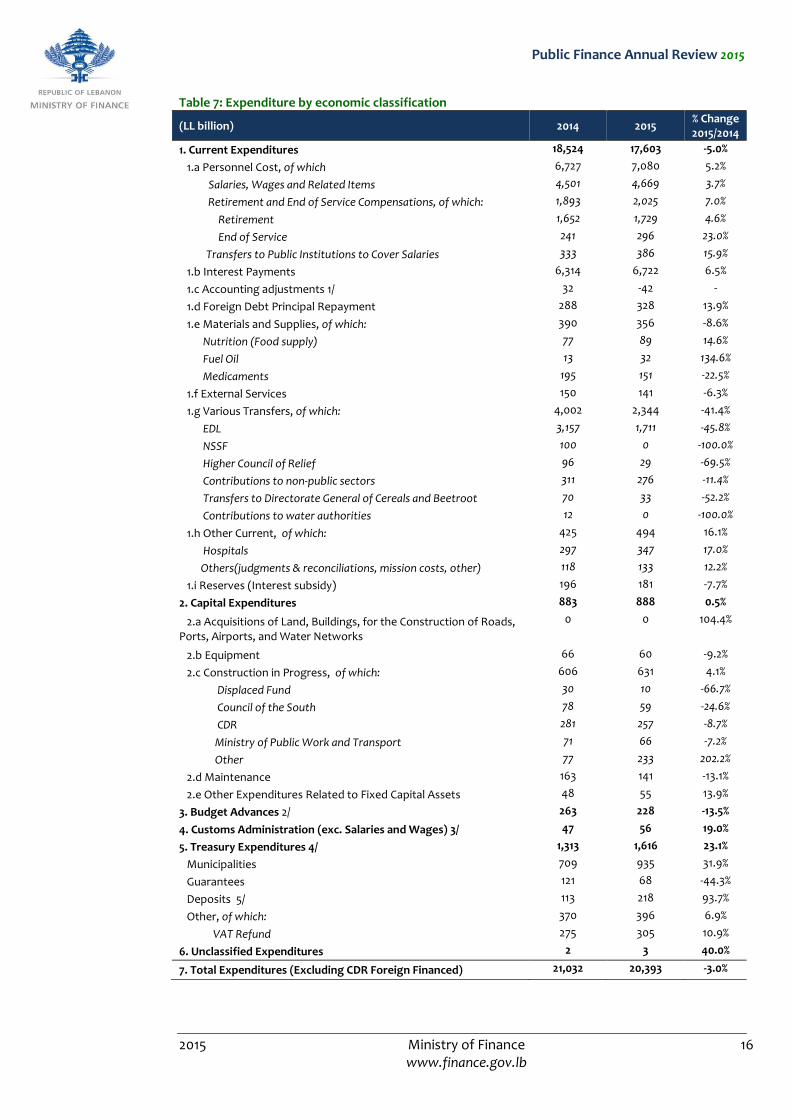
The evolution of the main expenditure items in 2015 according to the economic classification is presented in table 7 below, and reviewed in the sections that follow.
Public Finance Annual Review 2015
2015 Ministry of Finance 16 www.finance.gov.lb
Table 7: Expenditure by economic classification
(LL billion) 2014 2015 % Change 2015/2014
1. Current Expenditures 18,524 17,603 -5.0%
1.a Personnel Cost, of which 6,727 7,080 5.2%
Salaries, Wages and Related Items 4,501 4,669 3.7%
Retirement and End of Service Compensations, of which: 1,893 2,025 7.0%
Retirement 1,652 1,729 4.6%
End of Service 241 296 23.0%
Transfers to Public Institutions to Cover Salaries 333 386 15.9%
1.b Interest Payments 6,314 6,722 6.5%
1.c Accounting adjustments 1/ 32 -42 -
1.d Foreign Debt Principal Repayment 288 328 13.9%
1.e Materials and Supplies, of which: 390 356 -8.6%
Nutrition (Food supply) 77 89 14.6%
Fuel Oil 13 32 134.6%
Medicaments 195 151 -22.5%
1.f External Services 150 141 -6.3%
1.g Various Transfers, of which: 4,002 2,344 -41.4%
EDL 3,157 1,711 -45.8%
NSSF 100 0 -100.0%
Higher Council of Relief 96 29 -69.5%
Contributions to non-public sectors 311 276 -11.4%
Transfers to Directorate General of Cereals and Beetroot 70 33 -52.2%
Contributions to water authorities 12 0 -100.0%
1.h Other Current, of which: 425 494 16.1%
Hospitals 297 347 17.0%
Others(judgments & reconciliations, mission costs, other) 118 133 12.2%
1.i Reserves (Interest subsidy) 196 181 -7.7%
2. Capital Expenditures 883 888 0.5%
2.a Acquisitions of Land, Buildings, for the Construction of Roads, Ports, Airports, and Water Networks
0 0 104.4%
2.b Equipment 66 60 -9.2%
2.c Construction in Progress, of which: 606 631 4.1%
Displaced Fund 30 10 -66.7%
Council of the South 78 59 -24.6%
CDR 281 257 -8.7%
Ministry of Public Work and Transport 71 66 -7.2%
Other 77 233 202.2%
2.d Maintenance 163 141 -13.1%
2.e Other Expenditures Related to Fixed Capital Assets 48 55 13.9%
3. Budget Advances 2/ 263 228 -13.5%
4. Customs Administration (exc. Salaries and Wages) 3/ 47 56 19.0%
5. Treasury Expenditures 4/ 1,313 1,616 23.1%
Municipalities 709 935 31.9%
Guarantees 121 68 -44.3%
Deposits 5/ 113 218 93.7%
Other, of which: 370 396 6.9%
VAT Refund 275 305 10.9%
6. Unclassified Expenditures 2 3 40.0%
7. Total Expenditures (Excluding CDR Foreign Financed) 21,032 20,393 -3.0%
Public Finance Annual Review 2015
2015 Ministry of Finance 17 www.finance.gov.lb
Source: Statement of Account 36, Cashier Spending, Public Debt Department Figures, Fiscal Performance Gross Adjustment Figures (1) The line item presents a difference in interest payments due to the new procedure applied by the accounting department since July 2014 (2) Budget Advances were previously classified under "other". Given their growth, and in line with the Ministry of Finance's efforts to ensure transparency, they are published in a separate line. They will be regularized at a later stage, and it is only after their regularization that they can be classified according to their economic nature in the budget system. (3) “Customs administration” includes payments - excluding salaries and wages - made to customs and paid from customs cashiers. They can only be classified after Customs submit the supporting documents to the Directorate General of Finance. (4) Figures may differ from previously published data because of constant updates and improvements. (5) Deposit payments are deposited by the treasury to public administrations, institutions, municipalities, funds (such as pension fund, mutual fund, and employees’ cooperative), representing revenues collected by them and withdraw later.
CURRENT EXPENDITURE
Current expenditure declined by LL 921 billion (or 5.0 percent) mainly driven by the drop in various transfers by LL 1,658 billion and material and supplies by LL 33 billion, which was partly offset by increases in (i) interest payments by LL 408 billion, (ii) personnel cost by LL 353 billion, and (iii) other current expenditures by LL 68 billion.
CURRENT PRIMARY EXPENDITURE
Current primary expenditure registered a LL 1,369 billion decrease to reach LL 10,553 billion in 2015.
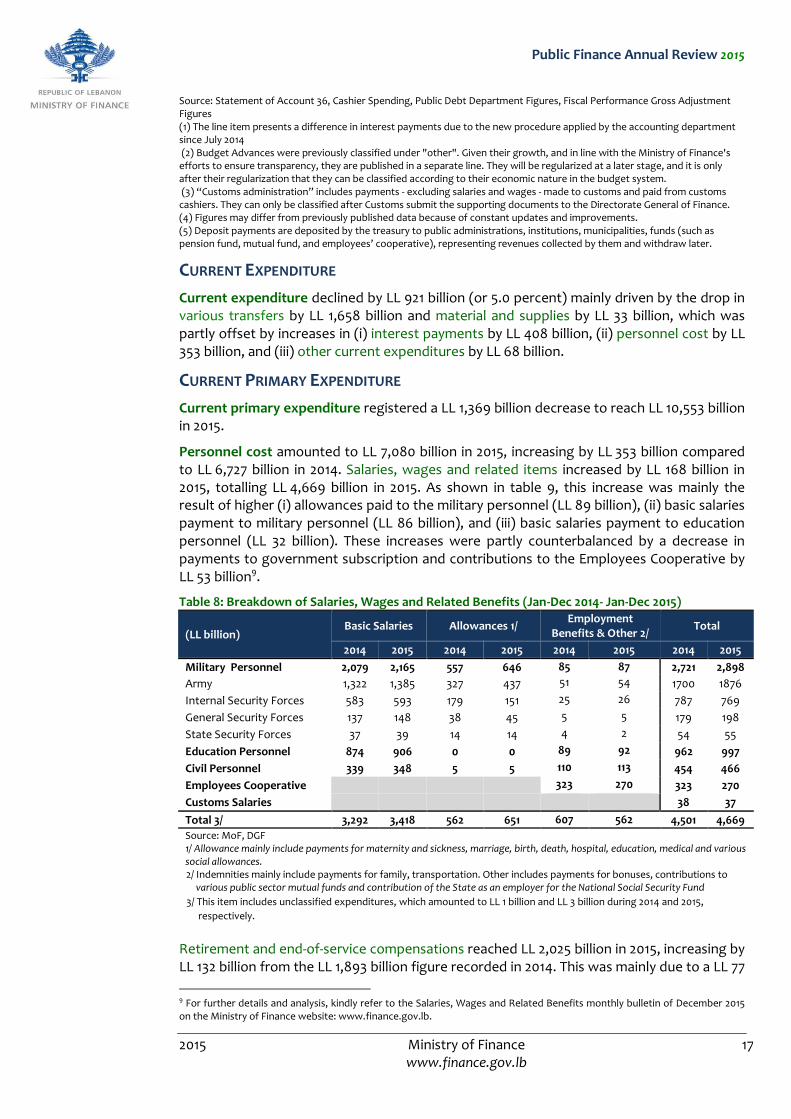
Personnel cost amounted to LL 7,080 billion in 2015, increasing by LL 353 billion compared to LL 6,727 billion in 2014. Salaries, wages and related items increased by LL 168 billion in 2015, totalling LL 4,669 billion in 2015. As shown in table 9, this increase was mainly the result of higher (i) allowances paid to the military personnel (LL 89 billion), (ii) basic salaries payment to military personnel (LL 86 billion), and (iii) basic salaries payment to education personnel (LL 32 billion). These increases were partly counterbalanced by a decrease in payments to government subscription and contributions to the Employees Cooperative by LL 53 billion9.
Table 8: Breakdown of Salaries, Wages and Related Benefits (Jan-Dec 2014- Jan-Dec 2015)
(LL billion) Basic Salaries Allowances 1/
Employment Benefits & Other 2/
Total
2014 2015 2014 2015 2014 2015 2014 2015
Military Personnel 2,079 2,165 557 646 85 87 2,721 2,898
Army 1,322 1,385 327 437 51 54 1700 1876
Internal Security Forces 583 593 179 151 25 26 787 769
General Security Forces 137 148 38 45 5 5 179 198
State Security Forces 37 39 14 14 4 2 54 55
Education Personnel 874 906 0 0 89 92 962 997
Civil Personnel 339 348 5 5 110 113 454 466
Employees Cooperative
323 270 323 270
Customs Salaries
38 37
Total 3/ 3,292 3,418 562 651 607 562 4,501 4,669
Source: MoF, DGF 1/ Allowance mainly include payments for maternity and sickness, marriage, birth, death, hospital, education, medical and various social allowances.
2/ Indemnities mainly include payments for family, transportation. Other includes payments for bonuses, contributions to various public sector mutual funds and contribution of the State as an employer for the National Social Security Fund
3/ This item includes unclassified expenditures, which amounted to LL 1 billion and LL 3 billion during 2014 and 2015,
respectively.
Retirement and end-of-service compensations reached LL 2,025 billion in 2015, increasing by LL 132 billion from the LL 1,893 billion figure recorded in 2014. This was mainly due to a LL 77
9 For further details and analysis, kindly refer to the Salaries, Wages and Related Benefits monthly bulletin of December 2015 on the Ministry of Finance website: www.finance.gov.lb.
Public Finance Annual Review 2015
2015 Ministry of Finance 18 www.finance.gov.lb
billion rise in retirement compensation along with LL 55 billion higher end-of-service indemnities.
In detail, retirement recorded a 4.6 percent rise, owing to a 4 percent higher number of beneficiaries. As for the end-of-service indemnity, the reason behind the 23 percent increase is mainly due to the following:
a) End-of-service compensation to military personnel increased by LL 59 billion and amounted to LL 256 billion (86 percent of total compensation payments) by end 2015, compared to LL 196 billion (81 percent of total compensation payments) in 2014.
b) End‐of‐service compensations to civil personnel decreased by LL 4 billion to reach LL 41 billion in 2015. The 8 percent decline was the result of lower number of retirees.
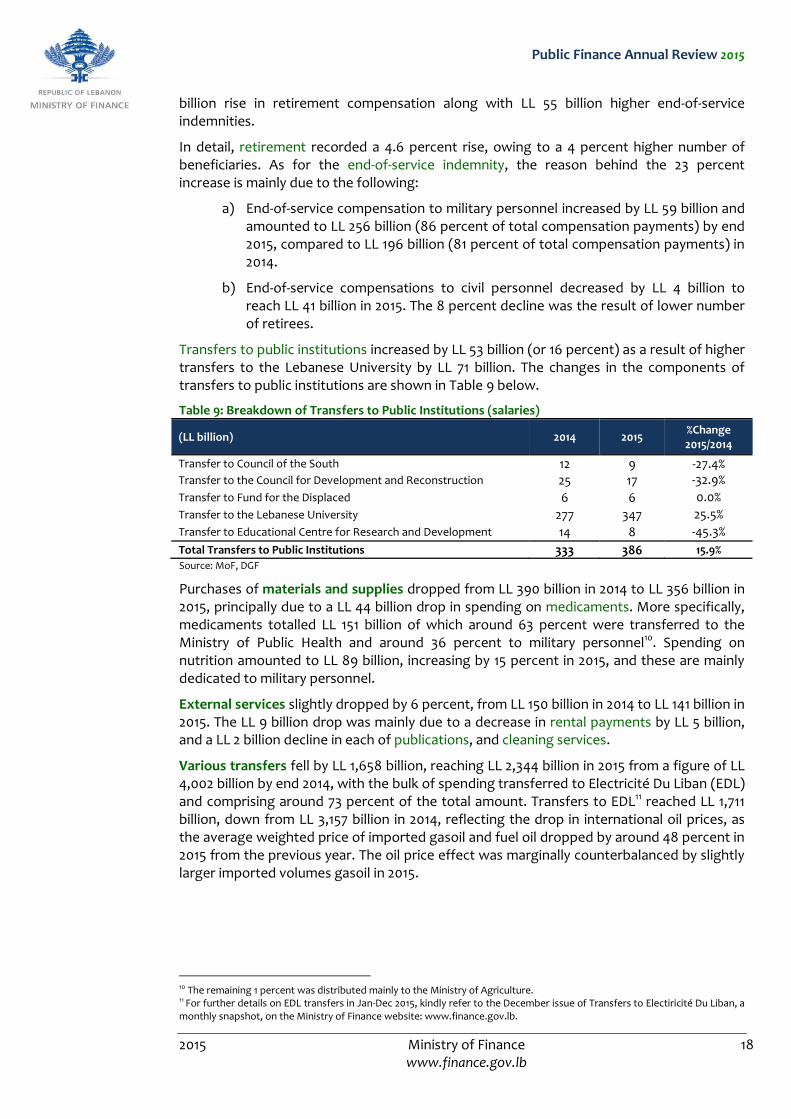
Transfers to public institutions increased by LL 53 billion (or 16 percent) as a result of higher transfers to the Lebanese University by LL 71 billion. The changes in the components of transfers to public institutions are shown in Table 9 below.
Table 9: Breakdown of Transfers to Public Institutions (salaries)
(LL billion) 2014 2015 %Change 2015/2014
Transfer to Council of the South 12 9 -27.4% Transfer to the Council for Development and Reconstruction 25 17 -32.9%
Transfer to Fund for the Displaced 6 6 0.0%
Transfer to the Lebanese University 277 347 25.5%
Transfer to Educational Centre for Research and Development 14 8 -45.3%
Total Transfers to Public Institutions 333 386 15.9%
Source: MoF, DGF
Purchases of materials and supplies dropped from LL 390 billion in 2014 to LL 356 billion in 2015, principally due to a LL 44 billion drop in spending on medicaments. More specifically, medicaments totalled LL 151 billion of which around 63 percent were transferred to the Ministry of Public Health and around 36 percent to military personnel10. Spending on nutrition amounted to LL 89 billion, increasing by 15 percent in 2015, and these are mainly dedicated to military personnel.
External services slightly dropped by 6 percent, from LL 150 billion in 2014 to LL 141 billion in 2015. The LL 9 billion drop was mainly due to a decrease in rental payments by LL 5 billion, and a LL 2 billion decline in each of publications, and cleaning services.
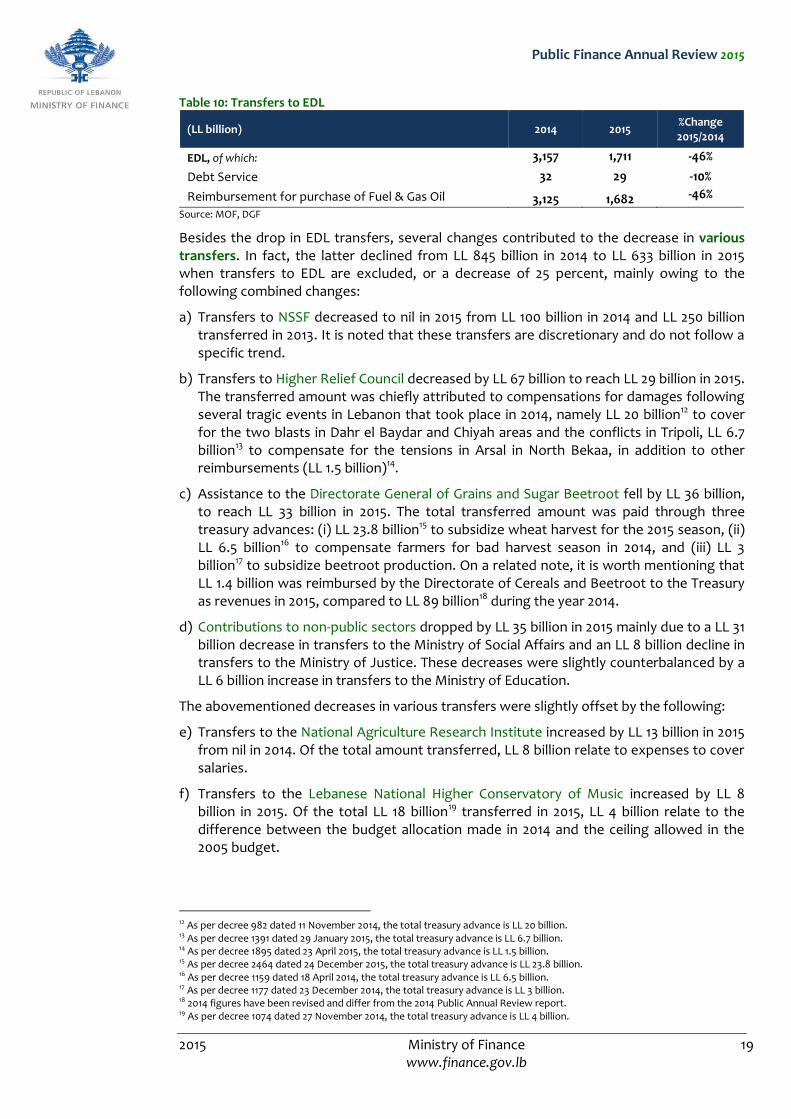
Various transfers fell by LL 1,658 billion, reaching LL 2,344 billion in 2015 from a figure of LL 4,002 billion by end 2014, with the bulk of spending transferred to Electricité Du Liban (EDL) and comprising around 73 percent of the total amount. Transfers to EDL11 reached LL 1,711 billion, down from LL 3,157 billion in 2014, reflecting the drop in international oil prices, as the average weighted price of imported gasoil and fuel oil dropped by around 48 percent in 2015 from the previous year. The oil price effect was marginally counterbalanced by slightly larger imported volumes gasoil in 2015.
10 The remaining 1 percent was distributed mainly to the Ministry of Agriculture. 11 For further details on EDL transfers in Jan-Dec 2015, kindly refer to the December issue of Transfers to Electiricité Du Liban, a monthly snapshot, on the Ministry of Finance website: www.finance.gov.lb.
Public Finance Annual Review 2015
2015 Ministry of Finance 19 www.finance.gov.lb
Table 10: Transfers to EDL
(LL billion) 2014 2015 %Change 2015/2014
EDL, of which: 3,157
1,711
-46% Debt Service 32
29
-10%
Reimbursement for purchase of Fuel & Gas Oil 3,125 1,682 -46% Source: MOF, DGF
Besides the drop in EDL transfers, several changes contributed to the decrease in various transfers. In fact, the latter declined from LL 845 billion in 2014 to LL 633 billion in 2015 when transfers to EDL are excluded, or a decrease of 25 percent, mainly owing to the following combined changes:
a) Transfers to NSSF decreased to nil in 2015 from LL 100 billion in 2014 and LL 250 billion transferred in 2013. It is noted that these transfers are discretionary and do not follow a specific trend.
b) Transfers to Higher Relief Council decreased by LL 67 billion to reach LL 29 billion in 2015. The transferred amount was chiefly attributed to compensations for damages following several tragic events in Lebanon that took place in 2014, namely LL 20 billion12 to cover for the two blasts in Dahr el Baydar and Chiyah areas and the conflicts in Tripoli, LL 6.7 billion13 to compensate for the tensions in Arsal in North Bekaa, in addition to other reimbursements (LL 1.5 billion)14.
c) Assistance to the Directorate General of Grains and Sugar Beetroot fell by LL 36 billion, to reach LL 33 billion in 2015. The total transferred amount was paid through three treasury advances: (i) LL 23.8 billion15 to subsidize wheat harvest for the 2015 season, (ii) LL 6.5 billion16 to compensate farmers for bad harvest season in 2014, and (iii) LL 3 billion17 to subsidize beetroot production. On a related note, it is worth mentioning that LL 1.4 billion was reimbursed by the Directorate of Cereals and Beetroot to the Treasury as revenues in 2015, compared to LL 89 billion18 during the year 2014.
d) Contributions to non-public sectors dropped by LL 35 billion in 2015 mainly due to a LL 31 billion decrease in transfers to the Ministry of Social Affairs and an LL 8 billion decline in transfers to the Ministry of Justice. These decreases were slightly counterbalanced by a LL 6 billion increase in transfers to the Ministry of Education.
The abovementioned decreases in various transfers were slightly offset by the following:
e) Transfers to the National Agriculture Research Institute increased by LL 13 billion in 2015 from nil in 2014. Of the total amount transferred, LL 8 billion relate to expenses to cover salaries.
f) Transfers to the Lebanese National Higher Conservatory of Music increased by LL 8 billion in 2015. Of the total LL 18 billion19 transferred in 2015, LL 4 billion relate to the difference between the budget allocation made in 2014 and the ceiling allowed in the 2005 budget.
12 As per decree 982 dated 11 November 2014, the total treasury advance is LL 20 billion. 13 As per decree 1391 dated 29 January 2015, the total treasury advance is LL 6.7 billion. 14 As per decree 1895 dated 23 April 2015, the total treasury advance is LL 1.5 billion. 15 As per decree 2464 dated 24 December 2015, the total treasury advance is LL 23.8 billion. 16 As per decree 1159 dated 18 April 2014, the total treasury advance is LL 6.5 billion. 17 As per decree 1177 dated 23 December 2014, the total treasury advance is LL 3 billion. 18 2014 figures have been revised and differ from the 2014 Public Annual Review report. 19 As per decree 1074 dated 27 November 2014, the total treasury advance is LL 4 billion.
Public Finance Annual Review 2015
2015 Ministry of Finance 20 www.finance.gov.lb
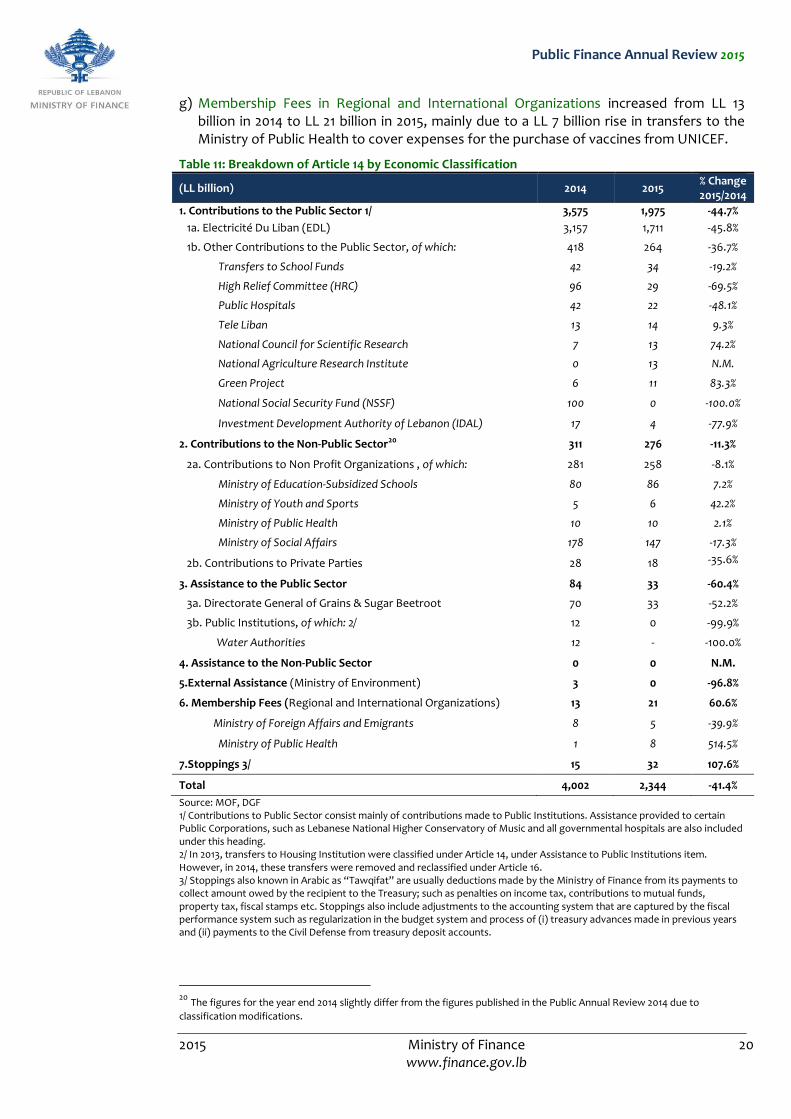
g) Membership Fees in Regional and International Organizations increased from LL 13 billion in 2014 to LL 21 billion in 2015, mainly due to a LL 7 billion rise in transfers to the Ministry of Public Health to cover expenses for the purchase of vaccines from UNICEF.
Table 11: Breakdown of Article 14 by Economic Classification
(LL billion) 2014 2015 % Change 2015/2014
1. Contributions to the Public Sector 1/ 3,575 1,975 -44.7%
1a. Electricité Du Liban (EDL) 3,157 1,711 -45.8%
1b. Other Contributions to the Public Sector, of which: 418 264 -36.7%
Transfers to School Funds 42 34 -19.2%
High Relief Committee (HRC) 96 29 -69.5%
Public Hospitals 42 22 -48.1%
Tele Liban 13 14 9.3%
National Council for Scientific Research 7 13 74.2%
National Agriculture Research Institute 0 13 N.M.
Green Project 6 11 83.3%
National Social Security Fund (NSSF) 100 0 -100.0%
Investment Development Authority of Lebanon (IDAL) 17 4 -77.9%
2. Contributions to the Non-Public Sector20 311 276 -11.3%
2a. Contributions to Non Profit Organizations , of which: 281 258 -8.1%
Ministry of Education-Subsidized Schools 80 86 7.2%
Ministry of Youth and Sports 5 6 42.2%
Ministry of Public Health 10 10 2.1%
Ministry of Social Affairs 178 147 -17.3%
2b. Contributions to Private Parties 28 18 -35.6%
3. Assistance to the Public Sector 84 33 -60.4%
3a. Directorate General of Grains & Sugar Beetroot 70 33 -52.2%
3b. Public Institutions, of which: 2/ 12 0 -99.9%
Water Authorities 12 - -100.0%
4. Assistance to the Non-Public Sector 0 0 N.M.
5.External Assistance (Ministry of Environment) 3 0 -96.8%
6. Membership Fees (Regional and International Organizations) 13 21 60.6%
Ministry of Foreign Affairs and Emigrants 8 5 -39.9%
Ministry of Public Health 1 8 514.5%
7.Stoppings 3/ 15 32 107.6%
Total 4,002 2,344 -41.4%
Source: MOF, DGF 1/ Contributions to Public Sector consist mainly of contributions made to Public Institutions. Assistance provided to certain Public Corporations, such as Lebanese National Higher Conservatory of Music and all governmental hospitals are also included under this heading. 2/ In 2013, transfers to Housing Institution were classified under Article 14, under Assistance to Public Institutions item. However, in 2014, these transfers were removed and reclassified under Article 16. 3/ Stoppings also known in Arabic as “Tawqifat” are usually deductions made by the Ministry of Finance from its payments to collect amount owed by the recipient to the Treasury; such as penalties on income tax, contributions to mutual funds, property tax, fiscal stamps etc. Stoppings also include adjustments to the accounting system that are captured by the fiscal performance system such as regularization in the budget system and process of (i) treasury advances made in previous years and (ii) payments to the Civil Defense from treasury deposit accounts.
20 The figures for the year end 2014 slightly differ from the figures published in the Public Annual Review 2014 due to
classification modifications.
Public Finance Annual Review 2015
2015 Ministry of Finance 21 www.finance.gov.lb
Other current expenditures increased by LL 69 billion in 2015, from a figure of LL 425 billion in 2014 to LL 493 billion. Transfers to hospitals rose by LL 50 billion mainly caused by a difference in the timing of payments whereby around 60 percent of the total amount paid in 2015 relate to the 2014 budget. “Other spending” increased by LL 14 billion in 2015 mainly as a result of a rise in payments for judgments and reconciliations by LL 16 billion, slightly counterbalanced by a drop in secret expenditure. Transfers to the Housing Institutions, classified under “other spending”21, amounted to LL 40 billion in 2015 compared to LL 35 billion in 2014, noting that these transfers represent interest payments of subsidized loans provided by banks, as per the contract between Banque du Liban and the Housing Institution.
INTEREST PAYMENTS
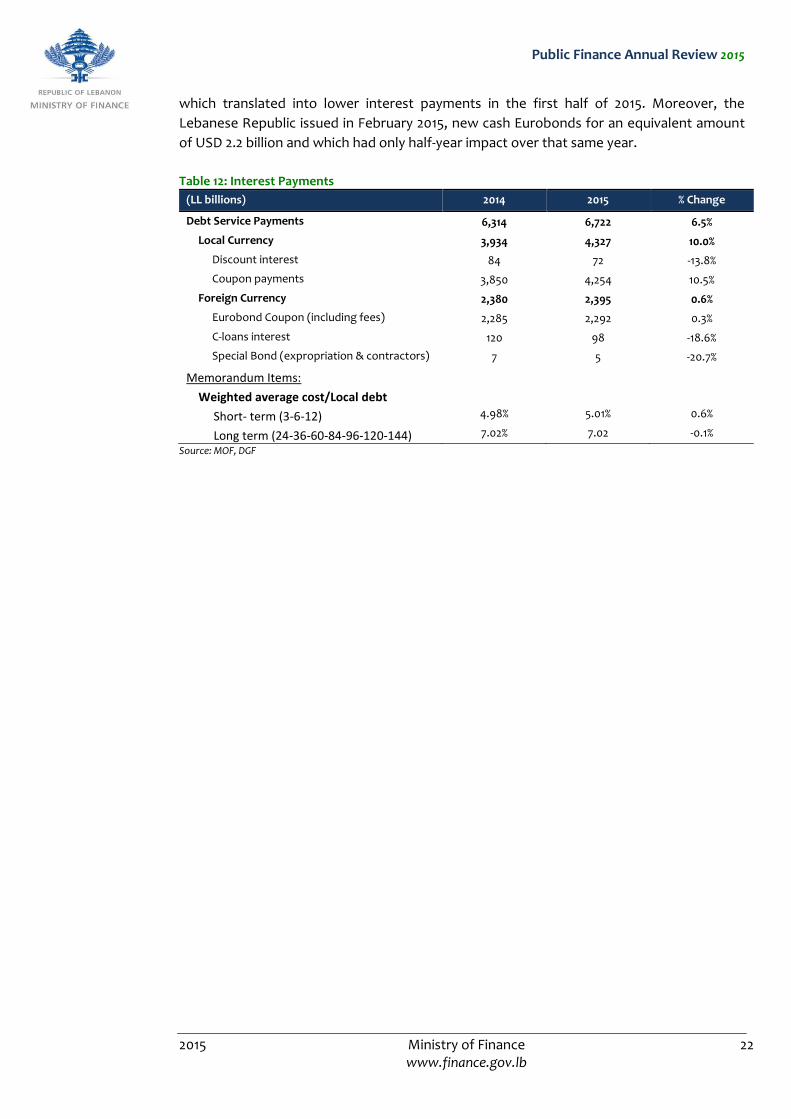
Debt Service payments rose by LL 408 billion to reach LL 6,722 billion during 2015, mainly on
account of a LL 393 billion increase in local currency interest payments. It is worth noting
that foreign currency interest payments remained broadly stable over the same period.
Interest payments on local currency debt rose by 10 percent to LL 4,327 billion in 2015,
reflecting an almost identical increase in coupon payments on long-term Treasury bonds
(with a maturity of more than one year) owing in turn to an expansion in the number of
outstanding bonds on which coupon was due. In parallel, the stock of long-term domestic
debt increased by 8.5 percent in June 2015, compared to June 2013, on account of a higher
stock of 2YR, 7YR and 10YR instruments, which rose by LL 965 billion, LL 1,067 billion and LL
2,806 billion respectively. These increases translated solely into higher interest payments
during 2015, given that coupon payments are disbursed six months following the issuance
of a Bond.
It is worth mentioning that the average interest rate on long-term tenors remained
unchanged during 2015, standing at 7.02 percent. On the one hand, average interest rates
on 2YR and 3YR instruments rose slightly by 8 bps and 12 bps respectively, partly resulting
from the 52 basis points increase in interest rates on instruments with maturity 5-years or
less, during March 2012. On the other hand, the average interest rate on 5YR instruments
dropped by 28 bps since some of these instruments that were issued in 2009 at relatively
high interest rates (varying between 7.74 percent and 9.00 percent) matured in 2014.
Moreover, the average interest rate on 10 YR instruments retreated by 13 bps, following a
52 bps reduction on such instrument in March 2016.
In contrast, discount interest payments (interest paid at maturity of 3, 6 and 12 months T-
bills) dropped by 14 percent to LL 72 billion in 2015, compared to LL 84 billion in 2014.
Interest payments on foreign currency debt amounted to LL 2,395 billion in 2015, recording
a 0.6 percent increase compared to 2014.
Eurobond coupons, the biggest sub-component, inched-up by 0.3 percent over the period
despite a 4.1 increase in the stock of market-issued Eurobonds from LL 35,291 billion as at
end-June 2014 to LL 36,744 billion as at end-June 2015, along a 10 basis points rise in the
weighted average cost of Eurobonds to 6.48 percent by end-June 2015, compared to 6.38
percent end-June 2014. This contrasted performance could rather be attributed to the fact
that the stock of Eurobonds was down by 1.2 percent over the June to December 2014,
21 In 2013, transfers to the Housing Institutions were classified under Various Transfers. In 2014, these transfers were
reclassified under Other Current Expenditure.
Public Finance Annual Review 2015
2015 Ministry of Finance 22 www.finance.gov.lb
which translated into lower interest payments in the first half of 2015. Moreover, the
Lebanese Republic issued in February 2015, new cash Eurobonds for an equivalent amount
of USD 2.2 billion and which had only half-year impact over that same year.
Table 12: Interest Payments
(LL billions) 2014 2015 % Change
Debt Service Payments 6,314 6,722 6.5%
Local Currency 3,934 4,327 10.0%
Discount interest 84 72 -13.8%
Coupon payments 3,850 4,254 10.5%
Foreign Currency 2,380 2,395 0.6%
Eurobond Coupon (including fees) 2,285 2,292 0.3%
C-loans interest 120 98 -18.6%
Special Bond (expropriation & contractors) 7 5 -20.7%
Memorandum Items:
Weighted average cost/Local debt
Short- term (3-6-12) 4.98% 5.01% 0.6%
Long term (24-36-60-84-96-120-144) 7.02% 7.02 -0.1%
Source: MOF, DGF
Public Finance Annual Review 2015
2015 Ministry of Finance 23 www.finance.gov.lb
CAPITAL EXPENDITURE
Capital expenditures increased by LL 5 billion, from LL 883 billion in 2014 to LL 888 billion in 2015, mainly as a result of a LL 25 billion increase in construction in progress and a LL 7 billion rise in other expenditures related to fixed capital assets. These increases were counterbalanced by a LL 21 billion decrease in maintenance and a LL 6 billion decline in equipment. Generally, the government has been under-spending on capital expenditures relatively to the budgeted figures and the increasing need of infrastructure projects.
Construction in progress reached LL 631 billion in 2015, rising by 4 percent mainly due to a LL 156 billion increase in other construction in progress sub-category. The latter totaled LL 233 billion by end 2015 and increased from a figure of LL 77 billion in 2014 chiefly as a result of the following:
a) LL 96 billion rise in payments made to the Ministry of Energy, totaling LL 141 billion of which (i) LL 51 billion relate to spending on electricity equipment and stations, and installation services in different Lebanese areas; (ii) LL 30 billion were allocated to the dam construction project in Bekaata region; (iii) LL 17 billion were disbursed to the dam construction project and other water projects in the Batroun Disctrict; and (iv) LL 15 billion pertain to water projects in North Lebanon.
b) LL 51 billion increase in payments to HRC, reaching LL 61 billion of which LL 50 billion relate to the execution of development, infrastructure, and public services projects in Akkar District22.
c) LL 12 billion higher payments to the Ministry of Interior mainly due to an increase in payments pertaining to the development of an indoor and an outdoor shooting field.
d) LL 3 billion decrease in payments to the Ministry of Agriculture and the Ministry of Youth and Sports, slightly counterbalancing the abovementioned increases.
Payments to other sub-categories under construction in progress decreased as per the following: (i) CDR by LL 24 billion, (ii) Displaced Fund by LL 20 billion, (iii) Council of the South by LL 19 billion, and (iv) Ministry of Public Work and Transportation by LL 4 billion.
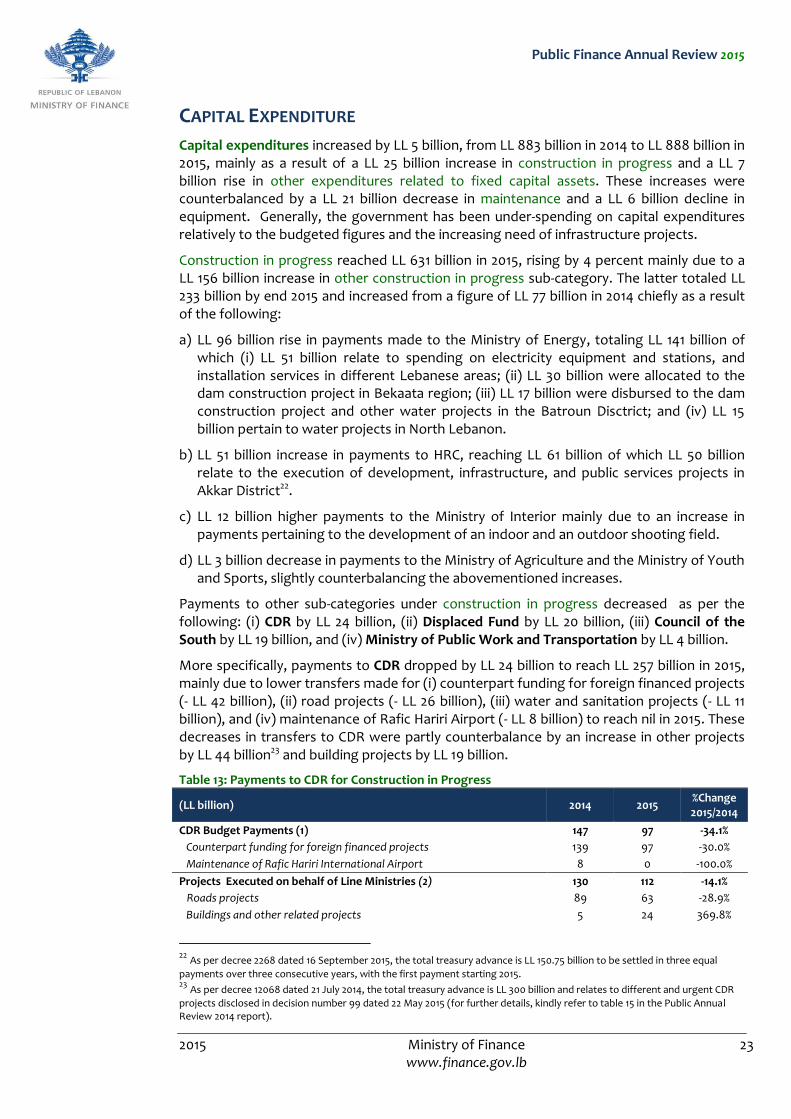
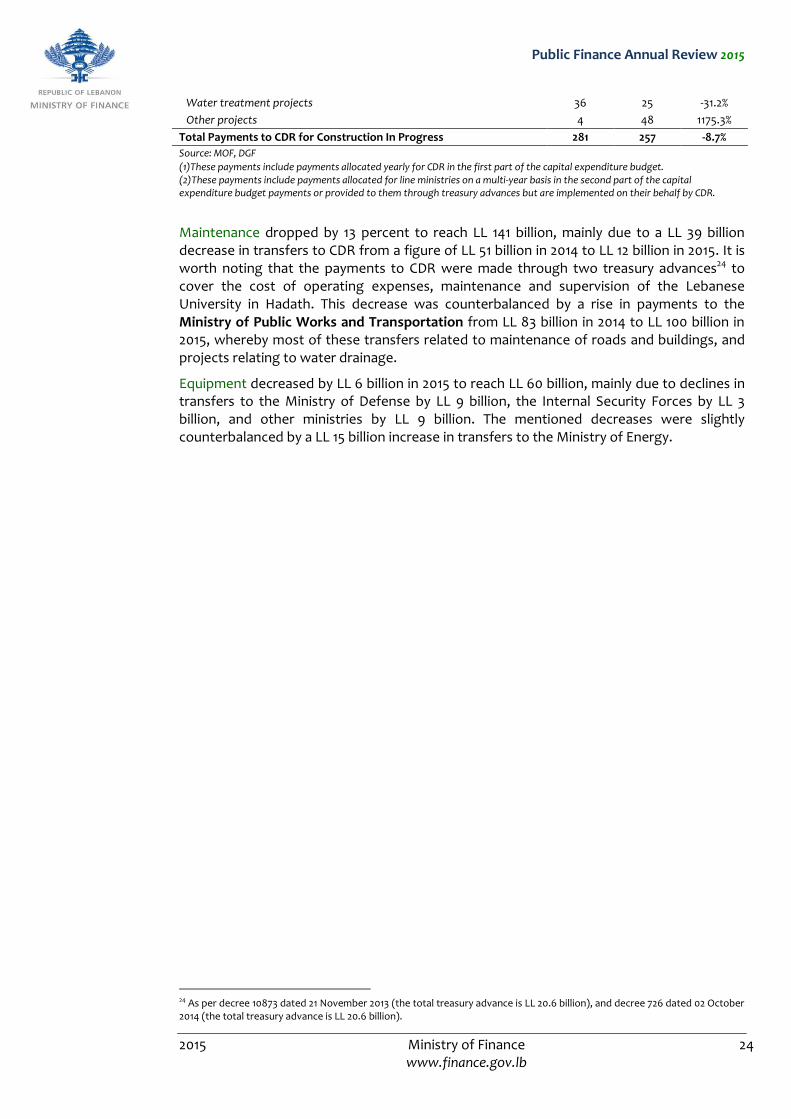
More specifically, payments to CDR dropped by LL 24 billion to reach LL 257 billion in 2015, mainly due to lower transfers made for (i) counterpart funding for foreign financed projects (- LL 42 billion), (ii) road projects (- LL 26 billion), (iii) water and sanitation projects (- LL 11 billion), and (iv) maintenance of Rafic Hariri Airport (- LL 8 billion) to reach nil in 2015. These decreases in transfers to CDR were partly counterbalance by an increase in other projects by LL 44 billion23 and building projects by LL 19 billion.
Table 13: Payments to CDR for Construction in Progress
(LL billion) 2014 2015 %Change 2015/2014
CDR Budget Payments (1) 147 97 -34.1%
Counterpart funding for foreign financed projects 139 97 -30.0%
Maintenance of Rafic Hariri International Airport 8 0 -100.0%
Projects Executed on behalf of Line Ministries (2) 130 112 -14.1%
Roads projects 89 63 -28.9%
Buildings and other related projects 5 24 369.8%
22 As per decree 2268 dated 16 September 2015, the total treasury advance is LL 150.75 billion to be settled in three equal
payments over three consecutive years, with the first payment starting 2015. 23 As per decree 12068 dated 21 July 2014, the total treasury advance is LL 300 billion and relates to different and urgent CDR
projects disclosed in decision number 99 dated 22 May 2015 (for further details, kindly refer to table 15 in the Public Annual Review 2014 report).
Public Finance Annual Review 2015
2015 Ministry of Finance 24 www.finance.gov.lb
Water treatment projects 36 25 -31.2%
Other projects 4 48 1175.3%
Total Payments to CDR for Construction In Progress 281 257 -8.7%
Source: MOF, DGF (1)These payments include payments allocated yearly for CDR in the first part of the capital expenditure budget. (2)These payments include payments allocated for line ministries on a multi-year basis in the second part of the capital expenditure budget payments or provided to them through treasury advances but are implemented on their behalf by CDR.
Maintenance dropped by 13 percent to reach LL 141 billion, mainly due to a LL 39 billion decrease in transfers to CDR from a figure of LL 51 billion in 2014 to LL 12 billion in 2015. It is worth noting that the payments to CDR were made through two treasury advances24 to cover the cost of operating expenses, maintenance and supervision of the Lebanese University in Hadath. This decrease was counterbalanced by a rise in payments to the Ministry of Public Works and Transportation from LL 83 billion in 2014 to LL 100 billion in 2015, whereby most of these transfers related to maintenance of roads and buildings, and projects relating to water drainage.
Equipment decreased by LL 6 billion in 2015 to reach LL 60 billion, mainly due to declines in transfers to the Ministry of Defense by LL 9 billion, the Internal Security Forces by LL 3 billion, and other ministries by LL 9 billion. The mentioned decreases were slightly counterbalanced by a LL 15 billion increase in transfers to the Ministry of Energy.
24 As per decree 10873 dated 21 November 2013 (the total treasury advance is LL 20.6 billion), and decree 726 dated 02 October 2014 (the total treasury advance is LL 20.6 billion).
Public Finance Annual Review 2015
2015 Ministry of Finance 25 www.finance.gov.lb
TREASURY EXPENDITURE
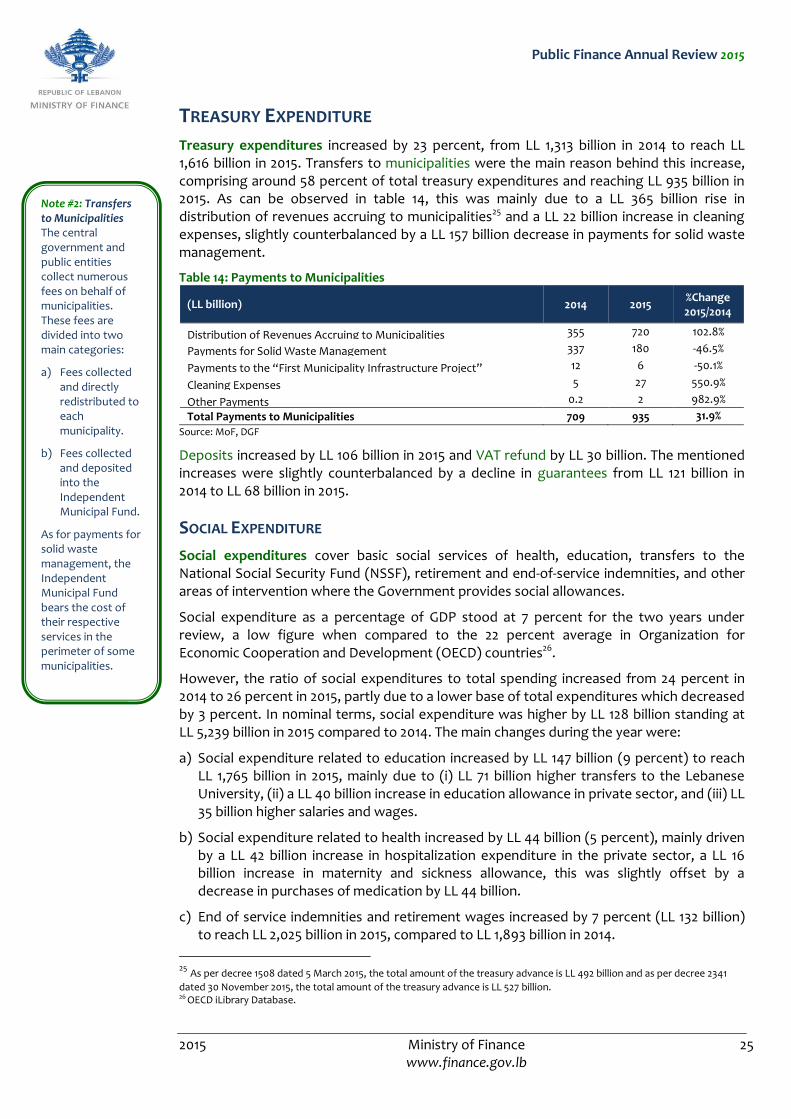
Treasury expenditures increased by 23 percent, from LL 1,313 billion in 2014 to reach LL 1,616 billion in 2015. Transfers to municipalities were the main reason behind this increase, comprising around 58 percent of total treasury expenditures and reaching LL 935 billion in 2015. As can be observed in table 14, this was mainly due to a LL 365 billion rise in distribution of revenues accruing to municipalities25 and a LL 22 billion increase in cleaning expenses, slightly counterbalanced by a LL 157 billion decrease in payments for solid waste management.
Table 14: Payments to Municipalities
(LL billion) 2014 2015 %Change 2015/2014
Distribution of Revenues Accruing to Municipalities 355 720 102.8%
Payments for Solid Waste Management 337 180 -46.5%
Payments to the “First Municipality Infrastructure Project” 12 6 -50.1%
Cleaning Expenses 5 27 550.9%
Other Payments 0.2 2 982.9%
Total Payments to Municipalities 709 935 31.9% .9 Source: MoF, DGF
Deposits increased by LL 106 billion in 2015 and VAT refund by LL 30 billion. The mentioned increases were slightly counterbalanced by a decline in guarantees from LL 121 billion in 2014 to LL 68 billion in 2015.
SOCIAL EXPENDITURE
Social expenditures cover basic social services of health, education, transfers to the National Social Security Fund (NSSF), retirement and end-of-service indemnities, and other areas of intervention where the Government provides social allowances.
Social expenditure as a percentage of GDP stood at 7 percent for the two years under review, a low figure when compared to the 22 percent average in Organization for Economic Cooperation and Development (OECD) countries26.
However, the ratio of social expenditures to total spending increased from 24 percent in 2014 to 26 percent in 2015, partly due to a lower base of total expenditures which decreased by 3 percent. In n0minal terms, social expenditure was higher by LL 128 billion standing at LL 5,239 billion in 2015 compared to 2014. The main changes during the year were:
a) Social expenditure related to education increased by LL 147 billion (9 percent) to reach LL 1,765 billion in 2015, mainly due to (i) LL 71 billion higher transfers to the Lebanese University, (ii) a LL 40 billion increase in education allowance in private sector, and (iii) LL 35 billion higher salaries and wages.
b) Social expenditure related to health increased by LL 44 billion (5 percent), mainly driven by a LL 42 billion increase in hospitalization expenditure in the private sector, a LL 16 billion increase in maternity and sickness allowance, this was slightly offset by a decrease in purchases of medication by LL 44 billion.
c) End of service indemnities and retirement wages increased by 7 percent (LL 132 billion) to reach LL 2,025 billion in 2015, compared to LL 1,893 billion in 2014.
25 As per decree 1508 dated 5 March 2015, the total amount of the treasury advance is LL 492 billion and as per decree 2341
dated 30 November 2015, the total amount of the treasury advance is LL 527 billion. 26 OECD iLibrary Database.
Note #2: Transfers to Municipalities The central government and public entities collect numerous fees on behalf of municipalities. These fees are divided into two main categories:
a) Fees collected and directly redistributed to each municipality.
b) Fees collected and deposited into the Independent Municipal Fund.
As for payments for solid waste management, the Independent Municipal Fund bears the cost of their respective services in the perimeter of some municipalities.
Public Finance Annual Review 2015
2015 Ministry of Finance 26 www.finance.gov.lb
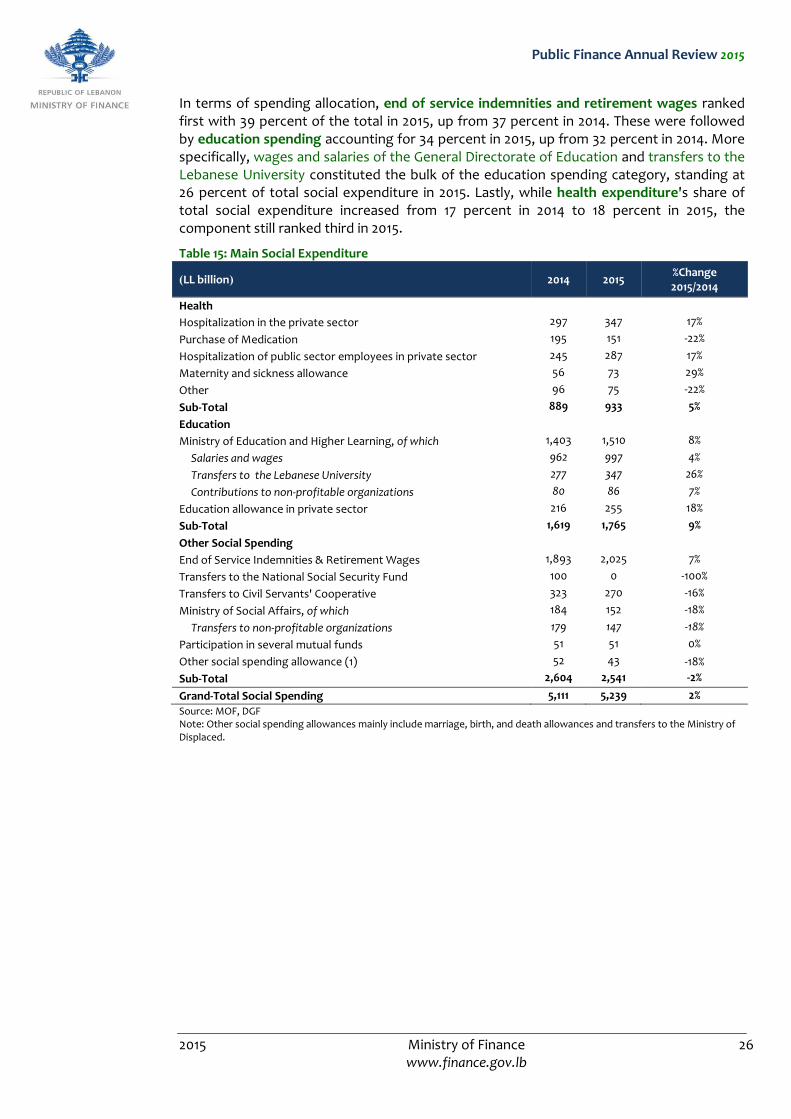
In terms of spending allocation, end of service indemnities and retirement wages ranked first with 39 percent of the total in 2015, up from 37 percent in 2014. These were followed by education spending accounting for 34 percent in 2015, up from 32 percent in 2014. More specifically, wages and salaries of the General Directorate of Education and transfers to the Lebanese University constituted the bulk of the education spending category, standing at 26 percent of total social expenditure in 2015. Lastly, while health expenditure's share of total social expenditure increased from 17 percent in 2014 to 18 percent in 2015, the component still ranked third in 2015.
Table 15: Main Social Expenditure
(LL billion) 2014 2015 %Change 2015/2014
Health
Hospitalization in the private sector 297 347 17%
Purchase of Medication 195 151 -22%
Hospitalization of public sector employees in private sector 245 287 17%
Maternity and sickness allowance 56 73 29%
Other 96 75 -22%
Sub-Total 889 933 5%
Education
Ministry of Education and Higher Learning, of which 1,403 1,510 8%
Salaries and wages 962 997 4%
Transfers to the Lebanese University 277 347 26%
Contributions to non-profitable organizations 80 86 7%
Education allowance in private sector 216 255 18%
Sub-Total 1,619 1,765 9%
Other Social Spending
End of Service Indemnities & Retirement Wages 1,893 2,025 7% Transfers to the National Social Security Fund 100 0 -100% Transfers to Civil Servants' Cooperative 323 270 -16% Ministry of Social Affairs, of which 184 152 -18%
Transfers to non-profitable organizations 179 147 -18%
Participation in several mutual funds 51 51 0% Other social spending allowance (1) 52 43 -18%
Sub-Total 2,604 2,541 -2% Grand-Total Social Spending 5,111 5,239 2% Source: MOF, DGF
Note: Other social spending allowances mainly include marriage, birth, and death allowances and transfers to the Ministry of Displaced.
Public Finance Annual Review 2015
2015 Ministry of Finance 27 www.finance.gov.lb
SECTION IV: PUBLIC DEBT DEVELOPMENTS
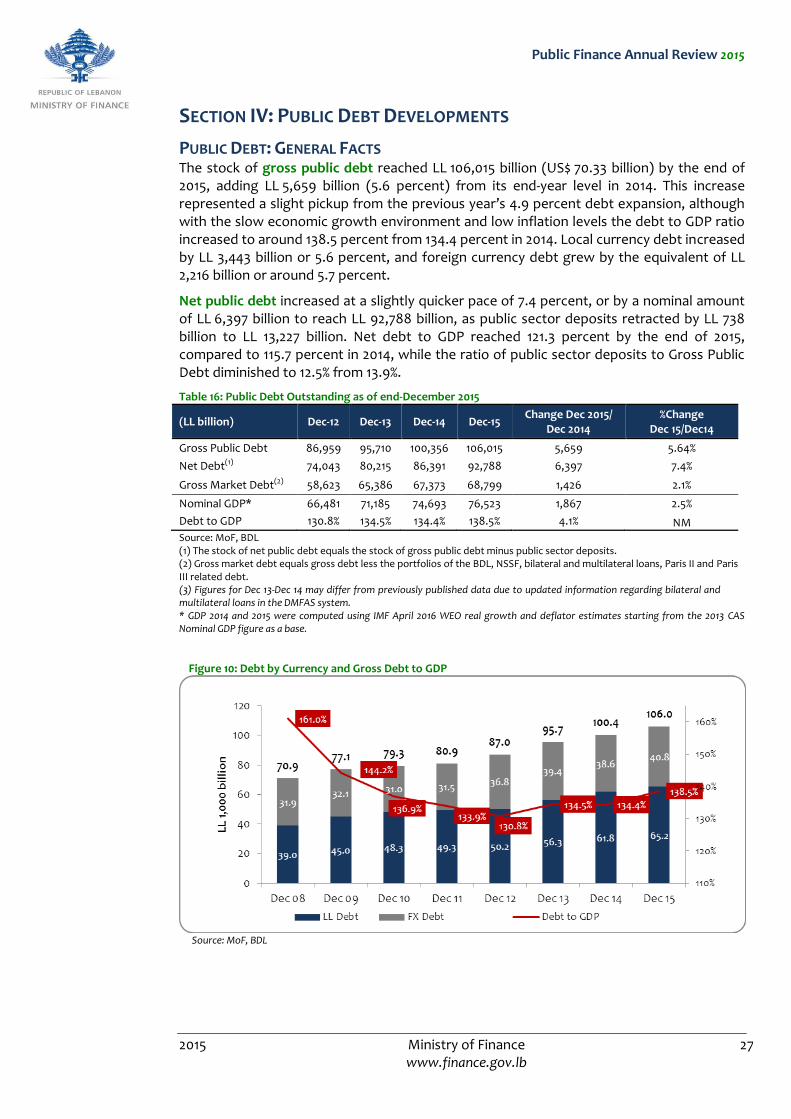
PUBLIC DEBT: GENERAL FACTS The stock of gross public debt reached LL 106,015 billion (US$ 70.33 billion) by the end of 2015, adding LL 5,659 billion (5.6 percent) from its end-year level in 2014. This increase represented a slight pickup from the previous year’s 4.9 percent debt expansion, although with the slow economic growth environment and low inflation levels the debt to GDP ratio increased to around 138.5 percent from 134.4 percent in 2014. Local currency debt increased by LL 3,443 billion or 5.6 percent, and foreign currency debt grew by the equivalent of LL 2,216 billion or around 5.7 percent.
Net public debt increased at a slightly quicker pace of 7.4 percent, or by a nominal amount of LL 6,397 billion to reach LL 92,788 billion, as public sector deposits retracted by LL 738 billion to LL 13,227 billion. Net debt to GDP reached 121.3 percent by the end of 2015, compared to 115.7 percent in 2014, while the ratio of public sector deposits to Gross Public Debt diminished to 12.5% from 13.9%.
Table 16: Public Debt Outstanding as of end-December 2015
(LL billion) Dec-12 Dec-13 Dec-14 Dec-15 Change Dec 2015/
Dec 2014 %Change
Dec 15/Dec14
Gross Public Debt 86,959 95,710 100,356 106,015 5,659 5.64%
Net Debt(1) 74,043 80,215 86,391 92,788 6,397 7.4%
Gross Market Debt(2) 58,623 65,386 67,373 68,799 1,426 2.1%
Nominal GDP* 66,481 71,185 74,693 76,523 1,867 2.5%
Debt to GDP 130.8% 134.5% 134.4% 138.5% 4.1% NM Source: MoF, BDL (1) The stock of net public debt equals the stock of gross public debt minus public sector deposits. (2) Gross market debt equals gross debt less the portfolios of the BDL, NSSF, bilateral and multilateral loans, Paris II and Paris III related debt. (3) Figures for Dec 13-Dec 14 may differ from previously published data due to updated information regarding bilateral and multilateral loans in the DMFAS system. * GDP 2014 and 2015 were computed using IMF April 2016 WEO real growth and deflator estimates starting from the 2013 CAS Nominal GDP figure as a base.
Figure 10: Debt by Currency and Gross Debt to GDP
Source: MoF, BDL
Public Finance Annual Review 2015
2015 Ministry of Finance 28 www.finance.gov.lb
LOCAL CURRENCY DEBT
The stock of Local currency debt reached LL 65,195 billion by end-December 2015, increasing by LL 3,443 billion (5.6 percent) from end-2014. This compared to a larger rise of LL 5,440 billion (9.7 percent) in 2014, when the fiscal deficit was mostly financed by new local currency debt owing to legislative limitations on new foreign currency issuances. With a more currency balanced financing strategy in 2015, local currency debt retained a similar share of gross outstanding debt as the previous year at 61.5 percent.
MoF’s debt management policy in 2015 entailed the first time publication of quarterly schedules27 for weekly auctions of local currency Treasury bills and bonds, which were released by the Public Debt Directorate prior to the beginning of each quarter. The calendars were published on MoF’s website specifying instruments to be issued in each of the weekly auctions of the coming quarter. This allowed for better alignment of investors’ expectations and helped improve the Ministry’s liquidity management. Auction calendars also introduced the regularized issuance of longer term instruments in weekly auctions, including the 7-year and 10-year tenors that had been previously issued on a non-regular basis. This helped to better gauge market demand and smooth primary coupon rates on the longer end of the curve. As a result, the coupon rate of the 10-year bond contracted by 52 basis points to 7.46% during the second offering of the tenor in March 2015 and remained flat until its last offering in December 2015. The 7-year T-bond was also issued at a lower rate of 7.08% compared to a primary rate of 7.50% when the tenor was last issued by MoF in June 2013 prior to its introduction in regular auction calendar.
Outstanding domestic currency denominated contractor bonds ended 2015 at LL 180 billion unchanged from end-2014.
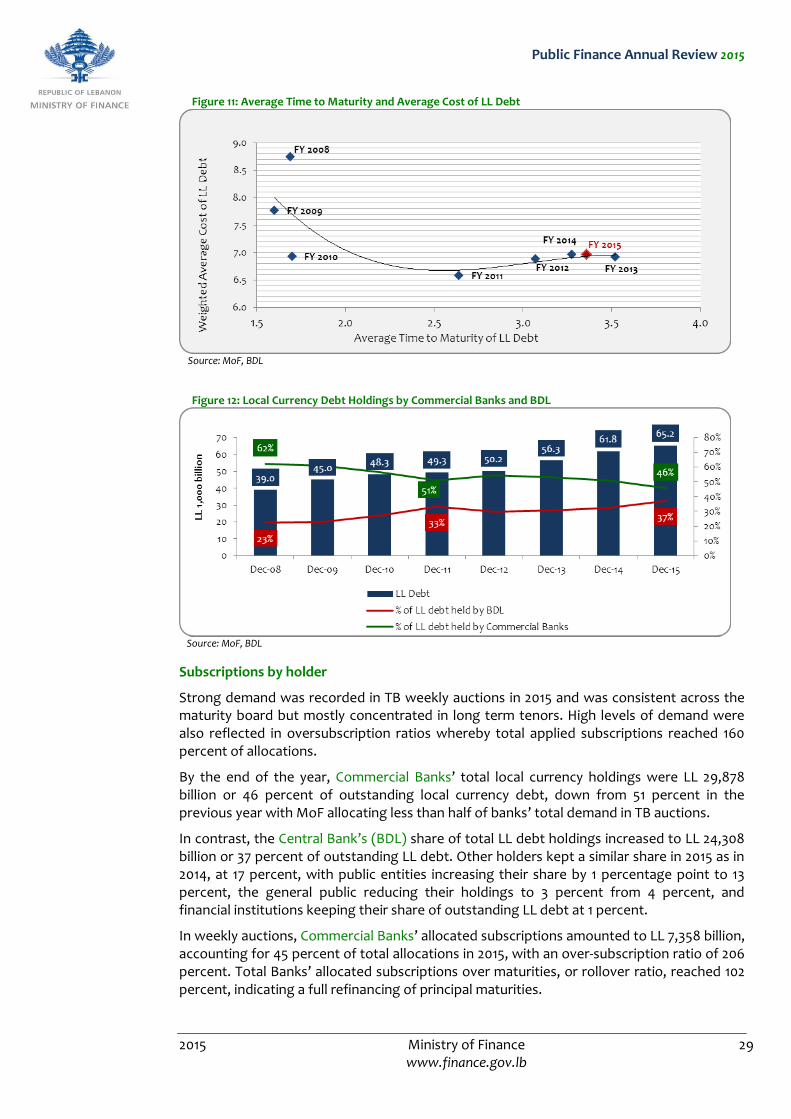
The average time‐to‐maturity (ATM) of domestic currency Treasury Bills and Bonds rose to 3.32 years by the end of December 2015, from 3.27 years in December 2014, reflecting the effect of longer tenors including the 7-year and 10-year Treasury bonds, which were issued on a regular basis in 2015.
The weighted average cost of outstanding domestic debt slightly increased to 7.00 percent from 6.96 percent by end‐2014, and 6.93 percent end‐2013. This increase outlined the larger concentration of new issuances in longer instruments, despite decreases in the weighted average cost of longer tenors individually, namely the 7-year and 10-year T-bonds.
Short‐term instruments kept similar weighted average costs of 4.44 percent, 4.99 percent, and 5.35 percent for 3MN, 6MN, and 12MN bills respectively. In long‐term instruments, the weighted average cost of 2YR and 3YR bonds was unchanged at 5.84 percent, but slightly increased to 6.5 percent from 6.48 percent for 3‐year bonds, and to 6.59 percent from 6.52 percent for 5‐year bonds. Those changes reflect the average 52 basis points hike in interest rates in March 2012. In contrast, the weighted average cost of the 7YR tenor decreased by 10 bps to 7.65 percent influenced by the decrease in issuance coupon to 7.08 percent in 2015. Likewise, the weighted average cost of the 10-year tenor decreased to 7.92 percent from 8.13 percent after primary issuance rates dropped to 7.46 percent from 7.98 percent in 2015 and 8.24 percent in 2013.
27 Calendars of Local currency debt weekly auctions are released on MoF’s website ten days prior to the beginning of each
quarter: http://www.finance.gov.lb/en-US/finance/PublicDebt/Pages/LebaneseGovernmentTreasuryBillsandBonds.aspx
Public Finance Annual Review 2015
2015 Ministry of Finance 29 www.finance.gov.lb
Figure 11: Average Time to Maturity and Average Cost of LL Debt
Source: MoF, BDL
Figure 12: Local Currency Debt Holdings by Commercial Banks and BDL
Source: MoF, BDL
Subscriptions by holder
Strong demand was recorded in TB weekly auctions in 2015 and was consistent across the maturity board but mostly concentrated in long term tenors. High levels of demand were also reflected in oversubscription ratios whereby total applied subscriptions reached 160 percent of allocations.
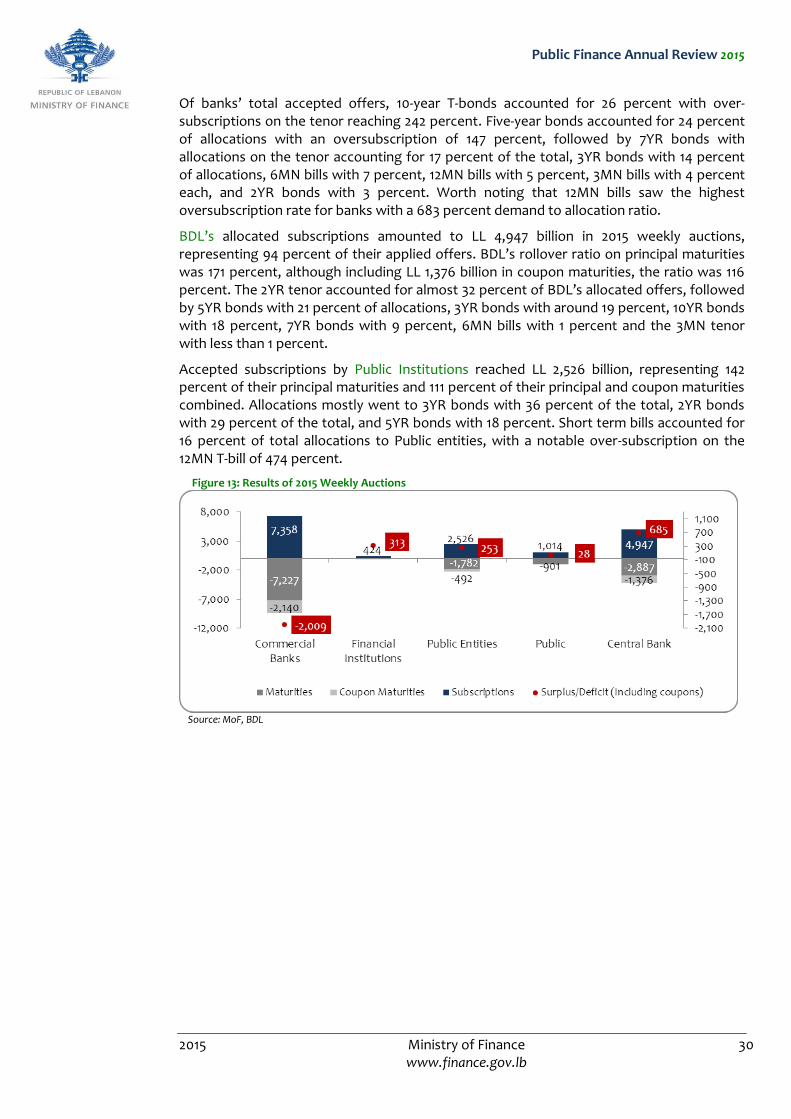
By the end of the year, Commercial Banks’ total local currency holdings were LL 29,878 billion or 46 percent of outstanding local currency debt, down from 51 percent in the previous year with MoF all0cating less than half of banks’ total demand in TB auctions.
In contrast, the Central Bank’s (BDL) share of total LL debt holdings increased to LL 24,308 billion or 37 percent of outstanding LL debt. Other holders kept a similar share in 2015 as in 2014, at 17 percent, with public entities increasing their share by 1 percentage point to 13 percent, the general public reducing their holdings to 3 percent from 4 percent, and financial institutions keeping their share of outstanding LL debt at 1 percent.
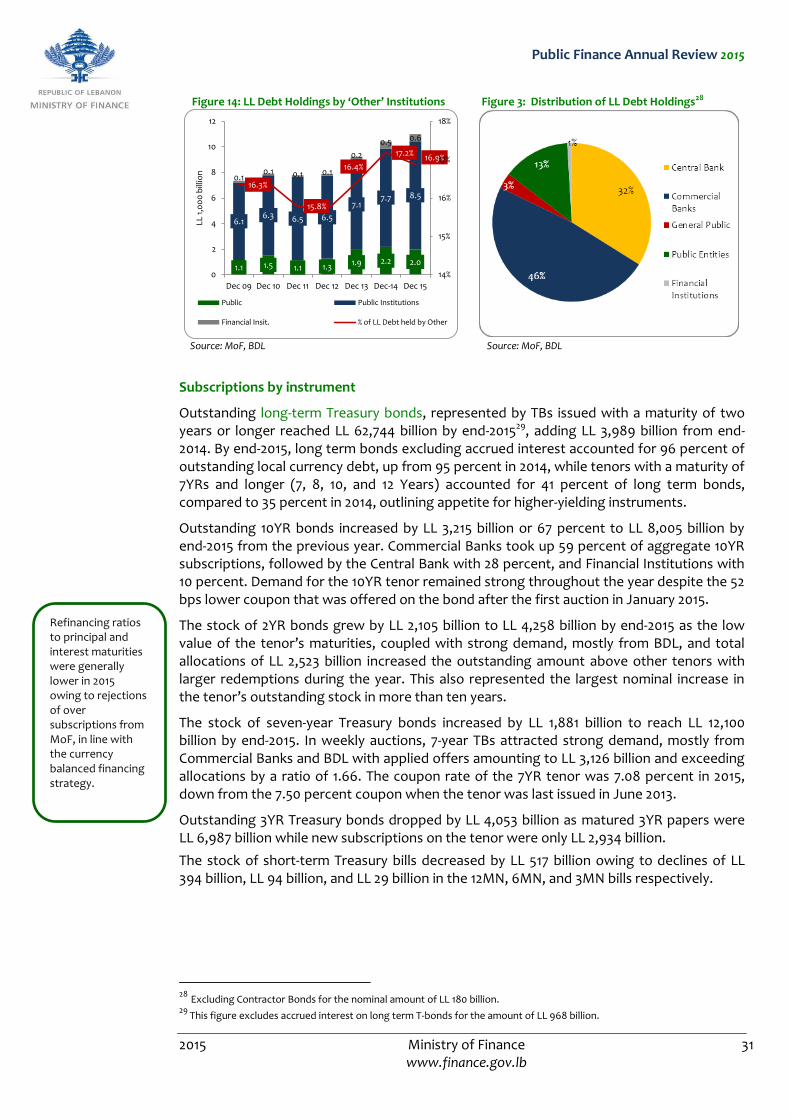
In weekly auctions, Commercial Banks’ allocated subscriptions amounted to LL 7,358 billion, accounting for 45 percent of total allocations in 2015, with an over-subscription ratio of 206 percent. Total Banks’ allocated subscriptions over maturities, or rollover ratio, reached 102 percent, indicating a full refinancing of principal maturities.
Public Finance Annual Review 2015
2015 Ministry of Finance 30 www.finance.gov.lb
Of banks’ total accepted offers, 10-year T-bonds accounted for 26 percent with over-subscriptions on the tenor reaching 242 percent. Five-year bonds accounted for 24 percent of allocations with an oversubscription of 147 percent, followed by 7YR bonds with allocations on the tenor accounting for 17 percent of the total, 3YR bonds with 14 percent of allocations, 6MN bills with 7 percent, 12MN bills with 5 percent, 3MN bills with 4 percent each, and 2YR bonds with 3 percent. Worth noting that 12MN bills saw the highest oversubscription rate for banks with a 683 percent demand to allocation ratio.
BDL’s allocated subscriptions amounted to LL 4,947 billion in 2015 weekly auctions, representing 94 percent of their applied offers. BDL’s rollover ratio on principal maturities was 171 percent, although including LL 1,376 billion in coupon maturities, the ratio was 116 percent. The 2YR tenor accounted for almost 32 percent of BDL’s allocated offers, followed by 5YR bonds with 21 percent of allocations, 3YR bonds with around 19 percent, 10YR bonds with 18 percent, 7YR bonds with 9 percent, 6MN bills with 1 percent and the 3MN tenor with less than 1 percent.
Accepted subscriptions by Public Institutions reached LL 2,526 billion, representing 142 percent of their principal maturities and 111 percent of their principal and coupon maturities combined. Allocations mostly went to 3YR bonds with 36 percent of the total, 2YR bonds with 29 percent of the total, and 5YR bonds with 18 percent. Short term bills accounted for 16 percent of total allocations to Public entities, with a notable over-subscription on the 12MN T-bill of 474 percent.
Figure 13: Results of 2015 Weekly Auctions
Source: MoF, BDL
Public Finance Annual Review 2015
2015 Ministry of Finance 31 www.finance.gov.lb
Figure 14: LL Debt Holdings by ‘Other’ Institutions Figure 3: Distribution of LL Debt Holdings28
1.1 1.5 1.1 1.3 1.9 2.2 2.0
6.16.3 6.5 6.5
7.17.7 8.5
0.10.1 0.1 0.1
0.2
0.5 0.6
16.3%
15.8%
16.4%
17.2%16.9%
14%
15%
16%
17%
18%
0
2
4
6
8
10
12
Dec 09 Dec 10 Dec 11 Dec 12 Dec 13 Dec-14 Dec 15
LL 1
,00
0 b
illio
n
Public Public Institutions
Financial Insit. % of LL Debt held by Other
Source: MoF, BDL Source: MoF, BDL
Subscriptions by instrument
Outstanding long-term Treasury bonds, represented by TBs issued with a maturity of two years or longer reached LL 62,744 billion by end-201529, adding LL 3,989 billion from end-2014. By end-2015, long term bonds excluding accrued interest accounted for 96 percent of outstanding local currency debt, up from 95 percent in 2014, while tenors with a maturity of 7YRs and longer (7, 8, 10, and 12 Years) accounted for 41 percent of long term bonds, compared to 35 percent in 2014, outlining appetite for higher-yielding instruments.
Outstanding 10YR bonds increased by LL 3,215 billion or 67 percent to LL 8,005 billion by end-2015 from the previous year. Commercial Banks took up 59 percent of aggregate 10YR subscriptions, followed by the Central Bank with 28 percent, and Financial Institutions with 10 percent. Demand for the 10YR tenor remained strong throughout the year despite the 52 bps lower coupon that was offered on the bond after the first auction in January 2015.
The stock of 2YR bonds grew by LL 2,105 billion to LL 4,258 billion by end-2015 as the low value of the tenor’s maturities, coupled with strong demand, mostly from BDL, and total allocations of LL 2,523 billion increased the outstanding amount above other tenors with larger redemptions during the year. This also represented the largest nominal increase in the tenor’s outstanding stock in more than ten years.
The stock of seven-year Treasury bonds increased by LL 1,881 billion to reach LL 12,100 billion by end-2015. In weekly auctions, 7-year TBs attracted strong demand, mostly from Commercial Banks and BDL with applied offers amounting to LL 3,126 billion and exceeding allocations by a ratio of 1.66. The coupon rate of the 7YR tenor was 7.08 percent in 2015, down from the 7.50 percent coupon when the tenor was last issued in June 2013.
Outstanding 3YR Treasury bonds dropped by LL 4,053 billion as matured 3YR papers were LL 6,987 billion while new subscriptions on the tenor were only LL 2,934 billion.
The stock of short-term Treasury bills decreased by LL 517 billion owing to declines of LL 394 billion, LL 94 billion, and LL 29 billion in the 12MN, 6MN, and 3MN bills respectively.
28 Excluding Contractor Bonds for the nominal amount of LL 180 billion. 29
This figure excludes accrued interest on long term T-bonds for the amount of LL 968 billion.
Refinancing ratios to principal and interest maturities were generally lower in 2015 owing to rejections of over subscriptions from MoF, in line with the currency balanced financing strategy.
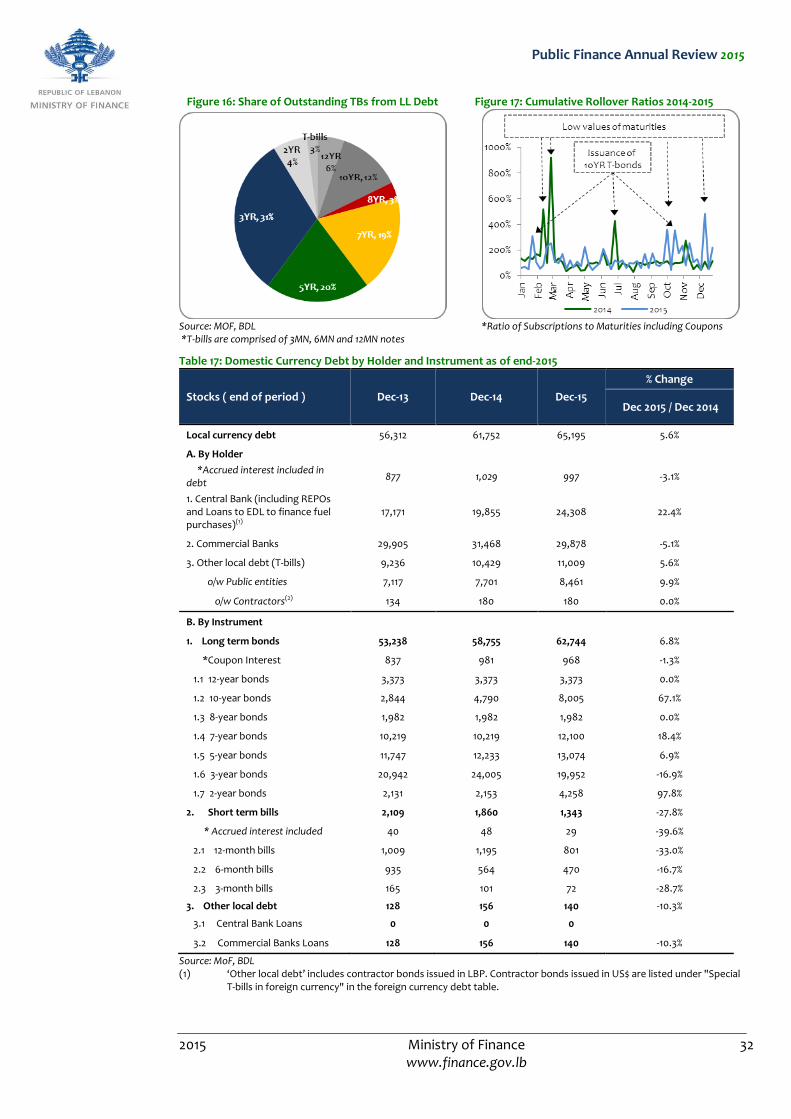
Public Finance Annual Review 2015
2015 Ministry of Finance 32 www.finance.gov.lb
Figure 16: Share of Outstanding TBs from LL Debt Figure 17: Cumulative Rollover Ratios 2014-2015
Source: MOF, BDL *Ratio of Subscriptions to Maturities including Coupons *T-bills are comprised of 3MN, 6MN and 12MN notes
Table 17: Domestic Currency Debt by Holder and Instrument as of end-2015
Stocks ( end of period ) Dec-13 Dec-14 Dec-15
% Change
Dec 2015 / Dec 2014
Local currency debt 56,312 61,752 65,195 5.6%
A. By Holder
*Accrued interest included in debt
877 1,029 997 -3.1%
1. Central Bank (including REPOs and Loans to EDL to finance fuel purchases)(1)
17,171 19,855 24,308 22.4%
2. Commercial Banks 29,905 31,468 29,878 -5.1%
3. Other local debt (T-bills) 9,236 10,429 11,009 5.6%
o/w Public entities 7,117 7,701 8,461 9.9%
o/w Contractors(2) 134 180 180 0.0%
B. By Instrument
1. Long term bonds 53,238 58,755 62,744 6.8%
*Coupon Interest 837 981 968 -1.3%
1.1 12-year bonds 3,373 3,373 3,373 0.0%
1.2 10-year bonds 2,844 4,790 8,005 67.1%
1.3 8-year bonds 1,982 1,982 1,982 0.0%
1.4 7-year bonds 10,219 10,219 12,100 18.4%
1.5 5-year bonds 11,747 12,233 13,074 6.9%
1.6 3-year bonds 20,942 24,005 19,952 -16.9%
1.7 2-year bonds 2,131 2,153 4,258 97.8%
2. Short term bills 2,109 1,860 1,343 -27.8%
* Accrued interest included 40 48 29 -39.6%
2.1 12-month bills 1,009 1,195 801 -33.0%
2.2 6-month bills 935 564 470 -16.7%
2.3 3-month bills 165 101 72 -28.7%
3. Other local debt 128 156 140 -10.3%
3.1 Central Bank Loans 0 0 0
3.2 Commercial Banks Loans 128 156 140 -10.3%
Source: MoF, BDL (1) ‘Other local debt’ includes contractor bonds issued in LBP. Contractor bonds issued in US$ are listed under "Special
T-bills in foreign currency" in the foreign currency debt table.
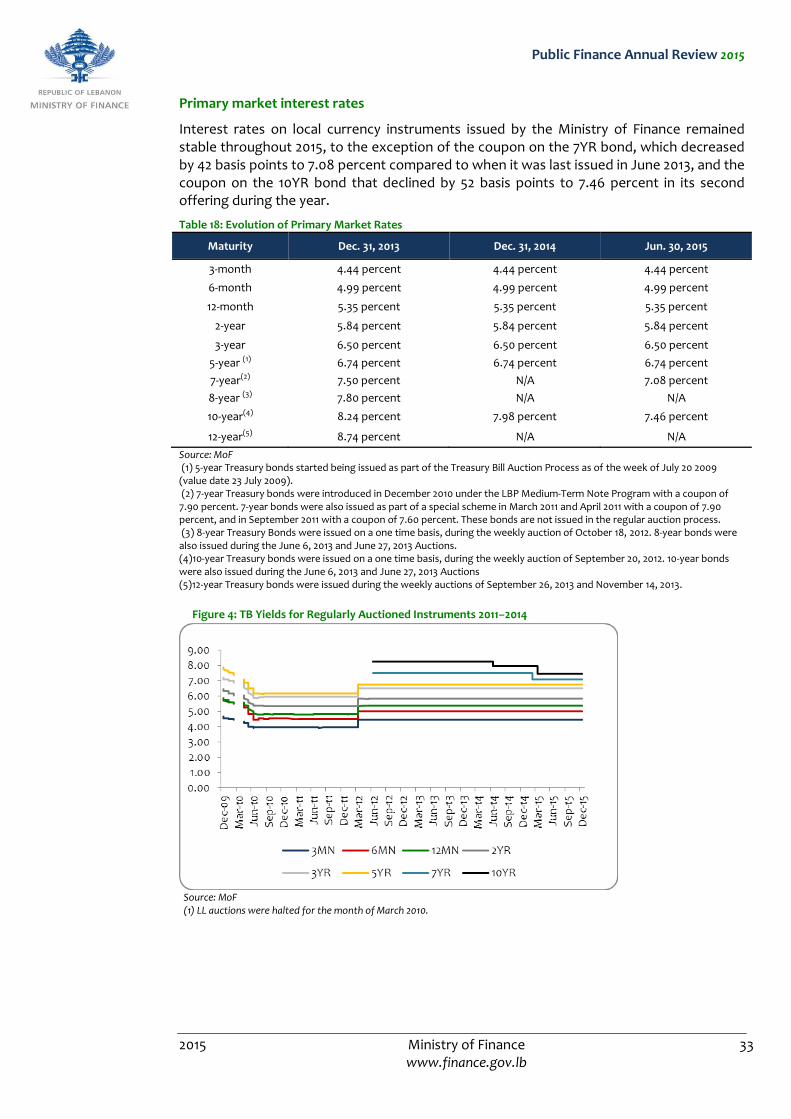
Public Finance Annual Review 2015
2015 Ministry of Finance 33 www.finance.gov.lb
Primary market interest rates
Interest rates on local currency instruments issued by the Ministry of Finance remained stable throughout 2015, to the exception of the coupon on the 7YR bond, which decreased by 42 basis points to 7.08 percent compared to when it was last issued in June 2013, and the coupon on the 10YR bond that declined by 52 basis points to 7.46 percent in its second offering during the year.
Table 18: Evolution of Primary Market Rates
Maturity Dec. 31, 2013 Dec. 31, 2014 Jun. 30, 2015
3-month 4.44 percent 4.44 percent 4.44 percent
6-month 4.99 percent 4.99 percent 4.99 percent
12-month 5.35 percent 5.35 percent 5.35 percent
2-year 5.84 percent 5.84 percent 5.84 percent
3-year 6.50 percent 6.50 percent 6.50 percent
5-year (1) 6.74 percent 6.74 percent 6.74 percent
7-year(2) 7.50 percent N/A 7.08 percent
8-year (3) 7.80 percent N/A N/A
10-year(4) 8.24 percent 7.98 percent 7.46 percent
12-year(5) 8.74 percent N/A N/A
Source: MoF (1) 5-year Treasury bonds started being issued as part of the Treasury Bill Auction Process as of the week of July 20 2009 (value date 23 July 2009). (2) 7‐year Treasury bonds were introduced in December 2010 under the LBP Medium‐Term Note Program with a coupon of 7.90 percent. 7‐year bonds were also issued as part of a special scheme in March 2011 and April 2011 with a coupon of 7.90 percent, and in September 2011 with a coupon of 7.60 percent. These bonds are not issued in the regular auction process. (3) 8-year Treasury Bonds were issued on a one time basis, during the weekly auction of October 18, 2012. 8-year bonds were also issued during the June 6, 2013 and June 27, 2013 Auctions. (4)10-year Treasury bonds were issued on a one time basis, during the weekly auction of September 20, 2012. 10-year bonds were also issued during the June 6, 2013 and June 27, 2013 Auctions (5)12-year Treasury bonds were issued during the weekly auctions of September 26, 2013 and November 14, 2013.
Figure 4: TB Yields for Regularly Auctioned Instruments 2011–2014
Source: MoF (1) LL auctions were halted for the month of March 2010.
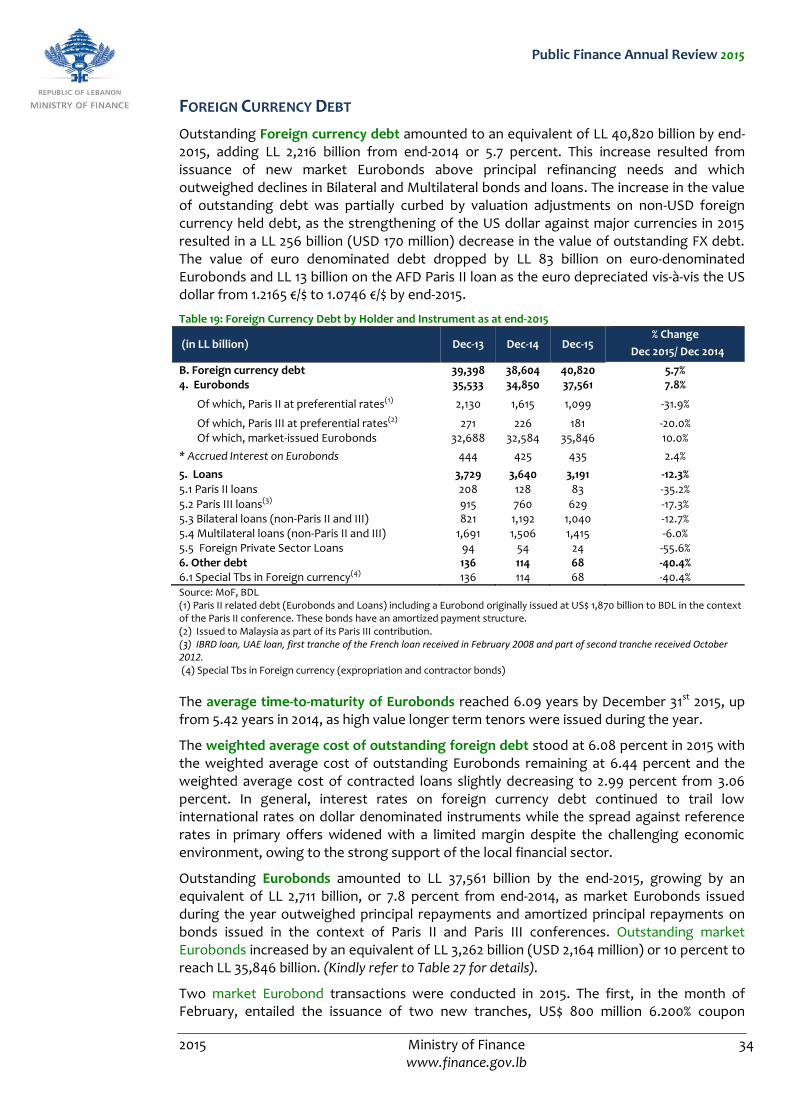
Public Finance Annual Review 2015
2015 Ministry of Finance 34 www.finance.gov.lb
FOREIGN CURRENCY DEBT
Outstanding Foreign currency debt amounted to an equivalent of LL 40,820 billion by end-2015, adding LL 2,216 billion from end-2014 or 5.7 percent. This increase resulted from issuance of new market Eurobonds above principal refinancing needs and which outweighed declines in Bilateral and Multilateral bonds and loans. The increase in the value of outstanding debt was partially curbed by valuation adjustments on non-USD foreign currency held debt, as the strengthening of the US dollar against major currencies in 2015 resulted in a LL 256 billion (USD 170 million) decrease in the value of outstanding FX debt. The value of euro denominated debt dropped by LL 83 billion on euro-denominated Eurobonds and LL 13 billion on the AFD Paris II loan as the euro depreciated vis‐à‐vis the US dollar from 1.2165 €/$ to 1.0746 €/$ by end-2015.
Table 19: Foreign Currency Debt by Holder and Instrument as at end-2015
(in LL billion) Dec-13 Dec-14 Dec-15 % Change
Dec 2015/ Dec 2014
B. Foreign currency debt 39,398 38,604 40,820 5.7% 4. Eurobonds 35,533 34,850 37,561 7.8%
Of which, Paris II at preferential rates(1) 2,130 1,615 1,099 -31.9%
Of which, Paris III at preferential rates(2) 271 226 181 -20.0% Of which, market-issued Eurobonds 32,688 32,584 35,846 10.0%
* Accrued Interest on Eurobonds 444 425 435 2.4%
5. Loans 3,729 3,640 3,191 -12.3%
5.1 Paris II loans 208 128 83 -35.2%
5.2 Paris III loans(3) 915 760 629 -17.3% 5.3 Bilateral loans (non-Paris II and III) 821 1,192 1,040 -12.7% 5.4 Multilateral loans (non-Paris II and III) 1,691 1,506 1,415 -6.0% 5.5 Foreign Private Sector Loans 94 54 24 -55.6% 6. Other debt 136 114 68 -40.4% 6.1 Special Tbs in Foreign currency(4) 136 114 68 -40.4% Source: MoF, BDL (1) Paris II related debt (Eurobonds and Loans) including a Eurobond originally issued at US$ 1,870 billion to BDL in the context of the Paris II conference. These bonds have an amortized payment structure. (2) Issued to Malaysia as part of its Paris III contribution. (3) IBRD loan, UAE loan, first tranche of the French loan received in February 2008 and part of second tranche received October 2012. (4) Special Tbs in Foreign currency (expropriation and contractor bonds)
The average time‐to‐maturity of Eurobonds reached 6.09 years by December 31st 2015, up from 5.42 years in 2014, as high value longer term tenors were issued during the year.
The weighted average cost of outstanding foreign debt stood at 6.08 percent in 2015 with the weighted average cost of outstanding Eurobonds remaining at 6.44 percent and the weighted average cost of contracted loans slightly decreasing to 2.99 percent from 3.06 percent. In general, interest rates on foreign currency debt continued to trail low international rates on dollar denominated instruments while the spread against reference rates in primary offers widened with a limited margin despite the challenging economic environment, owing to the strong support of the local financial sector.
Outstanding Eurobonds amounted to LL 37,561 billion by the end-2015, growing by an equivalent of LL 2,711 billion, or 7.8 percent from end-2014, as market Eurobonds issued during the year outweighed principal repayments and amortized principal repayments on bonds issued in the context of Paris II and Paris III conferences. Outstanding market Eurobonds increased by an equivalent of LL 3,262 billion (USD 2,164 million) or 10 percent to reach LL 35,846 billion. (Kindly refer to Table 27 for details).
Two market Eurobond transactions were conducted in 2015. The first, in the month of February, entailed the issuance of two new tranches, US$ 800 million 6.200% coupon
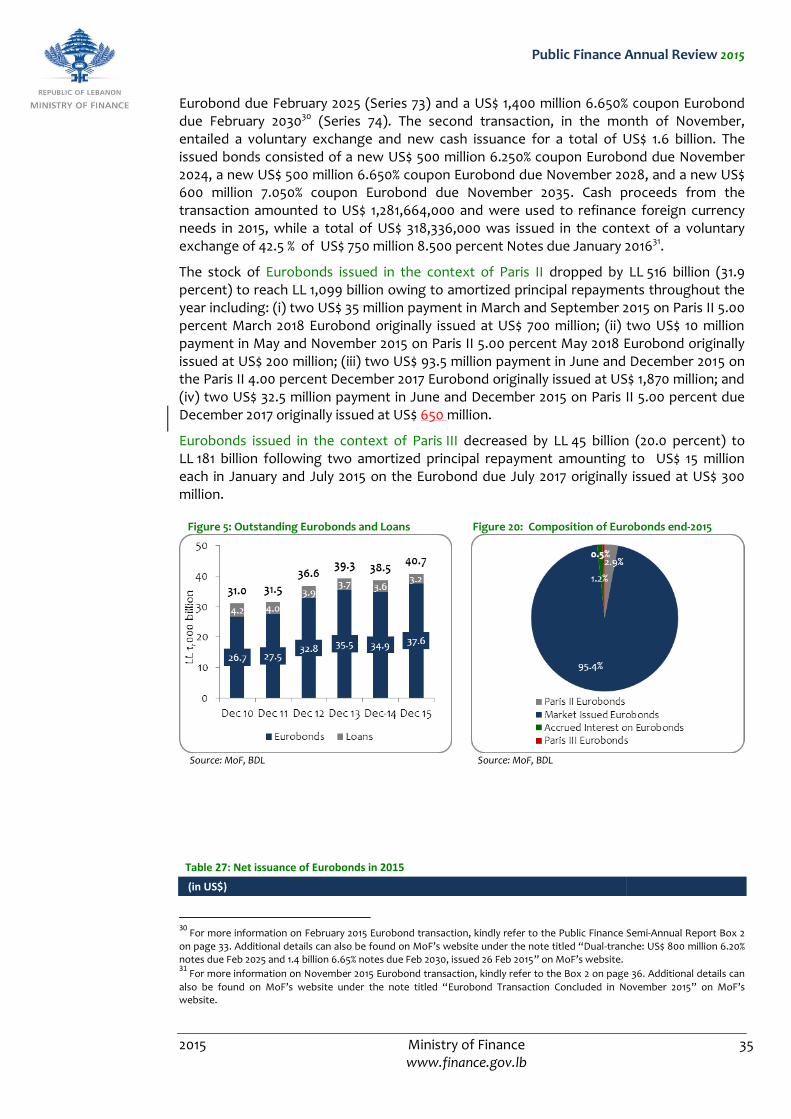
Public Finance Annual Review 2015
2015 Ministry of Finance 35 www.finance.gov.lb
Eurobond due February 2025 (Series 73) and a US$ 1,400 million 6.650% coupon Eurobond due February 203030 (Series 74). The second transaction, in the month of November, entailed a voluntary exchange and new cash issuance for a total of US$ 1.6 billion. The issued bonds consisted of a new US$ 500 million 6.250% coupon Eurobond due November 2024, a new US$ 500 million 6.650% coupon Eurobond due November 2028, and a new US$ 600 million 7.050% coupon Eurobond due November 2035. Cash proceeds from the transaction amounted to US$ 1,281,664,000 and were used to refinance foreign currency needs in 2015, while a total of US$ 318,336,000 was issued in the context of a voluntary exchange of 42.5 % of US$ 750 million 8.500 percent Notes due January 201631.
The stock of Eurobonds issued in the context of Paris II dropped by LL 516 billion (31.9 percent) to reach LL 1,099 billion owing to amortized principal repayments throughout the year including: (i) two US$ 35 million payment in March and September 2015 on Paris II 5.00 percent March 2018 Eurobond originally issued at US$ 700 million; (ii) two US$ 10 million payment in May and November 2015 on Paris II 5.00 percent May 2018 Eurobond originally issued at US$ 200 million; (iii) two US$ 93.5 million payment in June and December 2015 on the Paris II 4.00 percent December 2017 Eurobond originally issued at US$ 1,870 million; and (iv) two US$ 32.5 million payment in June and December 2015 on Paris II 5.00 percent due December 2017 originally issued at US$ 650 million.
Eurobonds issued in the context of Paris III decreased by LL 45 billion (20.0 percent) to LL 181 billion following two amortized principal repayment amounting to US$ 15 million each in January and July 2015 on the Eurobond due July 2017 originally issued at US$ 300 million.
Figure 5: Outstanding Eurobonds and Loans Figure 20: Composition of Eurobonds end-2015
…Source: MoF, BDL Source: MoF, BDL
Table 27: Net issuance of Eurobonds in 2015
(in US$)
30
For more information on February 2015 Eurobond transaction, kindly refer to the Public Finance Semi-Annual Report Box 2 on page 33. Additional details can also be found on MoF’s website under the note titled “Dual-tranche: US$ 800 million 6.20% notes due Feb 2025 and 1.4 billion 6.65% notes due Feb 2030, issued 26 Feb 2015” on MoF’s website. 31
For more information on November 2015 Eurobond transaction, kindly refer to the Box 2 on page 36. Additional details can
also be found on MoF’s website under the note titled “Eurobond Transaction Concluded in November 2015” on MoF’s website.
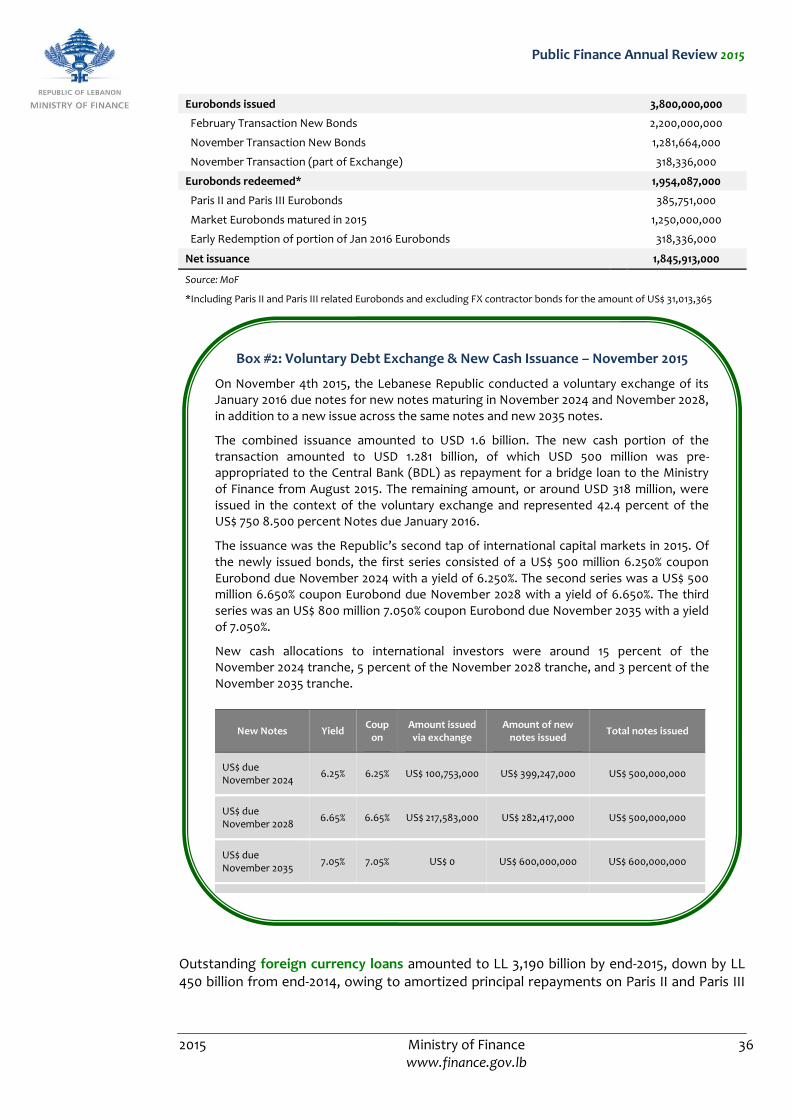
Public Finance Annual Review 2015
2015 Ministry of Finance 36 www.finance.gov.lb
Eurobonds issued
3,800,000,000
February Transaction New Bonds
2,200,000,000
November Transaction New Bonds
1,281,664,000
November Transaction (part of Exchange)
318,336,000
Eurobonds redeemed*
1,954,087,000
Paris II and Paris III Eurobonds
385,751,000
Market Eurobonds matured in 2015
1,250,000,000
Early Redemption of portion of Jan 2016 Eurobonds
318,336,000
Net issuance 1,845,913,000
Source: MoF
*Including Paris II and Paris III related Eurobonds and excluding FX contractor bonds for the amount of US$ 31,013,365
Outstanding foreign currency loans amounted to LL 3,190 billion by end-2015, down by LL 450 billion from end-2014, owing to amortized principal repayments on Paris II and Paris III
Box #2: Voluntary Debt Exchange & New Cash Issuance – November 2015
On November 4th 2015, the Lebanese Republic conducted a voluntary exchange of its January 2016 due notes for new notes maturing in November 2024 and November 2028, in addition to a new issue across the same notes and new 2035 notes.
The combined issuance amounted to USD 1.6 billion. The new cash portion of the transaction amounted to USD 1.281 billion, of which USD 500 million was pre-appropriated to the Central Bank (BDL) as repayment for a bridge loan to the Ministry of Finance from August 2015. The remaining amount, or around USD 318 million, were issued in the context of the voluntary exchange and represented 42.4 percent of the US$ 750 8.500 percent Notes due January 2016.
The issuance was the Republic’s second tap of international capital markets in 2015. Of the newly issued bonds, the first series consisted of a US$ 500 million 6.250% coupon Eurobond due November 2024 with a yield of 6.250%. The second series was a US$ 500 million 6.650% coupon Eurobond due November 2028 with a yield of 6.650%. The third series was an US$ 800 million 7.050% coupon Eurobond due November 2035 with a yield of 7.050%.
New cash allocations to international investors were around 15 percent of the November 2024 tranche, 5 percent of the November 2028 tranche, and 3 percent of the November 2035 tranche.
New Notes Yield Coup
on Amount issued via exchange
Amount of new notes issued
Total notes issued
US$ due November 2024
6.25% 6.25% US$ 100,753,000 US$ 399,247,000 US$ 500,000,000
US$ due November 2028
6.65% 6.65% US$ 217,583,000 US$ 282,417,000 US$ 500,000,000
US$ due November 2035
7.05% 7.05% US$ 0 US$ 600,000,000 US$ 600,000,000
Total US$ US$ 318,336,000 US$ 1,281,664,000 US$ 1,600,000,000
Public Finance Annual Review 2015
2015 Ministry of Finance 37 www.finance.gov.lb
loans, foreign private sector loans, non-Paris II and non-Paris III bilateral and Multilateral loans.
a) The stock of Paris II loans fell by LL 45 billion (35 percent) to reach LL 83 billion following the redemption of € 20 million of the Agence Française de Développement (AFD) Paris II loan, represented by two amortized repayments made in February and August, in addition to the effect of a devalued euro against the US dollar.
b) The stock of Paris III loans decreased by LL 131 billion, equivalent to 17 percent, to reach LL 629 billion by end-2015. The decline in the outstanding value of PIII loans was mainly due to (i) two US$ 15 million semi-annual principal repayments made in April and October 2015 on the UAE Paris III loan; (ii) two US$ 5 million semi-annual principal repayments in April and October 2014 on the World Bank IBRD loan, and (iii) two 9.375 million euro semi-annual principal repayments made in May and November 2015 on the 150 million euro AFD loan, (iv) two 1.875 million euro semi-annual principal repayments made in May and November 2015 on the 30 million euro AFD loan.
c) The stock of foreign private sector loans decreased by LL 30 billion to reach LL 24 billion.
d) The stock of non-Paris II and non-Paris III bilateral loans dropped by LL 152 billion, equivalent to 13 percent to reach LL 1,040 billion, as loan repayments exceeded disbursements made during the year. Major principal repayments included: LL 83 billion to ELO, financing arm of EKF export credit facility, (ii) LL 22 billion to the Kuwait Fund for Arab Economic Development, (iii) LL 20 billion to the Saudi Fund for Development, (iv) LL 12 billion to the Agence Française de Développement, (v) LL 9 billion to Japan’s Overseas Economic Cooperation Fund, and (vi) LL 4 billion to Abu Dhabi Fund for Development.
In return bilateral loans disbursed were:
i. LL 37 billion from six loans by Kuwait Fund for Arab Economic Development ii. LL 33 billion from ELO, Financing arm of EKF export credit facility32. iii. LL 7 billion from one loan granted by the Abu Dhabi Fund iv. LL 5 billion from two loans established by German government-owned development
bank, KFW v. LL 3 billion from four loans granted by the Saudi Fund for Development
e) Non-Paris II and Paris III multilateral loans dropped by LL 92 billion to LL 1,414 billion. Principal repayments included: (i) LL 64 billion to the Arab Fund for Economic and Social Development (AFESD), (ii) LL 49 billion to the Islamic Development Bank, (iii) around LL 45 billion to the European Investment Bank, (iv) LL 35 billion to the International Bank for Reconstruction and Development (IBRD), and (v) LL 4 billion to the Organization of Petroleum Exporting Countries (OPEC).
On the other hand, major primary disbursements included:
i. LL 72 billion from seven IBRD loans ii. LL 52 billion from eight AFESD loans iii. LL 19 billion from nine loans granted by the Islamic Development Bank iv. LL 6 billion from three OPEC loans v. LL 5 billion from one loan granted by European Investment Bank
32 This loan was signed between the Lebanese republic and Danish export credit agency to cover 85 percent of the cost of installing new electricity generation units at Zouk and Jieh power plants by Danish-German Consortium, Burmeister and Wain A.S and MAN Diesel and Turbo SE.
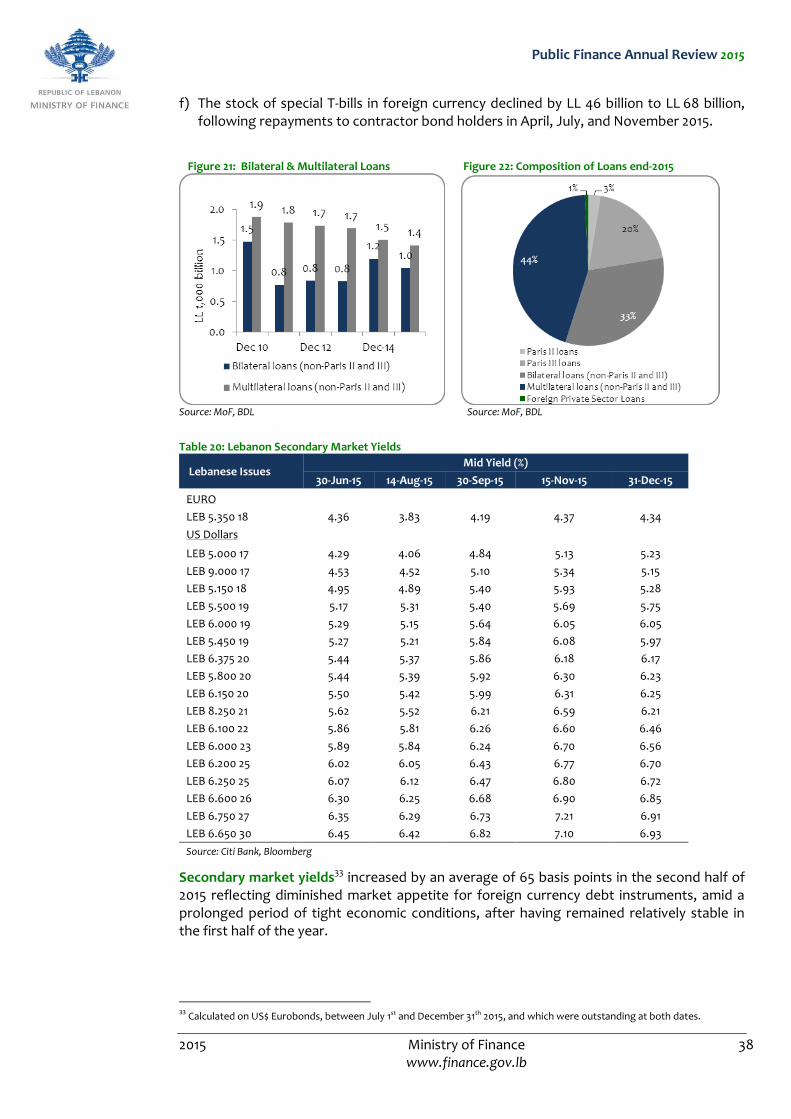
Public Finance Annual Review 2015
2015 Ministry of Finance 38 www.finance.gov.lb
f) The stock of special T-bills in foreign currency declined by LL 46 billion to LL 68 billion, following repayments to contractor bond holders in April, July, and November 2015.
Figure 21: Bilateral & Multilateral Loans Figure 22: Composition of Loans end-2015
Source: MoF, BDL Source: MoF, BDL
Table 20: Lebanon Secondary Market Yields
Lebanese Issues Mid Yield (%)
30-Jun-15 14-Aug-15 30-Sep-15 15-Nov-15 31-Dec-15
EURO
LEB 5.350 18 4.36 3.83 4.19 4.37 4.34
US Dollars
LEB 5.000 17 4.29 4.06 4.84 5.13 5.23
LEB 9.000 17 4.53 4.52 5.10 5.34 5.15
LEB 5.150 18 4.95 4.89 5.40 5.93 5.28
LEB 5.500 19 5.17 5.31 5.40 5.69 5.75
LEB 6.000 19 5.29 5.15 5.64 6.05 6.05
LEB 5.450 19 5.27 5.21 5.84 6.08 5.97
LEB 6.375 20 5.44 5.37 5.86 6.18 6.17
LEB 5.800 20 5.44 5.39 5.92 6.30 6.23
LEB 6.150 20 5.50 5.42 5.99 6.31 6.25
LEB 8.250 21 5.62 5.52 6.21 6.59 6.21
LEB 6.100 22 5.86 5.81 6.26 6.60 6.46
LEB 6.000 23 5.89 5.84 6.24 6.70 6.56
LEB 6.200 25 6.02 6.05 6.43 6.77 6.70
LEB 6.250 25 6.07 6.12 6.47 6.80 6.72
LEB 6.600 26 6.30 6.25 6.68 6.90 6.85
LEB 6.750 27 6.35 6.29 6.73 7.21 6.91
LEB 6.650 30 6.45 6.42 6.82 7.10 6.93
Source: Citi Bank, Bloomberg
Secondary market yields33 increased by an average of 65 basis points in the second half of 2015 reflecting diminished market appetite for foreign currency debt instruments, amid a prolonged period of tight economic conditions, after having remained relatively stable in the first half of the year.
33 Calculated on US$ Eurobonds, between July 1st and December 31th 2015, and which were outstanding at both dates.
Public Finance Annual Review 2015
2015 Ministry of Finance 39 www.finance.gov.lb
For further information please contact:
Ministry of Finance
UNDP Project
Tel: 961 1 981057/8
Fax: 961 1 981059
Email: [email protected]
Website: www.finance.gov.lb


![Bonded Logistic Center: Policy Analysis on Perspective ... · Ministry of Finance Regulation No. 193/PMK.03/2015 [8] and Ministry of Finance Regulation No. 192/PMK.03/2015 (PMK-193](https://img.pdfslide.us/doc/110x75/5cfb871488c993da268bb711/bonded-logistic-center-policy-analysis-on-perspective-ministry-of-finance.jpg)