Embed Size (px)
Citation preview

PUBLIC EXPOSE TAHUNAN
PT INTAN BARUPRANA FINANCE TBK
Auditorium 5th Floor, INTA HQ Building
Jakarta, 27 Oktober 2015

VISION
MISSION
STRATEGY
To be Tier 1 Finance Company in the financial industry
in Indonesia
To create job and prosperity, and build and grow with
aspiring local entrepreneurs
To have Capital Rp. 1 trillion or higher and rating single A or better.
Through upholding Good Corporate Governance, respecting all
stakeholders, practicing highest professionalism and having honest
character.
Key Company HighlightsVision, Mission, Strategy

1991 2010 2014
\
2003 2013
On September 4, 1991,
the Company was
established with a name
PT Intan Baruprana
Finance
The Company’s business
activities were expanded,
namely moving into
financing based on syariah
principles on April 8, 2010
The Company listed (go public) its
shares on the Indonesian Stock
Exchange with code:IBFN on
December 22, 2014
On February 14, 2003,
PT Inta Finance and
Employee Cooperative
of PT Intraco Penta, Tbk
become shareholders
(acquired by INTA)
On August 15, 2013,
Phillip Asia Pacific
Opportunity Fund, Ltd
became a shareholder of
the Company by holding
9.71% shares.
Key Company HighlightsMilestones

Overview of the CompanyAwards and Achievements
September 2011
The 12th best
multifinance
company (Total
Assets between
Rp500bn – Rp1tn)
October 2012
The 3rd best
multifinance
company (Total
Assets between
Rp1tn – Rp2tn)
Investor Magazine Awards Infobank Magazine Awards
“The company is well recognized in the Indonesian multifinance sector, having been given
numerous awards from Investor and Infobank magazines.”
September 2013
The 5th best
multifinance
company (Total
Assets between
Rp1tn – Rp2tn)
August 2011
Rated “Very Good”
and ranked 35th
(Assets category
between Rp 100
billion – Rp 1 trillion)
August 2012
Rated “Very Good”
and ranked 17th
(Assets category
above Rp 1 trillion)
August 2013
Rated “Very Good”
and ranked 37th
(Assets category
above Rp 1 trillion)
August 2014
Rated “Very Good” and
ranked 9th
(Assets category above
Rp 1 trillion)
September 2015
The 2nd best
multifinance company
(Total Assets between
Rp2tn – Rp5tn)
August 2015
Rated “Very Good” and
ranked 8th
(Assets category between
Rp1tn – 5tn)
October 2014
The 9th best
multifinance
company (Total
Assets between
Rp2tn – Rp5tn)

Business Strategy
• Prioritize to provide financing services for INTA customers
Maintaining captive market
• Provide financing for non-INTA products
• Target to have 50:50 captive and non-captive portfolio in the near future
Expanding the non-captive market
• Understand client’s needs
• Knowing client’s business
• Assess payment capabilities
Improving the assets quality
• Diversify portfolio to construction & infrastructure, agribusiness, transportation (land,sea), oil & gas, hospitality, healthcare and various sector
Penetrating new industry sectors
• Establish a joint-financing /channeling scheme
• issue MTN, BondsLowering cost of fund
• Provide tailor made financing
• Have skilled and experienced personnel
• Have depth knowledge in heavy equipments industry
Focusing on the customer

FinancialRevenue
Revenue from FY10A – FY14A; Sept 14UA – 15UA (in Rp mn)
Source: AFS 2010, 2011, 2012, 2013 ,2014 & UAFS Sept 2014, 2015
47.784
111.628
173.443
258.738
398.420
278.379
352.224
FY10A FY11A FY12A FY13A FY14A Sept14 Sept15

5.866
17.555
24.721
31.825
60.545
50.361 47.267
FY10A FY11A FY12A FY13A FY14A Sept14UA Sept15UA
12,28%
15,73%14,25%
12,30%
15,20%
18,09%
13,42%
FY10A FY11A FY12A FY13A FY14A Sept14UA Sept15UA
Net Profit Margin FY10A – FY14A; Sept 14UA – 15UA (%)
Net Income FY10A – FY14A; Sept 14UA – 15UA (in Rp Mn)
FinancialNet Income

FinancialNew Booking
New Booking from FY10 – FY14; Sept 14– 15 (in Rp mn)
Source: FS 2010, 2011, 2012, 2013 ,2014 & FS Sept 2014, 2015
440.983
985.244 1.041.619
997.275
1.071.313
715.798
847.707
Dec 10 Dec 11 Dec 12 Dec 13 Dec 14 Sept 14 Sept 15

FinancialFinancing Portofolio
By type in FY Dec14 (Value) By type in Sept15 (Value)
Heavy
Equipment
55.83%
Machinery
14.22%
Property
0.34%
Truck
19.62%
Tug and
Barge
8.02%
Others
1.96%
Heavy
Equipment
46.33%
Machinery
25.59%
Property
0.16%
Truck
17.66%
Tug and
Barge
7.65%
Others
2.61%
Source: MA as of Des 2014 & Sept 2015

Source: MA as of Des 2014 & Sept 2015
By type in FY Dec14 (Unit) By type in Sept15 (Unit)
Heavy
Equipment
49.47%
Machinery
17.07%
Property
2.60%
Truck
30.26%
Tug and
Barge
0.60%
Heavy
Equipment
16.55%
Machinery
71.88%
Property
0.26% Truck
11.08%
Tug and
Barge
0.23%
FinancialFinancing Portofolio

Source: MA as of Des 2014 & Sept 2015
By sector industry in Sept15 (Value)
Coal Mining
43%
Nickel
3%Gold
2%Bauxite
2%
Oil &
Gas
9%Quarry
2%
Agribusiness
4%
Transport &
Logistic
26%
Construction
6%
Other
3%
Coal Mining
40%
Nickel
3%Gold
1%Bauxite
0%
Logam
1%
Oil & Gas
11%Quarry
2%
Agribusiness
3%
Transport &
Logistic
22%
Construction
6%
Other
11%
By sector industry in FY Dec14 (Value)
FinancialFinancing Portofolio
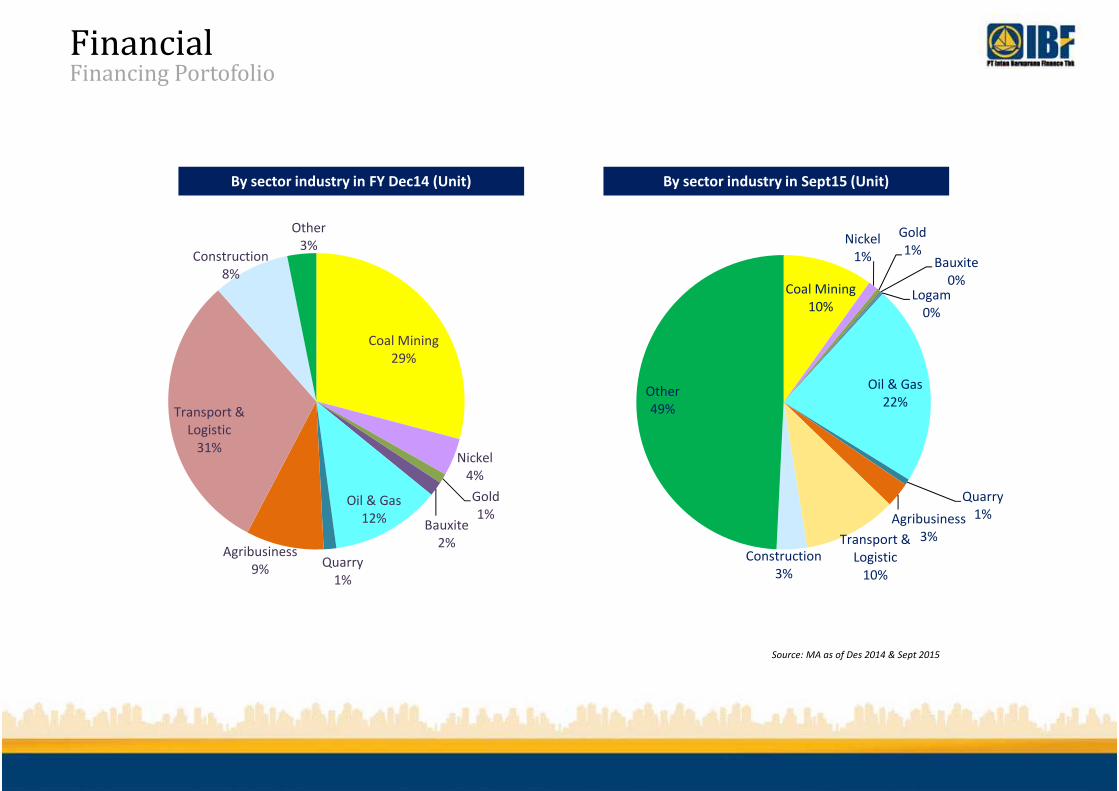
Source: MA as of Des 2014 & Sept 2015
By sector industry in FY Dec14 (Unit) By sector industry in Sept15 (Unit)
Coal Mining
29%
Nickel
4%
Gold
1%Bauxite
2%
Oil & Gas
12%
Quarry
1%
Agribusiness
9%
Transport &
Logistic
31%
Construction
8%
Other
3%
Coal Mining
10%
Nickel
1%
Gold
1%Bauxite
0%Logam
0%
Oil & Gas
22%
Quarry
1%Agribusiness
3%Transport &
Logistic
10%
Construction
3%
Other
49%
FinancialFinancing Portofolio

FinancialFunding
Outstanding loans per bank & financial institutions Bank loans+Financial institutions+MTN at Dec14A & Sept15UA
Conventional vs Sharia
IDR vs USD
Currency: Rp bn Dec14A Sept15UA
Bank Artha Graha 67 29
BPD Jabar dan Banten 19 1
BNI 292 243
Bank SBI Indonesia 25 48
Bank MNC (ICB Bumiputera) 96 163
Bank Mestika 74 75
Indonesia Eximbank - 158
Total Conventional Loans 581 717
Unamortized transaction cost (2) (2)
BSM 159 76
Bank Muamalat Indonesia 312 328
BNI Syariah 189 185
Bank Maybank Syariah Indonesia 78 91
Bank Jabar Banten Syariah 37 10
BCA Syariah 17 7
Bank Bukopin Syariah 3 1
Bank Rakyat Indonesia Syariah 3 2
ICD (The Islamic Corp. For The
Development Of The Private Sector) - 77
Total Sharia Loans 798 777
Bank loans & financial institutions 1.377 1.492
MTN (Medium Terms Notes) 300 300
Convent
52%Sharia
48%
IDR 79%
USD 21%
Convent
57%Sharia
43%
IDR;
82%
USD;
18%

Source: AFS 2010, 2011, 2012, 2013, 2014 & Sept 2015UA (ROA & ROE Sept 2015UA disetahunkan)
Assets (Rp billion) Equity (Rp billion)
ROA & ROE (%) Gearing Ratio (%)
295%
408%
557%
336%
286% 289%
Dec10A Dec11A Dec12A Dec13A Des14A Sept15UA
120
187 212
394
565 612
Dec 10A Dec 11A Dec 12A Dec 13A Dec 14A Sept 15UA
570
1.378
1.795
2.355
3.040
3.576
Dec 10A Dec 11A Dec 12A Dec 13A Dec 14A Sept 15UA
1,03% 1,27% 1,38% 1,35%1,99% 1,78%
4,91%
9,38%
11,69%
8,08%
10,73%10,04%
Dec10A Dec11A Dec12A Dec13A Dec14A Sept15UA
ROA
ROE
FinancialAssets, Equity & Ratios

Opportunities and Potentials
� Huge and growing middle class
� Very young population
� Infrastructure is the main theme of the current
government namely toll road, power plant,
airport, and seaport. These are the areas where
leasing can contribute and play big role.
� Healthcare and alternative energy.

Challenges
� Growth is dependent and limited by availability of
bank lines
� Investment grade is BBB- but in practice investors
look for A flat
� Capital market is robust but favor the big names,
big sharehlders, and big market cap

Q & A

THANK YOU