Embed Size (px)
Citation preview
And Researchers at the Department of Economics,
University of Stellenbosch
Public Expenditure Analysis for the Basic Education Sector in South Africa Infrastructure
John Kruger/Georgina Rawle
4 JUNE 2012
Infrastructure
Oxford Policy Management/Stellenbosch Economics, April 2012 i
Table of contents
Table of contents i
List of tables and figures ii
1 Introduction 3
2 Infrastructure and efficiency of the education system 5
3 Status quo in terms of infrastructure provisioning 6
3.1 Overview of data and recent assessments 6
3.2 Further analysis of the current NEIMS database 8
4 Reasons for continued inadequacy and inequality of infrastructure provisioning 13
5 Infrastructure institutions and responsibilities 15
6 Recent Interventions and efforts 16
6.1 Policy development 16
6.2 Information and monitoring 17
6.3 Capacity 17
6.4 Special programmes 18
6.5 Funding infrastructure 19
7 Conclusions and recommendations 21
References 23
Infrastructure
Oxford Policy Management/Stellenbosch Economics, April 2012 ii
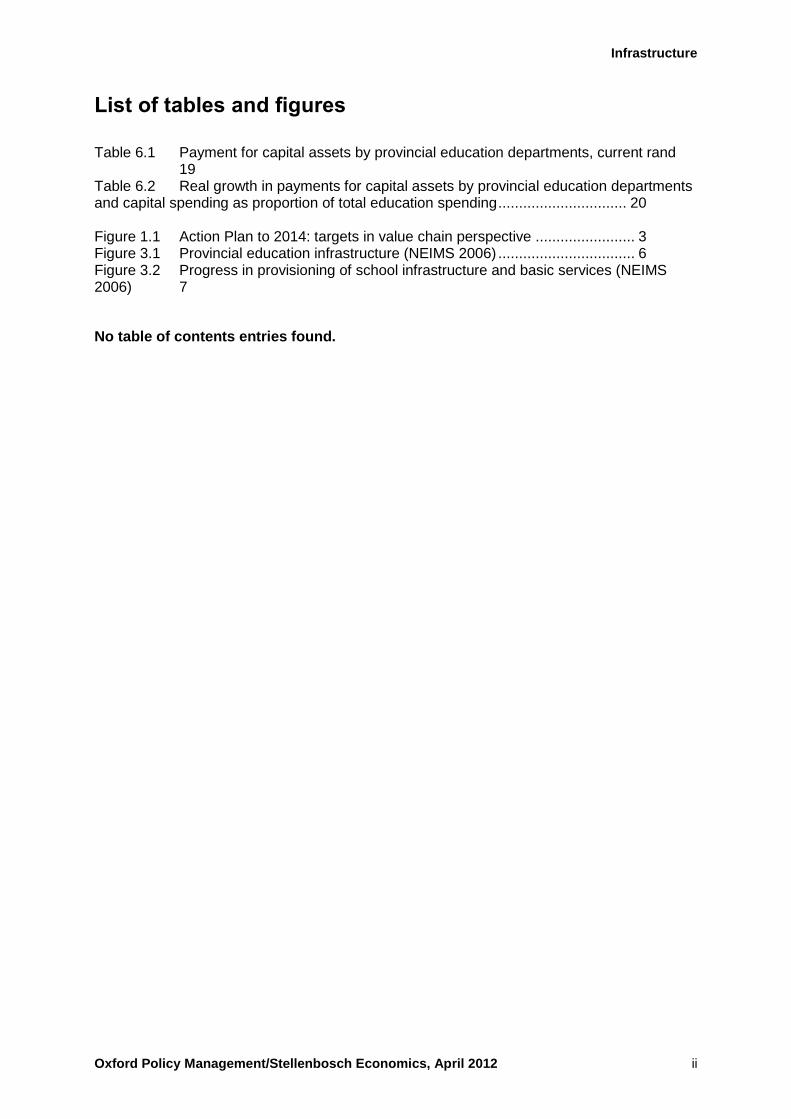
List of tables and figures
Table 6.1 Payment for capital assets by provincial education departments, current rand 19 Table 6.2 Real growth in payments for capital assets by provincial education departments and capital spending as proportion of total education spending ............................... 20 Figure 1.1 Action Plan to 2014: targets in value chain perspective ........................ 3 Figure 3.1 Provincial education infrastructure (NEIMS 2006) ................................. 6 Figure 3.2 Progress in provisioning of school infrastructure and basic services (NEIMS 2006) 7
No table of contents entries found.
Infrastructure
3
1 Introduction
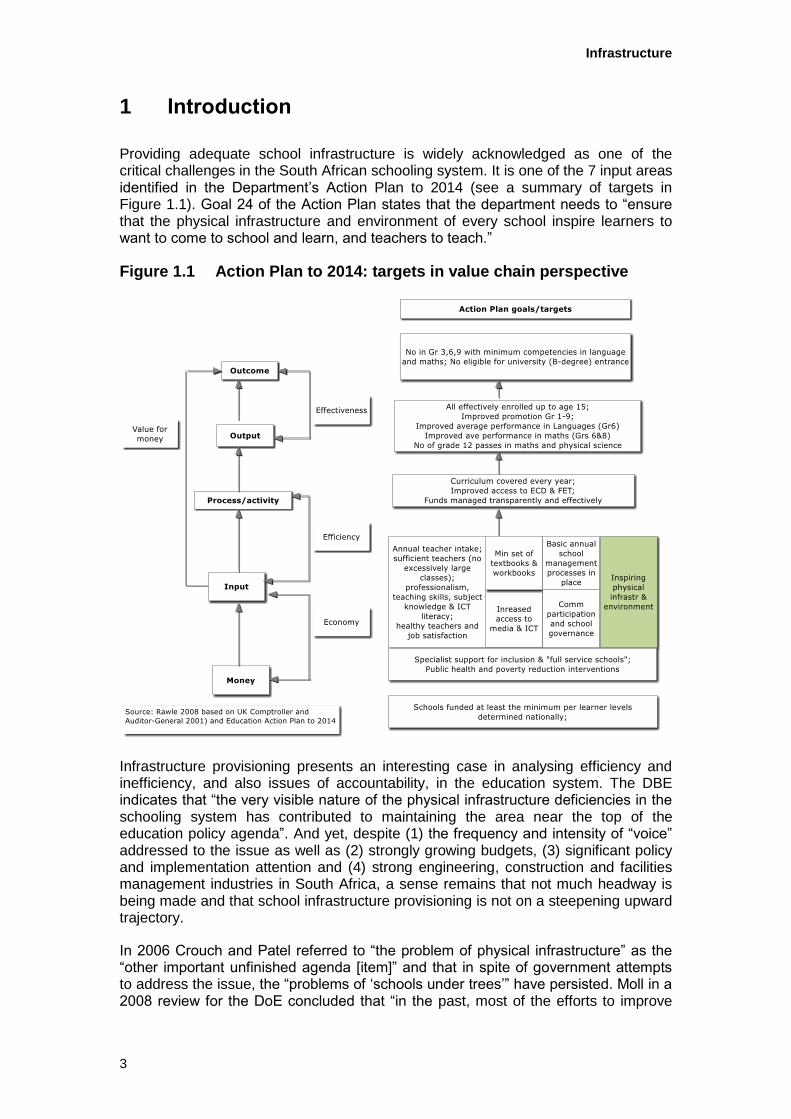
Providing adequate school infrastructure is widely acknowledged as one of the critical challenges in the South African schooling system. It is one of the 7 input areas identified in the Department’s Action Plan to 2014 (see a summary of targets in Figure 1.1). Goal 24 of the Action Plan states that the department needs to “ensure that the physical infrastructure and environment of every school inspire learners to want to come to school and learn, and teachers to teach.”
Figure 1.1 Action Plan to 2014: targets in value chain perspective
Infrastructure provisioning presents an interesting case in analysing efficiency and inefficiency, and also issues of accountability, in the education system. The DBE indicates that “the very visible nature of the physical infrastructure deficiencies in the schooling system has contributed to maintaining the area near the top of the education policy agenda”. And yet, despite (1) the frequency and intensity of “voice” addressed to the issue as well as (2) strongly growing budgets, (3) significant policy and implementation attention and (4) strong engineering, construction and facilities management industries in South Africa, a sense remains that not much headway is being made and that school infrastructure provisioning is not on a steepening upward trajectory.
In 2006 Crouch and Patel referred to “the problem of physical infrastructure” as the “other important unfinished agenda [item]” and that in spite of government attempts to address the issue, the “problems of ‘schools under trees’” have persisted. Moll in a 2008 review for the DoE concluded that “in the past, most of the efforts to improve
Infrastructure
4
the infrastructure delivery system failed.” In 2011 the South African Institution of Civil Engineering (SAICE) concluded that “school infrastructure overall in South Africa” was “generally deteriorating”, critically, in their analysis, because “[b]udgeting for maintenance in schools in all provinces has been and remains inadequate”.
A key question is why progress has been so unsatisfactory in an area which received significant additional resources and a lot of “attention”.
Infrastructure
5
2 Infrastructure and efficiency of the education system
The efficiency aspects of school infrastructure provision have not received much attention in South Africa. This would partly be because of the complexity of the analysis involved. Crouch and Patel (2006) rightly indicates that “it would be difficult to ‘prove’ statistically that [bad infrastructure] conditions are related to the lack of cognitive development among the poor”. Crouch and Patel, however, also argue that it is unnecessary to prove the negative impact because improving the infrastructure situation in poor schools “is a matter of simple justice and equity”. Improving infrastructure is therefore a rights issue.
While there is therefore little argument about the importance of improving school infrastructure in poor schools in South Africa, improvements in infrastructure could also be expected to impact positively on schooling outcomes. Theunynck (2009) has identified a number of channels through which infrastructure provisioning could influence school outcomes and argues that from a number of perspectives “school infrastructure matters”.
He identifies three channels through which the availability of school infrastructure could potentially influence schooling outcomes:
Closeness to schools and quality of school infrastructure impacts on school enrolment.
Higher quality infrastructure impacts on teacher motivation and absenteeism.
Conditions of school buildings can impact on learning outcomes.
According to Theunynck’s reading of the available evidence it is clear that “adequate school infrastructure” has a “positive impact on enrolment, completion and learning”. He does, however, point to data problems and endogeneity bias in assessing the impact of infrastructure on performance. Furthermore, he points out that there is some consensus that inputs other than infrastructure may have a bigger impact (mentioning textbooks and teacher manuals specifically) and that the relative cost-effectiveness of different types of infrastructure investments are not clear and the various studies therefore do not help much in targeting investments.
One of the data issues raised by Theunynck is the difficulty of summarising the availability and quality of school infrastructure. He points out that it is a multi-dimensional phenomenon and that efforts at constructing infrastructure indices are relatively untested.
Infrastructure
6
3 Status quo in terms of infrastructure provisioning
3.1 Overview of data and recent assessments
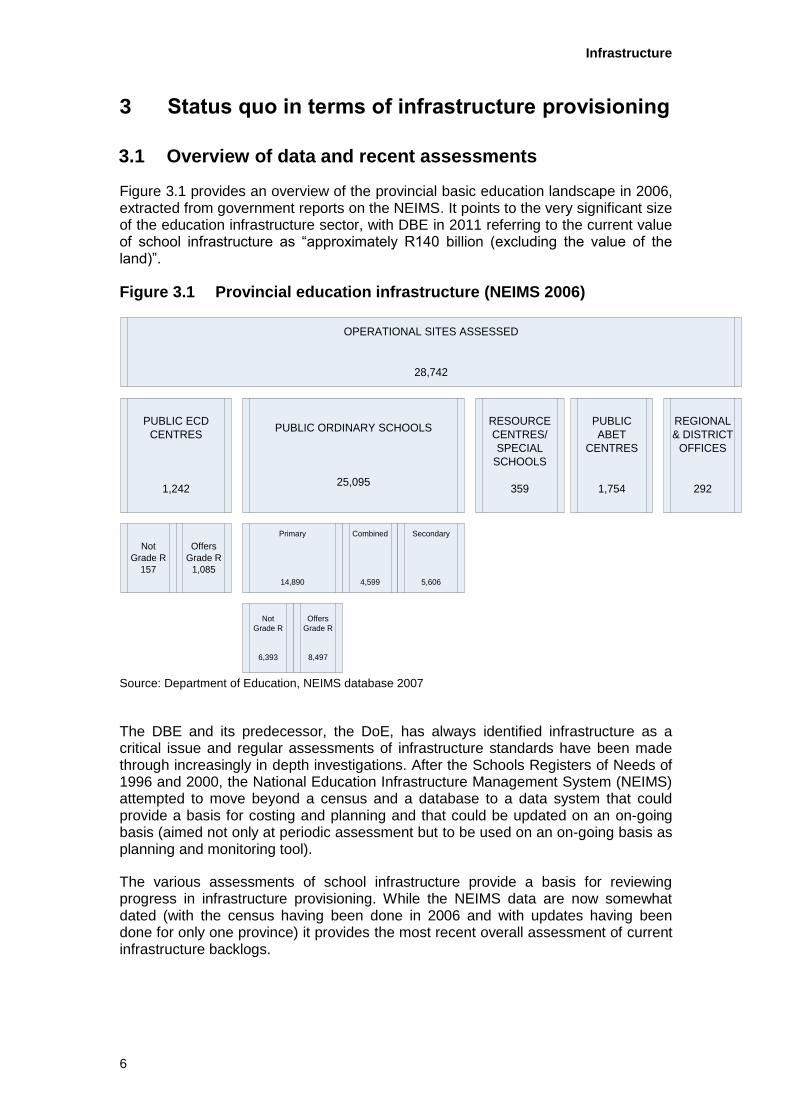
Figure 3.1 provides an overview of the provincial basic education landscape in 2006, extracted from government reports on the NEIMS. It points to the very significant size of the education infrastructure sector, with DBE in 2011 referring to the current value of school infrastructure as “approximately R140 billion (excluding the value of the land)”.
Figure 3.1 Provincial education infrastructure (NEIMS 2006)
Source: Department of Education, NEIMS database 2007
The DBE and its predecessor, the DoE, has always identified infrastructure as a critical issue and regular assessments of infrastructure standards have been made through increasingly in depth investigations. After the Schools Registers of Needs of 1996 and 2000, the National Education Infrastructure Management System (NEIMS) attempted to move beyond a census and a database to a data system that could provide a basis for costing and planning and that could be updated on an on-going basis (aimed not only at periodic assessment but to be used on an on-going basis as planning and monitoring tool).
The various assessments of school infrastructure provide a basis for reviewing progress in infrastructure provisioning. While the NEIMS data are now somewhat dated (with the census having been done in 2006 and with updates having been done for only one province) it provides the most recent overall assessment of current infrastructure backlogs.
PUBLIC ECD
CENTRES
1,242
OPERATIONAL SITES ASSESSED
28,742
PUBLIC
ABET
CENTRES
1,754
RESOURCE
CENTRES/
SPECIAL
SCHOOLS
359
PUBLIC ORDINARY SCHOOLS
25,095
REGIONAL
& DISTRICT
OFFICES
292
Not
Grade R
157
Offers
Grade R
1,085
Primary
14,890
Combined
4,599
Secondary
5,606
Not
Grade R
6,393
Offers
Grade R
8,497
Infrastructure
7
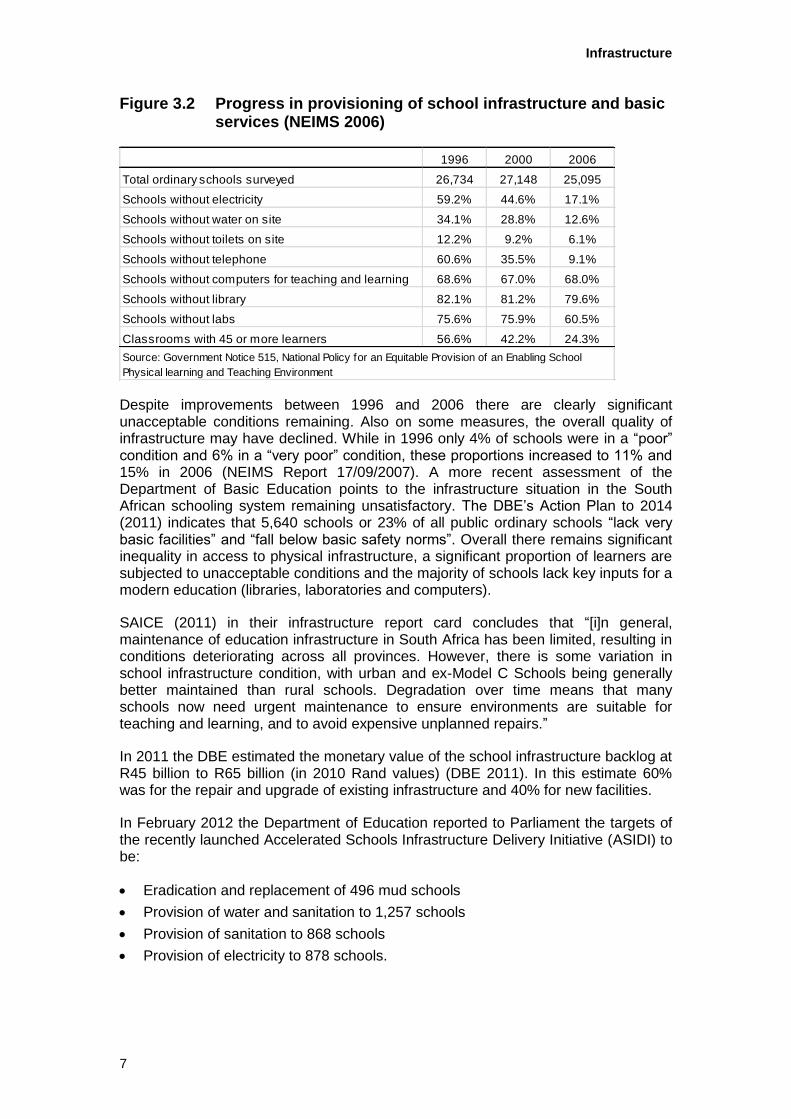
Figure 3.2 Progress in provisioning of school infrastructure and basic services (NEIMS 2006)
Despite improvements between 1996 and 2006 there are clearly significant unacceptable conditions remaining. Also on some measures, the overall quality of infrastructure may have declined. While in 1996 only 4% of schools were in a “poor” condition and 6% in a “very poor” condition, these proportions increased to 11% and 15% in 2006 (NEIMS Report 17/09/2007). A more recent assessment of the Department of Basic Education points to the infrastructure situation in the South African schooling system remaining unsatisfactory. The DBE’s Action Plan to 2014 (2011) indicates that 5,640 schools or 23% of all public ordinary schools “lack very basic facilities” and “fall below basic safety norms”. Overall there remains significant inequality in access to physical infrastructure, a significant proportion of learners are subjected to unacceptable conditions and the majority of schools lack key inputs for a modern education (libraries, laboratories and computers).
SAICE (2011) in their infrastructure report card concludes that “[i]n general, maintenance of education infrastructure in South Africa has been limited, resulting in conditions deteriorating across all provinces. However, there is some variation in school infrastructure condition, with urban and ex-Model C Schools being generally better maintained than rural schools. Degradation over time means that many schools now need urgent maintenance to ensure environments are suitable for teaching and learning, and to avoid expensive unplanned repairs.”
In 2011 the DBE estimated the monetary value of the school infrastructure backlog at R45 billion to R65 billion (in 2010 Rand values) (DBE 2011). In this estimate 60% was for the repair and upgrade of existing infrastructure and 40% for new facilities.
In February 2012 the Department of Education reported to Parliament the targets of the recently launched Accelerated Schools Infrastructure Delivery Initiative (ASIDI) to be:
Eradication and replacement of 496 mud schools
Provision of water and sanitation to 1,257 schools
Provision of sanitation to 868 schools
Provision of electricity to 878 schools.
1996 2000 2006
Total ordinary schools surveyed 26,734 27,148 25,095
Schools without electricity 59.2% 44.6% 17.1%
Schools without water on site 34.1% 28.8% 12.6%
Schools without toilets on site 12.2% 9.2% 6.1%
Schools without telephone 60.6% 35.5% 9.1%
Schools without computers for teaching and learning 68.6% 67.0% 68.0%
Schools without library 82.1% 81.2% 79.6%
Schools without labs 75.6% 75.9% 60.5%
Classrooms with 45 or more learners 56.6% 42.2% 24.3%
Source: Government Notice 515, National Policy for an Equitable Provision of an Enabling School
Physical learning and Teaching Environment
Infrastructure
8
3.2 Further analysis of the current NEIMS database
The research team could not be supplied with the full NEIMS database and as a result there had to be a focus on a limited number of extracted variables. The NEIMS database has not been systematically updated since 2006, as originally envisaged, but some ad-hoc updates have taken place. The following analysis uses this updated database together with current learner numbers to provide an insight into the distribution of infrastructure deprivation in public ordinary schools (POS)
The analysis is based on 23,858 records from POS schools. Of the 24,556 POS records in the database approximately 3% of schools had to be excluded because learner numbers were not available for these institutions.
The analysis of the NEIMS data focused on the following:
Briefly describing the infrastructure backlogs on the basis of the data in the current (2012) NEIMS database. The data highlights that although public spending per student is fairly equal, the physical conditions in which students learn are far from equal.
Developing a simple index of infrastructure status which is useful for analysis and could be a useful tool in prioritising public infrastructure investment.
Assessing backlog in terms of a number of variables such as province, district, school quintile and school size to identify relevant patterns of backlogs which could be used in generating focused plans.
The results from the analysis of the data are fairly comparable to the original (2006) NEIMS results and further analysis is provided of the relationship between the quality of the school environment and poverty (school quintile), school size and district.
At an aggregate level, the updated database shows that there is still a lack of basic infrastructure in a significant proportion of POS:
13.6% of POS have no electricity;
9.2% of POS have no water;
37.1% of POS have no toilet based on a minimum standard type (Ventilated Improved Pit (VIP) or better);
30.6% of POS have 45 or more learners per education room on average1; and
78.3% of POS have no library.
It is clear that further investment is needed to ensure that all POS have basic infrastructure. But in order to develop an efficient strategy to tackle the backlog, and to shed light on the type of schools (and students) who are facing the worst physical environment, it is important to answer some basic questions as a starting point:
(i) Is infrastructure deprivation concentrated geographically (and, if so, which provinces and districts are worst affected)?
(ii) Is infrastructure deprivation related to school quintiles?
1 An education room is defined as classroom or multipurpose room or laboratory or computer room or technical room.
Infrastructure
9
(iii) Is infrastructure deprivation related to school size?
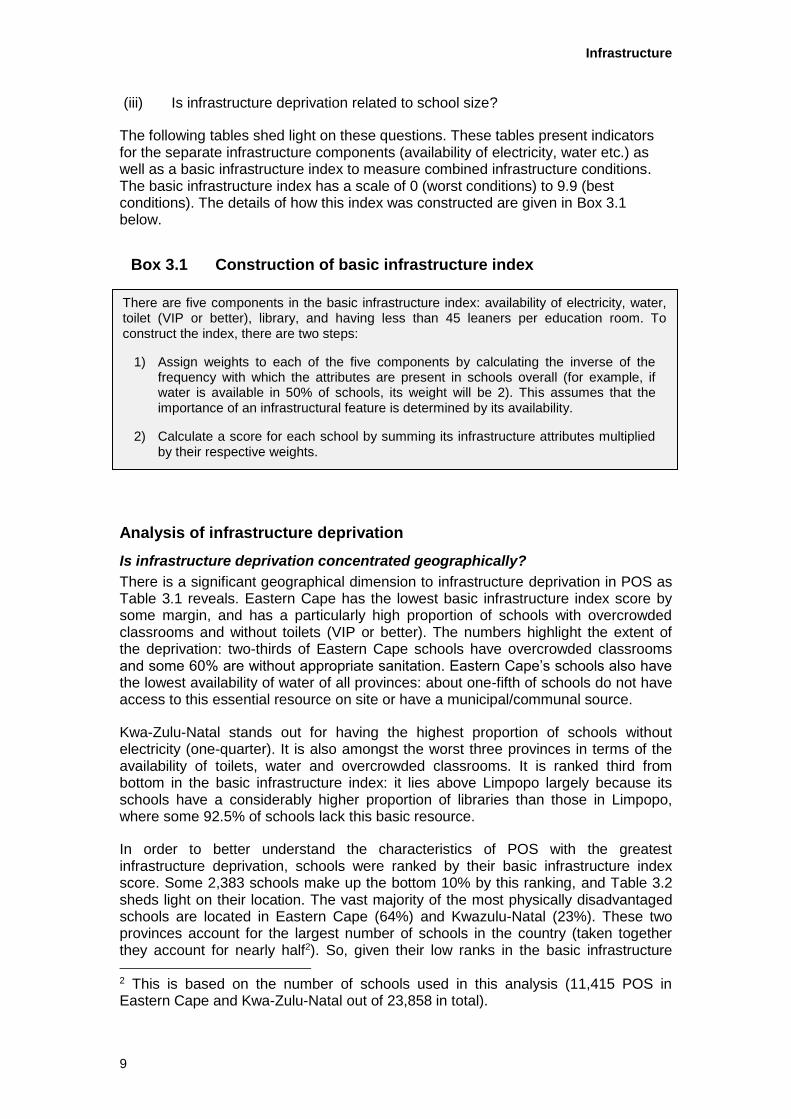
The following tables shed light on these questions. These tables present indicators for the separate infrastructure components (availability of electricity, water etc.) as well as a basic infrastructure index to measure combined infrastructure conditions. The basic infrastructure index has a scale of 0 (worst conditions) to 9.9 (best conditions). The details of how this index was constructed are given in Box 3.1 below.
Box 3.1 Construction of basic infrastructure index
Analysis of infrastructure deprivation
Is infrastructure deprivation concentrated geographically?
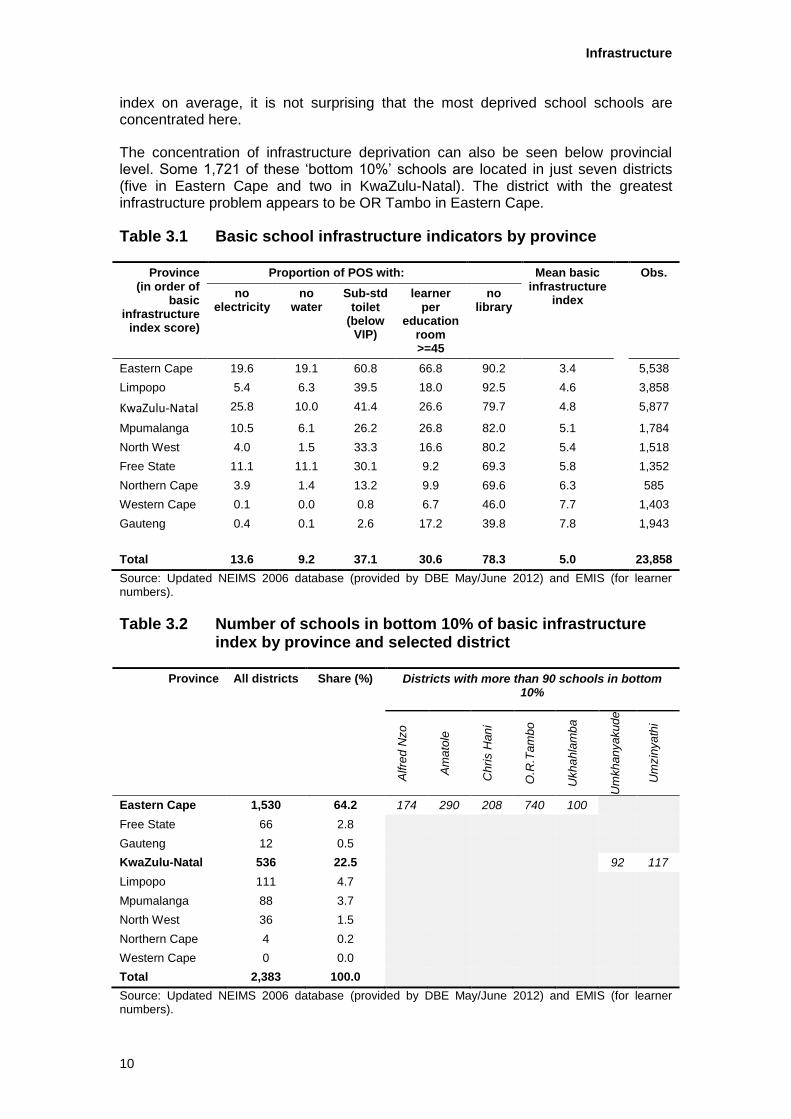
There is a significant geographical dimension to infrastructure deprivation in POS as Table 3.1 reveals. Eastern Cape has the lowest basic infrastructure index score by some margin, and has a particularly high proportion of schools with overcrowded classrooms and without toilets (VIP or better). The numbers highlight the extent of the deprivation: two-thirds of Eastern Cape schools have overcrowded classrooms and some 60% are without appropriate sanitation. Eastern Cape’s schools also have the lowest availability of water of all provinces: about one-fifth of schools do not have access to this essential resource on site or have a municipal/communal source.
Kwa-Zulu-Natal stands out for having the highest proportion of schools without electricity (one-quarter). It is also amongst the worst three provinces in terms of the availability of toilets, water and overcrowded classrooms. It is ranked third from bottom in the basic infrastructure index: it lies above Limpopo largely because its schools have a considerably higher proportion of libraries than those in Limpopo, where some 92.5% of schools lack this basic resource.
In order to better understand the characteristics of POS with the greatest infrastructure deprivation, schools were ranked by their basic infrastructure index score. Some 2,383 schools make up the bottom 10% by this ranking, and Table 3.2 sheds light on their location. The vast majority of the most physically disadvantaged schools are located in Eastern Cape (64%) and Kwazulu-Natal (23%). These two provinces account for the largest number of schools in the country (taken together they account for nearly half2). So, given their low ranks in the basic infrastructure 2 This is based on the number of schools used in this analysis (11,415 POS in Eastern Cape and Kwa-Zulu-Natal out of 23,858 in total).
There are five components in the basic infrastructure index: availability of electricity, water, toilet (VIP or better), library, and having less than 45 leaners per education room. To construct the index, there are two steps:
1) Assign weights to each of the five components by calculating the inverse of the frequency with which the attributes are present in schools overall (for example, if water is available in 50% of schools, its weight will be 2). This assumes that the importance of an infrastructural feature is determined by its availability.
2) Calculate a score for each school by summing its infrastructure attributes multiplied by their respective weights.
Infrastructure
10
index on average, it is not surprising that the most deprived school schools are concentrated here.
The concentration of infrastructure deprivation can also be seen below provincial level. Some 1,721 of these ‘bottom 10%’ schools are located in just seven districts (five in Eastern Cape and two in KwaZulu-Natal). The district with the greatest infrastructure problem appears to be OR Tambo in Eastern Cape.
Table 3.1 Basic school infrastructure indicators by province
Province (in order of
basic infrastructure
index score)
Proportion of POS with: Mean basic infrastructure
index
Obs.
no electricity
no water
Sub-std toilet
(below VIP)
learner per
education room >=45
no library
Eastern Cape 19.6 19.1 60.8 66.8 90.2 3.4 5,538
Limpopo 5.4 6.3 39.5 18.0 92.5 4.6 3,858
KwaZulu-Natal 25.8 10.0 41.4 26.6 79.7 4.8 5,877
Mpumalanga 10.5 6.1 26.2 26.8 82.0 5.1 1,784
North West 4.0 1.5 33.3 16.6 80.2 5.4 1,518
Free State 11.1 11.1 30.1 9.2 69.3 5.8 1,352
Northern Cape 3.9 1.4 13.2 9.9 69.6 6.3 585
Western Cape 0.1 0.0 0.8 6.7 46.0 7.7 1,403
Gauteng 0.4 0.1 2.6 17.2 39.8 7.8 1,943
Total 13.6 9.2 37.1 30.6 78.3 5.0 23,858
Source: Updated NEIMS 2006 database (provided by DBE May/June 2012) and EMIS (for learner numbers).
Table 3.2 Number of schools in bottom 10% of basic infrastructure index by province and selected district
Province All districts Share (%) Districts with more than 90 schools in bottom 10%
Alfre
d N
zo
Am
ato
le
Chri
s H
an
i
O.R
.Ta
mb
o
Ukh
ahla
mb
a
Um
kh
an
yakud
e
Um
zin
ya
thi
Eastern Cape 1,530 64.2 174 290 208 740 100
Free State 66 2.8
Gauteng 12 0.5
KwaZulu-Natal 536 22.5 92 117
Limpopo 111 4.7
Mpumalanga 88 3.7
North West 36 1.5
Northern Cape 4 0.2
Western Cape 0 0.0
Total 2,383 100.0
Source: Updated NEIMS 2006 database (provided by DBE May/June 2012) and EMIS (for learner numbers).
Infrastructure
11
Is infrastructure deprivation related to school quintiles?
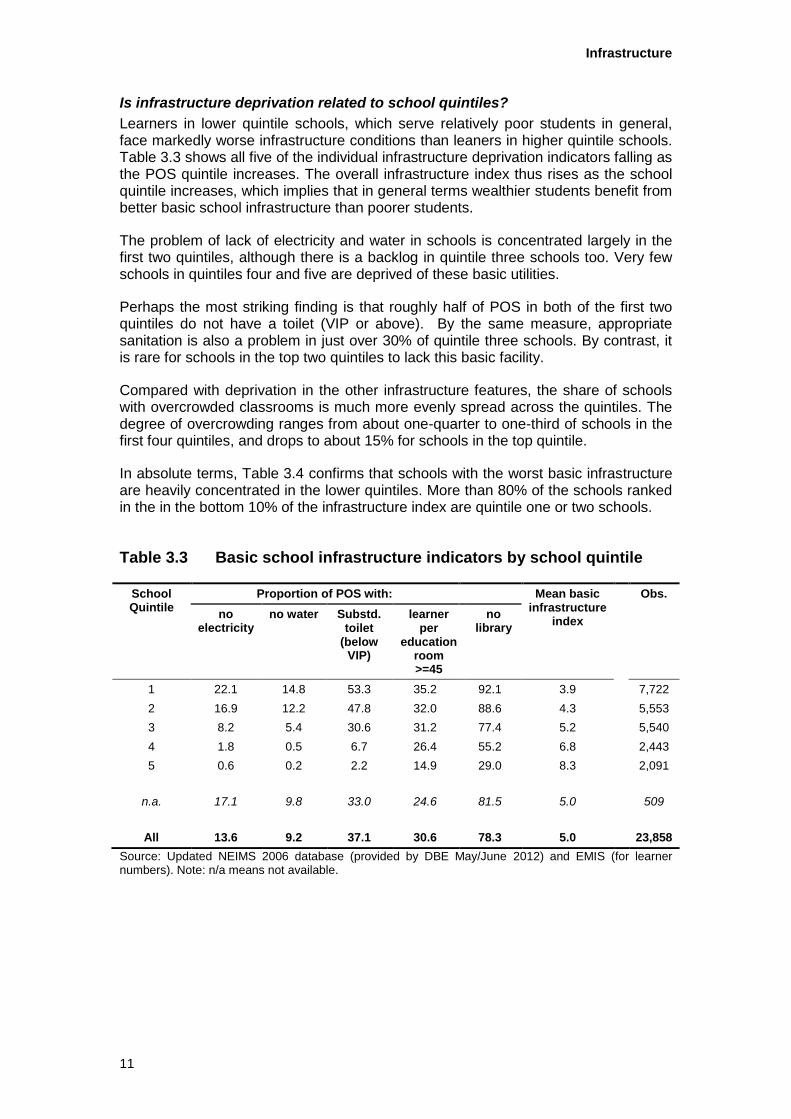
Learners in lower quintile schools, which serve relatively poor students in general, face markedly worse infrastructure conditions than leaners in higher quintile schools. Table 3.3 shows all five of the individual infrastructure deprivation indicators falling as the POS quintile increases. The overall infrastructure index thus rises as the school quintile increases, which implies that in general terms wealthier students benefit from better basic school infrastructure than poorer students.
The problem of lack of electricity and water in schools is concentrated largely in the first two quintiles, although there is a backlog in quintile three schools too. Very few schools in quintiles four and five are deprived of these basic utilities.
Perhaps the most striking finding is that roughly half of POS in both of the first two quintiles do not have a toilet (VIP or above). By the same measure, appropriate sanitation is also a problem in just over 30% of quintile three schools. By contrast, it is rare for schools in the top two quintiles to lack this basic facility.
Compared with deprivation in the other infrastructure features, the share of schools with overcrowded classrooms is much more evenly spread across the quintiles. The degree of overcrowding ranges from about one-quarter to one-third of schools in the first four quintiles, and drops to about 15% for schools in the top quintile.
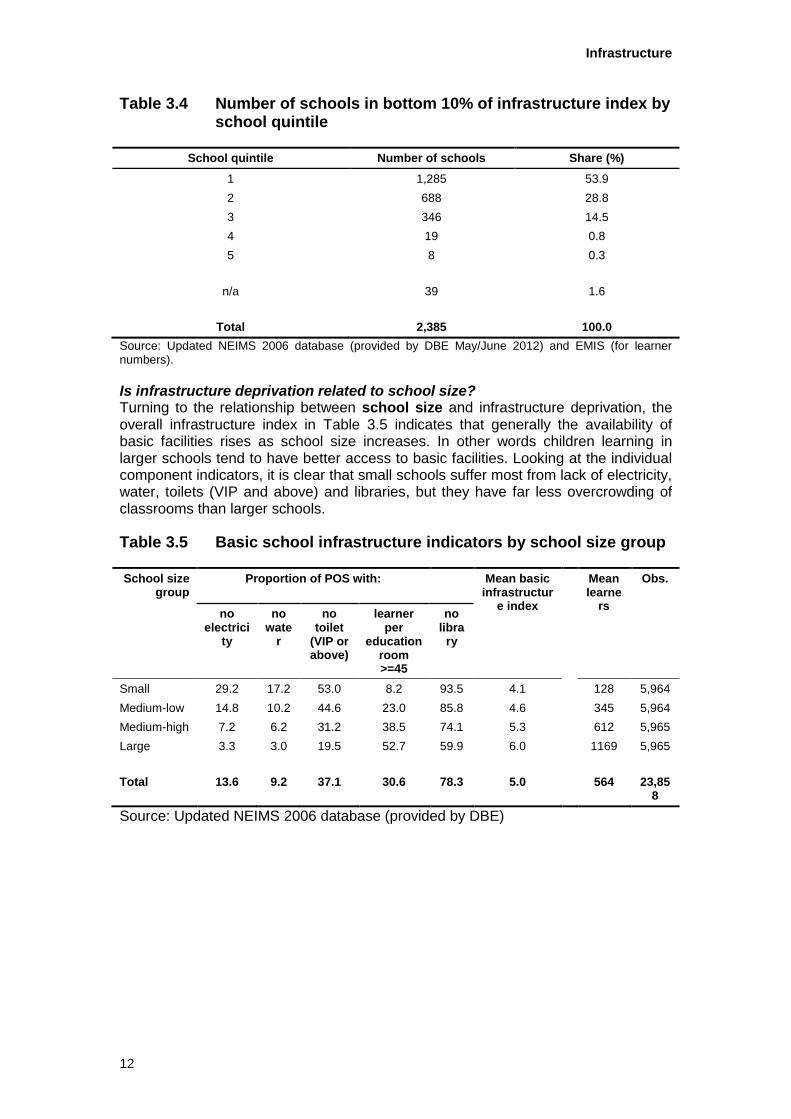
In absolute terms, Table 3.4 confirms that schools with the worst basic infrastructure are heavily concentrated in the lower quintiles. More than 80% of the schools ranked in the in the bottom 10% of the infrastructure index are quintile one or two schools.
Table 3.3 Basic school infrastructure indicators by school quintile
School Quintile
Proportion of POS with: Mean basic infrastructure
index
Obs.
no electricity
no water Substd. toilet
(below VIP)
learner per
education room >=45
no library
1 22.1 14.8 53.3 35.2 92.1 3.9 7,722
2 16.9 12.2 47.8 32.0 88.6 4.3 5,553
3 8.2 5.4 30.6 31.2 77.4 5.2 5,540
4 1.8 0.5 6.7 26.4 55.2 6.8 2,443
5 0.6 0.2 2.2 14.9 29.0 8.3 2,091
n.a. 17.1 9.8 33.0 24.6 81.5 5.0 509
All 13.6 9.2 37.1 30.6 78.3 5.0 23,858
Source: Updated NEIMS 2006 database (provided by DBE May/June 2012) and EMIS (for learner numbers). Note: n/a means not available.
Infrastructure
12
Table 3.4 Number of schools in bottom 10% of infrastructure index by school quintile
School quintile Number of schools Share (%)
1 1,285 53.9
2 688 28.8
3 346 14.5
4 19 0.8
5 8 0.3
n/a 39 1.6
Total 2,385 100.0
Source: Updated NEIMS 2006 database (provided by DBE May/June 2012) and EMIS (for learner numbers).
Is infrastructure deprivation related to school size? Turning to the relationship between school size and infrastructure deprivation, the overall infrastructure index in Table 3.5 indicates that generally the availability of basic facilities rises as school size increases. In other words children learning in larger schools tend to have better access to basic facilities. Looking at the individual component indicators, it is clear that small schools suffer most from lack of electricity, water, toilets (VIP and above) and libraries, but they have far less overcrowding of classrooms than larger schools.
Table 3.5 Basic school infrastructure indicators by school size group
School size group
Proportion of POS with: Mean basic infrastructur
e index
Mean learne
rs
Obs.
no electrici
ty
no wate
r
no toilet
(VIP or above)
learner per
education room >=45
no libra
ry
Small 29.2 17.2 53.0 8.2 93.5 4.1 128 5,964
Medium-low 14.8 10.2 44.6 23.0 85.8 4.6 345 5,964
Medium-high 7.2 6.2 31.2 38.5 74.1 5.3 612 5,965
Large 3.3 3.0 19.5 52.7 59.9 6.0 1169 5,965
Total 13.6 9.2 37.1 30.6 78.3 5.0 564 23,858
Source: Updated NEIMS 2006 database (provided by DBE)
Infrastructure
13
4 Reasons for continued inadequacy and inequality of infrastructure provisioning
From an Africa-wide perspective Theunynck (2009) has drawn attention to the following factors as leading to a lack of progress with infrastructure provisioning:
a lack of proper planning
a lack of clear and appropriate (planning) norms and resource allocation criteria
centralized planning and donors.
While limited donor involvement excludes that as a potential constraining factor in South Africa, the issue of how private initiative can be used more synergistically to support government aims is important in the light of significant philanthropic and business corporate responsibility support for schools.
The planning factor also comes up in Crouch and Patel’s (2006) assessment of South African constraints. They argue that the key factor in the South African case is capacity and not funding. With regard to capacity they argue that the problems lie in capacity for “higher order and strategic planning” and mostly at the “district and more local levels”. They also raised
A lack of clear guidelines and standards
A broader credibility or incentive problem.
The credibility/incentive problem is argued to arise from the fact that the national department (in some cases with the support of donors) intervenes regularly in response to high profile publicity or general unhappiness with the slowness of progress. This “taking over” by national could have led to provinces desisting from investing in permanent capacity. Examples are a major EU-funded school building project in poor provinces during 2004 to 2008, regular national initiatives to eradicate backlogs (“mud schools”; “schools under trees”) and currently a national drive for school building facilitated by the national department via the Development Bank of Southern Africa.
Crouch and Patel (2006) propose four components to a solution:
1. A more credible commitment to longer-term physical infrastructure and backlog elimination.
2. A clearer national policy on the issue including norms and standards.
3. Specification of capabilities needed in the provinces.
4. Training and certification.
They mention the establishment of a special fund or agency to drive backlog infrastructure provisioning as an option (in the light of the “morass of dysfunctionality”) but warn that this can lead to parallel structures (and presumably wastage and a further muddling of accountability) and could also be thwarted by the fundamental lack of capacity in these areas.
As mentioned, SAICE (2011) sees inadequate budgeting for school maintenance as the critical problems but they list further problems reported by stakeholders as such as lack of staff capacity, inequitable access to funding and maintenance programmes, and “a lack of respect.
Infrastructure
14
Moll (2008) in an analysis for the DoE also raised “insufficient capacity regarding physical planning and management” as the major reason for a lack of progress. Related to this he sees the large number of planning and implementing agents involved in infrastructure provisioning at the provincial level as problematic. The large number of actors led to “insufficient performance and ineffective reporting” and a lack of clarity between client department and their agents of what precisely needs to be delivered, by whom, when, and at what cost”.
As a result of considering the multiple institutions involved and accountability issues as central, Moll sees the solution lying in either enhancing “PEDs capacity to allow the direct contracting of consultants” or in creating “a flexible building implementing agency which is oriented to infrastructure delivery, supervises construction works directly on behalf of the client PED, and is ready to respond to changing tasks and workloads (probably through frequent consultancy inputs)”.
Infrastructure
15
5 Infrastructure institutions and responsibilities
The South African Schools Act (SASA) places the mandate for ensuring that there are adequate school places available to the provinces to the MEC of Education in the province: “Every Member of the Executive Council must ensure that there are enough school places so that every child who lives in his or her province can attend school”
The National Education Policy Act gives the national Minister, among other things, the authority to determine national policy with regard to a very wide range of areas (“the planning, provision, financing, staffing, co-ordination, management, governance, programmes, monitoring, evaluation and well-being of the education system” and specifically mentions “facilities”.)
Financing norms and standards in terms of the SASA has for a long time (under the heading “Scenario planning for new school construction”) underlined the responsibility of the MECs to ensure adequate school places and prescribed that provincial education departments must “(a) maintain an accurate, prioritised, annually updated database of school construction needs, and (b) undertake annually updated long-term projections of new school construction targets and funding requirements, based on these norms. The scenario planning should initially estimate the requirements to eliminate backlogs and provide sufficient school places by the target year …. “
The norms also prescribe that new schools or classrooms “should be targeted to the neediest in terms of “lack of current schools” and “overcrowding of existing ones” and require a targeting list with “a ranking of geographical areas from neediest to least needy, based on the numbers of children out of school or in existing crowded schools”.
While responsibility is therefore quite clear in terms of rules and regulations, reality is much more complex. As mentioned above, the DBE (and indeed other national departments such as Water Affairs, Public Works and national agencies such as ESCOM) has on numerous occasions intervened to address specific problems, “taking away” some of the provincial backlog.
In addition most education departments do not have the capacity or the authority to procure school construction. In most provinces they are dependent on implementing agents (mostly the Department of Public Work but also agencies such as the Independent Development Trust and Water Boards in some provinces). The education departments then hand over their implementation list to these implementing agents for procurement of professional teams (to finalise design, costing and procurement) and they procure and oversee assignments on behalf of the Department of Education. This limits the control and the accountability of the Department of Education. The relationship in one province (the Western Cape) was not seen as problematic and in other provinces there have been efforts to tighten the relationships between education departments and implementing agents through memoranda of understanding but until recently progress was slow.
Physical planning units in provinces are generally small (5-8 people headed by a director and responsible for physical planning) with the units centralised in some case and with a base in districts in other areas. The National Department is preparing a blueprint with staffing for Physical Planning Units.
Infrastructure
16
6 Recent Interventions and efforts
6.1 Policy development
In terms of the infrastructure policy vacuum identified by Crouch and Patel, there has been substantial progress over the last decade.
In June 2010 the Department published the National Policy for an Equitable Provision of an Enabling School Environment (June 2010). The policy:
Mandates the national minister to set norms and standards for the physical teaching and learning environment, distinguishing between 4 sets of standards: basic safety, minimum functionality, optimum functionality and enrichment. The DBE is instructed “to set clear target dates by which a set proportion of schools will meet each level of enablement”.
Requires standardisation of the “criteria and procedures for the identification and prioritisation of infrastructure needs” (define needs and identify gaps and prioritise).
Prescribes the development of national and provincial strategic plans (20 years/5 years and 1 year) and “recurrent planning instruments” (annual implementation plans, procurement plans, financial and disbursement plans) and “results frameworks” to guide monitoring and evaluation”.
Mandates the development of a policy on management and maintenance of infrastructure which will also include norms and standards for maintenance and allocation of responsibility for maintenance.
Commits the DBE to devolve “responsibility, authority and accountability for the provision of school infrastructure” to the school (“lowest feasible”) level, to vest all responsibility for infrastructure delivery with education departments and to develop a “comprehensive capacity development plan”.
In each case the policy describes background, identifies key challenges addressed, prior government effort in this regard and persistent challenges. It then describes the policy and identifies key policy actions and risks.
The policies cover critical areas and are especially useful in that their point of departure is that provisioning infrastructure is not merely about bricks and mortar but about norms, about prioritisation processes and about planning. In looking at prioritisation the need for extensive sources of quantitative data (demographics, current supply and so on) are raised clearly. In its 2011 Action Plan the DBE raised a number of remaining policy gaps, namely specifications with regard to moveable assets, “minimum specifications for the maintenance of infrastructure” and responses to destruction of infrastructure during emergencies and natural disaster.
National norms and standards were published for comment in 2008 but instead of finalised norms the Department published “Guidelines relating to planning for public school infrastructure” in May 2012. Norms and standards appear to have been softened to guidelines in order to deal with a threat of litigation.
The guidelines clearly respond to the first policy area above (minimum standards) and specify the spaces required in different sizes and types of schools (primary/secondary; small/medium/large) for minimum level of functioning and optimal levels of functioning, specify minimum and optimum size for different spaces
Infrastructure
17
and specify sanitation requirements (number of toilets per number of boy and girl learners). It also provides some essential definitions and factors to aim for in the planning and design of schools (such as feeder zones and walking distance, security, etcetera) and in some case what is not acceptable (unimproved pit latrines and bucket toilets).
Key areas where the guidelines are silent or address the matter in only a very limited way are standardising processes for determining needs and priorities (where the guidelines are much more limited than the planning stipulations in the financing norms and standards) and around maintenance. The guidelines are also silent on the devolution of responsibility for maintenance to schools and on vesting all accountability with education departments – areas on which the policy took a very strong stance.
6.2 Information and monitoring
Determination of needs, prioritisation and planning requires a strong information base. In this regard the National Education Infrastructure Management System – an audit of all provincial infrastructure assets in 2006 – provided an advance on previous efforts. The assessment of infrastructure was more detailed and systematic (allowing for a sophisticated costing model to be developed) and a more comprehensive and accessible database was developed, together with tools such as maps/GIS and costing. Individual school records can now be web-accessed through the State Information Technology Agency. Data are, however, at the moment not being updated systematically on a regular basis. Some provinces seem to have updated their information quite extensively since 2006 (although it is not clear on the basis of what instruments or process) while for other provinces there has not been much updating. The result is that for some provinces the database reflects the situation in 2006 and for others up to more recently.
The implications are that the database does not reflect the situation at any given time any longer and also that it cannot be used to track progress (except perhaps for one or two provinces, but even here to little is known about the basis for updating.) EMIS also does not collect any data on infrastructure which could have been an alternative source for assessing progress.
While there is therefore much better information on schools than before 2006, the data are ageing and becoming less useful for planning and monitoring purposes.
6.3 Capacity
National Treasury’s Infrastructure Development Improvement Plan (IDIP) has for some time supported the development of capacity in provincial departments for infrastructure planning, including in education departments. The IDIP has mapped and made proposals for streamlining infrastructure processes through the Infrastructure Delivery and Budget Cycle Alignment Model, developed an IDIP Toolkit and placed provincial technical assistance teams in provincial departments to support the development of processes and capacity. It has not been possible for this report to access assessments of impact in education departments over the life of the project.
The National Policy for the Physical Teaching and Learning Environment requires the DBE (by 2010) to have “prepared an implementation plan for the training of physical planners”. This is not in place yet and guidelines on structures of physical planning units are still under development.
Infrastructure
18
6.4 Special programmes
On a number of occasions, various departments from national government have intervened to assist with eradicating infrastructure backlogs.
One of the national programmes is the on-going eradication of electricity backlogs led by ESCOM with joint funding by the National Electrification Fund (Eskom 2011). In 2011 Eskom reported that 11,600 schools had been electrified between 1991 and 2011, tallying roughly with the decline in the number of schools without electricity according to NEIMS. There is little systematic public information available on the Eskom electrification drive and also on other programmes driven by the Department of Water Affairs (water and sanitation in schools) and the national Department of Public Works (mud schools).
During 2004 to 2009 the national Department of Education established an implementation unit to drive infrastructure improvement in three provinces (Eastern Cape, KwaZulu-Natal and Limpopo) with substantial funding from the European Commission. The project finally led to the provision of 140 classrooms, 435 toilets and 65 nutrition centres in 21 schools. Because of a number of funding and procurement issues only a fraction of the intended number of upgrades were made.
While extensive information is not available, some of the national programmes can support arguments for centralisation of an infrastructure drive but others seem to have been less successful.
As noted above, the DBE in 2011 launched the Accelerated Schools Infrastructure Delivery Initiative (ASIDI) Programme. The DBE has described the programme as being focused on: providing basic services to bring schools to the level of “Basic Safety Functionality”, bring all 395 mud schools in the Eastern Cape to “Optimum Functionality”, replace all inappropriate structures and “upgrade schools to “optimum functionality” by providing core spaces. An implementation unit has been established in the national department to drive the strategy with the funding for the project flowing through the DBE and the Development Bank of Southern Africa, which is providing support with procurement of contractors.
Infrastructure
19
6.5 Funding infrastructure
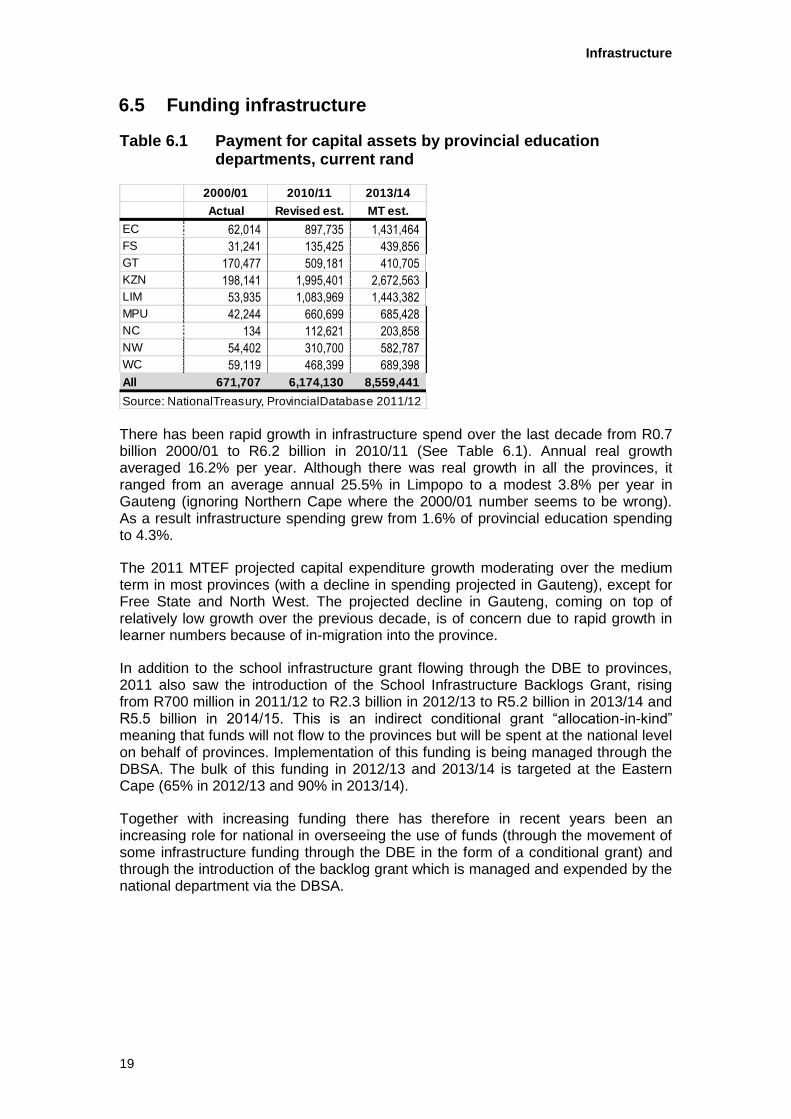
Table 6.1 Payment for capital assets by provincial education departments, current rand
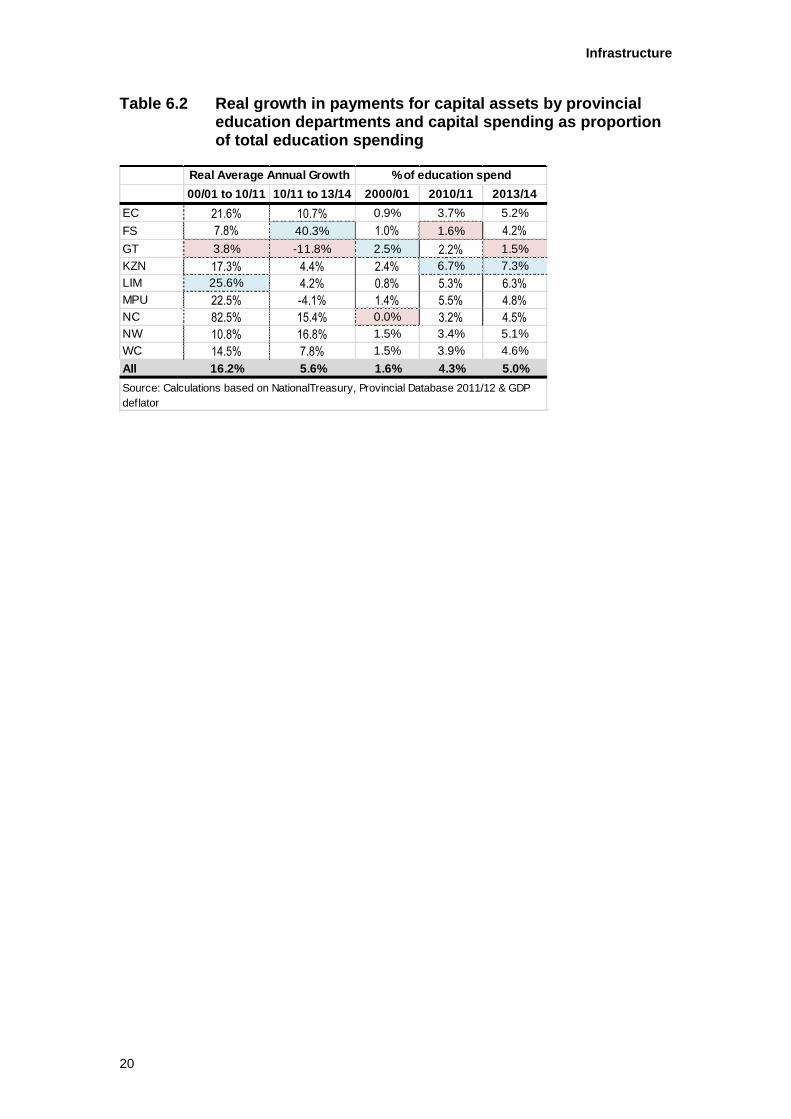
There has been rapid growth in infrastructure spend over the last decade from R0.7 billion 2000/01 to R6.2 billion in 2010/11 (See Table 6.1). Annual real growth averaged 16.2% per year. Although there was real growth in all the provinces, it ranged from an average annual 25.5% in Limpopo to a modest 3.8% per year in Gauteng (ignoring Northern Cape where the 2000/01 number seems to be wrong). As a result infrastructure spending grew from 1.6% of provincial education spending to 4.3%.
The 2011 MTEF projected capital expenditure growth moderating over the medium term in most provinces (with a decline in spending projected in Gauteng), except for Free State and North West. The projected decline in Gauteng, coming on top of relatively low growth over the previous decade, is of concern due to rapid growth in learner numbers because of in-migration into the province.
In addition to the school infrastructure grant flowing through the DBE to provinces, 2011 also saw the introduction of the School Infrastructure Backlogs Grant, rising from R700 million in 2011/12 to R2.3 billion in 2012/13 to R5.2 billion in 2013/14 and R5.5 billion in 2014/15. This is an indirect conditional grant “allocation-in-kind” meaning that funds will not flow to the provinces but will be spent at the national level on behalf of provinces. Implementation of this funding is being managed through the DBSA. The bulk of this funding in 2012/13 and 2013/14 is targeted at the Eastern Cape (65% in 2012/13 and 90% in 2013/14).
Together with increasing funding there has therefore in recent years been an increasing role for national in overseeing the use of funds (through the movement of some infrastructure funding through the DBE in the form of a conditional grant) and through the introduction of the backlog grant which is managed and expended by the national department via the DBSA.
2000/01 2010/11 2013/14
Actual Revised est. MT est.
EC 62,014 897,735 1,431,464
FS 31,241 135,425 439,856
GT 170,477 509,181 410,705
KZN 198,141 1,995,401 2,672,563
LIM 53,935 1,083,969 1,443,382
MPU 42,244 660,699 685,428
NC 134 112,621 203,858
NW 54,402 310,700 582,787
WC 59,119 468,399 689,398
All 671,707 6,174,130 8,559,441
Source: NationalTreasury, ProvincialDatabase 2011/12
Infrastructure
20
Table 6.2 Real growth in payments for capital assets by provincial education departments and capital spending as proportion of total education spending
00/01 to 10/11 10/11 to 13/14 2000/01 2010/11 2013/14
EC 21.6% 10.7% 0.9% 3.7% 5.2%
FS 7.8% 40.3% 1.0% 1.6% 4.2%
GT 3.8% -11.8% 2.5% 2.2% 1.5%
KZN 17.3% 4.4% 2.4% 6.7% 7.3%
LIM 25.6% 4.2% 0.8% 5.3% 6.3%
MPU 22.5% -4.1% 1.4% 5.5% 4.8%
NC 82.5% 15.4% 0.0% 3.2% 4.5%
NW 10.8% 16.8% 1.5% 3.4% 5.1%
WC 14.5% 7.8% 1.5% 3.9% 4.6%
All 16.2% 5.6% 1.6% 4.3% 5.0%
Source: Calculations based on NationalTreasury, Provincial Database 2011/12 & GDP
deflator
Real Average Annual Growth % of education spend
Infrastructure
21
7 Conclusions and recommendations
Over the last 5 years there has been significant activity in the school infrastructure sphere. This ranges from improving the information base on infrastructure trough NEIMS, putting in place a comprehensive, high-level policy on infrastructure with guidelines on key design and planning issues and launching a national initiative, ASIDI or the Accelerated School Infrastructure Delivery Initiative Progress, for eradicating backlogs, mostly in the Eastern Cape.
Nonetheless there is not good tracking of progress (or the absence thereof) and a sense remains of progress being limited and rather ad hoc and not sustained. The long-standing concerns around maintenance seem not to have been addressed although some provinces now identify maintenance budgets more clearly.
Part of the reason for slow progress is no doubt that infrastructure provision is a complex area requiring fairly sophisticated planning and long lead times – and where capacity has been lost or never existed it will take time to develop. However, a growing proportion of education funds is being invested in school infrastructure and the absence of clear plans and the ability to track and evaluate progress raise serious concerns about potential inefficiencies and lack of value for money.
In a complex area, the following areas seem to need attention:
1) National responses to pressure in the area of infrastructure often focus on addressing the symptom (school under trees, mud schools, overcrowded schools) and not the underlying causes (information, funding, capacity and processes in provinces). As a result these problems will recur, and potentially become more severe as provincial functionaries are disincentivised and disempowered.
2) The National Policy of 2010 is an ambitious policy and significant resources should be allocated to developing implementation plans and the capacity to implement. If not the department could face further litigation for not implementing its own policy in a number of areas (capacity plans, norms and standards, prototype plans, publication of plans) and also face the demise of a sensible if ambitious policy.
3) Three priority areas in the National Policy which should move towards implementation are
a. Standardisation of the “criteria and procedures for the identification and prioritisation of infrastructure needs”. (Define needs and identify gaps and prioritise). As long as these processes are not improved there will continue to be wastage as unnecessary or lower priority infrastructure works are undertaken and also inequity as less urgent projects are undertaken at the expense of the poor and marginalised. (This is an area which has long been a mandate in the school funding norms and some investigation is necessary to see why there has not been progress and what the obstacles are.)
b. Spending substantially on new infrastructure while routine maintenance is not budgeted and undertaken means that the country will never catch up as the capital stock deteriorates. It is therefore
Infrastructure
22
urgent to develop guidelines for maintenance, effective processes to maintain and monitoring mechanisms.
c. Developing standards and an implementation strategy for the range of planning instruments that should be utilised.
4) Information and monitoring remain significant issues and the regular updating of infrastructure data – about facilities as well as processes such as maintenance – requires urgent attention. An incentive-compatible and effective mechanism for updating information and tracking could be the development of a SA-Sams infrastructure module with monitoring information flowing through the LURITS system. This will spread the substantial LURITS cost over a wider range of activities and also remove the need for very expensive regular censuses of infrastructure.
Infrastructure
23
References
Crouch, L. and Patel, F. (2006). Whither SA’s education investment? Paper presented at the DBSA/HSRC/Wits NEPAD Conference “Investment Choices for Education in Africa” September 19-21 2006, Johannesburg.
DBE (2010). National Policy for an Equitable Provision of an Enabling School Environment. Pretoria: Department of Basic Education
DBE (2011) Action Plan 2014 (Full version). Pretoria: Department of Basic Education
DBE (2012). Guidelines Relating to Planning for Public School Infrastructure. Pretoria: Department of Education.
DoE (2008). Notice 1439 of 2008, National Minimum Uniform Norms and Standards for School Infrastructure (for public comment). Pretoria: Department of Education.
Eskom Holdings Limited (2011). The Eskom Factor 2011
Moll, D (2007). Efficiency Assessment of the School Infrastructure Delivery System in South Africa. RTI/USAID report to the Department of Education.
South African Institute of Civil Engineering (2011). Infrastructure Report Card for South Africa – 2011. Halfway House: SAICE.
Theunynck, S (2009). School construction strategies for universal primary education in Africa? Should communities be empowered to build their schools? Washington D.C., World Bank.
http://ec.europa.eu/europeaid/documents/case-studies/south_africa_education_school_infrastructure_en.pdf