Embed Size (px)
Citation preview
PUBLIC DOCUMENT – TRADE SECRET INFORMATION REDACTED–
PUBLIC DATA
Direct Testimony and Schedules Ruth K. Lowenthal
Before the Minnesota Public Utilities Commission State of Minnesota
In the Matter of the Application of Northern States Power Company for Authority to Increase Rates for Electric Service in Minnesota
Docket No. E002/GR-15-826 Exhibit___(RKL-1)
Employee Compensation and Benefits
November 2, 2015
PUBLIC DOCUMENT – TRADE SECRET INFORMATION REDACTED –
PUBLIC DATA
Table of Contents I. Introduction 1
II. Total Rewards Recovery Request Overview 5
III. Our Compensation and Benefit Levels are at or Below Market Levels
10
A. Total Cash Compensation Study 11
B. Health, Welfare and Retirement Benefits Study 17
IV. Total Rewards Program Cost Mitigation Measures and Resource Realignment
19
A. Cost Mitigation Measures 19
B. Resource Realignment 26
V. Resulting Challenges 30
A. Hiring Challenges 32
B. Retention Challenges 39
C. Emerging Issues Affecting Hiring and Retention Challenges 41
VI. Total Cash Compensation 44
A. Base Salary 45
B. AIP 48
C. Spot On Award Recognition Program 64
VII. Active Health and Welfare Costs 67
VIII. Employee Retirement Programs 74
A. Defined Benefit Plan 75
B. Defined Contribution Plan 82
C. Retiree Medical Benefits 84
IX. Conclusion 86
i Docket No. E002/GR-15-826 Lowenthal Direct

PUBLIC DOCUMENT – TRADE SECRET INFORMATION REDACTED –
PUBLIC DATA
Schedules
Statement of Qualifications Schedule 1
Total Rewards Program Components and Costs Schedule 2
Towers Watson Compensation Study (Non-Public) Schedule 3
Towers Watson BENVAL® Study (Non-Public) Schedule 4
Retirement Program Summary Schedule 5
2013, 2014 and 2015 AIP Documents Schedule 6
Dental, Vision, Life Insurance, and Disability Summary Schedule 7
Prefiled Discovery (Non-Public) Appendix A
ii Docket No. E002/GR-15-826 Lowenthal Direct
PUBLIC DOCUMENT – TRADE SECRET INFORMATION REDACTED –
PUBLIC DATA
I. INTRODUCTION 1
2
Q. PLEASE STATE YOUR NAME AND OCCUPATION. 3
A. My name is Ruth K. Lowenthal. I am the Vice President, Total Rewards for 4
Xcel Energy Services Inc. 5
6
Q. PLEASE SUMMARIZE YOUR QUALIFICATIONS AND EXPERIENCE. 7
A. As Vice President of Total Rewards, I oversee Total Rewards (Compensation, 8
Employee Benefits for Retirement and Health and Welfare), Payroll, HR 9
Operations, Talent Management and Recognition. My statement of 10
qualifications is included as Exhibit___(RKL-1), Schedule 1. 11
12
Q. WHAT IS THE PURPOSE OF YOUR TESTIMONY IN THIS PROCEEDING? 13
A. I support Northern States Power Company’s (NSPM or the Company) 14
request to recover in electric rates the costs associated with our employee 15
compensation and benefits, which are elements of the Company’s Total 16
Rewards Program. 17
18
Q. ARE YOU PROVIDING ANY INFORMATION IN RESPONSE TO THE COMMISSION’S 19
MAY 8, 2015 ORDER IN DOCKET NO. E002/GR-13-868? 20
A. Yes. In compliance with Order Point 29 I discuss Key Performance 21
Indicators (KPI) for purposes of our Annual Incentive Program (AIP). 22
23
Q. DO YOU PROVIDE ANY ADDITIONAL INFORMATION RELATED TO 24
COMPENSATION AND BENEFITS? 25
1 Docket No. E002/GR-15-826 Lowenthal Direct
PUBLIC DOCUMENT – TRADE SECRET INFORMATION REDACTED –
PUBLIC DATA
A. Yes. To prepare testimony for this case, we reviewed the discovery related to 1
compensation and benefits from Docket No. E002/GR-13-868. I have 2
incorporated some of those discovery responses into my testimony through 3
expanded discussion and schedules. We are also providing additional 4
information in the form of pre-filed discovery, which can be found in 5
Appendix A to my testimony. Appendix A also provides a list of each 6
information request from the 2013 rate case that we have incorporated into 7
this case, indicating where it is included in my testimony or schedules, or if it 8
is provided in Appendix A. 9
10
Q. PLEASE PROVIDE A SUMMARY OF YOUR TESTIMONY. 11
A. Our Total Rewards Program is of the utmost importance to our employees 12
and customers as these compensation and benefit costs are necessary to 13
attract, motivate, and retain the talent necessary to keep the lights on. Thus, it 14
is critical we recover the full amount of costs requested in this case. We have 15
taken internal cost mitigation measures, we have realigned resources, and, as 16
we have done in previous cases, we have limited our Total Rewards Program 17
cost recovery request in this case. We are not asking for recovery of any 18
amounts that the Commission has previously found to be unreasonable, and 19
our request is consistent with Commission precedent. For instance, we are 20
not seeking recovery of several elements of compensation that we will pay, 21
including a portion of our AIP costs, long-term incentive, nuclear retention, 22
and non-qualified pension expense. 23
24
As evidenced by our most recent Towers Watson survey discussed below, 25
even with AIP our total cash compensation levels are in line with, or slightly 26
2 Docket No. E002/GR-15-826 Lowenthal Direct
PUBLIC DOCUMENT – TRADE SECRET INFORMATION REDACTED –
PUBLIC DATA
below, the market. And if AIP were excluded (or, an employee did not earn 1
100 percent of their AIP) our total cash compensation would lag the market 2
by 14.7 percent. 3
4
Because of our limited requests and disallowances in prior cases, we have not 5
recovered all of the costs necessary to attract, motivate, and retain our 6
valuable employees. For instance, we have recovered less than 65 percent of 7
the AIP costs we have actually paid to employees over the past ten years. 8
Our expectation as a business is to provide safe and reliable service for our 9
customers. We are requesting to recover the costs necessary to allow the 10
Company to maintain and invest in our most important internal assets, our 11
employees. The consistent reductions and disallowances we continually 12
encounter are eroding our ability to pay for reasonable and necessary 13
compensation and benefit expenses. We cannot continue to pay at or below 14
market levels, make internal cost cuts year over year, request less than our full 15
cost of doing business in each rate case, and receive additional disallowances 16
on top of that. This pattern of under-recovery is not sustainable, and the 17
results would not be good for our customers or employees. 18
19
While many of the challenges associated with under-recovery of these costs 20
are familiar, like recruiting and retention, we are also seeing new issues 21
emerging. For instance, STEM (science, technology, engineering and math) 22
job openings are increasing while the corresponding skilled labor force is not. 23
As discussed below, we have a great need for job candidates in the STEM 24
category in our business, yet the job pool does not meet that demand. 25
26
3 Docket No. E002/GR-15-826 Lowenthal Direct
PUBLIC DOCUMENT – TRADE SECRET INFORMATION REDACTED –
PUBLIC DATA
Another contributing problem lies in the transition from baby boomers to 1
millennials and the difference in expectations between the generations. For 2
example, millennials are characterized by desiring quick career progression, 3
whereas most of our jobs require years of skill-building and on-the-job 4
training before career advancement is possible. Millennials also seem to 5
desire higher compensation and benefit levels at the outset than previous 6
generations, and our below-average compensation package impairs our ability 7
to compete for those employees with other companies who pay at or above 8
market compensation levels. While we are currently able to offer our new 9
employees health and welfare benefits generally comparable to our industry 10
peers, our new hire retirement benefit is significantly lower than our peers. 11
Although we made cost-saving changes to our retirement program, it puts us 12
at a disadvantage when we are trying to attract new candidates. 13
14
Finally, we are also affected by the fact that there are more people leaving the 15
workforce than joining it due to the lower birth rates after the baby boomer 16
generation. This means that not only are there fewer people to choose from 17
when selecting candidates, but even less of the population now has the 18
developed skills we need for many of our positions. 19
20
Despite these ongoing and emerging challenges, we have made efforts to 21
mitigate costs and use our resources more strategically in support of our 22
operational goals. Our mitigation efforts include elimination of the option for 23
employees to buy or sell Paid Time Off (PTO), a distinction between 24
dependent and employee healthcare coverage (and the provision of greater 25
4 Docket No. E002/GR-15-826 Lowenthal Direct
PUBLIC DOCUMENT – TRADE SECRET INFORMATION REDACTED –
PUBLIC DATA
coverage to employees), and the addition of new requirements that will limit 1
our exposure to increasing pharmacy costs. 2
3
In addition to our cost mitigation efforts, we have also made a concerted 4
effort to use our resources more strategically. For instance, while we have 5
always made it our goal to provide market-competitive compensation that is 6
linked to performance, we continue to place greater emphasis on 7
strengthening the link between employee pay and performance, thereby 8
providing larger rewards to our highest performers. This has not affected our 9
overall need for compensation levels; it merely targets our resources more 10
strategically. We view this as a positive move for our customers that should 11
be supported by the Commission and others, as it rewards performance. 12
13
When combining these challenges with our resource realignment efforts, and 14
the under-recovery of our costs, it is evident that we simply do not have the 15
capacity to absorb any further disallowance of our costs without making 16
significant changes to our Total Rewards Program. Considering the previous 17
cuts to our existing programs, the fact that we pay at, or below, market levels, 18
and the fact that we do not recover all of the costs we actually do pay, we 19
need every dollar requested to continue to be successful in the future. 20
21
II. TOTAL REWARDS RECOVERY REQUEST OVERVIEW 22
23
Q. WHAT ARE THE ELEMENTS OF THE TOTAL REWARDS PROGRAM? 24
A. The Total Rewards Program includes the following components of 25
compensation and benefits: 26
5 Docket No. E002/GR-15-826 Lowenthal Direct
PUBLIC DOCUMENT – TRADE SECRET INFORMATION REDACTED –
PUBLIC DATA
• Total Cash Compensation consisting of our base salary, the Annual 1
Incentive Program (AIP), and a non-exempt recognition program. 2
• Active health and welfare programs primarily consisting of medical, 3
pharmacy, dental, disability, vision, and life insurance coverage for our 4
employees and their families, plus employee long-term disability and 5
workers’ compensation. 6
• Retirement Program consisting of a defined benefit pension plan, a 7
defined contribution 401(k) savings plan, and retiree medical benefits 8
for employees who retired prior to the year 2000. 9
10
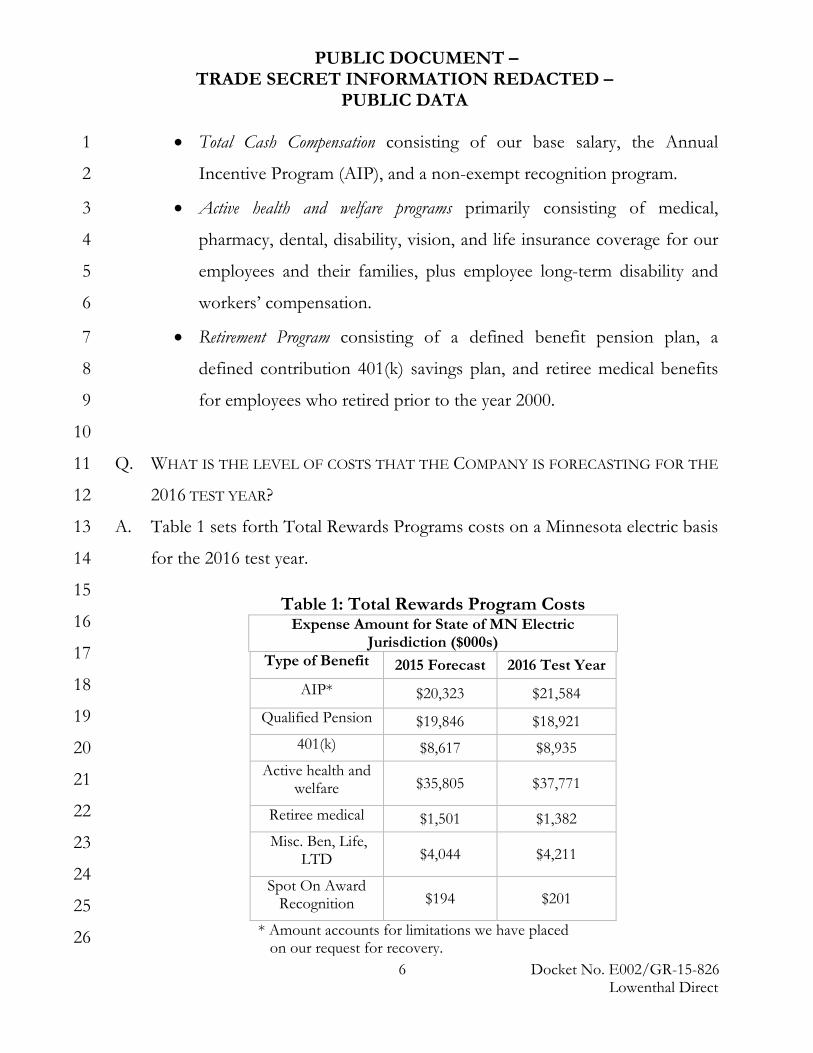
Q. WHAT IS THE LEVEL OF COSTS THAT THE COMPANY IS FORECASTING FOR THE 11
2016 TEST YEAR? 12
A. Table 1 sets forth Total Rewards Programs costs on a Minnesota electric basis 13
for the 2016 test year. 14
15
16
17
18
19
20
21
22
23
24
25
26
Table 1: Total Rewards Program Costs Expense Amount for State of MN Electric
Jurisdiction ($000s) Type of Benefit 2015 Forecast 2016 Test Year
AIP* $20,323 $21,584 Qualified Pension $19,846 $18,921
401(k) $8,617 $8,935 Active health and
welfare $35,805 $37,771
Retiree medical $1,501 $1,382 Misc. Ben, Life,
LTD $4,044 $4,211
Spot On Award Recognition $194 $201
* Amount accounts for limitations we have placed on our request for recovery.
6 Docket No. E002/GR-15-826 Lowenthal Direct
PUBLIC DOCUMENT – TRADE SECRET INFORMATION REDACTED –
PUBLIC DATA
1 Q. HOW DO THOSE TEST YEAR AMOUNTS COMPARE TO ACTUAL TOTAL REWARDS 2
PROGRAM COSTS IN PRIOR YEARS AS WELL AS THE 2016 TEST YEAR? 3
A. The actual amounts of Total Rewards Program costs for prior years and the 4
2016 test year, segregated by capital and expense, are set forth in 5
Exhibit___(RKL-1), Schedule 2. 6
7
Q. WHAT IS THE LEVEL OF O&M EXPENSE THAT HUMAN RESOURCES SEEKS TO 8
RECOVER FOR THE 2017 AND 2018 PLAN YEARS? 9
A. Our Total Rewards Program forecasted 2017 and 2018 increases in O&M 10
expenses are set forth in the “budget walk forwards” in Volume 6 of the 11
Company’s initial rate case filing. Company witness Mr. Aakash H. 12
Chandarana explains the basis of the Company’s overall approach to its O&M 13
expense requests for the 2017 and 2018 Plan Years, and Company witnesses 14
Mr. Charles R. Burdick and Mr. John Mothersole explain the basis for the 15
Company’s selection of the particular factors used in our rate requests for 16
these years. 17
18
Q. IS THE COMPANY SEEKING TO INCLUDE ALL OF THE COSTS OF THE TOTAL 19
REWARDS PROGRAM IN ITS TEST YEAR COST OF SERVICE? 20
A. No. We are not requesting rate recovery of the following elements of 21
employee compensation: 22
• Long-term incentive compensation costs; 23
• Nuclear retention program costs; 24
• Non-qualified pension benefits; and 25
• Certain pension benefits for senior executives. 26
7 Docket No. E002/GR-15-826 Lowenthal Direct
PUBLIC DOCUMENT – TRADE SECRET INFORMATION REDACTED –
PUBLIC DATA
In addition, we have limited our request for AIP recovery. 1
2
Q. HOW HAVE YOU LIMITED YOUR AIP COST RECOVERY REQUEST? 3
A. We have limited our request for AIP cost recovery in several ways, consistent 4
with previous rate cases and Commission precedent. First, we are requesting 5
rate recovery of our incentive compensation costs subject to a four-year 6
average payout of AIP – capped at 100 percent performance target and 7
limited to a cap of 15 percent of base salary. Therefore, customers are not 8
funding the full cost of employee compensation. This cap not only 9
implements the Commission’s original intent1 of excluding recovery of part of 10
the incentive compensation costs related to executives, but it also excludes 11
recovery of part of the incentive compensation paid to middle management 12
employees as part of their total compensation package. 13
14
Second, we are proposing to retain the refund mechanism that would provide 15
customer refunds if actual incentive compensation payouts are lower than the 16
test year level approved in rates. By including this previously approved 17
Commission safeguard, we are able to balance the interests of our customers 18
while providing our employees with market-competitive cash compensation. 19
20
Finally, we request recovery of only the target level incentive amount, so if 21
our employees perform beyond their specific goal targets and the Company’s 22
operational goals, our customers receive this added benefit at no extra cost. 23
Please see the testimony of Company witness Ms. Anne E. Heuer for a 24
25
1 Docket Nos. E002/GR-92-1185 and G002/GR-92-1186. 8 Docket No. E002/GR-15-826
Lowenthal Direct

PUBLIC DOCUMENT – TRADE SECRET INFORMATION REDACTED –
PUBLIC DATA
description of this AIP adjustment. 1
2
Q. YOU MENTIONED THAT YOU ARE NOT SEEKING RECOVERY OF THE NUCLEAR 3
RETENTION PROGRAM COSTS IN THIS CASE. IS THIS PROGRAM STILL 4
ONGOING? 5
A. Yes. As discussed further by Company witness Mr. Timothy J. O’Connor, we 6
are not seeking recovery of nuclear retention program costs (approximately 7
$900,000 in 2016) in this case to limit the number of contested issues. 8
However, these costs remain critical to attracting and retaining quality nuclear 9
employees in the current marketplace, and we will continue to incur these 10
costs in 2016 and beyond. 11
12
Q. ARE YOU SEEKING RECOVERY OF ANY COSTS FOR LONG-TERM INCENTIVE 13
(LTI) COMPENSATION? 14
A. No. Similar to our nuclear retention program, while we continue to offer this 15
program to our employees and believe it is imperative to attracting and 16
retaining these employees, we are not requesting recovery of the LTI costs in 17
this case to limit the number of contested issues. 18
19
Q. ARE YOU SEEKING RECOVERY OF COSTS FOR ALL OF THE COMPANY’S 20
EMPLOYEE RETIREMENT PLANS? 21
A. No. Though we have previously asked for recovery of these costs, in order to 22
minimize the disputed issues and be consistent with previous Commission 23
precedent, we are not seeking recovery of the Supplemental Executive 24
Retirement Plan (SERP) or non-qualified pension costs in this case, even 25
though these benefits are an important part of a Total Rewards Program 26
9 Docket No. E002/GR-15-826 Lowenthal Direct
PUBLIC DOCUMENT – TRADE SECRET INFORMATION REDACTED –
PUBLIC DATA
package that gives us the ability to attract and retain the right management 1
talent necessary for our business. 2
3
Q. WHAT DO YOU CONCLUDE ABOUT YOUR TOTAL REWARDS PROGRAM COST 4
RECOVERY REQUEST IN THIS CASE? 5
A. While all of the Total Rewards Program components are necessary to attract 6
and retain our valued employees, we have made a concerted effort to 7
minimize the issues at dispute in this case and to keep our request consistent 8
with Commission precedent and previous rate cases. 9
10
III. OUR COMPENSATION AND BENEFIT LEVELS ARE AT OR 11 BELOW MARKET LEVELS 12
13
Q. DO ANY INDEPENDENT STUDIES DEMONSTRATE THAT THE COMPANY’S 14
TOTAL REWARDS PROGRAM IS CONSISTENT WITH MARKET VALUES? 15
A. Yes. Although I am not aware of a single study that compares the entire array 16
of cash compensation, health and welfare benefits, and retirement benefits 17
among companies, we have an independent study from Towers Watson 18
showing the reasonableness of the Company’s total cash compensation. We 19
have another independent study showing the reasonableness of the 20
Company’s health and welfare benefits and retirement benefits. I provide 21
both of these studies as Exhibit___(RKL-1), Schedules 3 and 4, respectively. 22
Together, these studies demonstrate that the Company’s Total Rewards 23
Program is reasonable. 24
25
Q. WHY DOESN’T THE COMPANY USE A SINGLE STUDY TO COMPARE TOTAL CASH 26
COMPENSATION AND BENEFIT PROGRAMS AMONG COMPANIES? 27 10 Docket No. E002/GR-15-826
Lowenthal Direct

PUBLIC DOCUMENT – TRADE SECRET INFORMATION REDACTED –
PUBLIC DATA
A. It is my experience as a Human Resources (HR) professional that broad-based 1
studies evaluating both cash compensation and benefits are neither helpful 2
nor insightful for confirming market comparability. Where separate studies 3
are able to analyze individual components of a benefit program, overall 4
studies need to be adjusted for demographic differences across multiple 5
organizations so that the analysis is focused on differences in plan design 6
provisions, as opposed to an actual dollar value of a program. 7
8
Therefore, it is more typical, efficient, and meaningful for companies, 9
including NSPM, to assess the market-competitiveness of these components 10
separately, which is how we have historically assessed market comparability. 11
In addition, a single study would be more difficult to administer because 12
overall benefit programs are broad-based with numerous complex 13
components that are measured differently than pay. That could lead to less 14
reliable results as study participants, such as NSPM, would likely be less 15
certain about responding to survey questionnaires. For example, our market 16
survey for benefits, BENVAL®, captures data from a wide variety of benefit 17
plans and industries at a national level. General benefit surveys tend to 18
capture basic programmatic questions, which can be difficult to assess when 19
medical plan options and designs are very different. 20
21
A. Total Cash Compensation Study 22
Q. BRIEFLY SUMMARIZE THE FINDINGS OF THE TOTAL CASH COMPENSATION 23
STUDY PERFORMED BY TOWERS WATSON. 24
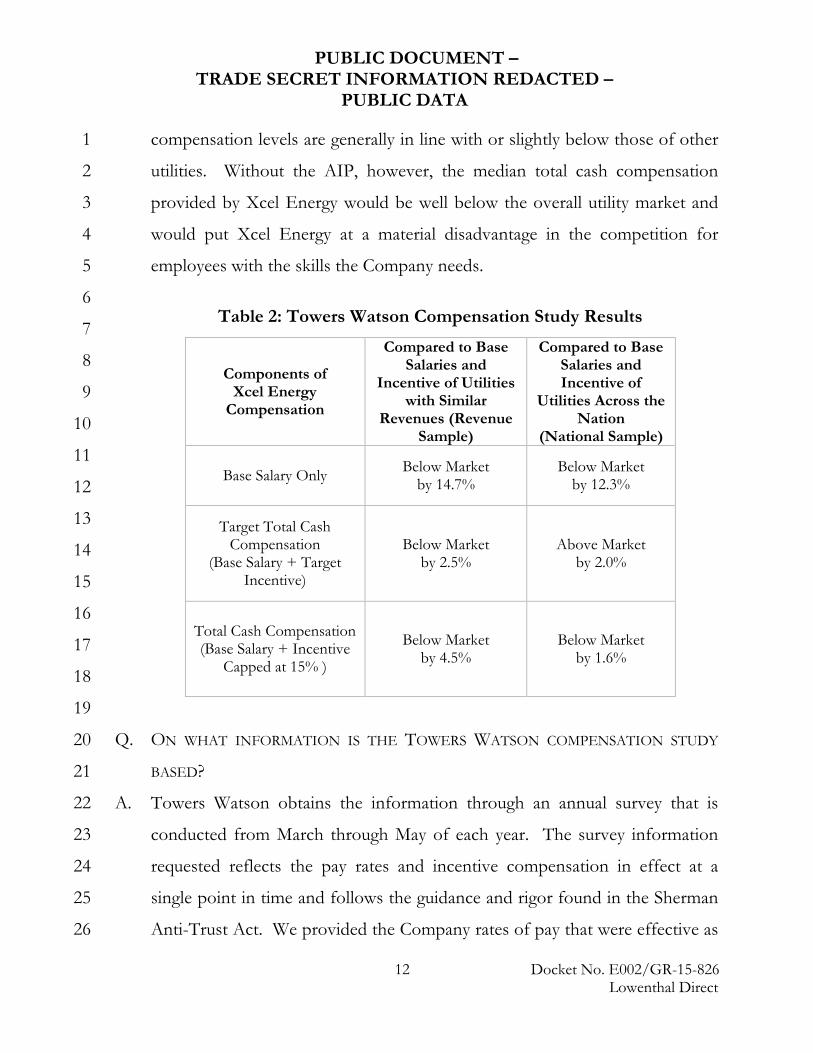
A. As shown in Table 2 below, the 2015 Towers Watson compensation study 25
finds that, with the inclusion of the AIP, Xcel Energy’s median total cash 26
11 Docket No. E002/GR-15-826 Lowenthal Direct
PUBLIC DOCUMENT – TRADE SECRET INFORMATION REDACTED –
PUBLIC DATA
compensation levels are generally in line with or slightly below those of other 1
utilities. Without the AIP, however, the median total cash compensation 2
provided by Xcel Energy would be well below the overall utility market and 3
would put Xcel Energy at a material disadvantage in the competition for 4
employees with the skills the Company needs. 5
6
7
8
9
10
11
12
13
14
15
16
17
18
19
Q. ON WHAT INFORMATION IS THE TOWERS WATSON COMPENSATION STUDY 20
BASED? 21
A. Towers Watson obtains the information through an annual survey that is 22
conducted from March through May of each year. The survey information 23
requested reflects the pay rates and incentive compensation in effect at a 24
single point in time and follows the guidance and rigor found in the Sherman 25
Anti-Trust Act. We provided the Company rates of pay that were effective as 26
Table 2: Towers Watson Compensation Study Results
Components of Xcel Energy
Compensation
Compared to Base Salaries and
Incentive of Utilities with Similar
Revenues (Revenue Sample)
Compared to Base Salaries and Incentive of
Utilities Across the Nation
(National Sample)
Base Salary Only Below Market by 14.7%
Below Market by 12.3%
Target Total Cash Compensation
(Base Salary + Target Incentive)
Below Market by 2.5%
Above Market by 2.0%
Total Cash Compensation (Base Salary + Incentive
Capped at 15% )
Below Market by 4.5%
Below Market by 1.6%
12 Docket No. E002/GR-15-826 Lowenthal Direct
PUBLIC DOCUMENT – TRADE SECRET INFORMATION REDACTED –
PUBLIC DATA
of March 2015 per the survey instructions. The other participants in the 1
survey, which are part of a comparison group of U.S. electric and gas 2
companies similar in size to Xcel Energy Inc. with comparable median 3
revenues of $5.0 billion, also provided information to Towers Watson during 4
the period of March through May 2015. In fact, there were 46 investor-5
owned energy services companies included in this study. 6
7
Q. DOES THE COMPENSATION INFORMATION SUBMITTED BY OTHER COMPANIES 8
INCLUDE 2015 INCREASES, OR DOES IT INCLUDE ONLY 2014 COMPENSATION 9
RATES? 10
A. The pay rates used reflect the compensation levels in place at the time the 11
survey was completed between March through May 2015 in accordance with 12
the survey instructions. 13
14
Q. WHAT WAS THE PERCENTAGE INCREASE REFLECTED IN THE COMPANY’S 15
SALARY INFORMATION SUBMITTED TO TOWERS WATSON AS COMPARED TO 16
THE PREVIOUS YEAR’S STUDY? 17
A. We provided Towers Watson the pay rates that were in effect as of March 16, 18
2015, which was a three-percent average increase over the pay rates effective 19
March 2014. 20
21
Q. IS IT COMMON FOR COMPANIES TO RELY UPON STUDIES SUCH AS THE TOWERS 22
WATSON COMPENSATION STUDY FOR COMPENSATION COMPARISON 23
PURPOSES? 24
A. Yes. It is very common for companies trying to ensure that their 25
compensation is market-competitive to use third-party consulting firm survey 26
13 Docket No. E002/GR-15-826 Lowenthal Direct
PUBLIC DOCUMENT – TRADE SECRET INFORMATION REDACTED –
PUBLIC DATA
data for benchmarking purposes. The use of surveys is a widely accepted 1
practice that employers use to compare their compensation levels to what is 2
going on outside of their own company which is a check-in on the reality of 3
the labor market. 4
5
In my past jobs, I also experienced the use of compensation surveys. They 6
were an important data resource used for designing and maintaining market-7
competitive compensation programs. Our Company’s human capital is our 8
talented and skilled workforce. They are a vitally important resource that is 9
needed to run our company just like the other capital resources in our 10
business. 11
12
The management of HR functions very much like other business functions. 13
For example, if we need to source a specially designed component for one of 14
our production generators, our procurement experts realize that we will not 15
be able to purchase the component for 15-20 percent below the market value 16
of comparable components. Conversely, we do not want to overspend 17
beyond their comparable reference point for the component either because 18
we have a limited budget to maintain operations. This same business 19
management principle exists for our human capital. We realize that we 20
cannot underpay and have no desire to overpay for our human capital 21
compared to what is happening in the market. Benchmarking our 22
compensation programs to survey market data is a best practice that allows us 23
to monitor what is happening in the external market for labor and 24
compensation programs. 25
26
14 Docket No. E002/GR-15-826 Lowenthal Direct

PUBLIC DOCUMENT – TRADE SECRET INFORMATION REDACTED –
PUBLIC DATA
Q. IS THE TOWERS WATSON COMPENSATION STUDY THE ONLY STUDY THE 1
COMPANY RELIES UPON FOR PURPOSES OF BENCHMARKING ITS TOTAL CASH 2
COMPENSATION LEVELS? 3
A. No. The Company routinely uses a number of additional third-party surveys 4
to compare its total cash compensation levels, merit pay increases, and 5
programs to those of other firms, including both other utilities and non-6
utilities. These studies are discussed further below in the section regarding 7
the Company’s cash compensation. 8
9
Q. WHAT IS THE COMPANY’S PRINCIPAL OBJECTIVE WHEN IT PERFORMS ITS 10
BENCHMARKING COMPARISONS? 11
A. Our goal in reviewing such survey information is to determine the market-12
competitive compensation rate for a given job and skill set, considering 13
companies with which Xcel Energy competes for talent. 14
15
Q. DOES THE COMPANY SET SALARIES FOR POSITIONS USING SUCH THIRD-PARTY 16
DATA? 17
A. Yes. Using the data provided by third-party surveys, the Company selects 18
benchmark positions that are representative of the Company’s similar 19
positions. We then use the compensation data provided by the survey (for 20
the position being evaluated) to select the appropriate pay grade within our 21
salary structure and to assign the pay grade for that position. After we 22
determine where a particular position should be placed within our salary 23
structure, an employee’s compensation within the pay grade will be 24
individually determined based on several factors, including experience, skills, 25
and performance. 26
15 Docket No. E002/GR-15-826 Lowenthal Direct
PUBLIC DOCUMENT – TRADE SECRET INFORMATION REDACTED –
PUBLIC DATA
1
For each eligible pay grade within the salary structure, the Company also sets 2
AIP compensation targets. The employees in those pay grades have the 3
ability to earn a target AIP payout if levels of performance are met under Xcel 4
Energy’s AIP. Just as we determine our base salary ranges by looking to 5
market survey data, we also set our AIP targets to deliver market-comparable 6
total cash compensation based on those same surveys. Survey data is 7
refreshed every year so that we can ensure our salaries and incentive 8
opportunities remain competitive and are aligned with the market. 9
10
Q. WHAT DO YOU CONCLUDE REGARDING THE MARKET-COMPETITIVE NATURE 11
OF THE COMPANY’S TOTAL CASH COMPENSATION? 12
A. The Towers Watson compensation study demonstrates that, with the 13
inclusion of the AIP, the Company’s total cash compensation levels are in line 14
with the market. However, if the AIP were excluded, our total cash 15
compensation would lag the market by 14.7 percent (compared to utilities 16
with similar revenues), which would put us at a material disadvantage when 17
competing for talented employees. 18
19
Q. PLEASE EXPLAIN WHAT YOU MEAN WHEN YOU STATE THAT AN EMPLOYEE’S 20
TOTAL CASH COMPENSATION WOULD LAG THE MARKET BY 14.7 PERCENT 21
WITHOUT AIP. 22
A. Assume that the market rate for a particular job is $100 per year, and that 23
other employers are paying $100 per year to employees who are capable of 24
performing that job. Our base salary for that job would be $85.30, but with 25
the AIP the employee would have the opportunity to earn $100. Or stated 26
16 Docket No. E002/GR-15-826 Lowenthal Direct
PUBLIC DOCUMENT – TRADE SECRET INFORMATION REDACTED –
PUBLIC DATA
alternatively, without the AIP, the Company’s employees would earn only 1
$85.30 for performing the same job that other employers would pay them 2
$100 to perform. Essentially, without AIP our employees would not be paid 3
competitively. We would need to add a comparable amount to their base 4
salary, which would then become a fixed cost to the organization and our 5
customers, or we would likely lose our most talented employees. 6
7
B. Health, Welfare and Retirement Benefits Study 8
Q. YOU INDICATED EARLIER THAT THE COMPANY ALSO HAS AN INDEPENDENT 9
STUDY DEMONSTRATING THE REASONABLENESS OF THE HEALTH AND 10
WELFARE AND RETIREMENT PROGRAM BENEFITS COMPONENTS OF ITS TOTAL 11
REWARDS PROGRAM. PLEASE DESCRIBE THAT STUDY. 12
A. Towers Watson collects health, welfare, and retirement benefit plan 13
provisions from hundreds of employers in all industry sectors and measures 14
the value of these programs. This analysis tool, known as BENVAL®, 15
compares new retirement and health and welfare benefit programs. The tool 16
compiles each benefit separately as well as on an entire health, welfare and 17
retirement benefit program basis. There were 40 energy services companies 18
in the comparison group for the Company. The study presents relative value 19
assessments of the competitiveness of a corporation’s entire benefit program. 20
It is based on a common set of actuarial assumptions and a standard 21
employee population that is a representative sample of large U.S. companies. 22
Thus, the analysis establishes a controlled environment in which differences 23
in value among employer plans are exclusively a function of differences in 24
plan design provisions. The results are normalized to a scale where a 25
company providing the average benefit value would be shown at 100. Higher 26
17 Docket No. E002/GR-15-826 Lowenthal Direct
PUBLIC DOCUMENT – TRADE SECRET INFORMATION REDACTED –
PUBLIC DATA
amounts reflect companies who provide benefits above the average, while 1
lower amounts are shown for companies whose benefits are below the peer 2
group average. 3
4
Q. BRIEFLY SUMMARIZE THE FINDINGS OF THE BENEFITS STUDY PERFORMED BY 5
TOWERS WATSON. 6
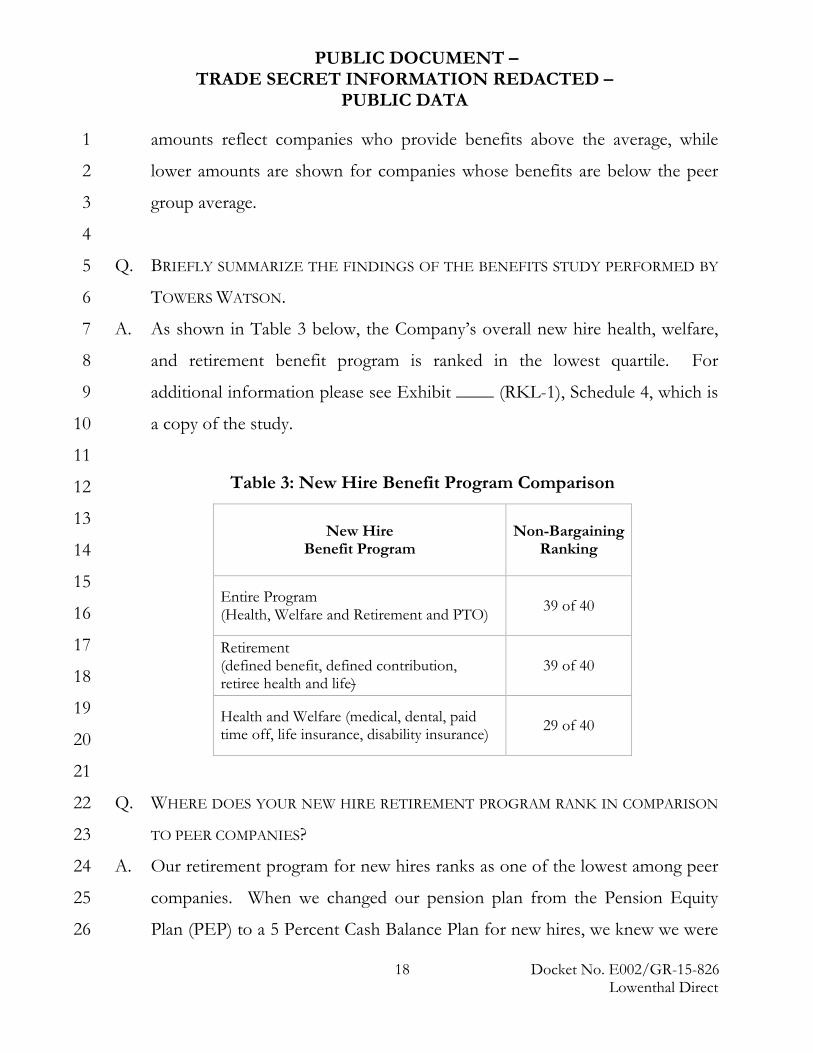
A. As shown in Table 3 below, the Company’s overall new hire health, welfare, 7
and retirement benefit program is ranked in the lowest quartile. For 8
additional information please see Exhibit ____ (RKL-1), Schedule 4, which is 9
a copy of the study. 10
11
12
13
14
15
16
17
18
19
20
21
Q. WHERE DOES YOUR NEW HIRE RETIREMENT PROGRAM RANK IN COMPARISON 22
TO PEER COMPANIES? 23
A. Our retirement program for new hires ranks as one of the lowest among peer 24
companies. When we changed our pension plan from the Pension Equity 25
Plan (PEP) to a 5 Percent Cash Balance Plan for new hires, we knew we were 26
Table 3: New Hire Benefit Program Comparison
New Hire Benefit Program
Non-Bargaining Ranking
Entire Program (Health, Welfare and Retirement and PTO) 39 of 40
Retirement (defined benefit, defined contribution, retiree health and life)
39 of 40
Health and Welfare (medical, dental, paid time off, life insurance, disability insurance) 29 of 40
18 Docket No. E002/GR-15-826 Lowenthal Direct
PUBLIC DOCUMENT – TRADE SECRET INFORMATION REDACTED –
PUBLIC DATA
leading the industry with the reduction in our pension benefit level. 1
Ultimately, we thought that we would be closer to the median once other 2
companies began making the same type of pension benefit reductions. 3
However, we have found that our peer companies have not moved as quickly 4
as Xcel Energy with this particular change. 5
6
Q. WHAT DO THE TWO STUDIES SHOW INSOFAR AS THE COMPANY’S OVERALL 7
CASH COMPENSATION AND BENEFITS PROGRAMS ARE CONCERNED? 8
A. The two studies demonstrate that the Company’s overall level of 9
compensation and benefits is at or below the median level of total 10
compensation and benefits offered by peer companies. We believe an overall 11
level of total rewards that is at or slightly below the median strikes a fair 12
balance between the interests of the Company and its customers. 13
14
IV. TOTAL REWARDS PROGRAM COST MITIGATION 15 MEASURES AND RESOURCE REALIGNMENT 16
17
A. Cost Mitigation Measures 18
Q. YOU MENTIONED THE COMPANY HAS TAKEN STEPS TO MANAGE THE TOTAL 19
REWARDS PROGRAM COSTS. CAN YOU EXPAND ON THAT STATEMENT? 20
A. Yes. We continually monitor our compensation to ensure it is competitive 21
with the market, and we make changes as necessary. As a result of these 22
evaluations, we have recently made design modifications to our AIP, PTO, 23
health and welfare benefits, and retirement benefits. 24
25
Q. HOW HAS THE AIP BEEN MODIFIED IN RECENT YEARS? 26
A. We have taken the following actions within the past four years: 27 19 Docket No. E002/GR-15-826
Lowenthal Direct
PUBLIC DOCUMENT – TRADE SECRET INFORMATION REDACTED –
PUBLIC DATA
• We eliminated AIP payments to non-exempt, non-bargaining 1
employees, who previously were included in the AIP at a six percent 2
target payout percentage. 3
• We eliminated our Control Room Operators from the AIP program 4
when we determined they no longer met the overtime exemption test. 5
• We eliminated eligibility for employees hired on or after October 1 of a 6
program year because they have not been in the job long enough to 7
produce results for that year. 8
• We prorate incentive awards for employee job movement that results 9
in a change in incentive opportunity. 10
• We added a provision that employees must be employed with Xcel 11
Energy on the actual date the AIP is paid. 12
• We eliminated all incentive pay for any employee who did not meet 13
acceptable levels of performance. 14
15
Q. DISCUSS SOME OF THE MEASURES THE COMPANY HAS TAKEN TO MANAGE THE 16
COSTS ASSOCIATED WITH THE HEALTH AND WELFARE BENEFITS. 17
A. The Company has made the following design changes: 18
• We have reduced the number of health insurance plans available to 19
employees from four to one. Since 2009, the only medical plan that the 20
Company has made available to employees is the HDHP plan I 21
described earlier. 22
• Beginning in 2011, the Company increased employees’ out-of-pocket 23
costs in the HDHP by introducing co-insurance, which means that 24
even after meeting their high deductible, our employees continue to 25
20 Docket No. E002/GR-15-826 Lowenthal Direct
PUBLIC DOCUMENT – TRADE SECRET INFORMATION REDACTED –
PUBLIC DATA
pay co-insurance on additional medical and pharmacy claims up to 1
$3,500 per individual or $7,000 per family. 2
• Beginning in 2011, the Company implemented pharmacy cost-3
containment programs that require employees to pay additional out-of-4
pocket expenses if they choose to purchase drugs in a less cost-5
effective manner. Over the years, the Company has added program 6
requirements to manage exposure to increasing drug costs, such as 7
prior drug authorization, step therapy programs and drug exclusions 8
related to specific compound drugs. 9
• In 2012, the Company lowered the plan costs by reducing the 10
Company/employee cost split from 80 percent to 75 percent under the 11
HDHP, shifting a greater portion of the cost to employees in the form 12
of premiums. 13
• In 2015, the Company kept pace with benefit trends by subsidizing 14
dependent coverage less than employee coverage, resulting in 15
additional cost to employees in the form of increased premiums. 16
• In 2010, adult orthodontia coverage was eliminated from the non-17
bargaining and bargaining dental plans. 18
• In 2011, the Short-Term Disability program was reduced from 100 19
percent income replacement for 26 weeks to 100 percent for the first 20
13 weeks, and then 70 percent of income replacement for the 21
remaining 13 weeks. 22
• In 2012, the Company launched a new wellness program, My Health 23
Choices, to further drive toward a healthier employee population 24
through wellness education and lifestyle changes. 25
21 Docket No. E002/GR-15-826 Lowenthal Direct
PUBLIC DOCUMENT – TRADE SECRET INFORMATION REDACTED –
PUBLIC DATA
• In 2015, the Company reduced our PTO liability by eliminating a PTO 1
Buy and Sell Program that allowed employees to purchase more and 2
return unused PTO. This legacy benefit was underutilized as originally 3
designed and was no longer administratively cost-effective. 4
• Since our last rate case filing in 2013, our annual deductibles for our 5
non-bargaining employees increased by $250 and $500 for individual 6
and family coverage, respectively. 7
8
Q. WHAT HAS BEEN THE EFFECT OF THESE CHANGES? 9
A. While many of these changes have directly increased costs for our employees, 10
they have also allowed the Company to better manage overall healthcare costs 11
and the rate at which our costs increase. Employee contributions to health 12
and welfare benefits have increased, but the ways in which our employees 13
access healthcare and consume healthcare services have also improved. For 14
example, we have seen improved use of urgent care facilities as opposed to 15
hospital emergency room visits for acute injuries and illness, and we also have 16
a very high rate of generic prescription drug use. This change in behavior has 17
the potential to mitigate healthcare cost increases for the Company as well as 18
the employees. 19
20
Although it is difficult to identify direct savings from these changes, the intent 21
of the plan modifications was to mitigate cost increases on a long-term basis, 22
in part by motivating employees to be more cost-conscious consumers of 23
medical and dental care, but also to live healthier lifestyles. We also know 24
that it can take time to see cost impacts resulting from program design 25
changes and that health care reform presents us with some unknown impacts 26
22 Docket No. E002/GR-15-826 Lowenthal Direct
PUBLIC DOCUMENT – TRADE SECRET INFORMATION REDACTED –
PUBLIC DATA
to our costs. Based upon the cost trends discussed by Company witness Mr. 1
Richard R. Schrubbe, it appears that our efforts to slow the pace of health 2
care cost increases are succeeding. 3
4
Q. WHAT ELSE HAS THE COMPANY DONE IN REGARD TO COSTS ASSOCIATED 5
WITH THE HEALTH AND WELFARE BENEFITS? 6
A. We have increased communications around a series of programs that have 7
been designed to help control our costs by improving the overall health and 8
welfare of our employees. These programs include counseling and coaching 9
for plan members who are seeking treatment for a condition, engaging plan 10
members proactively to help modify behaviors and health risks, and providing 11
education materials to help plan members make informed decisions. 12
13
The Company also renegotiates contracts with benefit vendors on an ongoing 14
basis. These negotiations focus on administrative fee reductions, better 15
performance guarantees and rebates, and improved discounts on provider 16
networks. All contribute to our ability to mitigate the increasing healthcare 17
costs and benefit administration costs charged by third parties, which limit the 18
impact of the cost of doing business for our customers. 19
20
Q. WHAT ADDITIONAL PLANS DOES THE COMPANY HAVE TO HELP MITIGATE 21
HEALTH AND WELFARE COSTS? 22
A. The Company is closely examining emerging benefit design strategies that 23
would drive our employees and their covered family members to high quality, 24
cost-efficient healthcare providers. We are following marketplace activity 25
23 Docket No. E002/GR-15-826 Lowenthal Direct
PUBLIC DOCUMENT – TRADE SECRET INFORMATION REDACTED –
PUBLIC DATA
changes that are a result of healthcare reform and assessing the resulting 1
impact to our employer-provided coverage. 2
3
We are also assessing programs that will provide more cost-effective 4
opportunities for employees. For example, we are looking at telemedicine 5
options, such as mobile, desktop or telephonic healthcare access for routine 6
visits. These non-traditional visits with a trained physician are convenient and 7
provide a less expensive option for employees and the Company. We are also 8
looking at Centers of Excellence that focus on specialty orthopedic 9
procedures such as spinal fusions, knee and hip replacements. This type of 10
specialty care model provides patient support and education in tandem with 11
high quality and lower cost services. We continue to review the possibility of 12
increasing medical premiums for those employees and their dependents who 13
use tobacco products, increasing their health risks. 14
15
Q. HAS THE COMPANY UNDERTAKEN ANY INITIATIVES TO REDUCE THE COSTS OF 16
ITS DEFINED BENEFIT PENSION EXPENSE? 17
A. Yes. We made the following changes to our defined benefit plan: 18
• Effective January 1, 2011, bargaining employees who are hired, rehired 19
and transferred into the bargaining unit on or after January 1, 2011 are 20
no longer eligible for the 10 percent PEP. Instead, these employees 21
participate in a 5 Percent Cash Balance Plan formula without pension 22
supplements (i.e., Retirement Savings Account or Social Security 23
Supplement). 24
• Effective January 1, 2012, non-bargaining new hires and rehired 25
employees hired on or after January 1, 2012, are no longer eligible for 26
24 Docket No. E002/GR-15-826 Lowenthal Direct
PUBLIC DOCUMENT – TRADE SECRET INFORMATION REDACTED –
PUBLIC DATA
the 10 percent PEP. Instead, these employees participate in a 5 1
Percent Cash Balance Plan formula without pension supplements (i.e., 2
Retirement Savings Account or Social Security Supplement). 3
4
Q. HAS THE COMPANY UNDERTAKEN ANY INITIATIVES TO REDUCE THE COSTS OF 5
ITS RETIREE MEDICAL EXPENSE? 6
A. Yes. We completed a thorough evaluation of the healthcare options available 7
to Medicare-eligible retirees through the individual market related to medical 8
and prescription drug coverage, and we found that those plans provide broad, 9
comprehensive coverage at affordable costs. Therefore, we took a new 10
approach effective January 1, 2013 to transition our Medicare-eligible retirees 11
and their Medicare-eligible spouses and dependents from the Company plan 12
options to the individual market. 13
14
These initiatives reduced the Company’s financial liability and administrative 15
responsibilities, and it gave us the opportunity for significant cost savings for 16
retiree groups that still had premium subsidies. 17
18
Q. HAVE THESE INITIATIVES RESULTED IN REDUCED RETIREE MEDICAL 19
EXPENSE? 20
A. Yes, as discussed by Mr. Schrubbe, these actions have reduced retiree medical 21
expense. 22
23
Q. PLEASE SUMMARIZE THE MOST RECENT CHANGES TO THE COMPANY’S 24
RETIREMENT PROGRAM. 25
25 Docket No. E002/GR-15-826 Lowenthal Direct
PUBLIC DOCUMENT – TRADE SECRET INFORMATION REDACTED –
PUBLIC DATA
A. We continually monitor and evaluate our retirement program to ensure we 1
align with the market as well as our workforce needs. This effort has resulted 2
in a number of modifications that have resulted in steadily lower total pay 3
replacement income levels for employees. Exhibit___(RKL-1), Schedule 5 4
identifies our efforts to date. 5
6
B. Resource Realignment 7
Q. IN ADDITION TO THE COST SAVING INITIATIVES DISCUSSED ABOVE, YOU ALSO 8
MENTIONED SOME RESOURCE REALIGNMENT EFFORTS THE COMPANY HAS 9
UNDERTAKEN. CAN YOU EXPLAIN WHAT YOU MEAN BY THAT? 10
A. Yes. In an effort to get the most value out of our existing program, we have 11
evaluated opportunities to focus our resources more strategically. For 12
instance, we have recently initiated greater emphasis on strengthening the 13
linkage between employee pay and performance, thereby providing larger 14
awards to our highest performers. 15
16
Another way in which we have aligned our resources more strategically is by 17
undertaking an effort to develop and transfer the knowledge necessary to run 18
our business successfully with our existing workforce, despite our increasing 19
attrition levels. Although we have always had knowledge transfer tools in 20
place, our forecasted attrition levels discussed later in my testimony have 21
caused us to refocus and heighten our efforts in this area to ensure we are 22
prepared for the future. These steps include proactively identifying critical 23
near-term retirements and succession opportunities to ensure these changes 24
do not leave areas of vulnerability. We also have formal leadership, rotational, 25
and technical skill training programs. While these efforts will not completely 26
26 Docket No. E002/GR-15-826 Lowenthal Direct
PUBLIC DOCUMENT – TRADE SECRET INFORMATION REDACTED –
PUBLIC DATA
offset our attrition levels, they are better preparing us for the upcoming loss 1
of knowledge. 2
3
Q. PLEASE DESCRIBE THE PAY-FOR-PERFORMANCE PHILOSOPHY. 4
A. The Company has had a long-standing pay-for-performance philosophy 5
which further correlates rewards with work expectations and performance 6
make an even greater distinction between exceptional work and successful 7
work. Consequently, those employees who are performing at levels less than 8
satisfactory will receive far less pay. This philosophy serves to motivate 9
higher performance, set clearer expectations, and recognize and drive 10
continuous improvement. Our renewed emphasis in this area has not 11
affected our overall need for greater compensation levels; it merely targets 12
spending our resources more strategically. 13
14
Q. HASN’T THE COMPANY ALWAYS LINKED MARKET-COMPETITIVE 15
COMPENSATION TO PERFORMANCE? 16
A. Yes. However, this new effort places a greater emphasis on strengthening the 17
link between employee pay and performance, thereby providing larger 18
rewards to our highest performers. We believe practicing greater pay 19
differentiation will help motivate and raise performance levels. 20
21
Q. CAN YOU DISCUSS THE STEPS THE COMPANY IS TAKING TO DEVELOP AND 22
TRANSFER KNOWLEDGE? 23
A. Yes. As discussed further below, our forecasted attrition levels have caused 24
us to refocus and heighten our efforts in this area to ensure we are prepared 25
for the future. Accordingly, we are taking a number of steps to ensure that we 26
27 Docket No. E002/GR-15-826 Lowenthal Direct
PUBLIC DOCUMENT – TRADE SECRET INFORMATION REDACTED –
PUBLIC DATA
are developing and capturing the knowledge and skills needed to run our 1
systems effectively, including the following: 2
• Apprenticeships. We have more than 30 apprenticeship programs across 3
our generation, transmission, and distribution functions. In these 4
apprenticeship programs, which may span two to four years, employees 5
receive formal and on-the-job training to develop technical skills, and 6
we have oversight committees to measure the employees’ development 7
and progress. 8
• Technical Skills. We provide training programs that support more than 9
1,400 qualification programs to ensure employees’ technical skills are 10
maintained, and we film specialized subject matter experts performing 11
key plant functions and technical activities in order to preserve that 12
knowledge for future employees. 13
• Knowledge Transfer. We have a self-directed knowledge transfer process 14
in place to ensure that key information is documented and transferred 15
from one employee to another employee. The goal of the process is to 16
help managers identify, prioritize, and transfer critical knowledge from 17
employees who are leaving the organization due to retirement or other 18
forms of attrition. 19
• Leadership Program. We have a pre-supervisory leadership development 20
program and a core leadership program. We also have a leadership 21
succession plan with development plans for successors for critical 22
positions. In the past few years, we added a frontline leadership 23
development program, we continue to enhance our new leader 24
development program, and we created a high-potential development 25
program. Since 2011, there have been 452 participants in our pre-26 28 Docket No. E002/GR-15-826
Lowenthal Direct
PUBLIC DOCUMENT – TRADE SECRET INFORMATION REDACTED –
PUBLIC DATA
leadership program, resulting in 150 promotions to leadership 1
positions. An additional 56 employees were developed and accepted 2
other jobs within the Company. 3
• Rotational Programs. Many business areas have rotational programs in 4
which employees learn different skills that enable knowledge transfer. 5
• e-Learning. We have more than 50 e-learning options on non-technical 6
topics. 7
• Productivity through Technology. As discussed by Company witness Mr. 8
David C. Harkness, we are currently going through a multi-year project 9
to upgrade our technology and redesign business processes and 10
procedures with thorough documentation. This project will drive 11
greater effectiveness and will also provide a long-term documentation 12
platform providing for improved knowledge transfer across the 13
Company. Upon completion, this project should aid in the growth and 14
development of newer employees who will fill openings created by 15
retirees and normal attrition. 16
17
Q. DO THESE INITIATIVES ENSURE THAT THE COMPANY WILL BE ABLE TO OFFSET 18
THE DETRIMENTAL EFFECTS OF ATTRITION? 19
A. No. These initiatives will help us impart, preserve, and transfer knowledge, 20
but they must be offered in tandem with a compensation package that is 21
sufficient to attract and retain employees. 22
23
Q. HAS THE COMPANY STRATEGICALLY TARGETED ANY EFFORTS TO ADDRESS 24
RECRUITING CHALLENGES? 25
29 Docket No. E002/GR-15-826 Lowenthal Direct
PUBLIC DOCUMENT – TRADE SECRET INFORMATION REDACTED –
PUBLIC DATA
A. Yes. The Company has developed a number of creative ways to address our 1
recruiting challenges and target our resources most effectively. For example, 2
we have an award-winning program expressly designed to recruit and hire 3
veterans of the United States armed forces.2 We actively recruit veterans 4
because their skills translate well to a utility environment, and their work ethic 5
and leadership skills are outstanding. Employees with military service 6
demonstrate leadership skills, high performance standards, and commitment 7
to teamwork. Currently, about 10 percent of Xcel Energy’s employees are 8
military veterans, with many represented in management, but the need for 9
new, qualified employees grows with more than half of our workforce eligible 10
to retire over the next ten years. 11
12
Q. WHAT DO YOU CONCLUDE ABOUT THE COMPANY’S TOTAL REWARDS 13
PROGRAM DESIGN CHANGES AND RESOURCE REALIGNMENT INITIATIVES? 14
A. The Company has undertaken a variety of initiatives to manage our expenses 15
and we believe these initiatives have been successful and allowed the 16
Company to better manage overall Total Rewards Program costs. 17
18
V. RESULTING CHALLENGES 19
20
Q. WHAT CHALLENGES IS THE COMPANY FACING AS A RESULT OF THE UNDER-21
RECOVERY OF COSTS, COST MITIGATION EFFORTS, AND OFFERING 22
COMPENSATION THAT IS AT, OR BELOW, MARKET LEVELS? 23
2 Xcel Energy was named one of GI Jobs’ Top 100 Military Friendly Employers for the last five years and won the Most Valuable Employer for Military by CivilianJobs.com. 30 Docket No. E002/GR-15-826
Lowenthal Direct
PUBLIC DOCUMENT – TRADE SECRET INFORMATION REDACTED –
PUBLIC DATA
A. The Company is facing a multitude of challenges with respect to its workforce 1
and our need to offer competitive compensation and benefits is greater than 2
ever. The electric industry is becoming more complex and technically 3
demanding. At the same time, we are facing more competition than ever for 4
the employees who have the skills and training to fulfill those roles in the 5
Company. Moreover, a significant portion of the Company’s workforce is 6
eligible for retirement, which makes it imperative for us to hire, train, and 7
retain new employees as well as retain those who are retirement eligible so 8
that knowledge transfer can occur. 9
10
Q. DO YOU HAVE A BREAKDOWN OF YOUR OVERALL WORKFORCE? 11
A. Yes. More than 75 percent of the Company’s employees based in Minnesota 12
are linemen, engineers, plant system operators, and other employees in skilled 13
field positions. The remaining employees support our customers, regulators, 14
investors, other employees, and the administration of our business. 15
16
Q. WHAT TYPES OF SKILLS ARE NECESSARY TO PERFORM THESE JOBS? 17
A. We expect our employees to have a variety of technical, communication, 18
interpersonal and educational skills. From skilled technical positions through 19
the Company’s senior management team, the requisite skill-set bar is high. 20
For example, our Cyber Security Program Manager job requires a Bachelor’s 21
degree in Management Information Systems, Computer Science or 22
Engineering, and it also requires five years of cyber security-related risk 23
management or compliance experience, including proven success defining 24
business and technical security or compliance solutions. 25
26
31 Docket No. E002/GR-15-826 Lowenthal Direct
PUBLIC DOCUMENT – TRADE SECRET INFORMATION REDACTED –
PUBLIC DATA
Q. WITH WHOM DOES XCEL ENERGY COMPETE FOR QUALIFIED EMPLOYEES? 1
A. Xcel Energy competes for talent within both the utility and the non-utility 2
sectors. Utility sector competition generally takes place for jobs specific to 3
utility operations and the delivery of utility services, such as engineers, plant 4
operators, technicians, welders, and machinists. We also compete with other 5
utilities for corporate employees such as regulatory accountants and load 6
forecasters. In addition, we compete with non-utility employers for jobs that 7
are not specific to utilities, such as finance and accounting analysts, marketing 8
analysts, designers, information technology specialists, human resource 9
generalists, and customer service representatives. 10
11
A. Hiring Challenges 12
Q. PLEASE DESCRIBE AT A HIGH LEVEL THE RECRUITING CHALLENGES THAT THE 13
COMPANY FACES. 14
A. Prospective employees with the specific skill sets and training required for 15
technical or specialized careers are in high demand. There is a limited pool of 16
candidates, and the Company competes for them on a national, regional and 17
local basis. In fact, some of the employee positions that we need to fill, such 18
as electrical engineers and nuclear technicians, are in such high demand that 19
their salaries are growing faster than the salaries of other positions. Due to 20
the unique nature of many of our highly technical utility jobs, we need to hire 21
experienced employees that can perform in their roles quickly as opposed to 22
being able to use entry-level talent. 23
24
Q. ARE THERE ANY UNIQUE RECRUITING CHALLENGES WITHIN THE STATE OF 25
MINNESOTA? 26
32 Docket No. E002/GR-15-826 Lowenthal Direct
PUBLIC DOCUMENT – TRADE SECRET INFORMATION REDACTED –
PUBLIC DATA
A. Yes. According to the Bureau of Labor Statistics, Minnesota had a 3.9 1
percent unemployment rate in June 2015, the eighth lowest in the country and 2
well below the national average of 5.3 percent. In July 2014, Minneapolis had 3
a jobless rate of 4.0 percent, the lowest jobless rate in the nation among large 4
metropolitan areas.3 According to the Minnesota Department of Employment 5
and Economic Development, Minnesota has more Fortune 500 firms per 6
capita than all but one state,4 and Minnesota is tied for eleventh-most Fortune 7
500 companies in the nation.5 In 2015, the 17 Fortune 500 companies in the 8
state include some of the world’s most recognized brands and firms, such as 9
3M and General Mills, with whom we compete for engineers, IT, marketing, 10
and other skilled employees. 11
12
We also compete for talent with many other large employers that have a 13
significant presence in Minnesota but are no longer headquartered in 14
Minnesota or are privately held and are not included on the Fortune 500 list, 15
such as Medtronic, Spartan Nash, and Cargill. In 2015, there are also eight 16
additional Fortune 1000 companies headquartered in Minnesota, mainly in the 17
Minneapolis-St Paul area.6 Recently, CNBC named Minnesota “America’s 18
Top State for Business” for 2015, moving up from number 6 in 2014, based 19
on the highest combined score from ten categories.7 20
3 See http://www.startribune.com/twin-cities-jobless-rate-is-the-lowest-for-large-u-s-metro-area/265471401/ (accessed on Aug. 17, 2015). 4 See http://mn.gov/deed/business/locating-minnesota/companies-employers/fortune500.jsp (accessed on Aug. 28, 2015). 5 See http://mn.gov/deed/business/locating-minnesota/companies-employers/fortune500.jsp (accessed on Aug. 28, 2015). 6 See http://www.geolounge.com/fortune-1000-companies-list-for-2015/ (accessed on Aug. 31, 2015) 7 See http://mn.gov/deed/newscenter/social-media/blogs/deed-developments/blog-entry.jsp?id=466-166368 (accessed on Aug. 31, 2015). 33 Docket No. E002/GR-15-826
Lowenthal Direct
PUBLIC DOCUMENT – TRADE SECRET INFORMATION REDACTED –
PUBLIC DATA
1
In addition, there are five other investor-owned electric utilities that serve 2
Minnesota, as well as more than 40 cooperatives and more than 20 municipal 3
providers with whom we also compete for talent.8 Finally, the costs of labor 4
in Minneapolis and St. Paul are 10 percent above the national average. 5
6
Q. ARE SOME TYPES OF JOBS HARDER TO FILL THAN OTHERS? 7
A. Yes. According to Forbes magazine, Minnesota is the fastest-growing state for 8
tech jobs, and the STEM jobs are in high demand across Minnesota as well.9 9
This shortage of skilled technical talent is accelerating wages for these job 10
categories faster than other areas. 11
12
Q. DO YOU HAVE ANY EXAMPLES OF THE COMPANY’S RECRUITING CHALLENGES 13
AS FAR AS TECHNICAL POSITIONS ARE CONCERNED? 14
A. Yes. In 2014, the Company filled 495 jobs with external candidates. Of 15
these, 62 jobs that fell mainly in technical areas were open for 130 days or 16
more (actual average for this group of jobs was 185 days open), although our 17
average time to fill a job during this period was 65 days. Jobs such as 18
Lineman (147 days), Senior Turbine Engineer (218 days), Transmission 19
Superintendent (145 days), Senior Information Systems Auditor (189 Days) 20
and Field Construction Manager (134 days) were particularly difficult to fill. 21
8 See http://mn.gov/puc/electricity/utility-companies/cooperatives/index.html and http://mn.gov/puc/electricity/utility-companies/municipals/index.html (accessed on Aug. 21, 2015) 9 See http://www.forbes.com/sites#/sites/susanadams/2015/08/18/the-fastest-growing-states-for-tech-jobs-in-2015/ (accessed on Oct. 23, 2015)
34 Docket No. E002/GR-15-826 Lowenthal Direct
PUBLIC DOCUMENT – TRADE SECRET INFORMATION REDACTED –
PUBLIC DATA
The length of time these jobs have remained open is evidence of the active 1
and robust job market in Minnesota for technical positions. 2
3
From the examples above, the Company received 28 applicants for the Senior 4
Turbine Engineer opening during this period, but only four candidates met 5
the minimum qualifications for the job. The Company offered the job to 6
three successive candidates and received declines from the first two 7
candidates due to either salary or personal reasons, before receiving final 8
acceptance. Regarding the Transmission Superintendent opening, the 9
Company received 25 applicants with eight qualified candidates meeting the 10
minimum job requirements. After interviews with four of the candidates, the 11
Company made an offer, then had to counteroffer with a higher salary, before 12
the candidate finally accepted. 13
14
Q. WHY IS IT SO DIFFICULT FOR THE COMPANY TO ATTRACT THOSE TYPES OF 15
EMPLOYEES? 16
A. The short answer is that our compensation is not high enough compared to 17
the companies with whom we compete for employees. With respect to 18
engineers, for example, we compete not only with other utilities, but also with 19
consulting firms that generally offer significantly higher pay and benefits, 20
according to feedback we receive from candidates and search firms. Because 21
of the highly technical nature of the engineering responsibilities at Xcel 22
Energy, we must often hire engineers with a senior level of experience, which 23
is difficult to accommodate in our pay range. For instance, in 2013 and 2014, 24
we hired 107 candidates for engineering-related professional and leadership 25
positions in Minnesota. The average time to fill these jobs was 105 days from 26
35 Docket No. E002/GR-15-826 Lowenthal Direct
PUBLIC DOCUMENT – TRADE SECRET INFORMATION REDACTED –
PUBLIC DATA
the initiation of the process through offer acceptance. Nineteen of these 1
positions were open for more than 200 days. 2
3
Another example relates to our search for an Engineering Supervisor for our 4
Nuclear area. This position has been open since September 17, 2014. There 5
were 18 candidates from the applicant pool who met the minimum job 6
requirements and advanced to our leader assessment process, which measures 7
the candidate’s leadership skills and competencies. Upon completion of our 8
review, only three of the candidates were deemed suitable. We made offers to 9
two of these candidates, but both rejected our offer. This job remained 10
unfilled for more than nine months. 11
12
We struggled to fill a number of other jobs that were open for more than 200 13
days, including a Safety and Training Consultant position that required 14
multiple offers before a candidate accepted; a Journeyman Lineman position 15
for which eight candidates pulled out of the process before an offer was 16
accepted; and a Senior Information Technology Business Manager position 17
that had six candidates who withdrew from consideration or rejected our 18
offer before we filled the position. 19
20
Q. DOES THE COMPANY CURRENTLY HAVE JOB OPENINGS THAT ARE PROVING 21
DIFFICULT TO FILL? 22
A. Yes. We have 122 current openings in Minnesota, with three openings 23
having been very difficult to fill: Senior Engineer for Energy Supply, SAP 24
Implementation Business Integration Manager for Business Systems, and 25
Bargaining Apprentice System Relay Specialist for Utilities. On average, 26
36 Docket No. E002/GR-15-826 Lowenthal Direct
PUBLIC DOCUMENT – TRADE SECRET INFORMATION REDACTED –
PUBLIC DATA
these jobs have been open for more than 165 days. In the case of the Senior 1
Engineer, only one of the 176 candidates met the combustion turbine 2
specialty requirements for the job, but that candidate was not willing to 3
work for the salary level we were willing to offer. 4
5
Q. THE MEDIA HAS REPORTED THAT OTHER COMPANIES IN MINNESOTA HAVE 6
RECENTLY HAD LAY-OFFS. HAS THE COMPANY BEEN ABLE TO REDUCE ITS 7
HIRING CHALLENGES BY HIRING SOME OF THOSE LAID-OFF WORKERS? 8
A. No. Many of the employees who were laid off by other employers in 9
Minnesota do not have the technical skills that our Company needs for the 10
jobs that are hardest to fill. And those employees who have those technical 11
skills are in such high demand that their salary expectations exceed what we 12
are able to pay. 13
14
Q. YOU TESTIFIED EARLIER THAT THE COMPANY ALSO FACES REGIONAL 15
RECRUITING ISSUES. WHAT ARE THOSE ISSUES? 16
A. The robust job market in neighboring states has made it more difficult to 17
recruit employees. In recent months the unemployment rates in North 18
Dakota and South Dakota have stood at 3.1 percent and 3.8 percent, 19
respectively, the second lowest and sixth lowest rates in the nation.10 In fact, 20
the demand for workers in North Dakota has caused the average annual wage 21
in the oil and gas industry to exceed $111,400 in some parts of the state.11 22
23
10 See http://www.bls.gov/web/laus/laumstrk.htm (accessed on Aug 17, 2015). 11 See http://www.washingtontimes.com/news/2014/jul/9/job-service-oil-counties-tops-in-n-dakota-wages/?page=all#! (accessed on Aug. 17, 2015). 37 Docket No. E002/GR-15-826
Lowenthal Direct
PUBLIC DOCUMENT – TRADE SECRET INFORMATION REDACTED –
PUBLIC DATA
Q. AT A NATIONAL LEVEL, WHAT IS DRIVING THE INCREASE IN COMPETITION IN 1
THE COMPANY’S LABOR MARKET? 2
A. There are several developments on a national level that are making it more 3
difficult to recruit qualified applicants. 4
5
For instance, the nuclear industry is facing a shortage of experienced and 6
highly-skilled workers. We have had difficulty hiring for nuclear operations 7
positions because employees with utility and nuclear generation-related 8
experiences are in short supply. Working at nuclear plants requires an 9
extensive set of specific skills, knowledge and expertise on specialized 10
equipment, and the demand for this unique skill set exists in the nuclear 11
industry both nationally and internationally. The persistent demand for 12
nuclear employees has caused and continues to cause compensation 13
expectations of nuclear professionals to rise in comparison to other 14
professional areas. There will be increased pressure going forward to match 15
perceived compensation levels and to attract employees with what they 16
believe is a competitive offer. 17
18 In addition, there is a highly competitive national market for skilled talent 19
with cyber security experience, and there is a limited pool of qualified 20
candidates. Cyber security attacks on information systems are becoming 21
increasingly common, and threats to information security can significantly 22
impact any business by interrupting service and losing customer confidence 23
when data breaches or unplanned outages occur. To defend against emerging 24
threats, we are raising the level of employee expertise and sophistication of 25
our critical systems by making investments in our people and our technology. 26
38 Docket No. E002/GR-15-826 Lowenthal Direct
PUBLIC DOCUMENT – TRADE SECRET INFORMATION REDACTED –
PUBLIC DATA
Xcel Energy has more than 50 critical systems that are deemed to be required 1
for delivery of our gas and electric services, satisfaction of regulatory 2
compliance requirements, and continuation of core business functions. We 3
are competing for these employees with other businesses who are facing 4
similar threats to their information systems. 5
6
B. Retention Challenges 7
Q. PLEASE DESCRIBE THE RETENTION ISSUES FACING THE COMPANY. 8
A. Many of our retention issues are related to our recruiting challenges. Just as 9
we have a need for skilled candidates, so do other utilities and energy industry 10
participants. Many of our employees are viable candidates for other utilities 11
and energy industry participants because of the experience, knowledge and 12
skills they have acquired while working for the Company. 13
14
For example, in the fall of 2014, we graduated ten new Senior Reactor 15
Operators from a two-year class. This class, which is conducted internally 16
and accredited by the Nuclear Regulatory Commission, is considered to be 17
one of the most difficult classes in the industry. The candidates had several 18
years of nuclear experience and were selected to be part of our future Control 19
Room Supervisory team that would ultimately assume the responsibilities 20
currently held by several of our seasoned and retiring leadership staff. Since 21
graduation from the class, we have lost two of the candidates to other nuclear 22
facilities, creating a strain on our shrinking operator pool and our training 23
resources. 24
25
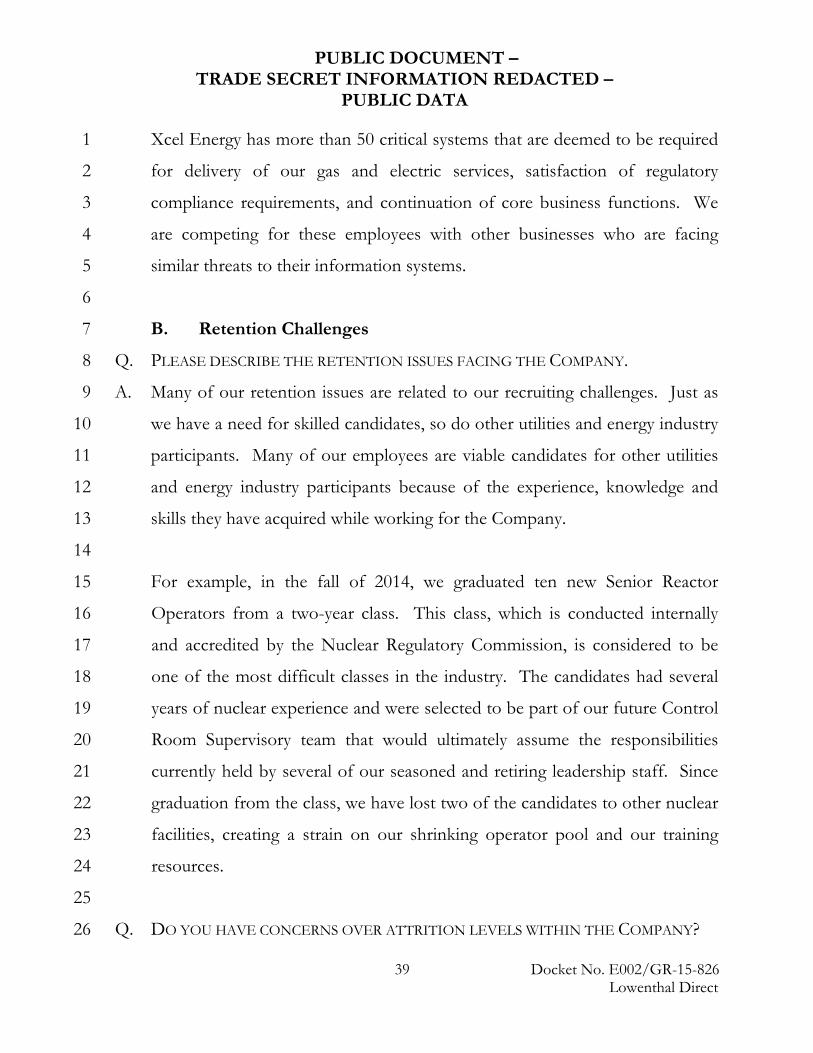
Q. DO YOU HAVE CONCERNS OVER ATTRITION LEVELS WITHIN THE COMPANY? 26
39 Docket No. E002/GR-15-826 Lowenthal Direct
PUBLIC DOCUMENT – TRADE SECRET INFORMATION REDACTED –
PUBLIC DATA
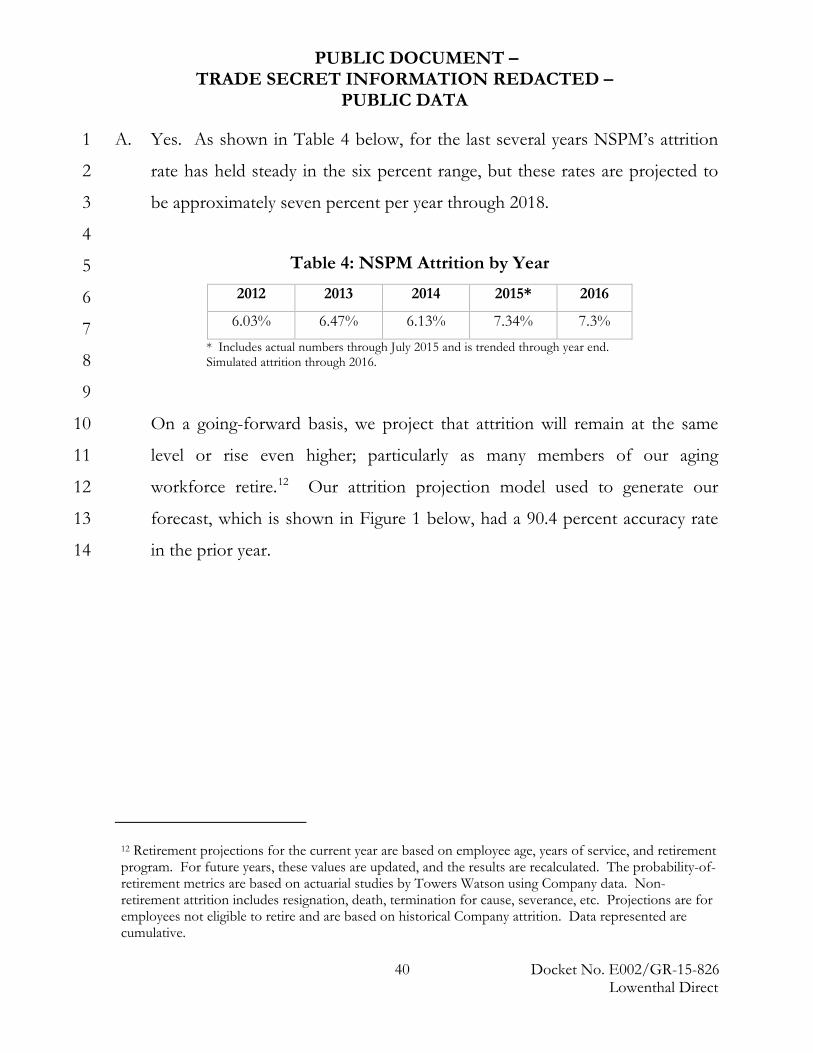
A. Yes. As shown in Table 4 below, for the last several years NSPM’s attrition 1
rate has held steady in the six percent range, but these rates are projected to 2
be approximately seven percent per year through 2018. 3
4
5
6
7
8
9
On a going-forward basis, we project that attrition will remain at the same 10
level or rise even higher; particularly as many members of our aging 11
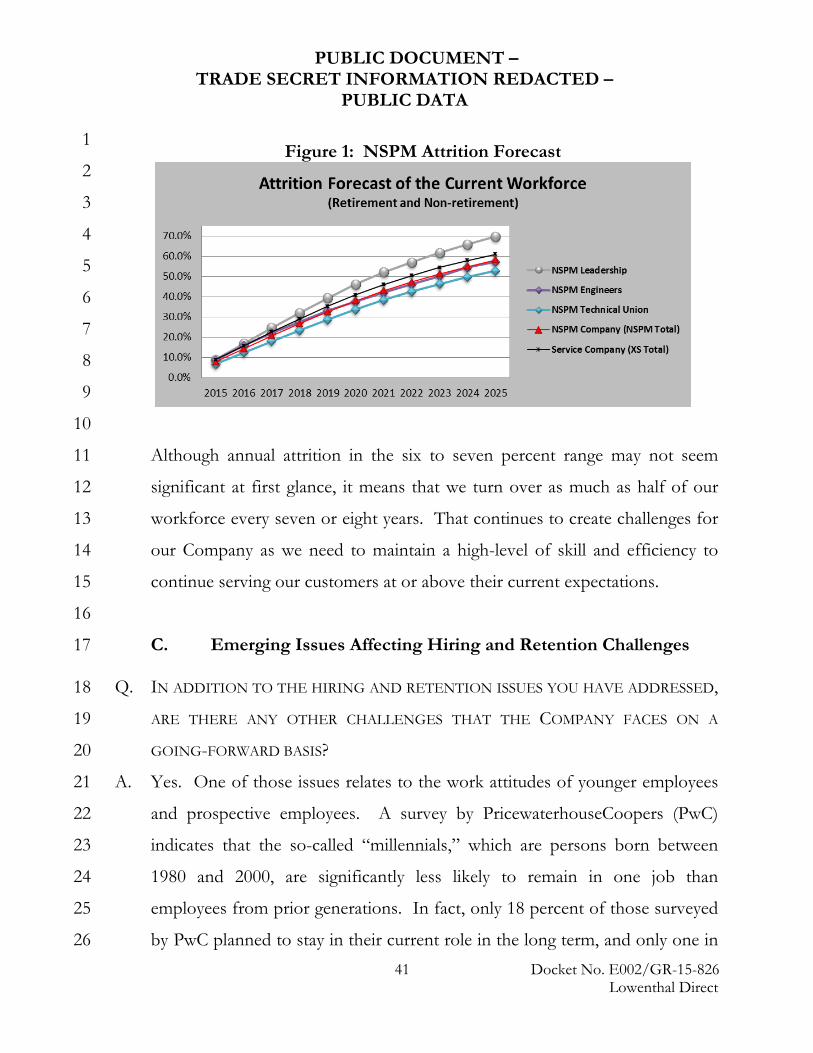
workforce retire.12 Our attrition projection model used to generate our 12
forecast, which is shown in Figure 1 below, had a 90.4 percent accuracy rate 13
in the prior year. 14
12 Retirement projections for the current year are based on employee age, years of service, and retirement program. For future years, these values are updated, and the results are recalculated. The probability-of-retirement metrics are based on actuarial studies by Towers Watson using Company data. Non-retirement attrition includes resignation, death, termination for cause, severance, etc. Projections are for employees not eligible to retire and are based on historical Company attrition. Data represented are cumulative.
Table 4: NSPM Attrition by Year
2012 2013 2014 2015* 2016
6.03% 6.47% 6.13% 7.34% 7.3%
* Includes actual numbers through July 2015 and is trended through year end. Simulated attrition through 2016.
40 Docket No. E002/GR-15-826 Lowenthal Direct
PUBLIC DOCUMENT – TRADE SECRET INFORMATION REDACTED –
PUBLIC DATA
1
2
3
4
5
6
7
8
9
10
Although annual attrition in the six to seven percent range may not seem 11
significant at first glance, it means that we turn over as much as half of our 12
workforce every seven or eight years. That continues to create challenges for 13
our Company as we need to maintain a high-level of skill and efficiency to 14
continue serving our customers at or above their current expectations. 15
16
C. Emerging Issues Affecting Hiring and Retention Challenges 17
Q. IN ADDITION TO THE HIRING AND RETENTION ISSUES YOU HAVE ADDRESSED, 18
ARE THERE ANY OTHER CHALLENGES THAT THE COMPANY FACES ON A 19
GOING-FORWARD BASIS? 20
A. Yes. One of those issues relates to the work attitudes of younger employees 21
and prospective employees. A survey by PricewaterhouseCoopers (PwC) 22
indicates that the so-called “millennials,” which are persons born between 23
1980 and 2000, are significantly less likely to remain in one job than 24
employees from prior generations. In fact, only 18 percent of those surveyed 25
by PwC planned to stay in their current role in the long term, and only one in 26
Figure 1: NSPM Attrition Forecast
41 Docket No. E002/GR-15-826 Lowenthal Direct
PUBLIC DOCUMENT – TRADE SECRET INFORMATION REDACTED –
PUBLIC DATA
five (21 percent) said they would like to stay in the same field and progress 1
with one employer.13 Because of the significant amount of training necessary 2
to perform many of the jobs that are most challenging for the Company to 3
fill, that makes it even more imperative that we be able to offer compensation 4
packages that are attractive to our current and prospective future employees. 5
6
Q. DO MILLENNIALS PRESENT ANY OTHER HIRING CHALLENGES FOR THE 7
COMPANY? 8
A. Yes. That same PwC study states that younger workers value flexibility in 9
working arrangements, including the opportunity to telecommute. Although 10
telecommuting is an option for some of the Company’s employees, there is 11
obviously no way for a lineman or a power plant operator to telecommute. 12
That diminishes the attractiveness of our field positions to be filled by 13
prospective employees from the millennial generation. 14
15
In addition, the PwC study indicates that one of the most important attributes 16
of employment for millennials is the opportunity for rapid career progression. 17
A number of the positions in the Company require training and 18
apprenticeship programs that can last several years, which reduces the 19
attractiveness to join our Company by candidates. 20
21
Q. WHAT OTHER EMERGING CHALLENGES DOES THE COMPANY FACE WITH 22
RESPECT TO HIRING AND RETENTION CHALLENGES? 23
13 See https://www.pwc.com/gx/en/managing-tomorrows-people/future-of-work/assets/reshaping-the-workplace.pdf (accessed on Oct. 23, 2015).
42 Docket No. E002/GR-15-826 Lowenthal Direct

PUBLIC DOCUMENT – TRADE SECRET INFORMATION REDACTED –
PUBLIC DATA
A. Like other Minnesota employers, the Company faces a future with fewer job 1
applicants. As seen in Figure 2 below, according to the Minnesota State 2
Demographic Center, in 2020 labor force growth rates will hit record lows.14 3
That also makes it more important for the Company to be able to attract the 4
anticipated lower number of candidates with a competitive compensation 5
package. 6
7
Figure 2: Annualized Minnesota Labor Force Growth Rate15 8
9
10
11
12
13
14
15
16
17
18
19
20
Q. IN LIGHT OF THE HIRING AND RETENTION CHALLENGES THE COMPANY 21
FACES, WHAT CONCLUSIONS DO YOU DRAW REGARDING THE NEED FOR FULL 22
14 See http://mn.gov/admin/images/the-time-for-talent-msdc-march2013.pdf (accessed on Oct. 23, 2015). 15 Source: MN State Demographic Center calculations and projections.
43 Docket No. E002/GR-15-826 Lowenthal Direct
PUBLIC DOCUMENT – TRADE SECRET INFORMATION REDACTED –
PUBLIC DATA
RECOVERY OF THE COMPENSATION REQUESTED BY THE COMPANY IN THIS 1
CASE? 2
A. It is vitally important that the Company be allowed to recover the full amount 3
requested. As I noted earlier, we are not requesting recovery of several 4
elements of compensation that we will continue to pay, such as long-term 5
incentive and non-qualified pension expense. With the exclusion of those 6
amounts from the cost of service, we are already asking shareholders to 7
shoulder a larger burden of the compensation costs necessary to attract and 8
retain talented employees. Further disallowances or exclusions will create a 9
compensation structure imbalance that is quite simply not sustainable over the 10
long term of our business operations. 11
12
Moreover, it is important to note that we are not asking for recovery of any 13
amounts that the Commission has found to be unreasonable in the past. 14
Thus, our request regarding compensation is consistent with Commission 15
precedent and is necessary to attract and retain the employees we need to 16
provide safe and reliable electric service. 17
18
VI. TOTAL CASH COMPENSATION 19
20
Q. WHAT COSTS FOR CASH COMPENSATION HAS THE COMPANY INCLUDED IN THE 21
2016 TEST YEAR? 22
A. The components of cash compensation in the test year are base salary 23
(including PTO), AIP, and our Spot On Award Recognition program. In 24
combination, these components compensate employees at a level that is 25
44 Docket No. E002/GR-15-826 Lowenthal Direct
PUBLIC DOCUMENT – TRADE SECRET INFORMATION REDACTED –
PUBLIC DATA
consistent with the market. I will discuss each of them in the following 1
subsections. 2
3
A. Base Salary 4
Q. HOW ARE MERIT BASE SALARY INCREASES EARNED? 5
A. Consistent with the Company’s pay-for-performance and market-competitive 6
pay philosophy, managers determine the merit increase amount to award 7
based on an employee’s performance, position in the salary range (an 8
indicator of market), and internal equity. Because merit increases are based 9
on these factors, some employees may earn less than the budgeted increase or 10
no increase at all, while some employees may earn more than the budgeted 11
increase percentage. Merit increases are not cost-of-living increases, and we 12
do not have a separate cost-of-living raise. 13
14
Q. WHAT IS INCLUDED IN THE 2016 TEST YEAR BUDGET AS IT PERTAINS TO MERIT 15
BASE SALARY INCREASES FOR NON-BARGAINING EMPLOYEES? 16
A. We included the costs budgeted for providing non-bargaining employees with 17
2016 merit increases equal to a 3.0 percent increase in base salary. Based on 18
recent trending, we anticipate base salaries will continue to rise at 19
approximately 3.0 percent in 2017 and 2018, as well. 20
21
Q. HOW WAS THE BUDGET CALCULATED FOR THE 2016 TEST YEAR? 22
A. In accordance with our budgeting process described below, we used the 23
headcount and base salaries in effect as of April 2014 and applied a 3.0 24
percent increase to those values. 25
26
45 Docket No. E002/GR-15-826 Lowenthal Direct
PUBLIC DOCUMENT – TRADE SECRET INFORMATION REDACTED –
PUBLIC DATA
Q. DOES YOUR BUDGET INCLUDE PTO? 1
A. Yes. Though we do not carve out the costs of PTO separately for rate 2
recovery, it is included as a component of an employee’s base salary and 3
therefore is in the base salary cost. 4
5
Q. HOW DOES THE COMPANY DETERMINE THE ANNUAL BUDGET FOR MERIT 6
INCREASES? 7
A. For non-bargaining employees, we initially budget for merit increases on a 8
five-year forward-looking basis. Each year, we refine the budget using our 9
current workforce information and each employee’s base salary at that time. 10
We then calculate the budgeted merit increase for the following five years 11
using target merit increase percentage values that are based on several factors, 12
including: 13
• Review of external market surveys regarding base salary increases; 14
• Comparison of potential or negotiated wage increases to our bargaining 15
employees; 16
• Economic conditions; and 17
• Company performance. 18
19
By balancing these several considerations, we develop a budgeted merit 20
increase that allows us to meet our hiring and retention challenges while being 21
fair and reasonable to our employees and customers. 22
23
For bargaining unit employees, the general wage increases are part of the 24
negotiation process and are included in the collective bargaining agreements. 25
26 46 Docket No. E002/GR-15-826
Lowenthal Direct
PUBLIC DOCUMENT – TRADE SECRET INFORMATION REDACTED –
PUBLIC DATA
Q. WHAT IS INCLUDED IN THE 2016 TEST YEAR BUDGET AS IT PERTAINS TO MERIT 1
BASE SALARY INCREASES FOR BARGAINING EMPLOYEES? 2
A. The current collective bargaining contract includes a 2.5 percent increase 3
scheduled with an effective date of January 1, 2016. This contract is 4
scheduled for negotiations during the 2016 test year. 5
6
Q. WHY IS A THREE PERCENT MERIT BASE SALARY INCREASE FOR NON-7
BARGAINING EMPLOYEES APPROPRIATE? 8
A. The Company regularly compares its total cash compensation levels merit pay 9
increases and programs to those of other companies, including other utilities 10
and non-utilities. Surveys demonstrate that a three percent increase in base 11
salary is comparable to what the market is projecting for 2016.16 In particular, 12
six different survey sources17 project 2016 base salary increases to fall within 13
the following ranges: 14
• 2.9 - 3.3 percent for all utilities on a national basis; 15
• 2.9 - 3.1 percent for all companies on a national basis; and 16
• 2.9 - 3.0 percent for the Minneapolis area. 17
18
These independent surveys include a comprehensive representation of many 19
companies, both in the utility and general industry. The number of 20
companies participating in the surveys ranges from 79 to 5,365. Using 21
16 See http://www.marketwatch.com/story/base-pay-for-us-employees-expected-to-make-modest-gains-in-2016-2015-08-04 (accessed on Sep. 1, 2015). 17 WorldatWork ”2015-2016 Salary Budget Survey;” The Conference Board “2015-2016 Salary Increase Budget Survey Results;” Towers Watson, “2015/2016 General Industry Salary Budget Survey;” Culpepper, “Salary Budget & Compensation Planning Survey Results 2015-2016;” Mercer “2015/2016 US Compensation Planning Survey Report;” and Aon Hewitt “U.S. Salary Increase Survey 2015-2016.” 47 Docket No. E002/GR-15-826
Lowenthal Direct
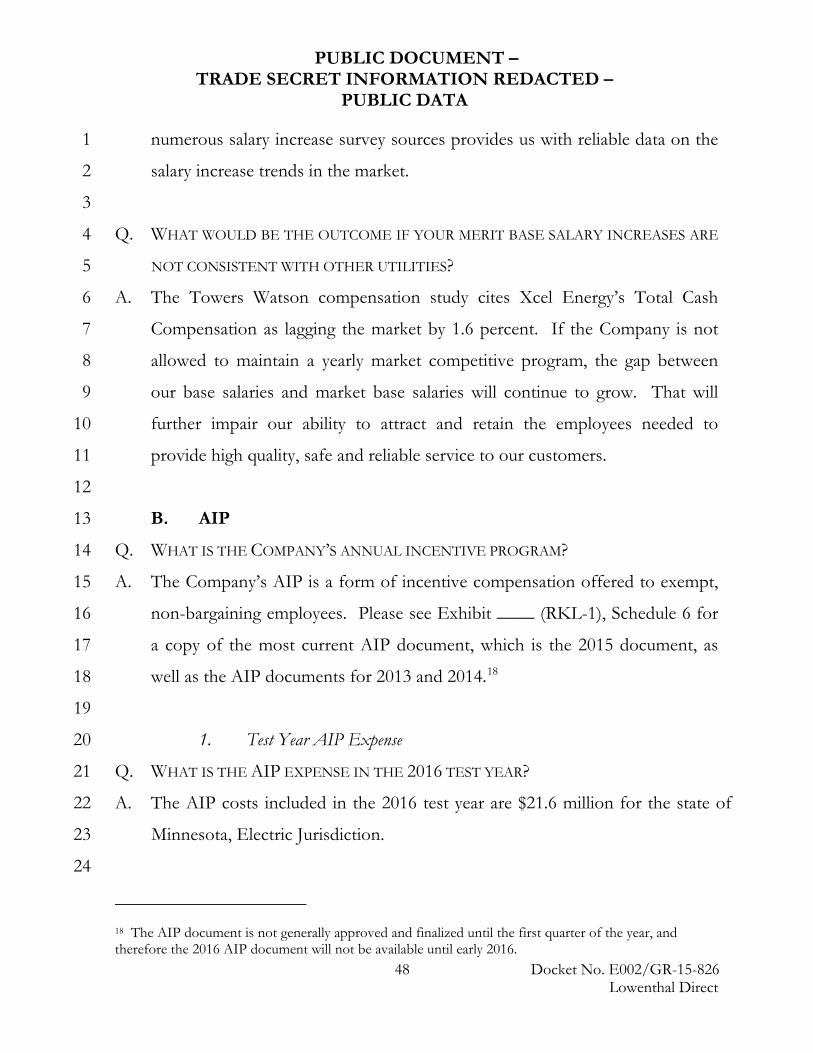
PUBLIC DOCUMENT – TRADE SECRET INFORMATION REDACTED –
PUBLIC DATA
numerous salary increase survey sources provides us with reliable data on the 1
salary increase trends in the market. 2
3
Q. WHAT WOULD BE THE OUTCOME IF YOUR MERIT BASE SALARY INCREASES ARE 4
NOT CONSISTENT WITH OTHER UTILITIES? 5
A. The Towers Watson compensation study cites Xcel Energy’s Total Cash 6
Compensation as lagging the market by 1.6 percent. If the Company is not 7
allowed to maintain a yearly market competitive program, the gap between 8
our base salaries and market base salaries will continue to grow. That will 9
further impair our ability to attract and retain the employees needed to 10
provide high quality, safe and reliable service to our customers. 11
12
B. AIP 13
Q. WHAT IS THE COMPANY’S ANNUAL INCENTIVE PROGRAM? 14
A. The Company’s AIP is a form of incentive compensation offered to exempt, 15
non-bargaining employees. Please see Exhibit ____ (RKL-1), Schedule 6 for 16
a copy of the most current AIP document, which is the 2015 document, as 17
well as the AIP documents for 2013 and 2014.18 18
19
1. Test Year AIP Expense 20
Q. WHAT IS THE AIP EXPENSE IN THE 2016 TEST YEAR? 21
A. The AIP costs included in the 2016 test year are $21.6 million for the state of 22
Minnesota, Electric Jurisdiction. 23
24
18 The AIP document is not generally approved and finalized until the first quarter of the year, and therefore the 2016 AIP document will not be available until early 2016. 48 Docket No. E002/GR-15-826
Lowenthal Direct
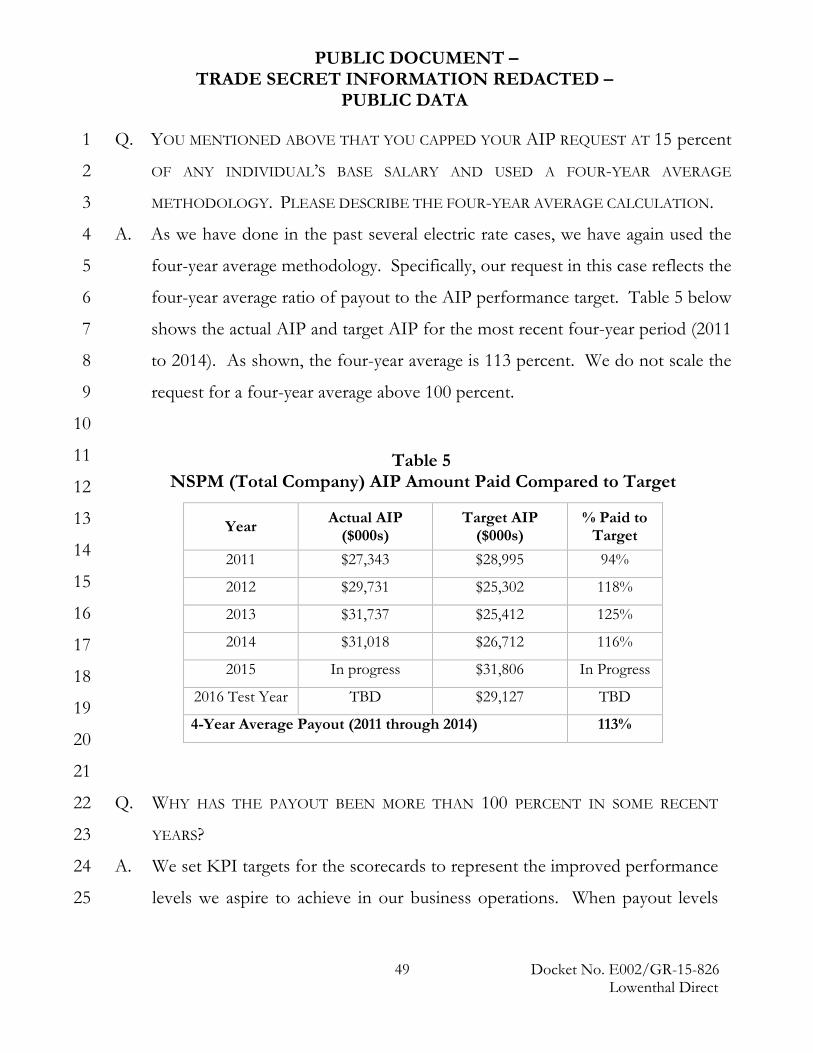
PUBLIC DOCUMENT – TRADE SECRET INFORMATION REDACTED –
PUBLIC DATA
Q. YOU MENTIONED ABOVE THAT YOU CAPPED YOUR AIP REQUEST AT 15 percent 1
OF ANY INDIVIDUAL’S BASE SALARY AND USED A FOUR-YEAR AVERAGE 2
METHODOLOGY. PLEASE DESCRIBE THE FOUR-YEAR AVERAGE CALCULATION. 3
A. As we have done in the past several electric rate cases, we have again used the 4
four-year average methodology. Specifically, our request in this case reflects the 5
four-year average ratio of payout to the AIP performance target. Table 5 below 6
shows the actual AIP and target AIP for the most recent four-year period (2011 7
to 2014). As shown, the four-year average is 113 percent. We do not scale the 8
request for a four-year average above 100 percent. 9
10
11
12
13
14
15
16
17
18
19
20
21
Q. WHY HAS THE PAYOUT BEEN MORE THAN 100 PERCENT IN SOME RECENT 22
YEARS? 23
A. We set KPI targets for the scorecards to represent the improved performance 24
levels we aspire to achieve in our business operations. When payout levels 25
Table 5 NSPM (Total Company) AIP Amount Paid Compared to Target
Year Actual AIP ($000s)
Target AIP ($000s)
% Paid to Target
2011 $27,343 $28,995 94%
2012 $29,731 $25,302 118%
2013 $31,737 $25,412 125%
2014 $31,018 $26,712 116%
2015 In progress $31,806 In Progress
2016 Test Year TBD $29,127 TBD
4-Year Average Payout (2011 through 2014) 113%
49 Docket No. E002/GR-15-826 Lowenthal Direct
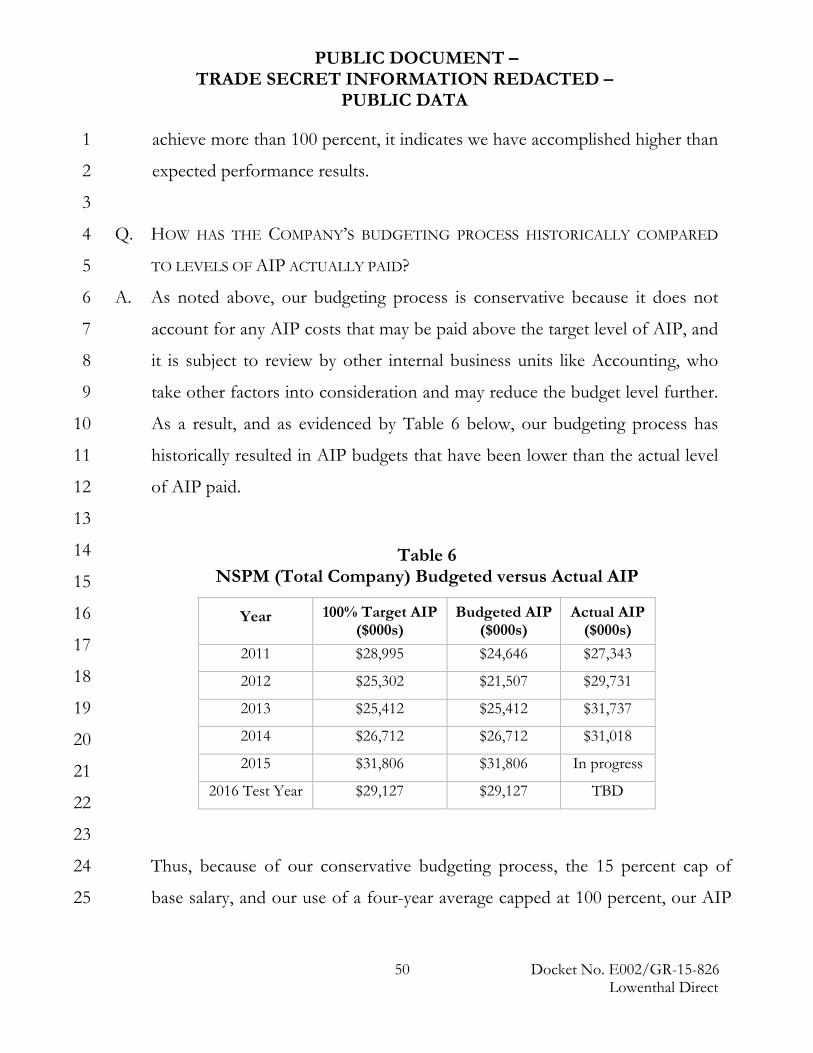
PUBLIC DOCUMENT – TRADE SECRET INFORMATION REDACTED –
PUBLIC DATA
achieve more than 100 percent, it indicates we have accomplished higher than 1
expected performance results. 2
3
Q. HOW HAS THE COMPANY’S BUDGETING PROCESS HISTORICALLY COMPARED 4
TO LEVELS OF AIP ACTUALLY PAID? 5
A. As noted above, our budgeting process is conservative because it does not 6
account for any AIP costs that may be paid above the target level of AIP, and 7
it is subject to review by other internal business units like Accounting, who 8
take other factors into consideration and may reduce the budget level further. 9
As a result, and as evidenced by Table 6 below, our budgeting process has 10
historically resulted in AIP budgets that have been lower than the actual level 11
of AIP paid. 12
13
14
15
16
17
18
19
20
21
22
23
Thus, because of our conservative budgeting process, the 15 percent cap of 24
base salary, and our use of a four-year average capped at 100 percent, our AIP 25
Table 6 NSPM (Total Company) Budgeted versus Actual AIP
Year 100% Target AIP ($000s)
Budgeted AIP ($000s)
Actual AIP ($000s)
2011 $28,995 $24,646 $27,343
2012 $25,302 $21,507 $29,731
2013 $25,412 $25,412 $31,737
2014 $26,712 $26,712 $31,018
2015 $31,806 $31,806 In progress
2016 Test Year $29,127 $29,127 TBD
50 Docket No. E002/GR-15-826 Lowenthal Direct
PUBLIC DOCUMENT – TRADE SECRET INFORMATION REDACTED –
PUBLIC DATA
request for rate recovery is narrow and will most likely be below our actual AIP 1
costs in the multi-year rate plan. 2
3
Q. DO ANY INDEPENDENT STUDIES DEMONSTRATE THAT THE COMPANY’S 4
OVERALL CASH COMPENSATION PROGRAM, INCLUDING THE AIP, IS 5
CONSISTENT WITH MARKET VALUES? 6
A. Yes, as I described earlier, the Towers Watson compensation study compares 7
our cash compensation program to programs offered by other utilities and 8
demonstrates that without the AIP, our median total cash compensation 9
would be well below the overall utility market. 10
11
2. Benefits of Incentive Compensation 12
Q. IS INCENTIVE COMPENSATION A COMMON APPROACH TO PROVIDING CASH 13
COMPENSATION IN THE UTILITY AND GENERAL INDUSTRIES? 14
A. Yes. Companies can provide cash compensation either through base salary 15
only or through a combination of base salary and incentive compensation. 16
Most companies, however, use a combination of base pay and incentive 17
compensation. 18
19
In fact, the use of performance-based award programs, in which 20
compensation must be re-earned each year, remained very high in 2014, with 21
93 percent of employers using this type of program according to an Aon 22
Hewitt survey of 1,214 U.S. companies.19 According to the 2014 Towers 23
Watson total cash compensation study, 100 percent of utilities in the national 24
sample maintain an annual incentive plan, and 100 percent of utilities in the 25
51 Docket No. E002/GR-15-826 Lowenthal Direct
PUBLIC DOCUMENT – TRADE SECRET INFORMATION REDACTED –
PUBLIC DATA
revenue-based sample maintain an annual incentive plan. Towers Watson has 1
also reported incentive compensation is used by 99 percent of publicly traded 2
companies.20 3
4
Q. WHY DO YOU BELIEVE THE USE OF INCENTIVE COMPENSATION IS SO 5
COMMON? 6
A. I believe the widespread use of incentive compensation is due to two 7
fundamental benefits: (1) it promotes superior employee performance; and (2) 8
it reduces fixed labor costs. 9
10
Q. HOW DOES INCENTIVE COMPENSATION AFFECT EMPLOYEE PERFORMANCE? 11
A. A fundamental tenet of incentive compensation is that it is a powerful way to 12
promote superior employee performance. The role of incentive pay is to align 13
compensation with results, and it is better than a base-pay-only approach in 14
this respect. Research has shown that pay-for-performance can positively 15
affect performance, but it must be seen as being tied to performance.21 In 16
particular, it is necessary that the incentive amount can be reduced or 17
eliminated, resulting in below-market cash compensation, when performance 18
metrics are not met. This approach motivates employees to perform at a 19
higher level because they are compensated for doing so. 20
21
Q. HOW DOES THE COMPANY’S AIP PROMOTE SUPERIOR PERFORMANCE FROM 22
EMPLOYEES? 23
19 Aon Hewitt “US Salary Increase Survey,” 2015-2016. 20 WorldatWork “Incentive Pay Practices Survey: Publicly Traded Companies,” 2014 21 See http://www.shrm.org/hrdisciplines/compensation/articles/pages/cms_005592.aspx 52 Docket No. E002/GR-15-826
Lowenthal Direct
PUBLIC DOCUMENT – TRADE SECRET INFORMATION REDACTED –
PUBLIC DATA
A. Incentive pay is one of the strongest ways to motivate employee performance 1
consistent with Company objectives. In our case, providing safe, reliable 2
electric service to our customers is the most important objective. Our AIP 3
program directly aligns Company objectives and customers’ interests by 4
awarding incentive compensation when individual, business area, and 5
corporate components achieve goals that promote overall customer 6
satisfaction, safety, and reliability. By reinforcing positive employee 7
performance that is tied to customer benefit-oriented components, the AIP 8
serves as a catalyst for improving customer service and satisfaction. Thus, the 9
AIP helps drive superior employee performance that consequently benefits 10
customers through more efficient and higher quality service. 11
12
Q. DO YOU BELIEVE IT IS APPROPRIATE TO RECOVER AIP COSTS IN RATES? 13
A. Yes. If we were to rely on current base salary alone, the Company’s 14
compensation levels would be well below market levels and it would limit our 15
ability to motivate and reward our employees for superior performance. 16
Incentive pay directly aligns employee, corporate, and customer interests. In 17
addition, incentive pay helps reduce overall compensation costs by requiring 18
the employee to re-earn the reward every year and by reducing the base salary 19
costs upon which other benefit costs are based. 20
21
As discussed above, we would need to significantly adjust the base wages for 22
our employees to remain competitive in the market if we did not have the 23
AIP program. However, this would not necessarily result in superior 24
performance levels, as the motivation to receive an incentive for their efforts 25
would be absent. This change would also drastically increase our benefit and 26
53 Docket No. E002/GR-15-826 Lowenthal Direct

PUBLIC DOCUMENT – TRADE SECRET INFORMATION REDACTED –
PUBLIC DATA
retirement costs, without necessarily adding any value to our customers. 1
2
3. Structure of the Company’s AIP 3
Q. PLEASE DESCRIBE THE COMPANY’S AIP. 4
A. The Company’s AIP uses metrics specifically focused on providing benefits to 5
customers in the form of greater efficiencies in operations, increased 6
customer satisfaction, improved reliability, increased employee engagement, 7
environmental leadership, and higher safety levels. Each eligible employee 8
has a targeted annual incentive expressed as a percentage of base salary. The 9
percentage is determined by position or level within the organization and, 10
when combined with the employee’s base salary, delivers a market-11
competitive level of total cash compensation. If an individual employee has 12
unsatisfactory performance for the year, he or she will not receive an 13
incentive award regardless of corporate and business area performance. 14
15
Q. PLEASE DESCRIBE IN MORE DETAIL THE PERFORMANCE COMPONENTS OF THE 16
2015 AIP. 17
A. The AIP includes the components in Table 7 below. 18
54 Docket No. E002/GR-15-826 Lowenthal Direct
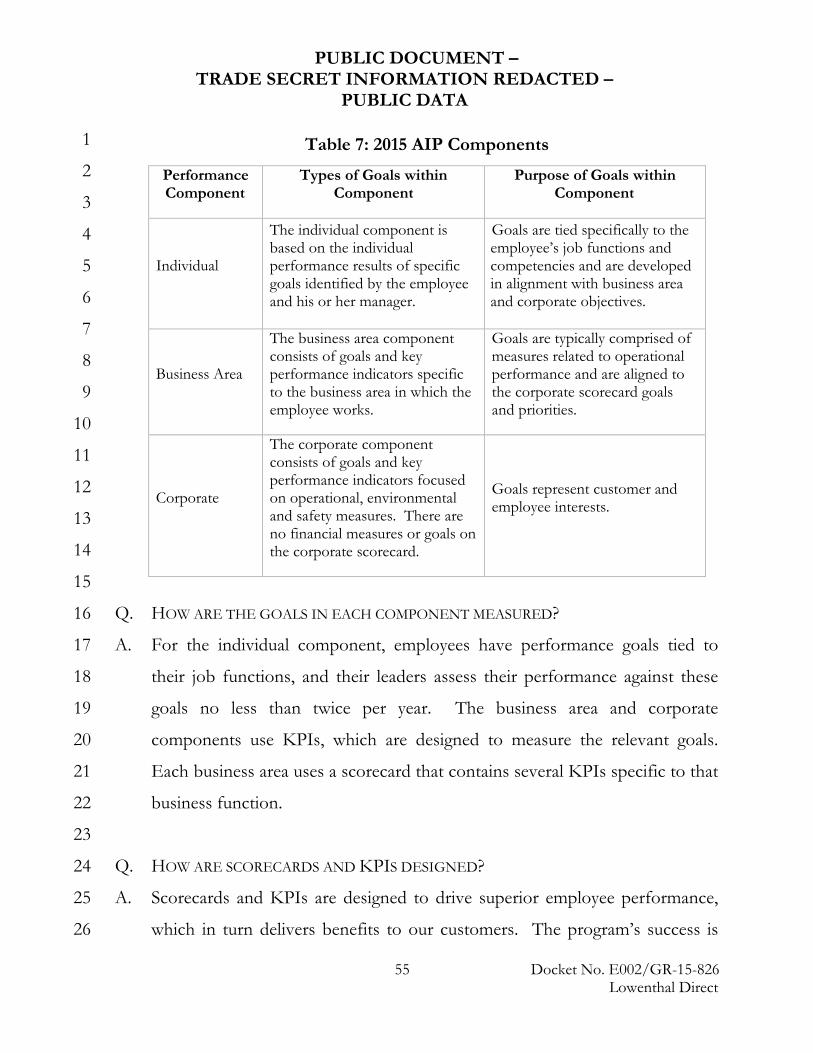
PUBLIC DOCUMENT – TRADE SECRET INFORMATION REDACTED –
PUBLIC DATA
1
2
3
4
5
6
7
8
9
10
11
12
13
14
15
Q. HOW ARE THE GOALS IN EACH COMPONENT MEASURED? 16
A. For the individual component, employees have performance goals tied to 17
their job functions, and their leaders assess their performance against these 18
goals no less than twice per year. The business area and corporate 19
components use KPIs, which are designed to measure the relevant goals. 20
Each business area uses a scorecard that contains several KPIs specific to that 21
business function. 22
23
Q. HOW ARE SCORECARDS AND KPIS DESIGNED? 24
A. Scorecards and KPIs are designed to drive superior employee performance, 25
which in turn delivers benefits to our customers. The program’s success is 26
Table 7: 2015 AIP Components
Performance Component
Types of Goals within Component
Purpose of Goals within Component
Individual
The individual component is based on the individual performance results of specific goals identified by the employee and his or her manager.
Goals are tied specifically to the employee’s job functions and competencies and are developed in alignment with business area and corporate objectives.
Business Area
The business area component consists of goals and key performance indicators specific to the business area in which the employee works.
Goals are typically comprised of measures related to operational performance and are aligned to the corporate scorecard goals and priorities.
Corporate
The corporate component consists of goals and key performance indicators focused on operational, environmental and safety measures. There are no financial measures or goals on the corporate scorecard.
Goals represent customer and employee interests.
55 Docket No. E002/GR-15-826 Lowenthal Direct

PUBLIC DOCUMENT – TRADE SECRET INFORMATION REDACTED –
PUBLIC DATA
dependent on setting the right goals. From my perspective as an HR 1
professional, this makes sense because if the goals are too easy to achieve, the 2
Company and its customers gain little because incentives are paid for goals 3
the employees would have likely achieved without the AIP. If the goals are 4
too difficult to achieve, employees may see them as a disincentive. I will 5
discuss below the process the Company undertakes to ensure that the goals 6
are sufficiently demanding but do not represent a disincentive. 7
8
Q. HAS THE CORPORATE SCORECARD BEEN MODIFIED? 9
A. Yes. Earnings Per Share (EPS) of Xcel Energy stock was removed as a 10
Corporate Goal beginning in 2012. In 2014, the Demand Side Management 11
goal was removed and the O&M Growth Management goal was added. The 12
goals and KPIs for the 2015 Corporate Scorecard are provided in Table 8 13
below. The detailed goals for the 2015 AIP are provided in Schedule 6. 14
56 Docket No. E002/GR-15-826 Lowenthal Direct
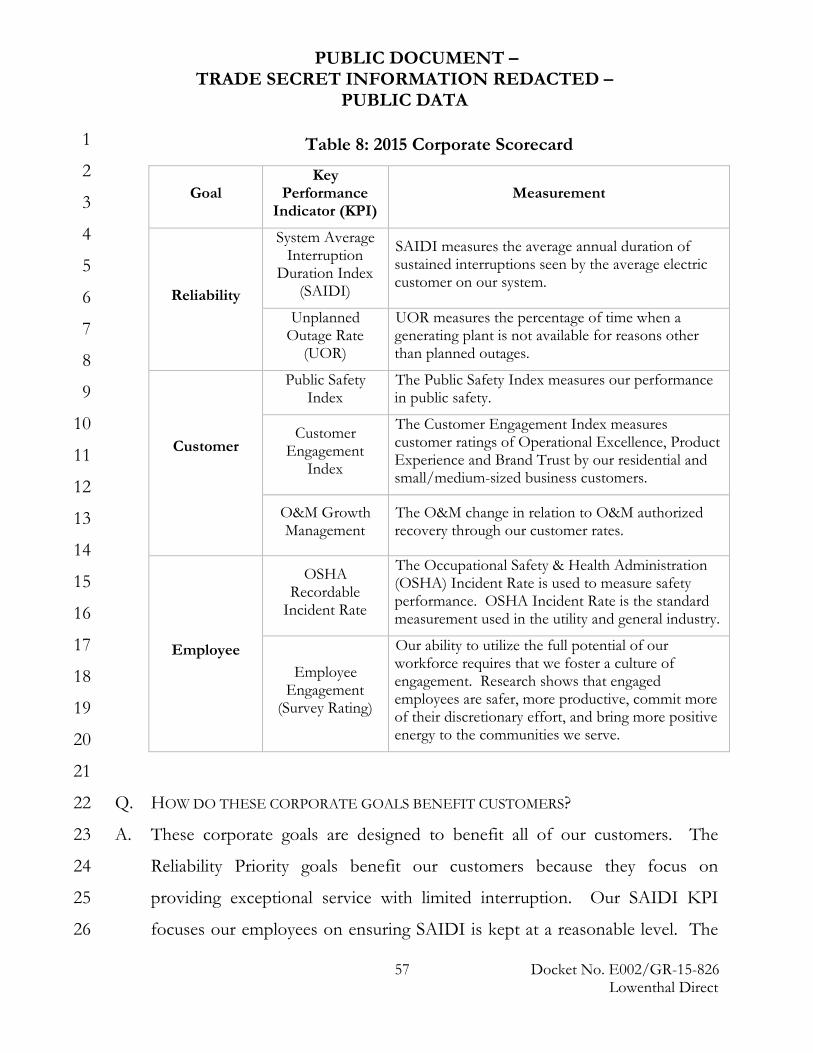
PUBLIC DOCUMENT – TRADE SECRET INFORMATION REDACTED –
PUBLIC DATA
1
2
3
4
5
6
7
8
9
10
11
12
13
14
15
16
17
18
19
20
21
Q. HOW DO THESE CORPORATE GOALS BENEFIT CUSTOMERS? 22
A. These corporate goals are designed to benefit all of our customers. The 23
Reliability Priority goals benefit our customers because they focus on 24
providing exceptional service with limited interruption. Our SAIDI KPI 25
focuses our employees on ensuring SAIDI is kept at a reasonable level. The 26
Table 8: 2015 Corporate Scorecard
Goal Key
Performance Indicator (KPI)
Measurement
Reliability
System Average Interruption
Duration Index (SAIDI)
SAIDI measures the average annual duration of sustained interruptions seen by the average electric customer on our system.
Unplanned Outage Rate
(UOR)
UOR measures the percentage of time when a generating plant is not available for reasons other than planned outages.
Customer
Public Safety Index
The Public Safety Index measures our performance in public safety.
Customer Engagement
Index
The Customer Engagement Index measures customer ratings of Operational Excellence, Product Experience and Brand Trust by our residential and small/medium-sized business customers.
O&M Growth Management
The O&M change in relation to O&M authorized recovery through our customer rates.
Employee
OSHA Recordable
Incident Rate
The Occupational Safety & Health Administration (OSHA) Incident Rate is used to measure safety performance. OSHA Incident Rate is the standard measurement used in the utility and general industry.
Employee Engagement
(Survey Rating)
Our ability to utilize the full potential of our workforce requires that we foster a culture of engagement. Research shows that engaged employees are safer, more productive, commit more of their discretionary effort, and bring more positive energy to the communities we serve.
57 Docket No. E002/GR-15-826 Lowenthal Direct
PUBLIC DOCUMENT – TRADE SECRET INFORMATION REDACTED –
PUBLIC DATA
UOR KPI is focused on reducing unplanned outages through improved work 1
scheduling and planning, quality assurance, and human capital. The Company 2
works to achieve a level of reliability that is consistent with the value our 3
customers attribute to reliability compared to the cost. 4
5
Our Customer Priority goals focus on meeting value and safety expectations 6
of our customers. The Public Safety Index KPI measures our public safety 7
performance. The Public Safety Index includes a variety of metrics, including 8
contacts to our electric service lines; contractor communication to provide 9
information concerning working safely where overhead lines are present; and 10
training for electric first responders. The Customer Engagement Index KPI 11
helps to ensure that we are meeting our customers’ expectations in other 12
areas: it measures our customers’ perception of operational excellence, 13
product experience and brand trust. The O&M growth measure added in 14
2014 promotes mindful spending and more efficient execution of projects and 15
programs across the Company. 16
17
The Employee Priority KPIs focus on the safe delivery of service to our 18
customers, as well as the level of engagement our employees are feeling about 19
their work and their work environment. Including the Safety and 20
Engagement KPIs helps to ensure that we have a safe and productive 21
workforce to deliver service to our customers. Safety is a core value of Xcel 22
Energy: the OSHA Recordable Incident Rate KPI reinforces its importance 23
in our corporate culture. The higher the safety level of our employees, the 24
more productive and reliable the service. Similarly, engaged employees are 25
necessary to every facet of our business – especially in today’s environment, 26
58 Docket No. E002/GR-15-826 Lowenthal Direct
PUBLIC DOCUMENT – TRADE SECRET INFORMATION REDACTED –
PUBLIC DATA
as we seek to improve productivity and keep our costs competitive for our 1
customers. 2
3
Q. IS IT REASONABLE TO INCLUDE EPS AS AN AFFORDABILITY TRIGGER? 4
A. Yes. While we have removed EPS from the corporate scorecard, payment of 5
incentive compensation in the face of poor financial performance is not 6
reasonable. The trigger is used to ensure payment of the AIP can be made, 7
not to guarantee payments will be made. Individuals must earn incentive pay 8
through performance by achieving individual, business unit, and corporate 9
goals. As previously described, the corporate scorecard is based exclusively 10
on operational goals. This serves to balance healthy financial performance 11
and operational excellence to truly deliver maximum benefits possible to 12
customers. 13
14
Q. DO YOU ANTICIPATE CHANGES TO THE SCORECARD FOR 2016? 15
A. Yes. We reevaluate and discuss the goals and KPIs for the scorecard on an 16
annual basis. During this process we evaluate several different components, 17
including our own corporate goals, industry best practices, and customer 18
expectations. Currently, those discussions are underway and the scorecards 19
for 2016 are not finalized. I anticipate there will be changes as a result of 20
those discussions as we move further into the 2016 planning process. 21
22
4. AIP Compliance 23
Q. IN ITS ORDER IN DOCKET NO. E002/GR-13-868, THE COMMISSION ISSUED 24
ORDER POINT NO. 29 REFERENCING THE COMMISSION’S SEPTEMBER 3, 2013 25
ORDER IN DOCKET NO. E002/GR-12-961 WHICH DIRECTED THE COMPANY 26
59 Docket No. E002/GR-15-826 Lowenthal Direct
PUBLIC DOCUMENT – TRADE SECRET INFORMATION REDACTED –
PUBLIC DATA
TO ANALYZE THE AIP TARGETS. HAS THE COMPANY PERFORMED THAT 1
ANALYSIS? 2
A. Yes. The Company has evaluated its AIP targets. Based upon the process for 3
setting AIP goals and the fact that employees have not been able to achieve 4
their AIP goals on some occasions, the Company concludes that our AIP 5
goals strike the right balance between being difficult enough to challenge our 6
employees, while not being so difficult as to serve as a disincentive. 7
8
Q. WHAT IS THE INTENT OF A PERFORMANCE GOAL OR KPI? 9
A. The intent of a performance goal is to motivate employees to provide 10
excellent service to the Company and its customers, as well as to drive 11
superior operational performance. In order to serve as a motivation, 12
however, the KPIs must be set at levels that can be met with the requisite 13
amount of talent and effort. Goals that are not truly attainable actually serve 14
as a disincentive, because employees know they will not be rewarded for the 15
extra effort they give. 16
17
Q. DOES THE ACHIEVEMENT OF A KPI LEAD TO A “BONUS” FOR THE EMPLOYEE? 18
A. No. If the goals are achieved and AIP is paid at target (or 100 percent), the 19
employee’s compensation level for that year is just then meeting market levels. 20
Anything less than 100 percent of the full AIP amount puts the employee at a 21
compensation level below what other companies and utilities are paying. 22
23
Q. ARE ANY OTHER WITNESSES SUPPORTING THE REASONABLENESS OF KPIS IN 24
THEIR BUSINESS AREAS? 25
60 Docket No. E002/GR-15-826 Lowenthal Direct
PUBLIC DOCUMENT – TRADE SECRET INFORMATION REDACTED –
PUBLIC DATA
A. Yes. The following Company witnesses support the reasonableness of their 1
specific KPIs or business area scorecards: 2
• Utilities & Corporate Services scorecard – myself and David C. 3
Harkness 4
• Customer Care scorecard – Michael C. Gersack 5
• Distribution Operations scorecard – Kelly A. Bloch 6
• Energy Supply scorecard – Steven H. Mills 7
• Financial Operations scorecard – Gregory J. Robinson 8
• Nuclear scorecard – Timothy J. O’Connor 9
• Supply Chain scorecard – Gary J. O’Hara 10
• Transmission scorecard – Ian R. Benson 11
12
We are addressing the Commission’s order point requiring further discussion 13
about our AIP goals for those business areas that have provided testimony in 14
support of our rate request. There are additional scorecards and KPIs that 15
are not discussed in this case that are either supported by business areas that 16
do not have testimony in this case or are not related to AIP. I further note 17
the overall Corporate scorecard, which I discussed earlier in my testimony, 18
consists of KPIs linked to the goals in the business area scorecards set forth 19
above. For that reason, the discussion of individual witnesses regarding the 20
goals on their respective business area scorecards relates to the KPIs on the 21
Corporate scorecard. 22
23
Q. ARE YOU SUPPORTING THE REASONABLENESS OF ANY OF THE KPIS? 24
61 Docket No. E002/GR-15-826 Lowenthal Direct
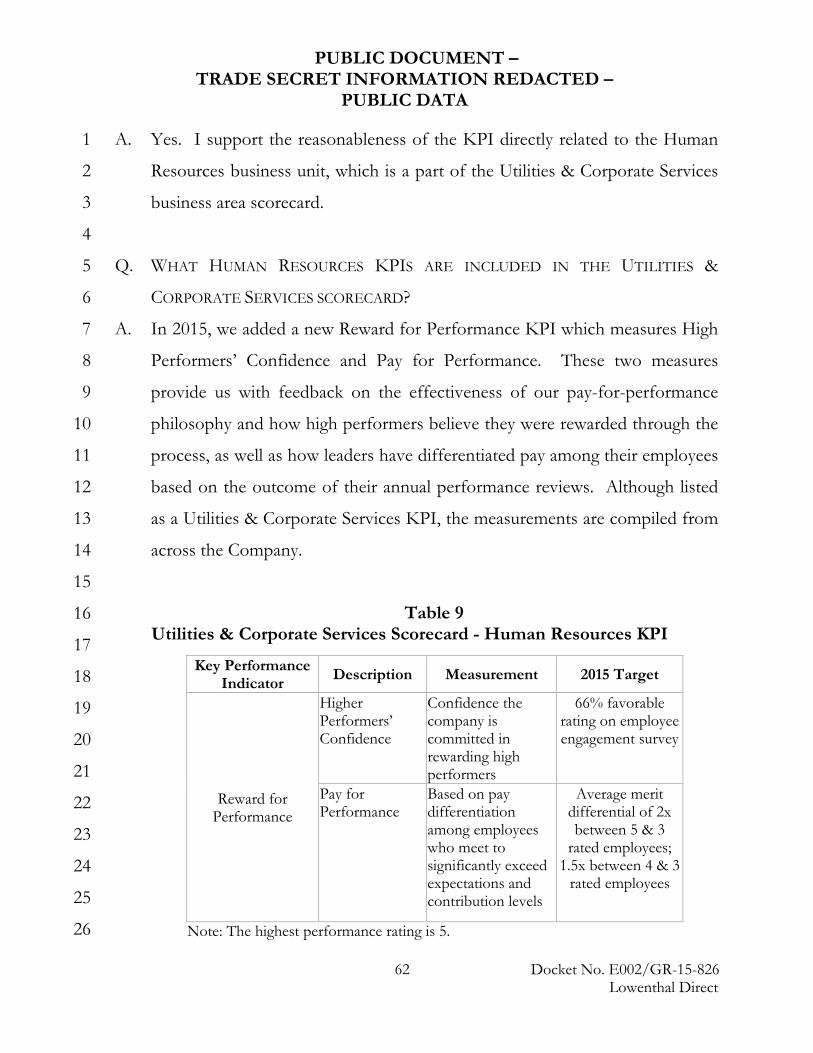
PUBLIC DOCUMENT – TRADE SECRET INFORMATION REDACTED –
PUBLIC DATA
A. Yes. I support the reasonableness of the KPI directly related to the Human 1
Resources business unit, which is a part of the Utilities & Corporate Services 2
business area scorecard. 3
4
Q. WHAT HUMAN RESOURCES KPIS ARE INCLUDED IN THE UTILITIES & 5
CORPORATE SERVICES SCORECARD? 6
A. In 2015, we added a new Reward for Performance KPI which measures High 7
Performers’ Confidence and Pay for Performance. These two measures 8
provide us with feedback on the effectiveness of our pay-for-performance 9
philosophy and how high performers believe they were rewarded through the 10
process, as well as how leaders have differentiated pay among their employees 11
based on the outcome of their annual performance reviews. Although listed 12
as a Utilities & Corporate Services KPI, the measurements are compiled from 13
across the Company. 14
15
16
17
18
19
20
21
22
23
24
25
26
Table 9 Utilities & Corporate Services Scorecard - Human Resources KPI
Key Performance Indicator Description Measurement 2015 Target
Reward for Performance
Higher Performers’ Confidence
Confidence the company is committed in rewarding high performers
66% favorable rating on employee engagement survey
Pay for Performance
Based on pay differentiation among employees who meet to significantly exceed expectations and contribution levels
Average merit differential of 2x between 5 & 3
rated employees; 1.5x between 4 & 3
rated employees
Note: The highest performance rating is 5.
62 Docket No. E002/GR-15-826 Lowenthal Direct
PUBLIC DOCUMENT – TRADE SECRET INFORMATION REDACTED –
PUBLIC DATA
Q. WHY WAS THIS KPI ADDED FOR 2015? 1
A. One of our corporate priorities is Workforce Excellence and transitioning the 2
workforce. The Reward for Performance KPI drives the results of our pay-3
for-performance philosophy which supports our focus on workforce 4
excellence. The two components address the questions of whether our 5
rewards affect our highest performers in a positive manner, as they should, 6
and whether our leaders address differences in performance by differentiating 7
their employees through pay. Our Human Resources KPIs will adapt and 8
change to focus on our priorities related to transitioning our workforce 9
further our strategic corporate goals. This KPI and its measures place 10
emphasis on our current workforce transitioning efforts. 11
12
Q. BASED ON YOUR REVIEW, WHAT DO YOU CONCLUDE ABOUT THE INCENTIVE 13
METRIC USED BY THE HUMAN RESOURCES BUSINESS UNIT? 14
A. The goals for Human Resources are focused on transitioning the workforce 15
and rewarding our high performers who help carry-out that goal. 16
Transitioning the workforce is a key component to preserving and 17
transferring the knowledge necessary to support our ability to provide reliable 18
customer service now and in the future. 19
20
In order to serve as true incentives, KPIs must be set at levels that require 21
outstanding performance, but not so high that they are unattainable. I believe 22
the Human Resources KPI level meets this requirement. We must work very 23
hard to achieve our KPI levels, and even with the best of efforts, we still may 24
not achieve our desired results. Our AIP goals are set appropriately and 25
sufficiently challenge the Company and its employees to meet them. 26
63 Docket No. E002/GR-15-826 Lowenthal Direct
PUBLIC DOCUMENT – TRADE SECRET INFORMATION REDACTED –
PUBLIC DATA
1
C. Spot On Award Recognition Program 2
Q. WHAT IS THE SPOT ON AWARD RECOGNITION PROGRAM? 3
A. The Spot On Award program allows managers to recognize and reward non-4
exempt, non-bargaining employees with a recognition award for outstanding 5
performance close to the time when the employee has made the contribution. 6
7
Q. ARE AIP-ELIGIBLE EMPLOYEES ALSO ELIGIBLE FOR THE SPOT ON AWARD 8
PROGRAM? 9
A. No. Employees eligible for the AIP are not eligible for the Spot On Award 10
program. 11
12
Q. WHY DID THE COMPANY INITIATE THE SPOT ON AWARD PROGRAM? 13
A. The Company initiated the program in 2011 because the elimination of the 14
AIP for non-exempt, non-bargaining employees left them with no form of 15
incentive compensation. The Spot On Award program is designed to 16
motivate non-exempt, non-bargaining employees to provide superior 17
performance. 18
19
Q. WHAT IS THE SPOT ON AWARD PROGRAM EXPENSE IN THE 2016 TEST YEAR? 20
A. The 2016 test year expense amount is $201,160 (State of Minnesota, Electric 21
Jurisdiction). 22
23
Q. WHAT WERE THE AMOUNTS OF THE SPOT ON AWARD PROGRAM EXPENSE IN 24
THE YEARS PRIOR TO THE 2016 TEST YEAR? 25
64 Docket No. E002/GR-15-826 Lowenthal Direct
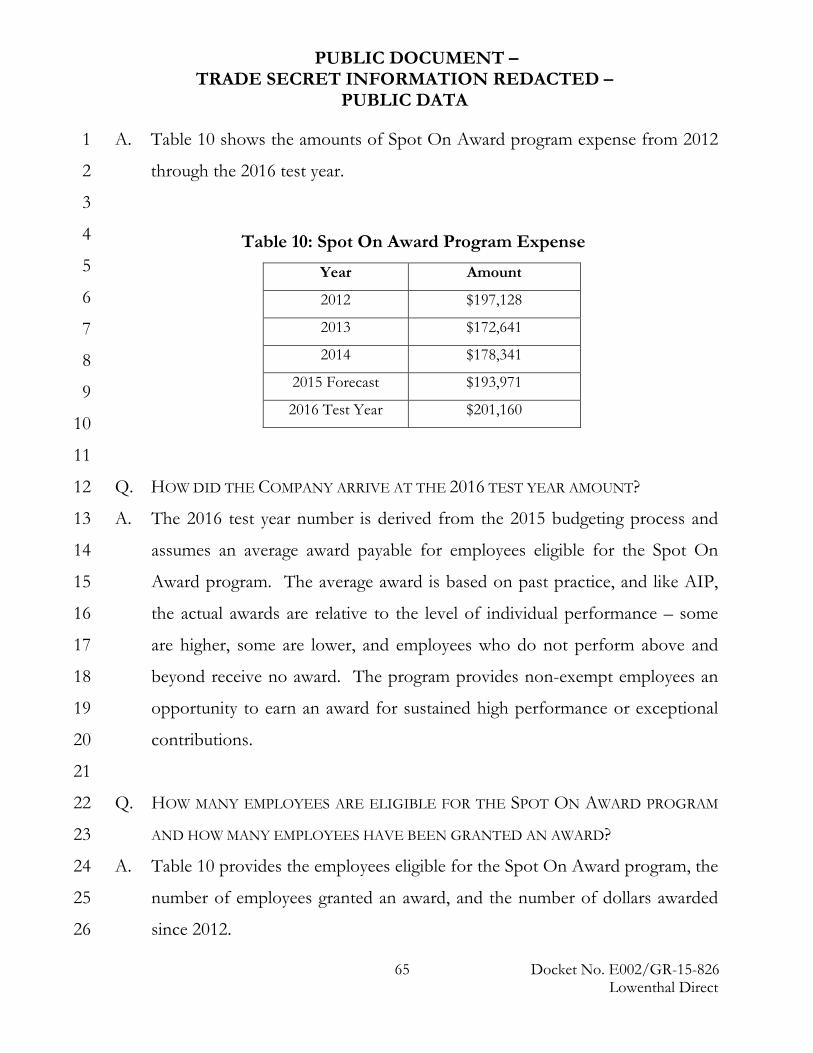
PUBLIC DOCUMENT – TRADE SECRET INFORMATION REDACTED –
PUBLIC DATA
A. Table 10 shows the amounts of Spot On Award program expense from 2012 1
through the 2016 test year. 2
3
4
5
6
7
8
9
10
11
Q. HOW DID THE COMPANY ARRIVE AT THE 2016 TEST YEAR AMOUNT? 12
A. The 2016 test year number is derived from the 2015 budgeting process and 13
assumes an average award payable for employees eligible for the Spot On 14
Award program. The average award is based on past practice, and like AIP, 15
the actual awards are relative to the level of individual performance – some 16
are higher, some are lower, and employees who do not perform above and 17
beyond receive no award. The program provides non-exempt employees an 18
opportunity to earn an award for sustained high performance or exceptional 19
contributions. 20
21
Q. HOW MANY EMPLOYEES ARE ELIGIBLE FOR THE SPOT ON AWARD PROGRAM 22
AND HOW MANY EMPLOYEES HAVE BEEN GRANTED AN AWARD? 23
A. Table 10 provides the employees eligible for the Spot On Award program, the 24
number of employees granted an award, and the number of dollars awarded 25
since 2012. 26
Table 10: Spot On Award Program Expense
Year Amount
2012 $197,128
2013 $172,641
2014 $178,341
2015 Forecast $193,971
2016 Test Year $201,160
65 Docket No. E002/GR-15-826 Lowenthal Direct
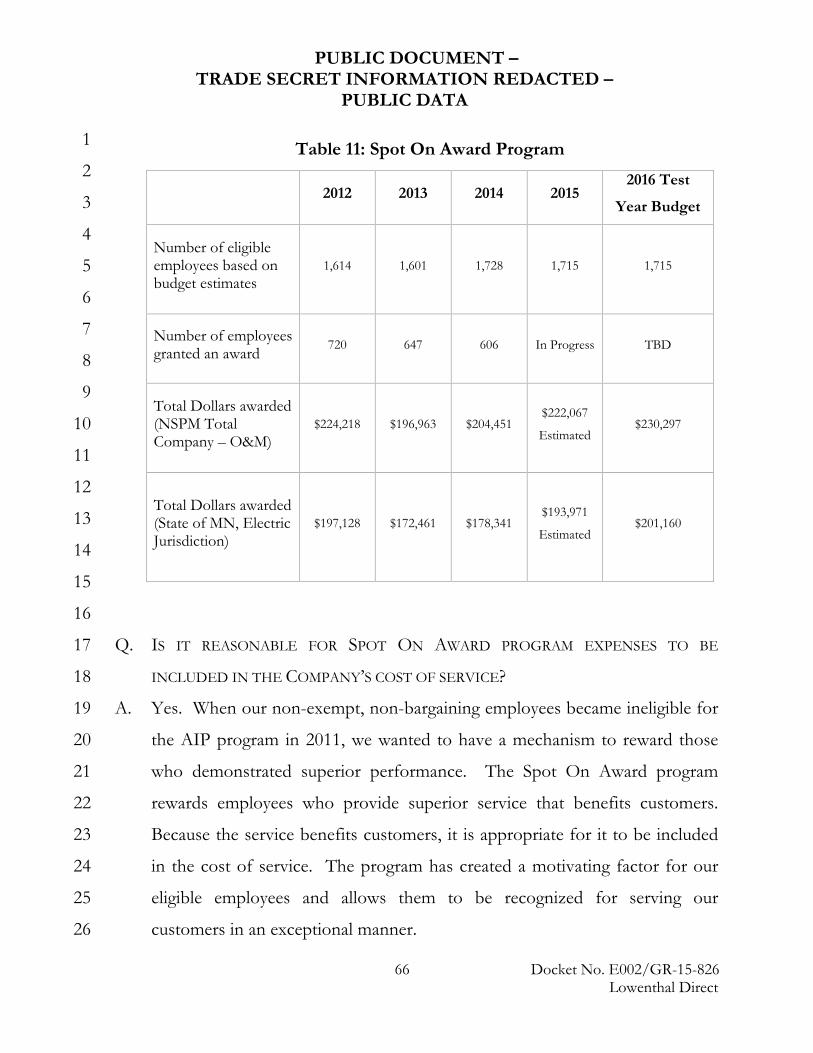
PUBLIC DOCUMENT – TRADE SECRET INFORMATION REDACTED –
PUBLIC DATA
1
2
3
4
5
6
7
8
9
10
11
12
13
14
15
16
Q. IS IT REASONABLE FOR SPOT ON AWARD PROGRAM EXPENSES TO BE 17
INCLUDED IN THE COMPANY’S COST OF SERVICE? 18
A. Yes. When our non-exempt, non-bargaining employees became ineligible for 19
the AIP program in 2011, we wanted to have a mechanism to reward those 20
who demonstrated superior performance. The Spot On Award program 21
rewards employees who provide superior service that benefits customers. 22
Because the service benefits customers, it is appropriate for it to be included 23
in the cost of service. The program has created a motivating factor for our 24
eligible employees and allows them to be recognized for serving our 25
customers in an exceptional manner. 26
Table 11: Spot On Award Program
2012 2013 2014 2015 2016 Test
Year Budget
Number of eligible employees based on budget estimates
1,614 1,601 1,728 1,715 1,715
Number of employees granted an award 720 647 606 In Progress TBD
Total Dollars awarded (NSPM Total Company – O&M)
$224,218 $196,963 $204,451 $222,067
Estimated $230,297
Total Dollars awarded (State of MN, Electric Jurisdiction)
$197,128 $172,461 $178,341 $193,971
Estimated $201,160
66 Docket No. E002/GR-15-826 Lowenthal Direct

PUBLIC DOCUMENT – TRADE SECRET INFORMATION REDACTED –
PUBLIC DATA
1
Q. DO YOU HAVE ANY EXAMPLES OF AN INSTANCE WHEN A SPOT ON AWARD 2
WAS ISSUED? 3
A. Yes. In one instance an employee increased production by 17 percent year-4
over-year resulting in a savings of $26,000. In another example, an employee 5
worked closely with representatives from two cities and designed all aspects 6
of a $1.4 million electrical feeder project to reach a constructive outcome for 7
all parties. 8
9
Q. WHAT DO YOU CONCLUDE ABOUT TOTAL REWARDS PROGRAM CASH 10
COMPENSATION COSTS? 11
A. These costs are reasonable and necessary to attract, recruit and retain the 12
talent necessary to continue to offer safe and reliable service. 13
14
VII. ACTIVE HEALTH AND WELFARE COSTS 15
16
Q. WHAT TOPIC DO YOU DISCUSS IN THIS SECTION OF YOUR TESTIMONY? 17
A. I describe the active healthcare and welfare programs that the Company 18
offers to eligible employees. Mr. Schrubbe discusses the actual amounts of 19
health and welfare costs in his testimony, and he describes the cost trends 20
that the Company is experiencing. 21
22
Q. WHAT ACTIVE HEALTH AND WELFARE PROGRAMS DOES THE COMPANY 23
OFFER? 24
67 Docket No. E002/GR-15-826 Lowenthal Direct
PUBLIC DOCUMENT – TRADE SECRET INFORMATION REDACTED –
PUBLIC DATA
A. The Company’s active health and welfare programs primarily consist of 1
providing medical, pharmacy, dental, disability, vision, and life insurance 2
coverage to our bargaining and non-bargaining employees and their families. 3
4
Q. PLEASE DESCRIBE THE COMPANY’S MEDICAL AND PHARMACY PLAN FOR 5
EMPLOYEES AND THEIR FAMILIES. 6
A. The Company offers employees one medical plan option, the High 7
Deductible Health Plan (HDHP) with a Health Savings Account (HSA). All 8
plan participants are subject to an annual high deductible related to either 9
single or family coverage. After that deductible is satisfied, the Plan begins to 10
share any additional costs. Please see Exhibit___(RKL-1), Appendix A for 11
the annual premiums employees pay as well as the type of services covered by 12
the HDHP. 13
14
Q. WHAT IS THE SHARING RATIO AFTER THE DEDUCTIBLE IS MET? 15
A. After the deductible is met, the plan covers 90 percent of costs, with 16
employees or their dependents contributing 10 percent of medical costs and 17
20 to 50 percent of prescription drug costs until they reach an annual out-of-18
pocket maximum, which is $3,500 per individual or $7,000 per family. After 19
the out-of-pocket maximum is met, the Plan covers the remaining eligible 20
medical and pharmacy expenses for the calendar year. Employees pay a 21
monthly premium for this HDHP, and a combination of their out-of-pocket 22
expenses and premiums covers 27.5 percent of the total cost. 23
24
The plan provides lower levels of benefits coverage for using out-of-network 25
medical providers. The HSA is a tax-advantaged medical savings account 26
68 Docket No. E002/GR-15-826 Lowenthal Direct
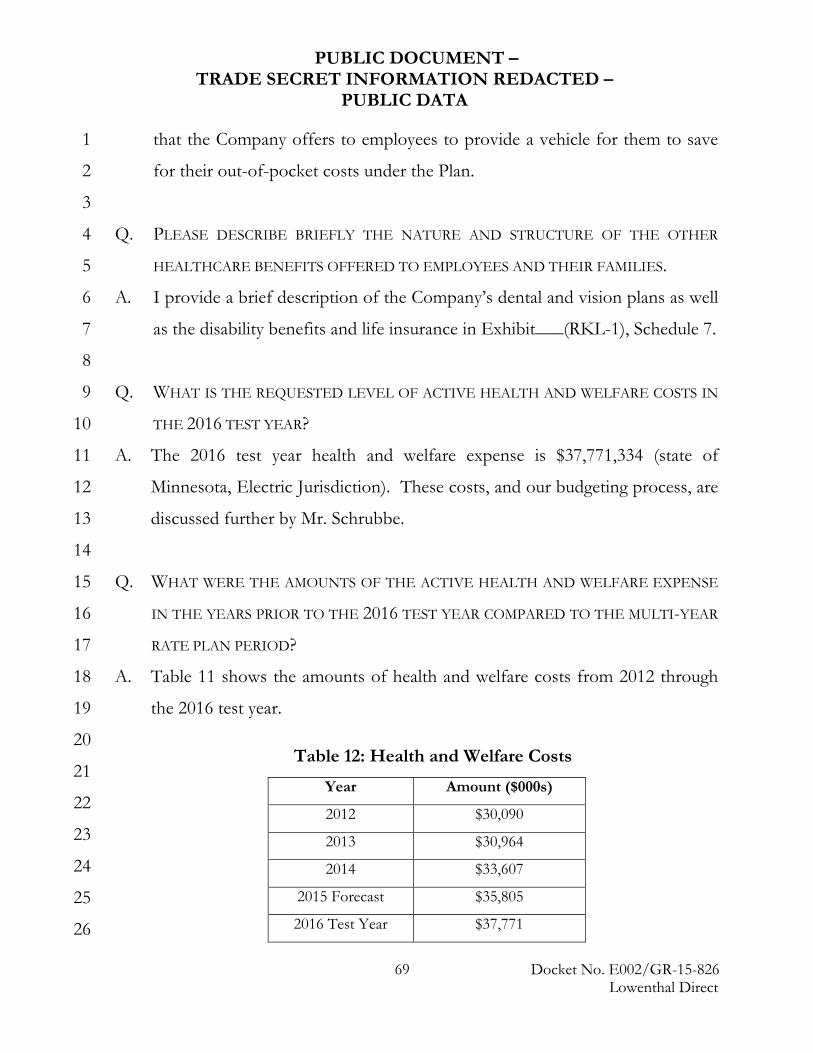
PUBLIC DOCUMENT – TRADE SECRET INFORMATION REDACTED –
PUBLIC DATA
that the Company offers to employees to provide a vehicle for them to save 1
for their out-of-pocket costs under the Plan. 2
3
Q. PLEASE DESCRIBE BRIEFLY THE NATURE AND STRUCTURE OF THE OTHER 4
HEALTHCARE BENEFITS OFFERED TO EMPLOYEES AND THEIR FAMILIES. 5
A. I provide a brief description of the Company’s dental and vision plans as well 6
as the disability benefits and life insurance in Exhibit___(RKL-1), Schedule 7. 7
8
Q. WHAT IS THE REQUESTED LEVEL OF ACTIVE HEALTH AND WELFARE COSTS IN 9
THE 2016 TEST YEAR? 10
A. The 2016 test year health and welfare expense is $37,771,334 (state of 11
Minnesota, Electric Jurisdiction). These costs, and our budgeting process, are 12
discussed further by Mr. Schrubbe. 13
14
Q. WHAT WERE THE AMOUNTS OF THE ACTIVE HEALTH AND WELFARE EXPENSE 15
IN THE YEARS PRIOR TO THE 2016 TEST YEAR COMPARED TO THE MULTI-YEAR 16
RATE PLAN PERIOD? 17
A. Table 11 shows the amounts of health and welfare costs from 2012 through 18
the 2016 test year. 19
20
21
22
23
24
25
26
Table 12: Health and Welfare Costs
Year Amount ($000s)
2012 $30,090
2013 $30,964
2014 $33,607
2015 Forecast $35,805
2016 Test Year $37,771
69 Docket No. E002/GR-15-826
Lowenthal Direct
PUBLIC DOCUMENT – TRADE SECRET INFORMATION REDACTED –
PUBLIC DATA
Q. DO YOU BELIEVE THE COMPANY’S BUDGET FOR ACTIVE HEALTH AND 1
WELFARE COSTS IS REASONABLE? 2
A. Yes. Although our health and welfare costs have increased due to the 3
challenges discussed below and for the reasons discussed in Mr. Schrubbe’s 4
testimony, the Company has implemented several design changes and 5
wellness programs that I discussed earlier to help mitigate cost increases 6
associated with our health and welfare program. Our efforts have kept our 7
health and welfare program costs consistent with the experiences of other 8
private sector businesses. 9
10
Q. YOU MENTIONED THAT THE COMPANY IS FACING CHALLENGES IN 11
INCREASING HEALTHCARE COSTS. PLEASE ELABORATE. 12
A. The Company faces significant challenges in mitigating our healthcare trend: 13
• Healthcare reform has required the removal of certain benefit limits; it 14
has added or increased coverage levels for newly defined preventative 15
services; and it allows for dependents to remain on the plan due to less 16
restrictive rules for dependents. This legislation remains very active 17
and as recently as October 2015, there was a fee increase for the 18
Patient-Centered Outcomes Research Trust Fund (PCORTF) per 19
covered life in our program. Although the full impact to the Company 20
remains uncertain, it clearly indicates we do not have full control of 21
charges the Company must bear under this new requirement. 22
• Xcel Energy’s age/gender risk score is eight percent higher than 23
UnitedHealthcare’s book of business norm.22 Age/gender risk score is 24
22 The norm is UnitedHealthcare’s national employer accounts book of business that represents more than 10 million members. 70 Docket No. E002/GR-15-826
Lowenthal Direct
PUBLIC DOCUMENT – TRADE SECRET INFORMATION REDACTED –
PUBLIC DATA
an indicator that the age and gender mix of our population will likely 1
drive more cost than the benchmark. 2
• Xcel Energy’s specialty drug costs account for more than 30 percent of 3
our overall pharmacy costs. These costs are increasing significantly, 4
year over year. When comparing total specialty drug spending in 2014 5
to 2013, the Company saw an increase of 21 percent. Even though we 6
were able to decrease our forecasted medical trend from 7 percent to 6 7
percent for 2016, we increased the trend for pharmacy (specialty and 8
non-specialty drugs) to 15 percent. This is largely due to the FDA 9
accelerating new drug approvals, resulting in high-cost specialty drugs 10
coming to market quickly. New cancer drugs, such as Keytruda, can 11
increase costs by 100 percent, and new cholesterol drugs such as 12
PCSK9 can result in costs rising to $12,000 per patient per year, up 13
from the current cost of approximately $600 per patient per year. In 14
2016, our plan costs could increase as much as $4 million as a result of 15
new specialty therapies on the market. These therapies include new 16
cancer and hepatitis C agents and PSCK9’s for cholesterol. 17
18
Q. IS IT TRUE THAT HEALTHCARE COSTS ARE HIGHER FOR AN OLDER 19
WORKFORCE? 20
A. Yes. The average age of Xcel Energy’s employees who enrolled in medical 21
coverage in 2014 was 46.2 years. This compares to UnitedHealthcare’s norm 22
age of 43.9 years. The distribution of healthcare costs is strongly age-23
dependent. After the first year of life, healthcare costs are lowest for children, 24
rise slowly throughout adult life, and increase significantly after age 50. There 25
71 Docket No. E002/GR-15-826 Lowenthal Direct
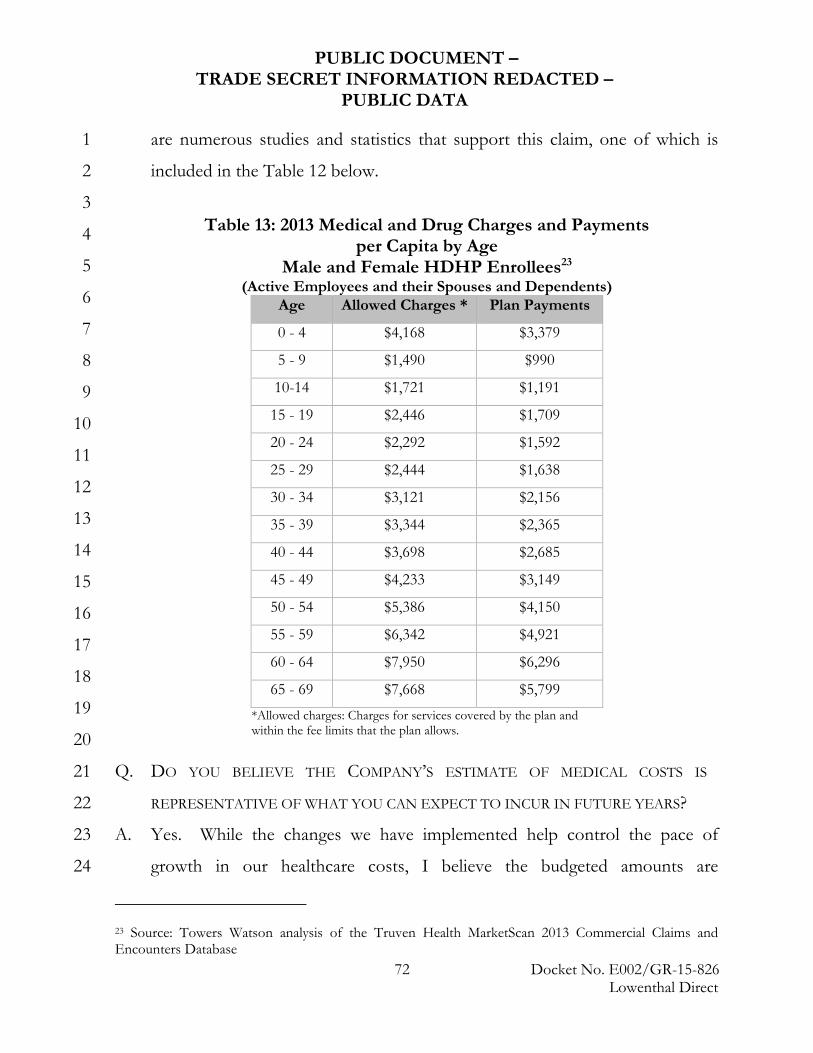
PUBLIC DOCUMENT – TRADE SECRET INFORMATION REDACTED –
PUBLIC DATA
are numerous studies and statistics that support this claim, one of which is 1
included in the Table 12 below. 2
3
4
5
6
7
8
9
10
11
12
13
14
15
16
17
18
19
20
Q. DO YOU BELIEVE THE COMPANY’S ESTIMATE OF MEDICAL COSTS IS23 21
REPRESENTATIVE OF WHAT YOU CAN EXPECT TO INCUR IN FUTURE YEARS? 22
A. Yes. While the changes we have implemented help control the pace of 23
growth in our healthcare costs, I believe the budgeted amounts are 24
23 Source: Towers Watson analysis of the Truven Health MarketScan 2013 Commercial Claims and Encounters Database
Table 13: 2013 Medical and Drug Charges and Payments per Capita by Age
Male and Female HDHP Enrollees23 (Active Employees and their Spouses and Dependents)
Age Allowed Charges * Plan Payments
0 - 4 $4,168 $3,379
5 - 9 $1,490 $990
10-14 $1,721 $1,191
15 - 19 $2,446 $1,709
20 - 24 $2,292 $1,592
25 - 29 $2,444 $1,638
30 - 34 $3,121 $2,156
35 - 39 $3,344 $2,365
40 - 44 $3,698 $2,685
45 - 49 $4,233 $3,149
50 - 54 $5,386 $4,150
55 - 59 $6,342 $4,921
60 - 64 $7,950 $6,296
65 - 69 $7,668 $5,799
*Allowed charges: Charges for services covered by the plan and within the fee limits that the plan allows.
72 Docket No. E002/GR-15-826 Lowenthal Direct
PUBLIC DOCUMENT – TRADE SECRET INFORMATION REDACTED –
PUBLIC DATA
representative of future costs. I have already pointed out several factors that 1
complicate the budgeting process, such as the time for employee behavior 2
changes to take effect, healthcare reform, and the inherent risk found in 3
insurance programs of unknown future events. As discussed further by Mr. 4
Schrubbe, medical costs continue to increase and are expected to increase 5
annually at a rate of approximately 6 to 6.5 percent. Accordingly, we do not 6
expect to see a reduction in our healthcare costs going forward. 7
8
Q. DO YOU HAVE ANY STUDIES DEMONSTRATING THAT THE COMPANY’S ACTIVE 9
HEALTHCARE PROGRAMS ARE REASONABLE? 10
A. Yes, we use the BENVAL® benchmarking study to help us evaluate our 11
benefits design. The BENVAL® study compares the value, based on plan 12
provisions, of Xcel Energy’s benefits with those of a utility industry peer 13
group. The Company uses this study to consider redesign options, check-in 14
on strategy decisions, review the balance of program elements, and assess 15
what value needs to be communicated to employees. The 2015 results 16
showed that our non-bargaining active medical and dental benefit programs 17
ranked 31 out of 40 peer utilities, placing us below the median value of our 18
competitors. 19
20
Q. ARE CUSTOMERS BEARING THE ENTIRE COST OF ACTIVE HEALTHCARE? 21
A. No. As I testified earlier, employees are responsible for healthcare costs 22
through the use of monthly premiums, upfront deductibles, and cost sharing 23
after deductibles have been met. Overall, 27.5 percent of the plan costs are 24
covered by the employee. 25
26
73 Docket No. E002/GR-15-826 Lowenthal Direct
PUBLIC DOCUMENT – TRADE SECRET INFORMATION REDACTED –
PUBLIC DATA
Q. WHY IS IT REASONABLE FOR CUSTOMERS TO BEAR PART OF THE COSTS FOR 1
ACTIVE HEALTH AND WELFARE BENEFITS FOR EMPLOYEES AND THEIR 2
FAMILIES? 3
A. The Company designs programs that promote a culture of personal 4
accountability for employees’ physical and financial well-being, while ensuring 5
the long-term financial health of our programs. The active health and welfare 6
benefits that the Company offers to its employees are important elements of 7
the Total Rewards Program. Without health and welfare benefits that are 8
comparable to those offered by other utilities and other companies with 9
whom we compete for employees, the Company would find it very difficult to 10
attract and retain qualified employees, including current employees with many 11
years of training that benefits the Company and its customers. Therefore, the 12
Company and its customers share an interest in ensuring that the Company is 13
able to offer a competitive package of health and welfare benefits. Health and 14
welfare benefits are an essential part of any company’s Total Rewards 15
Program package. In order to remain an employer of choice in our highly 16
competitive work environment, we must provide reasonably comparable 17
coverage to attract new candidates and retain our current staff. 18
19
VIII. EMPLOYEE RETIREMENT PROGRAMS 20
21
Q. WHAT RETIREMENT BENEFITS DOES XCEL ENERGY OFFER ITS EMPLOYEES? 22
A. Xcel Energy provides eligible employees the following retirement benefits: 23
• A defined benefit pension plan, which is also referred to as a 24
“qualified” pension plan; 25
74 Docket No. E002/GR-15-826 Lowenthal Direct
PUBLIC DOCUMENT – TRADE SECRET INFORMATION REDACTED –
PUBLIC DATA
• A “non-qualified” pension plan, which is the same as the qualified 1
pension plan, but maintains a consistent level of benefit to that of the 2
qualified defined pension benefit for employee wages over the IRS 3
wage limitations in effect. This is commonly referred to as a 4
“restoration” plan because it restores benefits to affected employees 5
that would have been provided under the qualified plan but for the 6
limits imposed by the IRS; 7
• A 401(k) defined contribution plan; 8
• Retiree medical benefits for certain employees that retired before 2000; 9
and 10
• A Supplemental Executive Retirement Plan (SERP), which provides 11
supplemental compensation to assure that the Total Rewards Program 12
benefits are market-competitive for certain executives. The SERP is no 13
longer offered to new executives and covers only two (one in 2015) 14
remaining executives. The Company is not seeking recovery of the 15
SERP-related costs. 16
17
A. Defined Benefit Plan 18
Q. PLEASE DESCRIBE THE COMPANY’S DEFINED BENEFIT PLAN. 19
A. We offer newly hired employees a 5 Percent Cash Balance Plan that provides 20
for an annual five percent Company contribution of the employee’s annual 21
salary into a notional account. This account has interest credited to it 22
annually based on the 30-year Treasury rates. This plan is similar to a savings 23
account or a 401(k) plan, so employees easily understand the plan value. 24
Non-bargaining employees hired prior to January 1, 2012 and bargaining 25
employees hired prior to January 1, 2011 are eligible for the 10 percent 26 75 Docket No. E002/GR-15-826
Lowenthal Direct
PUBLIC DOCUMENT – TRADE SECRET INFORMATION REDACTED –
PUBLIC DATA
Pension Equity Plan (PEP), which results in employees receiving 10 percent 1
of their highest 48 months of consecutive earnings. 2
3
Q. IS IT COMMON IN THE UTILITY INDUSTRY TO HAVE A DEFINED BENEFIT PLAN? 4
A. Yes, it is very common. Of the 46 utilities in the Fortune 1000, 27 (59 5
percent) continue to provide defined benefit pension benefits to all 6
employees, 15 (33 percent) provide defined benefit pension benefits to all 7
employees except those hired after a certain date, and only three have fully or 8
partially discontinued the defined benefit pension benefit for employees.24 9
Per Mr. Schrubbe’s testimony, 100 percent of the 52 EEI members that filed 10
10-K reports in 2014 indicate they provide pension benefits, based on 11
pension service cost amounts being reported. 12
13
Q. WOULD IT BE REASONABLE TO ELIMINATE THE DEFINED BENEFIT PENSION 14
PLAN AND RELY ENTIRELY ON A DEFINED CONTRIBUTION PLAN? 15
A. No. Offering a defined pension plan provides us the opportunity to remain 16
competitive with other utilities that we compete against for talent. Today, we 17
offer a lower valued pension plan compared with other utilities, as 18
demonstrated by the BENVAL® study. We believe that offering a pension 19
plan, along with a 401(k) savings plan, provides employees with a retirement 20
program in which employee participation is required, assets are fully 21
diversified, and future investment risk is shared. Our retirement program is 22
cost-effective and helps us manage our workforce appropriately for the 23
following reasons: 24
24 Information gathered from annual reports for the Fortune 1000 utilities. 76 Docket No. E002/GR-15-826
Lowenthal Direct
PUBLIC DOCUMENT – TRADE SECRET INFORMATION REDACTED –
PUBLIC DATA
• The defined benefit pension plan, along with our defined contribution 1
plan, aligns with our Total Rewards Program strategy to provide a 2
shared responsibility between employee and employer to accumulate 3
retirement assets. By providing a pension plan in which the employee 4
can count on a defined amount of retirement benefits, we are able to 5
manage an orderly transition of employees into retirement. This 6
provides Xcel Energy an opportunity to effectively manage our 7
workforce at the end of the employees’ careers, appropriately prepare 8
for knowledge transfer, and manage our training and succession 9
planning. 10
• Given the same benefit levels, pension plans can be a less expensive 11
vehicle for delivering retirement benefits than a defined contribution 12
plan, in both the short-term and the long-term. That is because the 13
Company is able to utilize investment earnings to fund future benefit 14
obligations, which reduces future cash flow requirements. In a defined 15
contribution plan, those earnings on the Company’s contributions 16
belong to the employee. 17
• Studies show more employees, including younger and less-tenured 18
employees, value the security a defined benefit pension plan provides.25 19
20
Q. EARLIER YOU MENTIONED TWO INITIATIVES THE COMPANY HAS TAKEN TO 21
REDUCE THE RETIREMENT PROGRAM BENEFITS FOR PROSPECTIVE EMPLOYEES. 22
IS THIS PRACTICE COMPARABLE TO THE MARKET? 23
25 https://www.towerswatson.com/en-US/Insights/Newsletters/Americas/insider/2012/Attraction-and-Retention-What-Employees-Value-Most-March-2012 (accessed on Oct. 23, 2015).
77 Docket No. E002/GR-15-826 Lowenthal Direct

PUBLIC DOCUMENT – TRADE SECRET INFORMATION REDACTED –
PUBLIC DATA
A. Yes. It is a common practice when making changes to retirement offerings 1
for employers to eliminate or reduce defined benefit pension plan benefits for 2
new hires only. Based on the most recent Towers Watson study of pension 3
changes in the last decade, 48 percent of defined benefit plan sponsors 4
significantly changed their program for current employees at some point in 5
the last 10 years. However, the prevalence is considerably different within the 6
utility industry, which showed only 34 percent of utilities significantly change 7
their programs for current employees.26 This is due to some of the following 8
reasons: 9
• Union limitations. Our industry is heavily unionized and must consider 10
the risks associated with varying benefits levels for union and non-11
union populations, including workforce and succession planning 12
considerations and risk and costs of additional unionization efforts. 13
We have and will continue to work with the union leaders to ensure 14
our benefits are at the appropriate levels. 15
• Disruption to existing employees. Consistent with the experience of other 16
utilities, many of our employees are already eligible to retire or very 17
close to retirement. Significant benefit reductions can result in 18
employees retiring early rather than staying with the Company. 19
Unplanned early retirements pose concerns due to our specialized skill 20
sets, supply of viable candidates, and the need for a seamless 21
knowledge transition. 22
• Complexity. Changing benefits for existing employees involves 23
significant transition rules required under the laws governing qualified 24
26 Towers Watson, “Pensions in Transition: Retirement Plan Changes and Employer Motivations,” 2012 78 Docket No. E002/GR-15-826
Lowenthal Direct
PUBLIC DOCUMENT – TRADE SECRET INFORMATION REDACTED –
PUBLIC DATA
pension plans. This often includes separating benefits into two parts 1
(past and future), adding interest or other “credits” for transition 2
purposes, and maintaining old distribution options along with the new 3
distribution options, as those are considered protective benefits. Other 4
complexities include system modifications which are required to ensure 5
and communication appropriate calculations. All of these transitional 6
transactions increase the costs of the benefit changes. 7
8
Q. HAS THE COMPANY EXPLORED AND EVALUATED FREEZING OR AMENDING 9
PRIOR PENSION BENEFITS AND EXTENDING THE APPLICATION OF THE 5 10
PERCENT CASH BALANCE PLAN? 11
A. Yes, as part of the analysis to move to the 5 Percent Cash Balance Plan, the 12
Company did explore expanding the 5 Percent Cash Balance Plan to current 13
employees, taking into consideration a number of factors, including the 14
impacts to our employees and the financial impact to our business. We also 15
considered the practices of other utilities, the effect on potential unionization 16
and the legal risks. 17
18
Q. WHAT DID THE COMPANY DISCOVER DURING THIS ANALYSIS? 19
A. A large portion of our highly skilled workforce is already eligible to retire. 20
Changing the pension benefits for these employees would have increased the 21
risk of them leaving earlier, resulting in a significant loss of necessary 22
knowledge to run our business. Our analysis demonstrated that projected 23
cost savings were not significant enough to offset this risk. Our attrition rate, 24
which was previously discussed, has been rising as a result of our aging 25
population and the number of employees eligible to retire. As more 26
79 Docket No. E002/GR-15-826 Lowenthal Direct
PUBLIC DOCUMENT – TRADE SECRET INFORMATION REDACTED –
PUBLIC DATA
employees are retiring and replacement employees are going into the 5 1
Percent Cash Balance Plan, we knew we could achieve our benefit objectives 2
more effectively by simply making the change for new hires. This business 3
decision eliminated the complexity and disruption associated with changing an 4
employee’s existing vested benefit, as well as allowing us to achieve our 5
financial objectives. 6
7
Q. WERE THESE THE ONLY CONSIDERATIONS IN THE COMPANY’S DECISION TO 8
MAINTAIN THE CURRENT PENSION PLAN FOR EXISTING EMPLOYEES? 9
A. No, there were other considerations. During 1998-1999, employees were 10
provided with a choice between two pension formulas. This choice was given 11
to existing employees because we were changing the pension formula for new 12
hires. We wanted to give existing employees the opportunity to choose the 13
new plan or stay in their existing plan. This is because the two plan choices 14
were very different from each other – the new plan accrued benefits evenly 15
over the course of an employee’s career and the existing plan accrued the 16
majority of the benefits at the end of a career. Therefore an employee’s 17
ultimate benefit could be impacted by the amount of time he or she was in 18
each plan. Our analysis showed that we would be assuming legal risk if we 19
moved these employees into the 5 Percent Cash Balance Plan because it 20
would have negatively impacted their pension value. Many employees would 21
likely have made a different choice if they had known that the pension design 22
would change again before they left the Company. 23
24
Q. YOU ALSO MENTIONED POTENTIAL “UNION IMPACTS.” PLEASE ELABORATE 25
ON THIS COMMENT. 26
80 Docket No. E002/GR-15-826 Lowenthal Direct
PUBLIC DOCUMENT – TRADE SECRET INFORMATION REDACTED –
PUBLIC DATA
A. We knew from our own experience and from the experience of peer utilities 1
that it is difficult to obtain benefit reductions during labor negotiations, and as 2
a result, substantial transitional benefits may be required to mitigate the 3
impact on employees. Transitional benefits would significantly erode any 4
savings associated with the 5 Percent Cash Balance Plan. We also believe that 5
our unions would have viewed a change to their pension plan as a potential 6
strike issue, requiring cost-prohibitive preparations to maintain the continuity 7
of service levels for our customers. 8
9
Q. WHY DOESN’T THE COMPANY MAKE CHANGES TO ITS NON-UNION 10
WORKFORCE ONLY? 11
A. Having similarly valued benefit programs for bargaining and non-bargaining 12
employees is critical to our workforce strategy. Similar programs provide 13
opportunities to transition employees from bargaining positions into 14
supervisory positions. These transitions are important because former union 15
employees understand the work and have credibility with other union 16
employees. Alignment of benefit programs between union and non-union 17
workforces is not uncommon in the utility industry. In the Towers Watson 18
BENVAL® study previously described, 75 percent of the companies provide 19
their non-union employees with benefit levels that are aligned with or better 20
than union benefits. Based on all of these factors, the Company determined 21
that a gradual transition to limit disruption to current employees was the most 22
appropriate course of action and was well within the practices of others 23
within our industry. This resulted in our offering the 5 Percent Cash Balance 24
Plan to newly hired and rehired union and non-union employees and to 25
employees transitioning from a non-union position to a union position. 26
81 Docket No. E002/GR-15-826 Lowenthal Direct
PUBLIC DOCUMENT – TRADE SECRET INFORMATION REDACTED –
PUBLIC DATA
1
Q. WHY IS IT REASONABLE FOR DEFINED BENEFIT PENSION EXPENSE TO BE 2
INCLUDED IN RATES? 3
A. Including defined benefit pension expense in rates is reasonable because 4
nearly all of the utilities with whom we compete for employees offer defined 5
benefit plans. It is important for the Company to attract and retain 6
employees by offering total compensation and benefits that align with the 7
companies with whom we compete for talent. 8
9
B. Defined Contribution Plan 10
Q. PLEASE DESCRIBE THE COMPANY’S DEFINED CONTRIBUTION PLAN. 11
A. The Company’s defined contribution plan, which is a 401(k) savings plan, 12
provides an employer contribution equal to a maximum of four percent of an 13
employee’s eligible compensation (i.e. base salary). The Company matches 50 14
cents on the dollar up to eight percent of an employee’s contribution. 15
16
Q. WHAT IS THE 401(K) EXPENSE IN THE 2016 TEST YEAR? 17
A. The 2016 test year 401(k) expense amount is $8,934,795 (state of Minnesota, 18
Electric Jurisdiction). 19
20
Q. WHAT WERE THE AMOUNTS OF THE 401(k) EXPENSE IN THE YEARS PRIOR TO 21
THE 2016 TEST YEAR? 22
A. Table 13 below shows the amounts of 401(k) costs from 2012 through the 23
2016 test year.24
82 Docket No. E002/GR-15-826 Lowenthal Direct
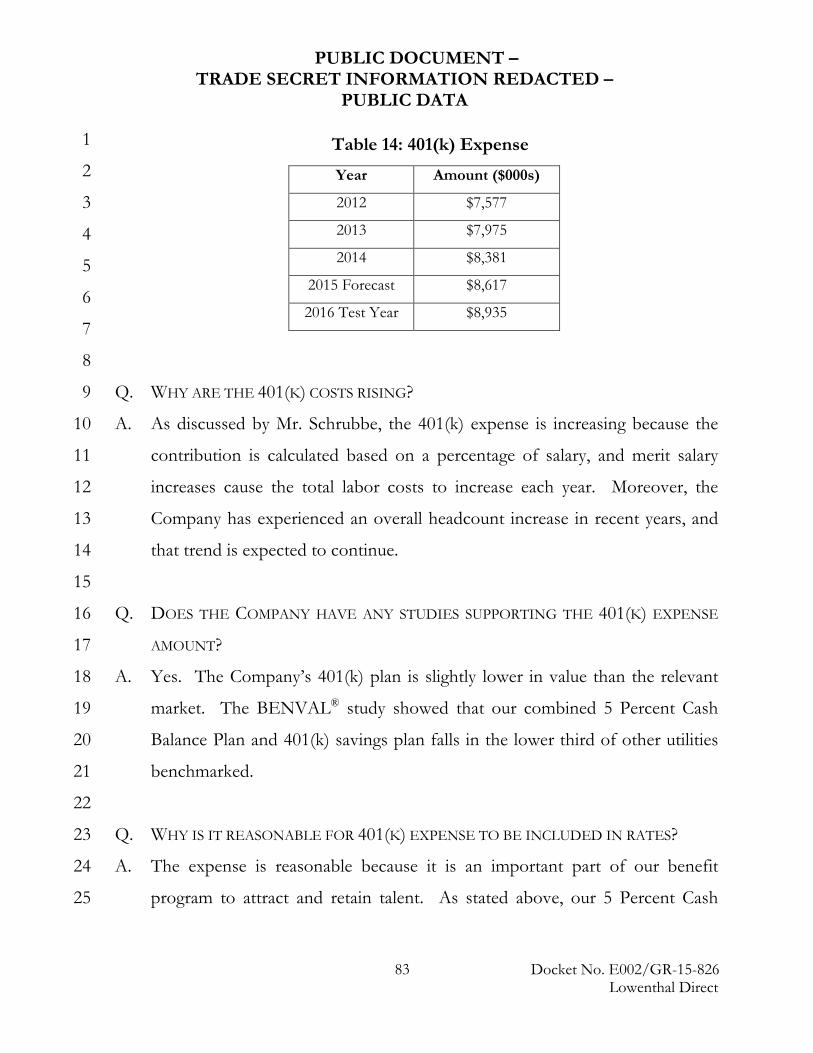
PUBLIC DOCUMENT – TRADE SECRET INFORMATION REDACTED –
PUBLIC DATA
1
2
3
4
5
6
7
8
Q. WHY ARE THE 401(K) COSTS RISING? 9
A. As discussed by Mr. Schrubbe, the 401(k) expense is increasing because the 10
contribution is calculated based on a percentage of salary, and merit salary 11
increases cause the total labor costs to increase each year. Moreover, the 12
Company has experienced an overall headcount increase in recent years, and 13
that trend is expected to continue. 14
15
Q. DOES THE COMPANY HAVE ANY STUDIES SUPPORTING THE 401(K) EXPENSE 16
AMOUNT? 17
A. Yes. The Company’s 401(k) plan is slightly lower in value than the relevant 18
market. The BENVAL® study showed that our combined 5 Percent Cash 19
Balance Plan and 401(k) savings plan falls in the lower third of other utilities 20
benchmarked. 21
22
Q. WHY IS IT REASONABLE FOR 401(K) EXPENSE TO BE INCLUDED IN RATES? 23
A. The expense is reasonable because it is an important part of our benefit 24
program to attract and retain talent. As stated above, our 5 Percent Cash 25
Table 14: 401(k) Expense
Year Amount ($000s)
2012 $7,577
2013 $7,975
2014 $8,381
2015 Forecast $8,617
2016 Test Year $8,935
83 Docket No. E002/GR-15-826 Lowenthal Direct
PUBLIC DOCUMENT – TRADE SECRET INFORMATION REDACTED –
PUBLIC DATA
Balance Plan and 401(k) savings plan combined provide a lower benefit than 1
most of the companies we compete against for talent. 2
3
C. Retiree Medical Expense 4
Q. PLEASE DESCRIBE THE COMPANY’S RETIREE MEDICAL BENEFIT. 5
A. For bargaining employees who retired prior to 2000 and non-bargaining 6
employees who retired prior to 1999, the Company provides subsidized 7
medical and pharmacy coverage at varying levels based on the year in which 8
the employee retired. Employees who retired after those dates receive access 9
to medical coverage but are responsible for 100 percent of the cost. I provide 10
more details about the health plans and premiums offered to retirees in 11
Appendix A. 12
13
Q. WHAT IS THE RETIREE MEDICAL EXPENSE IN THE 2016 TEST YEAR? 14
A. The 2016 test year retiree medical expense amount is $1,381,774 (state of 15
Minnesota, Electric Jurisdiction). 16
17
Q. WHAT WERE THE AMOUNTS OF THE RETIREE MEDICAL EXPENSE IN THE YEARS 18
PRIOR TO THE 2016 TEST YEAR? 19
A. Table 14 shows the amounts of retiree medical costs from 2012 through the 20
2016 test year.21
84 Docket No. E002/GR-15-826 Lowenthal Direct
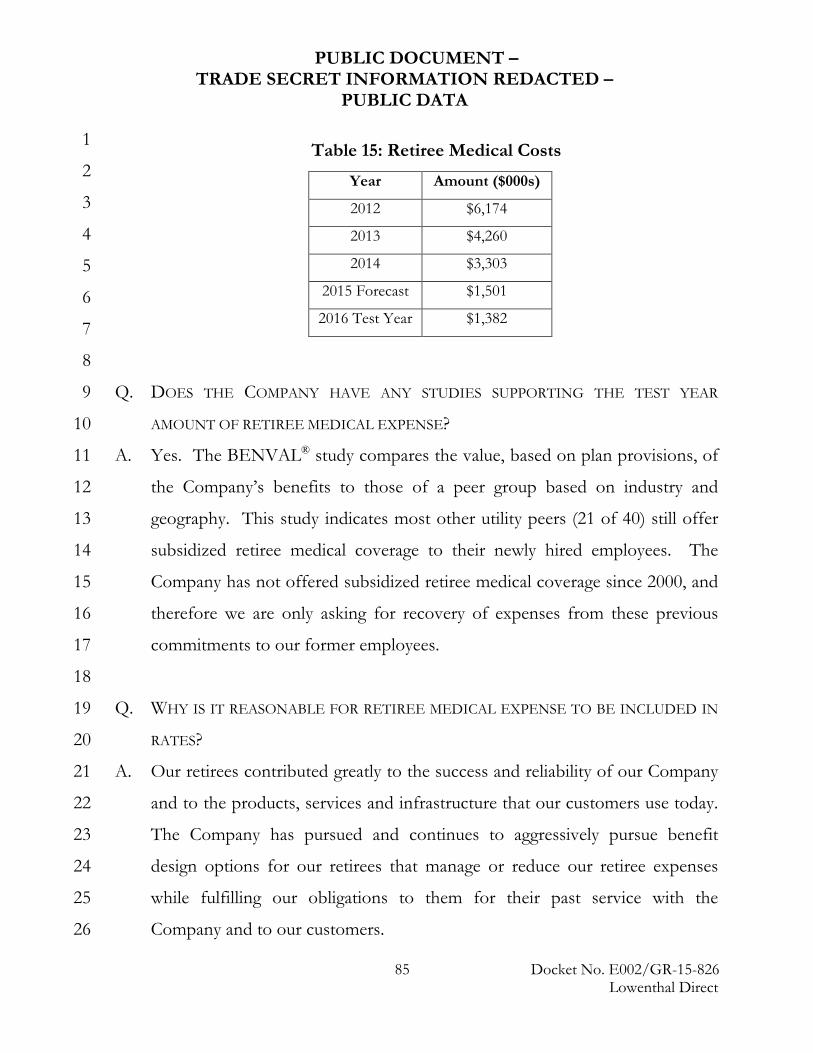
PUBLIC DOCUMENT – TRADE SECRET INFORMATION REDACTED –
PUBLIC DATA
1
2
3
4
5
6
7
8
Q. DOES THE COMPANY HAVE ANY STUDIES SUPPORTING THE TEST YEAR 9
AMOUNT OF RETIREE MEDICAL EXPENSE? 10
A. Yes. The BENVAL® study compares the value, based on plan provisions, of 11
the Company’s benefits to those of a peer group based on industry and 12
geography. This study indicates most other utility peers (21 of 40) still offer 13
subsidized retiree medical coverage to their newly hired employees. The 14
Company has not offered subsidized retiree medical coverage since 2000, and 15
therefore we are only asking for recovery of expenses from these previous 16
commitments to our former employees. 17
18
Q. WHY IS IT REASONABLE FOR RETIREE MEDICAL EXPENSE TO BE INCLUDED IN 19
RATES? 20
A. Our retirees contributed greatly to the success and reliability of our Company 21
and to the products, services and infrastructure that our customers use today. 22
The Company has pursued and continues to aggressively pursue benefit 23
design options for our retirees that manage or reduce our retiree expenses 24
while fulfilling our obligations to them for their past service with the 25
Company and to our customers. 26
Table 15: Retiree Medical Costs
Year Amount ($000s)
2012 $6,174
2013 $4,260
2014 $3,303
2015 Forecast $1,501
2016 Test Year $1,382
85 Docket No. E002/GR-15-826 Lowenthal Direct
PUBLIC DOCUMENT – TRADE SECRET INFORMATION REDACTED –
PUBLIC DATA
1
Q. WHAT DO YOU CONCLUDE REGARDING THE COMPANY’S RETIREMENT 2
PROGRAM? 3
A. The Company provides a retirement program that is comparable to the 4
relevant market in which we compete for talent, but it reflects considerable 5
cost savings as a result of plan changes the Company has been able to achieve 6
through the measures discussed in my testimony. Minnesota customers have 7
benefitted from those changes. The BENVAL® study supports the 8
conclusion that we are below the market median, and therefore reducing 9
these benefits even further would compromise our ability to attract and retain 10
employees. 11
12
IX. CONCLUSION 13
14
Q. PLEASE SUMMARIZE YOUR TESTIMONY AND RECOMMENDATIONS. 15
A. I recommend the Commission approve the Total Rewards Program costs as 16
requested in this rate case. These compensation costs are necessary to attract, 17
recruit and retain the talent necessary to continue to offer safe and reliable 18
service. We have taken internal cost mitigation measures, we have realigned 19
resources, we have limited our cost recovery request, and we have not asked 20
for recovery of any amounts that the Commission has previously found to be 21
unreasonable. We do not have the capacity to absorb any further 22
disallowance of our Total Rewards Program costs without making significant 23
changes to our program and need the costs requested to continue to be 24
successful in the future. 25
26
86 Docket No. E002/GR-15-826 Lowenthal Direct

PUBLIC DOCUMENT – TRADE SECRET INFORMATION REDACTED –
PUBLIC DATA
Q. DOES THIS CONCLUDE YOUR TESTIMONY? 1
A. Yes, it does. 2
87 Docket No. E002/GR-15-826 Lowenthal Direct
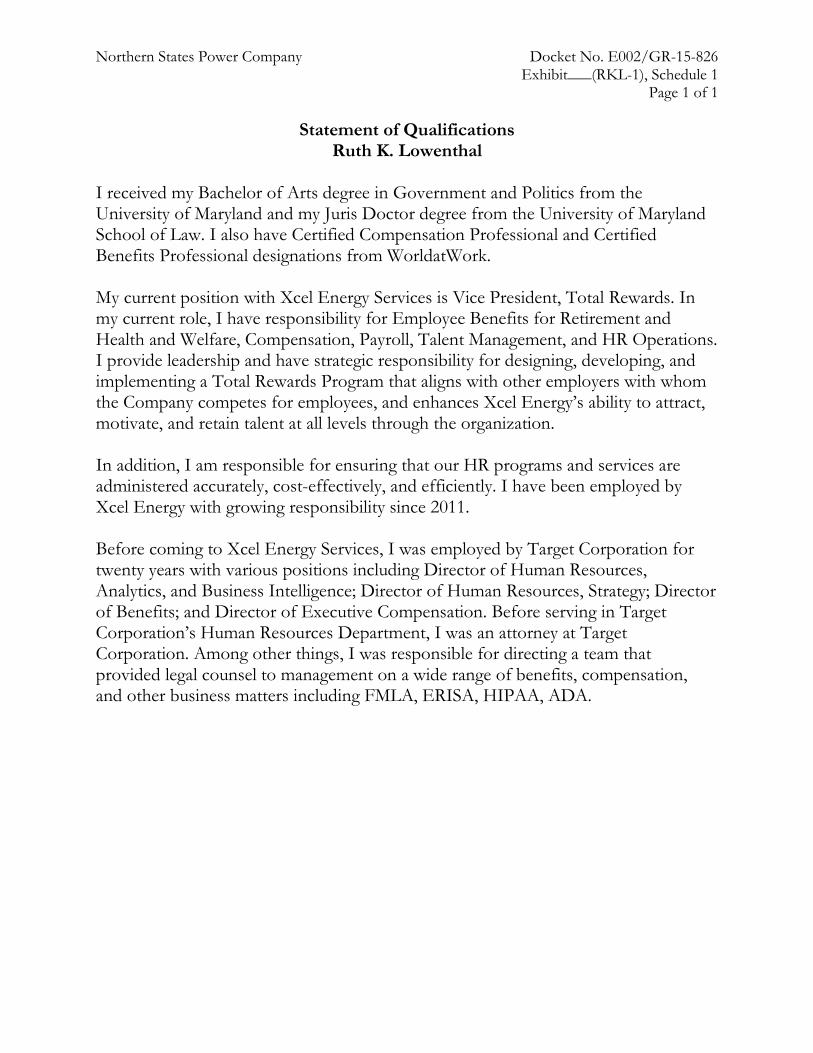
Northern States Power Company Docket No. E002/GR-15-826 Exhibit___(RKL-1), Schedule 1
Page 1 of 1
Statement of Qualifications Ruth K. Lowenthal
I received my Bachelor of Arts degree in Government and Politics from the University of Maryland and my Juris Doctor degree from the University of Maryland School of Law. I also have Certified Compensation Professional and Certified Benefits Professional designations from WorldatWork. My current position with Xcel Energy Services is Vice President, Total Rewards. In my current role, I have responsibility for Employee Benefits for Retirement and Health and Welfare, Compensation, Payroll, Talent Management, and HR Operations. I provide leadership and have strategic responsibility for designing, developing, and implementing a Total Rewards Program that aligns with other employers with whom the Company competes for employees, and enhances Xcel Energy’s ability to attract, motivate, and retain talent at all levels through the organization. In addition, I am responsible for ensuring that our HR programs and services are administered accurately, cost-effectively, and efficiently. I have been employed by Xcel Energy with growing responsibility since 2011. Before coming to Xcel Energy Services, I was employed by Target Corporation for twenty years with various positions including Director of Human Resources, Analytics, and Business Intelligence; Director of Human Resources, Strategy; Director of Benefits; and Director of Executive Compensation. Before serving in Target Corporation’s Human Resources Department, I was an attorney at Target Corporation. Among other things, I was responsible for directing a team that provided legal counsel to management on a wide range of benefits, compensation, and other business matters including FMLA, ERISA, HIPAA, ADA.
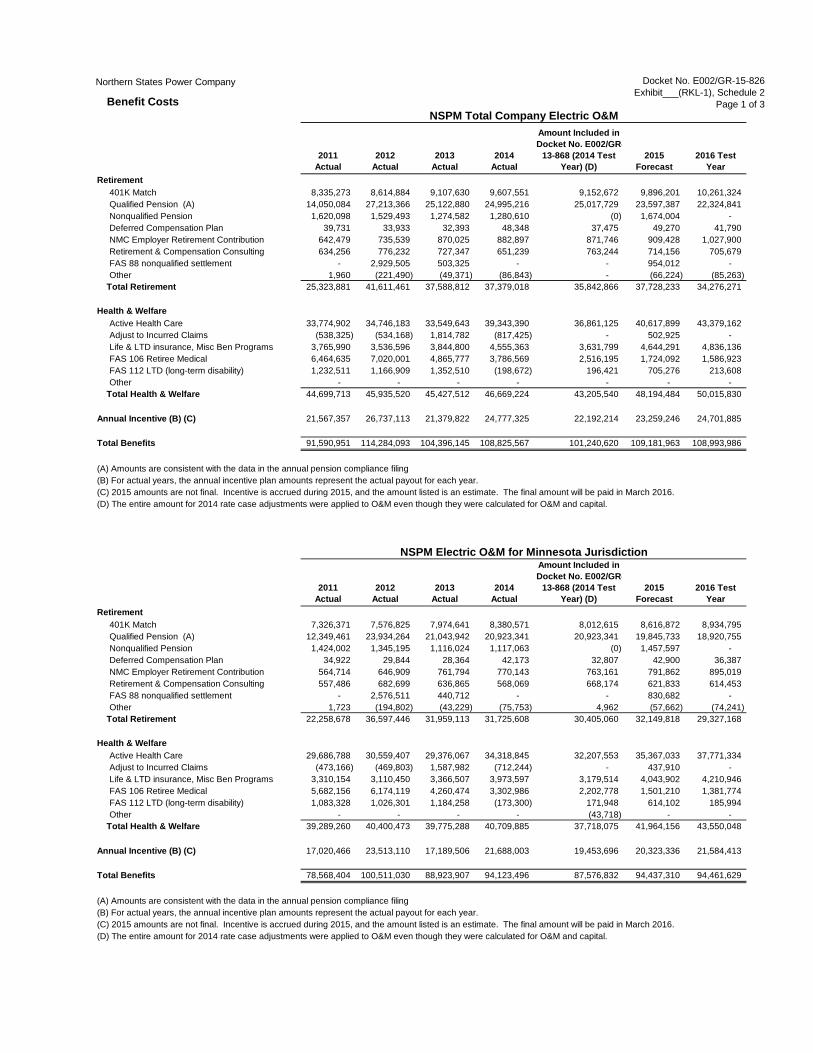
Northern States Power Company Docket No. E002/GR-15-826Exhibit___(RKL-1), Schedule 2
Page 1 of 3Benefit Costs
2011Actual
2012Actual
2013Actual
2014Actual
Amount Included in Docket No. E002/GR-
13-868 (2014 Test Year) (D)
2015 Forecast
2016 Test Year
Retirement401K Match 8,335,273 8,614,884 9,107,630 9,607,551 9,152,672 9,896,201 10,261,324 Qualified Pension (A) 14,050,084 27,213,366 25,122,880 24,995,216 25,017,729 23,597,387 22,324,841 Nonqualified Pension 1,620,098 1,529,493 1,274,582 1,280,610 (0) 1,674,004 - Deferred Compensation Plan 39,731 33,933 32,393 48,348 37,475 49,270 41,790 NMC Employer Retirement Contribution 642,479 735,539 870,025 882,897 871,746 909,428 1,027,900 Retirement & Compensation Consulting 634,256 776,232 727,347 651,239 763,244 714,156 705,679 FAS 88 nonqualified settlement - 2,929,505 503,325 - - 954,012 - Other 1,960 (221,490) (49,371) (86,843) - (66,224) (85,263)
Total Retirement 25,323,881 41,611,461 37,588,812 37,379,018 35,842,866 37,728,233 34,276,271
Health & WelfareActive Health Care 33,774,902 34,746,183 33,549,643 39,343,390 36,861,125 40,617,899 43,379,162 Adjust to Incurred Claims (538,325) (534,168) 1,814,782 (817,425) - 502,925 - Life & LTD insurance, Misc Ben Programs 3,765,990 3,536,596 3,844,800 4,555,363 3,631,799 4,644,291 4,836,136 FAS 106 Retiree Medical 6,464,635 7,020,001 4,865,777 3,786,569 2,516,195 1,724,092 1,586,923 FAS 112 LTD (long-term disability) 1,232,511 1,166,909 1,352,510 (198,672) 196,421 705,276 213,608 Other - - - - - - -
Total Health & Welfare 44,699,713 45,935,520 45,427,512 46,669,224 43,205,540 48,194,484 50,015,830
Annual Incentive (B) (C) 21,567,357 26,737,113 21,379,822 24,777,325 22,192,214 23,259,246 24,701,885
Total Benefits 91,590,951 114,284,093 104,396,145 108,825,567 101,240,620 109,181,963 108,993,986
(A) Amounts are consistent with the data in the annual pension compliance filing(B) For actual years, the annual incentive plan amounts represent the actual payout for each year.(C) 2015 amounts are not final. Incentive is accrued during 2015, and the amount listed is an estimate. The final amount will be paid in March 2016.(D) The entire amount for 2014 rate case adjustments were applied to O&M even though they were calculated for O&M and capital.
2011Actual
2012Actual
2013Actual
2014Actual
Amount Included in Docket No. E002/GR-
13-868 (2014 Test Year) (D)
2015 Forecast
2016 Test Year
Retirement401K Match 7,326,371 7,576,825 7,974,641 8,380,571 8,012,615 8,616,872 8,934,795 Qualified Pension (A) 12,349,461 23,934,264 21,043,942 20,923,341 20,923,341 19,845,733 18,920,755 Nonqualified Pension 1,424,002 1,345,195 1,116,024 1,117,063 (0) 1,457,597 - Deferred Compensation Plan 34,922 29,844 28,364 42,173 32,807 42,900 36,387 NMC Employer Retirement Contribution 564,714 646,909 761,794 770,143 763,161 791,862 895,019 Retirement & Compensation Consulting 557,486 682,699 636,865 568,069 668,174 621,833 614,453 FAS 88 nonqualified settlement - 2,576,511 440,712 - - 830,682 - Other 1,723 (194,802) (43,229) (75,753) 4,962 (57,662) (74,241)
Total Retirement 22,258,678 36,597,446 31,959,113 31,725,608 30,405,060 32,149,818 29,327,168
Health & WelfareActive Health Care 29,686,788 30,559,407 29,376,067 34,318,845 32,207,553 35,367,033 37,771,334 Adjust to Incurred Claims (473,166) (469,803) 1,587,982 (712,244) - 437,910 - Life & LTD insurance, Misc Ben Programs 3,310,154 3,110,450 3,366,507 3,973,597 3,179,514 4,043,902 4,210,946 FAS 106 Retiree Medical 5,682,156 6,174,119 4,260,474 3,302,986 2,202,778 1,501,210 1,381,774 FAS 112 LTD (long-term disability) 1,083,328 1,026,301 1,184,258 (173,300) 171,948 614,102 185,994 Other - - - - (43,718) - -
Total Health & Welfare 39,289,260 40,400,473 39,775,288 40,709,885 37,718,075 41,964,156 43,550,048
Annual Incentive (B) (C) 17,020,466 23,513,110 17,189,506 21,688,003 19,453,696 20,323,336 21,584,413
Total Benefits 78,568,404 100,511,030 88,923,907 94,123,496 87,576,832 94,437,310 94,461,629
(A) Amounts are consistent with the data in the annual pension compliance filing(B) For actual years, the annual incentive plan amounts represent the actual payout for each year.(C) 2015 amounts are not final. Incentive is accrued during 2015, and the amount listed is an estimate. The final amount will be paid in March 2016.(D) The entire amount for 2014 rate case adjustments were applied to O&M even though they were calculated for O&M and capital.
NSPM Total Company Electric O&M
NSPM Electric O&M for Minnesota Jurisdiction
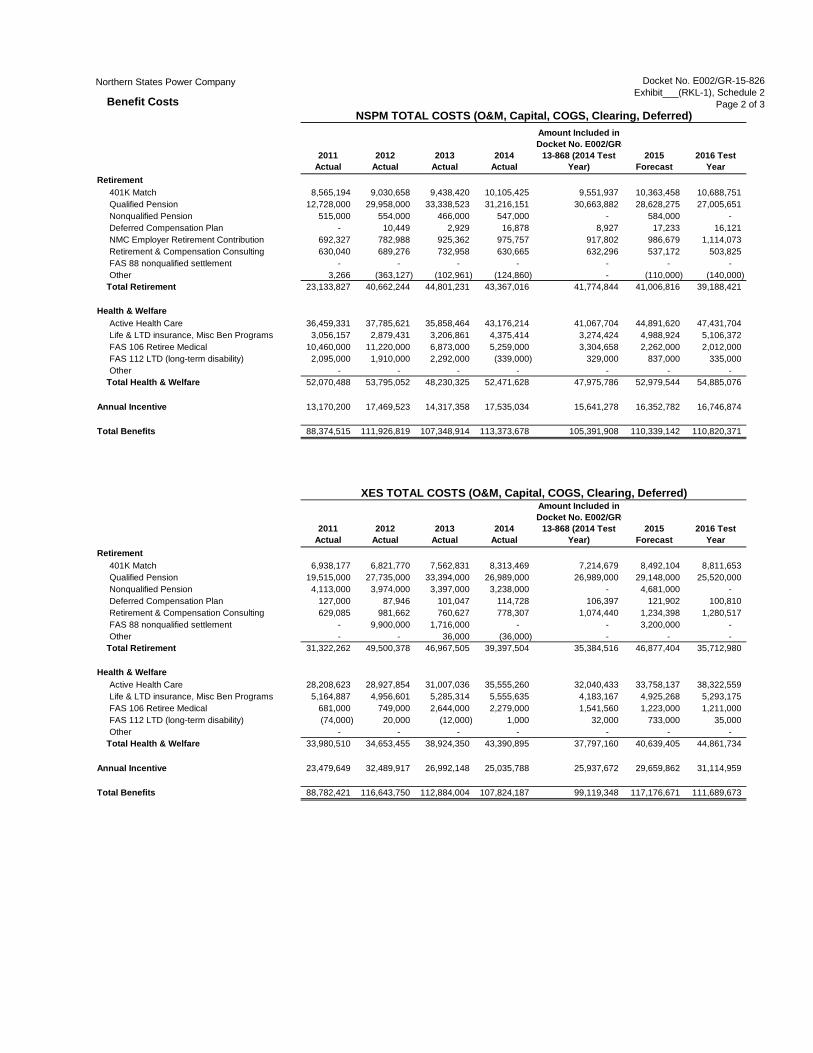
Northern States Power Company Docket No. E002/GR-15-826Exhibit___(RKL-1), Schedule 2
Page 2 of 3Benefit Costs
2011Actual
2012Actual
2013Actual
2014Actual
Amount Included in Docket No. E002/GR-
13-868 (2014 Test Year)
2015 Forecast
2016 Test Year
Retirement401K Match 8,565,194 9,030,658 9,438,420 10,105,425 9,551,937 10,363,458 10,688,751 Qualified Pension 12,728,000 29,958,000 33,338,523 31,216,151 30,663,882 28,628,275 27,005,651 Nonqualified Pension 515,000 554,000 466,000 547,000 - 584,000 - Deferred Compensation Plan - 10,449 2,929 16,878 8,927 17,233 16,121 NMC Employer Retirement Contribution 692,327 782,988 925,362 975,757 917,802 986,679 1,114,073 Retirement & Compensation Consulting 630,040 689,276 732,958 630,665 632,296 537,172 503,825 FAS 88 nonqualified settlement - - - - - - - Other 3,266 (363,127) (102,961) (124,860) - (110,000) (140,000)
Total Retirement 23,133,827 40,662,244 44,801,231 43,367,016 41,774,844 41,006,816 39,188,421
Health & WelfareActive Health Care 36,459,331 37,785,621 35,858,464 43,176,214 41,067,704 44,891,620 47,431,704 Life & LTD insurance, Misc Ben Programs 3,056,157 2,879,431 3,206,861 4,375,414 3,274,424 4,988,924 5,106,372 FAS 106 Retiree Medical 10,460,000 11,220,000 6,873,000 5,259,000 3,304,658 2,262,000 2,012,000 FAS 112 LTD (long-term disability) 2,095,000 1,910,000 2,292,000 (339,000) 329,000 837,000 335,000 Other - - - - - - -
Total Health & Welfare 52,070,488 53,795,052 48,230,325 52,471,628 47,975,786 52,979,544 54,885,076
Annual Incentive 13,170,200 17,469,523 14,317,358 17,535,034 15,641,278 16,352,782 16,746,874
Total Benefits 88,374,515 111,926,819 107,348,914 113,373,678 105,391,908 110,339,142 110,820,371
2011Actual
2012Actual
2013Actual
2014Actual
Amount Included in Docket No. E002/GR-
13-868 (2014 Test Year)
2015 Forecast
2016 Test Year
Retirement401K Match 6,938,177 6,821,770 7,562,831 8,313,469 7,214,679 8,492,104 8,811,653 Qualified Pension 19,515,000 27,735,000 33,394,000 26,989,000 26,989,000 29,148,000 25,520,000 Nonqualified Pension 4,113,000 3,974,000 3,397,000 3,238,000 - 4,681,000 - Deferred Compensation Plan 127,000 87,946 101,047 114,728 106,397 121,902 100,810 Retirement & Compensation Consulting 629,085 981,662 760,627 778,307 1,074,440 1,234,398 1,280,517 FAS 88 nonqualified settlement - 9,900,000 1,716,000 - - 3,200,000 - Other - - 36,000 (36,000) - - -
Total Retirement 31,322,262 49,500,378 46,967,505 39,397,504 35,384,516 46,877,404 35,712,980
Health & WelfareActive Health Care 28,208,623 28,927,854 31,007,036 35,555,260 32,040,433 33,758,137 38,322,559 Life & LTD insurance, Misc Ben Programs 5,164,887 4,956,601 5,285,314 5,555,635 4,183,167 4,925,268 5,293,175 FAS 106 Retiree Medical 681,000 749,000 2,644,000 2,279,000 1,541,560 1,223,000 1,211,000 FAS 112 LTD (long-term disability) (74,000) 20,000 (12,000) 1,000 32,000 733,000 35,000 Other - - - - - - -
Total Health & Welfare 33,980,510 34,653,455 38,924,350 43,390,895 37,797,160 40,639,405 44,861,734
Annual Incentive 23,479,649 32,489,917 26,992,148 25,035,788 25,937,672 29,659,862 31,114,959
Total Benefits 88,782,421 116,643,750 112,884,004 107,824,187 99,119,348 117,176,671 111,689,673
NSPM TOTAL COSTS (O&M, Capital, COGS, Clearing, Deferred)
XES TOTAL COSTS (O&M, Capital, COGS, Clearing, Deferred)
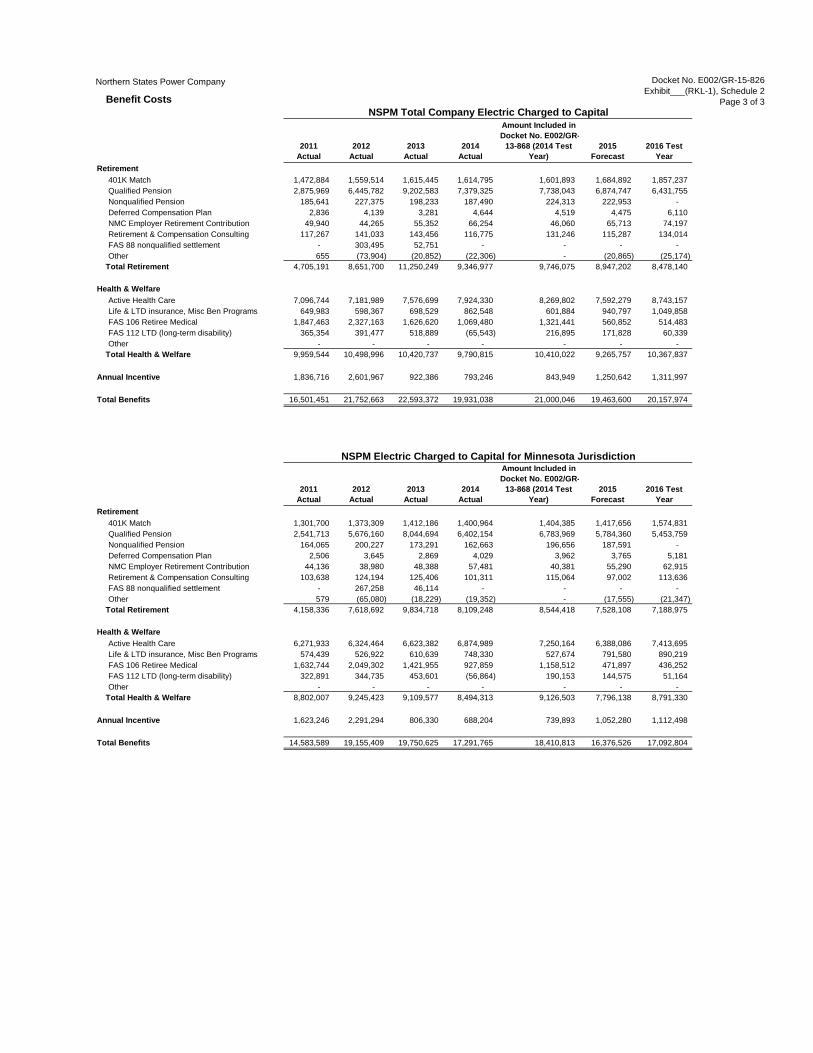
Northern States Power Company Docket No. E002/GR-15-826Exhibit___(RKL-1), Schedule 2
Page 3 of 3Benefit Costs
2011Actual
2012Actual
2013Actual
2014Actual
Amount Included in Docket No. E002/GR-
13-868 (2014 Test Year)
2015 Forecast
2016 Test Year
Retirement401K Match 1,472,884 1,559,514 1,615,445 1,614,795 1,601,893 1,684,892 1,857,237 Qualified Pension 2,875,969 6,445,782 9,202,583 7,379,325 7,738,043 6,874,747 6,431,755 Nonqualified Pension 185,641 227,375 198,233 187,490 224,313 222,953 - Deferred Compensation Plan 2,836 4,139 3,281 4,644 4,519 4,475 6,110 NMC Employer Retirement Contribution 49,940 44,265 55,352 66,254 46,060 65,713 74,197 Retirement & Compensation Consulting 117,267 141,033 143,456 116,775 131,246 115,287 134,014 FAS 88 nonqualified settlement - 303,495 52,751 - - - - Other 655 (73,904) (20,852) (22,306) - (20,865) (25,174)
Total Retirement 4,705,191 8,651,700 11,250,249 9,346,977 9,746,075 8,947,202 8,478,140
Health & WelfareActive Health Care 7,096,744 7,181,989 7,576,699 7,924,330 8,269,802 7,592,279 8,743,157 Life & LTD insurance, Misc Ben Programs 649,983 598,367 698,529 862,548 601,884 940,797 1,049,858 FAS 106 Retiree Medical 1,847,463 2,327,163 1,626,620 1,069,480 1,321,441 560,852 514,483 FAS 112 LTD (long-term disability) 365,354 391,477 518,889 (65,543) 216,895 171,828 60,339 Other - - - - - - -
Total Health & Welfare 9,959,544 10,498,996 10,420,737 9,790,815 10,410,022 9,265,757 10,367,837
Annual Incentive 1,836,716 2,601,967 922,386 793,246 843,949 1,250,642 1,311,997
Total Benefits 16,501,451 21,752,663 22,593,372 19,931,038 21,000,046 19,463,600 20,157,974
2011Actual
2012Actual
2013Actual
2014Actual
Amount Included in Docket No. E002/GR-
13-868 (2014 Test Year)
2015 Forecast
2016 Test Year
Retirement401K Match 1,301,700 1,373,309 1,412,186 1,400,964 1,404,385 1,417,656 1,574,831 Qualified Pension 2,541,713 5,676,160 8,044,694 6,402,154 6,783,969 5,784,360 5,453,759 Nonqualified Pension 164,065 200,227 173,291 162,663 196,656 187,591 - Deferred Compensation Plan 2,506 3,645 2,869 4,029 3,962 3,765 5,181 NMC Employer Retirement Contribution 44,136 38,980 48,388 57,481 40,381 55,290 62,915 Retirement & Compensation Consulting 103,638 124,194 125,406 101,311 115,064 97,002 113,636 FAS 88 nonqualified settlement - 267,258 46,114 - - - - Other 579 (65,080) (18,229) (19,352) - (17,555) (21,347)
Total Retirement 4,158,336 7,618,692 9,834,718 8,109,248 8,544,418 7,528,108 7,188,975
Health & WelfareActive Health Care 6,271,933 6,324,464 6,623,382 6,874,989 7,250,164 6,388,086 7,413,695 Life & LTD insurance, Misc Ben Programs 574,439 526,922 610,639 748,330 527,674 791,580 890,219 FAS 106 Retiree Medical 1,632,744 2,049,302 1,421,955 927,859 1,158,512 471,897 436,252 FAS 112 LTD (long-term disability) 322,891 344,735 453,601 (56,864) 190,153 144,575 51,164 Other - - - - - - -
Total Health & Welfare 8,802,007 9,245,423 9,109,577 8,494,313 9,126,503 7,796,138 8,791,330
Annual Incentive 1,623,246 2,291,294 806,330 688,204 739,893 1,052,280 1,112,498
Total Benefits 14,583,589 19,155,409 19,750,625 17,291,765 18,410,813 16,376,526 17,092,804
NSPM Total Company Electric Charged to Capital
NSPM Electric Charged to Capital for Minnesota Jurisdiction
PUBLIC DOCUMENT – TRADE SECRET INFORMATION EXCISED—PUBLIC DATA
Docket No. E002/GR-15-826 Exhibit___(RKL-1), Schedule 3 Page 1 of 1 Schedule 3 – Towers Watson Study on Competitive Annual Incentive and Total Cash Compensation Analysis Including Nuclear Positions
NON-PUBLIC DOCUMENT – CONTAINS TRADE SECRET INFORMATION—NON-PUBLIC DATA
ENTIRE DOCUMENT IS NON-PUBLIC Schedule 3 is a compensation and benefits study prepared by an external consultant which the Company has designated as Trade Secret information in its entirety as defined by Minn. Stat. § 13.37, subd. 1(b). The information contained in this schedule is not the work product of Xcel Energy, and we are only able to allow its release under the condition that it be protected as trade secret and will not be publicly released. Because it derives independent economic value from not being generally known to, and not being readily ascertainable by proper means by, other persons who can obtain economic value from its disclosure or use, Xcel Energy maintains this information as a trade secret pursuant to Minn. Rule 7829.0500, subp 3.
PUBLIC DOCUMENT – TRADE SECRET INFORMATION EXCISED—PUBLIC DATA
Docket No. E002/GR-15-826 Exhibit___(RKL-1), Schedule 4 Page 1 of 1
Schedule 4 – Towers Watson 2015 Energy Industry Benefits Study (BENVAL®)
NON-PUBLIC DOCUMENT – CONTAINS TRADE SECRET INFORMATION—NON-PUBLIC DATA
ENTIRE DOCUMENT IS NON-PUBLIC Schedule 4 is a compensation and benefits study prepared by an external consultant which the Company has designated as Trade Secret information in its entirety as defined by Minn. Stat. § 13.37, subd. 1(b). The information contained in this schedule is not the work product of Xcel Energy, and we are only able to allow its release under the condition that it be protected as trade secret and will not be publicly released. Because it derives independent economic value from not being generally known to, and not being readily ascertainable by proper means by, other persons who can obtain economic value from its disclosure or use, Xcel Energy maintains this information as a trade secret pursuant to Minn. Rule 7829.0500, subp 3.
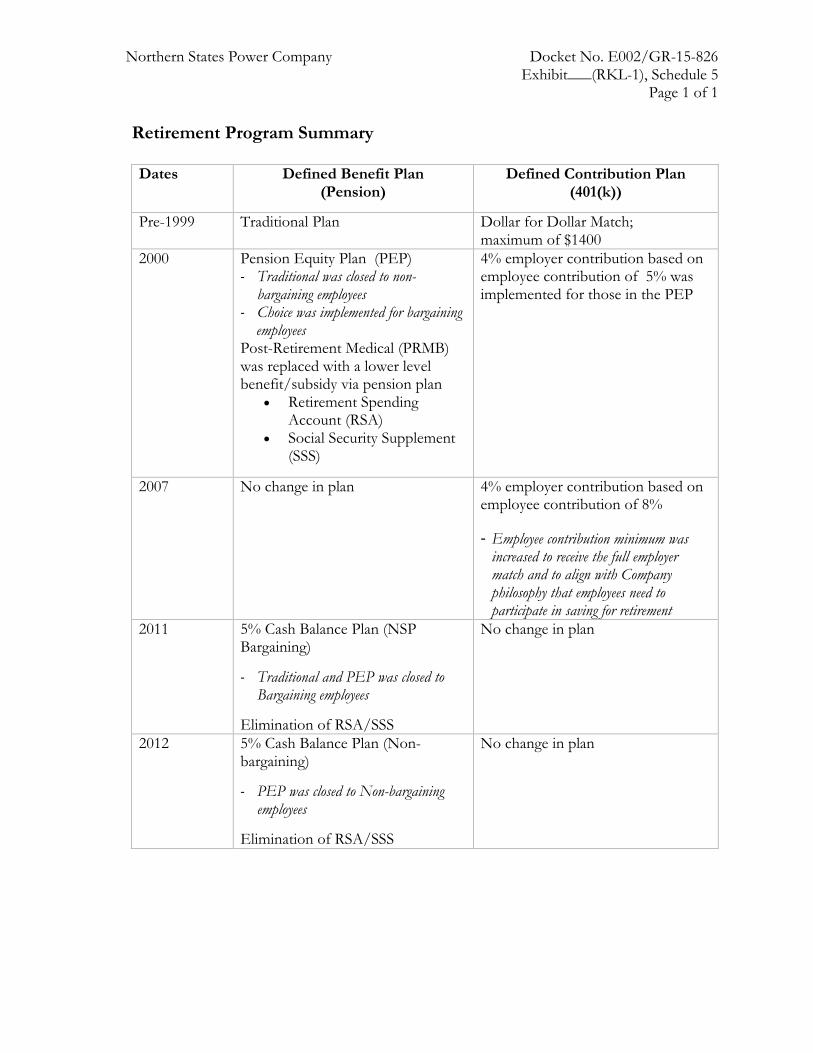
Northern States Power Company Docket No. E002/GR-15-826 Exhibit___(RKL-1), Schedule 5
Page 1 of 1 Retirement Program Summary Dates Defined Benefit Plan
(Pension) Defined Contribution Plan
(401(k))
Pre-1999 Traditional Plan Dollar for Dollar Match; maximum of $1400
2000 Pension Equity Plan (PEP) - Traditional was closed to non-
bargaining employees - Choice was implemented for bargaining employees Post-Retirement Medical (PRMB) was replaced with a lower level benefit/subsidy via pension plan
• Retirement Spending Account (RSA)
• Social Security Supplement (SSS)
4% employer contribution based on employee contribution of 5% was implemented for those in the PEP
2007 No change in plan
4% employer contribution based on employee contribution of 8% - Employee contribution minimum was
increased to receive the full employer match and to align with Company philosophy that employees need to participate in saving for retirement
2011
5% Cash Balance Plan (NSP Bargaining) - Traditional and PEP was closed to
Bargaining employees Elimination of RSA/SSS
No change in plan
2012
5% Cash Balance Plan (Non-bargaining) - PEP was closed to Non-bargaining
employees Elimination of RSA/SSS
No change in plan
XCEL ENERGY NON-BARGAINING EXEMPT EMPLOYEE ANNUAL INCENTIVE PROGRAM
Program Year January 1 – December 31, 2013
CONTENTS
INTRODUCTION
PURPOSE OF THE PROGRAM
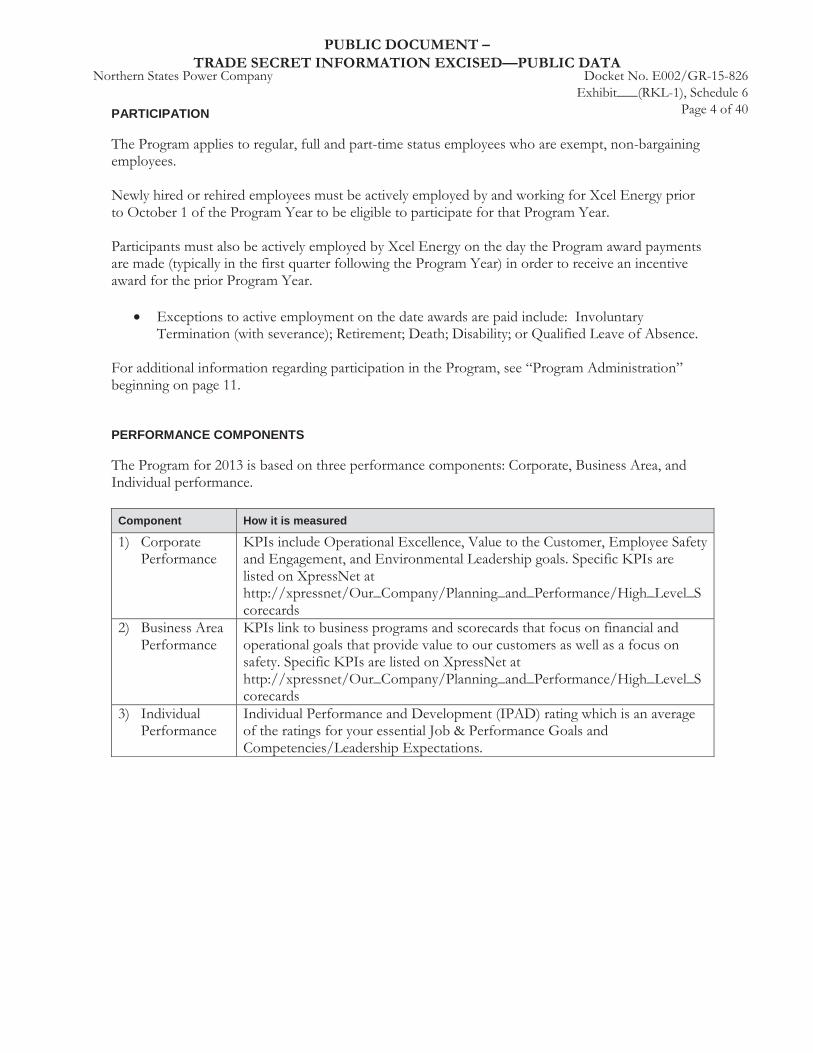
PARTICIPATION
PERFORMANCE COMPONENTS
Component How it is measured
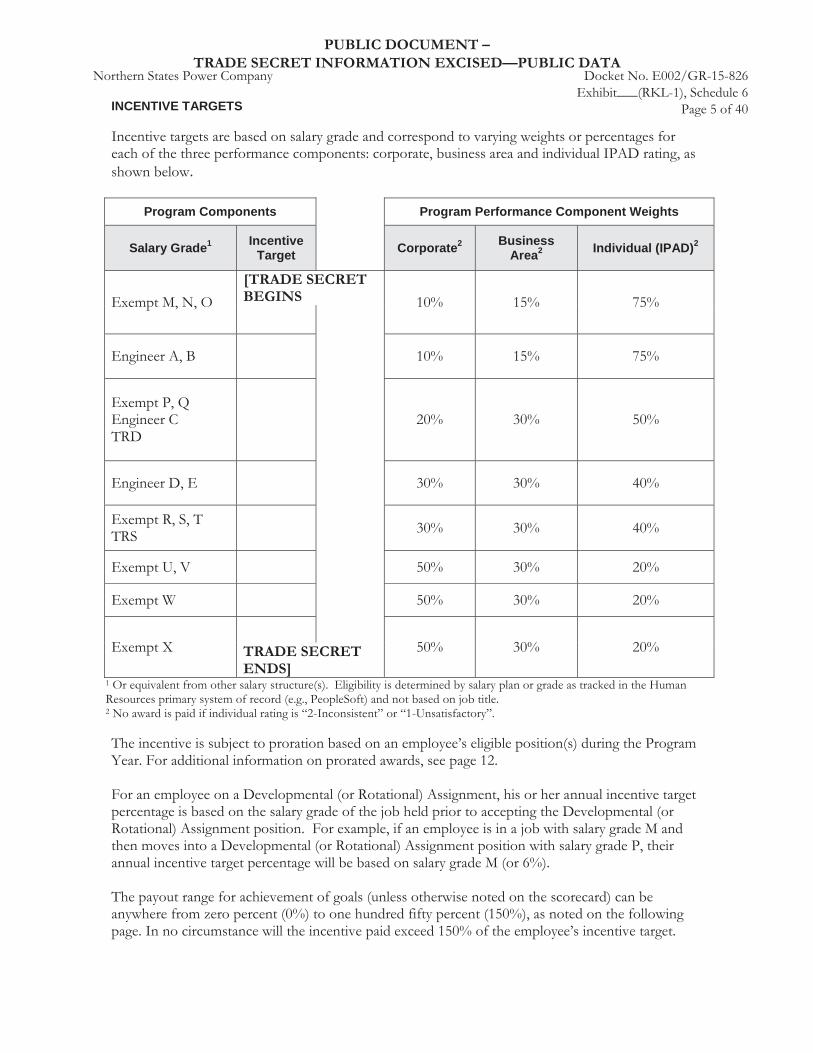
INCENTIVE TARGETS
.
Program Components Program Performance Component Weights
Salary Grade1 Incentive Target Corporate2 Business
Area2 Individual (IPAD)2
[TRADE SECRET BEGINS
TRADE SECRET ENDS]
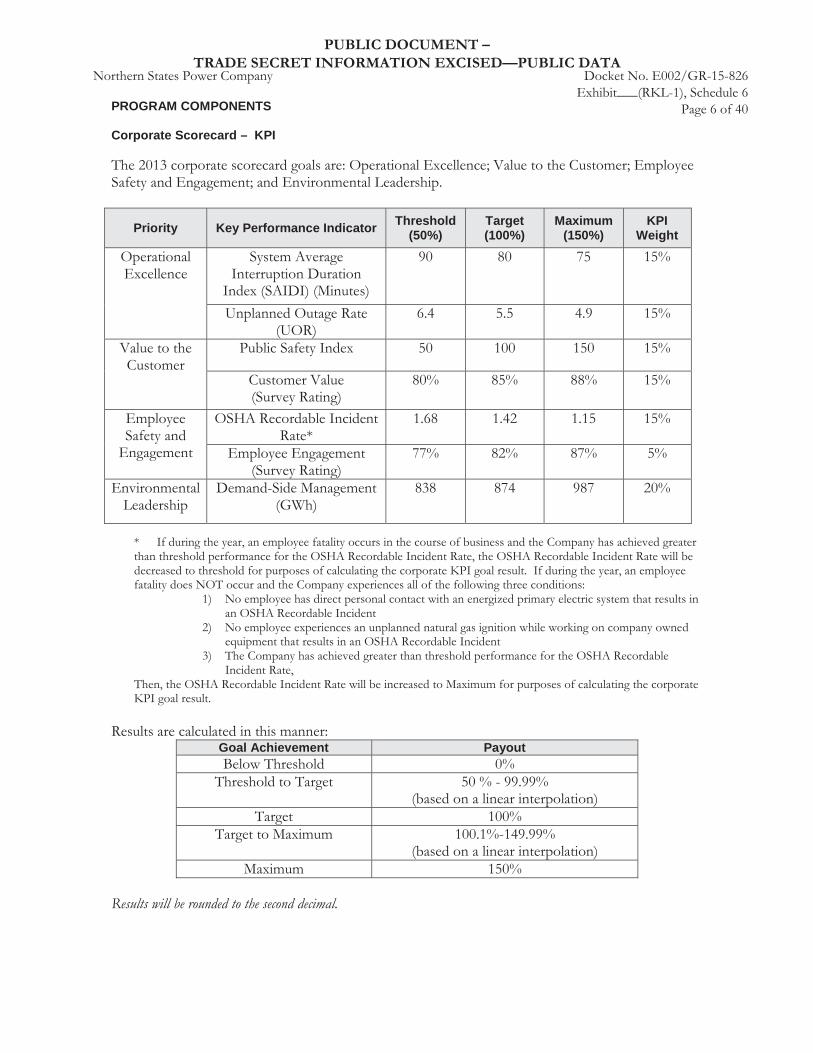
PROGRAM COMPONENTS
Corporate Scorecard – KPI
Priority Key Performance Indicator Threshold (50%)
Target (100%)
Maximum (150%)
KPI Weight
Goal Achievement Payout
Results will be rounded to the second decimal.
Business Area Scorecard – KPI
The Individual Component
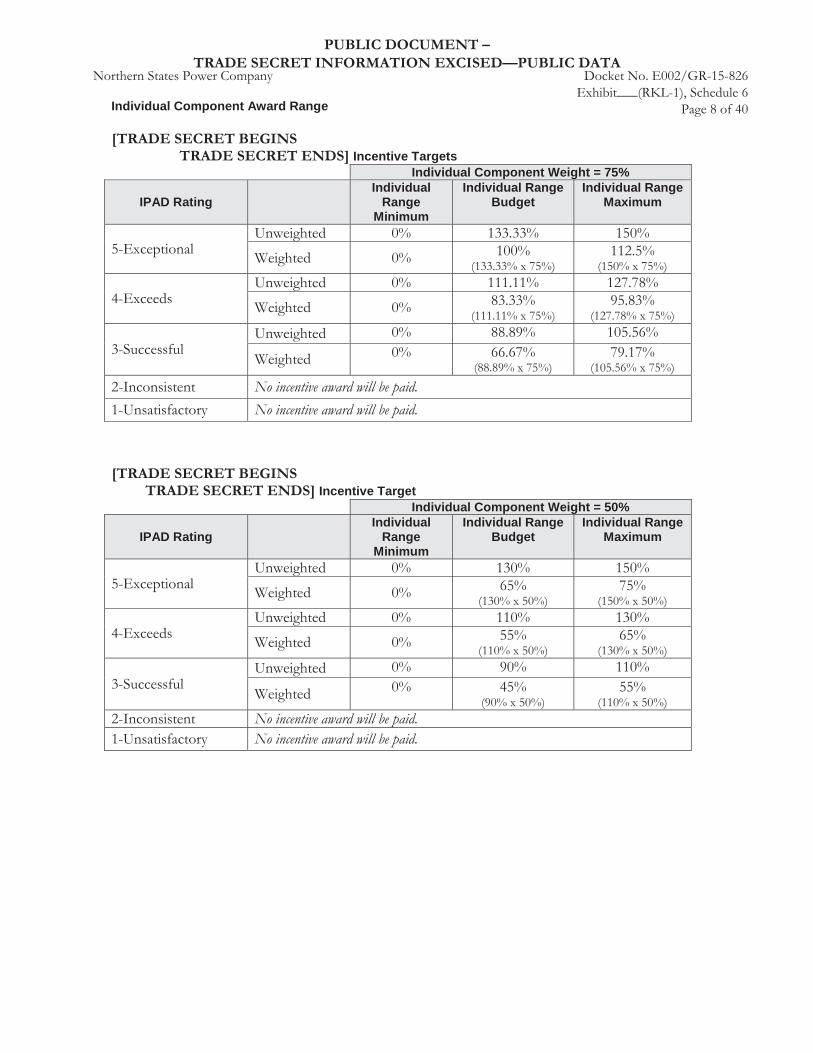
Individual Component Award Range
[TRADE SECRET BEGINSTRADE SECRET ENDS] Incentive Targets
Individual Component Weight = 75%
IPAD RatingIndividual
Range Minimum
Individual Range Budget
Individual Range Maximum
No incentive award will be paid. No incentive award will be paid.
[TRADE SECRET BEGINSTRADE SECRET ENDS] Incentive Target
Individual Component Weight = 50%
IPAD RatingIndividual
Range Minimum
Individual Range Budget
Individual Range Maximum
No incentive award will be paid. No incentive award will be paid.
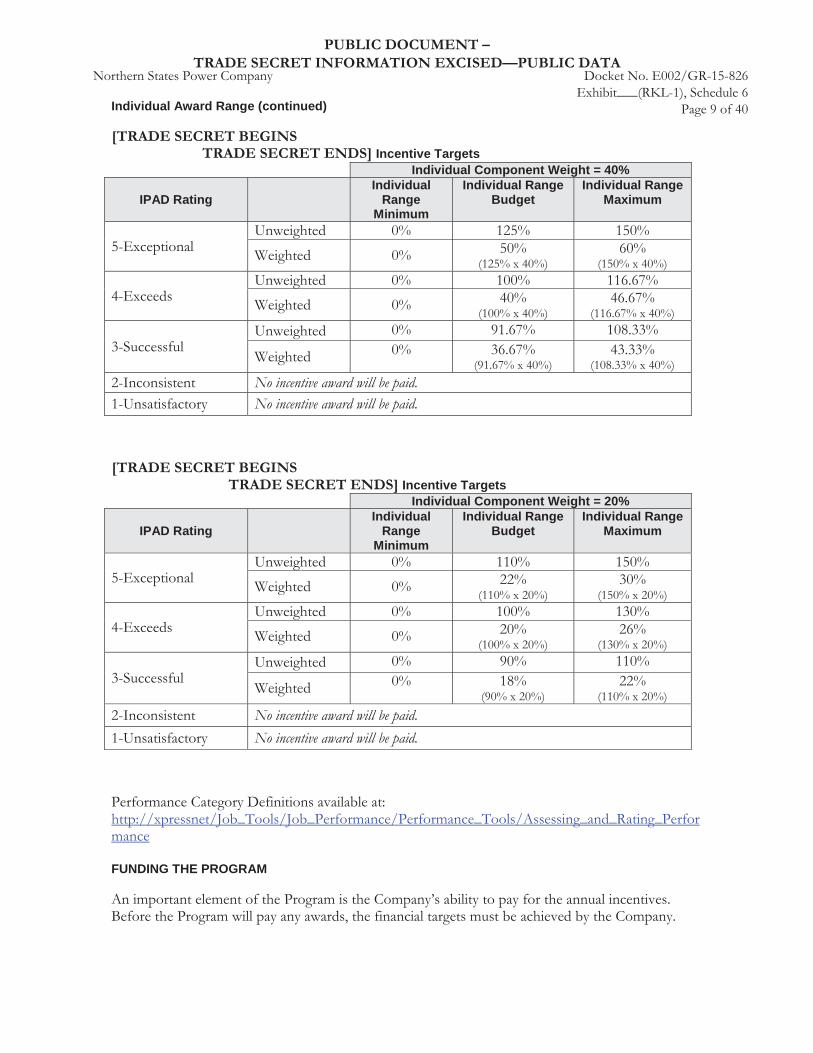
Individual Award Range (continued)
[TRADE SECRET BEGINSTRADE SECRET ENDS] Incentive Targets
Individual Component Weight = 40%
IPAD RatingIndividual
Range Minimum
Individual Range Budget
Individual Range Maximum
No incentive award will be paid. No incentive award will be paid.
[TRADE SECRET BEGINSTRADE SECRET ENDS] Incentive Targets
Individual Component Weight = 20%
IPAD RatingIndividual
Range Minimum
Individual Range Budget
Individual Range Maximum
No incentive award will be paid. No incentive award will be paid.
FUNDING THE PROGRAM
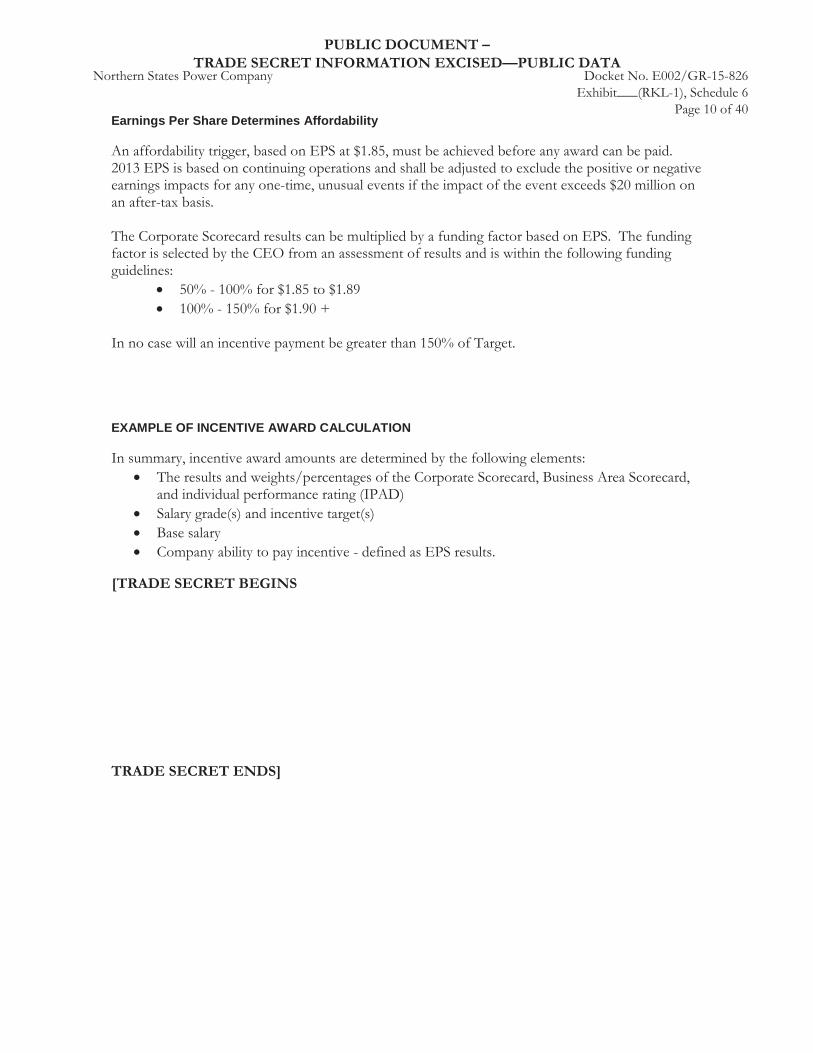
Earnings Per Share Determines Affordability
EXAMPLE OF INCENTIVE AWARD CALCULATION
[TRADE SECRET BEGINS TRADE SECRET ENDS]
EXAMPLE OF INCENTIVE AWARD CALCULATION (CONTINUED)[TRADE SECRET BEGINS
TRADE SECRET ENDS]
PROGRAM ADMINISTRATION
Approval and Timing of Payment
Form of Payment
Eligibility
Status Changes.
Hired or Rehired During Program Year.
Employed on Last Day of Program Year and Date of Payment.
Eligibility (continued)
Calendar Days
Examples of Prorated Awards
INCENTIVE AWARD PROGRAM RELATED INFORMATION
Chief Executive Officer
No Right to Continued Employment

XCEL ENERGY NON-BARGAINING, EXEMPT EMPLOYEEANNUAL INCENTIVE PROGRAM
Program Year: January 1 – December 31, 2014
CONTENTS
INTRODUCTION
PURPOSE OF THE PROGRAM

PARTICIPATION
PERFORMANCE COMPONENTS
Component How it is measured
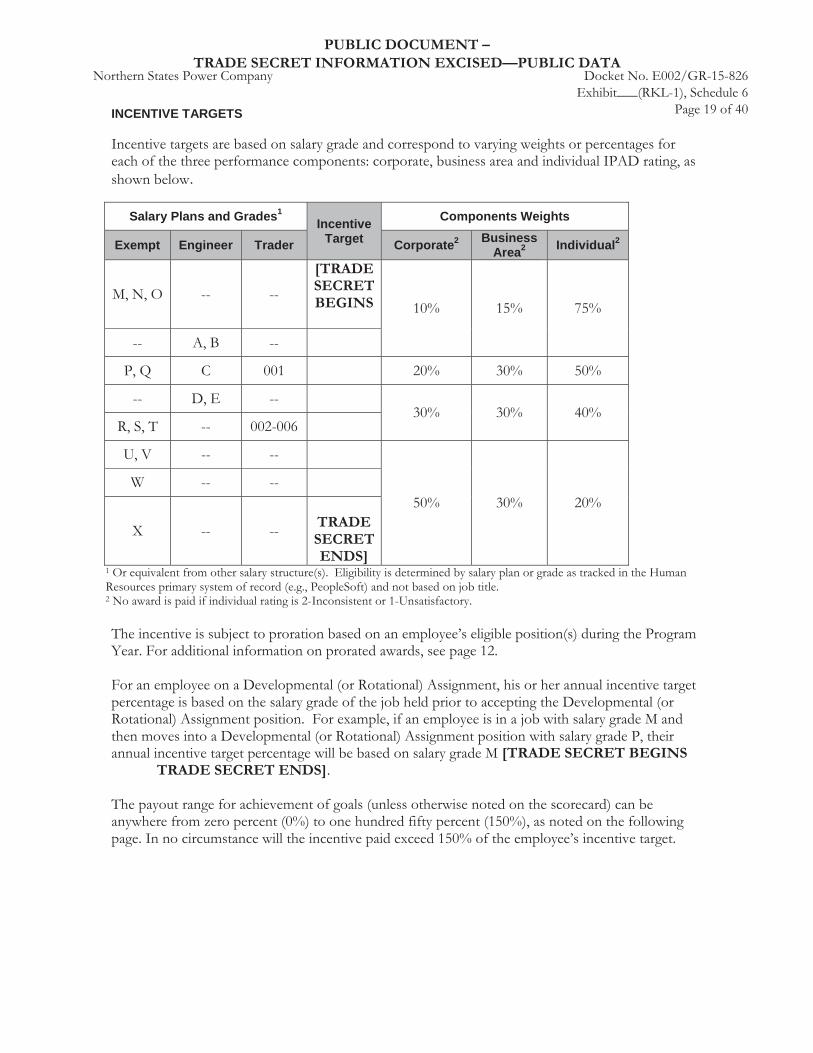
INCENTIVE TARGETS
.
Salary Plans and Grades1Incentive
Target
Components Weights
Exempt Engineer Trader Corporate2 Business Area2 Individual2
[TRADE SECRET BEGINS
TRADE SECRET ENDS]
[TRADE SECRET BEGINSTRADE SECRET ENDS]
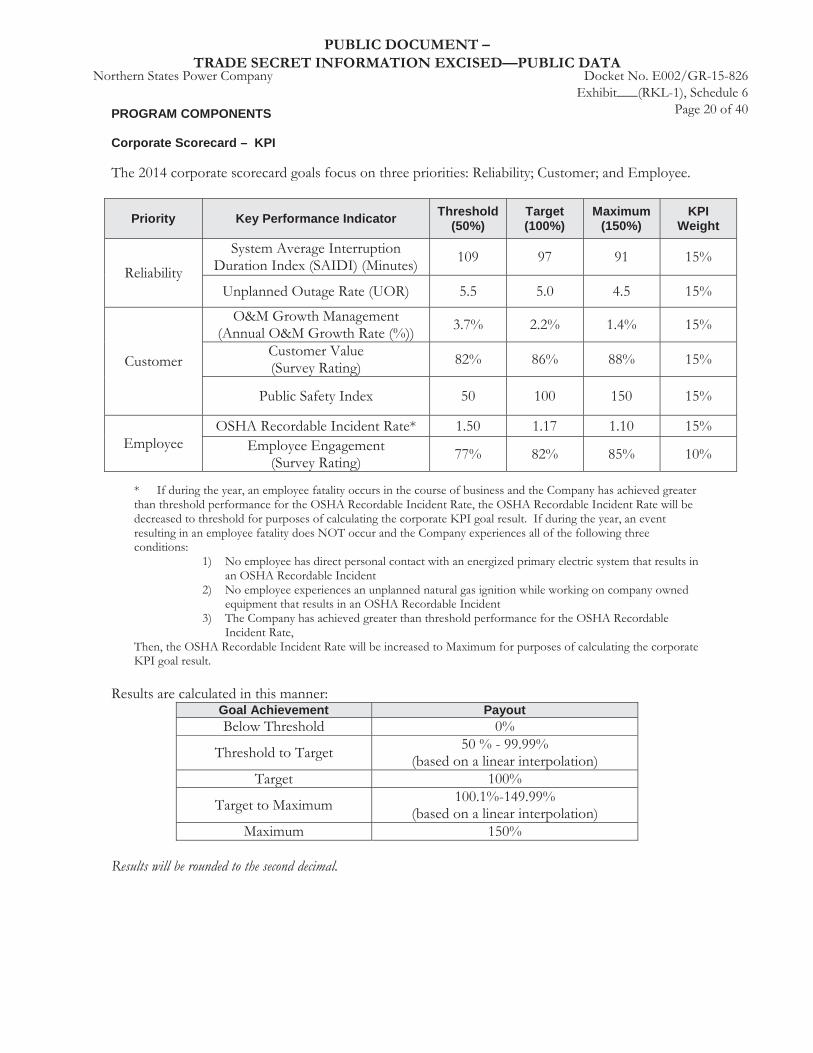
PROGRAM COMPONENTS
Corporate Scorecard – KPI
Priority Key Performance Indicator Threshold (50%)
Target (100%)
Maximum (150%)
KPI Weight
Goal Achievement Payout
Results will be rounded to the second decimal.
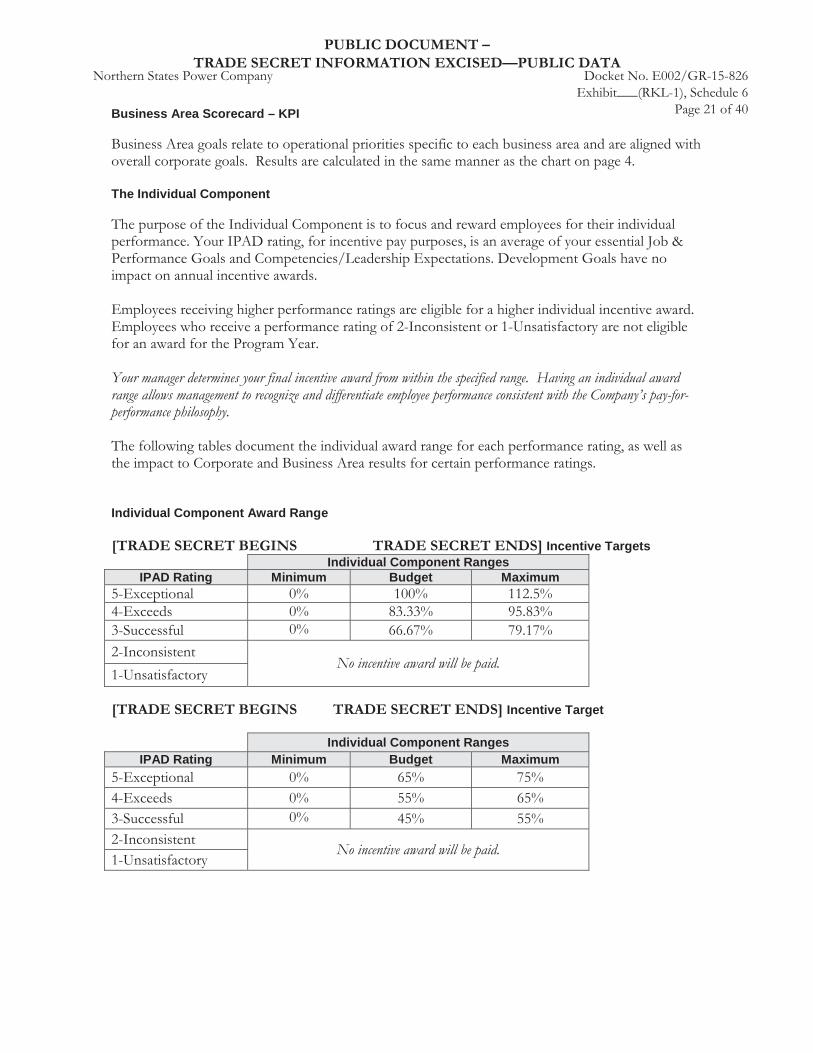
Business Area Scorecard – KPI
The Individual Component
Your manager determines your final incentive award from within the specified range. Having an individual award range allows management to recognize and differentiate employee performance consistent with the Company’s pay-for-performance philosophy.
Individual Component Award Range
[TRADE SECRET BEGINS TRADE SECRET ENDS] Incentive Targets Individual Component Ranges
IPAD Rating Minimum Budget Maximum
No incentive award will be paid.
[TRADE SECRET BEGINS TRADE SECRET ENDS] Incentive Target
Individual Component RangesIPAD Rating Minimum Budget Maximum
No incentive award will be paid.
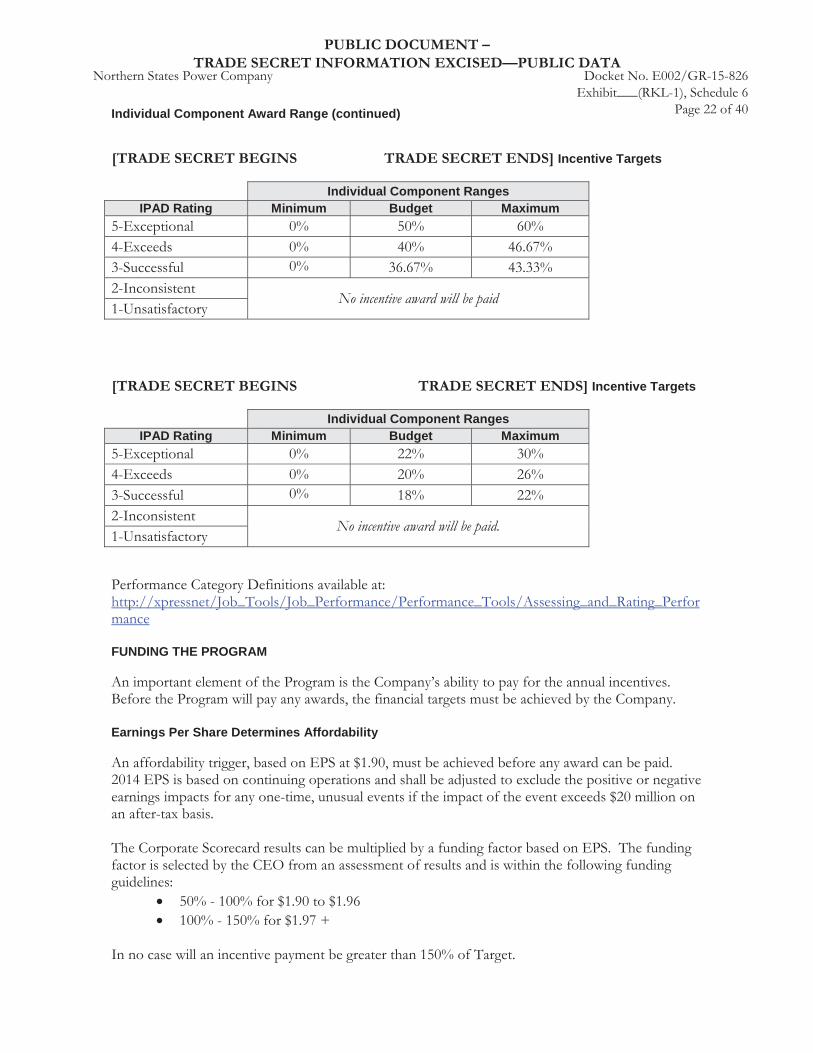
Individual Component Award Range (continued)
[TRADE SECRET BEGINS TRADE SECRET ENDS] Incentive Targets
Individual Component RangesIPAD Rating Minimum Budget Maximum
No incentive award will be paid
[TRADE SECRET BEGINS TRADE SECRET ENDS] Incentive Targets
Individual Component RangesIPAD Rating Minimum Budget Maximum
No incentive award will be paid.
FUNDING THE PROGRAM
Earnings Per Share Determines Affordability
EXAMPLE OF INCENTIVE AWARD CALCULATION
[TRADE SECRET BEGINS
TRADE SECRET ENDS]
EXAMPLE OF INCENTIVE AWARD CALCULATION (CONTINUED)
Individual Portion of Award:[TRADE SECRET BEGINS
TRADE SECRET ENDS]
PROGRAM ADMINISTRATION
Approval and Timing of Payment
Form of Payment
Eligibility
Status Changes.
Hired or Rehired During Program Year.
Employed on Last Day of Program Year and Date of Payment.
Eligibility (continued)
Calendar Days
Examples of Prorated Awards
INCENTIVE AWARD PROGRAM RELATED INFORMATION
Chief Executive Officer
No Right to Continued Employment
XCEL ENERGY NON-BARGAINING, EXEMPT EMPLOYEEANNUAL INCENTIVE PROGRAM
Program Year: January 1 – December 31, 2015
CONTENTS
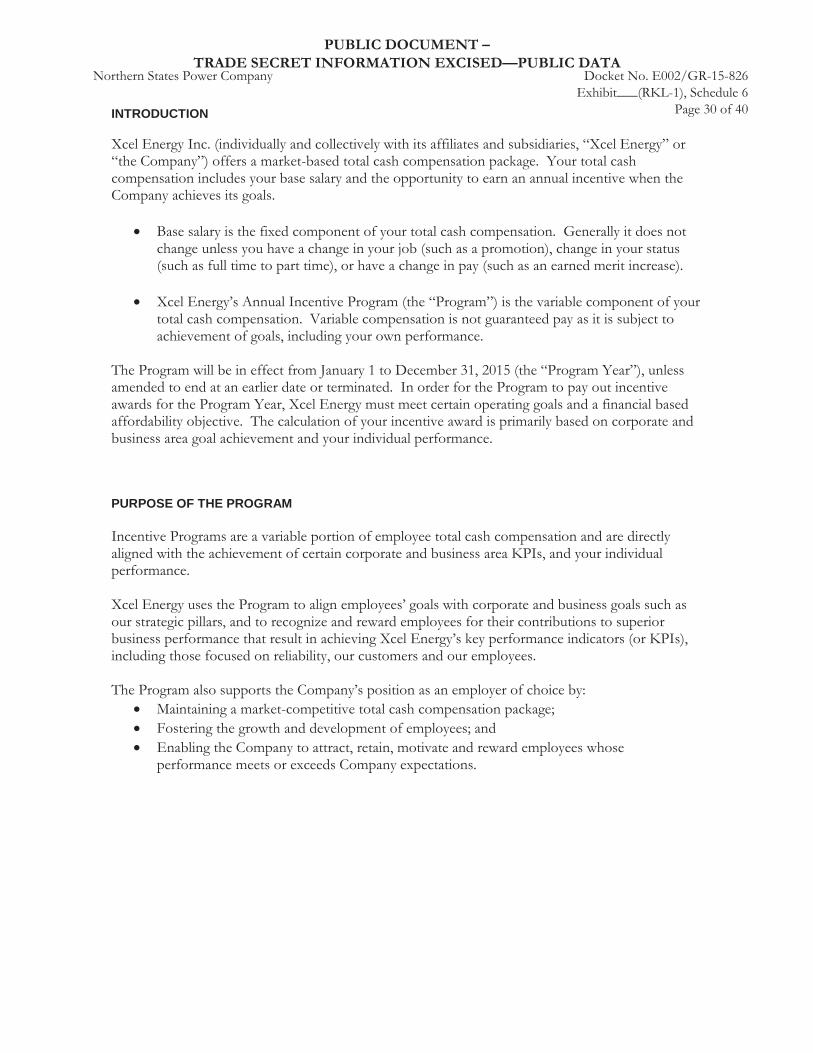
INTRODUCTION
PURPOSE OF THE PROGRAM
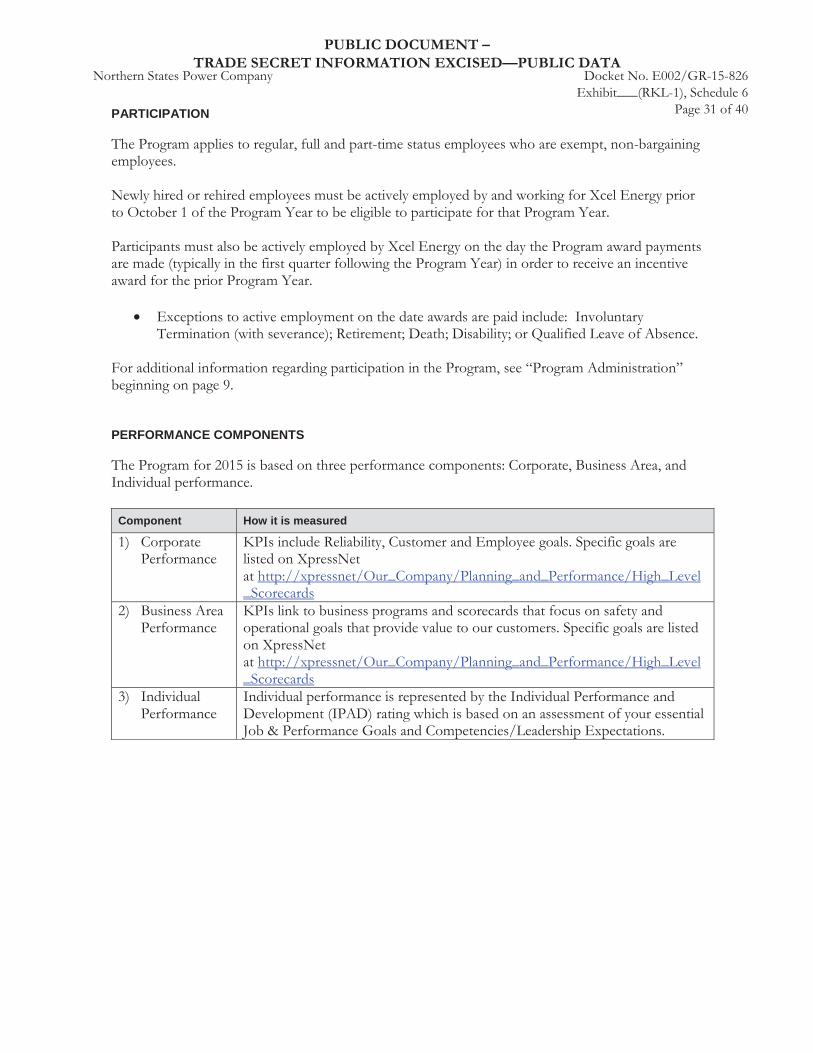
PARTICIPATION
PERFORMANCE COMPONENTS
Component How it is measured
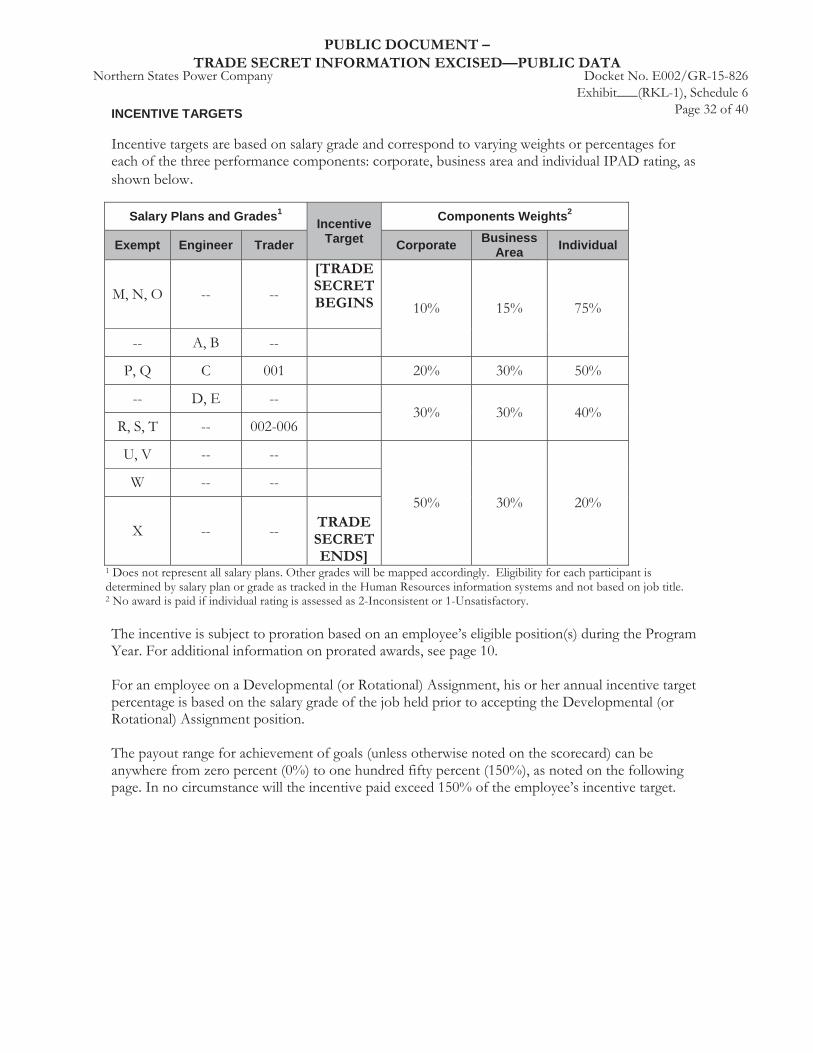
INCENTIVE TARGETS
.
Salary Plans and Grades1Incentive
Target
Components Weights2
Exempt Engineer Trader Corporate Business Area Individual
[TRADE SECRET BEGINS
TRADE SECRET ENDS]
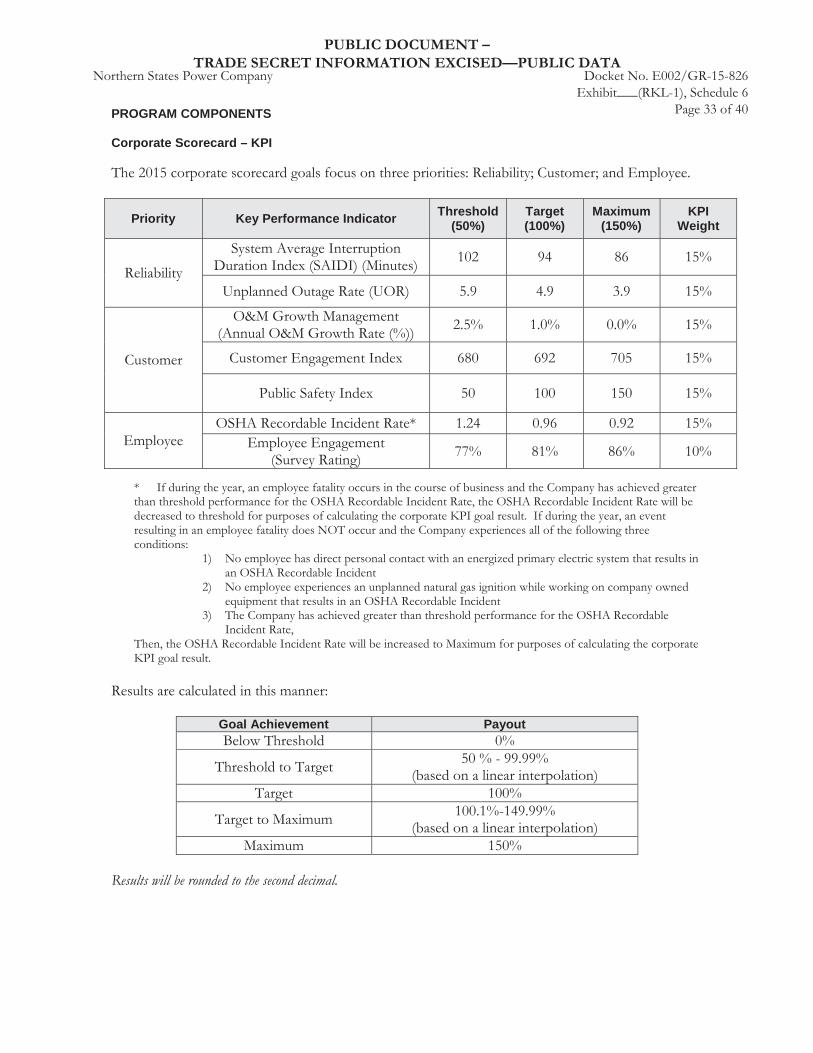
PROGRAM COMPONENTS
Corporate Scorecard – KPI
Priority Key Performance Indicator Threshold (50%)
Target (100%)
Maximum (150%)
KPI Weight
Goal Achievement Payout
Results will be rounded to the second decimal.
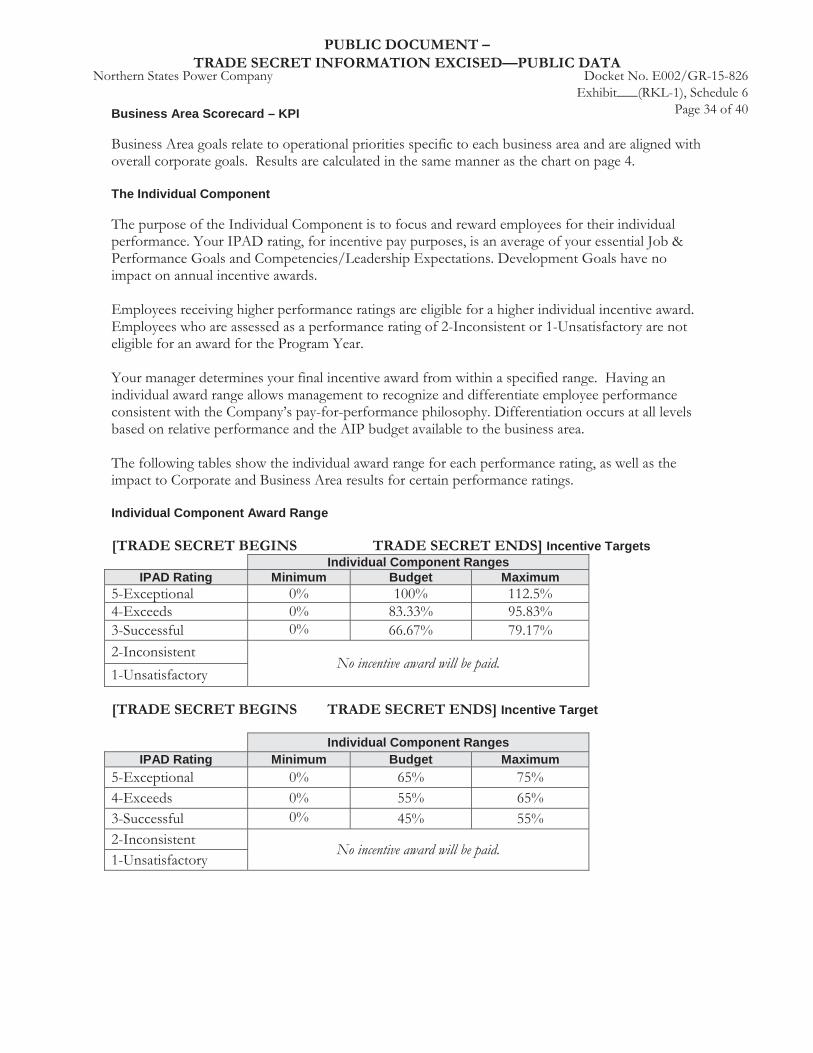
Business Area Scorecard – KPI
The Individual Component
Individual Component Award Range
[TRADE SECRET BEGINS TRADE SECRET ENDS] Incentive TargetsIndividual Component Ranges
IPAD Rating Minimum Budget Maximum
No incentive award will be paid.
[TRADE SECRET BEGINS TRADE SECRET ENDS] Incentive Target
Individual Component RangesIPAD Rating Minimum Budget Maximum
No incentive award will be paid.
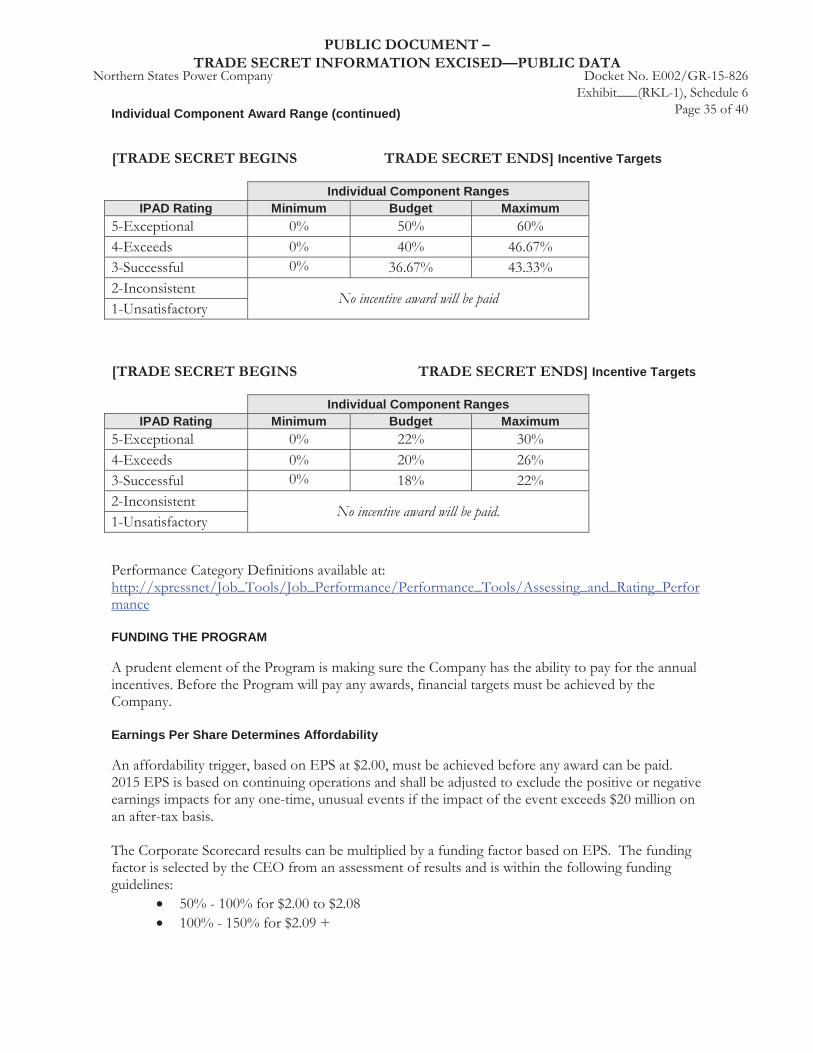
Individual Component Award Range (continued)
[TRADE SECRET BEGINS TRADE SECRET ENDS] Incentive Targets
Individual Component RangesIPAD Rating Minimum Budget Maximum
No incentive award will be paid
[TRADE SECRET BEGINS TRADE SECRET ENDS] Incentive Targets
Individual Component RangesIPAD Rating Minimum Budget Maximum
No incentive award will be paid.
FUNDING THE PROGRAM
Earnings Per Share Determines Affordability
EXAMPLE OF INCENTIVE AWARD CALCULATION
[TRADE SECRET BEGINS
TRADE SECRET ENDS]
EXAMPLE OF INCENTIVE AWARD CALCULATION (CONTINUED)
Individual Portion of Award:[TRADE SECRET BEGINS
TRADE SECRET ENDS]
PROGRAM ADMINISTRATION
Approval and Timing of Payment
Form of Payment
Eligibility
Status Changes.
Hired or Rehired During Program Year.
Employed on Last Day of Program Year and Date of Payment.
Eligibility (continued)
Calendar Days
Award Proration
INCENTIVE AWARD PROGRAM RELATED INFORMATION
Chief Executive Officer
No Right to Continued Employment
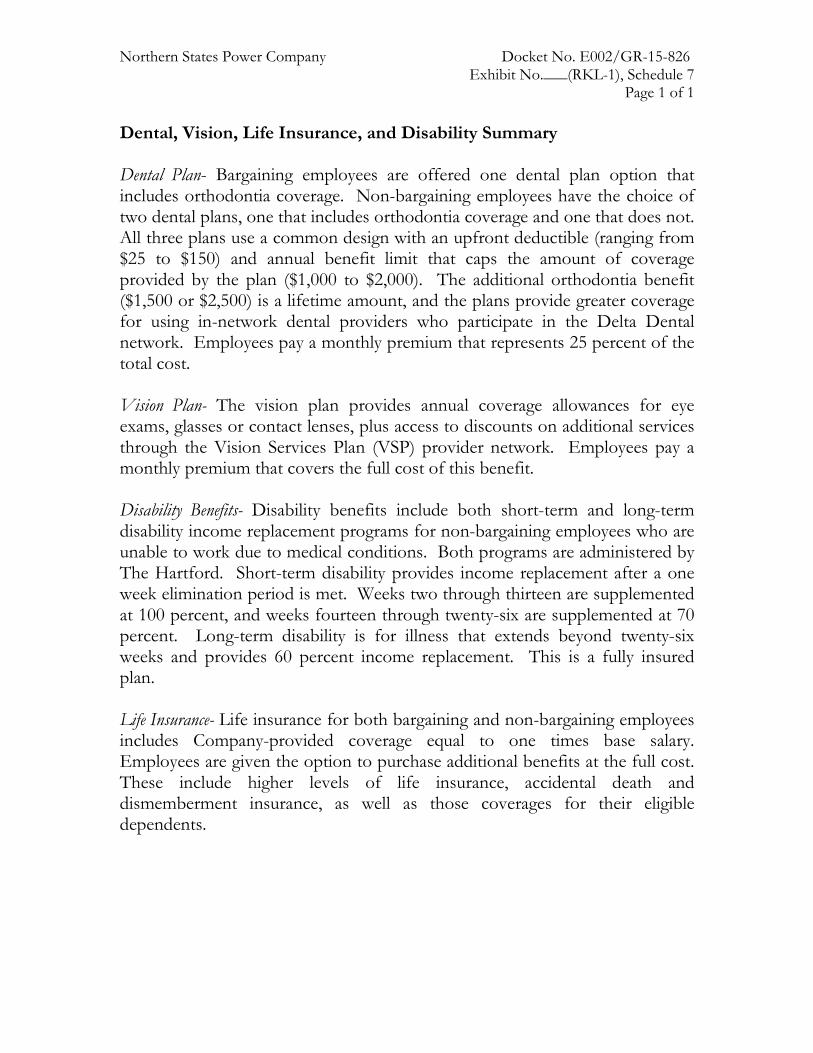
Northern States Power Company Docket No. E002/GR-15-826 Exhibit No.___(RKL-1), Schedule 7
Page 1 of 1 Dental, Vision, Life Insurance, and Disability Summary Dental Plan- Bargaining employees are offered one dental plan option that includes orthodontia coverage. Non-bargaining employees have the choice of two dental plans, one that includes orthodontia coverage and one that does not. All three plans use a common design with an upfront deductible (ranging from $25 to $150) and annual benefit limit that caps the amount of coverage provided by the plan ($1,000 to $2,000). The additional orthodontia benefit ($1,500 or $2,500) is a lifetime amount, and the plans provide greater coverage for using in-network dental providers who participate in the Delta Dental network. Employees pay a monthly premium that represents 25 percent of the total cost. Vision Plan- The vision plan provides annual coverage allowances for eye exams, glasses or contact lenses, plus access to discounts on additional services through the Vision Services Plan (VSP) provider network. Employees pay a monthly premium that covers the full cost of this benefit. Disability Benefits- Disability benefits include both short-term and long-term disability income replacement programs for non-bargaining employees who are unable to work due to medical conditions. Both programs are administered by The Hartford. Short-term disability provides income replacement after a one week elimination period is met. Weeks two through thirteen are supplemented at 100 percent, and weeks fourteen through twenty-six are supplemented at 70 percent. Long-term disability is for illness that extends beyond twenty-six weeks and provides 60 percent income replacement. This is a fully insured plan. Life Insurance- Life insurance for both bargaining and non-bargaining employees includes Company-provided coverage equal to one times base salary. Employees are given the option to purchase additional benefits at the full cost. These include higher levels of life insurance, accidental death and dismemberment insurance, as well as those coverages for their eligible dependents.
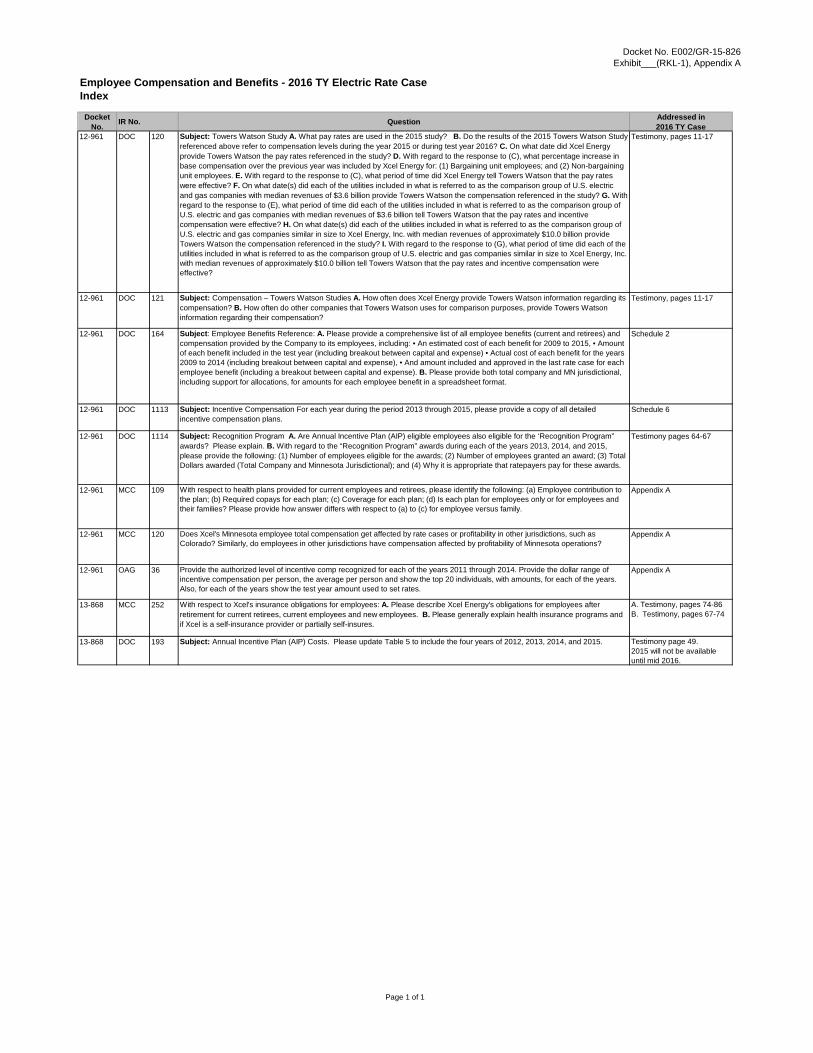
Docket No. E002/GR-15-826Exhibit___(RKL-1), Appendix A
Page 1 of 1
Employee Compensation and Benefits - 2016 TY Electric Rate CaseIndex
Docket No. IR No. Question Addressed in
2016 TY Case12-961 DOC 120 Subject: Towers Watson Study A. What pay rates are used in the 2015 study? B. Do the results of the 2015 Towers Watson Study
referenced above refer to compensation levels during the year 2015 or during test year 2016? C. On what date did Xcel Energy provide Towers Watson the pay rates referenced in the study? D. With regard to the response to (C), what percentage increase in base compensation over the previous year was included by Xcel Energy for: (1) Bargaining unit employees; and (2) Non-bargaining unit employees. E. With regard to the response to (C), what period of time did Xcel Energy tell Towers Watson that the pay rates were effective? F. On what date(s) did each of the utilities included in what is referred to as the comparison group of U.S. electric and gas companies with median revenues of $3.6 billion provide Towers Watson the compensation referenced in the study? G. With regard to the response to (E), what period of time did each of the utilities included in what is referred to as the comparison group of U.S. electric and gas companies with median revenues of $3.6 billion tell Towers Watson that the pay rates and incentive compensation were effective? H. On what date(s) did each of the utilities included in what is referred to as the comparison group of U.S. electric and gas companies similar in size to Xcel Energy, Inc. with median revenues of approximately $10.0 billion provide Towers Watson the compensation referenced in the study? I. With regard to the response to (G), what period of time did each of the utilities included in what is referred to as the comparison group of U.S. electric and gas companies similar in size to Xcel Energy, Inc. with median revenues of approximately $10.0 billion tell Towers Watson that the pay rates and incentive compensation were effective?
Testimony, pages 11-17
12-961 DOC 121 Subject: Compensation – Towers Watson Studies A. How often does Xcel Energy provide Towers Watson information regarding its compensation? B. How often do other companies that Towers Watson uses for comparison purposes, provide Towers Watson information regarding their compensation?
Testimony, pages 11-17
12-961 DOC 164 Subject: Employee Benefits Reference: A. Please provide a comprehensive list of all employee benefits (current and retirees) and compensation provided by the Company to its employees, including: • An estimated cost of each benefit for 2009 to 2015, • Amount of each benefit included in the test year (including breakout between capital and expense) • Actual cost of each benefit for the years 2009 to 2014 (including breakout between capital and expense), • And amount included and approved in the last rate case for each employee benefit (including a breakout between capital and expense). B. Please provide both total company and MN jurisdictional, including support for allocations, for amounts for each employee benefit in a spreadsheet format.
Schedule 2
12-961 DOC 1113 Subject: Incentive Compensation For each year during the period 2013 through 2015, please provide a copy of all detailed incentive compensation plans.
Schedule 6
12-961 DOC 1114 Subject: Recognition Program A. Are Annual Incentive Plan (AIP) eligible employees also eligible for the ‘Recognition Program” awards? Please explain. B. With regard to the “Recognition Program” awards during each of the years 2013, 2014, and 2015, please provide the following: (1) Number of employees eligible for the awards; (2) Number of employees granted an award; (3) Total Dollars awarded (Total Company and Minnesota Jurisdictional); and (4) Why it is appropriate that ratepayers pay for these awards.
Testimony pages 64-67
12-961 MCC 109 With respect to health plans provided for current employees and retirees, please identify the following: (a) Employee contribution to the plan; (b) Required copays for each plan; (c) Coverage for each plan; (d) Is each plan for employees only or for employees and their families? Please provide how answer differs with respect to (a) to (c) for employee versus family.
Appendix A
12-961 MCC 120 Does Xcel's Minnesota employee total compensation get affected by rate cases or profitability in other jurisdictions, such as Colorado? Similarly, do employees in other jurisdictions have compensation affected by profitability of Minnesota operations?
Appendix A
12-961 OAG 36 Provide the authorized level of incentive comp recognized for each of the years 2011 through 2014. Provide the dollar range of incentive compensation per person, the average per person and show the top 20 individuals, with amounts, for each of the years. Also, for each of the years show the test year amount used to set rates.
Appendix A
13-868 MCC 252 With respect to Xcel's insurance obligations for employees: A. Please describe Xcel Energy's obligations for employees after retirement for current retirees, current employees and new employees. B. Please generally explain health insurance programs and if Xcel is a self-insurance provider or partially self-insures.
A. Testimony, pages 74-86 B. Testimony, pages 67-74
13-868 DOC 193 Subject: Annual Incentive Plan (AIP) Costs. Please update Table 5 to include the four years of 2012, 2013, 2014, and 2015. Testimony page 49. 2015 will not be available until mid 2016.
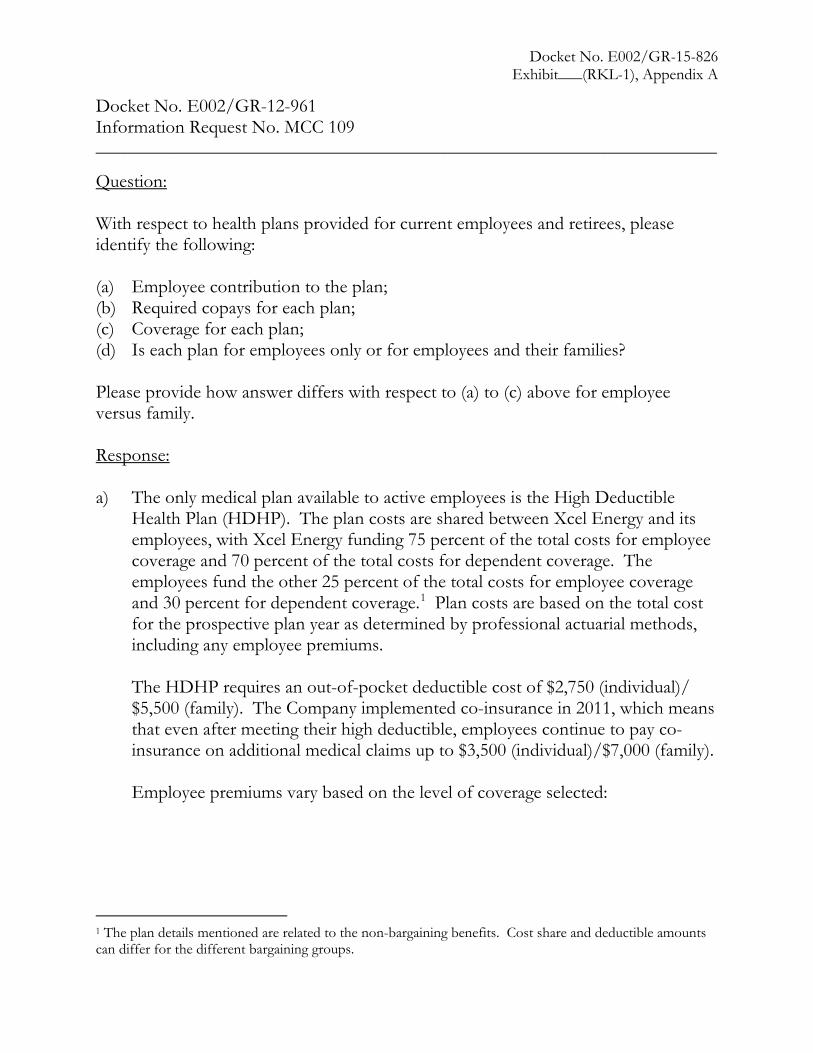
Docket No. E002/GR-15-826 Exhibit___(RKL-1), Appendix A
Docket No. E002/GR-12-961 Information Request No. MCC 109 __________________________________________________________________
Question:
With respect to health plans provided for current employees and retirees, please identify the following:
(a) Employee contribution to the plan; (b) Required copays for each plan; (c) Coverage for each plan; (d) Is each plan for employees only or for employees and their families?
Please provide how answer differs with respect to (a) to (c) above for employee versus family.
Response:
a) The only medical plan available to active employees is the High DeductibleHealth Plan (HDHP). The plan costs are shared between Xcel Energy and itsemployees, with Xcel Energy funding 75 percent of the total costs for employeecoverage and 70 percent of the total costs for dependent coverage. Theemployees fund the other 25 percent of the total costs for employee coverageand 30 percent for dependent coverage.1 Plan costs are based on the total costfor the prospective plan year as determined by professional actuarial methods,including any employee premiums.
The HDHP requires an out-of-pocket deductible cost of $2,750 (individual)/$5,500 (family). The Company implemented co-insurance in 2011, which meansthat even after meeting their high deductible, employees continue to pay co-insurance on additional medical claims up to $3,500 (individual)/$7,000 (family).
Employee premiums vary based on the level of coverage selected:
1 The plan details mentioned are related to the non-bargaining benefits. Cost share and deductible amounts can differ for the different bargaining groups.
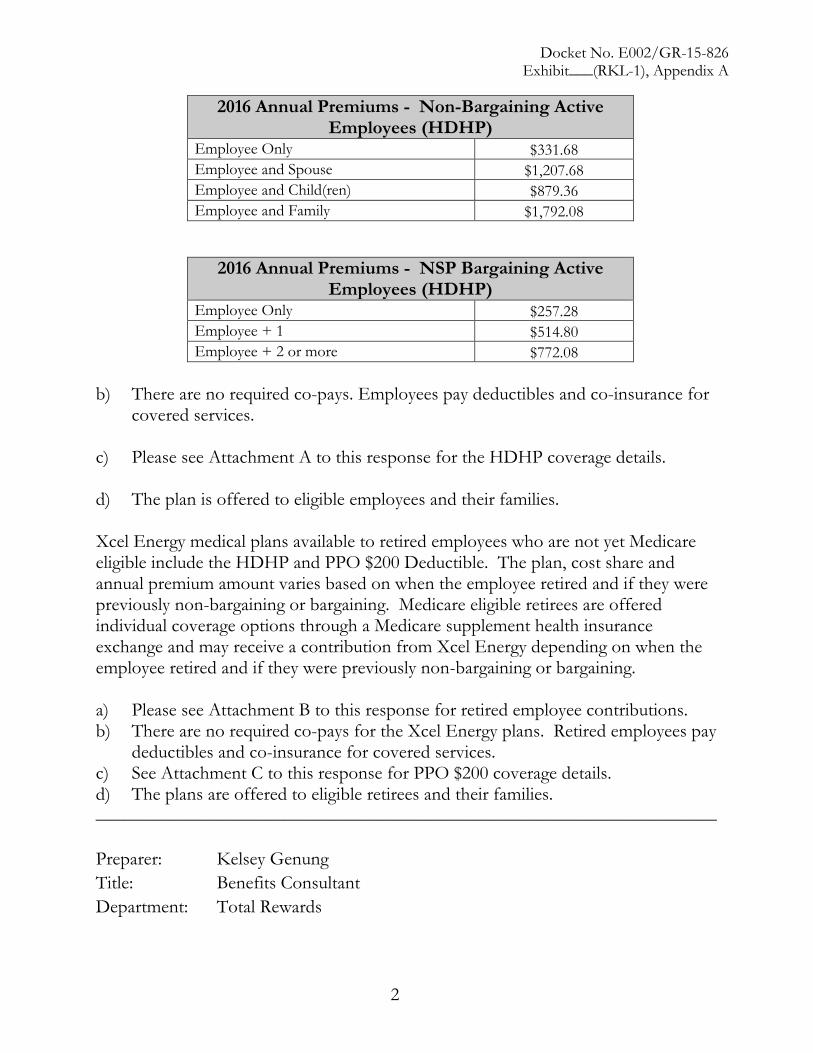
b) There are no required co-pays. Employees pay deductibles and co-insurance forcovered services.
c) Please see Attachment A to this response for the HDHP coverage details.
d) The plan is offered to eligible employees and their families.
Xcel Energy medical plans available to retired employees who are not yet Medicare eligible include the HDHP and PPO $200 Deductible. The plan, cost share and annual premium amount varies based on when the employee retired and if they were previously non-bargaining or bargaining. Medicare eligible retirees are offered individual coverage options through a Medicare supplement health insurance exchange and may receive a contribution from Xcel Energy depending on when the employee retired and if they were previously non-bargaining or bargaining.
a) Please see Attachment B to this response for retired employee contributions.b) There are no required co-pays for the Xcel Energy plans. Retired employees pay
deductibles and co-insurance for covered services.c) See Attachment C to this response for PPO $200 coverage details.d) The plans are offered to eligible retirees and their families.__________________________________________________________________
Preparer: Kelsey Genung Title: Benefits Consultant Department: Total Rewards
2016 Annual Premiums - Non-Bargaining Active Employees (HDHP)
Employee Only $331.68 Employee and Spouse $1,207.68 Employee and Child(ren) $879.36 Employee and Family $1,792.08
2016 Annual Premiums - NSP Bargaining Active Employees (HDHP)
Employee Only $257.28 Employee + 1 $514.80 Employee + 2 or more $772.08
2
Docket No. E002/GR-15-826 Exhibit___(RKL-1), Appendix A
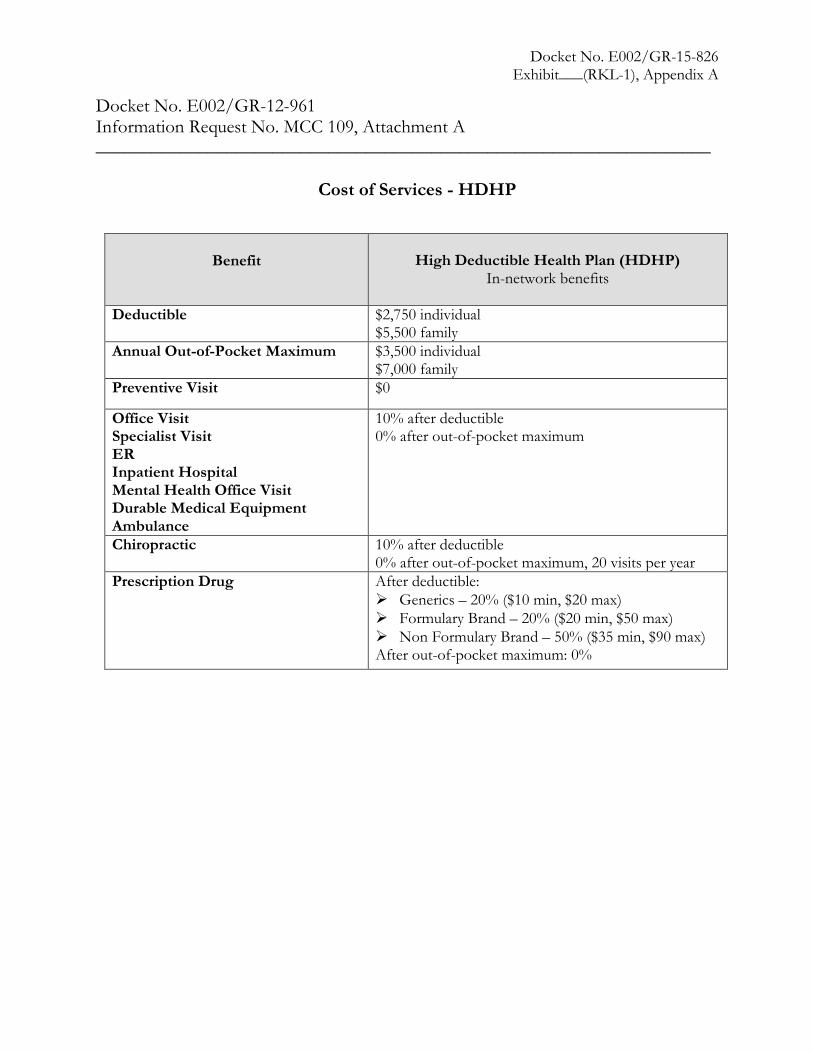
Docket No. E002/GR-15-826 Exhibit___(RKL-1), Appendix A
Docket No. E002/GR-12-961 Information Request No. MCC 109, Attachment A __________________________________________________________________
Cost of Services - HDHP
Benefit High Deductible Health Plan (HDHP) In-network benefits
Deductible $2,750 individual $5,500 family
Annual Out-of-Pocket Maximum $3,500 individual $7,000 family
Preventive Visit $0
Office Visit Specialist Visit ER Inpatient Hospital Mental Health Office Visit Durable Medical Equipment Ambulance
10% after deductible 0% after out-of-pocket maximum
Chiropractic 10% after deductible 0% after out-of-pocket maximum, 20 visits per year
Prescription Drug After deductible: Generics – 20% ($10 min, $20 max) Formulary Brand – 20% ($20 min, $50 max) Non Formulary Brand – 50% ($35 min, $90 max)After out-of-pocket maximum: 0%
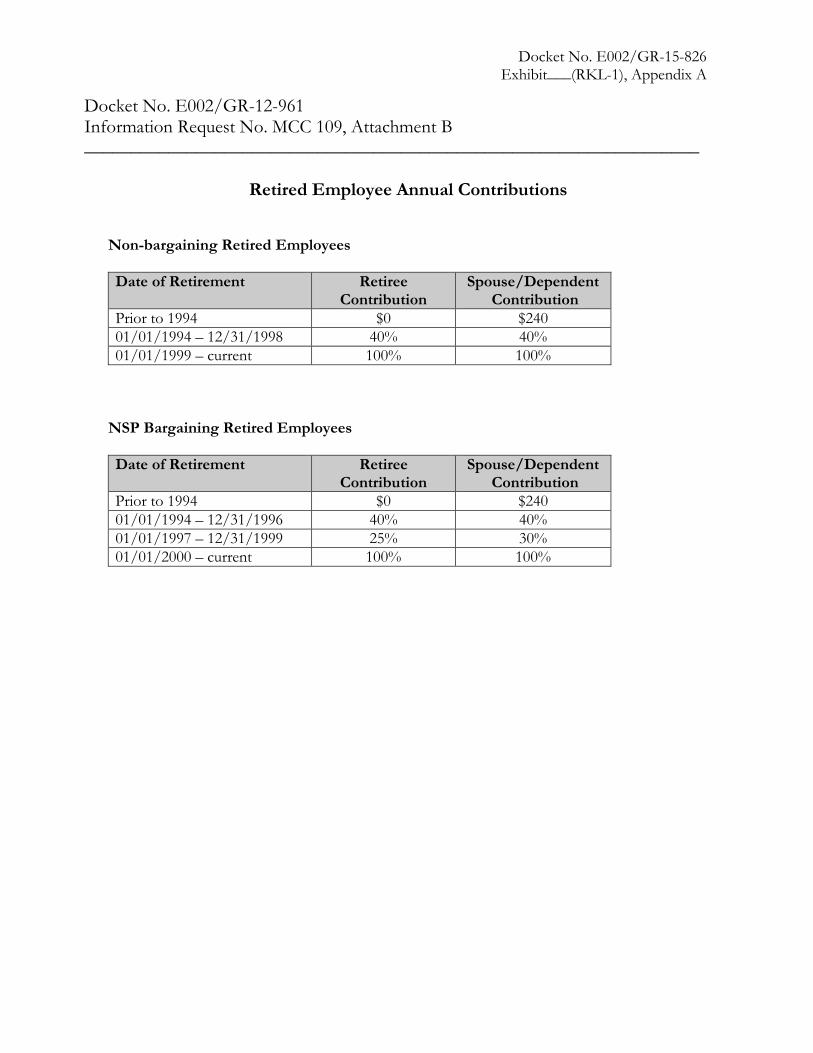
Docket No. E002/GR-15-826 Exhibit___(RKL-1), Appendix A
Docket No. E002/GR-12-961 Information Request No. MCC 109, Attachment B __________________________________________________________________
Retired Employee Annual Contributions
Non-bargaining Retired Employees
Date of Retirement Retiree Contribution
Spouse/Dependent Contribution
Prior to 1994 $0 $240 01/01/1994 – 12/31/1998 40% 40% 01/01/1999 – current 100% 100%
NSP Bargaining Retired Employees
Date of Retirement Retiree Contribution
Spouse/Dependent Contribution
Prior to 1994 $0 $240 01/01/1994 – 12/31/1996 40% 40% 01/01/1997 – 12/31/1999 25% 30% 01/01/2000 – current 100% 100%
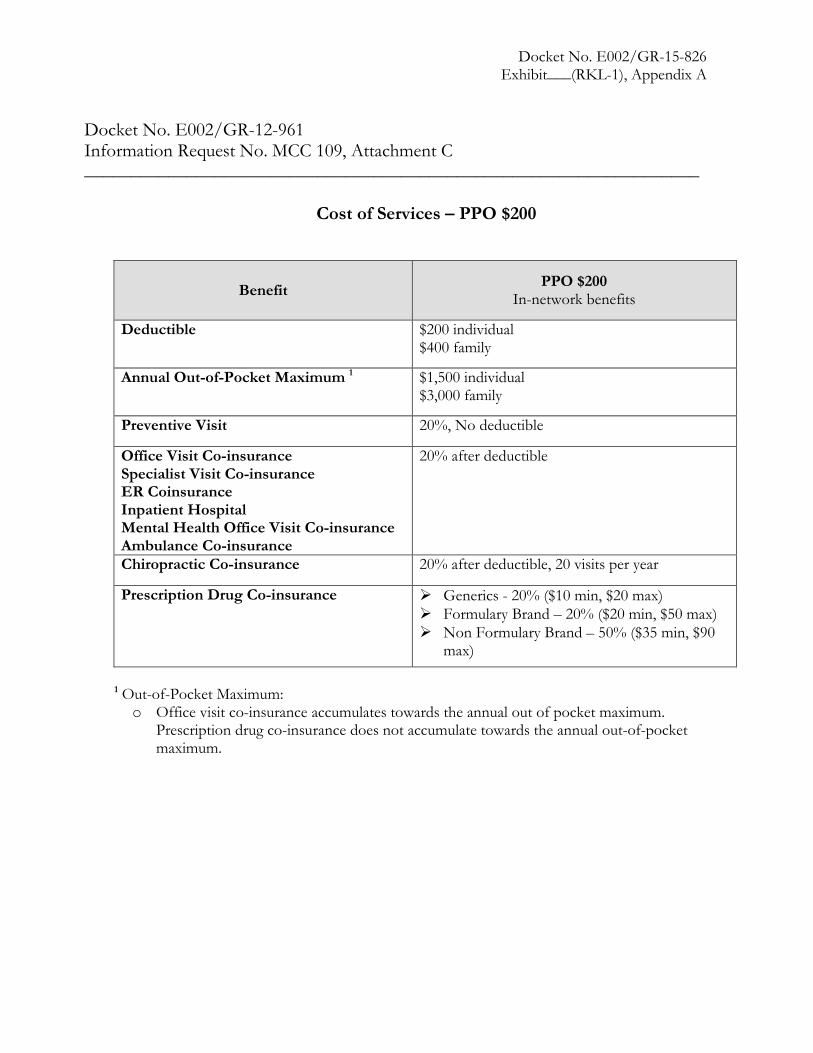
Docket No. E002/GR-15-826 Exhibit___(RKL-1), Appendix A
Docket No. E002/GR-12-961 Information Request No. MCC 109, Attachment C __________________________________________________________________
Cost of Services – PPO $200
Benefit PPO $200 In-network benefits
Deductible $200 individual $400 family
Annual Out-of-Pocket Maximum 1 $1,500 individual $3,000 family
Preventive Visit 20%, No deductible
Office Visit Co-insurance Specialist Visit Co-insurance ER Coinsurance Inpatient Hospital Mental Health Office Visit Co-insurance Ambulance Co-insurance
20% after deductible
Chiropractic Co-insurance 20% after deductible, 20 visits per year
Prescription Drug Co-insurance Generics - 20% ($10 min, $20 max) Formulary Brand – 20% ($20 min, $50 max) Non Formulary Brand – 50% ($35 min, $90
max)
1 Out-of-Pocket Maximum: o Office visit co-insurance accumulates towards the annual out of pocket maximum.
Prescription drug co-insurance does not accumulate towards the annual out-of-pocket maximum.
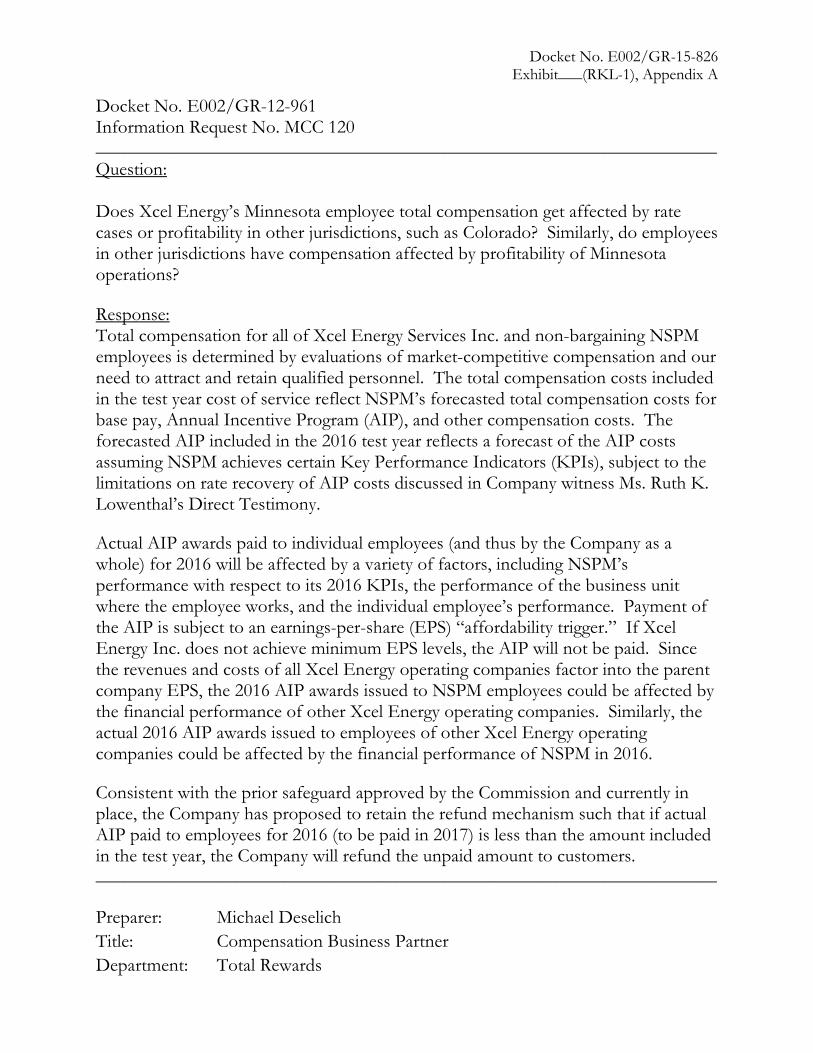
Docket No. E002/GR-15-826 Exhibit___(RKL-1), Appendix A
Docket No. E002/GR-12-961 Information Request No. MCC 120 __________________________________________________________________ Question: Does Xcel Energy’s Minnesota employee total compensation get affected by rate cases or profitability in other jurisdictions, such as Colorado? Similarly, do employees in other jurisdictions have compensation affected by profitability of Minnesota operations? Response: Total compensation for all of Xcel Energy Services Inc. and non-bargaining NSPM employees is determined by evaluations of market-competitive compensation and our need to attract and retain qualified personnel. The total compensation costs included in the test year cost of service reflect NSPM’s forecasted total compensation costs for base pay, Annual Incentive Program (AIP), and other compensation costs. The forecasted AIP included in the 2016 test year reflects a forecast of the AIP costs assuming NSPM achieves certain Key Performance Indicators (KPIs), subject to the limitations on rate recovery of AIP costs discussed in Company witness Ms. Ruth K. Lowenthal’s Direct Testimony. Actual AIP awards paid to individual employees (and thus by the Company as a whole) for 2016 will be affected by a variety of factors, including NSPM’s performance with respect to its 2016 KPIs, the performance of the business unit where the employee works, and the individual employee’s performance. Payment of the AIP is subject to an earnings-per-share (EPS) “affordability trigger.” If Xcel Energy Inc. does not achieve minimum EPS levels, the AIP will not be paid. Since the revenues and costs of all Xcel Energy operating companies factor into the parent company EPS, the 2016 AIP awards issued to NSPM employees could be affected by the financial performance of other Xcel Energy operating companies. Similarly, the actual 2016 AIP awards issued to employees of other Xcel Energy operating companies could be affected by the financial performance of NSPM in 2016. Consistent with the prior safeguard approved by the Commission and currently in place, the Company has proposed to retain the refund mechanism such that if actual AIP paid to employees for 2016 (to be paid in 2017) is less than the amount included in the test year, the Company will refund the unpaid amount to customers. __________________________________________________________________ Preparer: Michael Deselich Title: Compensation Business Partner Department: Total Rewards
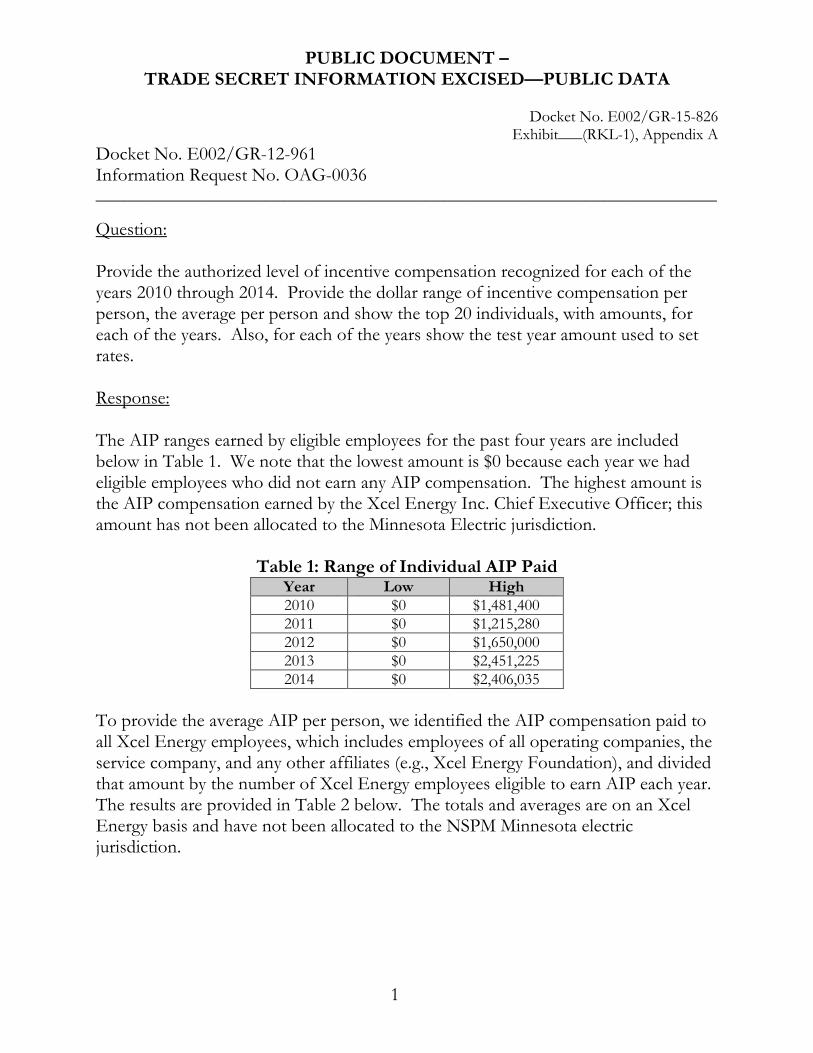
PUBLIC DOCUMENT – TRADE SECRET INFORMATION EXCISED—PUBLIC DATA
Docket No. E002/GR-15-826 Exhibit___(RKL-1), Appendix A Docket No. E002/GR-12-961 Information Request No. OAG-0036 __________________________________________________________________
Question: Provide the authorized level of incentive compensation recognized for each of the years 2010 through 2014. Provide the dollar range of incentive compensation per person, the average per person and show the top 20 individuals, with amounts, for each of the years. Also, for each of the years show the test year amount used to set rates. Response: The AIP ranges earned by eligible employees for the past four years are included below in Table 1. We note that the lowest amount is $0 because each year we had eligible employees who did not earn any AIP compensation. The highest amount is the AIP compensation earned by the Xcel Energy Inc. Chief Executive Officer; this amount has not been allocated to the Minnesota Electric jurisdiction.
Table 1: Range of Individual AIP Paid Year Low High 2010 $0 $1,481,400 2011 $0 $1,215,280 2012 $0 $1,650,000 2013 $0 $2,451,225 2014 $0 $2,406,035
To provide the average AIP per person, we identified the AIP compensation paid to all Xcel Energy employees, which includes employees of all operating companies, the service company, and any other affiliates (e.g., Xcel Energy Foundation), and divided that amount by the number of Xcel Energy employees eligible to earn AIP each year. The results are provided in Table 2 below. The totals and averages are on an Xcel Energy basis and have not been allocated to the NSPM Minnesota electric jurisdiction.
1

PUBLIC DOCUMENT – TRADE SECRET INFORMATION EXCISED—PUBLIC DATA
Docket No. E002/GR-15-826 Exhibit___(RKL-1), Appendix A
Table 2: Average AIP Per Person
Year Number of Eligible Employees
Total AIP (Xcel Energy)
Average AIP per Employee per year
2010 4,460 $50,340,897 $11,287
2011 4,011 $55,238,370 $13,772
2012 4,068 $68,004,481 $16,717
2013 4,287 $71,605,217 $16,703
2014 4,267 $68,176,535 $15,578
See Attachment A to this response for the details regarding the top 20 individuals. __________________________________________________________________ Preparer: Michael Deselich Title: Compensation Business Partner Department: Total Rewards
2
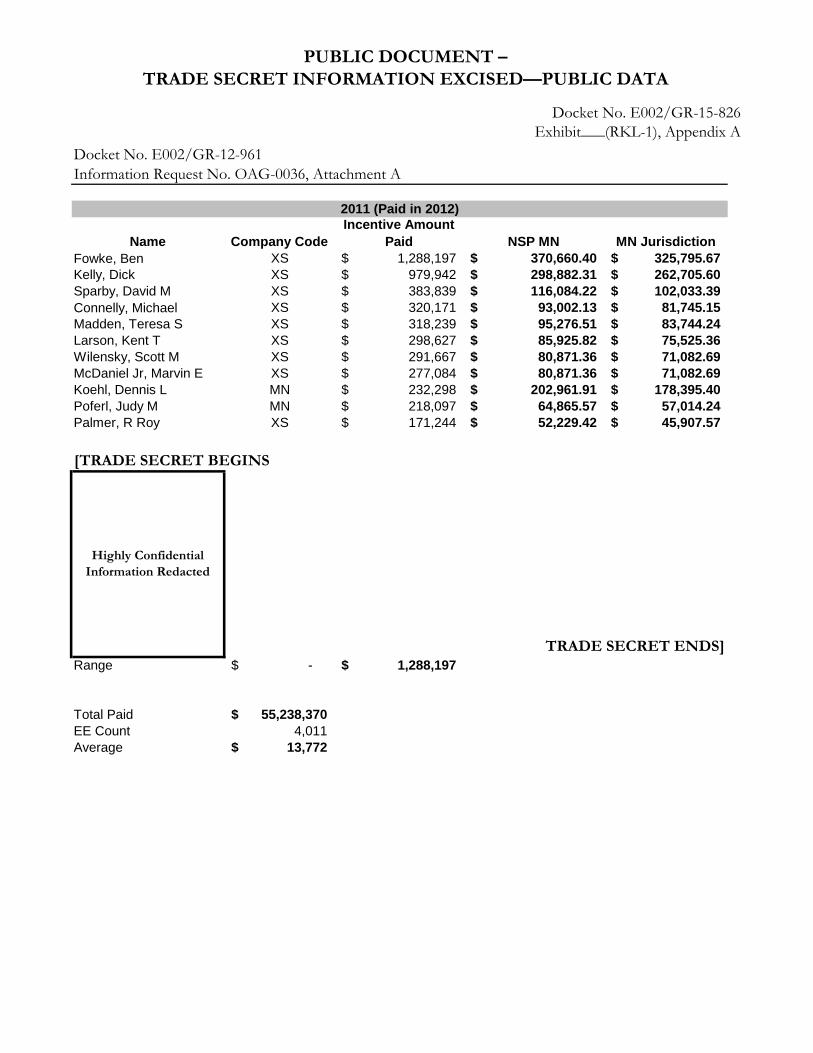
PUBLIC DOCUMENT – TRADE SECRET INFORMATION EXCISED—PUBLIC DATA
Docket No. E002/GR-15-826Exhibit___(RKL-1), Appendix A
Docket No. E002/GR-12-961Information Request No. OAG-0036, Attachment A
Name Company CodeIncentive Amount
Paid NSP MN MN JurisdictionFowke, Ben XS 1,288,197$ 370,660.40$ 325,795.67$ Kelly, Dick XS 979,942$ 298,882.31$ 262,705.60$ Sparby, David M XS 383,839$ 116,084.22$ 102,033.39$ Connelly, Michael XS 320,171$ 93,002.13$ 81,745.15$ Madden, Teresa S XS 318,239$ 95,276.51$ 83,744.24$ Larson, Kent T XS 298,627$ 85,925.82$ 75,525.36$ Wilensky, Scott M XS 291,667$ 80,871.36$ 71,082.69$ McDaniel Jr, Marvin E XS 277,084$ 80,871.36$ 71,082.69$ Koehl, Dennis L MN 232,298$ 202,961.91$ 178,395.40$ Poferl, Judy M MN 218,097$ 64,865.57$ 57,014.24$ Palmer, R Roy XS 171,244$ 52,229.42$ 45,907.57$
TRADE SECRET ENDS]Range -$ 1,288,197$
Total Paid 55,238,370$ EE Count 4,011 Average 13,772$
Highly Confidential Information Redacted
[TRADE SECRET BEGINS
2011 (Paid in 2012)
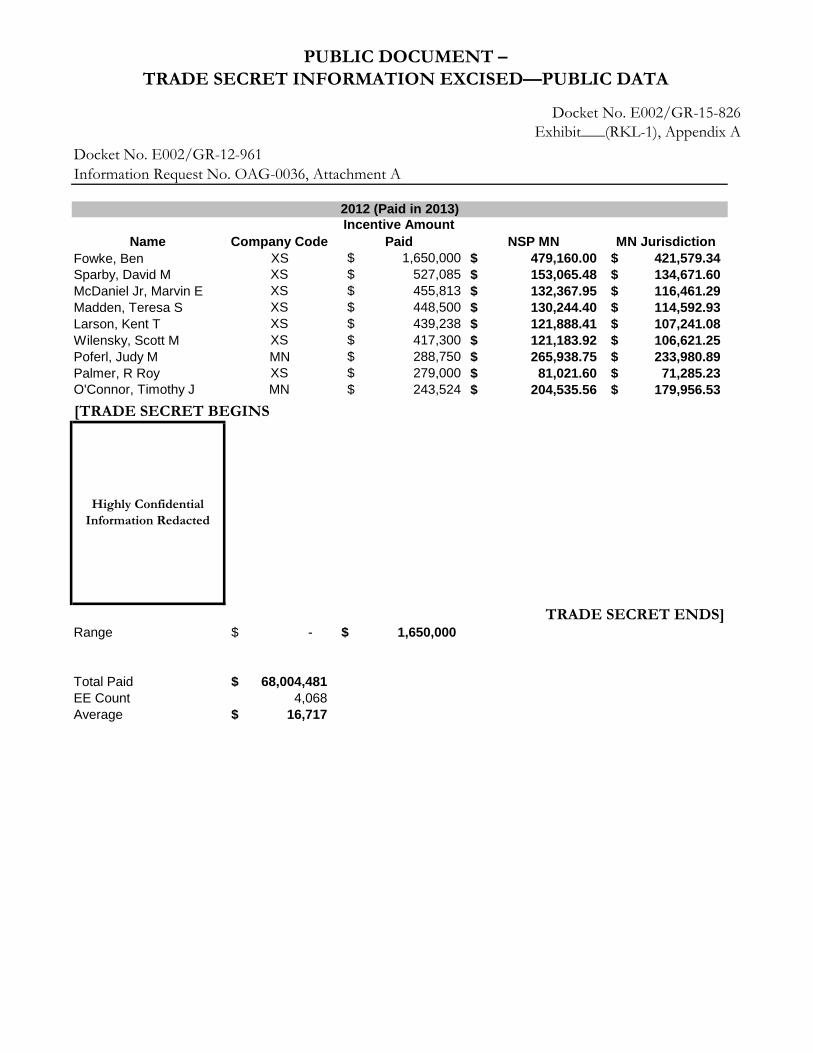
PUBLIC DOCUMENT – TRADE SECRET INFORMATION EXCISED—PUBLIC DATA
Docket No. E002/GR-15-826Exhibit___(RKL-1), Appendix A
Docket No. E002/GR-12-961Information Request No. OAG-0036, Attachment A
Name Company CodeIncentive Amount
Paid NSP MN MN JurisdictionFowke, Ben XS $ 1,650,000 479,160.00$ 421,579.34$ Sparby, David M XS $ 527,085 153,065.48$ 134,671.60$ McDaniel Jr, Marvin E XS $ 455,813 132,367.95$ 116,461.29$ Madden, Teresa S XS $ 448,500 130,244.40$ 114,592.93$ Larson, Kent T XS $ 439,238 121,888.41$ 107,241.08$ Wilensky, Scott M XS $ 417,300 121,183.92$ 106,621.25$ Poferl, Judy M MN $ 288,750 265,938.75$ 233,980.89$ Palmer, R Roy XS $ 279,000 81,021.60$ 71,285.23$ O'Connor, Timothy J MN $ 243,524 204,535.56$ 179,956.53$
TRADE SECRET ENDS]Range -$ 1,650,000$
Total Paid 68,004,481$ EE Count 4,068 Average 16,717$
[TRADE SECRET BEGINS
Highly Confidential Information Redacted
2012 (Paid in 2013)
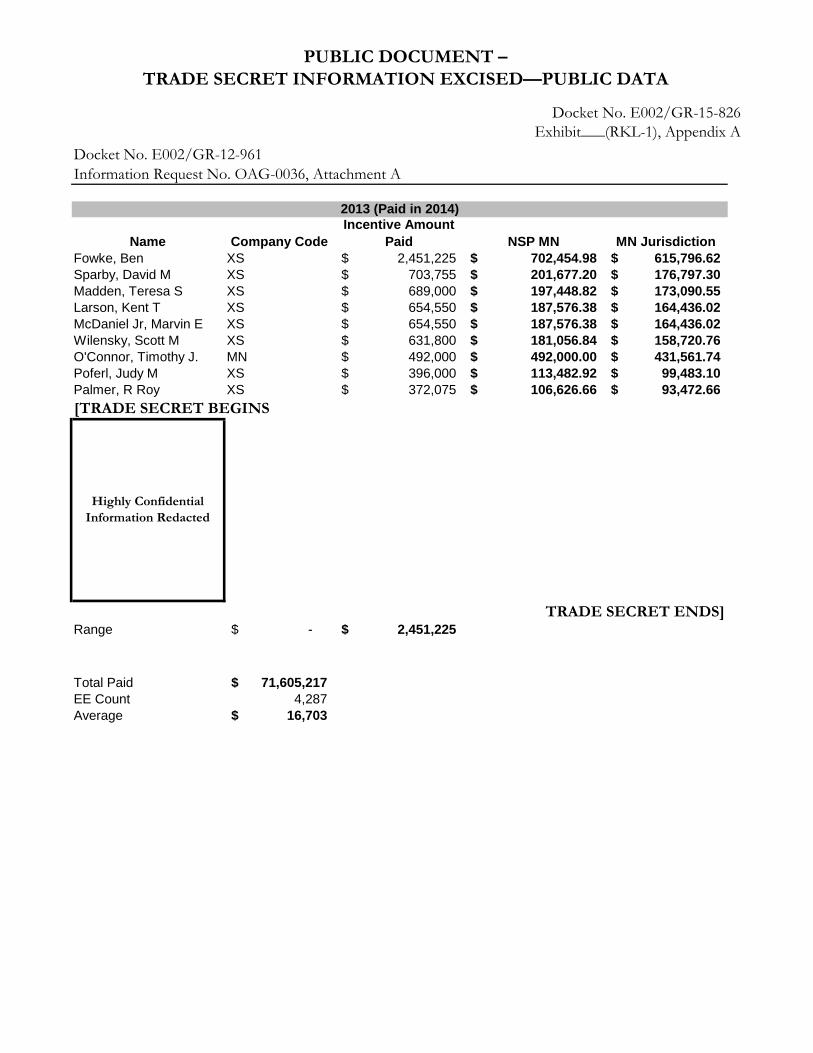
PUBLIC DOCUMENT – TRADE SECRET INFORMATION EXCISED—PUBLIC DATA
Docket No. E002/GR-15-826Exhibit___(RKL-1), Appendix A
Docket No. E002/GR-12-961Information Request No. OAG-0036, Attachment A
Name Company CodeIncentive Amount
Paid NSP MN MN JurisdictionFowke, Ben XS 2,451,225$ 702,454.98$ 615,796.62$ Sparby, David M XS 703,755$ 201,677.20$ 176,797.30$ Madden, Teresa S XS 689,000$ 197,448.82$ 173,090.55$ Larson, Kent T XS 654,550$ 187,576.38$ 164,436.02$ McDaniel Jr, Marvin E XS 654,550$ 187,576.38$ 164,436.02$ Wilensky, Scott M XS 631,800$ 181,056.84$ 158,720.76$ O'Connor, Timothy J. MN 492,000$ 492,000.00$ 431,561.74$ Poferl, Judy M XS 396,000$ 113,482.92$ 99,483.10$ Palmer, R Roy XS 372,075$ 106,626.66$ 93,472.66$
TRADE SECRET ENDS]Range -$ 2,451,225$
Total Paid 71,605,217$ EE Count 4,287 Average 16,703$
2013 (Paid in 2014)
[TRADE SECRET BEGINS
Highly Confidential Information Redacted

PUBLIC DOCUMENT – TRADE SECRET INFORMATION EXCISED—PUBLIC DATA
Docket No. E002/GR-15-826Exhibit___(RKL-1), Appendix A
Docket No. E002/GR-12-961Information Request No. OAG-0036, Attachment A
Name Company CodeIncentive Amount
Paid NSP MN MN JurisdictionFowke, Ben XS 2,406,034$ 679,792.51$ 594,880.99$ Larson, Kent T XS 647,966$ 183,074.13$ 160,206.70$ Madden, Teresa S XS 639,076$ 180,562.28$ 158,008.61$ McDaniel Jr, Marvin E XS 618,514$ 174,752.83$ 152,924.81$ Sparby, David M XS 600,175$ 169,571.33$ 148,390.51$ Wilensky, Scott M XS 566,888$ 160,166.47$ 140,160.39$ O'Connor, Timothy J MN 451,414$ 451,414.00$ 395,115.45$ Poferl, Judy M XS 338,560$ 95,655.55$ 83,707.41$ Palmer, R Roy XS 310,347$ 87,684.35$ 76,731.87$
TRADE SECRET ENDS]Range -$ 2,406,034$
Total Paid 68,176,535$ EE Count 4,267 Average 15,978$
Highly Confidential Information Redacted
[TRADE SECRET BEGINS
2014 (Paid in 2015)


![Decision and Order [Redacted Public Record Version]](https://img.pdfslide.us/doc/110x75/61fa32de67f7d54adf3cfb87/decision-and-order-redacted-public-record-version.jpg)


![Decision and Order [Redacted Public Version]](https://img.pdfslide.us/doc/110x75/61d57a057bb473025c17c813/decision-and-order-redacted-public-version.jpg)