Embed Size (px)
Citation preview

Report No. 5503-PH
The PhilippinesFood Processing SectorDevelopment Potential and Constraints
July 11, 1985
East Asia and Pacific Projects Department
FOR OFFICIAL USE ONLY
-: -. - --
Document of the World Bank
This report has a restricted distribution and may be used by recipientsonly in the performance of their official duties. Its contents may not otherwisebe disclosed without World Bank authorization.
Pub
lic D
iscl
osur
e A
utho
rized
Pub
lic D
iscl
osur
e A
utho
rized
Pub
lic D
iscl
osur
e A
utho
rized
Pub
lic D
iscl
osur
e A
utho
rized
Pub
lic D
iscl
osur
e A
utho
rized
Pub
lic D
iscl
osur
e A
utho
rized
Pub
lic D
iscl
osur
e A
utho
rized
Pub
lic D
iscl
osur
e A
utho
rized
FOR OMCIAL USE ONLY
PHILIPPINES
FOOD PROCESSING SECTOR: DEVELOPMENT POTENTIAL AND CONSTRAINTS
Page No.
EXECUTIVE SUMHARY .................................................. i-vi
I. INTRODUCTION ................................................. 1
A. Background .. ............................ ...... 1B. The Role of Food Processing in the Government's
Growth Strategy ......................................... 1C. Importance of Food Processing . . .1........ D. Structure of the Industry . . . 2E. Objectives of Study . . . 2F. Coverage of Study . . . 3
Ir. INDUSTRY STRUCTURE, CONDITIONS AND NEEDS ..................... 4
A. Structure of the Industry ................................. 41. Fruit and Vegetable Processing . . 42. Beef, Pork and Chicken Processing .. 43. Dairy Product Processing .. 54. Fish Processing .. 6
B. Technical Staff Capabilities .............................. 6C. Standards of Sanitation and Quality Control ............... 7D. Research and Development ................................. 8E. Packaging .......... 10F. Investment Needs ......................................... . 12
III. AGRICULTURAL PRODUCTION FOR PROCESSING ....................... 12
A. Procurement of Raw MateriaLs: General Aspects ............ 121. Sources of Raw Material Supplies .. 132. Options for Expanding Contract Farming ....... ........ 15
B. Specific Production Aspects ..... 171. Selected Fruits and Vegetables . . ...................... 172. Beef, Pork and Chicken (Including Feedgrain Inputs)... 193. Dairy Products ..... . .................................. 214. Marine Products. ...... 21
This report was prepared by a mission which visited the Philippines in June1984. The mission consisted of Ernst Lutz (Mission Leader), PatriciaBrereton, James Brown (Bank), Andrew McHillan (FAO/CP), and Edmundo Isidro,John Kitson and Ian Mathews (Consultants).
|hisdocument has a restricted distribution and may be used by recipients only in the performnce of ir official duties. Its contents may not otherwise be disclosed without World Bank authoization.
- ii -
Page No.
IV. EXPORT SUPPLY AND DEMAND . ......... .. . 23
A. Fruits and Vegetables ..................................... ,231. Exports and Export Marketing . . 232. Assessment of Export Market Demand ......... .......... 263. Export Development ... ................................. 28
B. Marine Products..*............................a. 29
V. THE ROLE OF GOVERNMENT IN FOOD PROCESSING AND MARKETING ...... 29
A. Export Procedures ......................................... 30B. Food Terminal Inc. (FTI) ...... ........................... 31C. Support Functions of the Ministry of Trade and
Industry (MTI) ......... .................................. 32D. Government Intervention in the Livestock Sector ........... 33
VI. SUNMARY OF RECOMMENDATIONS ......................... ........ . 34
ANNEXES
1. Export Prospects for Tropical Fruit Productsin Selected Markets .. ........ 36
2. Export Markets for Tropical Fruit Juices: Market Access,Custom Duties, Food Laws and Regulations ................. 40
3. Annex ,Tables1. Gross Values Added in Food Processing 1970 to 1983.. 442. Philippne Exports of Food and Non-food Agricultural
Products 1970 to 1983 ............................. 453. Philippine Imports of Food and Non-food Agricultural
Products 1970 to 1983 ............................. 464. Summary Statistics for Food Processing Industries
1981 ... 475. Production of Selected Products 1971 to 1983 ........ 486. World Imports of Fruit Juices by Major Countries 1977
and 1981 ............. 497. Fresh and Processed Fruit Exports 1983-87 ........... 508. Exports and Fresh and Processed Food and Non-food
Agricultural Products . . 519. Imports of Selected Food and Non-food Agricultural
Products .......................................... 5310. Capacities of Food Terminal Inc. (FTI) .............. 5511. Population of Livestock and Poultry, 1950-83 ........ 5712. Meat Consumption - Total and Per Capita . . 5813. Estimated Rated Capacities of Integrated Poultry
Processors .. 5914. Estimated Processed Meat Volume 1983 ................ 60

- 1.1 -
15. Meat Consumption - Fresh Versus Processed ............ 6116. Milk Production and Collection, 1983 ................ 6217. Selected Commercial Dairy Herd Population,
June 1984......................................... 6318. Reconstituted Evaporated Milk - Comparative
Cost Xars...............................64x19. List of Fruit and Vegetable Processing Fir msms-**-*- 6520. List of Fish Processing Firms .. . . 6821. List of Meat Processing Firms ....................... 70

EXECUTIVE SUMMARY
Purpose of Survey
1. This survey reviews the prospects for expanding the output ofselected food processing industries in order to help the balance of paymentsthrough increased exports or reduced imports. The study concentrated onsecondary activities which produce food and beverage products other than rice,coconut or sugar products (the primary products) each of which is beingstudied independently in the context of the Bank-assisted AgriculturalSector/Inputs project. The report focuses principally on fruits and fruitjuices, vegetables, marine products, livestock products and, in the context offeedgrains for the livestock industry, also on yellow corn and soybeans;greatest attention is given to fruits and fruit juices, which appear to havethe best prospects.
2. It was originally expected that the review would identify bottle-necks to expanded production within the food processing industry on a muchbroader basis, reflecting capacity constraints that might be relieved by newinvestment. However, the review noted that the inadequacy and discontinuoussupply of raw materials (agricultural products) of an acceptable quality was acontinuing constraint with the result that some branches of food processinghave an unutilized capacity. If this pervasive problem can be overcome, therewould be a need for selective new investment in food processing in the nearfuture. In the longer run, opportunities for expanded domestic and overseassales Look good, and a more assured supply of raw materials could well justifyadditional investment. In the meantime, recent (April 1985) measures by theGovernment to remove or modify a number of bothersome regulations andprocedures has also improved the prospects for some expansion in theproduction and sale of high-quality products. Improvements in some of thegovernment services that could assist in raising product quality and provideinformation about foreign market opportunities would provide a furtherimpetus. A main contribution of the review is the identification of problemareas to which Government should give special attention.
Perspective on Food Processing Industries Covered
3. The food and beverage industries account for a large proportion oftotal industrial activity, about 40% of gross value added in manufacturing(1983). They also accounted for 28% of the country's total merchandiseexports (US$1.4 billion of a US$5.0 billion total). However, two-thirds offood and beverage exports consisted of coconut and sugar products which, asnoted, are excluded from this review. Total food and beverage exports(including sugar and coconuts) have recently been running about twice thevolume of food imports (about US$600 million in 1983, consisting of cereals ofUS$250 million, dairy products of US$130 million, and animal feedstuffs ofabout US$80 million). These figures provide some useful benchmarks. Forexample, with more than US$900 million in exports in 1983, sugar and coconutsprovide over three times the export contribution from fresh and processedfruits and about nine times that earned from marine products. It is the largerelative size of coconut, rice, and sugar that mark them as "primary" products
- ii -
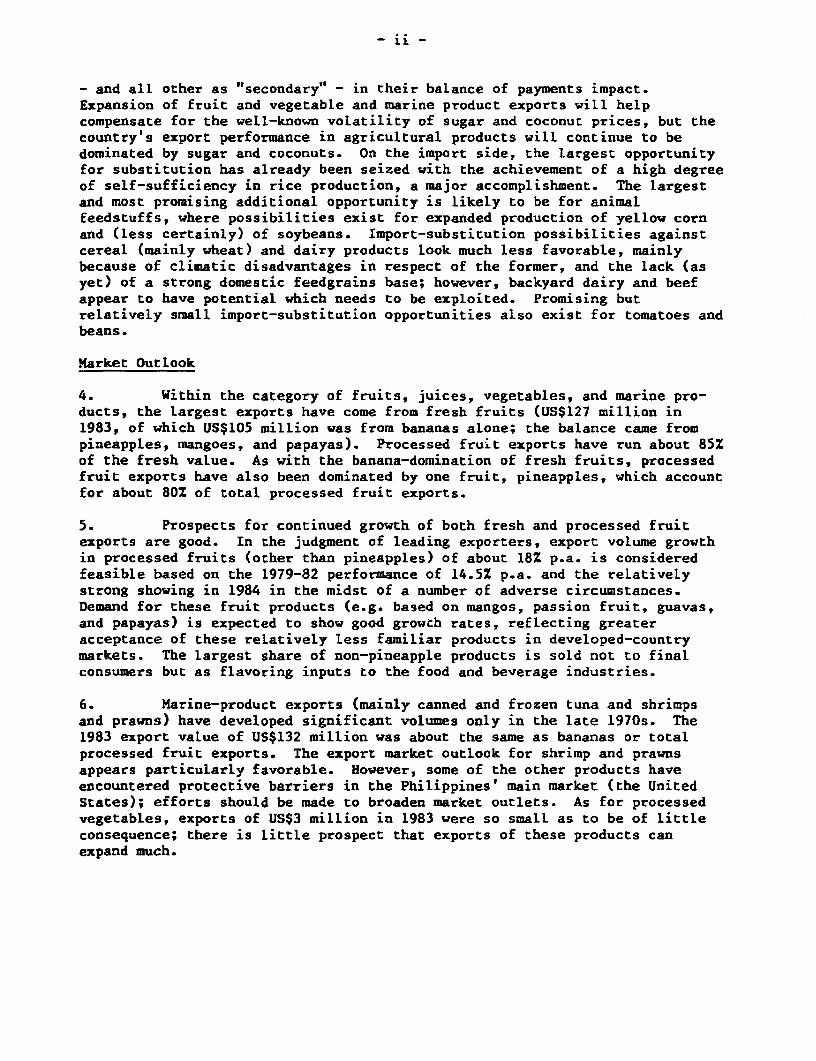
- and all other as "secondary" - in their baLance of payments impact.Expansion of fruit and vegetable and marine product exports wiLl helpcompensate for the well-known voLatility of sugar and coconut prices, but thecountry's export performance in agricultural products will continue to bedominated by sugar and coconuts. On the import side, the largest opportunityfor substitution has already been seized with the achievement of a high degreeof self-sufficiency in rice production, a major accomplishment. The largestand most promising additional opportunity is likely to be for animalfeedstuffs, where possibilities exist for expanded production of yellow cornand (less certainly) of soybeans. Import-substitution possibilities againstcereal (mainly wheat) and dairy products look much less favorable, mainlybecause of climatic disadvantages in respect of the former, and the lack (asyet) of a strong domestic feedgrains base; however, backyard dairy and beefappear to have potential which needs to be exploited. Promising butrelatively small import-substitution opportunities also exist for tomatoes andbeans.
Market Outlook
4. Within the category of fruits, juices, vegetables, and marine pro-ducts, the largest exports have come from fresh fruits (US$127 million in1983, of which US$105 million was from bananas alone; the balance came frompineapples, mangoes, and papayas). Processed fruit exports have run about 85Zof the fresh value. As with the banana-domination of fresh fruits, processedfruit exports have also been dominated by one fruit, pineapples, which accountfor about 80% of total processed fruit exports.
5. Prospects for continued growth of both fresh and processed fruitexports are good. In the judgment of leading exporters, export volume growthin processed fruits (other than pineapples) of about 18% p.a. is consideredfeasible based on the 1979-82 performance of 14.5% p.a. and the relativelystrong showing in 1984 in the midst of a number of adverse circumstances.Demand for these fruit products (e.g. based on mangos, passion fruit, guavas,and papayas) is expected to show good growth rates, reflecting greateracceptance of these relatively less familiar products in developed-countrymarkets. The largest share of non-pineapple products is sold not to finalconsumers but as flavoring inputs to the food and beverage industries.
6. Marine-product exports (mainly canned and frozen tuna and shrimpsand prawns) have developed significant volumes only in the late 1970s. The1983 export vaLue of US$132 million was about the same as bananas or totalprocessed fruit exports. The export market outlook for shrimp and prawnsappears particularly favorable. However, some of the other products haveencountered protective barriers in the Philippines' main market (the UnitedStates); efforts should be made to broaden market outlets. As for processedvegetables, exports of US$3 million in 1983 were so small as to be of littleconsequence; there is little prospect that exports of these products canexpand much.
- iii -
Problems Needing Special Attention
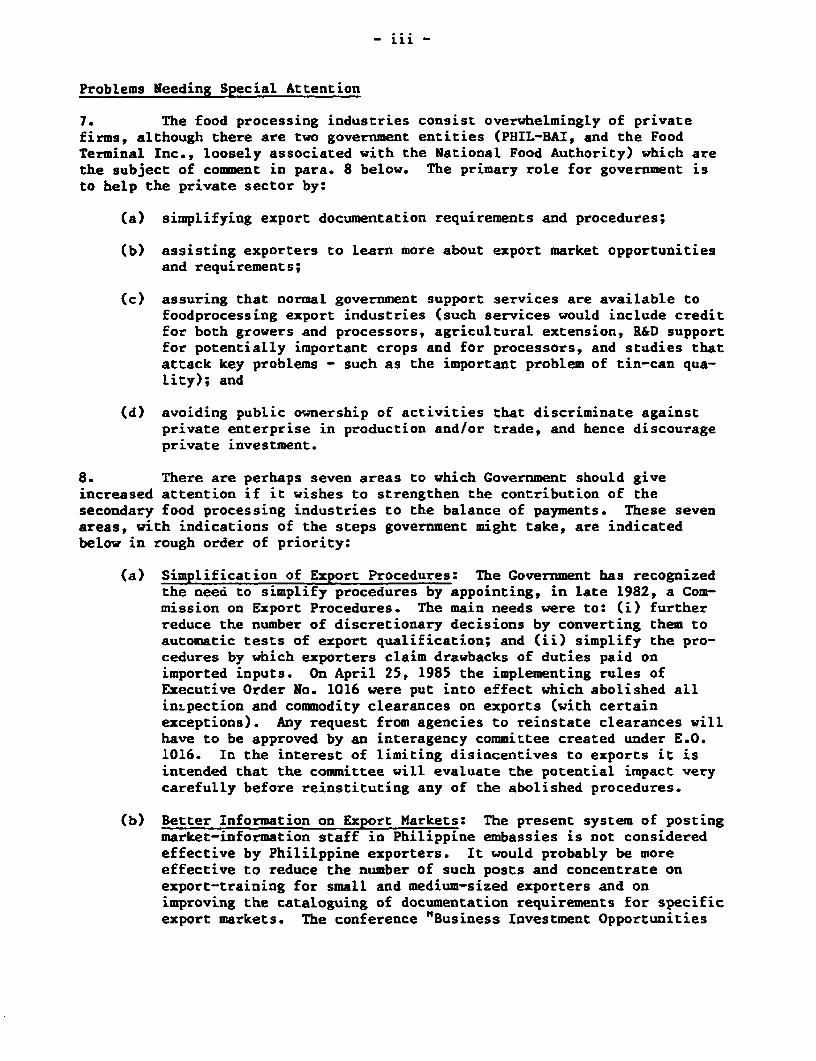
7. The food processing industries consist overwhelmingly of privatefirms, although there are two government entities (PHIL-BAI, and the FoodTerminal Inc., loosely associated with the National Food Authority) which arethe subject of comment in para. 8 below. The primary role for government isto help the private sector by:
(a) simplifying export documentation requirements and procedures;
(b) assisting exporters to learn more about export market opportunitiesand requirements;
(c) assuring that normal government support services are available tofoodprocessing export industries (such services would include creditfor both growers and processors, agricultural extension, R&D supportfor potentially important crops and for processors, and studies thatattack key problems - such as the important problem of tin-can qua-lity); and
(d) avoiding public ownership of activities that discriminate againstprivate enterprise in production and/or trade, and hence discourageprivate investment.
8. There are perhaps seven areas to which Government should giveincreased attention if it wishes to strengthen the contribution of thesecondary food processing industries to the balance of payments. These sevenareas, with indications of the steps government might take, are indicatedbelow in rough order of priority:
(a) Simplification of Export Procedures: The Government has recognizedthe need to simplify procedures by appointing, in late 1982, a Com-mission on Export Procedures. The main needs were to: (i) furtherreduce the number of discretionary decisions by converting them toautomatic tests of export qualification; and (ii) simplify the pro-cedures by which exporters claim drawbacks of duties paid onimported inputs. On April 25, 1985 the implementing rules ofExecutive Order No. 1016 were put into effect which abolished allinLpection and commodity clearances on exports (with certainexceptions). Any request from agencies to reinstate clearances willhave to be approved by an interagency committee created under E.O.1016. In the interest of limiting disincentives to exports it isintended that the committee will evaluate the potential impact verycarefully before reinstituting any of the abolished procedures.
(b) Better Information on Export Markets: The present system of postingmarket-information staff in Philippine embassies is not consideredeffective by Phililppine exporters. It would probably be moreeffective to reduce the number of such posts and concentrate onexport-training for small and medium-sized exporters and onimproving the cataloguing of documentation requirements for specificexport markets. The conference "Business Investment Opportunities

- iv -
with Emphasis on Exports" organized by MTIIBOI in June 1984 wasuseful; it would be valuable to bring the interested partiestogether on a more continuous basis. The regional Agribusiness Foraorganized under the World Bank's Agricultural Support ServicesProject may be one of the vehicles to encourage exchange of marketinformation between producers, processors and exporters. Anotherwould be the various industry associations.
(c) Packaging Study: A problem that affects all Philippine processorswho use tin cans is the low quality of domestic cans which is not ofsufficiently high quality for export purposes. The Government hasrecently obtained advice from an overseas consulting firm concerningpossible improvements of tin plate manufacturing under the NationalSteel Corporation. It should be reviewed along with other packagingoptions which would be particularly appropriate for Philippineexport products.
(d) Measures to Strengthen R&D: Few food processing firms have the fin-ancial or staff resources to do much R&D work. Government activitytherefore dominates this function. The chain of leadership, fund-ing, and coordination extends from the National Science and Techno-logy Authority (NSTA) through subsidiary organizations that reachdown to the working-level institutions in the universities, researchinstitutes, and extension-center laboratories. The working-levelunits appear reasonably well equipped; their main problem is a lackof operating funds to maintain their work-programs. Many facilitiestherefore experience long periods of idleness. A possibLe solutionwould be to encourage such facilities to seek out and accept tasksfrom private firms on a contract basis; alternatively, they mightsimply rent out their facilities to private firms if the latter pre-ferred to do work with their own staff. Achievement of higher uti-lization of existing R&D facilities, and avoidance of duplication,might be aided by appointment of a Coordinator for the food industrywithin the NSTA.
(e) Review Product Standards to Remove Bias Against Domestic Products:The Philippines has a Food and Drug Administration whose main mis-sion is consumer protection through setting product standards. Alarge proportion of these standards have simply been taken over fromthose used in other countries (notably the United States). Whilethis has been an efficient way of introducing standards, some stand-ards may be inappropriate for Philippine conditions. Some process-ors believe this to be true for some food products, resulting inexcessive reliance on imports and exclusion of domestic producersfrom the domestic market. A review of standards used for processedfoodstuffs might identify justified changes that would permit localproducers to compete with imports on more equal terms. Such areview has recently been initiated.
(f) Elimination of Public/Private Competition: Some private processorsview with concern the presence of a large government agency, FoodTerminal Inc. (FTI) in processing and marketing. It is not so much

FTI's presence that causes resentment as the fact that FTI operatesat a loss that is covered by its parent organization, the NationalFood Authority (UFA), which holds authority to license and toenforce regulations against certain segments of the food processingindustry. If they are to compete against a government firm, privatefirms feel that fair competition would require the government firmto stand on its own feet and to oe independent of government licens-ing and inspection authorities that could penalize private firmsthat competed too successfully against the government firm. APresidential Executive Order issued on May 31, 1985 provides thatFTI be separated from NFA and be restructured to allow jointownership with private enterprise, without prejudice to its possibletransfer wholly to the private sector.
(g) Policy Measures in the Livestock Sector: Three specific reforms aresuggested. To the extent that PHIL-RAI, a government corporation,continues to be involved in beef importations, private importersshould be allowed to compete with it on an equal basis. Vaccineimportation procedures can and should be simplified further and theban on inter-provincial trade of carabaos shouLd be lifted.
The above list focuses almost exclusively on steps the government might takeat the processing and exporting levels; it says very little about possiblegovernment measures to overcome what the food processing industry regards asits principal constraint, i.e., its chronic shortage of quality agriculturalinputs. It might be thought that government should try to take special stepsto strengthen the extension services in order to help growers achieve higherlevels of high-quality output. However, there are difficult across-the-boardproblems involved in improving the extension service, and it is not realisticto believe that improvement can be successfully focused on crops serving theexport-oriented food processing industries. The processors themselves arewell aware of the difficulties the government faces in addressing theseproblems, and many of them have developed contract growing arrangements withgrowers that include what amount to private technical assistance (principallyextension services) offered by the processors. This is a welcome development,one found in several other countries, and one that does not appear to need anyspecial support measures from Government. Similarly, the needs of bothgrowers and processors for additional working capital do not appear Lo requireany new measures beyond the expansion of agricultural credit which a new WorldBank credit loan will help make possible. The expanded credit funjds can bestbe distributed through the existing banking network.
9. Yellow Corn and Soybeans: These two crops are important for theanimal-feed industry. The country already grows five or six times as muchyellow corn as it imports, but 1983 imports of US$71 million were stilllarge. While the technology for expanded corn production (both thetraditional and hybrid varieties) already exists, this is not yet true forsoybeans, the market for which is 95% supplied by imports (US$61 million in1983). More credit for growers (such as under the expanded yellow cornprogram), and incentives for the construction of private dryers, shellers, andstorage capacity should be sufficient to achieve self-sufficiency in yellowcorn at reasonably competitive costs. (Whether additional tariff protection

- vi -
would be desirable until the country becomes a net exporter should beconsidered in the context of the SAL tariff reforms.) It is much moredoubtful that soybeans can be grown in the country at competitive prices.Research leadership is currently with two or three private firms whoseactivities need not be given infant-industry protection until it becomesclearer whether or not a promising infant industry, d%:serving of modestprotection, will emerge from the present R&D work.

I. INTRODUCTION
A. Background
1.01 The economic situation of the Philippines has deteriorated seriouslyin the last four years. The global recession, with low comodity prices, highinterest rates on external borrowing, and an unfavorable trading climate haschecked economic growth, slowed down export growth and depressed domesticdemand and private investment activity. Real CDP growth fell to 4X in 1981,32 in 1982 and 1% in 1983. For 1984 the decline in CDP was 6Z with seriousimplications for employment and income. Since 1981, the volume of merchandiseexports has been virtually stagnant, reflecting, in addition to the stagnationin the world's economy, a drought in the Philippines in 1983. The combinedimpact of the various factors has been a growing balance of payments deficitand an increasingly difficult debt service burden. The current accountdeficit rose to US$2.7 billion in 1983. In view of the current difficulties(some of which are transitory and external, some structural and internal), are-evaluation of the country's growth strategy was in order.
B. The Role of Food Processing in the Covernment's Crowth Strategy
1.02 The Government's revised Five-Year Plan for 1984-87 reflects a newemphasis on balanced growth of the agricultural and industrial sectors. TheGovernment's growth strategy in the 1970. and early 1980s relied heavily on anindustrialization policy based an import substitution that was developedbehind high and varied import tariffs. However, the efficiency of investmentwas generally low and failed to generate the expected growth impetus. As aresult of the current rethinking, the former emphasis on industrialization isbeing modified, and consequently both agriculture and foodprocessing are beingassigned a higher priority in overall economic development. The objective isto move toward a structure of agriculture and industry which utilizes moreeffectively the country's comparative advantage with respect to labor andnatural resource endowments. This new strategy has particular merit in thepresent economic circumstances of the Philippines. The foreign exchangecrisis and the devaluations of the peso have made foreign goods more costlyrelative to domestic resources. rherefore, production activities based onimported inputs have been adversely affected by reduced availabilities andhigher costs. On the other hand, agricultural production and foodprocessing,which use a high percentage of domestic resources, can benefit from and cancontribute significantly to growth of exports, or in some sectors, such ascorn production, to efficient substitution of imports.
C. Importance of Food Processing
1.03 Food processing includes all industries that use agriculturalproducts as their primary raw materials. The share of value added in food-processing as compared to total manufacturing is a sizeable 50 percent and hasremained roughly constant over time (Annex 3, Table 1). The most importantcomponent of foodprocessing are food processing industries. Their share intotal manufacturing was 30 percent in 1970, dropped to 26 percent in 1975 andjumped back to 35 percent in 1979. Since then the share rose slightly and
2
remained within the 36 to 37 percent range. The increased importance of foodprocessing implies that other foodprocessing subsectors have declined inrelative importance between 1970 and 1983. Among them are the beverage andtobacco industry am well as wood and paper manufacturing. The share of rubberand leather processing has roughly remained constant.
1.04 Food and non-food agricultural exports increased from US$726 millionin 1970 to US$2,227 million in 1980 and then fell to US$1641 million in 1983(Annex 3, Table 2). Their relative importance in terms of total merchandiseexports during this time period fell from 64 percent in 1970 to 33 percent in1983. The three major export categories in 1983 (relative to total food andnon-food agricultural exports) still were, as since 1970, coconut products (36percent), sugar (20 percent), wood products (14 percent), foLlowed by marineproducts (8 percent), fresh fruits (8 percent), processed fruit (7 percent),and coffee and cocoa (5 percent). Exports of marine products, fresh fruits,and coffee and cocoa achiev:J very large growth rates throughout the 1970s,starting from a low base in 1970.
1.05 Imports of food and non-food agricultural commodities are sizable(Annex 3, Table 3). From US$179 million in 1970 they increased to US$914million in 1982 before dropping off to US$796 in 1983. In terms of relativeimportance, these imports amounted to 14 percent of total merchandise importsin 1970 and have since been on a slightly declining trend, falling to 10.5percent in 1983.
D. Structure of the Industry
1.06 Data on the structure of the food industry are not available on atime series basis; detailed surveys were only conducted in 1979, 1980 and1981. The results of the 1981 survey are shown in Annex 3, Table 4. Accor-ding to this, 250,000 people were employed in food processing activities in1981 which accounted for a value added amounting to P 7.7 billion. In termsof value added, the relative importance of the various indtustry groups was(ranked from most to least important): (a) manufacture of bakery products,cocoa, chocolate and sugar confectionary, desiccated coconut, coffee; (:)sugar milling and refining; (c) rice, corn and flour milling; (d) meat, frui-_,and fish processing; (e) coconut and other oil processing; (f) dairy productprocessing; and (g) animal feed preparation.
E. Objectives of Study
1.07 The prima-y objective of this study is to review developments withinthe food processing subsector during the past decade, and to identify policyand investment interventions which would improve the growth of the subsector.Within this broad objective, and in line with current priorities, the mainfocus is on export development and efficient import substitution. The keyquestion is what are the constraints to production, processing and marketingand how can these be overcome. Some of the recommendations are technical innature while others are more policy oriented. They could constitute a basisfor the policy dialogue with Government with the objective of making theeconomic environment more conducive to short- as well as long-term developmentin the agricultural and food processing sectors.
-3 -
F. Coverage of Study
1.08 The main focus of the study is on the processing of fruits, vegeta-bles, fish, livestock and dairy products. Chapter II deals with the pro-cessing industry's structure, conditions and needs. Production arrangementsincluding contract farming are reviewed in Chapter III, and Chapter IV coversexports and export marketing with an emphasis on fruits and vegetables.Chapter V assesses the role of Government in food processing and marketing.Two annexes provide more details on export markets.
1.09 Three major products have been excluded from this study largelybecause they have been or are currently being examined elsewhere. Rice pro-cessing is assessed in an appraisal report (No. PHI-AP-58, November 1982) of arice processing project financed by the Asian Development Bank, and relatedmarketing issues and, in particular, the role of NFA has been the subject of aseparate study. The two other main products, sugar and coconuts, have beenthe subject of recent studies by the Government's National Economic andDevelopment Authority under the Bank-financed Agricultural Inputs Project(Loan 2469-PH). Another sector with good opportunities, shrimp farming, hasnot been covered since a recent report by the International Finance Corpora-tion has assessed the opportunities and constraints in that sector (ThePhilippine Shrimp Farming Industry: Risks and Opportunites for PrivateInvestors, IFC, July 1984).
1.10 Pricing policies for inputs and outputs are important and in certainsectors insufficient price incentives have constrained production and devel gy-ment. Pricing policy questions have been analyzed in a recent Bank report,-and some pricing policy reforms have recently been impLemented by Government.Also, questions with regard to pricing of commodities appear to be less impor-tant in the subsectors covered in this report than in coconuts, sugar andrice. Therefore, they have not been dealt with extensively in this review.
6/ "Agriculture: Issues in Pricing Policy," Country Sector Report. No.4845-PH, July 10, 1984.

-4-
II. INDUSTRY STRUCTURE, CONDITIONS AND -iEEDS
A. Structure of the Industry
2.01 In the following sections more details about the industry structureare provided for the following industries: fruit and vegetable processipg;beef, pork and chicken processing; dairy product processing; and fishprocessing.
1. Fruit and Vegetable Processing
2.02 Forty-two firms own processing plants with facilities for thecanning, bottling, dehydration, freezing and pickling of fruits and vegetables(see Annex 3, Table 19). The Philippine Chamber of Food Industries estimatesthat 15% are large firms, i.e. with sales of P 100 million and more annuallyand accounting for 75% of domestic production and 80% of exports. Seventypercent are classified as medium scali, with sales of P 50-100 milLion perannum, and accounting for 20% of production and 20Z of exports. The remaining15X are small scale, with sales of P 1-50 million annually and accounting for5% of production but no exports.
2.03 With the exception of the pineapple processing industry, for whichsupplies of fruit are available throughout the year, most other processors aresubject to seasonal factors with regard to raw material supplies. Consequently,continuous plant and labor utilization throughout the year is rarely possible.Average capacity utilization for 1984 is estimated at between 25% and 50%.
2.04 The location of existing fruit and vegetable processors is a poten-tially serious constraint. Of the 42 firms, 35 are located in or around theMetro Manila area which is the largest domestic market and the main center ofinternational communication. But this results in high transportation costsand product deterioration when tropical fruit and other raw materials need tobe transported from other areas.
2. Beef, Pork and Chicken Processing
2.05 The Philippines has 19 major beef and pork processing facilitieswith a rated capacity of 59,400 m tons in 1983 (see Annex 3, Table 21). Aboutthree fourths of these are canning facilities operating on a relatively smallscale while the others operate their own abattoirs and engage in integratedoperations. Capacity utilization in the industry is low, reaching only 36% in1983.
2.06 Of the 19 firms, 17 are located within the greater Manila area.Therefore, in general, animals for slaughter need to be transported over longdistances. A large share of the finished products are shipped within theManila area, although some are transported to various regions. Spnce the timewhen most of the plants were built, relative prices have changed such thatplants built close to the centers of production now have a cost advantage ofup to 20Z compared to Manila-based operations. The cost advantages stem fromthree sources:
- 5-
(a) savings in freight costs;
(b) savings on wages which are lower in the provinces, in some cases byas much as 50% to 55Z; and
(c) savings on fuel costs since indigenous fuel such as ipil-ipil, fire-wood, rice hull, coconut shell and other substitutes for bunker orliquified gas fuel can be used.
2.07 Most commercial processing of chicken is done in Large dressingplants owned by 7 integrated firms (see Annex 3, Table 13 for their capaci-ties). All of these are located in the Greater Manila area. Capacity util-ization in 1983 was only 36Z. In contrast to the meat processing operations,most of the chicken processing plants are rated higher in terms of criteriasuch as plant layout, plant equipment, quality control, sanitation standards,etc. Some of the reasons for this is that (a) these operations started morerecently, at the end of the 1960s or early 1970s; (b) most entrepreneurs hadsome experience in meat processing; and (c) foreign expertise was used in theplanning, construction and start-up of operations as well as in some training.
2.08 Average annual per capita meat consumption has increased from 11.4kg during 1974-76 to 14.4 kg during 1982-83. This is the combined result of astrongly increasing poultry consumption, and a moderate increase in pork con-sumption, and was accomplished despite a drop in beef consumption. Poultryconsumption is expected to continue to expand particularly because it is thecheapest meat product. Pork consumption is expected to be roughly stable on aper capita basis; additional growth could possibly come from an expansion inthe processed segment of the market. Beef, the highest priced product, willprobably continue to experience some declines. Most meat (81X) is sold fresh;only 19% is processed. Of the processed portion 60% is packed in polyethelenebags and 40% canned. Because of increasing relative container costs the shareof canned products is decreasing.
3. Dairy Product Processing
2.09 The Philippine dairy processing industry ranges from small liquidmilk processing plants and home-based enterprises to large, efficient andmodern recombining plants (for liquid and powdered milk and infant dietetics)run by large domestic or multinational organizations. There are nine majordairy processing facilities, producing various milk products largely based onimported dry milk. The Philippines was one of the first countries in which arecombining process was developed using imported skimmed milk powder andlocally produced vegetable oils such as coconut oil. This product was called"filled milk", both in the form of filled evaporated and filled condensedmilk. Currently three major processing firms are involved in this process gactivity.
2.10 Most of these facilities are in the Greater Manila Area. Thereasons for this are: proximity to the main center of consumption andproximity to the key port where 90% of the industry's raw materials areunloaded. Although the processing facilities are old, ranging from 5 to 25years, they are generally in good condition because of proper maintenance.
2.11 Prior to October 1983, all plants were operating at about 60Z to 70%of their rated capacities. In 1984, with the supply constraints and reduceddemand resulting from the economic crisis, the industry was operating at only30% to 40Z of the rated capacities.
4. Fish Processing
2.12 Forty-seven firms are involved in the processing of marine products,of which 11 process tuna, 16 process sardines, and 20 specialize in frozenmarine products (see Annex 3, Table 20). Twenty-five firms are located inMetro Manila (Tagnig Region) and seven in Western Mindanao. Canned tunaaccounts for nearly 40% of all (fresh and processed) exports of the industry.
2.13 Fish canning facilities are underutilized particularly during theLow season of November to February. Various options exist by which capacityutilization could be increased. First, the tuna catch could be increased withrefrigerated deep water vessels. Second, fish could be stored in refrigeratedwarehouses and processed during the off-season. The third possibility wouldbe to produce canned fruits or fruit cocktails when fish supplies are low. Afourth option would be to permit Philippine vessels to fish outside territo-rial waters (such as in Micronesia) while not treating fish caught in thosewaters as "imported" (imports are prohibited). These options should bestudied further.
B. Technical Staff Capabilities
2.14 In the industries surveyed, most plants have well trained technicalstaff involved in engineering, plant design and equipment layout and modifica-tion, product and process development and quality assurance. Some haveuniversity degrees in food science, engineering, etc. from national or foreignuniversities. In general, the plant technologists have a good grasp of thetechnology of the processes with which they are involved. This is not to say,necessarily, that their plants are using the best available technology butthat in most cases the staff is at least aware of it.
2.15 Senior non-technical people such as retort operators and can-closingmachine mechanics are trained in a number of ways which are apparently quiteadequate from a technical standpoint. Some retort operators are given shortcourses in Taiwan while others seem to have been trained locally. Most train-ing appears to have been based on the course "Canned Foods, Principles ofThermal Process Control, Acidification and Container Closure Evaluation"developed by the Food Processors Institute in the United States.- Thismaterial is generally being adapted worldwide as a standard for safe processcontrol in canning of low acid foods such as vegetables, meat products andfish. Adoption of a single standard method of training and certification ofoperators could probably best be done through the Philippine Chamber of FoodManufacturers or through one or more universities with adequate pilot food
7/ The Food Processors' Institute, 1133 Twentieth Street, Washington, D.C.20036.

processing faciLities. These might include the University of the Philippinesat Central Luzon, the Food Terminal, Inc. pilot plant in Metro Manila andpossibly some processing plant or university in Cebu or Davao. A singlestandard method would help to make exports more easily acceptable.
C. Standards of Sanitation and Quality Control
2.16 Standards of sanitation and quality control are somewhat varieddepending on the type of building and equipment used and whether the productis :ntended for the domestic or the export market. Some plants, particularly-tLose in poor financial condition and/or those manufacturing solely for thedomestic market, have cracked and chipped concrete floors, rusted metal sheet-ing on cool-room doors and shelves and generally outdated equipment, all ofvnici1 are difficult to sanitize properly.
2.17 On the other hand, a number of plants have very high standards ofsanitation with excellent buildings and equipment and well organized sanita-tion and maintenance programs. It is apparent that the knowledge and abilityto run good sanitation programs do exist at all levels in the food processingindustry. It is probable that, in some cases at least, a lack of funds forneeded building maintenance and new equipment (resulting, in turn, from asmall turn-over and a limited margin), purchase have made it difficult for theoperating personnel to keep up adequate sanitation standards.
2.18 The most apparent quality problems relate to control and recordingof thermal processes for low acid foods such as canned fish and canned meats.These problems were noted in plants processing for the domestic market andinvolved a lack of process control recorders. In these plants the retortprocesses are controlled manually by the operators. Although there may be noproblems with all manual control, the safety of the process relies entirelyupon the care of the operator. There is no way of knowing for certain thatthe required process has been followed. Installation of properly calibratedprocess recorders with suitable charts would allow both plant managers andgovernment inspectors to check processing conditions on all products passingthrough the system. At present some degree of safety in canned low acidproducts is provided by incubation of all canned products before shipment tomarket. Normally this would show up any insufficient processing, but thesystem is not 100Z fail-safe. This small risk, in case some food poisoningwould happen, could lead to a loss of export markets. Improvements in qualitycontrol are, therefore, important.
2.19 Measurement of heat distribution in retorts, and determination ofadequate venting should be done at the time of installation and at any timewhen there is a change in piping. Thus, there is an apparent need for a con-siderable amount of retort process evaluation work in the Philippines. It issuggested that either a private consulting company or a university or tech-nology institute be encouraged to provide such a service for a fee.
2.20 Other major canning problems involve the quality of cans made fromdomestically produced tinplate and/or manufactured domestically on semi-automatic can lines. These problems include: temper of the steelplate,quality of tin coating, lacquers, can body forming, and end-seam gasket
- 8 -
compounds. These points are discussed in more detail in the section onpackaging issues (paras. 2.30-2.34).
2.21 The Food and Drug Administration (FDA) is the main government agencyresponsible for licensing and inspection of approximately 12,000 food plantsthroughout seven districts in Greater Manila and twelve other regions of thecountry. Each district has a Food and Drug inspection supervisor and a groupof inspectors. Inspectors are appointed from applicants with degrees in foodscience and technology, nutrition and pharmacy. Basic pay is low, and theefficiency of the service is hampered by a lack of operating funds. As ofJune 1984, inspectors in Manila were only able to work in the field three daysout of five because they did not have sufficient funds to travel more often.By careful planning, an inspector would be able to visit 400 plants in a yearand with available staff this would mean that each plant would be visited onaverage once a year. This would normally be considered an inadequate level ofinspection. It means that firms involved in exporting which try to maintain ahigh standard of quality must rely largely on their own quality controlsystems.
2.22 The FDA currently attempts to provide both technical assistance andregulatory control. In order to avoid any conflicts of interest which mightoccur under the present arrangement, it is recommended that inspection andenforcement of regulatory standards be kept separate from technical assistancein development of new processes, process improvements, new products, andproduct formulation. Technical assistance is more important than inspections.Also, stiff legislation and penalties for negligence which causes harm areconsidered a better alternative than increased inspections.
D. Research and Development
2.23 The institutional arrangements for food processing research anddevelopment arc very complex and it is not easily apparent who is responsiblefor what. There is a lack of coordination among various entities and this,among other factors, has led to inefficiencies in the use of the limitedresources.
2.24 The National Science and Technology Authority (NSTA) is the overallplanning body for a wide range of activities in science and technology. It isalso responsible for food processing research. Coordination of this researchhas been lacking and duplications and inefficiencies have resulted. Thecoordination of Government-funded food processing research and development isso important that this function might be considerably strengthened by theappointment of a food research and development coordinator. He would beresponsible for the allocation of funds in accordance with national prioritiesand for ensuring that duplication and other inefficiencies are avoided.
2.25 Under NSTA is a group of 10 agencies one of which is the PhilippineCouncil for Agriculture and Resources Research and Development (PCARRD).PCARRD is responsible for funding and overseeing research being undertaken bya hundred or more organizations located in different parts of the country.These organizations include universities and colleges and government andquasi-government research groups. Their research involves agricultural
-9 -
production, harvesting, storage and processing. PCARRD has provided approxi-mately US$3.6 million to nine research centers since 1980. Of this amount,US$2.3 million have come from USAID. Other funds have been received from theAustralian Center for International Agriculture Research (ACIAR), theInternational Development Research Center of Canada (IDRC), the JapanInternational Cooperation Agency (JICA), and the World Bank.
2.26 PCARRD is responsible for presenting state-of-the-art summaries ofcurrent knowledge on the production and utilization of natural resources. Itis also responsible for the preparation of economic analyses for policymakers. PCARRD is noted for its series of extension publications, "ThePhilippines Recommends." These cover the propagation, planting, growing,harvesting and storage of many crops, including mango, papaya, coconut,passion fruit, grapes, coffee, citrus, fish and shellfish in ponds, forestproducts, and rubber.
2.27 At the base of the research and development organizations' pyramidare the working level research centers in government-financed universities,research stations, extension centers, etc., throughout the country. The labo-ratories and pilot plants of these centers appear to be adequately equippedfor the research and development needs of the foodprocessing industry. How-ever, operating funds and to a lesser extent staff are inadequate. Forexample, during the mission's visit, the central Luzon pilot plant could notafford fuel for the oil-fired boilers, and cold rooms at the University of thePhilippines at Los Banos were shut down to conserve electricity. The lack ofoperating funds is one reason for the low capacity utilization of most exist-ing food research facilities. However, these research facilities are tooexpensive to be duplicated under private auspices, and it is therefore recom-mended that the underutilized facilities be made available to private industryfor a fee. Thereby more funds could be obtained to cover operating expendi-tures, and private firms, particularly smaller ones, could undertake researchand testing without having to make significant investments in capitalequipment.
2.28 Almost without exception the processing plants visited were aware ofthe continuing need for increasing profitability through process modificationsdesigned to increase efficiency and/or improve quality. Many also had a keeninterest in developing new products for export or domestic markets. Informa-tion on how to achieve these development objectives is often difficult toobtain. Most companies are trying to develop new or improved products byusing their existing production line equipment. This tends to limit theirdevelopment to products that can be made using available equipment. The needfor a mechanism whereby industry can have access to government run food pro-cessing pilot plants with a wide range of specialized equipment is apparent.By being able to use such pilot plants on a confidential basis, industry wouldbe able to test a much wider range of new product and process ideas withoutthemselves investing in the necessary equipment or facilities.
2.29 Many new product and process ideas were discussed with processors.These included canned tropical fruit salad, various types of tropical fruitjuices and concentrates, dried powdered or flaked tropical fruit purees,n.iural colorings and flavorings derived from tropical fruits and vegetables,

- 10 -
use of vegetable proteins in formulated meat products, use of cold and frozenstorage to extend the processing period for seasonal crops, and the use ofvarious leveLs of storage technology to reduce waste of fresh market produce.
E. Packaging
2.30 Packaging questiuons are important for almost all products in thefoodprocessing sector. By far the most commonly used containers for domesticand export marketing are tin cans which are discussed below.
2.31 The Philippines obtains tin cans from three major sources:
(a) imported cans, usually from the United States, Japan or Taiwan, areused for export products such as tuna or canned pineapple;
(b) domestically assembled cans made from imported tinplate are mainlyused for export products. As in (a), a wide range of tempers(hardness of steel), differential tinplate coatings, and lacquers(coatings) are available for any application; and
(c) domestically produced cans made from domestically produced tinplateand lacquered with domestically produced lacquers are fordomestically consumed products only.
Domestic production of tin plate in 1983 amounted to 96,000 mt whereasimported tin plate (including cans translated into tinplate tonnage) amountedto 59,500 mt.
2.32 For export purposes processing firms need, for quality reasons,either imported tin cans or domestically manufactured cans based on importedtinplate. The quality of domestically produced tin cans has been improvingbut there are a number of unresolved technical problems in steel plate making,tinning and lacquering that still limit the range and quality of products thatcan be produced. The most important limitation is that domestically producedcans do not have the quality and consistency necessary for the export market.The source of the problems are several. First, tin mill blackplate cannotcurrently be made sufficiently flat or of sufficiently uniform hardness forgood tinning or for certain special applications yequiring high-hardnesssteel. Second, with the existing tinning lines,8 it is only possibLe toproduce tinplate with certain levels of thickness whereas other leveLs cannotbe produced economically. Third, because of the lack of flatness in thetinplate and the type of tinning lines, it has been difficult to produce ahighly uniform tin coating.
2.33 Another problem is the lacquering of cans. Lacquer manufacturers inthe Philippines lack the technical know-how to produce some types ofspecialized cai coatings. This is because most coatings have been developed
8 The Ferrostan line is about 15 years old with vertical tinning tanks andthe Halogen line is over 20 years old and has horizontal tinning tanks.
- ii -
by major United States or European can manufacturers and are trade secrets.Lacquer applicators or lithographers (printers which print or decorate cans)also have problems in that they are not set up to print universal productcodes (UPCs) on lithographed cans. Finally, many of the production linesstill use solder to seal cans. Since it is associated wich a high leadcontent in cann7d foods, this technique is less and less acceptable in theexport market.-
2.34 The problems mentioned above are all technological in nature andcould be corrected Largely by additional investments. Whether the benefits ofthese investments outweigh the costs would, of course, have to be analyzedcarefully. The investments required would be:
(a) a further upgrading of the steel plants owned by the National SteelCorporation. Plans are now proceeding to establish a five-standBlaw Knox cold mill capable of producing high quality tin mill bLackplate. Apparently, the financing of US$105 million has already beensecured for this plant. The capacity would be 300,000 tons per yearand it is expected to be on stream in September 1986. In additionto the ongoing upgrading, further investments would be needed forthe production of high q.1ality tin plate. This would require atemper mill, a continuous annealing line and a new pickling line.The additional funds required would be in the range of US$125-150million. (When completed, the plants could produce 300,000 tons oftin plate annually. Using the 1983 level of imports, this wouldreplace US$44.6 million of imports annually; about 145,000 tonswould be available for exports. Whether production would becompetitive in export markets would need to be determined);
(b) an improved tinning line for the production of a specific thickness(1.0-0.25 lb) differential tin plate (required for the exportationof canned pineapple) would cost US$21 million;
(c) since it would be impractical to repeat the research that resultedin the existing lacquer products, a technology purchase agreementshould be made with a can company or lacquer manufacturer in anindustrialized country; and
(d) the transformation of soldering to side-seam welding lines isessential to meet export market requirements. Eleven side-seamwelding lines are already in operation in the country but anadditional 10-15 further conversions (each costing about US$0.4million) are required.
2.35 The above are only rough and preliminary estimates of investmentrequirements if it were decided that top quality tin cans acceptable in theexport markets were to be produced domestically. Whether domestic production
9/ For example, legislation in the United States, to become effective in1985, will prohibit importation of soldered cans.
- 12 -
would be indeed more beneficial to the country than continued importationwould have to be carefully analyzed. Also, the technology and the marketpreferences in packaging are subject to change. Packaging options include,for example, tin-free steel cans, nickle cans, aseptic packaging, foil and theretorte pouch. Any assessment of an investment in improved tin plate produc-tion must therefore consider the alternative options. The Bank's Regional IDFDivision is planning to expLore with Government how further investigations ofpackaging issues can best be carried out.
F. Investment Needs
2.36 A variety of factors have resulted in reduced investment in foodprocessing activities. Limited raw material availability (which is thebiggest constraint), shortages of working capital, and problems with theimportation of tin plate, tin cans or spare parts have led to considerabLecapacity underutilization which, for the time being, obviates the need for newinvestments. Further, tight credit and uncertainties in the economic outlookare reducing the incentives for potential investors. Significant new invest-ment needs in food processing would only arise if the specific constraintsnoted above can be successfully overcome and if the economy as a whole is backon a reasonable growth path.
2.37 Before the mission undertook the field visit it was believed that ashortage of food processing facilities and equipment presented a constraint todevelopment, and that the Bank could relieve this constraint possibly byfinancing a project in this subsector. The findings of the mission in thisregard are that investments in the subsector are currently not a majorconstraint; while there are some needs for finance, they do not appear to belarge enough to justify a separate Bank project. The working capital needs ofprocessing enterprises, particularly for financing contract farming opera-tions, as well as any new modest investment needs, can be met by the Agricul-turai Credit Project.
III. AGRICULTURAL PRODUCTION FOR PROCESSING
A. Procurement of Raw Materials: General Aspects
3.01 The most serious constraint to expanding food processing in thePhilippines is neither access to export markets nor availability of processingequipment or know-how but production of raw materials. One of the mostfrequent complaints of processors and fresh produce exporters is that they areunable to secure raw material supplies in the quantities and of the qualitywhich they wish to purchase. Seasonality of production is also a problem incertain crops. As a result of constraints in supplies, a significant numberof food processing factories are operating below full capacity, and potentiaLoverseas demand, especially for fresh and processed fruits, remains unful-filled. The purpose of this chapter is first to review the various measureswhich have been taken by processors and exporters to improve their access toraw materials supplies, and secondly to examine one highly promising optionfor expanding raw material production.

- 13 -
1. Sources of Raw Material Supplies
3.02 Four principal means of securing raw materials supplies are current-ly used by processors in the Philippines (listed from worst to best supply-security provided):
(a) Open-market purchasing;
(b) Collection at farm gate (with or without advance payment);
(c) Contract farming; and
(d) Own-account farming.
3.03 Open-Market Purchasing. Most agricultural products used for pro-cessing are bought on the open market, without any formal or direct linkbetween processor and producer. Although there are some exceptions, crops aregenerally sold by farmers to local (barrio) buyers who, in turn, may sell tohigher level buyers who bulk up supplies for delivery to the factories. Forfruits and vegetables the open market is still a significant source ofsupplies for small to medium scale processors. However, reliance on the openmarket is decreasing as other forms of procuring input supplies such ascontract farming are gaining in importance.
3.04 There are two reasons why some small and medium scale processors canstill rely on open-market purchases. First, their raw material requirementsare small in relation to the total marketed quantities of a given type ofproduce during its peak production season. Second, they are sufficientlyversatile in their equipment and facilities to be able to process a wide rangeof raw materials, changing production according to the availability and priceof inputs and correspondingly adjusting the number of people employed. Inaddition, they often lack capital to invest in their own production equipment,to make the necessary credit advances for contract farming or to build uptheir own extension staff and acquire up-to-date know-how. Also, productsprocessed by small to medium firms are often destined for the local market,which is less discriminating about quality and regularity of supply thanpotential export markets.
3.05 The main problems associated with operating a processing firm exclu-sively on open-market purchasing of raw materials are the unpredictability ofsupplies, volumes and prices, and the difficulty of ensuring homogeneity ofquality. Therefore, the thrust of processors will have to be in the directionof strengthening their ties with producers. Increasing costs and specializa-tion of food processing equipment are additional factors why processors in thefuture will want to rely less on the open market and more on contractual orother more reliable supply arrangements.
3.06 On-Farm Collection. As a means of increasing security of supplies,processors have frequently been obliged to arrange for collection of producedirectly from farmers. In the case of perishable goods, such as fruits andvegetables or milk, farm-gate pick-up also provides a way of reducing both thetime and the frequency of handling between harvesting and processing, and

- 14 -
hence contributes to quality. Particularly in areas with an over-capacityprocessors may arrange for collection, which is usually associated with pre-payment for the crop several weeks before harvest, at a discounted price.Such prepayments are, however, generally made too Late in the crop cycle toinfluence the technology applied by the farmer and merely help him overcomepersonal liquidity problems.
3.07 Contract Farming. This is a production arrangement which is growingrapidly in the Philippines. It offers attractive elements to both agricul-tural producers and processors. Generally such contracts have been promotedby processing and marketing companies, interest dOin increasing the reliabil-ity and quality of their raw material supplies._ Normally the processingfirm provides extension services and the production inputs on credit to bededucted when the produce is sold. Close contact between extension staff andthe farmers is an important element in a successful operation. Prior toplanting a crop or starting a livestock cycle the processor makes a written(but not legally binding) commitment to the producer to purchase all or partof the output, either at a fixed price or at one related to the market orsupport price prevailing at harvest time.
3.08 Contract growing systems have been or are being adopted for the pro-duction of a wide range of commodities. In fruits and vegetables, processorsarrange for the supply of planting material, fertilizers and pesticides; pro-vide technical supervision throughout the crop season, and assume responsibi-lity for grading, processing, packaging, and marketing. The farmer suppliesland and labor. For long-term fruit crops, such as mangoes, contracts wouldcover one crop cycle during which the processor oversees the spraying program;however, there are thus far no examples of fruits peing planted under long-term contractual arrangements in the Philippines.1 / As in other countries,intensive poultry and pig production is sponsored by vertically integratedfirms which provide all inputs (e.g., day-old chicks, feed, drugs), technicaland veterinary advice, and a guaranteed market. Farmers provide buildings andlabor. For prawns, purchasers or processors provide technical advice on pondconstruction and management. The farmer's input consists of providing ponds,pumps and labor. Contract growing has recently been extended to cover yellowcorn, soybeans, navy beans and tomatoes, largely because restrictions onforeign exchange availability and ihe increased profitability of these cropsfollowing successive devaluations,-2/ have made it either essential or
10/ There are, however, also instances of input distributors entering intosimilar contracts (as under the RP-Japan fertilizer project and therecent Planter's Products corn program) as a means of increasing theirsales.
ll/ Some limited apple production on a contractual arrangement is beingstudied (Business Day, October 24, 1984).
12/ The increased profitability is being eroded by increasing productioncosts given the relatively stable exchange rate at present.

- 15 -
attractive for processors to look to the local market rather than imports asthe main sources of their raw materials.
3.09 A review of a number of contract farming operations now in progressin the Philippines led to the following conclusions. First, contract farminghas been successful in introducing superior technology to farmers and hence inraising yields, quality and regularity of production. Where contractors haveoperated in good faith, substantial benefits have been obtained by bothproducer and contractor. Second, since the majority of farmers invoLved incontract farming are smallholders (1-3 ha), the system has had a beneficialsocial impact. Third, processors are developing contract farming in favorablegrowing areas and, even though they largely work with small farmers, theycarefully select good and reliable ones, using information from banks, inputsuppliers, barangay captains, etc, and endeavor to build up a relationship ofmutual confidence and trust. Fourth, credit repayment rates are generallyclose to 100% of the amount due. Fifth, contractors have largely been unableto draw on the results of Government-sponsored agricultural research, ordepend on the national extension service for advising farmers. Thus, theyhave to invest heavily in acquiring and testing "know-how" and in providingfarmers with technical support services, paying staff substantially more thanprevailing public service salaries. And finally, the difficulty of raisingfinance to cover the costs of inputs advanced to farmers, restricts the scaleof several contract farming operations.
3.10 From the processor's point of view, one of the attractions ofcontract growing is that it enables raw material suppLies of the right qualityand amount to be obtained (within reasonable limits) without the commitment ofheavy investments in fixed capital and land, and without major increases inpermanent staff. Many processors are concerned that, if they were to acquireland for production, this could expose them to provisions under land reform.
3.11 Own-Account Farming. Full integration of production and processingwithin the same enterprise has characterized several agro-industries, notablythose based on pineapple, bananas, and, more recently, oil palm. Examplesalso exist of vertically integrated companies producing, processing and retailmarketing their own milk, beef, pork, chickens, fruits and vegetables. Thedevelopment of these enterprises has been possible because of the presentexemptions for corporate farming from agrarian reform. The advantages of suchfull integration are that it permits an even higher standard of management tobe attained than is usually possible with contracted smallholders, transactioncosts are cut and supplies can be forecast with considerable accuracy. Thesebenefits may be outweighed, however, by the problems of raising capital forlarge-scale land acquisition and development, by the difficulties of managinga large labor force and by the conspicuousness of large holdings in a countryin which periodic calls are bound to be made for further land reforms, and incertain areas by peace and order problems.
2. Options for Expanding Contract Farming
3.12 Contract farming systems offer the most promising means of expandingthroughput production since they have been generally successful and arepolitically acceptable. The question arises whether the scale of the opera-
- 16 -
tions and the range of products covered can be increased and what the respec-tive roles of the private sector and the Government should be. Except inisolated cases, private firms have entered into contract farming arrangementswithout any government support. Indeed, some contractors claim that theirsuccess is due to the lack of involvement by government institutions and that,if the public sector were to assume a promotional role, this could soon leadto the red tape and obstacles commonly associated with the management ofincentive-based schemes. While this may be true, the current programs appearto be operating under a number of constraints some of which could be partiallyor wholly removed by government action. Various options for Government'ssupport for a greater private sector role in increasing small farmerproduction are examined below.
3.13 Research and Development. Most contractors have had to investheavily in acquiring knowledge and experience by sending staff abroad toacquire technical skills and know-how, by bringing foreign experts to thePhilippines or by carrying out their own agronomic trials. The extent towhich companies have relied on local sources of technologies has beenlimited. Possible approaches to reducing the costs to firms of such R&D work,and hence of encouraging an expansion, include:
(a) redirecting the agricultural processing research of the PhilippineCouncil for Agriculture and Resources Research and Development(PCARRD) and the National Institute of Sciences and Technology(NIST) to address immediate problems identifiad by processors andexporters (possibly by including the Latter as members of therelevant commodity committees);
(b) providing Governmer. grants to finance approved R&D activitiesundertaken by the private sector; and
(c) consideration of tax deductions for approved R&D expenditures.
3.14 Technical Services to Farmers. If the extension services of theMinistry of Agriculture and Food (MAF) were adequately staffed and equipped toassist horticultural activities, there would be no need for processors tobuild up their own field staff, especially to provide technical supportservices to small farmers. Processors claim, however, that MAF extensionstaff are, in general, underpaid and ill-equipped and hence not sufficientlymotivated, and thus do not generally offer the kind of service they need. Yetthe direct recruitment of staff by firms may lead to duplication of services,with its attendant costs. One approach to reducing the cost to firms ofproviding technical services, which is being considered in tomato processingareas, would be for MAF to second selected extension staff to work with theprivate company for a predefined contract period - possibly either thecropping season for a 1-year assignment. MAF would continue to pay basesalaries, while the firm would supplement this with project and travelallowances, and provide special training, supervision and transport.
3.15 Financing Inputs. One of the constraints on the scale o- currentcontract farming programs appears to be the shortage of working capitalavailable for financing inputs. The proposed Agricultural Credit Project isexpected to help remove this constraint.

- 17 -
B. Specific Production Aspects
1. Selected Fruits and Vegetables
3.17 Tropical fruits are well suited for contract farming arrangements.Some of them are particularly attractive in the current economic environmentbecause of their short gestation period. But the production of others withlong gestation periods, most notably mangoes, should also be encouraged sincethey offer high returns and can contribute to economic growth in the longerrun.
3.18 Mangoes. Output of mangoes increased from 137,000 tons in 1971 to400,000 tons in 1983 (Annex 3, Table 5). While demand for increased volumesof exports for fresh and processed products exists (para. 4.18), increasedproduction is mainly constrained by a lack of capital for investment andoperations and maintenance during the i 7es' first five unproductive years.According to data published by PCARRD,_ the rate of return of a mangoorchard is high. PCARRD estimated that the 1976 costs of planting and main-taining a mango orchard with a tree density of 72 trees per ha were P 2,230 intotal up to the end of the fifth year including cash and labor costs. The netincome from year seven to fifteen was estimated at P 11,457 and from year 16to 30 at P 43,248, implying a high overall rate of return.
3.20 With mangoes as with many other tree crops, more intensive horticul-tural research should pay off in greatly increased yields. Also, the use ofplant hormones for obtaining earlier bearing or for changing the harvestingseason should be investigated. Use of more compact-form trees, or improvedsystems such as treewalls, planting of hybrids, etc., might have a majoreffect on yields and possibly on costs and ease of spraying, harvesting andother field operations. For the longer term, plant breeders should developnew varieties of mangoes as well as of other tropical fruits with a view toproducing high yielding, high quality fruits that are acceptable for the freshmarket as well as for processing. From both fresh and processing market view-points, it would also be desirable to select varieties that would extend theharvesting season with an ultimate objective of having a year-round supply.The harvest season for mangoes is February to June and an extension of theseason would be highly desirable. It should be recognized that trials ofpromising new varieties will have to be conducted in various locationsthroughout the Phiiippines since no one variety may be suited for all regions.
3.21 Papayas. Papayas are fast growing plants which bear fruit withinless than a year of planting. The na'Aoional average yield was 12.8 mt per hain 1982; in one area (Central Visayas) the average yield was a high 40 mt perha. Production expanded at a rate of 7 percent per year in the 1970s andreached 104,000 tons in 1981. Since then, however, it dropped back to 80,000tons in 1983. The reasons given are drought and typhoon damage. Productivity
13/ "The Philippines Recommends for Mangoes," PCARRD Technical BulletinSeries No. 38.
- 18 -
could be increased by better agricultural practices. Investment and laborcost for a 1 ha plantation of papayas for year I exceed income by P 6,090 at1981/82 price but net income in year two and three is P 16,800 and P 12,100,respectively.- Compared to mangoes the gestation period of papayas is veryshort, and they also provide attractive returns, but again capital is neededduring the time the cash flow is negative.
3.22 Since its production Life is effectively only four years, papaya maywell be fitted into a rotation involving annual crops. As in the case ofmango, papaya varieties that are most suited to different growing areas shouldbe selected. Also, dual purpose selection would allow fruits not suitable forthe fresh market to be converted into processed products. It is consideredimportant that evaluation of fresh market quality and processing quality ofall new fruit variety selections be carried out by a team comprising foodtechnologists, plant breeders and storage and marketing specialists. The teamapproach will help to prevent biases, so that varieties are selected whichmeet a variety of objectives.
3.23 Bananas. At approximately 3.67 milLion tons, bananas comprised 67%of the total Philippine fruit and nut crop in 1983. Most of the bananas forprocessing are used t;: produce banana chips. This involves a two-stage fryingprocess of bananas or plantain with a high starch content. A small quantityof the Cavendish banana is also processed into puree and packaged in anaseptic process. Since there is a large potential surplus of ripe Cavendishbananas for puree, the export market, and not the raw material supply, appearsto be the main constraint in this case. The peak harvest seasons for bananain the Philippines are January-February and June-July.
3.24 Pineapples. After bananas, pineapples, at slightly less than onemillion tons, were the second major fruit crop in 1983. A large percentage ofthis supply is grown by Dole, Inc. and Del Monte on their own plantations.Their mechanized cultural practices, mechanically assisted harvesting andintegrated fresh packing and processing operations appear to be highlyefficient. Agair it may be short-sighted to rely on only one main variety,the Cayenne. Australian and other dual-purpose varieties should be tested inPhilippine conditions. As with other fruit crops, the idea of dual-purposepineapples is important. Pineapples that are good only for canning may misssome of the highly profitable fresh fruit market. On the other hand a purelyfresh market variety of any fruit would end up - in normal conditions - with252 or more of the crop rejected for defects that would render it unacceptablefor the fresh market. Without a r *cessing possibility, this portion wouldhave to be dumped or sold as fooa_ uffs at a low price. Pineapples areharvested year-round with only small crop peaks in summer and winter and withonly minor seasonal variation in quality; therefore, seasonality problems inprocessing operations are minimal.
3.25 Tomatoes. Of the 1983 production of 103,000 tons the majority wasfor fresh market usage. Because of inadequate coloring, tomatoes for proces-
14/ Technology Resource Center Data.

- 19 -
sing have been imported in the past. But the technical information is nowavailable for efficient domestic production of a variety that meets processingrequirements. Average yields are only about 8 tons per ha, but with the useof improved varieties and the right cultural practices 20 to 25 tons per hacould be achieved. Production lends itself well to contract growing, and thepotential exists for the efficient substitution of US$6 million of imports.
3.26 Beans. Up to very recently, most of the 4,500 tons of canned porkand beans consumed domestically have been produced with imported beans. Forthe last two years a multinational firm has been selecting suitable varietiesfor domestic production. Trials have been successful, and production costs ofP 0.425/kg based on a 1.5 tons/ha yield compare favorably to the import priceof P 0.90/kg (1984 data). The 1984/85 crop season will involve 150 ha ofplantings, and prospects for a further expansion to supply part or all of theUS$6-8 million of bean imports appear promising. An important aspect of beansis that, as canning uses the dried product, it is a good off-season item in amulti-product line using fresh produce.
3.27 Other Vegetables. Onions are already produced in large quantitiesin the Philippines (42,000 tons in 1983). With appropriate research andextension, dehydrated onion flakes produced from locally grown onions shouldbe able to replace imports. Research is also needed for potato, asparagus andgarlic growing for processing. Asparagus production involves a long gestationperiod (six years until full production), but it is labor-intensive and possi-bilities in the export market exist, particularly as production in Taiwan maydecline.
2. Beef, Pork, and Poultry (Including Feedgrain Inputs)
3.28 Meat production in the Philippines is currently inadequate fordomestic consumption and must be supplemented by imports. While meat exportshave been in the order of US$1-3 million in recent years, prospects for afurther expansion are limited. Imports, however, amounted to US$10 million in1982 and US$13 milLion in 1983. In order to save valuable foreign exchange,domestic production should be increased by relieving constaints that now limitthe sector.
3.29 Since 1976, the carabao population has growp from 2.7 million headto 2.9 million head in 1983 (see Annex 3, Table 11).1_/ The number of cattleand hogs is also on a slightly increasing trend, while the number of chickenshas expanded more rapidly, particularly since 1979.
3.30 Inputs for Production. Corn and soybean meal are the major commer-cial inputs for livestock production, and if domestic meat production is to beincreased, then feedgrains production should 'lso grow. But at present, cornproduction is not yet large enough to meet domestic demand and only a small
15/ While the trend of data before 1973 may be correct the level does notseem consistent with later data. There appears to have been a change inthe statistical series.
- 20 -
part of soybeans are produced locally. Corn imports have increased from about1,000 tons in 1970 to 250,000 tons in 1980 and doubled to 528,000 cons in 1983(from US$35 million in 1980 to US$71 million in 1983). During these yearsproduction has remained roughly stable at 3 million tons. Soybean mealimports also increased from a low level in 1970 to 403,000 tons in 1982, thendropping off to 274,000 tons in 1983 (value in 1983: US$60 million). Domes-tic production of soybeans has been small, reaching only about 8,000 tons in1983.
3.31 The Government has had a program in effect for corn (Maisagana)which earlier had some success in increasing production but has stagnatedsince 1979. Several problems have hindered progress: technical advice andinput availability for farmers have been lacking; the availability of creditfor farmers under the program has been reduced, particularly in the last twoyears; post-harvest losses have been high, in some areas reaching an estimated30% and the lack of infrastructure has constrained deliveries from some areaswhich are well-suited to yellow corn production. Most wastage occurs for lackOr shellers, dryers, storage facilities and infrastructure (roads to producingareas). Because imports have become sizeable and because the potential forefficient domestic production exists, every effort should be made to removethe constraints to production and marketing of both corn and soybeans.
3.32 Much of the soybean research and development has been undertakenmainly in Mindanao by two to three private companies. So far it has not beenas successful in terrs of yields as research in hybrid corn but a potentialfor expanded production does exist. Yet even if private firms were willing toshare their know-how, it would still be necessary to devise a means by whichinformation could be disseminated through government entities such as theBureau of Plant Industry, the Extension Service, Agricultural ResearchStations, PCARRD or others. At the same time research is needed on substituteprotein sources such as sugarcane tops, ipil-ipil, copra milling by-products,etc.
3.33 Increased livestock development would also require increasedavailability of animal vaccines. The Bureau of Animal Industry controlsvaccine importation, but according to livestock producers bureaucratic delaysat times delay the timely availability of required medication. Simplificationof vaccine importation procedures should therefore be explored by Government.
3.34 Poultry Operations. Broilers are being produced by integratedoperators, by independent producers and under a variety of contractualarrangements. Integrated growers breed, hatch and grow their own chickens,mix their feed, and process and market their own products. Integratedproducers have been expanding production by 10 to 15% annually, and haveincreased their share in total production from 14% in 1976 to 35% in 1983.This increase is expected to continue. In one type of contractual arrangementprocessors provide growers with day old chicks and feed. The growers in turnprovide production facilities and their labor for some 45 to 50 days under thesupervision of the processor's field technicians. The growers are granted a 4Zallowance for transit mortality. They are paid a fixed fee for every broilerraised and an additional amount for broilers above 1.2 kg. For broilers below1.2 kg a certain amount is deducted. In another arrangement integrators sell

- 21 -
the growers broiler type chicks (usually a minimum of 5,000) and the necessaryfeeds at an agreed price. Later, at maturity, the growers sell the broilersback to the integrators also at an agreed price. The contractual operationsin poultry production are successful; therefore no specific actions arerecommended.
3. Dairy Products
3.35 The dairy subsector in the Philippines provides only a smallcontribution to total agricultural output, and domestic production as apercentage of final consumption is very small (2.5% in 1983). The bulk ofdairy products are imported. According to the National Dairy Development Planof 1979 the objective was to achieve 20% self-sufficiency within a 10 yearperiod. This target was much too optimistic. In the mission's assessment ofpossibilities of expanding dairying, the Philippines can realistically expectto achieve only 10 to 15Z self-sufficiency within a 20-year period, princi-pally because of a shortage of foodgrains as well as the low milking potentialof local cattle. However, backyard dairy cattle raising, whose economic via-bility has been demonstrated in other countries despite low yields, has shownsome promise in the Philippines and should be encouraged.
3.36 Milk Production. Milk production in 1983 is estimated at 28 millionliters (see Annex 3, Table ll) while total milk consumption amounted to about1.1 billion kg. Imports of milk and milk products increased from US$32 mil-lion to a peak of US$166 million in 1982 and then dropped to US$128 million in1983.
3.37 Most livestock production takes place as a small-scale backyardactivity. In general, cattle and carabao backyard enterprises are intended toprovide work animals and some meat for home consumption. With the currentbreed of animals, the milk production potential is low. The backyard carabaoand cattle population has roughly remained constant over the Last 10 years.The number of actual dairy cows, most of which have been imported is now at anestimated 3,500 head. Accelerated upgrading of the current local stock ofanimals can be achieved through greater use of artificial insemination.Extension services need to be further strengthened for that purpose.
3.38 The price of imported dairy products have been relatively cheap fortwo reasons: (a) the surplus of milk and milk products in the EuropeanEconomic Community and other countries depressed world market prices, and (b)the cost of foreign currency was undervalued in the past. Price incentivesfor domestic production were therefore low. With the changing economicenvironment, a better incentive structure is expected to prevail in thefuture, leading to expected higher production, but with a significant time laginvolved.
4. Marine Products
3.39 The important processing species of fish in the Philippines are sar-dines and mackerel for the domestic market and tuna for the export market.Sardines and mackerel are canned aLmost exclusively in tomato sauce, much ofwhich has been imported in the past. Top grade tuna is sold for sashimi at a
- 22 -
premium price but because of the current catching and handling system, mosttuna being landed is of canning grade. Fish are caught with locally basedseiners using the Payao system. Payaos consist of 2.5-3 cm diameter nylonline up to 2 km long anchored to the sea bed and supported with floats on thesurface. The line may be branched in the upper portion to increase the areacovered. Palm leaves and other vegetation tied into the upper portions.of aPayao support marine growth that attracts the smaller fish, etc. that in turnattract feeding tuna. Payaos are costly ($3,000/km) and subject to Loss bystorms or by theft. Fish caught by local seiners using Payaos are gutted andmay be held on board with ice for up to 2 days before delivery for process-ing. Capacity utilization in Philippine tuna canneries is low, particularLyduring the off season (November-February). During that time processors arepermitted to buy frozen tuna from ocean-going fishing vessels with on-boardfreezers. Some of the Japanese vessels bringing frozen tuna have capacitiesof up to 300 tons. There are currently no vessels of Philippine registry withthis kind of on-board freezing capacity to take part in mid-ocean fishery.Costs for large ocean-going fishing vessels vary greatly with capacity and theage of the unit. A new vessel of about 46 meters in length with on-boardfreezing and storage capacity of 360-450 tons is estimated to cost about US$14million. There is an apparent need for the Philippines to acquire one or moreof these vessels. Used ships would be proportionally less expensive dependingon age and physical condition.
3.40 Prices in June 1984 for 7-8 kg tuna of suitable quality for canningwere US$0.35-$0.40 per kilogram. Fresh tuna of the highest quality (rated assashimi grade) sold for up to US$2.00/kg. Currently used longline boats arenot capable of producing high grade tuna and a potential 5,000 tons/yearmarket for this premium product is therefore largely untapped by thePhilippines. Required are boats with ability to: (a) catch and land fishquickly, (b) chill fish immediately in cold brine, and (c) pack chilled fishin ice. One such option would be a small single man 9-meter troller withtwelve power-gurdies (reels) which would also be suitable for going furtheroffshore than the 30 km range that is currently being overfished. Such boatsfor example of the "Oregon Dory" type developed by Oregon State Universitycould be built inexpensively with locally made marine plywood.
3.41 Recently, import restrictions for canned sardines and mackerel havebeen imposed. Therefore, relative prices of (both fresh and canned) sardinesand mackerel have risen and production is expected to expand. It remains tobe seen to what extent this is possible within existing fishing grounds.There may be unexploited fishing grounds but there seems to be no clear ideaof the size of various stocks in Philippine territorial waters. A fishingresource assessment should therefore be undertaken (and, if necessary, aconservation program be instituted). If a resource inventory indicated theexistence of unexploited areas, upgrading the fishing fleet would be apriority in fishing resource development.
3.42 There are other marine product resources in the Philippines, some ofwhich, like milkfish or bangus, are well established as a fish farming busi-ness. The potential exists for development of other resources, such as squid,for drying or freezing and krill or euphasids for "shrimp" paste or aquariumfish food. Another industry with a good potential is shrimp farming. The
- 23 -
risks and opportunities in the Philippine shrimp farT7g industry haverecently been assesspd in an in-depth report by IFC.- Consequently, thistopic is not treated in this report.
IV. EXPORT SUPPLY AND DEMAND
4.01 The emphasis of this chapter is on exports, particulary the exportof processed fruits, with only brief discussions on vegetables and marineproducts. The reason for this emphasis is that a far greater potential existsfor the expansion of fresh and processed fruit exports by comparison withvegetables and marine products. Export marketing is not significant forlivestock and dairy products (barring some pork exports) since the country isan importer of these products.
4.02 For fresh fruit exports, market proximity is an important factor.In this regard, there are particular advantages for the Philippines over othercompetitors in the Japanese, ASEAN and Australian markets. In 1983, 98% offresh pineapple exports and 74% of fresh banana exports went to Japan.Because of stringent standards for fumigation only 18% of fresh mango exportswent to Japan; 63% was exported to Hong Kong and 14% to Singapore. Forprocessed products, market proximity plays a lesser role. Of canned pineappleexports, for example, 59% were sold in the United States market whereas therest was relatively evenly distributed among the major developed and newlyindustrializing countries.
A. Fruits and Vegetables
1. Exports and Export Marketing
4.03 Exports of processed fruits and vegetables increased from US$64 mil-lion in 1970 to US$137 million in 1982 and declined to US$115 million in 1983.In value terms the growth rate from 1970 to 1982 was 6.52 and in volume terms6.1%, implying that unit values were almost unchanged. The sector has b2endominated by pineapple products which in 1979 achieved a share in totalprocessed fruit and vegetables of 87% but declined to 78Z in 1983. A largeproportion of pineapple exports ay, handled by the two leading transnationalcorporations, Dole and Del Monte.- Through their aggressive market buildingand distribution network, and backed by sustained advertising investments overmany years, these firms have contributed much to the Philippines becoming aworld leader in canned pineapple and juices.
16/ "The Philippine Shrimp Farming Industry: Risks and Opportunities forPrivate Investors", IFC, July 1984.
17/ Del Monte brand products are manufactured in the.Philippines byPhilippine Packing Corporation (PPC).

- 24 -
4.04 With the economic expansion continuing in industrial countries andelsewhere, the prospects for an expanded market for pineappLe products appearsgood. Even so, Dole and Del Monte are trying to diversify their operationssomewhar (such as into fruit cocktails). It is noteworthy that the dominanceof the two multinational companies has not prevented smaller companies fromentering the market. Among the reasons for this are that the large companiesare less flexible, they require a minimum market size to enter a market andhave contractuaL arrangements with certain chain stores which limit theirdealings with other chains. Also, some chains prefer not to be completelydependent on a certain brand, but like to offer more than one, possiblyincluding a product under a generic label. This offers definite opportunitiesfor smaller firms.
4.05 The success of the pineapple industry in capturing world markets hasnot been foLlowed up in the case of other products, despite the fact that themajority of tropical fruits required by export markets are indigenous to thePhilippines. Indeed, exports of canned and preserved fruits, other thanpineapple products, amounted to no more than US$17 million in 1983. Yet, inthe context of the expected growth of worldwide demand for tropical fruits andby-products, opportunities for the Philippines clearly exist.
4.06 Pineapple Canned in Syrup. Canned pineapple is a traditional exportproduct the value of which had already reached US$28 million in 1970. Expan-sion in the 1970s was swift; more than a doubling of the volume was achievedfrom 1970 to 1979 (with an export value of $83 million in 1979). Between 1979and 1983 the export volume decreased by 232, while the value remained at about$83 million because of higher unit prices. The recession in industrialcountries appears to have been a major cause of the decline. In 1984, inspite of domestic problems, processed pineapple exports expanded by 10 percent(in value terms). Pineapple is produced in primarily single-product opera-tions of Dole and Del Monte, but is also a key component of a variety of fruitproducts produced by a number of medium-size companies. The establishedrecord of the Philippines as a world supplier of canned pineapples provides avaluable "umbrella" under which an extended range of associated tropical fruitproducts can be launched.
4.07 Other Fruits Canned in Syrup. This category of canned fruitsconsists of tropical fruits, either whole or in portions, and mixed fruitcocktails. Total exports were about US$7.0 million in 1983. Canned mixedfruit cocktails account for 85% of exports of this category. The remaining15% is made up of four tropical fruits, jackfruit, mangoes, palm fruit andsantol. The development of canned fruit cocktails to a US$5.9 million exportbusiness during recent years is more important than may at first appear, and,if efficiently promoted, could emerge as the backbone of the non-pineapplecanning industry, since it uses as ingredients many local tropical fruits,some of which individually may not be commercially viable in export marketsfor some time to come. Moreover, international manufacturers of canned fruitsrecognize that fruit cocktails provide a unique opportunity to extend therange of their existing brands, while at the same time expanding the totalmarket. The logical development would be the marketing of a range of fruitcocktails consisting of different combinations of a variety of fruits. Theprincipal demand for mixed fruit cocktails is in the iadustrialized countries.

- 25 -
Of particular significance is the demand from Western Europe, a market whichoffers good opportunities for expansion. Demand is in excess of availablesupplies as evidenced by unfilled orders. The addition of new fruits, e.g.,passion fruit or guyabano, is expected to further contribute to expanding themarket.
4.08 Banana Chips. One out of every three fruit processing firms in thePhilippines is producing banana chips, with combined exports totalling US$7.2million in 1983. Banana chip exports were negligibLe or nonexistent in 1975,but rose to US$8 million in 1982. The export market worldwide is highlycompetitive, with Taiwan, Thailand, Mexico and Ecuador being the other mainsources of supply. In Western Europe additional competition is encounteredfrom Africa and the Caribbean.
4.09 Fruit Purees and Pastes. The Board of Investment (BOI) list ofregistered firms includes six processors manufacturing fruit puree with a com-bined plant capacity of 17,000 tons annually. Exports have been limited andvolatile largely due to scarcity and seasonality of fruits for processing.The instability of this relatively new market sector points to a problem thatis generic to tropicaL fruit products, and is partly attributable toimporters' reluctance to expose themselves to too much risk during new-productpromotion and new-use formulation stages. However, the leading processors areconvinced that a large export market does exist for fruit purees and pastes,and that the real constraint is supply shortages rather than low demandlevels.
4.10 Pineapple Juice. Pineapple juice exports experienced a 3-1/2 foldincrease in volume terms and a 7 fold increase in value terms between 1970 and1982. However, exports concracted to only US$4.4 million in 1983 from US$9.2million in the previous year. Pineapple juice is predominantly a product ofDole and Del Monte but an increasing volume is also ;,eing produced by otherfirms. Volume and value of pineapple juice exp,-ts depend very much on therequirements of the U.S. market, which accounts for 88X of all exports in thiscategory. The U.S. market has been experiencing some demand instability thereason for which are not entirely clear.
4.11 Other Fruit Juices and Concentrates. The export value of otherfruit juices and concentrates was less than US$1.0 million in 1983; but pros-pects for increases appear good. The juices are usually packed in cans ready-to-drink. The principal disadvantage is the high cost of transporting thewater content of each container. A principal advantage is that the product isa convenience food which requires no preparation before consumption.
4.12 Processed Vegetables. The total exports of processed vegetables -frozen, packed in preservative solutions, dehydrated or canned - were US$3.4million in 1983. Dehydrated onions represented the major share in this cate-gory up to 1982 but other vegetables became more important in 1983. The listof all other processed vegetables exported covers a wide range of tropicalpulses, salads and root produce, none of which individually is very large.The international market for dried and dehydrated vegetables is highly compe-titive, with strong competition from Eastern Europe and the United States.

- 26 -
Import demand in individual countrjge fluctuates sharply. The total market isstagnant and not expected to grow._
2. Assessment of Export Market Demand
4.13 The only consolidated figures for worLd trade in fruit juices,arefor the period 1977 to 1981. According to them the value of world importsfrom all sources doubled during 1977-81 from US$957.5 million to US$1.9 bil-lion (see Annex 3, Table 13). OECD member states accounted for over 81% ofworld imports of fruit juices in 1981 of which 67X was for citrus juices(US$1,080 million, mostly for orange juice), 4.4% pineapple juices (US$68.5million), and the remaining 28% (US$432.4 million) was unspecified.
4.14 For the purpose of this report "Tropical Fruit Juices" and "CitrusJuices" are classified as separate product categories. In comparison to cit-rus juices, world trade in tropical fruit juices is small, estimated at aboyu1US$100 million in 1981. However, a recent survey of tropical fruit juicesindicated growing consumer and industrial interest which is reflected inimports increasing at an average of about 10% annually in volume terms.
4.15 Over the last decade or so, consumers' attitudes towards fruitjuices have changed considerably. Traditionally regarded and consumed as abreakfast drink in many countries, fruit juices have replaced beverages duringthe rest of the day as they have gained in popularity, particularly amongyounger consumers. Recent years have witnessed the growth of healthconsciousness, especially in Western markets. The considerable interest innatural, pure and healthy food products has benefitted the fruit industrygreatly.
4.16 Consumers in the United States and Western Europe are graduallyacquiring a taste for exotic fruit juices. There is a willingness to try newflavors and tropical fruit juices are growing in popularity in spite of higherprices relative to citrus. Among the tropical fruit drinks most preferred aremango, guayabano and calamansi (Philippine lemon). Guava, papaya andnaranghita (Philippine oranges) are less preferred, at least as single fruitdrinks, but recent tests combining guava-with-apple, and papaya-with-apple,have been well received.
4.17 The beverage industry is the most notable user of tropical fruitjuices, concentrates and pulps with an estimated share of 80% of allimports. It uses these products in the manufacture of a wide range ofbeverages, including juices, nectars, fruit juice drinks, multi-vitamindrinks, syrups, etc. The dairy industry uses imported juices, concentratesand pulps to produce yoghurt, ice-cream, desserts, pudding, etc. It probablyabsorbs 10% of all imports. The remaining 10% are used by a variety of otherfood industries to produce jam, marmalade, jelly, baby food, confectionery and
18/ "The Market for Dehydrated Vegetables," ITC, UNCTAD/CATT, Geneva 1981.
19/ "The World Market for Fruit Juices," ITC, UNCTAD/GATT, Geneva 1982.
- 27 -
other products. The beverage industry is characteristically a high-volume,limited-variety user, while the food and dairy industries are low-volume, widevariety users. It is through these two industries that most of the tropicalfruit juices have been or are being introduced into the market. The mostsignificant products traded internationalLy are currently juices of passionfruit, mango, guava and papaya. (Other tropical juices include cherimoya, aclosely related fruit to the Philippine "atis", and guyabano or soursop, whichare relative newcomers to export markets.) The prospects for these arediscussed below. A more indepth analysis of prospects in individual countriesis presented in Annex 1.
4.18 Passion Fruit. This is the best known of tropical fruits in Europe,North America and Australia/New Zealand. Both yellow and purple varieties aredemanded, without a clear trade preference for either. Owing to its pene-trating flavor and high acidity, passion fruit is consumed as a nectar, ajuice drink or in dairy products with a low content of pure juice. Its flavorand color are universally acceptable, and it is used increasingly as a blenderby the drinks industry. It has also become increasingly popular as a fruitdrink in its own right. With more steady and reliable supplies, trade sourceshold the view that the market will expand significantly. Current suppLies ofpassion fruit products originate in Brazil, Kenya, Colombia, Peru, Taiwan,Ivory Coast, India, Sri Lanka, and Venezuela. Philippine production ofpassion fruit is still negligible. Del Monte has planted a 45 ha area inMindanao and Crown Fruit has a 3 ha experimental plot. Some farms in Luzonare also conducting trials.
4.19 Mango. Fresh mango is traditionally an important product in theMiddle East and in various ethnic markecs in Europe and North America. It isnow appealing to a new consumer base in these markets, and is growing inimportance in other markets as well. The Philippines is already a supplier ofmango puree. Expansion in Western Europe is limited only by supply con-straints from the main producers, and significant opportunities exist for thePhilippines since it is able to produce a high quality product at a competi-tive price. Philippine exporters have also had some success in the UnitedStates, but Mexico's proximity puts the latter in a strong competitiveposition. Nevertheless, mango puree from the Philippines promoted on thedemonstrable merits of the variety of the fruit grown locally could wellsecure a premium price. The major sources of competition are India, BraziLand Mexico.
4.20 Guava. Guava juice is increasingly being used as a raw material,and trade sources predict a steady expansion in demand. Market informationindicates a considerable increase in the popuLarity of guava juice, withmarket preference for the pink variety. However, the white variety is prefer-red in the United States due to its stronger flavor. Currently, importers inthe United States report an upsurge in the demand for guava.
4.21 In the Philippines Del Monte has a small area planted with guava.The fruit is used in various canned products. Another processing firm hasbeen utilizing guava in the past, but because of unreliability of supplies andthe existence of numerous varieties which detract from a uniform quality, itstopped producing. More research will have to be done on the production side

- 28 -
to select the best varieties for the various areas, followed by arrangementssuch as contract farming to assure sufficient quantities and the rightqualities of product.
4.22 Papaya. Although the taste and flavor of papaya do not normallyappeal to consumers in the major markets, particularly in the United States,papaya has grown in importance in recent years. Principal uses are with otherfruit, e.g., mixed drinks, and in yoghurt and baby foods, partly because ofits papain (tenderizer) content. Growth in demand is expected to be steadybut not spectacular.
3. Export Development
4.23 One of the functions of the Export Development Strategy Crou D2/ isto estimate projected exports for specific categories of fresh and processedfruits. Each year the actual performance is reviewed against the targets andthen the targets for the next several years are revised. The overall targetsset in 1982 for 1983 were too optimistic. However, the projections for 1983for 1984 turned out to be more accurate for fresh fruit exports where animpressive 20X growth was indeed achieved (see Annex 3, Table 14). Inprocessed fruit exports the expectations for a good performance were alsohigh, but the general macro-economic situation as well as the emergence ofunforeseen specific constraints such as the availability of high quality tincans prevented the expectations from being realized. However, in spite of theconstraints, a significant 11 growth was achieved.
4.24 The world market for tropical fruit juices and purees (excludingpineapples) was estimated at about US$100 million in 1981. It is expected togrow in real terms at 10% per year. The Philippines' share of the worldmarket in 1981 was 7.6%. Since in the judgment of leading exporters an 18%volume growth rate of Philippine exports in processed fruits (other than pine-apples) is feasible, the Philippines share in the world market will increasefrom the estimated current share of about 8% to about 11% by 1990. The 18%rate is also being used by the Export Development Strategy Group, and, in themission's view this is a realistic expection. It is based on a 1979-82 per-formance of 14.5% (1983 was a drought year) and on the 1984 performance (Annex3, Table 7) which was impressive in spite of an unfavorable macroeconomicenvironment. An even higher growth rate would be feasible if a number ofconstraints could be overcome (faster growth of raw material production,simplification of export procedures, etc.).
4.25 If Government firmly decides to support export development in thetropical fruits sector by creating a conducive economic environment and, moredirectly, by various actions or measures recommended in this report, signifi-cant progress could be made since good export market opportunities exist. Theworking assumption based on the mission's preliminary explorations are that,
20/ Established as an advisory body to the Minister of Trade and Industry in1982. Consists of heads of industry representing seven industrial groupsincluding fresh and processed foods.
- 29 -
with the exception of bananas, the market potential exists in importingcountries for fresh and processed tropical fruits both for varieties of shortand long gestation. With this knowledge producers and processors who mighthave a limited knowledge of the export markets can expand production, and thegovernment should facilitate this development by reducing hindrances whichmight exist such as in export and duty drawback procedures.
4.26 The question has been raised about a potential oversupply of longgestation fruits such as mangoes. In the production of apples an oversupplysituation currently exists because too many producers in too many countriesplanted trees simultaneously which led some years later to excess supply andlower prices. The reason why this may not occur with mangoes is that (a) onlyfew countries can grow them; (b) because of the attractive flavor mango can beused in many forms and types of products; and (c) even an all-out productioneffort of a country like the Philippines would result in absolute exportproduction totals that are still small in relation to products of a similarnature currently being demanded by the world market.
B. Marine Products
4.27 In 1983 the major marine product exports were: canned tuna(US$53 million), shrimps and prawns (US$36 million), and frozen tuna(USt18 million). These exports have developed only toward the end of the1970s; in 1975, with the exception of shrimp and prawns (US$7 million),exports in all categories were still very small (see Annex 3, Table 8).
4.28 Taiwan and Thailand are strong competitors for Philippine marineproduct exports. According to information from processors, the cost ofimported cans is one of the factors making the cost of processed tuna from thePhilippines higher than that from Thailand. An effort should be mate by theexporters to broaden the traditional market base now heavily concentrated inthe United States in view of protectionist pressures in the United Statesmarkets. In 1983 a countervailing duty amounting to 35Z was requested by U.S.canners on tuna imports from the Philippines on grounds of dumping. Therequest was later canceled when a court ruled that the actual Philippinesubsidy was only 0.75%. Since then, however, other requests for protectionhave been introduced by producers in the United States (under the escapeclause provision No. 201).
V. THE ROLE OF GOVERNMENT IN FOOD PROCESSING AND MARKETING
5.01 Food processing in the Philippines was developed largely by aprivate sector that showed initiative and ability; private sector developmentshould be encouraged further. The role of Government should be to enhance theefficiency of its support functions and to reduce interventions which mightmilitate against an economic environment in which the private sector canmaximize its contribution. The perceived threat of new government interven-tions and the frequency of changes in rules and regulations increase the risksfor potential investors, discourage investment and therefore limit the exploi-tation of opportunities which exist in the sector.
- 30 -
A. Export Procedures
5.02 In the early 1970s export procedures had become very complicated andthere were overlapping functions of various agencies responsible for exportclearances. The time required to obtain a permit was excessive since a largenumber of steps were involved. Altogether an exporter needed to obtain 47signatures from various government offices. Presidential Decree No. 930 ofMay 1976 achieved some simplifications and reduced the signature requirementto 23. Still, export procedures were considered a hindrance by private sectorexporters. They were requesting further simplifications, and with anincreased emphasis on exports, Covernment decided to take further actions inthis regard. Executive Order No. 843 was issued in November 1982 with theobjective to "eliminate the obstacles of red tape and cumbersome exportprocedures." For this purpose the Commission on Export Procedures wascreated. The Commission is chaired by the Minister of Trade and Industry andincludes the Governor of the Central Bank, the Commissioner of Customs, theDirector-General of NEDA as weLl as four members from the private sectornominated by the Philippine Chamber of Commerce and Industry. The secretariatfor the Commission is provided by the Ministry of Trade and Industry.
5.03 The focus of the Commission's work has been on moving away fromshipment-bas:id documentation to period- source- or product-based documenta-tion. For example, the exports of a particular firm may be authorized for aspecified period of time by a single set of technical and administrative per-mits. Individual shipments during that time would then only require monetaryand fiscal authorization, and these would also be simplified. Authorizationsof a periodic or source nature may take 30 days or more to secure, but thetime saviags on individual shipments are significant.
5.04 As one of the intended simplifications a "one stop shop" for exportclearance was established by centralizing the representatives of all majorregulating agencies in the Export Office of the Bureau of Customs. While thiswas expected to streamline export clearance, it did not seem to be viable.Informal as well as procedural problems arose, and coordination proved diffi-cult when input was required from more than one unit of an agency. Facilitieswere also inadequate since no laboratories were provided for the testing whichis often a prerequisite of export approval. While inter-agency sec ndment isfeasible to a greater extent than is now being practiced, the one-s:op shopdoes not appear to have been fully guccessful.
5.05 The Commission on Export Procedures had achieved some simplicationsbut disincentives for exporters continued, arising from export regulations andprocedures. This was particularly the case in the area of processed foodexports where such agencies as the Bureaus of Food and Drugs, Plant Industry,Animal Industry and Forest Development, the National Food Authority and thePhilippine Coconut Authority were involved, in addition to the usual agenciesdealing with exports such as Bureau of Customs or the Central Bank. As notedin paragraph 8(a) on April 25, 1985 the implementing rules of Executive Order1016 were put into effect which abolished all inspection and commodityclearances on exports (with certain exceptions).

- 31 -
5.06 Another area where simplifications are needed is the duty-drawbacksystem. Currently, exporters pay import duties on their imported components,and later, after the exportation has occurred, they obtain a refund; theadministrative procedures involved in this process are tedious. TheCommission on Export Procedures agrees with the need for simplification and isexpected to make proposals in the near future.
B. Food Terminal Inc. (FTI)
5.07 The FTI was organized in 1968 with the status of a private entityfully owned by the Development Bank of the Philippines. It initially envi-sioned linking producers and retailers by providing modern trading facilitiesfor farmers, food processors and wholesalers. FTI's core facilities consistof a central refrigerated warehouse, farmers' sheds, wholesalers' building,dry warehouses, food research Laboratory, roads and site utilities and coveran area of 120 ha. The facilities were underutilized during the late 1970sand large losses were incurred.
5.08 In 1980, FTI became a subsidiary of the National Food Authority(NFA). Since then, use of existing capacities has increased and some newfacilities have been built. The volumes of goods procured, processed,marketed and exported have increased but the financial situation continues tobe precarious. In 1980, FTI started the KADIWA program, intended to makebasic commodities available to low-income consumers at fixed prices. FTI iscurrently managing 24 KADIWA centers and 65 mobile stores in Metro Manila. Inaddition to the retail outlets in Manila, 242 NFA provincial centers and 47satellite centers are being used for retailing and for procurement of rawmaterials. Buying from farmers is usually done at pre-negotiated prices andvolumes. For procurement of processed food and other products, FTI relies on180 manufacturers. A variety of products is exported by FTI such as milkfish,prawns, fruit juices, food preserves, snack foods, fruits and vegetabLes.
5.09 Because the losses incurred by FTI are a drain on NFA's resourcesand because FTI's activities are outside NFA's main mission, it has beenrecommended that NFA divest itself of FTI.211 Should the divesture notmaterialize soon or should FTI be detached from NFA but remain publicly owned,fairness requires that FTI compete with the private sector on an equaLfooting. Direct or indirect subsidies should be reduced and made explicit,and a public accountability system should be established. Also, there is muchresentment in the private sector of the fact that NFA is responsible for anumber of regulation, licensing and enforcement activities while at the sametime NFA, or its subsidiary FTI, compete with the firms being regulated. Theobvious solution is either that FTI ceases to benefit from its association
21/ "Organization and Systems Study for the National Food Authority," Con-sultant study for ADB and IBRD, Public Administration Service,Washington, January 1985.
- 32 -
with NFA or that NFA's regulatory functions are transferred to the appropriateGovernment agency.
C. Support Functions of the Ministry of Trade and Industry
5.10 Authority and responsibility for all matters relating to foreigntrade are vested in the Ministry of Trade and Industry (MTI). Althoughspecialist functions have been delegated to MTI's specific departments andagencies in the past, their roles have become fragmented, and their terms ofreference complex. The situation leads to duplication of functions andinternal rivalries; however, it goes beyond the scope of this report to makespecific recommendations for making the support functions more efficient.
5.11 Philippine International Trade Corporation (PITC). This body is thePhilippine Government's official export agency. Because it is outside thegovernment civil service, it can pay salaries commensurate with the privatesector and therefore attract higher quality staff. It was originally set upto develop markets in Eastern Europe and socialist countries elsewhere. Theobjective was to achieve volume exports for specialized products in marketswhere a government-backed negotiating authority could be expected to havegreater leverage than individual exporters in the private sector or where agovernment agency was a more natural counterpart to a state trading agency.To this end, PITC has established offices in East Berlin, Moscow, Peking, andBagdad. Later, offices were also established in Sydney, Tokyo, San Francisco,New York and Munich. The cost-effectiveness of these offices could, however,not be established by the mission.
5.12 Until recently PITC's main activity areas have been in support ofthe garment, footwear, electronics and construction industries. But PITC hasnow also been charged with promoting exports from the food industry, not onlyto socialist economies, but also to other markets. PITC sees its role ascomplementary to the private sector, and not as competitive, since the companydoes not take physical possession of goods. PITC's main function is toinitiate and negotiate large scale transactions, arrange trade credits inexcess of US$1 million, and supervise documentation and shipment procedures.PITC services are available to a specific exporter or group of exporters, onthe basis of a fee of 5% on the value of the transaction. Because PITCpossesses valuable information or can obtain market intelligence, it issuggested that consideration be given to PITC's provision of information tothe private sector on a fee paying basis.
5.13 The Center for International Trade Expositions and Missions, Inc.(CETAM). CETAM is a statutory enterprise set up by MTI for the purpose ofhandling all functions of export promotion relating to participation in tradefairs and overseas trade missions. Its budget is met by donor agencies andthe fees charged to Philippine fair participants. At the conclusion of eachpromotional event, CETAM publishes details of business contacts made, sales,activities by competitors, and favorable factors and constraints affectingfuture development. CETAM is considered to provide useful services toexporters.

- 33 -
5.14 Information on Trade and Markets. Information on market opportuni-ties is provided to all registered exporters in a bi-weekly bulletin (TradeTrends) which lists overseas trade inquiries and other relevant information.
5.15 Training in export marketing is provided largely through two-dayregional seminars organized by the Bureau of Foreign Trade. Speakers aredrawn from commercial offices of foreign embassies in Manila and from variousgovernment agencies involved in export promotion. They are well attended andinclude topics such as product development and adaptation, export costing andpricing, export financing, snipping and transportation, and export procedures.Since these seminars are quite general, dealing with the whole range of exportproducts, it is suggested that seminars also be conducted for specific commo-dity groups such as fresh and processed fruits which are high on theGovernment's priority list.
5.16 Information and Assistance on Packaging. Packaging, includinggraphics, materials and container construction, is important particularly forexport marketing since technical requirements and promotional properties inexport markets are especially strict. Recognizing this in February 1983, theMinistry proposed the establishment of a Packaging Center within the DesignCenter of the Philippines. The implementation of the proposal has beensuspended because of current financial conditions. The initial proposalappears to have been too wide-ranging for present domestic and export marketrequirements. What is required is a package design facility geared to meetingthe needs of specific products in specific markets. For that purpose, a smallfull-time staff may be sufficient, supplemented by specialists who could beemployed on an ad hoc basis.
5.17 NDC Food Processing Project. The mission gathered that a foodprocessing project is being studied for possible promotion by NDC. Theproject would establish an investment company to provide funding in the formof loans and equity for food processing activities. It is, however, question-able whether increased government involvement in the sector is needed sincefinancing, at market rates, is available through IGLF and could be supplemen-ted by the proposed Agricultural Credit Project. Food processing sectordevelopment should take place as far as possible under the auspices of theprivate sector given the good track record, and without recourse to publicfunds.
D. Government Intervention in the Livestock Sector
5.18 Import Monopoly. The importation of briskets and beef trimmings hasbeen centralized and managed solely by PHIL-BAI, a government corporation.Presidential Decree No. 1297(as amended by PD 1593) appointed PHIL-BAI as thecountry's sole importing agent from Australia and New Zealand. To improvemarketing efficiency, imports should be opened up to permit private sectorparticipation on equal terms with PHIL-BAI.
5.19 Ban on Inter-Provincial Movements of Carabaos. A bar. on inter-pro-Ancial movements of carabaos was imposed by Memorandum 37-80. This wasdone with the purpose of preserving the carabao population to be used as workanimals. This is an important objective; however, carabaos are already

- 34 -
sufficiently protected by Executive Order No. 626 which only allows theslaughter of carabaos "seven years old or older if male, and eleven years oldor older if female". The effect of the inter-provincial trade ban hassegmented the market and created surpluses in some provinces and shortages inothers. It is recommended that the ban be abolished.
VI. SUMMARY OF RECOMMENDATIONS
6.01 This section includes a brief summary of each of the principalrecommendations of the report, and is intended for quick reference. Theparagraph numbers in parenthesis will assist a ready reference to the maintext.
(a) Import and Export Procedures:
- Simplify export and duty drawback procedures (export proceduresfor processed food products are especially cumbersome) (paras.5.02-5.06).
- Remove product standard biases in favor of imports (8(e)).
- Review vaccine import procedures with view toward possible simpli-fication (para. 3.33).
- Remove ban on inter-provincial trade of carabaos (para. 5.19).
(b) Food Processing Research:
- Coordinator to be appointed in NSTA (para. 2.24).
- Private sector to have access at cost to government researchfacilities, now much underutilized (para. 2.27).
- Private sector to be represented on research committees (3.13).
(c) Government Monopolies:
- Eliminate unfair competition of FTI (paras. 5.07-5.09).
- Abolish beef import monopoly of PHIL-BAI and increasingly transferresponsibility to private sector (para. 5.18).
(d) Market Information:
- Provide better marketing information (including documentationrequirements) to private sector (paras. 5.14-5.16).
(e) FDA Role:
- Separate FDA technical assistance from enforcement function(para. 2.26).
- 35 -
(f) Private Sector Role:
- Actively promote feedgrain production under private auspices -greatest potential for efficient import substitution (para. 3.31).
- No need for NDC food processing project (para. 5.17).
(g) Study:
- Study tin can problem and other packing options with assistancefrom the Bank's Regional IDF Division (paras. 2.30-2.34).

ANNEX 1Page 1
- - ~~36 -
EXPORT PROSPECTS FOR TROPICAL FRUIT PRODUCTS
IN SELECTED MARKETS
1. United States. Domestic production of tropical fruit juices doesnot meet current demand and is certainly insufficient for the demand expectedin the future. Philippine suppLiers (particulnrly suppliers of bulkconcentrates) of the juice/pulp of passion fruit, guava ithe pink variety withfew seeds), mango and papaya have good prospects in this market. The currentvolume of demand is small compared with that of citrus and other juices, butthe outlook is positive.
2. As the market for consumer-packed juice is intensively competitive,prospective suppliers shouLd seLect market segments and product rangescarefully. They could, for example, aim at the Hispanic community, thecountry's fastest growing community and a substantial consumer of tropicalfruit juices and nectars.
3. Canada. Traditional sources meet most import requirements. Withthe exception of Brazil and the Philippines, developing countries have beenunreliable suppliers in terms of quality standards and delivery. As a result,the trade has been reluctant to promote tropical fruit juices at the consumerlevel. Philippine exporters should exploit their acceptance in the Canadianmarket.
4. Health food retail outlets, which seek suppliers of all types ofunadultered, sugar-free juices, offer other sales prospects. A certain growthin the consumption of yoghurt is also expected, especially yoghurt and milkdrinks with fruit flavors, which in turn will increase demand for fruit pulpsand juices.
5. Tropical fruit juice products are still relatively unknown in Canadaexcept among small ethnic groups in some of the larger cities. However, someof the larger supermarket chains have displayed some interest in selling agood line of tropical fruit juices and nectars in their gourmet fooddepartments, thus providing an opportunity for suppliers of a range of cannedjuices, including mango, guava, papaya, and passion fruit. The possibleintroduction of multi-drinks in the near future will also improve theprospects for tropical fruit juices of various types.
6. Japan. As growth in production of juices from domestic fruit islower than the growth of consumer demand, the shortfall is being filled byimports which are growing more-varied in response to consumer demand.Consumers are attempting to move away from the imposed flavor of orange juice,as is evidenced by the increase in the consumption of grapefruit, apple, grapeand other juices, including those of tropical origin.
7. A number of tropical fruit juices are distributed in Japan but salesare mainly concentrated in the larger urban areas and are made up of soft
ANNEX 1- 37 - Page 2
drinks or nectars. The leading flavors are passion fruit, guava, papaya andmango. The stagnation of the market for tropical fruit juices results fromthe import quota system, which awards priority to the principal juices, i.e.orange, grapefruit, apple, grape etc., and leaves only the remainder of thequota for the other juices.
8. In June 1984 the Japanese Government approved some trade measureswhich will ease the situation somewhat for Philippine exporters of tropicalproducts.
9. Australia. Orange juice and orange juice blended with pineapple ormango juice, are the most popular juice products, each accounting for about45% of the market, or a total of 90%. The remaining 10% is shared by apple,blended appLe and guava, blended tropicaL fruit, grapefruit, grape and otherjuices. Small quantities of mango juice, mixed tropical fruit and pineapplejuices are sold as straight juices.
10. In 1981, an actempt to market calamansi juice imported from thePhilippines as a blender failed for lack of consumer interest. Australia'simports of passion fruit juice mostly come from Fiji - approximately 8,000gallons p.a.
11. Consumer demand for tropical fruit juices may develop over themedium term to a level representing increased opportunities to Philippineexporters. Although tropical fruit concentrates are not specified in thenational import quantities, the Philippines exporters can probably increasethis trade by carrying out trade promotion activities in the market. Theproducts with the best current opportunities, and which would benefit mostfrom joint marketing activities with an importer, are passion fruit,pineapple, mango and guava juices.
12. Gulf States. Total imp Yts of all fruit juices, including citrus,amounted to $189 million in 1980 - of which Saudi Arabia imported $159 mil-lion (84%). Imports of mango and guava accounted for 8.2% of Saudi Arabia'stotal, which, on the basis of comparable ratios for the rest of the region,suggests mango and guava imports of $15.5 million. Of this Philippines fruitjuice exports (non-pineapple) represent only around 0.8%.
13. Saudi Arabia is the fifth largest importer of tropical fruit juicesin the world after the U.S.A., West Germany, Canada and the U.K. Principalsupplies of mangoes and guavas are Egypt 56%; Cuba 22%; Taiwan 10Z; India 6%;China 3Z; Japan 2%. Mango and guava juices are required in easy-open cans.
14. The market is particularly attracted to products with novel flavoror combinations of flavors (fruit mixes). Increased imports of concentrateand pulp will be required to supply the expanding domestic processing indus-try. At the same time, imports of consumer packs may level off.
I/ 1980: Latest statistical period common to all states, for comparativeorder of magnitude only.
ANNEX 1Page 3
- 38 -
15. France. In 1981, the estimated value of imports of tropical fruitjuices exceeded an estimated $1.6 million compared with $185,000 in 1977.Importers are optimistic that further growth will take place because increasedconsumption of mixed juices and beverages (e.g. tropical fruit cocktails),usually with citrus juice as the major component, is making consumers moreaware of the "new" flavors. %
16. The current market comprises small firms that market the productswithin limited areas rather than nationaLly. The interest generated in thismanner may prompt larger firms to attempt wider distribution of tropical fruitjuice products under their own brands.
17. Importers of tropical fruit juices, concentrates and pulps haveexpressed continuing interest in passion fruit concentrate, papaya, cherimoyaand guava.
18. United Kingdom. Citrus juices accounted for 75% of all importsvalue in 1981. Imports of pineapple juice made up 6.2% of the total thatyear.
19. Only passion fruit has been imported continuously and even then onlyon a limited scale. However, marketing of juice mixtures, such as those ofvarious citrus juices,.is stimulating sales of tropical fruit drinks, i.e.mixtures based on orange juice and containing one or two tropical fruitjuices. Furthermore, recent trends in other European markets, viz. FederalRepublic of Germany, toward multi-flavored juice drinks, may influence theU.K. trade to follow similar trends.
20. Most importers consider it premature to expect a sudden upsurge indemand for tropical fruit juices; however, a small demand already exists,estimated at between 400 - 500 tons year, and this demand is increasing. Thetime is right for Philippine suppliers to attempt to secure a foothold in thecurrent market.
21. Federal Republic of Germany. With imports of tropical fruit juices,concentrates and pulps probably amounting to 20,000 tons of single-strengthequivalent, the Federal Republic of Germany is among the world's largestimport markets for tropical juices. Although their share of total juiceimports is still very small, this situation indicates considerable growthpotential. The two major industrial end-users of juices and nectarsingeneral, i.e. the beverages industry and the dairy industry, are bothexpected to grow. In 1981, for example, per capita consumption of juices andnectars in the Federal Republic of Germany was 20.6 litres, which is high,compared with the that of most other European markets. Consumption of yoghurtis also quite high. In view of the general interest in health prod-cts, it islikely that the juice market will continue to grow during the coming years.Tropical fruit juices are expected to benefit, especially if further salespromotion and advertising are undertaken.
22. On the other hand, high prices are likely to have a negative effecton the market, especially under adverse economic conditions. It is alsoimportant to note the trend towards buying nectars or juice drinks with lower

ANNEX 139 Page 4
and lower juice content. Nevertheless, it is probable that the market fortropical juices, concentrates and pulps will continue to grow, provided thatgood-quality products are offered at competitive prices.
23. The Netherlands. Despite its small population (14.1 million in1981), the Netherlands is an important rapidly growing importer of juices'Over the five-year period 1977-1981, its imports increased in value by 86.5%from $77.6 million to $144.7 million or by an annual average of over 16.5%.
24. The Netherlands is a substantial re-exporter of fruit juices, mainlyto other EEC countries and in particular to the Federal Republic of Germany,France, the United Kingdom, Belgium and Luxembourg. Re-exports accounted for35Z imports in 1980 or $90 million.
25. The Netherlands' role as a major European importer/re-exporter ofjuices is due to various factors. First, Rotterdam, Europe's largest port, isespecially well equipped to handle shipments of food products, making it anattractive terminal point for exporters from all over the world. Second, ithas traditionally been an important trading center for many products due toits central location and excellent communications with the major Europeancities. Finally, advanced food technological facilities prompt many Europeanimporters to obtain specific products tailored to their specifications, fromNetherlands compound houses.
26. The market for the general category of products, which includestropical fruit juices, almost doubled in terms of value and quantity betweenL977 and 1981. Although the quantity (9,254 tons) represented only 3.8Z ofall imports in 1981, the value made up 11.7% of the total ($145 million).Developing countries are large and growing sources of these products, with48.1X of supplies by vaLue in 1981 compared with ony 12.9Z in 1977. As thesecountries mainly export tropical fruit juices (ppssion fruit, mango, papaya,etc.), the figures clearly indicate a growing interest in these products, ifnot in the Netherlands itself, then certainly in the European market.

ANNEX 2- 40 - Page 1
EXPORT MARKETS FOR TROPICAL FRUIT JUICE: MARKET ACCESS,CUSTOMS DUTIES, FOOD LAWS AND REGULATIONS
USA
1. Custom Duties. AlL imported juices are subject to duties varyingbetween a maximum of 35 cents per gallons on citrus concentrates, 3 cents pergallon on juices not elsewhere specified (free under the Generalized System ofPreferences (GSP), and 1 cent per gallon on vegetable juices.
2. Food Laws and Regulations. All processed foodstuffs entering theUnited States are subject to inspection by the Food and Drug Administration,which has established Standards of Identify, Quality and Fill for a number ofcanned products.
3. tn addition, the United States Department of Agriculture, FoodSafety and Quality Service, has promulgated Quality Grade Standards forvoluntary use: canned, glass and frozen foods.
4. The latter standards have been developed to designate differentlevels of quality and to provide a convenient basis for buying and selling andfor establishing quality control programs. Importer goods that conform tothem will have easy access to the market, and will not be subjected to longand costly delays at the port of entry.
5. End-users impose their own standards or specifications for productsnot included in the foregoing standards.
Canada
6. Custom Duties and Quantitative Restrictions. There are no quantita-tive restrictions on imports of juices into Canada. Duties may be as high as35Z on some items under the general tariff. Most favored nation (MFN) ratesdo not exceeed 15Z and many items, including some tropical products, enterduty free under the MFN schedule. A few other products from developingcountries benefit from the GSP, which gives free access to most productsexcepting those also produced in Canada.
7. Food Laws and Regulations are contained in the Canada AgriculturalProducts Standards Act and in the Processed Fruit and Vegetable Regulations.An amendment referring to permitted can sizes for fruit and vegetable juiceswas published in Canada Gazette Part II, 1980.
8. The Department of National Health and Welfare, through the Food andDrug Act, has also enumerated a series of standards for fruit juices.
ANNEX 2- 41 - Page 2
Japan
9. Custom Duties. Imports of all juices excluding lemon and lime juiceare subject to quota restrictions. Importers must apply to the Min:stry ofTrade each year to obtain their quota. The latter is partly determined byend-use and importers specializing in specific segments of the market are"allocated quantities accordingly. Special quotas have also been negotiatedwith certain supply sources such as the United States.
10. Import restrictions are imposed on certain food products to protectthe domestic producers. The fruits and vegetables sub@ect to quotarestrictions are as follows:
CCCN Code Description
08.02 Oranges and tangerines, fresh08.11 Oranges and tangerines, temporarily preserved20.05 Fruit puree and fruit pastes20.06 Canned pineapples, fruit pulp20.07 Fruit juices, tomato juice21.04 Tomato catsup, tomato sauce and mixed
seasonings
Quotas on imported items are applied on a global basis.
11. The Philippines benefit from preferential duty on these items;duties nevertheless remain quite high, i.e. 12% on vegetable juices, 22% onfruit juices not containing sugar and 27%-30% on those that do.
12. Food Laws and Regulations. The Food Sanitation Law (No. 233 ofDecember 24, 1947 and amended June 30, 1977) and the Standards for FoodAdditives in Japan are applicable to all foodstuffs. Philippine exportersshould carefully consult them before attempting to trade with this market.
13. In general, three types of inspection are carried out on importedfood products, viz., a visual inspection and two tests, one to verify thecontent of chemicals or additives, and the other to examine the bacteriacount. Failure to qualify may cause delay or rejection of shipment.
Australia
14. Custom Duties. Australia sets no quantitative restrictions onimports of juices, concentrates, pulps/purees. It levies a floating duty onfrozen orange concentrate, which in 1982 amounted to A $2.40/kilo of totalsoluble solids. A customs duty of up to 10% ad valorem is also levied on mostjuice products. However, preferential rates are granted to developingcountries for a number of products. A statutory sales tax of 25Z is levied onconsumer products that contain more than 25% of imported material to protectdomestic fruit growers.
15. Imports. At the time o' the mission, precise data on Australianimports were not available beyond 1979. Imports during the previous 4 years
- 42 - ANNEX 2Page 3
vacillated between $4.5 and $8.5 millions p.a., averaging $6.6 million. Abouthalf of all juice requirements are imported with citrus fruit juices compris-ing approximately 85%.
Middle East/Gulf States
16. This group includes Saudi Arabia, Bahrain, Kuwait and the U.A.E.
Customs Duties
(a) Saudi Arabia. Customs Duty: 3% ad valorem. Certificate of Originis required;
(b) Bahrain. Customs Duty: 5% ad valorem. Certificate of Origin isrequired;
(c) Kuwait. Customs Duty: Nil. Certificate of Origin is required.All labeLling must be in Arabic.
(d) U.A.E. Custom Duty: 3% ad valorem (by sea); 2% ad valorem (byair). Certificate of Origin is required.
France
17. Custom Duties. France applies the EEC common external tariff onimported fruit juices, which varies according to the product's specific grav-ity (degree of concentration), sugar content and country of origin. Certainpreferences exist under the GSP scheme, in addition to suppLementary prefer-ence accorded to signatories to the Lome Convention.
18. Food Laws_and Regulations. Juice sales are regulated by decreesjointly issued by various ministries, including the Ministries of Agriculture,Industry and Health and by EEC directives.
United Kingdom
19. Customs Duties. The United Kingdom applies the EEC common tariff onimported juices and juice products.
20. Food Laws and Regulations. The Minister of Agriculture, Fisheriesand Food, acting jointly with the Secretary of State for Social Services,issued regulations in 1977 under the Food and Drugs Act of 1955 on fruitjuices and fruit nectars. These aim at protecting consumers by providing morespecific safeguards against unfair practices and against the sale of fruitjuices and fruit nectars not of the nature, substance or quality expected.They were also intended to harmonize United Kingdom regulations with EECCouncil Directives by controlling the composition, description and labellingof fruit juices, concentrates, dried juices, and fruit nectars.
- 43 -ANNEX 2Page 4
Federal Republic of Germany
21. Customs Duties. The Federal Republic of Germany applies the EECcommon customs tariff. There are no quantitative restrictions for fruitjuices classified under BTN 20.07 with the exception of grape juice.
22. Food Laws and Regulations. The fruit juice industry is regulatedboth by Federal Republic food laws and regulations and by EEC CouncilDirectives.
23. All imported foodstuffs offered for sale in the country must complywith the provisions of the food law, Lebensmittel-und Bedarfsgegenstandegesetzof August 15 1974, as amended. This is a general law, which is supplementedby a number of regulations concerning labelling and packaging (including thatof prepacked goods); the use of preservatives, coloring agents and otheradditives; dietetic foodstuffs; and vitaminized foodstuffs.
24. En addition, special food laws and regulations are applied to fruitjuices, including:
(a) Verordnung uber Fruchtsaft, konzentrierten Fruchstsaft undGetrockneten Fruchtsaft (regulations on fruit juices, concentratedfruit juice and dried fruit juice) of 1982.
(b) Verordnung ueber Fruchtnektar and Fruchtsirup, regulations on fruitnectar and syrups, 1982.
The Netherlands
25. Customs Duties. The EEC common external tariff is applied. Thereare currently no quantitative restrictions on imports of fruit juices, withthe exception of grape juice.
26. Food Laws and Regulations. Food regulations applicable to fruitjuices are included in the EEC Council Directive 75/726. In addition, salesof fruit juice beverages are governed by the general food law, Warenwet, of28 December 1935. It is strongly recommended that Philippine exporters ensurethat their goods comply with the specifications required by agents andimporters before shipping to this market.
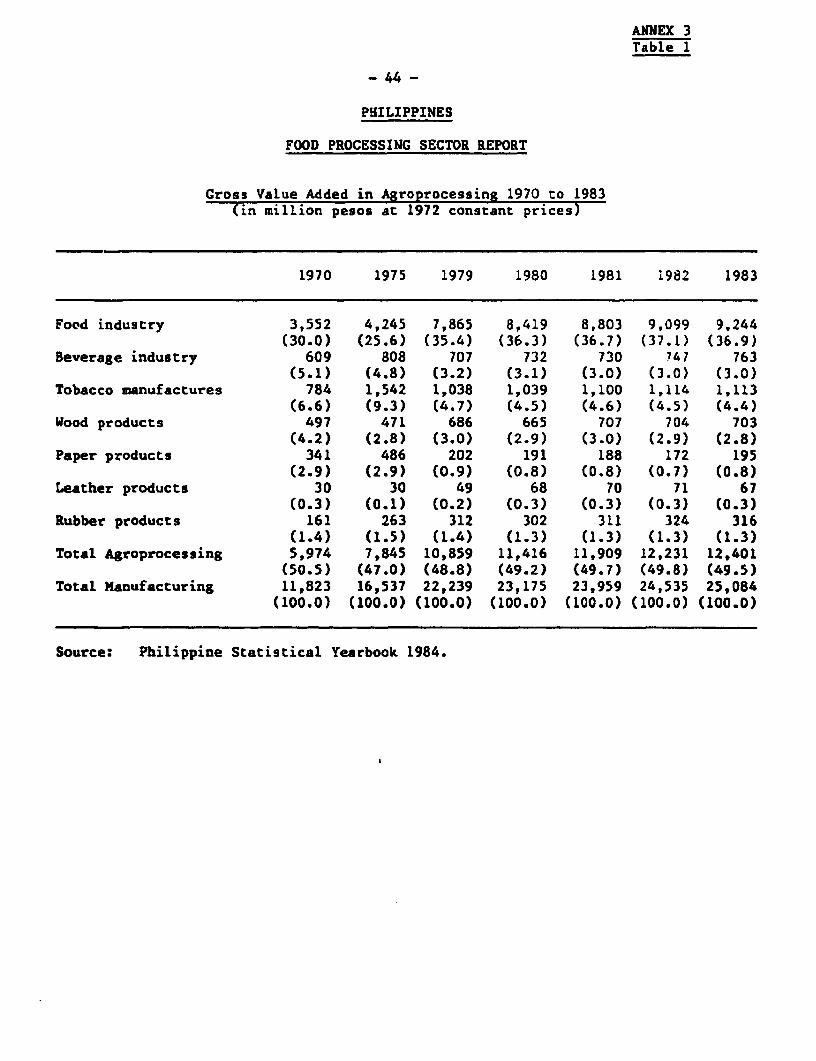
ANNEX 3Table 1
- 44 -
PHILIPPINES
FOOD PROCESSING SECTOR REPORT
Cross Value Added in Agroprocessing 1970 to 1983(in million pesos at 1972 constant prices)
1970 1975 1979 1980 1981 1982 1983
Food industry 3,552 4,245 7,865 8,419 8,803 9,099 9,244(30.0) (25.6) (35.4) (36.3) (36.7) (37.1) (36.9)
Beverage industry 609 808 707 732 730 ?47 763(5.1) (4.8) (3.2) (3.1) (3.0) (3.0) (3.0)
Tobacco manufactures 784 1,542 1,038 1,039 1,100 1,114 1,113(6.6) (9.3) (4.7) (4.5) (4.6) (4.5) (4.4)
Wood products 497 471 686 665 707 704 703(4.2) (2.8) (3.0) (2.9) (3.0) (2.9) (2.8)
Paper products 341 486 202 191 188 172 195(2.9) (2.9) (0.9) (0.8) (0.8) (0.7) (0.8)
Leather products 30 30 49 68 70 71 67(0.3) (0.1) (0.2) (0.3) (0.3) (0.3) (0.3)
Rubber products 161 263 312 302 311 324 316(1.4) (1.5) (1.4) (1.3) (1.3) (1.3) (1.3)
Total Agroprocessing 5,974 7,845 10,859 11,416 11,909 12,231 12,401(50.5) (47.0) (48.8) (49.2) (49.7) (49.8) (49.5)
Total Kanufacturing 11,823 16,537 22,239 23,175 23,959 24,535 25,084(100.0) (100.0) (100.0) (100.0) (100.0) (100.0) (100.0)
Source: Philippine Statistical Yearbook 1984.
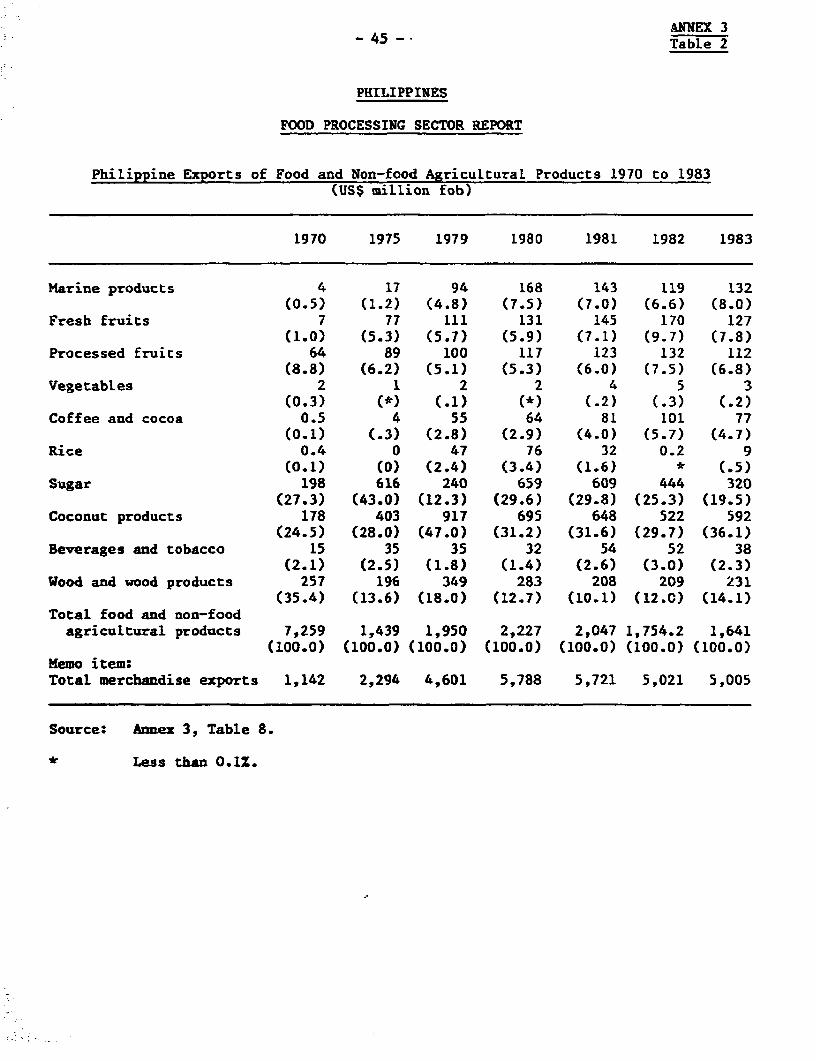
ANNEX 3Table 2
PHILIPPINES
FOOD PROCESSING SECTOR REPORT
Philippine Exports of Food and Non-food Agricultural Products 1970 to 1983(US$ million fob)
1970 1975 1979 1980 1981 1982 1983
Marine products 4 17 94 168 143 119 132(0.5) (1.2) (4.8) (7.5) (7.0) (6.6) (8.0)
Fresh fruits 7 77 111 131 145 170 127(1.0) (5.3) (5.7) (5.9) (7.1) (9.7) (7.8)
Processed fruits 64 89 100 117 123 132 112(8.8) (6.2) (5.1) (5.3) (6.0) (7.5) (6.8)
VegetabLes 2 1 2 2 4 5 3(0.3) (*) (.1) (*) (.2) (.3) (.2)
Coffee and cocoa 0.5 4 55 64 81 101 77(0.1) (.3) (2.8) (2.9) (4.0) (5.7) (4.7)
Rice 0.4 0 47 76 32 0.2 9(0.1) (0) (2.4) (3.4) (1.6) * (.5)
Sugar 198 616 240 659 609 444 320(27.3) (43.0) (12.3) (29.6) (29.8) (25.3) (19.5)
Coconut products 178 403 917 695 648 522 592(24.5) (28.0) (47.0) (31.2) (31.6) (29.7) (36.1)
Beverages and tobacco 15 35 35 32 54 52 38(2.1) (2.5) (1.8) (1.4) (2.6) (3.0) (2.3)
Wood and wood products 257 196 349 283 208 209 231(35.4) (13.6) (18.0) (12.7) (10.1) (12.0) (14.1)
Total food and non-foodagricultural products 7,259 1,439 1,950 2,227 2,047 1,754.2 1,641
(100.0) (100.0) (100.0) (100.0) (100.0) (100.0) (100.0)Memo item:Total merchandise exports 1,142 2,294 4,601 5,788 5,721 5,021 5,005
Source: Annex 3, Table 8.
* Less than 0.1Z.

ANNEX 3-46- Table 3-46-
PEILIPPINES
FOOD PROCESSING SECTOR REPORT
Philippine Imports of Food and Non-food Agricultural Products 1970 to 1983(US$ millions cif)
1970 1975 1979 1980 1981 1982 1983
Live animals 0.1 0.4 3 3 4 4 4(0.1) (0.1) (0.4) (.4) (.5) (0.4) (0.5)
Heat products 5 10 17 12 16 20 13(2.8) (2.1) (2.5) (1.4) (2.0) (2.2) (1.6)
Dairy products 32 62 96 112 135 167 128(17.9) (13.1) (14.2) (13.6) (16.4) (18.3) (16.1)
Fish products 17 33 20 26 30 38 7(9.5) (7.0) (3.0) (3.2) (3.6) (4.2) (0.9)
Cereal products 37 175 144 214 230 242 249(20.7) (37.0) (21.3) (26.0) (27.9) (26.5) (31.3)
Fruit and vegetableproducts 4 7 10 11 14 15 14
(2.2) (1.5) (1.5) (1.3) (1.7) (1.6) (1.8)Coffee, cocoa, teaspices 2 2 17 27 46 43 21
(1.1) (0.4) (2.5) (3.3) (5.6) (4.7) (2.6)Feedstuffs 8 25 42 81 81 111 81
(4.5) (5.3) (6.2) (9.9) (9.9) (12.1) (10.2)Beverages and tobacco 9 23 48 48 53 65 72
(5.0) (4.9) (7.1) (5.8) (6.4) (7.1) (9.0)Non-food agriculturalproducts 65 135 278 288 214 209 207
(36.3) (28.6) (41.2) (35.1) (26.0) (22.9) (26.0)Total food and non-foodagricultural products 179.1 472.4 675 822 823 914 796
(100.0) (100.0) (100.0) (100.0) (100.0) (100.0) (100.0)
Memo Item:Total merchandise imports 1,286 3,459 6,142 7,727 7,946 7,667 7,487
Source: Annex 3, Table 9.
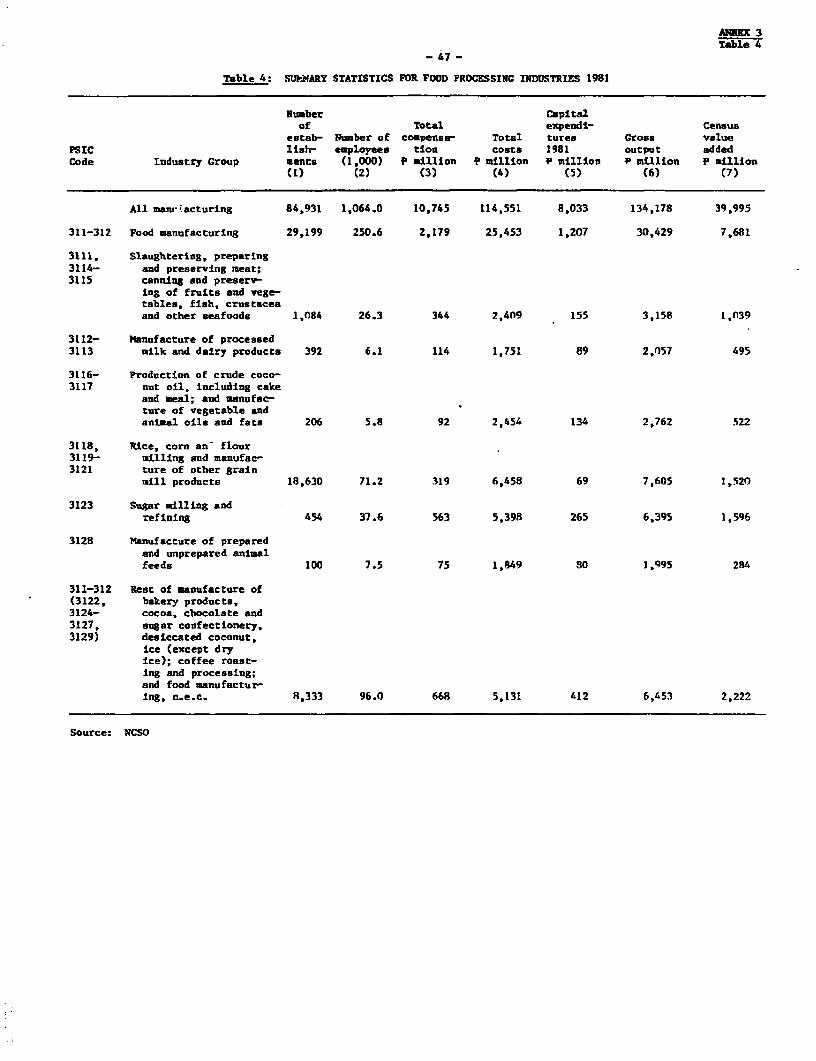
ANNEX 3Table 4
-47 -
Table 4: SUMMAMY STATISTICS FOR FOOD PROCESSING INDUSTRIES 1981
Number Capitalof Total expendl- Census
estab- Number of coapensw- Total tures Gross valuePSIC limb- employees tion costs 1981 output addedCode Industry Group Ments (1,000) P million P million P million X million P million
(1) (2) (3) (4) (5) (6) (7)
All man-iacturing 84,931 1,064.0 10,745 114,551 8,033 134,178 39,995
311-312 Food manufacturing 29,199 250.6 2,179 25,453 1,207 30,429 7,681
3111, Slaughtering, preparing3114- and preserving meat;3115 canning and preserv-
ing of fruits and vege-tables, fish, crustaceaand other seafoods 1,084 26.3 344 2,409 155 3,158 1,n39
3112- Manufacture of processed3113 milk and dairy products 392 6.1 114 1,751 89 2,057 495
3116- Production of crude coco-3117 nut oil, including cake
and meal; and manufac-ture of vegetable andanimal oils and fats 206 5.8 92 2,454 134 2,762 522
3118, Rice, corn an- flour3119- milling and manufac-3121 ture of other graIn
mill products 18,630 71.2 319 6,458 69 7,605 1,520
3123 Sugar milling andrefining 454 37.6 563 5,398 265 6,395 1,596
3128 Manufacture of preparedand unprepared animalfeeds 100 7.5 75 1,849 S0 1,Q95 284
311-312 Rest of manufacture of(3122, bakery products,3124- cocoa, chocolate and3127, sugar confectionery,3129) desiccated coconut,
ice (except dryIce); coffee roast-ing and processing;and food manufactur-ing, n.e.c. 8,333 96.0 668 5,131 412 6,453 2,222
Source: NCSO

ANNEX 3-48 - Table 5
PHILIPPINES
FOOD PROCESSING SECTOR REPORT
Production of Selected Products 1971 to 1983(in '000 m tons)
1971 1975 1979 1980 1981 1982 1983
Corn 2,012 2,514 3,090 3,123 3,109 3,290 3,126Soybeans 1 6 8 9 10 11 8Banana 1,035 1,686 3,582 3,977 4,073 4,077 3,668Guyabano 7 7 10 10 10 11 11Jackfruit 64 84 89 91 97 94 82Mango 137 239 363 377 367 426 400Papaya 54 61 85 95 104 94 80Pineapple 234 424 605 1,281 1,293 1,242 964Coffee 49 91 115 125 147 171 139Cacao 4 3 4 4 4 5 6
Source: Bureau of Agricultural Economics.

ANNEX 3Table 6
- 49 -
PHILIPPINES
FOOD PROCESSING SECTOR REPORT
World Imports of Fruit Juices by Major Countries, 1977 and 1981(UV$ 000)
1977 % of 1981 X oftotal total
USA 88,941 9.3 411,220 /a 16.2 /fGermany, Fed. Republic 162,763 .17.0 273,859 15.4Canada 93,783 9.8 193,842 10.9United Kingdom 91,075 9.5 182,955 10.3Saudi Arabia 108,644 11.2 161,824 9.2The Netherlands 77,610 8.1 145,075 8.3France 68,650 7.2 98,817 5.6Belgium 29,989 3.1 65,057 3.1Sweden 50,745 /b 5.3 47,695 2.8Switzerland /c 19,508 7T 2.0 34,504 1.9Libya /c 17,596 1.8 34,500 /b 1.9Austria /c 22,665 2.4 27,880 1.6Japan 8,980 0.9 26,818 1.5Denmark 22,419 2.3 26,030 1.5Finland 12,851 1.3 20,245 1.2Israel /c 9,272 1.0 18,227 1.1Eongkong /c 8,493 0.9 17,761 1.1Norway 10,903 /b 1.1 17,664 1.0Yemen Ic 10,000 Tb 1.0 17,500 /b 1.0Australia 4,794 /b 0.5 16,000 7T 0.9USSR fc 3,621 0.4 15,067 7T 0.8Italy 3,621 0.4 14,351 0.8Kuwait /c 15,857 1.7 13,000 /b 0.7Ireland 4,438 0.5 11,352 0.6United Arab Emirates /c 10,176 1.1 11,000 /e 0.6
Total Imports into25 Major markets L& 957,425 100.0 1,891,243 100.0
/a 1981 imports increased substantially due to disease in Florida citrus crop.'verage imports 1980/81 suggest $288,133 for 1981.
/b ITC estimates.7- Import statistics include vegetable juices, believed to be minimal.7i Cootrade.Te National statistics.7? Calculation based on /a and adjusted pro rata to total $1,768,156.7j Estimated to represent over 95X of world imports.
Source: Comtrade data base system, UNSO/ITC, 1982.
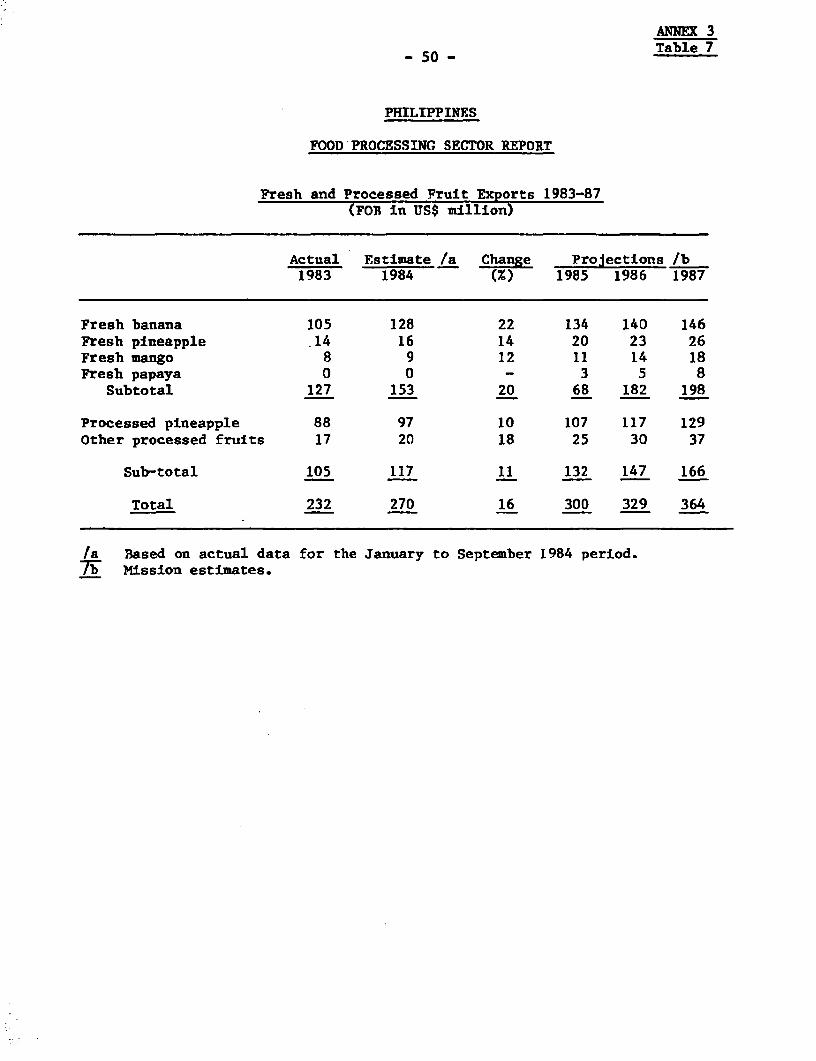
ANNEX 3
-50- Table 7
PHILIPPINES
FOOD'PROCESSING SECTOR REPORT
Fresh and Processed Fruit Exports 1983-87(FOR in US$ million)
Actual Estimate /a Change Projections /b1983 1984 (X) 1985 1986 1987
Fresh banana 105 128 22 134 140 146Fresh pineapple .14 16 14 20 23 26Fresh mango 8 9 12 11 14 18Fresh papaya 0 0 - 3 5 8
Subtotal 127 153 20 68 182 198
Processed pineapple 88 97 10 107 117 129Other processed fruits 17 20 18 25 30 37
Sub-total 105 117 11 132 147 166
Total 232 270 16 300 329 364
/a Based on actual data for the January to September 1984 period.'b7 Mission estimates.
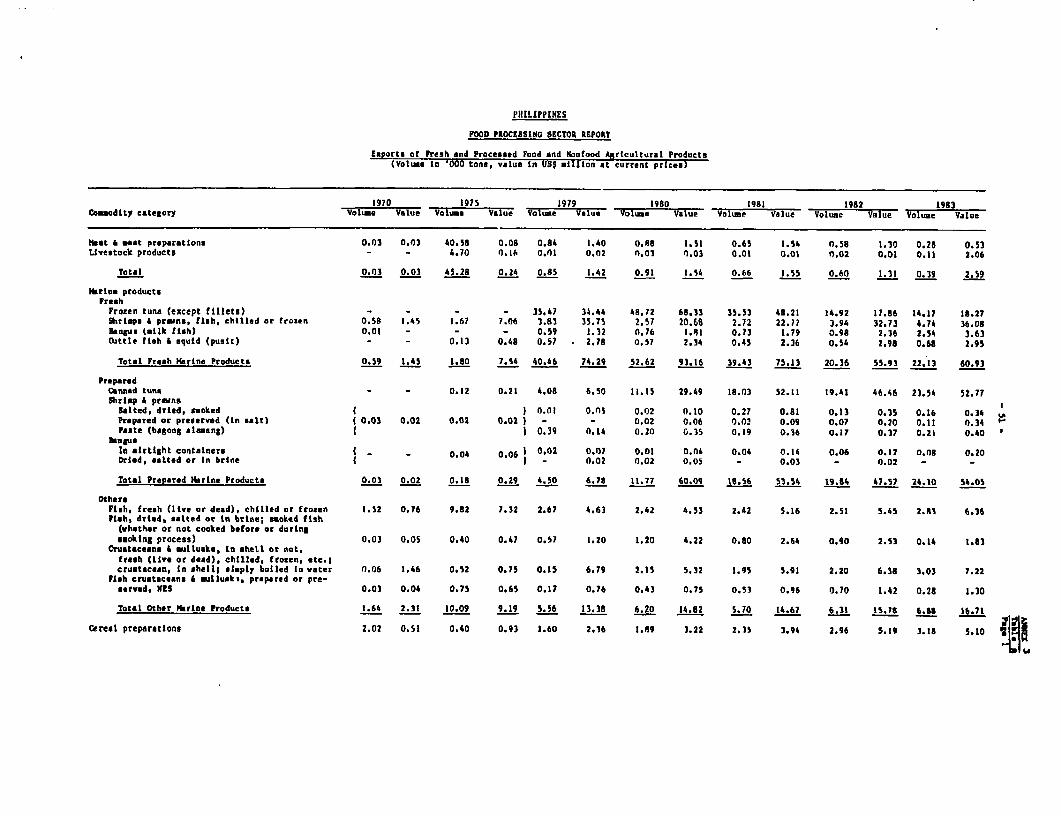
PHILIPPINES
FOOD PROCtSSING SECTOR REPORT
Exporta of Fresh and Processed Food and Nonfood Agrtcultural Products(Vl. n'000 tons, value In Usi million at curentpies
1970 1975 1979 1980 1981 1982 1983Commodity category Volte Value Volume Value Volume Vsluf Voluwe -- Value Volume Value Volume Value Volume Value
Heat a meat preparations 0.03 0.03 40.58 0.08 0.84 1.40 0.88 1.51 0.65 3.54 0.58 1.30 0.28 0.53Livestock products - - 4.70 0.16 O.l 0.02 n.03 '3.01 0.01 0.01 0.02 0.01 0.11 2.06
Total 0.03 0.03 45.28 0.24 0.85 1.42 0.91 1.54 0.66 1.55 0.60 1.31 0.39 2.59
Marine productaFresh
Frozen tuna (except fillets) - - - 35.47 34.44 48.72 68.33 35.53 48.21 14.92 17.86 14.17 18.27Shrimps 6 prmns, fish, chilled or frozen 0.58 1.45 1.67 7.06 3.83 35.75 2.57 20.68 2.72 22.77 3.94 32.73 4.74 38.088 ngus (mlIk fish) 0.01 - - - 0.59 1.32 0.76 1.81 0.73 1.79 0.98 2.36 2.54 3.63Olttle fish 6 squid (pusht) - - 0.13 0.48 0.57 * 2.78 0.57 2.34 0.45 2.36 0.56 2.98 0.68 2.95
Total Freah Marine Products 0.59 1.45 1.80 7.54 40.46 74.29 52.62 93.16 39.43 75.13 20.36 55.93 22.13 60.93
PreparedCanned tuna - - 0.12 0.21 4.08 6.50 11.15 29.49 18.03 52.11 19.41 46.46 23.54 52.77Shriep A prans
Salted, dried, smoked 0.01 o0.s 0.02 0.10 0.27 0.81 0.13 0.35 0.16 0.34 vPrepared or preserved (in salt) ( 0.03 0.02 0.02 0.02 ) - - 0.02 0.06 0.03 0.09 0.07 0.20 0.11 0.34 -Paste (begong aloang) I I 0.39 0.14 o.20 C.35 0.19 0.36 0.17 0.37 0.21 0.40
kngusIr airtight containers I _ _ 0.04 0.06 0.02 0.07 0.01 O.04 0.04 0.14 0.06 0.17 0.08 0.20Dried, ealted or In brine | | - 0.02 0.02 0.05 - 0.03 - 0.02 - -
Total Prep2red Marine Products 0.03 0.02 0.18 0.29 4.50 6.78 11.77 60.09 18.56 53.54 19.84 47.57 24.10 54.05
OthersFish, fresh Clive or dead), chilled or frozen 1.52 0.76 9.82 7.32 2.67 4.63 2.42 4.53 2.42 5.16 2.51 5.45 2.13 6.36Fish, dried, satted oe in brine; soked fish
(vhether or not cooked before or duringsmoking process) 0.03 0.05 0.40 0.47 0.57 1.20 1.20 4.22 0.80 2.64 0.90 2.53 0.14 1.83
Cruataceans 6 oultuske, tn ahell or not,fresh (live or dead), chilled, frozen, etc.;crustacean, In shell1 simply boiled in vater 0.06 1.46 0.52 0.75 0.15 6.79 2.15 5.32 1.95 5.91 2.20 6.38 3.03 7.22
Fish crutaceans 6 mullueks, prepared or pre-served, MES 0.03 0.04 0.75 0.65 0.17 0.76 0.43 0.75 0.53 0.96 0.70 1.42 0.28 1.30
Total Other Marine Products 1.64 2.31 10.09 9.19 5.56 13.38 6.20 14.82 5.70 14.67 6.31 15.78 6.88 16.71
Cereal preparations 2.02 0.51 0.40 0.93 1.60 2.16 1.89 3.22 2.35 3.94 2.96 5.19 3.18 5.1o0- W3

1970 1975 1979 1980 1981 1982 1983-_odity category Volume Value Voloe Value Volu e Value Vole e Value Volu e Value Volume Value Volu e Ylue
Fruitsfresh
Bananas 106.19 5.90 822.74 713.10 856.61 96.68 922.71 114.18 868.56 124.02 926.68 146.11 643.73 104.73IHngoes 6.54 1.01 5.51 1.78 7.46 4.89 8.96 6.48 7.21 5.91 9.64 8.14 8.67 8.67Pineapples 3.29 0.13 43.64 2.03 108.32 9.43 114.76 10.13 134.78 15.04 142.08 15.86 127.28 13.67Papayas - - 0.05 0.03 - - - - - - - - - -
Total Fresh Fruits 116.62 7.04 871.94 76.94 974.39 110.97 1,046.43 110.79 1,010.55 144.97 1,078.40 170.11 779.68 127.07
ProcessedPineappleJuice 11.80 1.25 17.95 2.68 15.31 3.20 25.09 5.80 20.25 6.24 39.86 9.24 23.25 4.41Other. (dried, drained, concontratas or in
syrup) 97.66 27.76 127.29 37.51 210.42 83.28 205.54 91.43 186.12 95.54 189.90 98.36 162.81 83.38Fruit purees & fruit paste - - 0.24 0.13 1.32 0.88 1.84 1.64 1.69 1.89 2.00 2.94 1.74 1.99Jun 0.01 - 0.19 0.10 1.47 0.80 1.61 0.87 1.51 1.01 1.94 1.17 1.07 0.68Banana cracker. 0.03 0.09 - - 1.51 2.13 3.72 4.81 4.88 6.21 6.18 8.36 5.99 7.18lixed fruits 2.31 0.94 5.45 2.57 7.43 4.27 10.12 6.76 7.00 5.34 7.08 5.31 3.32 2.60OthersFruits 4 nute (not Including oil nuts 4
pineapple). dried - 7.06 - - 1.03 1.62 1.36 2.12 1.35 2.24 1.25 2.37 1.41 2.50Fruit preserved & fruit preparation 112.27 27.26 152.97 45.74 3.40 3.62 2.84 4.09 2.90 4.18 3.66 5.23 3.72 4.59
Total Processed Fruits 124.08 64.36 304.09 88.73 241.89 99.80 252.12 117.52 225.70 122.72 251.87 131.98 203.31 112.33
Vegetables
Tomtoes, fresh or chLiled - - 0.44 0.18 0.29 0.14 0.05 0.02 0.22 0.11 0.27 0.07 0.16 0.05Vegetables, fresh, frozen or simply preserved - 0.15 - 0.76 0.80 0.37 1.09 0.54 0.51 .46 3.59 0.42 4.67 1.99Onione, dried - - - - 5.03 1.18 2.37 0.59 9.77 3.41 7.02 2.52 0.72 0.25Veagtables, roots & tubers, prepared or pre-
served, NES - - - - 0.61 0.72 0.69 0.89 0.43 0.05 0.58 1.61 0.94 1.10
Total Vegetables - - - - 5.64 1.90 3.06 1.48 30.20 3.46 7.60 4.13 1.66 1.35
Coffee
PAv beans 0.14 0.09 2.31 2.58 15.93 43.78 15.80 44.58 20.53 39.38 24.59 49.42 21.55 46.69Processed - - 0.01 0.08 0.27 2.92 0.17 2.01 0.19 1.93 0.14 1.37 0.21 1.90
Total Coffee 0.14 0.09 2.32 2.66 16.20 46.70 15.97 46.59 20.72 41.31 24.73 50.79 21.76 46.59
Cocoa
Mc Cor (cocoa butter) 0.29 0.41 0.71 1.80 1.58 8.31 2.36 16.58 6.04 37.12 7.95 44.15 4.75 20.99Others (cocoa products) - - - - - - 1.00 1.34 2.99 2.64 7.63 5.65 4.06 2.61
Total Cocoa 0.29 0.41 0.71 1.80 1.58 8.31 3.36 17.92 9.03 39.76 15.58 49,80 9.81 28.60
Rice 1.91 0.41 0.02 0.03 16S.60 46.74 263.37 76.35 94.77 31.61 0.45 0.20 40.40 9.33 1 I fCoconut ,ilcaka - - - - 541.30 85.52 545.19 81.39 620.36 80.76 586.57 72.12 550.84 72,01 oSugar 1,855.60 1988.30 1,647.40 616.20 - 240.00 - 658.70 - 6088.90 - 445.50 - 320.50Coconut oll 339.20 97.60 614.40 230.30 803.50 742.50 918.50 566.80 1,039.90 533.50 921.20 401.00 998.20 515.10Copra 447.40 80.60 761.20 172.30 144.70 89.10 121.40 47.20 108.30 33.60 177.70 49.20 16.10 4.40Beverages and tobacco - 15.30 - 35.90 - .5.30 - 31.70 - 53.80 - 52.40 - 37.70Ibod and vood products - 257.40 - 196.10 - 348.80 - 282.90 - 208.20 - 208.60 - 23n.60
Total Food and Nonfood Aaricultural Products - 724.20 - 1,463.00 - 2.067.60 - 2,330.30 - 2,169.70 1,840..0 - 1,743.80
Sourcel Philippine Yearbook of Foreign Trade Statistics, various Issues.
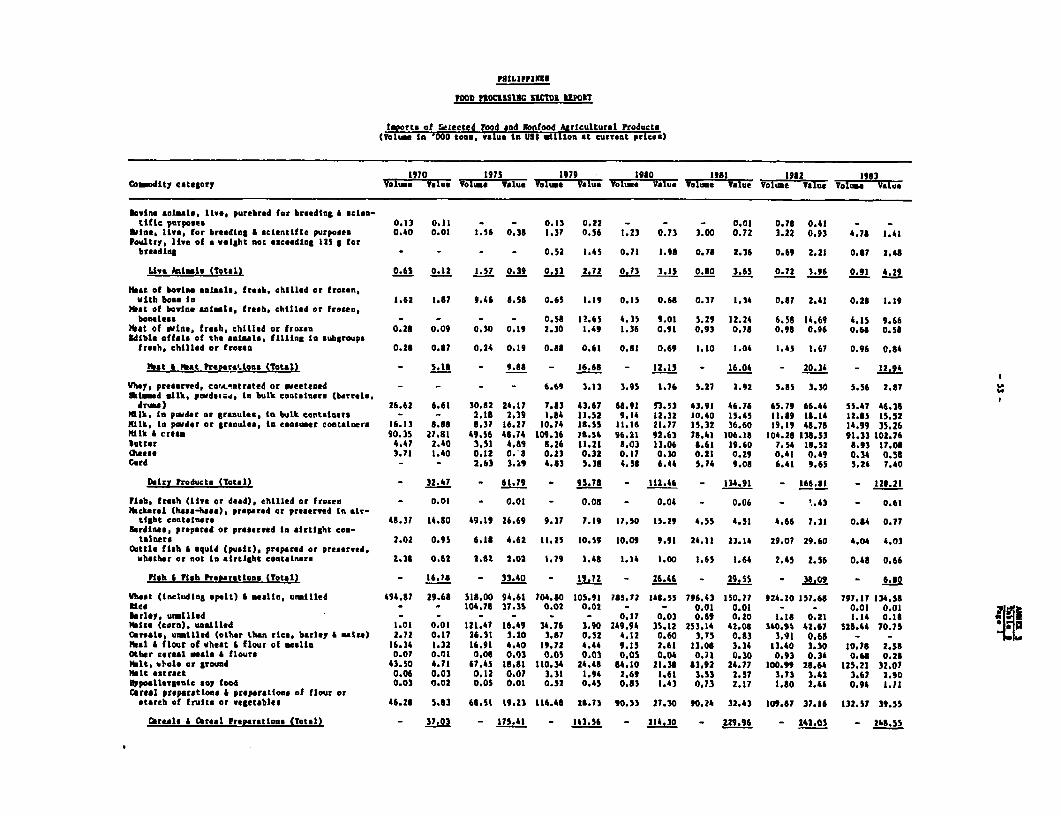
FOOD PROCISSIUC SICTOZ UPOSt
fyorts of (elected rood and Nionfood 4ricultural Products(Faa - In 000 tons, value in US$ cilion at eurrent prices)
1970 1975 1979 1980 ISI 1982 1983Comodity category Yolum T Voua bumor VAlue Volu o Value Volue Va lue Val me Value Voliue Value VoTu a e Vr
Bwoine anials, livtr purebred for breeding & netan-tiftc purpo,es 0.13 0.11 - - 0.13 0.22 - - - 0.01 0.76 0.43 -
Silas live. for breeding A scientifte purposes 0.40 0.01 1.56 0.36 1.37 0.56 1.23 0.73 3.00 0.72 3.22 0.93 4.76 1.43Poultrty, live of a weight not esceedlng 125 g for
brading - - - - 0.52 1.45 0.71 1.98 0.78 2.36 0.69 2.21 0.87 2.48
Livs Infils (total) 0.6S 0.12 1.57 0.39 0.53 2.72 0.73 3.15 0.80 3.65 0.72 3.96 0.91 4.29
hrat of bovine animals. fresh, chilled or frozen,with bone in 1.62 1.87 9.46 6.58 0.65 1.39 0.15 0.68 0.37 1.34 0.87 2.41 0.28 1.19
Hat of bovine nimle, fresh, chilled or froten,boneless - - - 0.58 12.65 4.35 9.01 5.29 12.24 6.58 14.69 4.35 9.66
Hett of wine, fresh, chilled or frozen 0.28 0.09 0.30 0.19 2.30 1.49 1.36 0.91 0.93 0.78 0.98 0.96 0.6 0.56Edible offals of the omaln, fillias In subgroups
fresh, chilled or frosen 0.28 0.87 0.24 0.19 0.66 0.61 0.81 0.69 1.10 1.04 1.43 1.67 0.96 0.84
Most a wiat Pr.parA.tqnn (Total) - 5.18 - 9.88 - 16.68 - 12.15 - 16.04 - 20.34 - 12.94
Vhey, preserved, eorLutntrated or sweetened - - - - 6.69 3.13 3.95 1.76 5.27 2.92 5.85 3.30 5.56 2.67kiaed milk, poldetca, In bulk containers (barrels.
dr'm) 26.62 6.61 30.62 24.17 7.83 43.67 68.91 53.53 43.91 46.76 65.79 66.44 55.47 46.38Mlk. In pewder or granules, tn bulk eontetners - - 2.16 2.39 1.84 11.52 9.14 12.32 10.40 15.45 11.89 18.14 12.85 15.52lIk, in pwder or granules, ti consumer contaneArs 16.13 8.68 6.37 16.27 10.74 18.55 11.16 21.77 15.32 36.60 19.19 48.78 14.99 35.26
rdlk t cream 90.35 21.6t 49.56 46.74 109.36 76.54 96.21 92.63 78.41 106.18 104.28 133.53 91.33 102.76Suttor 4.47 2.40 3.51 4.69 8.26 11.21 1.03 13.06 8.61 19.60 7.54 16.52 8.93 17.08awes 3.71 1.40 0.12 0.3 0.23 0.32 0.17 0.30 0.21 0.29 0.41 0.49 0.34 0.56Curd - - 2.63 3.19 4.63 5.38 4.58 6.44 5.74 9.06 6.41 9.65 5.24 7.40
Dairy products (Total) - 32.47 - 61.79 - 95.76 - 312.46 - 134.91 - 166.61 - 128.21
Flsb. fresh (live or dead). chilled or frozen - 0.01 - 0.01 - 0.05 - 0.04 - 0.06 - ~.43 - 0.61Nachrmel (hasa-hama), prepared or preserved In air-
tight containers 48.37 14.80 49.19 26.69 9.37 7.19 17.50 15.29 4.55 4.51 4.66 7.31 0.84 0.77Sardines, prepnred or preserwd In airtight con-tainers 2.02 0.95 6.18 4.62 11.25 10.59 10.09 9.91 24.11 23.14 29.07 29.60 4.04 4.03
Oattle fioh 6 aquid (puast), prepared or preserved,whether or not in airtight containers 2.36 0.62 2.62 2.02 1.79 1.48 1.14 1.00 1.65 1.64 2.45 2.56 0.48 0.66
Fish 6 7ish tPraparations (Total) - 16.7S - 33.40 - 19.72 - 26.46 - 29.5S - 38.09 - 6.50
WHtet (including spelt) 6 eall,n unetiled 494.87 29.68 518.00 94.61 704.80 105.91 765.72 138.55 796.43 150.77 924.10 157.68 797.17 134.58Rice - - 104.76 37.35 0.02 0.02 - - 0.01 0.01 - - 0.01 0.01 31;@ >brlcy. uuilled _- - 0.17 0.03 0.69 0.20 1.18 0.21 1.14 0.18 ;6otie (corn). unailled 1.01 0.01 121.47 16.49 34.76 3.90 249.94 35.12 253.14 42.06 340.95 42.67 528.44 70.75
crealos, urnilled (other than rice, barley A matte) 2.72 0.17 26.31 3.20 3.S7 0.52 4.12 0.60 3.75 0.83 3.91 0.68 - - T2tbal & flour of wheat 6 flour of serlin 16.34 1.32 16.91 4.40 19.72 4.44 9.15 2.61 13.06 3.34 13.40 3.30 10.78 2.58Other cereal maIe 6 flours 0.07 0.01 0.06 0.03 0.05 0.03 0.05 0.04 0.71 0.30 0.93 0.34 0.66 0.26Nilt, stole or ground 43.50 4.71 67.45 18.81 110.34 24.48 64.10 21.38 63.92 24.77 100.99 28.64 125.21 32.07lalt astract 0.06 0.03 0.12 0.07 3.31 1.94 2.69 1.61 3.53 2.57 3.73 3.42 3.67 2.90
nypoallargontc soy food 0.03 0.02 0.05 0.01 0.52 0.45 0.83 1.43 0.73 2.17 3.80 2.44 0.94 1.71Cereal pteparatloas 4 preparations of flour orstarch of fruits or vegetables 46.28 5.63 66.51 19.21 116.46 26.73 90.33 27.30 90.24 32.43 109.67 37.16 132.57 39.55
Cbrealo & Cbreal Preparations (Total) - 37.03 - 175.41 - 143.56 - 214.30 - Z29.96 - 242.03 - 246.55
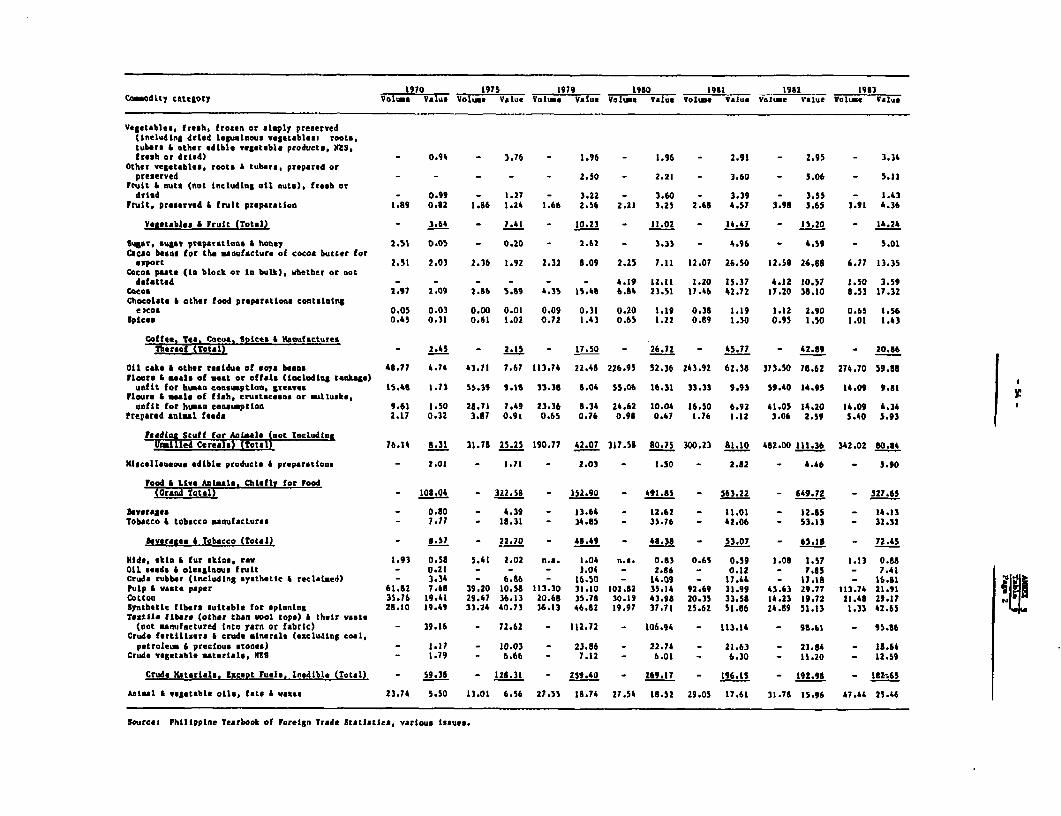
1910 1975 1979 1950 o 95 1982 1963Co_odity tattioty Voitma Value Vol.me Value Volume Value Valu e Value Volume value Volui Value Volume Value
Vegetables, fresh, frozen or simply preserved(Including dried lepainous vegetables: roots,tubers & other edible vegetable productes, AS.fresh or dried) _ 0.94 3 3.76 - 1.96 _ 1.96 - 2.91 - 2.95 - 3.3,
Other vegetablesa roots A tubers, prepared orpreserved - - - - - 2.50 - 2.21 - 3.60 - 5.06 - 5.31
Fruit 4 nuts (not including oil nuts), fresh ordsred - 0.99 - 1.27 - 3.22 - 3.60 - 3.39 - 3.55 - 1.43
Fruit, preserved & fruit preparatioo 1.89 0.82 1.86 1.24 1.66 2.56 2.21 3.25 2.5 4.57 3.98 3.65 3.91 *.36
Vesetablee 5 Fruit (Total) - 3.64 - 7.41 - 10.23 - 11.02 - 14.47 - 15.20 - 14.24
Sugxar. suer ptepamstious t honey 2.51 0.05 - 0.20 - 2.62 - 3.33 - 4.96 - 4.59 - 5.01Cacso beans for the manufacture of cocoa butter for
export 2.51 2.03 2.36 1.92 2.32 8.09 2.25 7.11 12.07 26.50 12.58 26.88 6.77 13.35CoAoa paste (In block or In bulk), whether or notdefatted - - - - - - 4.19 12.11 1.20 15.37 4.12 30.57 1.50 3.59
Cooa 2.97 2.09 2.86 5.89 4.35 15.48 6.84 23.51 17.46 42.72 17.20 38.10 8.53 17.32Chocolate 6 other food preparatione containing
excoa 0.05 0.03 0.00 0.01 0.09 0.31 o.20 1.19 0.38 1.19 1.12 2.90 0.65 1.56Spice. 0.45 0.31 0.61 1.02 0.72 1.43 0.65 1.22 0.89 1.30 0.95 1.50 1.01 1.43
Coffee Tea. Cocoa, Spices & ManufacturesTbereof Trot.l) - - 2.45 - 2.15 - 17.50 - 26.72 - 45.77 - 42.89 - 20.e6
Oil cake & other residue of soya beans 48.77 4.74 43.71 7.67 113.74 22.48 226.95 52.36 243.92 62.38 373.50 78.62 274.70 59.88Flours 6 meals of meat or offale (including tankage)
uafit for busan consumption, greaves IS.48 1.71 55.39 9.16 33.3e 8.04 55.06 16.31 33.33 9.93 59.40 14.95 14.09 9.81Flours 6 meals of flah, crustaceans or eulluexs,
unfit for huxmn conxumption 9.61 1.50 28.71 7.49 23.36 8.34 24.62 10.04 16.50 6.92 41.05 14.20 14.09 4.34Prepared animal feeds 2.17 0.32 3.87 0.91 0.65 0.76 0.98 0.47 1.76 1.12 3.06 2.59 5.40 5.93
Feedlnj 5tuff eor Anlmals (not Includtng.ntttilled CereaIx) (Total) 76.14 8.31 31.78 25.25 190.77 42.07 317.58 80.75 300.23 31.10 482.00 131.36 342.02 80.54
MeIscellaneous edible products 4 preparations - 2.01 - 1.71 - 2.03 - 1.50 - 2.82 - 4.40 - 5.90
Food S Live Animals. Chiefl for foodMWrcd ~Totcl) - 108.04 - 322.58 - 352.90 - 491.65 - 563.22 - 649.72 - 527.65
sevaerage - 0.80 - 4.39 - 13.64 - 12.62 - 11.01 - 12.85 - 14.13Tobacco 4 tobacco manufactures - 1.71 - 18.31 - 34.85 - 35.76 - 42.06 - 53.13 - 32.32
severeags £ Tobacco (Total) - S.57 - 22.70 - 48.49 - 48.38 - 53.07 - 65.18 - 72.45
Hide, skin * fur skins, raw 1.93 0.58 5.41 2.02 n.e. 1.04 n.e.. 0.83 0.6S 0.59 1.08 1.57 1.13 0.88011 seeds 4 oleaginous fruit - 0.21 - - - 3.04 - 2.86 - 0.12 - 7.85 - 7.41Crude rubber (including systhetic 4 reclaimed) - 3.34 - 6.86 - 16.50 - 14.09 - 17. 1 - 17.16 - 16.812PuLp 6 wants paper 61.82 7.68 39.20 10.58 113.30 31.10 OZ.8Z 35.14 92.69 31.99 43.63 29.77 113.74 21.91Cotton 35.76 19.41 29.47 36.13 20.68 35.78 30.19 43.98 20.35 33.58 14.23 19.72 21.48 29.17 LSynthetic fibers suitable for spinnins 28.10 19.49 33.24 40.73 36.13 46.82 19.97 37.71 25.62 51.86 Z4.89 51.13 1.33 42.65Textille fibers (other than wool tops) 6 their waste
(not mnufactured Into yarn or fabric) - 39.16 - 72.62 - 112.72 - 106.94 - 113.14 - 986.1 - 95.6Crude fertilliers S crude minerals (excluding coal,
petroleum 6 precioue stones) - 1.17 - 10.03 - 23.86 - 22.74 - 21.63 - 21.84 - 18.64Crude vegetable materals, NIS - 1.79 - b.6b - 7.12 - 6.01 - 6.30 - 13.20 - 12.59
Crude Materials, Except Fueles Inedible (Total) - 59.38 - 128.31 - 259.40 - Z69.17 - 196.L5 - 192.96 - 182065
Animal * vegetable oils, fats * wates 23.74 5.50 13.01 6.56 27.55 18.74 27.54 18.52 29.05 17.61 31.78 15.96 47.44 25.46
Sourcet Philippine Yearbook of Foreign Trade Statistics, various lssues.
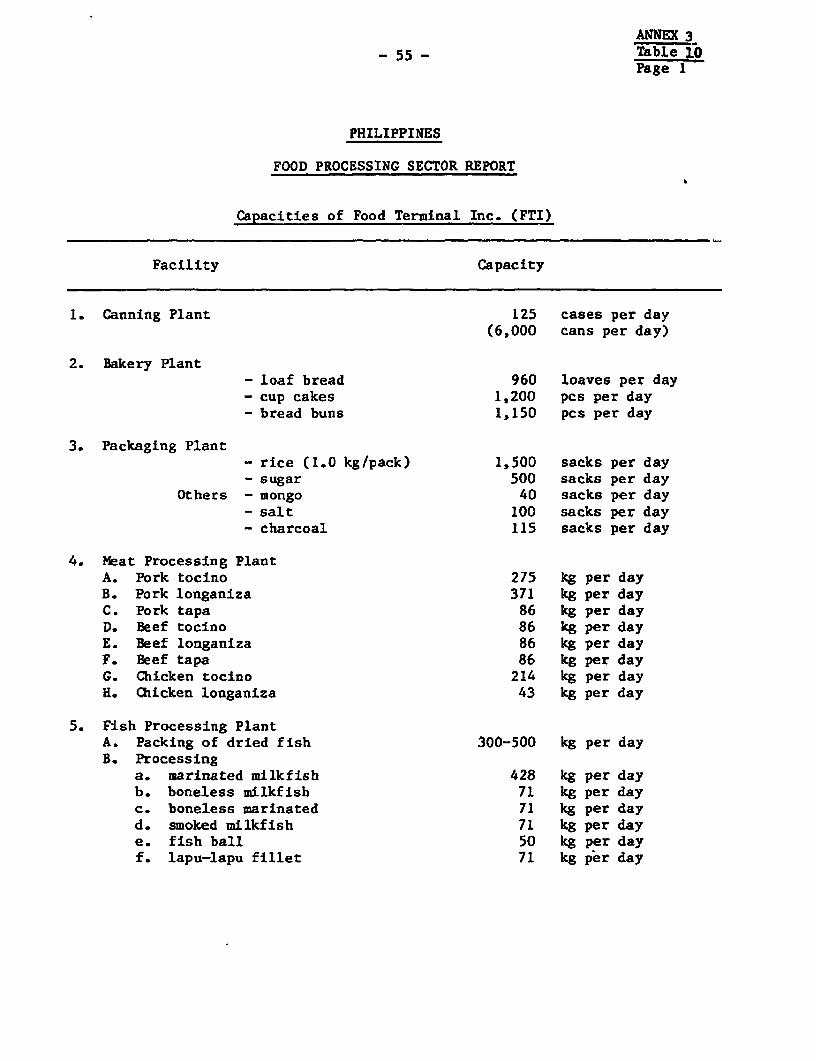
ANNEX 3Table l0Page 1
PHILIPPINES
FOOD PROCESSING SECTOR REPORT
Capacities of Food Terminal Inc. (FTI)
Facility Capacity
1. Canning Plant 125 cases per day(6,000 cans per day)
2. Bakery Plant- loaf bread 960 loaves per day- cup cakes 1,200 pcs per day- bread buns 1,150 pcs per day
3. Packaging Plant- rice (1.0 kg/pack) 1,500 sacks per day- sugar 500 sacks per day
Others - mongo 40 sacks per day- salt 100 sacks per day- charcoal 115 sacks per day
4. Meat Processing PlantA. Pork tocino 275 kg per dayB. Pork longaniza 371 kg per dayC. Pork tapa 86 kg per dayD. Beef tocino 86 kg per dayE. Beef longaniza 86 kg per dayF. Beef tapa 86 kg per dayG. Chicken tocino 214 kg per dayH. Chicken longaniza 43 kg per day
5. Fish Processing PlantA. Packing of dried fish 300-500 kg per dayB. Processing
a. marinated milkfish 428 kg per dayb. boneless milkfish 71 kg per dayc. boneless marinated 71 kg per dayd. smoked milkfish 71 kg per daye. fish ball 50 kg per dayf. lapu-lapu fillet 71 kg per day
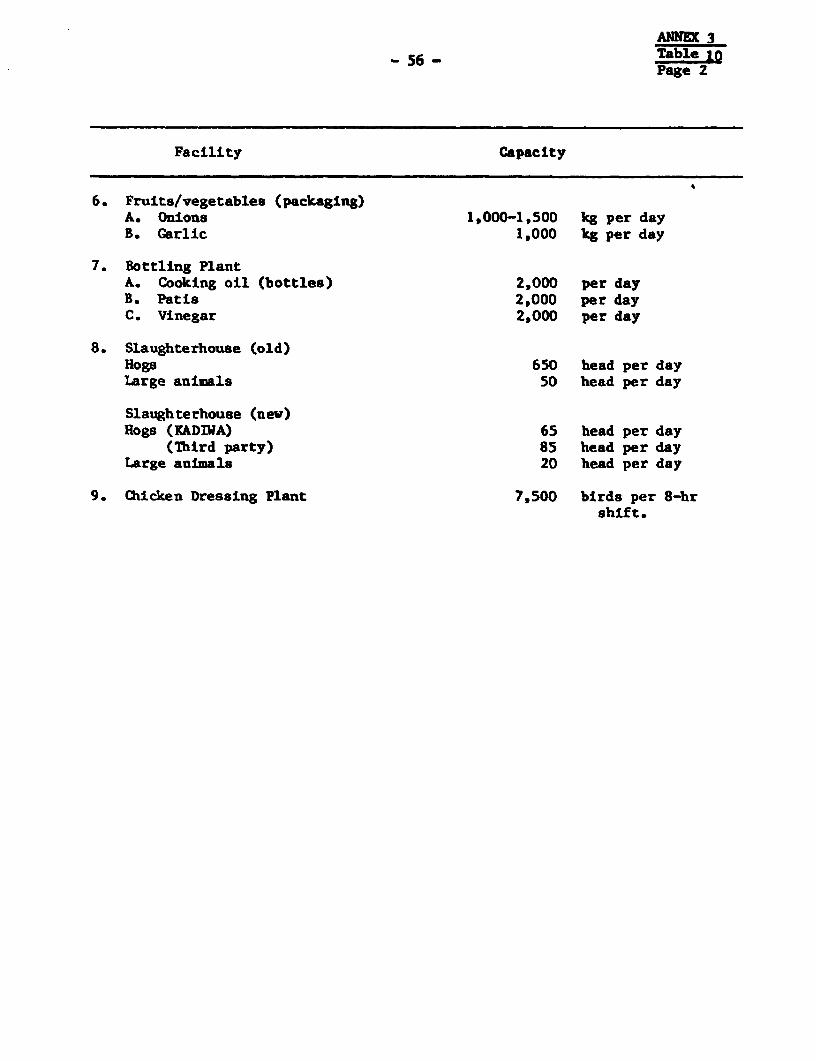
ANNEX 3
- 56 - Table Page 2
Facility Capacity
6. Fruits/vegetables (packaging)A. Onions 1,000-1,500 kg per dayB. Garlic 1,000 kg per day
7. Bottling PlantA. Cooking oil (bottles) 2,000 per dayB. Patis 2,000 per dayC. Vinegar 2,000 per day
8. Slaughterhouse (old)Hogs 650 head per dayLarge animals 50 head per day
Slaughterhouse (new)Hogs (KADIWA) 65 head per day
(Third party) 85 head per dayLarge animals 20 head per day
9. Chicken Dressing Plant 7,500 birds per 8-hrshift.
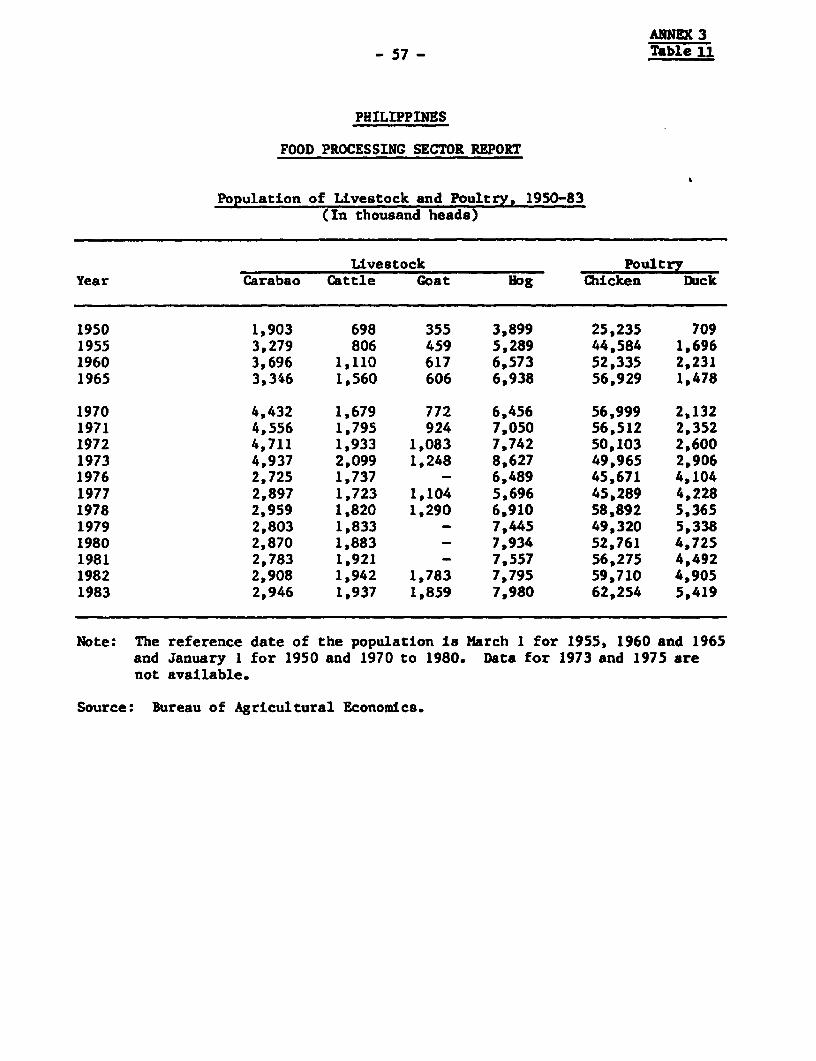
ANNEX 3-57 - Table 11
PHILIPPINES
FOOD PROCESSING SECTOR REPORT
Population of Livestock and Poultry, 1950-83(In thousand heads)
Livestock PoultryYear Carabao Cattle Goat Hog Chicken Duck
1950 1,903 698 355 3,899 25,235 7091955 3,279 806 459 5,289 44,584 1,6961960 3,696 1,110 617 6,573 52,335 2,2311965 3,346 1,560 606 6,938 56,929 1,478
1970 4,432 1,679 772 6,456 56,999 2,1321971 4,556 1,795 924 7,050 56,512 2,3521972 4,711 1,933 1,083 7,742 50,103 2,6001973 4,937 2,099 1,248 8,627 49,965 2,9061976 2,725 1,737 - 6,489 45,671 4,1041977 2,897 1,723 1,104 5,696 45,289 4,2281978 2,959 1,820 1,290 6,910 58,892 5,3651979 2,803 1,833 - 7,445 49,320 5,3381980 2,870 1,883 - 7,934 52,761 4,7251981 2,783 1,921 - 7,557 56,275 4,4921982 2,908 1,942 1,783 7,795 59,710 4,9051983 2,946 1,937 1,859 7,980 62,254 5,419
Note: The reference date of the population is March 1 for 1955, 1960 and 1965and January 1 for 1950 and 1970 to 1980. Data for 1973 and 1975 arenot available.
Source: Bureau of Agricultural Economics.

ANNEX 3- 58 - Table 12
PHILIPPINES
FOOD PROCESSING SECTOR REPORT
Meat Consumption - Total and Per Capita
1974-76 1982-83
Population (million) 42.0 50.0
Total meat consumption (NT) 478,000 720,000per capita (kg) 11.4 14.4
of which:
Total pork consumed (MT) 296,856 439,200per capita (kg) 7.1 8.8
Total beef/carabeef consumed (MT) 24,488 122,400per capita (kg) 3.0 2.4
Total poultry consumed (MT) 57,446 158,400per capita (kg) 1.4 3.2
Source: Mission estimates.
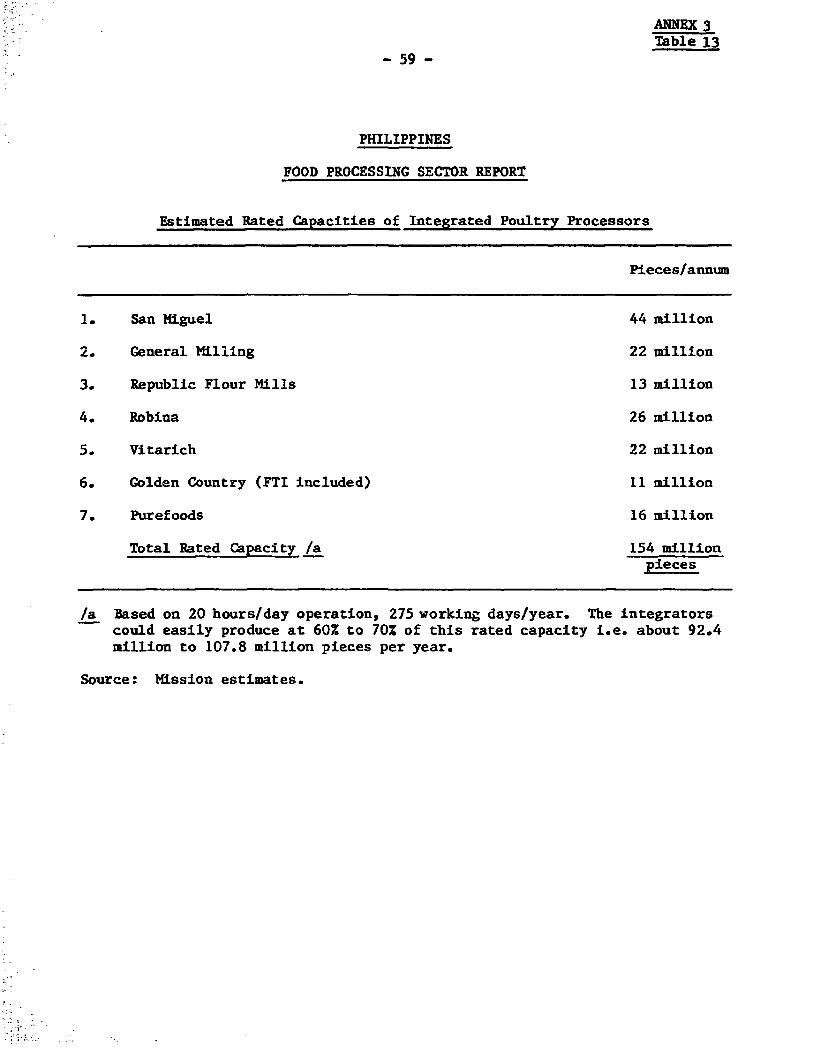
ANNEX 3Table 13
- 59 -
PHILIPPINES
FOOD PROCESSING SECTOR REPORT
Estimated Rated Capacities of Integrated Poultry Processors
Pieces/annum
1. San Miguel 44 million
2. General Milling 22 million
3. Republic Flour Mills 13 million
4. Robina 26 million
5. Vitarich 22 million
6. Golden Country (FTI included) 11 million
7. Purefoods 16 million
Total Rated Capacity /a 154 millionpieces
/a Based on 20 hours/day operation, 275 working days/year. The integratorscould easily produce at 60% to 70% of this rated capacity i.e. about 92.4million to 107.8 million pieces per year.
Source: Mission estimates.
j.

ANNEX 3Table 14
- 60 -
PHILIPPINES
FOOD PROCESSING SECTOR REPORT
Estimated Processed Meat Volume for 1983
Processed Processedpercentage volume
(Z) (NT)
Pork 10 43,92..
Beef/carabeef 30 36,720
Poultry 35 55,440
Total Processed Meat 19 6,080
Total Coneumed/Supply 100 720,000
Source: Mission estimates.
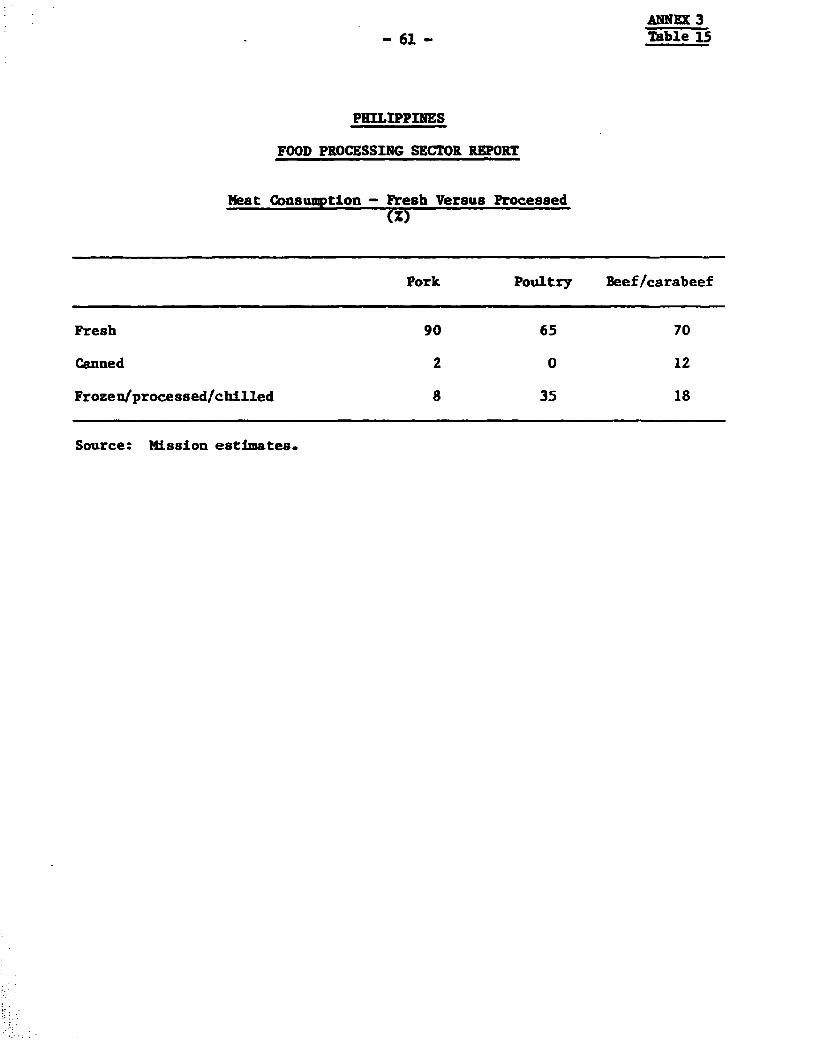
ANNEX 3-61 - Table 15
PHILIPPINES
FOOD PROCESSING SECTOR REPORT
Meat Cons uption - Fresh Versus Processed(Z)
Pork Poultry Beef/carabeef
Fresh 90 65 70
Canned 2 0 12
Frozen/processed/chilled 8 35 18
Source: Mission estimates.
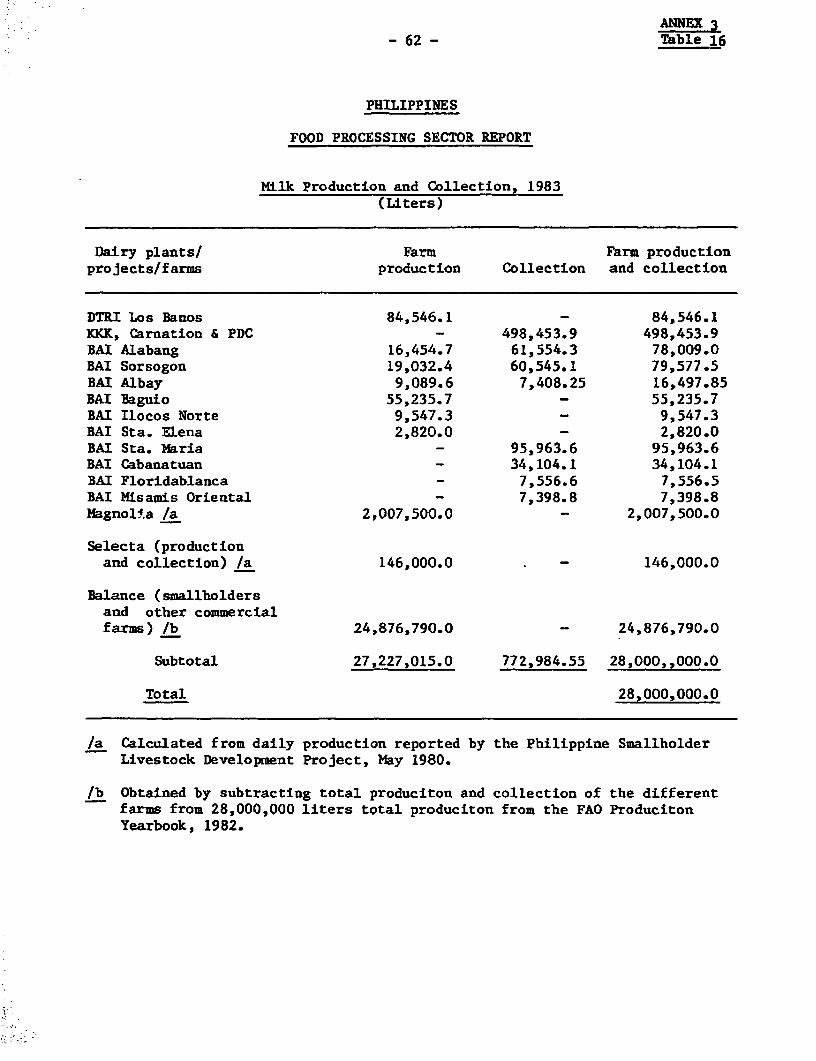
ANNEX 3- 62 - Table 16
PHILIPPINES
FOOD PROCESSING SECTOR REPORT
Milk Production and Collection, 1983(Liters)
Dairy plants/ Farm Farm productionprojects/farms production Collection and collection
DTRI Los Banos 84,546.1 - 84,546.1KKK, Carnation & PDC - 498,453.9 498,453.9BAI Alabang 16,454.7 61,554.3 78,009.0BAI Sorsogon 19,032.4 60,545.1 79,577.5BAI Albay 9,089.6 7,408.25 16,497.85BAI Baguio 55,235.7 - 55,235.7BAI Ilocos Norte 9,547.3 9,547.3BAI Sta. Elena 2,820.0 - 2,820.0BAI Sta. Maria - 95,963.6 95,963.6BAI Cabanatuan - 34,104.1 34,104.1BAI Floridablanca - 7,556.6 7,556.5BAI Misamis Oriental - 7,398.8 7,398.8Magnolia /a 2,007,500.0 - 2,007,500.0
Selecta (productionand collection) /a 146,000.0 146,000.0
Balance (smallholdersand other commercialfarms) /b 24,876,790.0 - 24,876,790.0
Subtotal 27,227,015.0 772,984.55 28,000,,000.0
Total 28,000,000.0
/a Calculated from daily production reported by the Philippine SmallholderLivestock Development Project, May 1980.
/b Obtained by subtracting total produciton and collection of the differentfarms from 28,000,000 liters total produciton from the FAO ProducitonYearbook, 1982.

ANNEX 3
- 63 - Table 17
PHILIPPINES
FOOD PROCESSING SECTOR REPORT
Selected Commercial Dairy Herd Population - June 1984
Total Yield TotalBeef dairy herd Nilking 1/day liter/day
Magnolia 1,500 700 14 9,800
Puyat (Exotic) 800 800 200 15 3,000(Upgrade) 600
Aberdeen - 250 42 9 378
1bnterey 4,000 400 200 15 3,0009,000 200 100 11 1,100
Philpacking - 150 100 9 900
Phildairy - 800 400 6 2,400
Sodaco 5,000 200 50 6 300
Sarangani 20,000 - - -
Source: Mission estimates.
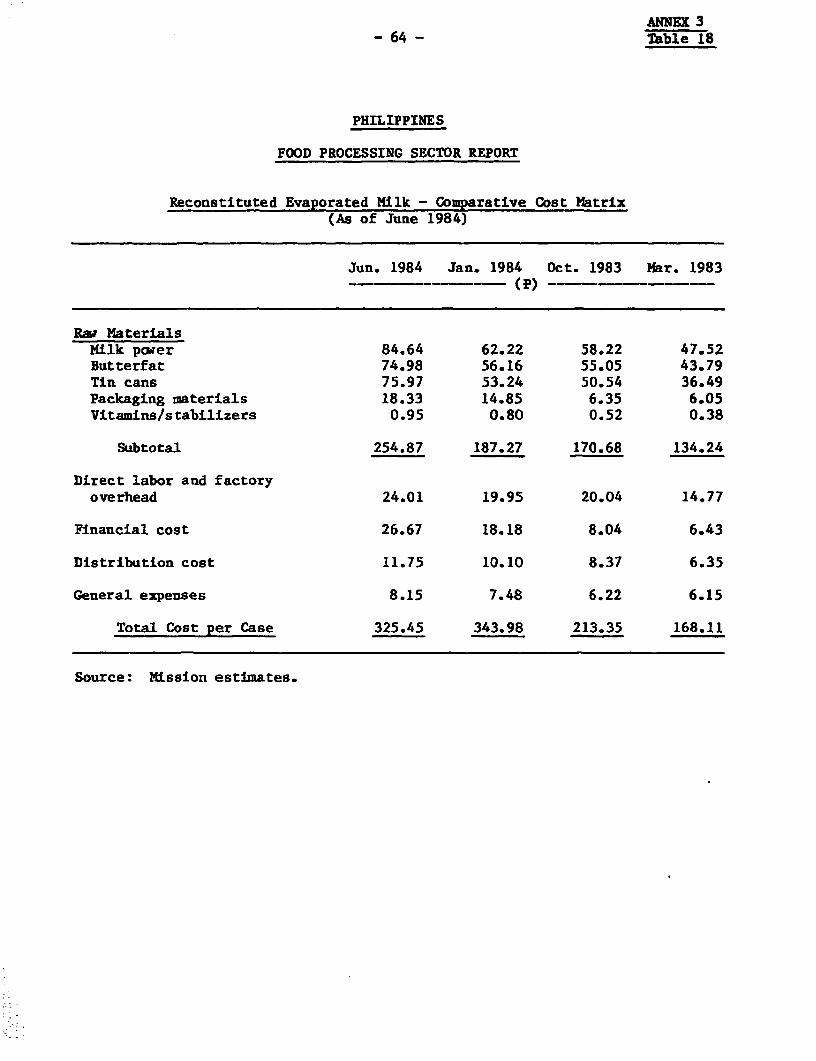
ANNEX 364 - Table 18
PHILIPPINES
FOOD PROCESSING SECTOR REPORT
Reconstituted Evaporated Milk - Comparative Cost Matrix(As of June 1984)
Jun. 1984 Jan. 1984 Oct. 1983 Nar. 1983__ ___ _ ~( P)____
Raw MaterialsMilk power 84.64 62.22 58.22 47.52Butterfat 74.98 56.16 55.05 43.79Tin cans 75.97 53.24 50.54 36.49Packaging materials 18.33 14.85 6.35 6.05Vitamins/stabilizers 0.95 0.80 0.52 0.38
Subtotal 254.87 187.27 170.68 134.24
Direct labor and factoryoverhead 24.01 19.95 20.04 14.77
Financial cost 26.67 18.18 8.04 6.43
Distribution cost 11.75 10.10 8.37 6.35
General expenses 8.15 7.48 6.22 6.15
Total Cost per Case 325.45 343.98 213.35 168.11
Source: Mission estimates.
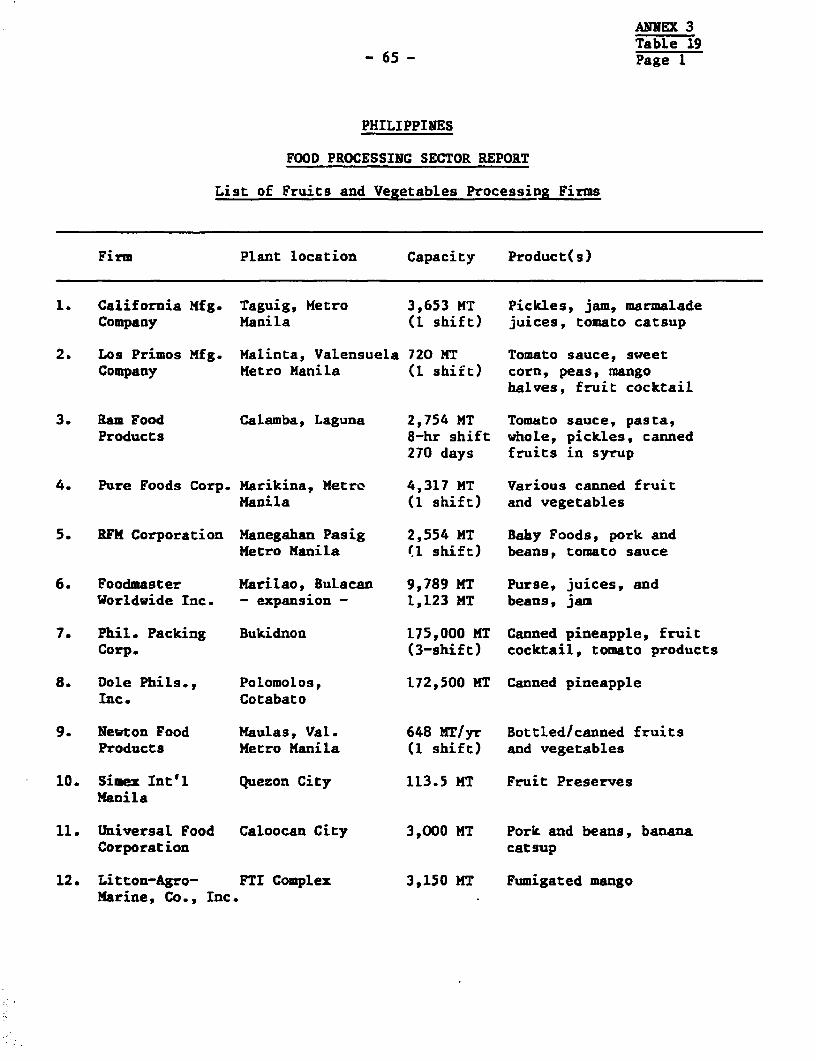
ANNEX 3Table 19
-65 - Page 1
PHILIPPINES
FOOD PROCESSING SECTOR REPORT
List of Fruits and Vegetables Processing Firms
Firm Plant location Capacity Product(s)
1. California Mfg. Taguig, Metro 3,653 MT Pickles, jam, marmaladeCompany Manila (1 shift) juices, tomato catsup
2. Los Primos Mfg. Malinta, Valensuela 720 MT Tomato sauce, sweetCompany Metro Manila (1 shift) corn, peas, mango
halves, fruit cocktail
3. Ram Food Calamba, Laguna 2,754 MT Tomato sauce, pasta,Products 8-hr shift whole, pickles, canned
270 days fruits in syrup
4. Pure Foods Corp. Karikina, Metro 4,317 MT Various canned fruitKanila (1 shift) and vegetables
5. RFM Corporation Kanegahan Pasig 2,554 MT Baby Foods, pork andMetro Manila (I shift) beans, tomato sauce
6. Foodmaster Marilao, Bulacan 9,789 MT Purse, juices, andWorldwide Inc. - expansion - 1,123 MT beans, jam
7. Phil. Packing Bukidnon 175,000 MT Canned pineapple, fruitCorp. (3-shift) cocktail, tomato products
8. Dole Phils., PoLomolos, 172,500 MT Canned pineappleInc. Cotabato
9. Newton Food Maulas, Val. 648 MT/yr Bottled/canned fruitsProducts Metro Manila (1 shift) and vegetables
10. Simex Int'l Quezon City 113.5 MT Fruit PreservesManila
11. Universal Food Caloocan City 3,000 MT Pork and beans, bananaCorporation catsup
12. Litton-Agro- FTI Complex 3,150 MT Fumigated mangoMarine, Co., Inc.

-66- ANNEX 3Table 19Page 2
13. Pelican Agro FTI CompLex 4,400 Fumigated mangoProducts
14. Sta. Monica Malinta, Valenzuela n.a. Canned peas, tomato pasteCanning Corp.
15. Lorenzana Foods Laus, Cavite 700 MT Frozen fruits andCorporation vegetables
16. Wise and Co. Pasig, Metro 190 MT Dehydrated vegetables,Manila spice crops
17. Philips Food Pasay City 2,150 MT Canned peas, pork andCorp. beans, banana, catsup
18. Finest Food Valenzuela 3,000 MT Canned fruitsProducts Bulaean
19. Agro Gold Corp. Bagcarlan, Laguna 900 MT Coconut milk
20. Tobi Marketing Paranque, Metro 323 MT NutsManila
21. Crown Fruits and Davao 36,720 Mr Canned pineappleCannery Corp.
22. Panama Food Malabon, Metro 26,600 MT Canned fruits andIndustries Manila vegetables and fish
23. San Carlos Fruit San Carlos 1,500 MT Mango pureeCorp. Pangasinan
24. Stanfood Corp. Tondo, Manila 166,320 Canned fruits andvegetables and fish
25. Sureland Aspar- Garona, Tarlac 672 MT Canned asparagusagus
DEHYDRATED FRUITS
26. Country Harvest, Cuyapo, Nueva 624 MT Dehydrated mango andInc. Ecija papaye
27. Del Mar Domestic Quezon City 720 MT Banana chipsEnterprise
28. Green and Gold Calamba, Laguna 408 MT Banana chips
29. Fruitchips GMBH Paranaque, Metro 237 MT Dehydrated fruitsPhilippines Manila (flakes, chips,
powder or granule)
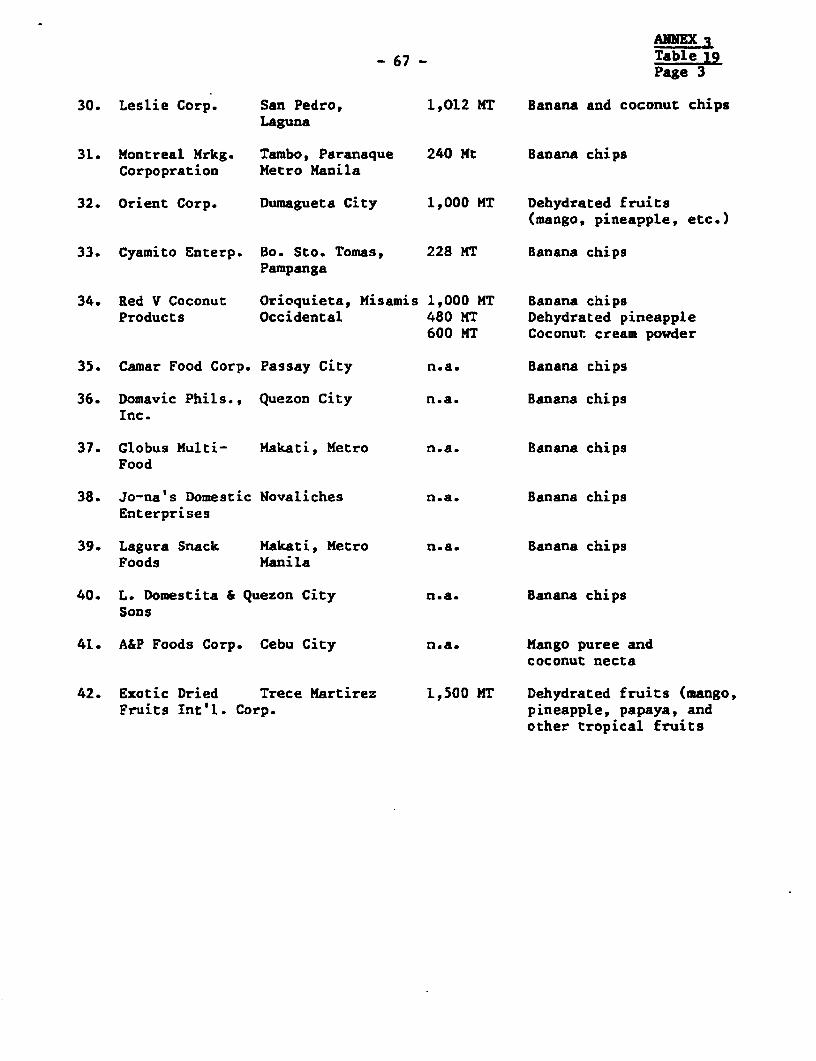
ANNEX
- 67 - Table 19Page 3
30. Leslie Corp. San Pedro, 1,012 MT Banana and coconut chipsLaguna
31. Montreal Mrkg. Tambo, Paranaque 240 Mt Banana chipsCorpopration Metro Manila
32. Orient Corp. Dumagueta City 1,000 MT Dehydrated fruits(mango, pineapple, etc.)
33. Cyamito Enterp. Bo. Sto. Tomas, 228 MT Banana chipsPampanga
34. Red V Coconut Orioquieta, Misamis 1,000 MT Banana chipsProducts Occidental 480 MT Dehydrated pineapple
600 MT Coconut cream powder
35. Camar Food Corp. Passay City n.a. Banana chips
36. Domavic Phils., Quezon City n.a. Banana chipsInc.
37. Globus Multi- Makati, Metro n.a. Banana chipsFood
38. Jo-na's Domestic Novaliches n.a. Banana chipsEnterprises
39. Lagura Snack Makati, Metro n.a. Banana chipsFoods Manila
40. L. Domestita & Quezon City n.a. Banana chipsSons
41. A&P Foods Corp. Cebu City n.a. Mango puree andcoconut necta
42. Exotic Dried Trece Martirez 1,500 MT Dehydrated fruits (mango,Fruits Int'l. Corp. pineapple, papaya, and
other tropical fruits
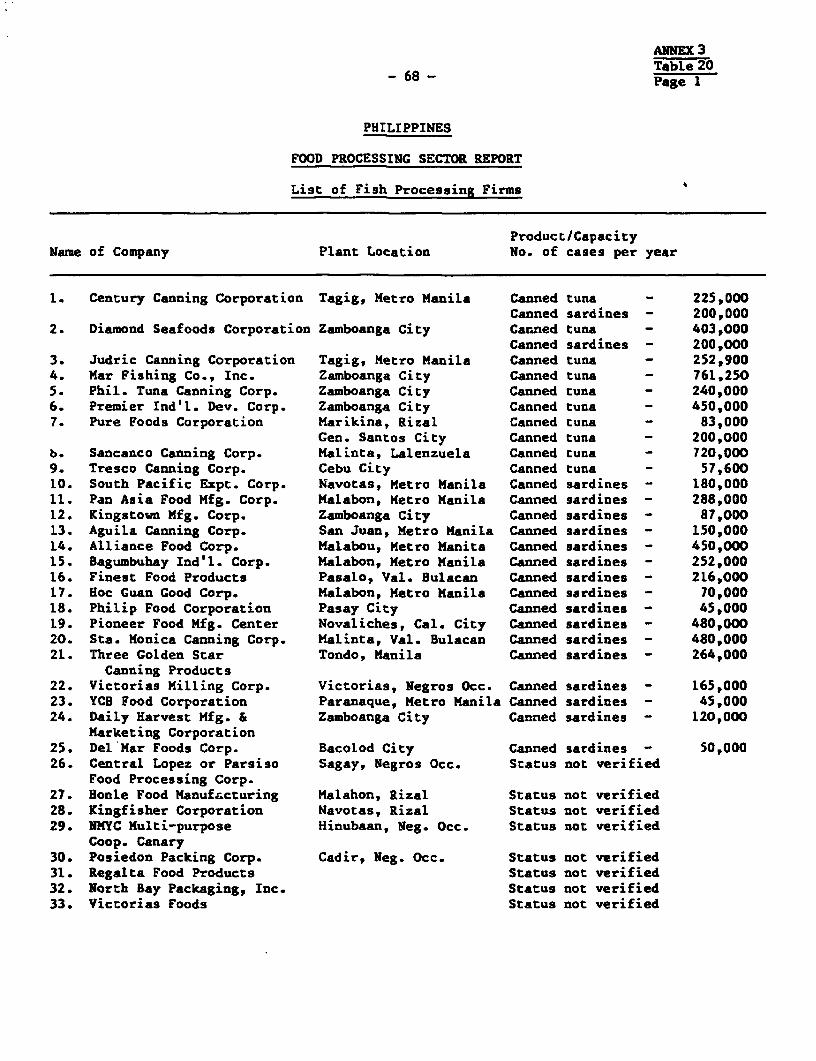
ANNEX 3
- 68 - ~Tble 20-68- ~~~~~~Page 1
PHILIPPINES
FOOD PROCESSING SECTOR REPORT
List of Fish Processing Firms
Product/CapacityName of Company Plant Location No. of cases per year
1. Century Canning Corporation Tagig, Metro Manila Canned tuna - 225,000Canned sardines - 200,000
2. Diamond Seafoods Corporation Zamboanga City Canned tuna - 403,000Canned sardines - 200,000
3. Judric Canning Corporation Tagig, Metro Manila Canned tuna - 252,9004. Mar Fishing Co., Inc. Zamboanga City Canned tuna - 761,2505. Phil. Tuna Canning Corp. Zamboanga City Canned tuna - 240,0006. Premier Ind'l. Dev. Corp. Zamboanga City Canned tuna - 450,0007. Pure Foods Corporation Marikina, Rizal Canned tuna - 83,000
Gen. Santos City Canned tuna - 200,000b. Sancanco Canning Corp. Malinta, Lalenzuela Canned tuna - 720,0009. Tresco Canning Corp. Cebu City Canned tuna - 57,60010. South Pacific Expt. Corp. Navotas, Metro Manila Canned sardines - 180,00011. Pan Asia Food Mfg. Corp. Malabon, Metro Manila Canned sardines - 288,00012. Kingstown Mfg. Corp. Zamboanga City Canned sardines - 87,00013. Aguila Canning Corp. San Juan, Metro Manila Canned sardines - 150,00014. Alliance Food Corp. Malabou, Metro Manita Canned sardines - 450,00015. Bagumbuhay Ind'l. Corp. Malabon, Metro Manila Canned sardines - 252,00016. Finest Food Products Pasalo, Val. Bulacan Canned sardines - 216,00017. Hoc Guan Good Corp. Malabon, Metro Manila Canned sardines - 70,00018. Philip Food Corporation Pasay City Canned sardines - 45,000L9. Pioneer Food Mfg. Center Novaliches, Cal. City Canned sardines - 480,00020. Sta. Monica Canning Corp. Malinta, Val. Bulacan Canned sardines - 480,00021. Three Golden Star Tondo, Manila Canned sardines - 264,000
Canning Products22. Victorias Milling Corp. Victorias, Negros Occ. Canned sardines - 165,00023. YCB Food Corporation Paranaque, Metro Manila Canned sardines - 45,00024. Daily Harvest Mfg. & Zamboanga City Canned sardines - 120,000
Marketing Corporation25. Del'Mar Foods Corp. Bacolod City Canned sardines - 50,00026. Central Lopez or Parsiso Sagay, Negros Occ. Status not verified
Food Processing Corp.27. Honle Food Manufacturing Malahon, Rizal Status not verified28. Kingfisher Corporation Navotas, Rizal Status not verified29. NMYC Multi-purpose Hinubaan, Neg. Occ. Status not verified
Coop. Canary30. Posiedon Packing Corp. Cadir, Neg. Occ. Status not verified31. Regalta Food Products Status not verified32. North Bay Packaging, Inc. Status not verified33. Victorias Foods Status not verified
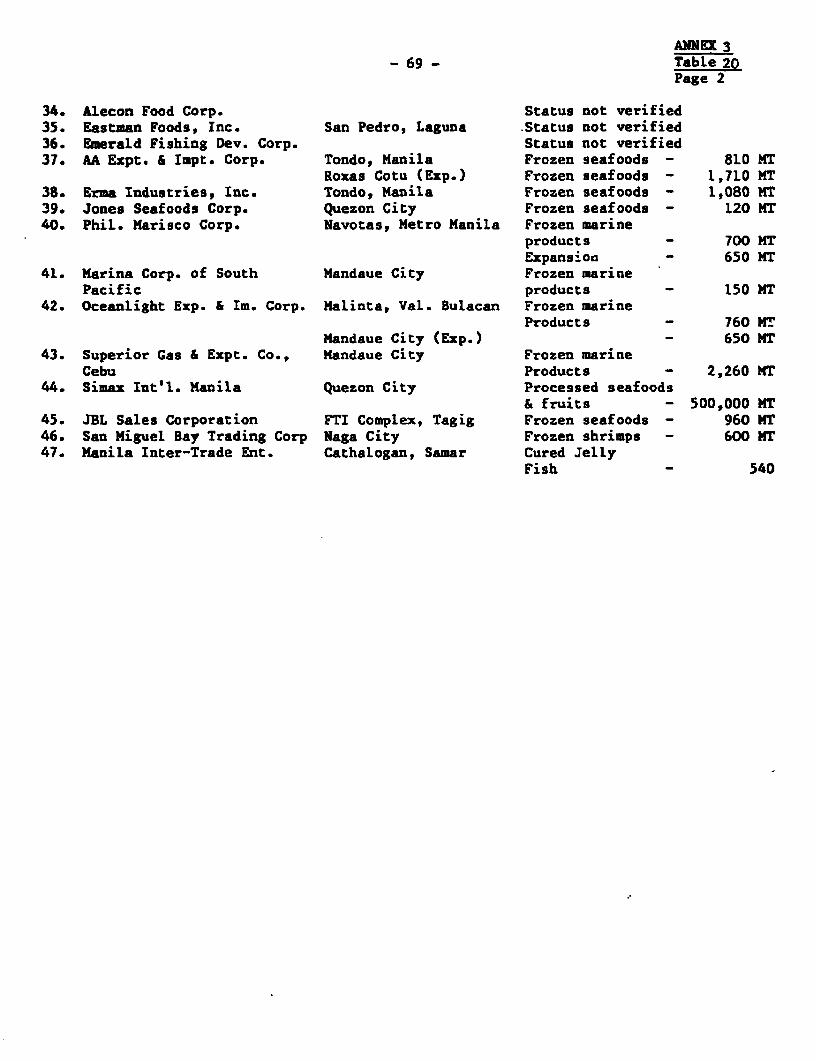
ANNEC 3- 69 - Table 20
Page 2
34. Alecon Food Corp. Status not verified35. Eastman Foods, Inc. San Pedro, Laguna -Status not verified36. Emerald Fishing Dev. Corp. Status not verified37. MA Ezpt. & Impt. Corp. Tondo, Manila Frozen seafoods - 810 MT
Roxas Cotu (Exp.) Frozen seafoods - 1,710 MT38. Erma Industries, Inc. Tondo, Manila Frozen seafoods - 1,080 MT39. Jones Seafoods Corp. Quezon City Frozen seafoods - 120 MT40. Phil. Marisco Corp. Navotas, Metro Manila Frozen marine
products - 700 MTExpansion - 650 MT
41. Marina Corp. of South Mandaue City Frozen marinePacific products - 150 MT
42. Oceanlight Ezp. & Im. Corp. Malinta, Val. Bulacan Frozen marineProducts - 760 MT
Mandaue City (Exp.) - 650 MT43. Superior Gas & Expt. Co., Mandaue City Frozen marine
Cebu Products - 2,260 MT44. Simax Int'l. Manila Quezon City Processed seafoods
& fruits - 500,000 MT45. JBL Sales Corporation FTI Complex, Tagig Frozen seafoods - 960 MT46. San Miguel Bay Trading Corp Naga City Frozen shrimps - 600 MT47. Manila Inter-Trade Ent. Cathalogan, Samar Cured Jelly
Fish - 540
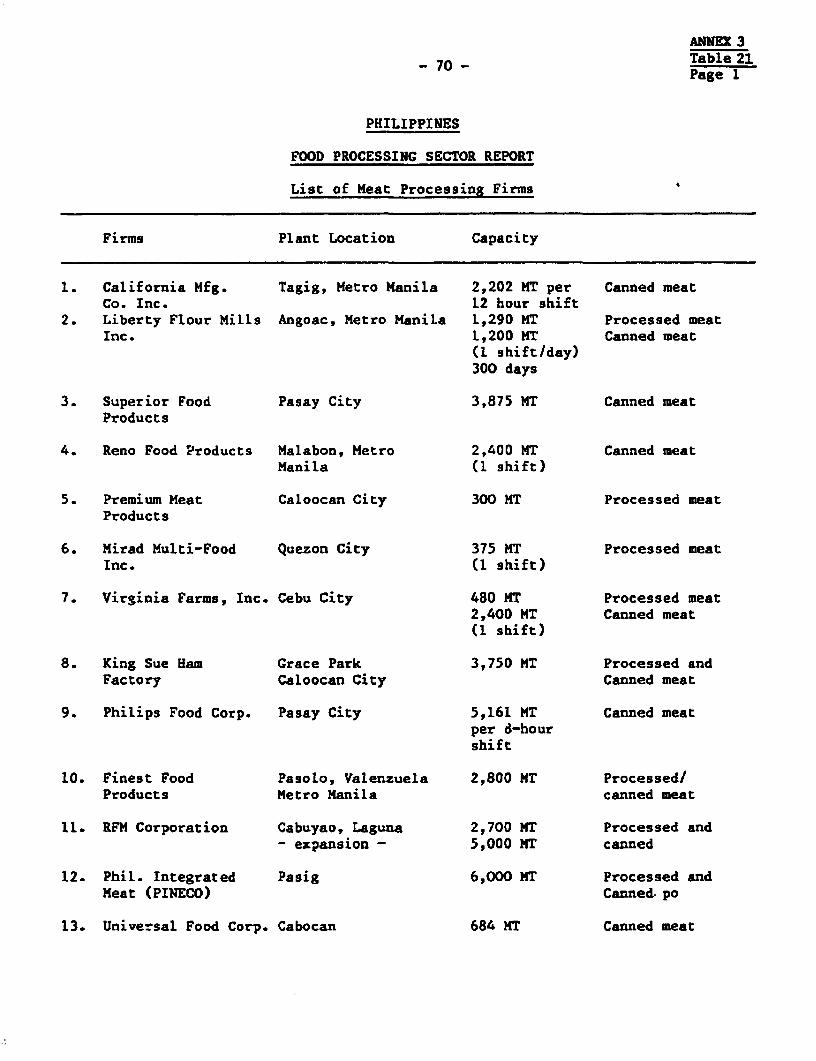
ANNEX 3Table 21Page 1
PHILIPPINES
FOOD PROCESSING SECTOR REPORT
List of Heat Processing Firms
Firms Plant Location Capacity
1. California Mfg. Tagig, Metro Manila 2,202 MT per Canned meatCo. Inc. 12 hour shift
2. Liberty Flour Mills Angoac, Metro Manila 1,290 MT Processed meatInc. 1,200 MT Canned meat
(1 shift/day)300 days
3. Superior Food Pasay City 3,875 MT Canned meatProducts
4. Reno Food Products Malabon, Metro 2,400 MT Canned meatManila (1 shift)
5. Premium Meat Caloocan City 300 MT Processed meatProducts
6. Mirad Multi-Food Quezon City 375 MT Processed meatInc. (1 shift)
7. Vireinia Farms, Inc. Cebu City 480 MT Processed meat2,400 MT Canned meat(1 shift)
8. King Sue Ham Grace Park 3,750 MT Processed andFactory Caloocan City Canned meat
9. Philips Food Corp. Pasay City 5,161 MT Canned meatper d-hourshift
10. Finest Food Pasolo, Valenzuela 2,800 MT Processed/Products Metro Manila canned meat
11. RFM Corporation Cabuyao, Laguna 2,700 MT Processed and- expansion - 5,000 MT canned
12. Phil. Integrated Pasig 6,000 MT Processed andMeat (PINECO) Canned po
13. Universal Food Corp. Cabocan 684 MT Canned meat
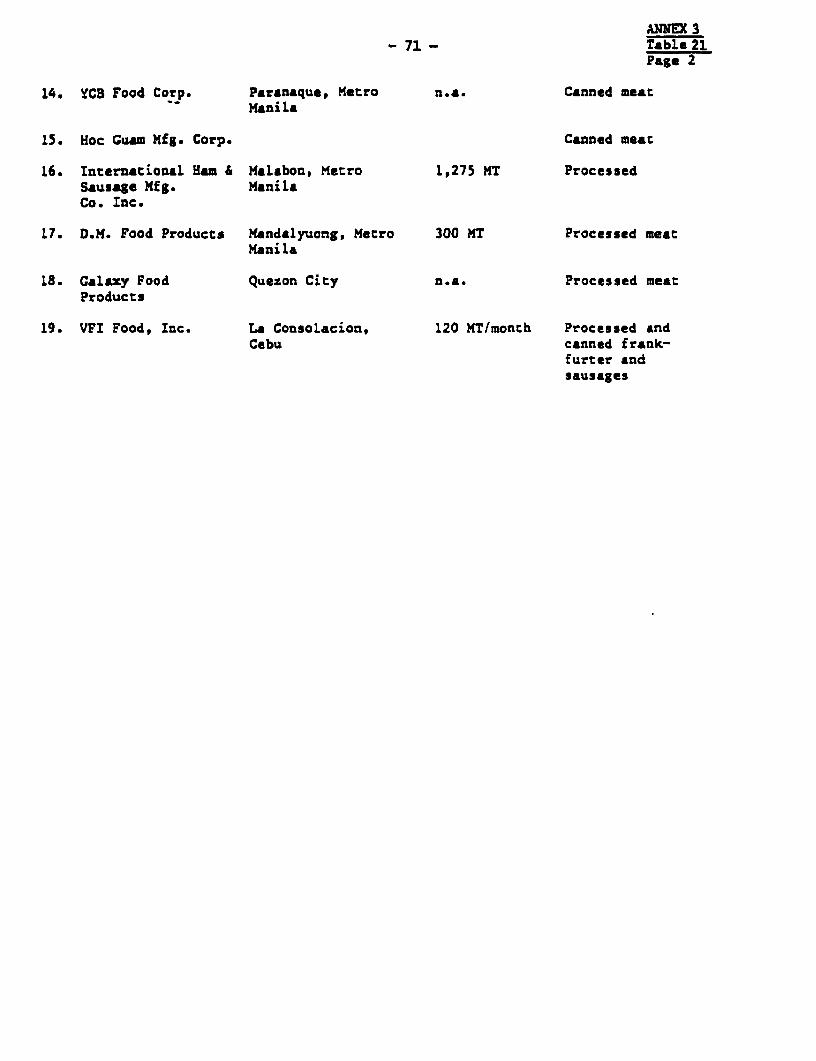
ANNEX 3- 71 - Table 21
Page 2
14. YCB Food Corp. Parsnaque, Metro n.&. Canned meatManila
15. Hoc Guam Mfg. Corp. Canned meat
16. International Ham & Malabon, Metro 1,275 MT ProcessedSausage Nfg. ManilaCo. Inc.
17. D.H. Food Products Mandalyuong, Metro 300 MT Processed meacManila
18. Galaxy Food Quezon City n.a. Processed meatProducts
19. VFI Food, Inc. La Consolacion, 120 MT/month Processed andCebu canned f rank-
furter andsausages