Embed Size (px)
Citation preview

T o wa r d s b e t t e r i n v e s t m e n t i n r u r a l c o m m u n i t i e ss o l o m o n i s l a n d s
s o l o m o n i s l a n d s
Pub
lic D
iscl
osur
e A
utho
rized
Pub
lic D
iscl
osur
e A
utho
rized
Pub
lic D
iscl
osur
e A
utho
rized
Pub
lic D
iscl
osur
e A
utho
rized
Pub
lic D
iscl
osur
e A
utho
rized
Pub
lic D
iscl
osur
e A
utho
rized
Pub
lic D
iscl
osur
e A
utho
rized
Pub
lic D
iscl
osur
e A
utho
rized

The aim of Solomon Islands — Towards Better Investment in Rural Communities is to assist policymakers, program sponsors and implementers to make informed decisions about the design, financing, governance and overall advantages and disadvantages of programs that invest in small-scale infrastructure and income-generating opportunities for rural communities in the Solomon Islands.
Completed in mid-2014, the report identifies ways to strengthen the current mechanisms for investing in rural service delivery by examining the three main types of financing for small-scale infrastructure and livelihood activities — constituency, province and community-oriented funds — in a national and global context across four key programs between 2008 and 2012. A summary of the programs is provided in Table 1.
The report explores the following key components across the four programs: analysis and consolidation of sub-project data; local development planning; efficiency and effectiveness; accountability, transparency and dispute management; and sustainability.
This document is a summary of the report. The full text can be found at worldbank.org/pi
s o l o m o n i s l a n d s | p h : + 6 7 7 2 1 4 4 4 | P O B OX 1 7 4 4 , h o n i a r a | w o r l d b a n k .o r g / p i
T o wa r d s b e t t e r i n v e s t m e n t i n r u r a l c o m m u n i t i e ss o l o m o n i s l a n d s
P R O G R A M O V E R V I E W A D M I N I S T R AT I O N & I M P L E M E N TAT I O N F U N D E D B YProvincial Capacity Development Fund (PCDF)
$US 18.1M, launched in 2008 to improve infrastructure and services, natural resource management and local economic activity.
Ministry of Provincial Government & Institutional Strengthening: annual block grants disbursed to Provincial Governments provided minimum conditions and performance measures are met. Originally donor funded, but only SIG funded starting in 2013.
SIG, Australia, RAMSI, EU, UNDP and UNCDF
Rural Development Program (RDP)
U$S 26.53M, launched in 2007 to improve access to rural community infrastructure, agricultural services and rural business financing.
Ministry of Development Planning & Aid Coordination supported by Ministry of Agriculture & Livestock and provincial governments: community infrastructure component provides one small grant to each rural ward per grant cycle (excluding in Rennel and Bellona) based on community-identified needs and ward development committee prioritisation.
WB, Australia, EU, SIG, IFAD
Rural Advancement Micro-projects Program (RAMP)
$US 9.6M, launched in 2009 to improve access to social services and the income of participating rural and urban communities. Extension of two previous, EU- funded ‘micro-project’ projects.
Ministry of Development Planning & Aid Coordination: community committees receive small grants based on successful submissions to a competitive, national call for proposals.
EU
Rural Constituency Livelihood Fund (RCLF)
$US 37.9M, launched in 2008 to fund social and economic infrastructure and other developments in each constituency to complement provincial and national projects. Various types of constituency funds have been in operation since 1989, and there are others beyond RCLF that remain in operation.
Ministry of Rural Development: funds transferred to constituency accounts (RCLF has largest number of ‘constituency funds’) or directly to vendors for projects and assorted activities identified by MPs and their constituency development officers.
SIG
2
T A B L E 1 — S u m m a r y o f P r o g r a m s f r o m 2 0 0 8 t o 2 0 1 2
Exchange rate 1 US Dollar ($US) = 7.60 Solomon Islands Dollar (SBD)
DisclaimerThis work is a product of the staff of The World Bank with external contributions. The findings, interpretations, and conclusions expressed in this work do not necessarily reflect the views of The World Bank, its Board of Executive Directors, or the governments they represent.
The World Bank does not guarantee the accuracy of the data included in this work. The boundaries, colors, denominations, and other information shown on any map in this work do not imply any judgement on the part of The World Bank concerning the legal status of any territory or the endorsement or acceptance of such boundaries. Nothing herein shall constitute or be considered to be a limitation upon or waiver of the privileges and immunities of The World Bank, all of which are specifically reserved.
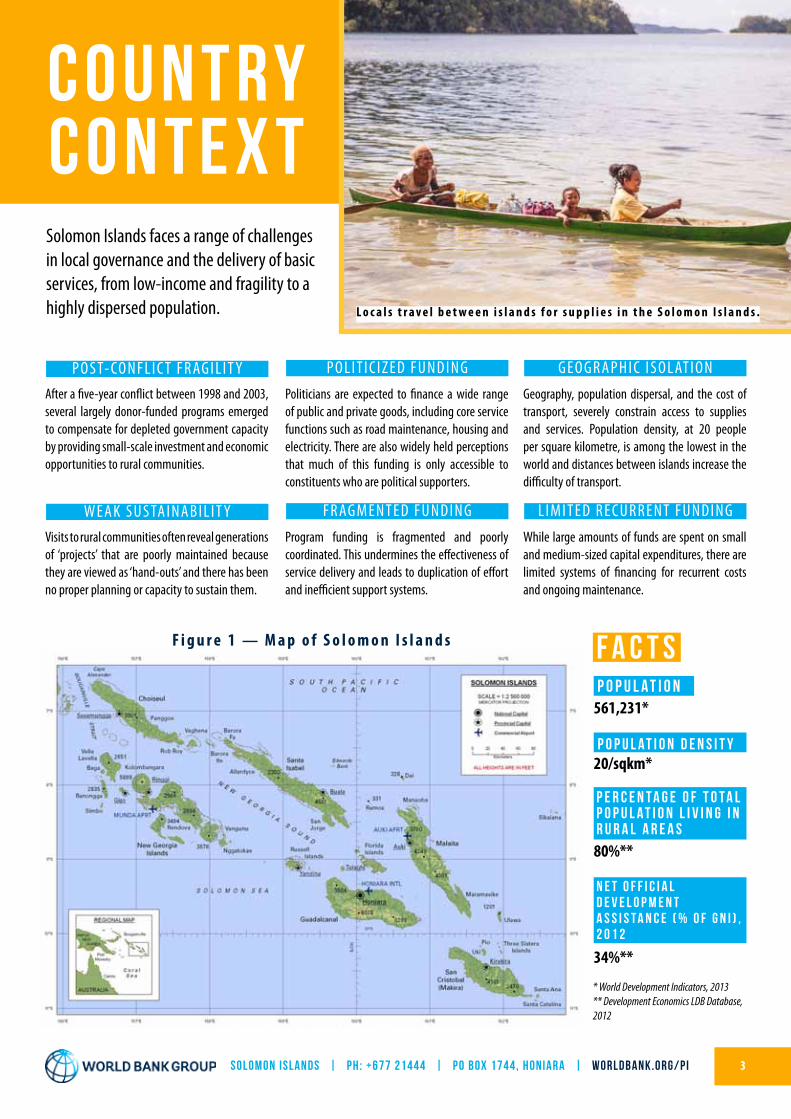
c o u n t ry c o n t e x tSolomon Islands faces a range of challenges in local governance and the delivery of basic services, from low-income and fragility to a highly dispersed population.
P O S T- CO N F L I C T F R AG I L I T Y P O L I T I C I Z E D F U N D I N G G E O G R A P H I C I S O L AT I O NAfter a five-year conflict between 1998 and 2003, several largely donor-funded programs emerged to compensate for depleted government capacity by providing small-scale investment and economic opportunities to rural communities.
Politicians are expected to finance a wide range of public and private goods, including core service functions such as road maintenance, housing and electricity. There are also widely held perceptions that much of this funding is only accessible to constituents who are political supporters.
Geography, population dispersal, and the cost of transport, severely constrain access to supplies and services. Population density, at 20 people per square kilometre, is among the lowest in the world and distances between islands increase the difficulty of transport.
W E A K S U S TA I N A B I L I T Y F R AG M E N T E D F U N D I N G L I M I T E D R E C U R R E N T F U N D I N G
Visits to rural communities often reveal generations of ‘projects’ that are poorly maintained because they are viewed as ‘hand-outs’ and there has been no proper planning or capacity to sustain them.
Program funding is fragmented and poorly coordinated. This undermines the effectiveness of service delivery and leads to duplication of effort and inefficient support systems.
While large amounts of funds are spent on small and medium-sized capital expenditures, there are limited systems of financing for recurrent costs and ongoing maintenance.
561,231*
F a c t sP O P U L A T I O N
P O P U L A T I O N D E N S I T Y
P E R C E N T A G E O F T O T A L P O P U L A T I O N L I V I N G I N R U R A L A R E A S
20/sqkm*
80%**
N E T O F F I C I A L D E V E L O P M E N T A S S I S T A N C E ( % O F G N I ) , 2 0 1 2
34%**
* World Development Indicators, 2013** Development Economics LDB Database, 2012
F i g u r e 1 — M a p o f S o l o m o n I s l a n d s
s o l o m o n i s l a n d s | p h : + 6 7 7 2 1 4 4 4 | P O B OX 1 7 4 4 , h o n i a r a | w o r l d b a n k .o r g / p i 3
L o c a l s t r a v e l b e t w e e n i s l a n d s f o r s u p p l i e s i n t h e S o l o m o n I s l a n d s .

cURRENT FUNDING STREAMS
Funds flowing to the sub-national level can be grouped into three main categories according to their geographic orientation and the levels at which decisions are made and funds managed (see Figure 3 for an example).
s o l o m o n i s l a n d s | p h : + 6 7 7 2 1 4 4 4 | P O B OX 1 7 4 4 , h o n i a r a | w o r l d b a n k .o r g / p i 4
P r o v i n c e - o r i e n t e d f u n d sA province is the only subnational level of government in Solomon Islands. Beyond the Provincial Service Grant, which primarily finances Provincial Government personnel and operations, the most significant source of development financing at the provincial level is the PCDF grants. These grants primarily finance elements of provincial development plans, much of which are defined by members of the Provincial Assembly who are elected to represent each ward in the province (refer to Figure 2 for an example of boundaries).
A constituency is a geographically defined area within a province, which is represented by an elected national Member of Parliament. There are several different constituency funds (CDFs), including RCLF, all of which flow into constituency accounts and are intended to benefit members of the constituency. Members of Provincial Assembly are also increasingly being allocated funds to be used for similar purposes within their ward-level constituencies.
C o m m u n i t y- o r i e n t e d f u n d sCommunities are defined broadly as individual villages and hamlets as well as the geographically defined wards which are not an official level of government, but which have political representation and are often a level of planning. RDP, RAMP and its predecessor micro-project funds as well as a range of smaller discretionary donor funds and NGO projects provide financing directly to community-based groups or NGOs for the benefit of communities.
Comparison of Programs“After a decade of implementation, programs have evolved independently and become institutionalised to varying degrees, but the lessons of experience across the
various approaches have yet to be drawn together.”
Solomon Islands — Towards Better Investment in Rural Communities consolidates data into a single data set using data from 1449 sub-projects undertaken between 2008 to 2012 from the Provincial Capacity Development Fund (PCDF), Rural Constituency Livelihood Fund (RCLF), Rural Development Program (RDP), and the Rural Advancement Micro-projects Programme (RAMP) and its predecessors,
Micro-projects Programme 1 (MPP1) and Micro-projects Programme 2 (MPP2). The report found:
The Solomon Island Government (SIG) has been providing funds to PCDF since 2009 and to constituency funds since 1989. SIG did not contribute funds for grants to RDP until 2013 and did not contribute any funds for grants to RAMP.
Community contributions are required in cash and/or in kind for RDP and RAMP, but not for PCDF and constituency funds (RCLF). These contributions likely represent a significant portion of community project cost (about 30 per cent for RDP), but are not represented in Figure 2 below.
Detailed expenditure data for RCLF was only available for 2010, although some of the data was unable to be assigned to sectors as 30 per cent of expenditures were unclassified and the bulk of expenditures were for one-off, small items.
There is often co-financing of individual sub-projects by the different programs, with constituency funds, in particular, being used to fill funding gaps or scale-up RDP or PCDF-funded subprojects.
From 2008 to 2012, these four programs have disbursed a total of $US 134,226,722. The bulk of these funds were channelled through the constituency fund modality (60 per cent) and a combined total of US$ 90,739,303 was spent on rural investment grants (see Figure 2).
Figure 2 — Percentage of Total Grants for Rural Investment Grants in Solomon Islands (2008- 2012)
C D F - $ U S 7 1 , 9 0 1 , 4 0 8
R D P - $ U S 8 , 2 7 4 , 8 9 5
P G S P - $ U S 6 , 4 8 0 , 0 0 0
R A M P - $ U S 4 , 0 8 3 , 0 0 0
7 9 %
9 %
7 %4 %
T O T A L - $ U S 9 0 , 7 3 9 , 3 0 3
Figure 3 — Example of Constituency and Ward Boundaries, Choiseul Province
C o n s t i t u e n c y b o u n d a r y
W a r d b o u n d a r y
C o n s t i t u e n c y- o r i e n t e d f u n d s
A f r e s h w a t e r p r o j e c t i n I s a b e l P r o v i n c e .

While there are some distortions in the data such as the absence of RDP funding in Guadalcanal, Central, Rennell and Bellona provinces, the highest proportion of overall provincial investment in the Solomon Islands was found in Malaita Province (25%), followed by Western (19.3%). Per capita, the highest investment was in Temotu ($US 576) and Choiseul ($US 539). To achieve greater equity, efforts should be made to bring provincial per capita amounts closer into alignment. Adjustments could also be made to account for the cost of extreme remoteness, but this should be based primarily on cost data.
P r o v i n c i a l a n d S e c t o r U s e o f F u n d s
s o l o m o n i s l a n d s | p h : + 6 7 7 2 1 4 4 4 | P O B OX 1 7 4 4 , h o n i a r a | w o r l d b a n k .o r g / p i 5
T a b l e 3 — S e c t o r F u n d A l l o c a t i o n s b y P r o g r a m f r o m 2 0 0 8 t o 2 0 1 2 ( i n $ U S )
As Table 3 illustrates, program funding was highest for the housing and community amenities sector (31%), followed by education. Water supply accounted for 63 per cent of the housing and community amenities sector, while 43 per cent of education sector funds was allocated to secondary education (43 per cent of education total) followed by primary education (37 per cent) and pre-primary (14 per cent).
SECTOR AND SUBSECTOR MPP II RAMP (2012) PCDF RDP TotalEconomic Affairs 33,122,454 864,228 1,017,417 159,121 35,163,220 Education 811,561 924,943 2,134,825 897,722 4,769,052 Environmental Protection 92,572 - 16,335 97,963 206,870 General Public Services - 63,128 - 14,903 78,030 Health 185,760 1,313,603 997,761 503,265 3,000,389 Housing and Community Amenities 1,011,478 1,214,496 818,295 2,450,492 5,494,760 Other 382,325 - 27,862 - 410,187 Provincial Government - - 1,032,165 - 1,032,165 Public Order and Services - - 11,235 - 11,235 Recreation, Culture & Religion 138,166 - 240,769 - 378,935 Grand Total 35,744,316 4,380,397 6,296,664 4,123,466 50,544,844
A s e a w a l l i s c o n s t r u c t e d t o p r o t e c t a s m a l l i s l a n d i n M a l a i t a f r o m l o s i n g l a n d t o e r o s i o n f r o m t h e s e a .
T a b l e 2 — C o n s o l i d a t e d D a t a P e r P r o g r a m P e r P r o v i n c e f r o m 2 0 0 8 t o 2 0 1 2 ( i n $ U S )PROVINCE MPP II PCDF RDP RAMP GRAND TOTAL POPULATION PER CAPITACentral Islands - 3,201,867 - 1,697,044 4,898,911 26,051 188 Choiseul 2,116,356 2,629,090 6,201,670 2,016,069 12,963,185 26,372 491Guadalcanal 4,307,370 5,824,562 - 6,275,466 16,407,398 93,613 175Isabel 2,255,277 2,317,420 2,662,816 4,411,502 11,647,015 26,158 445 Makira Ulawa 1,711,137 5,971,178 2,462,622 2,502,891 12,647,828 40,419 313Malaita 3,577,153 15,629,483 6,932,801 7,813,411 33,952,848 137,596 247
National 4,083,662 - - - 4,083,662 - - Rennell & Bellona 195,500 950,197 - 494,375 1,640,072 3,041 539 Temotu 766,288 3,313,436 5,877,324 2,337,556 12,294,604 21,362 576 Western 3,974,168 8,598,646 7,581,733 6,147,071 26,301,618 76,649 343 Total 22,986,911 48,435,879 31,718,966 33,695,385 136,837,141 451,261

p r o g r a m
s o l o m o n i s l a n d s | p h : + 6 7 7 2 1 4 4 4 | P O B OX 1 7 4 4 , h o n i a r a | w o r l d b a n k .o r g / p i 6
p l a n n i n gO V E R V I E W
“A framework to integrate provincial, community-driven,and perhaps constituency-based planning
processes is needed.”
P C D FLargely driven by the provincial administration and the preparation of standardised, periodic plans.
Each of the four programs takes a different approach towards identifying sub-projects to finance, to the use of planning processes, and to the engagement of stakeholders.
R D PPlanning begins with the participatory identification of development needs at the village level followed by the ranking of priorities at the ward level.
R A M PHas no planning process, but identifies sub-projects via open competition.
R C L FRCLF is one of the CDFs. Under the new legislation, all CDFs should begin to use constituency development plans to guide spending. Until now, there has been minimal planning with allocations largely at the discretion of members of parliament and Constituency Development Officers (CDOs).
F i n d i n g sRDP’s bottom-up, participatory planning does not inform provincial planning, and provincial government sector knowledge is not well-utilised to guide the identification of the best solutions to community-level problems.
Emerging constituency-based planning mechanisms are likely to duplicate ward and provincial data collection and planning, and be produced with uneven quality due to limited human resources.
The tokenistic representation of women in village and ward-level planning processes should be reconsidered as this constrains the potentially wider interest of women to participate in decision-making bodies and to establish more of a balance of male and female perspectives.
R e c o m m e n d a t i o n sA framework to integrate provincial, community-driven, and constituency-based planningprocesses is needed to minimise duplication of effort and to develop strategically distinct plans.
A greater clarification and even institutionalisation of ward-level (Ward Development Committee or Authority) governance and decision-making processes would allow for more robust ward plans and monitoring of outcomes.
Constituency development plans should be derived primarily through structured consultationswith constituents and avoid duplication of data gathering at the ward and provincial level.
Rather than identifying women as an interest group with one representative, a minimumpercentage of female members of Ward Development Committees or village groups could be specified (for example, 50 per cent).
local development planning
A c o m m u n i t y c o n s u l t a t i o n i n r u r a l S o l o m o n I s l a n d s .
B u n i W o m e n ’s R e s o u r c e C e n t r e i n W e s t e r n P r o v i n c e .

s o l o m o n i s l a n d s | p h : + 6 7 7 2 1 4 4 4 | P O B OX 1 7 4 4 , h o n i a r a | w o r l d b a n k .o r g / p i 7
To assess efficiency and effectiveness, and allow for a visual comparison, a set of 10 performance measures was developed and each program was rated on a 3-point scale (weak, satisfactory and strong).
F i n d i n g sThere is a trade-off between the speed of disbursement and quality assurance processes, and each of the programs can benefit from improvements in different areas.
With the lightest processes, RCLF delivers funds fastest. This is likely at the cost of value-for-money as there are no competitive procurement processes like other programs, nor use of cost data to check pricing. RCLF also does not monitor sub-projects.
RCLF lacks procedural guidance for its activities, and while the CDF legislation (2013) provides some specifics, there will remain a need for a significant amount of detail in order to strengthen the performance of RCLF as an effective delivery mechanism for development assistance.
CDOs lack the professional skills to design and implement technically sound development projects, and they are often driven by political imperatives rather than development priorities.
There is a lack of information available regarding rural investments and this is an impediment to assessing development results and planning future investments at the sub-national level.
R e c o m m e n d a t i o n sRDP and RAMP are very process-heavy, and thus slower moving. The technical review process of these programs could be streamlined and perhaps even be decentralised to province-level technical specialists, including sector staff working in the provincial administration.
The administrative cost borne by RDP (for Community Helpers) and RCLF (for CDOs) could be optimised through greater provincial integration as provinces have various sources to finance human resources including line ministries, Provincial Service Grants and own revenue.
RDP Community Helpers should be integrated into Provincial Government as a means of strengthening provincial connection to communities and this could be funded with an increase in Provincial Service Grants or through an agency agreement between MDPAC and the respective Provincial Government.
Responsibility for the implementation of RCLF/CDF-funded activities should shift to better resourced and less politically compromised entities such as Provincial Government, certified NGOs, RDP community groups or central government ministries or authorities. This would be in contrast to the constituency funds which pass through line ministries, but which are beyond their administrative control.
An implementation manual (like PCDF, RDP and RAMP’s) should be developed for RCLF and all CDFs for standardisation and to enhance efficiency and effectiveness.
Unit cost data should be shared across the programs to allow for more effective budget preparation and review, and to bring costs down, overall, of public investments.
“There is a lack of information available regarding rural investments and this is an impediment to assessing development results and planning
future investments at the sub-national level.”
E f f i c i e n cy & E f f e c t i v e n e s s
P r o d u c t i v i t y
P r o c u r e m e n t
U n i t C o s t s
H u m a n R e s o u r c e s
F u n d D i s b u r s e m e n t
F u n d U t i l i s a t i o n
F i g u r e 4 — E f f i c i e n c y & E f f e c t i v e n e s s S c o r e R a n k i n g s A c r o s s P r o g r a m s
L e v e r a g e
C o m p a r e t o s e c t o r
L i n k t o l o g f r a m e
M o n i t o r i n g
W E A K S AT I S FA C T O R Y S T R O N G
Effi
cien
cyEf
fect
iven
ess
C o m m u n i t y m e m b e r s c a r r y i n g s a n d a n d g r a v e l a s p a r t o f t h e c o m m u n i t y c o n t r i b u t i o n f o r a c o m m u n i t y h a l l i n M a l a i t a .
P C D F E U R A M PR D P R C L F

Accountability, Transparency & Dispute Management
F i n d i n g s
s o l o m o n i s l a n d s | p h : + 6 7 7 2 1 4 4 4 | P O B OX 1 7 4 4 , h o n i a r a | w o r l d b a n k .o r g / p i 8
Accountability from the programs to national government is reasonably strong in the cases of PCDF and RDP, with each convening regular project committee meetings and sharing progress reports. However, there are limited-to-no accountability mechanisms in place between communities and service providers to monitor the quality of service delivery.
RCLF has no means of reporting progress to government stakeholders, except through ad hoc audits done by the Auditor General which have, to date not been circulated, even within government.
There is very little information as to how RCLF funds are used, at all levels of government and society. This lack of information and accountability stokes concern and criticism of waste, fraud and corruption, which occasionally make their way into the media and public discourse (there is no regular media coverage).
While there have been disputes regarding land and other natural resources, this has not escalated to violence. It appears informal and/or traditional mechanisms for resolving disputes in place are working even if they are not able to uphold agreements made with respect to the sub-projects.
The Kenya Social Audit is designed to assist community groups and individuals to understand the Constituency Development Fund (CDF) process and to provide information and skills on how to monitor these funds through a process known as social auditing. It helps track CDF expenditure in local areas, and with this information better empowers communities in Kenya to make demands on their politicians about how they want their public funds used. It also ensures such projects are constructed in an open and non-corrupt manner.
Case Study 1: Kenya Social Audit, an international comparison
All programs could do better in providing more visual printed materials to affected or beneficiary communities so that they can develop a better understanding as to how these programs work.
Piloting social accountability mechanisms such as community scorecards is recommended to enable community members/beneficiaries to hold service providers accountable for the quality of service delivery, not just the quality of infrastructure construction.
A robust set of accountability and transparency measures for RCLF and all CDFs is needed, including — A realistic financial auditing approach which reflects capacity requirements; regular public reporting requirements including information on funding allocations, expenditures, types of activities funded and recipients; and social accountability mechanisms to allow citizens to monitor the use of funds in their communities. For an example of a comprehensive public accountability mechanism, see Case Study 1.
Utilise mobile phone, SMS, and smartphone technology (where 3G networks are available) to allow community members to more easily provide direct feedback to program management units, and to allow the public to find information online.
R e c o m m e n d a t i o n s
A n u r s e p r o v i d i n g a s e r v i c e t o r e s i d e n t s i n M a k i r a .

“Budget shortfalls and accessing supplies are risks to projects.”
T e c h n i c a l Q u a l i t y & S u s ta i n a b i l i t y
s o l o m o n i s l a n d s | p h : + 6 7 7 2 1 4 4 4 | P O B OX 1 7 4 4 , h o n i a r a | w o r l d b a n k .o r g / p i 9
F i n d i n g s
Overall, the quality of construction of rural infrastructure is sound and appropriate for the supply base available in-country.
The difficulty in accessing supplies and budget shortfalls pose a risk to the full completion of projects, which must be monitored to ensure the integrity of the structures is unaffected.
Per unit and per beneficiary costs vary by province, but overall are generally consistent with similar small-scale rural projects in other parts of the world.
The likelihood of financial sustainability varies widely depending upon the type of infrastructure and the location. However, there is lack of clarity as to who is responsible for what facility, and insufficient data about the extent to which maintenance funds flow from various sources (e.g. national government transfers for education and health).
Projects with a business or economic activity-focus typically place little emphasis on sustainability.
RCLF is weak on all indicators as there are no guidelines or technical reviews to ensure quality, socially and environmentally sound design and construction.
Application of social and environmental risk mitigation is mixed, with monitoring for compliance being generally weak.
The current construction codes for the Pacific are 25 years old. It is necessary to review these codes and update seismic and cyclone design approaches as well as incorporate climate change adaptation approaches into project designs.
Clarity on facility ownerships and guidance on how to budget for the maintenance of various types of infrastructure drawing on available O&M plans and accumulated experience in different sectors is needed.
A catalogue of standard designs and unit costs from across programs would be a useful resource to speed the process of design and ensure quality design standards.
Continue to collect cost-per-beneficiary data for project types, share this information across programs and apply it to project appraisal to ensure that projects are good value for money.
R e c o m m e n d a t i o n s
C o s t b e n e f i t a n a l y s i s
A c c e s s i b i l i t y
E n v i r o n m e n t a l a s s e s s m e n t
O H M p l a n & b u d g e t
M a x i m i s i n g p u b l i c g o o d s
S p a t i a l p l a n n i n g
F i g u r e 5 — S u s t a i n a b i l i t y S c o r e R a n k i n g s A c r o s s P r o g r a m s
W E A K S AT I S FA C T O R Y S T R O N G
P C D F E U R A M PR D P R C L F
C h i l d r e n o n a f o o t b r i d g e c o m p l e t e d u n d e r a r u r a l d e v e l o p m e n t p r o g r a m i n C h o i s e u l P r o v i n c e .

s o l o m o n i s l a n d s | p h : + 6 7 7 2 1 4 4 4 | P O B OX 1 7 4 4 , h o n i a r a | w o r l d b a n k .o r g / p i 10
1. Redefine Funding Streams
There are major policy and program shifts underway for rural community infrastructure and service delivery in the Solomon Islands, including a policy guiding use of constituency funds (2013 CDF Act and draft CDF Regulations). The Rural Development Program is entering its second phase (RDP 2). The Provincial Government Strengthening Program, which previously supported PCDF, has concluded, so PCDF is solely supported by government now. RAMP has come to an end. While each province is different, and flexibility is therefore required, a framework is needed to illustrate how these and other rural, sub-national investment programs and activities fit together and how public and donor funds can be leveraged to greatest effect.
The three overarching recommendations to help to design an improved second generation of rural service delivery programs in the Solomon Islands are —
R e d e f i n e t h e t h r e e m a i n f u n d i n g s t r e a m s — p r o v i n c i a l , c o n s t i t u e n c y a n d c o m m u n i t y.Funds should be aligned to clarified and distinct mandates as well as appropriate capacities for implementation. Financing of similar activities across the funding streams should be minimised (see Table 3).
STREAM STRATEGIC FOCUS OF INVESTMENT FOR EACH LEVEL ACTIVITIES ELIGIBLE FOR FUNDING
Provincial Multi-ward benefits; major, yet medium-scale investments which require technical expertise; infrastructure maintained through recurrent service delivery grants (e.g. health); investments aligned to PG mandates in the PG Act; and sub-projects that lend themselves to contractor delivery.
Primary and secondary schools; hospitals and health clinics; major housing projects; provincial administration infrastructure and equipment; provincial roads, and townships; and pumped water supply.
Constituency Sub-projects that can be managed and monitored by sector ministries; income-generating support based on solid business plans; rapid response to disaster; living condition improvements for disadvantaged households; co-financing of provincial or community- level projects; CDF funds could be transferred to line ministries, government agencies or NGOs for implementation.
Sustainable livelihood projects (agriculture, aquaculture and horticulture, manufacturing, sustainable forest products); minor road or bridge repairs; improved housing stock; improved electricity access; supplies to rebuild houses, supply food, water and shelter, etc., after a disaster; and emergency repair of public infrastructure such as roads and bridges.
Community Infrastructure that can be operated and maintained primarily by community-generated funding and labor; investments that have broad community benefit and have been prioritised by the community; beneficiaries are mainly within one ward or village; not technically complex, requiring specialised parts or technical expertise that is difficult to find in rural areas; and keep project budgets generally below SBD 200,000.
Small feeder roads, ildings that already exist; community water supply and sanitation; community electricity supply such as solar charging stations, mini-grid and micro-hydro; multi-purpose or groups-specific (i.e. women or youth) community halls/resource centres; new community-oriented education or health infrastructure such as kindergartens; housing for public service delivery personnel; etc.
T a b l e 3 — P r o p o s e d R e f o c u s o f F u n d i n g S t r e a m s
Overall Recommendations
To ensure all three funding streams continue to flow beyond donor financing, the Solomon Island Government should make a long-term commitment through its development plans and through regularly allocated resources. These grants could be made into recurrent grants, such as a Provincial Development Grant to complement the existing Provincial Service Grant that largely funds staff and operating expenses. Community or Ward Development Grants could allow Members of Provincial Assembly to minimise the use of their discretional funds on development and focus instead on constituency engagement, which requires more modest funds.
2. Redistribute and Institutionalize FundsS h i f t t h e b a l a n c e away f r o m s p e n d i n g a m a j o r i t y o f r u r a l i n v e s t m e n t f u n d s o n C D F s a n d r e d i s t r i b u t e f u n d s t o wa r d s t h e o t h e r , w e l l- p e r f o r m i n g m o d a l i t i e s at t h e p r o v i n c i a l a n d c o m m u n i t y l e v e l s .

s o l o m o n i s l a n d s | p h : + 6 7 7 2 1 4 4 4 | P O B OX 1 7 4 4 , h o n i a r a | w o r l d b a n k .o r g / p i 11
3. Integrate ProcessesI m p l e m e n t a n i n t e g r at e d p l a n n i n g p r o c e s s
a c r o s s t h e f u n d i n g s t r e a m s t o a l i g n w i t h t h e r e d e f i n e d f o c u s o f e a c h s t r e a m .
The planning process should be fed from the bottom-up, starting with participatory planning at the village and ward levels, then advancing up through the provincial and national levels (see Table 4). Coordination across the various levels and funding programs should be centred around the annual provincial planning process.
LEVEL PLANNING PRODUCT PEOPLE FREQUENCY APPROVAL PROCESS KEY RECOMMENDATIONS
National National Development Strategy (10 years)
Inter-ministerial government task force led by MDPAC
Every 10 years Adopted and approved by Cabinet No changes required
Provincial Government
Strategic Plan
Medium Term Development Plan
Annual Plan and Budget and including recurrent budgets
Planning divisions and TPBU
Planning divisions and TPBU
Provincial executive, final plans approved for release by the provincial assembly
Every 5 years
Every 3 years with annual validation
Annual
Provincial Government Executives.
Provincial Assembly (for budget only)
Every 6 years with annual validation
New Annual planning forum based on PPDC, with target of 50 per cent representation of women
All constituency, provincial and community projects are included
Sectors Sector Corporate Plans and Sector Profiles prepared.
National ministries prepare corporate plans and budgets
Sector profiles every 3 years
Adopted and Approved by Cabinet Sectors and WDCs to conduct profiling in parallel. Wards to consult with relevant sector on prioritised projects before approving and forwarding
Constituency Constituency Development Plans
Provincial Government planning division and TPBU to be part of any planning advisory body that develops constituency plans
Timing needs to be linked to Provincial Medium Term Development Plan and Strategic Plan Development
Constituency plan approval process unclear. In this process, projects approved in the integrated planning process will be included as part of a constituency development plan
CDOs to become part of the provincial planning process as advisory members of the TPBU
Ward Ward Development Profile
Ward Development Plan (including project ranking)
Ward Development Committee, supported by provincial planning divisions through CHs
WDC to develop a full ward profile with identified prioritised projects every 3 years. Update basic data in the ward profile annually
Ward profile and ranked community projects will be approved by WDC every three years and forwarded to the provincial government
WDC to not only rank community projects, but also identify priorities for constituency and provincial funding.
Increase representation of women to comprise 50 per cent of the members
Village/Community
Village data fed into Ward Profile
Prioritised village projects
Village development meeting inclusive of everyone in the community, and allowing for participation
Re-priorituse projects every three years. Provide basic data to update ward profile annually
Village priorities will be agreed by consensus at open village meeting and forwarded to WDC for ranking
Standard village data collections forms to be developed and facilitated by CHs
E s ta b l i s h a n d m a i n ta i n a n i n t e r - m i n i s t e r i a l S u b n at i o n a l F i n a n c i n g C o o r d i n at i o n G r o u p ( S F C G ) t o i m p l e m e n t p r o g r a m s .
Recommendations of this report entail a restructuring and integration of existing funding streams and their associated management structures. Therefore, units responsible for management of amended streams will need to review this report, come to a consensus on agreed changes and map out a plan of action.
Overall Recommendations
T a b l e 4 — P r o p o s e d I n t e g r a t e d P l a n n i n g F r a m e w o r k
INTERMINISTERIAL COORDINATION GROUP
V i l l a g e r s a t t h e o p e n i n g c e r e m o n y o f a f r e s h w a t e r s u p p l y p r o j e c t i n Te m o t u . P r o v i n c e .

s o l o m o n i s l a n d s
p h : + 6 7 7 2 1 4 4 4 | P O B OX 1 7 4 4 , h o n i a r a | w o r l d b a n k .o r g / p i