Embed Size (px)
Citation preview
World Bank Reprint Series: Number 274
Ron Duncan and Ernst Lutz
Peneiration of IndustrialCountry Marketsby Agricultural Productsfrom Developing Countries
Reprinted with permission from World Development, vol. 11, no. 9 (1983), pp. 771-86.
Pub
lic D
iscl
osur
e A
utho
rized
Pub
lic D
iscl
osur
e A
utho
rized
Pub
lic D
iscl
osur
e A
utho
rized
Pub
lic D
iscl
osur
e A
utho
rized
Pub
lic D
iscl
osur
e A
utho
rized
Pub
lic D
iscl
osur
e A
utho
rized
Pub
lic D
iscl
osur
e A
utho
rized
Pub
lic D
iscl
osur
e A
utho
rized

World Bank Reprints
No. 238. Richard H. Goldman and Lyn Squire, "Technical Change, Labor Use,and Income Distribution in the Muda Irrigation Project," EconomicDevelopment and Cultural Change
No. 239. J. Michael Finger, "Trade and the Structure of American Industry,"Annals of the American Academy of Political and Social Science
No. 240. David M.G. Newbery and Joseph E. Stiglitz, "Optimal CommodityStock-piling Rules," Oxford Economic Papers
No. 241. Bela Balassa, "Disequilibrium Analysis in Developing Economies: AnOverview," World Development
No. 242. T.N. Srinivasan, "General Equilibrium Theory, Project Evaluation,and Economic Development," The Theory and Experience of EconomicDevelopment
No. 243. Emmanuel Jimenez, "The Value of Squatter Dwellings in DevelopingCountries," Economic Development and Cultural Change
No. 244. Boris Pleskovic and Marjan Dolenc, "Regional Development in aSocialist, Developing, and Multinationai Country: The Case of Yugo-slavia," International Regional Science Review
No. 245. Mieko Nishimizu and John M. Page, Jr., "Total Factor ProductivityGrowth, Technological Progress, and Technical Efficiency Change:Dimensions of Productivfty Change in Yugoslavia, 1965-78," TheEconomic Journal
No. 246. J. M. Finger, "The Political Economy of Administered Protection"(with H. Keith Hall and Douglas R. Nelson), The American EconomicReview; and "The Industry-Country Incidence of 'Less than Fair Value'Cases in U.S. Import Trade," Quarterly Review of Economics and Business
No. 247. Nancy Birdsall and Susan Hill Cochrane. "Education and ParentalDecision Making: A Two-Generation Approach," Education and Devel-opment
No. 248. Kemal Dervis, Jaime de Melo, and Sherman Robinson, "A GeneralEquilibrium Analysis of Foreign Exchange Shortages in a DevelopingEconomy," The Economic Journal
No. 249. Kyu Sik Lee, "A Model of Intraurban Employment Location: AnApplication to Bogota, Colombia," Journal of Urban Economics
No. 250. J. B. Knight and R. H. Sabot, "From Migrants to Proletarians:Employment Experience, Mobility, and Wages in Tanzania," OxfordBulletin of Economics and Statistics
No. 251. M. Louise Fox, "Income Distribution in Post-1964 Brazil: NewResults," Journal of Economic History
No. 252. Nizar Jetha, "The Welfare Cost of Taxation: Its Meaning and Measure-ment," Bulletini for International Fiscal Documentation
No. 253. Larry E. Westphal, "Fostering Technological Mastery by Means ofSelective Infant-Industry Protection," Trade, Stability, Technology, andEquity in Latin America
No. 254. Gershon Feder, "On Exports and Economic Growth," Journal ofDevelopment Economics

World Development, Vol. 11, No. 9, pp. 771-786, 1983. 0305-750X/83/$3.00 + 0.00Printed in Great Britain. © 1983 Pergamon Press Ltd.
Penetration of Industrial Country Marketsby Agricultural Products from
Developing Countries
RON DUNCAN and ERNST LUTZ*The World Bank, Washington, D. C.
Su-mmary. - About 55% of food and about 60%'o of non-food agricultural exports of the developingcountries are sold in industrial country markets. Market access is therefore inmportant.
Wnile the developing countries have been able to increase the market penetration of theirmanufactured exports in industrial countries at a remarkable rate of about 8% in the 1970s,market penetration in agricultural commodities has generally been less successful.
From 1970 to 1980 the developing countries were able to increase their market penetra-tion in processed agricultural commodities from 3.5 to 3.7%, which amounts to an averageannual increase of only 0.6%. In basic agricultural products like sugar, maize, tomatoes andbeef they even incurred losses in their market share that corresponded to an increase in thedegree of self-sufficiency (and probably of protective trade barriers) of the industrial countries.in particular the EC.
1. INTRODUCTION to the change in the degree of import pene-tration of these markets by developing countries
The industrial countries have been the most that has occurred during the 1 970s, and whetherimportant market for most basic agricultural protectionism may affect the future growth ofcommodity exports. Of the commodities exports of agricultural products, both basic aslisted in Table 1 below, this statement is true well as processed, from the developing countriesfor all except rice, wheat, jute, cotton and to the industrial country markets.sugar. Trade in rice has always been largely As far as developing country exports to thebetween the developing countries of South industrial nations and to each other are con-and East Asia. However, the importance of cerned, protectionism is an important factordeveloping and centrally planned economies on the demand side. The focus of this study isin wheat, jute, cotton and sugar is of recent, on market penetration and is therefore moreorigin. The newly industrializing or middle- concerned with demand-side than with supply-income developing countries have become side factors. However, it needs to be pointeddominant in imports of wheat only in the out that the policies of developing countriesmid-l 970s as they have experienced quicklygrowing incomes. Also, because of the increaseddemand for meat, coarse grain imports have *The autlhors are Chief, Commodities and Exportgained in importance in recent years. The Projections Division and Economist, Internationalshift of jute milling from Europe to the develop- Trade and Capital Flows Division, respectively, Eco-ing countries is also a phenomenon of the nomic Analysis and Projections Department, World1970s. In sugar and cotton the developing Bank. We are indebted to Helen Hughes and Vasiliscountries' markets have surpassed those of the Panoutsopoulos for access to the market penetrationindustrial countries only recently. These data, to Helen Bothwell for FAO data preparation andobservations highlight the fact that the domin- to Aeran Lee for excellent research assistance. Also,ance of Western industrial countries in the we would like to thank two anonymous referees ofancepof Westernainduforastricultural coun n t World Development for valuable comments on animport demand for basic agricultural commo- earlier version of the paper. The views and interpreta-
dities may well be eroded further in the future. tions in this article are those of the authors and mayBe that as it may, they are presently still not be attributed to the World Bank or its affiliatedimportant importers and the questions arise as organizations.
771

772 WORLD DEVELOPMENT
Table 1. Shares of world imports of basic agricultural commodities held bymajor world regions, 1981* (in per cent)
Industrial Developing Centrally plannedCommnodity countries countries economies
Coffee 83 12 5Cocoa beans 72 10 18Tea 45 42 13Sugar (total raw and refined) 34 43 23Beef and veal 69 19 12Bananas 84 13 3Fresh citrus fruit 68 16 16Rice 11 74 15Coarse grains 36 35 29Wheat 18 56 26Oilseeds, fats and oils 55 39 6Cotton 35 48 17Jute 22 56 22Rubber 60 27 13Tobacco 61 27 12
Source: FAO, Trade Yearbook (1981).*Economic classification according to the definition used in 'The outlook for primarycommodities', World Bank Staff Commodity Working Paper No. 9 (January 1983).
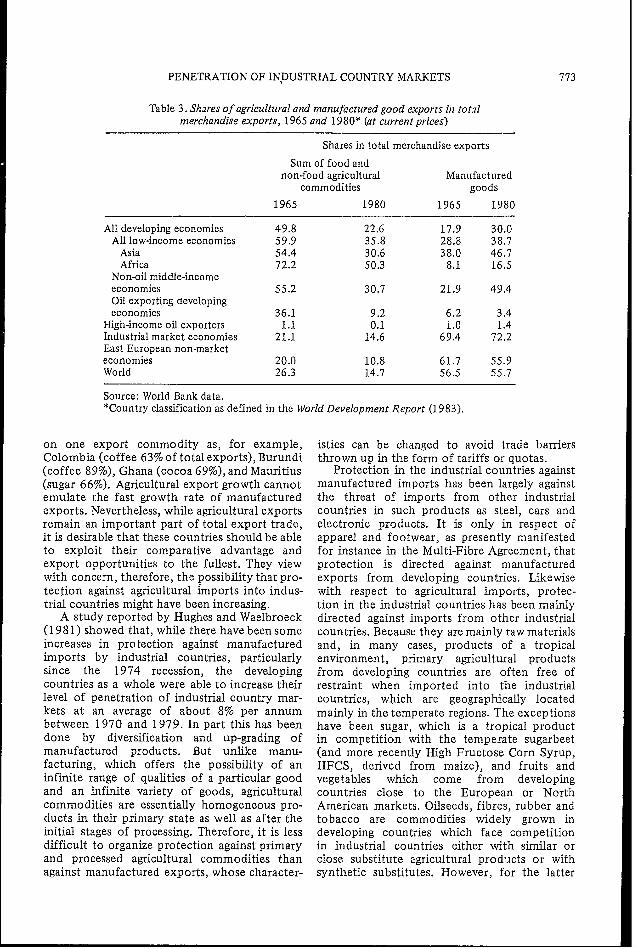
which affect their production and exports are of agricultural commodity trade in total exportsalso of importance (see e.g. Bale and Duncan, was 50% in 1965 and declined to 23% in 19801983). (see Table 3). For the low-income, oil-importing
Trade in agricualtural products is no longer as developing countries the share has declinedimportant for developing countries as it once from 60% in 1965 to 36% in 1980.was. Manufactured exports have been growing Nevertheless, for some developing countriesfaster than agricultural exports for some years - particularly those in the low-income categorynow (see Table 2) and the relative importance - agricultural exports are still an importantof agricultural trade has corresporndingly de- part of total trade. In many of these cases,clined. For all developing countries the share moreover, the countries are highly dependent
Table 2. Export growth of major world regions: agricultural trade comparedwith manufactures trade, 1965-1980* (average annual growth rates
1965-1980 at constant 1980 prices)
Non-foodagricultural Manufactured
Food commodities goods
All developing economies 4.5 3.9 14.1All low-income economies 4.1 3.6 8.6
Asia 5.1 5.7 8.5Africa 1.8 -1.3 9.0
Non-oil middle-incomeeconomies 5.5 5.5 16.5Oil exporting developingeconomies 0.0 2.1 5.7
High-income oil exporters -4.1 -1.2 19.1Industrial market economies 6.7 3.4 8.1East European non-marketeconomies 2.6 4.9 7.6World 5.6 3.7 8.5
Source: World Bank data.*Country classification as defined in the TWorldcIDevelopment Report (1983).
PENETRATION OF INpUSTRIAL COUNTRY MARKETS 773
Table 3. Shares of agricultural and manuifactured good exports in totalmerchandise exports, 1965 and 1980* (at current prices)
Shares in total merchandise exports
Sum of food andnon-food agricultural Manufactured
commodities goods
1965 1980 1965 1980
All developing economies 49.8 22.6 17.9 30.0All low-income economies 59.9 35,8 28.8 38.7
Asia 54.4 30.6 38.0 46.7Africa 72.2 50.3 8.1 16.5
Non-oil middle-incomeeconomies 55.2 30.7 21.9 49.4Oil exporting developingeconomies 36.1 9.2 6.2 3.4
High-income oil exporters 1.1 0.1 1.0 1.4Industrial market economies 21.1 14.6 69.4 72.2East European non-marketeconomies 20.0 10.8 61.7 55.9World 26.3 14.7 56.5 55.7
Source: World Bank data.*Country classification as defined in the World Development Report (1983).
on one export commodity as, for example, istics can be changed to avoid trade barriersColombia (coffee 63% of total exports), Burundi thrown up in the form of tariffs or quotas.(coffee 89%), Ghana (cocoa 69%), and Mauritius Protection in the industrial countries against(sugar 66%). Agricultural export growth cannot manufactured imports has been largely againstemulate the fast growth rate of manufactured the threat of imports from other industrialexports. Nevertheless, while agricultural exports countries in such products as steel, cars andremain an important part of total export trade, electronic products. It is only in respect ofit is desirable that these countries should be able apparel and footwear, as presently manifestedto exploit their comparative advantage and for instance in the Multi-Fibre Agreement, thatexport opportunities to the fullest. They view protection is directed against manufacturedwith concern, therefore, the possibility that pro- exports from developing countries. Likewisetection against agricultural imports into indus- with respect to agricultural imports, protec-trial countries might have been increasing. tion in the industrial countries has been mainly
A study reported by Hughes and Waelbroeck directed against imports from other industrial(1981) showed that, while there have been some countries. Because they are mainly raw materialsincreases in protection against manufactured and, in many cases, products of a tropicalimports by industrial countries, particularly environment, primary agricultural productssince the 1974 recession, the developing from developing countries are often free ofcountries as a whole were able to increase their restraint when imported into the industriallevel of penetration of industrial country mar- countries, which are geographically locatedkets at an average of about 8% per annum mainly in the temperate regions. The exceptionsbetween 1970 and 1979. In part this has been have been sugar, which is a tropical productdone by diversification and up-grading of in competition with the temperate sugarbeetmanufactured products. But unlike manu- (and more recently High Fructose Corn Syrup,facturing, which offers the possibility of an HFCS, derived from maize), and fruits andinfinite range of qualities of a particular good vegetables which come from developingand an infinite variety of goods, agricultural countries close to the European or Northcommodities are essentially homogeneous pro- American markets. Oilseeds, fibres, rubber andducts in their primary state as well as after the tobacco are commodities widely grown ininitial stages of processing. Therefore, it is less developing countries which face competitiondifficult to organize protection against primary in industrial countries either with similar orand processed agricultural commodities than close substitute agricultural prod' cts or withagainst manufactured exports, whose character- synthetic substitutes. However, for the latter

774 WORLD DEVELOPMENT
group of commodities the protection in the after steps toward freer trade are taken, whichindustrial countries has been, at least at first, will be in the interest of all trading parties.directed aga4nst imports from other industrial It would be a difficult task to assess whethercountries, The shares in world trade of the the level and extent of protection againstmajor regions for 22 basic agricultural com- agricultural commodities by the industrialmodities are shown in Table 4. countries changed throughout the 1 970s.
Table 4. Sha2res of world exports of basic agricultural commoditiesheld by the thzree ma/or world regions, 1981* (in per cent)
Inouistrial 'Developing Centrally plannedCommodity countries countries economies
Coffee 5 95 0Cocoa 5 95 0Tea 92 2Sugar 33 - 40 27Beef 7 2 19 9
Bananas 4 96 0Fresh citrus fruits 25 73 2Rice 38 59 3Coarse grains 77 21 2Wheat 91 5 4Soybeans 83 17 0Soybean oil 47 53 0Groundnuts 21 77 2Groundnut oil 27 73 0Copra 0 100 0Coconut oil 5 95 0Palm oil 3 97 0Palm kernels 2 98 0Cotton 33 47 20Jute 3 96 1Rubber 1 98 1Tobacco 32 60 7
Source: FAO, Trade Yearbook (1981).*See footnote to Table 1.
The advantage generally held by the exporter The main reason is that there have been a largeof tropical basic commodities does not carry number of decisions affecting the degree ofover to processed products. To protect their protectionism and the impact of those decisionsdomestic processing industries, protection in cannot easily be quantified. Moreover, manyindustrial countries is normally higher the of the trade barriers faced by agriculturalhigher the degree of processing involved. products are non-tariff barriers. However, it
The industrial countries are not the only is possible to determine the chainges in marketones where trade barriers are a hindrance to the penetration of these products by exportingfree flow of goods. The centrally planned eco- countries during the 1970s. What changes innomies through their state trading practices are the degree of market penetration for a historicalhighly protectionist by nature. But also develop- period imply as far as future export prospectsing countries themselves, in particular some of of developing countries are concerned is obvi-the newly industrializing ones, have erected ously not easy to assess quantitatively. Astrade barriers that are limiting trade - not least implied above, one of the difficulties involvedwith other developing countries. Whenever relates to the question of the extent to whichprotectionism occurs there are economic costs changes in the rate of market penetration areassociated with it (see e.g. Bale and Lutz, due to supply-side constraints and competition1981). It is therefore important that in the first from other suppliers as compared to demand-instance the establishment of further protec- side barriers.tionist measures be prevented and that there-
PENETRATION OF INDUSTRIAL COUNTRY MARKETS 775
2. PENETRATION OF AGRICULTURAL For some of these, such as fruits and vegetables,EXPORTS OF DEVELOPING COUNTRIES sugar, cocoa and tobacco, the developing
IN INDUSTRIAL COUNTRY MARKETS countries are important raw material producersand exporters (see Table 4). Tables 5-8 show
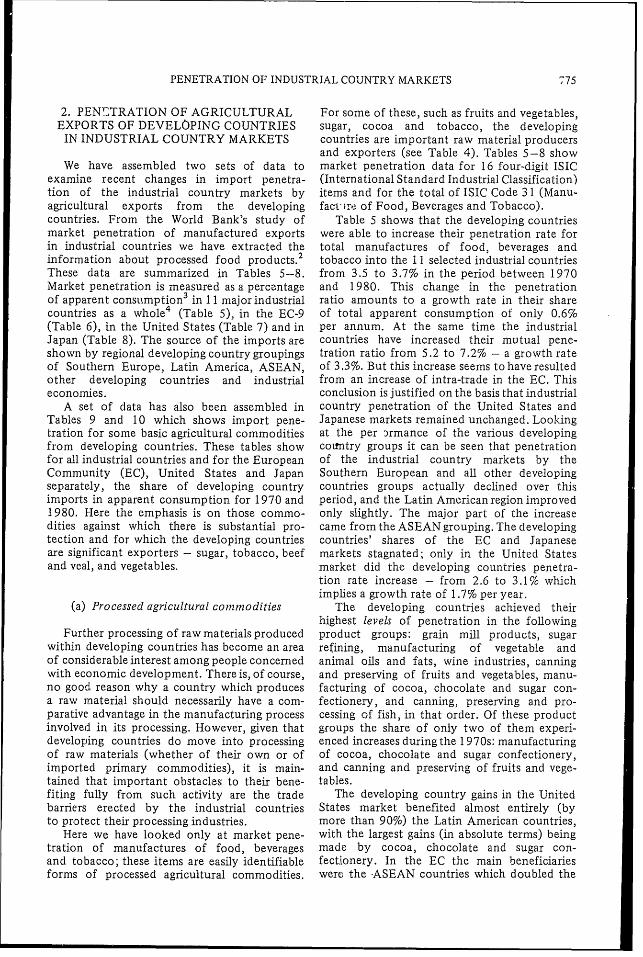
We have assembled two sets of data to market penetration data for 16 four-digit ISICexamine recent changes in import penetra- (International Standard Industrial Classification)tion of the industrial country markets by items and for the total of ISIC Code 31 (Manu-agricultural exports from the developing fact zre of Food, Beverages and Tobacco).countries. From the World Bank's study of Table 5 shows that the developing countriesmarket penetration of manufactured exports were able to increase their penetration rate forin industrial countries we have extracted the total manufactures of food, beverages andinformation about processed food products.2 tobacco into the 11 selected industrial countriesThese data are summarized in Tables 5-8. from 3.5 to 3.7% in the period between 1970Market penetration is measured as a percantage and 1980. This change in the penetrationof apparent consuzmption 3 in 11 major industrial ratio amounts to a growth rate in their sharecountries as a whole4 (Table 5), in the EC-9 of total apparent consumption of only 0.6%(Table 6), in the United States (Table 7) and in per annum. At the same time the industrialJapan (Table 8). The source of the imports are countries have increased their mutual pene-shown by regional developing country groupings tration ratio from 5.2 to 7.2% - a growth rateof Southern Europe, Latin America, ASEAN, of 3.3%. But this increase seems to have resultedother developing countries and industrial from an increase of intra-trade in the EC. Thiseconomies. conclusion is justified on the basis that industrial
A set of data has also been assembled in country penetration of the United States andTables 9 and 10 which shows import pene- Japanese markets remained unchanged. Lookingtration for some basic agricultural commodities at the per Drmance of the various developingfrom developing countries. These tables show cotmtry groups it can be seen that penetrationfor all industrial countries and for the European of the industrial country markets by theCommunity (EC), United States and Japan Southern European and all other developingseparately, the share of developing country countries groups actually declined over thisimports in apparent consumption for 1970 and period, and the Latin American region improved1980. Here the emphasis is on those commo- only slightly. The major part of the increasedities against which there is substantial pro- came from the ASEAN grouping. The developingtection and for which the developing countries countries' shares of the EC and Japaneseare significant exporters - sugar, tobacco, beef markets stagnated; only in the United Statesand veal, and vegetables. market did the developing countries penetra-
tion rate increase - from 2.6 to 3.1f% whichimplies a growth rate of 1.7% per year.
(a) Processed agricultural commodities The developing countries achieved theirhighest levels of penetration in the following
Further processing of raw materials produced product groups: grain mill products, sugarwithin developing countries has become an area refining, manufacturing of vegetable andof considerable interest among people concerned animal oils and fats, wine industries, canningwith economic development. There is, of course, and preserving of fruits and vegetables, manu-no good reason why a country which produces facturing of cocoa, chocolate and sugar con-a raw material should necessarily have a com- fectionery, and canning, preserving and pro-parative advantage in the manufacturing process cessing of fish, in that order. Of these productinvolved in its processing. However, given that groups the share of only two of them experi-developing countries do move into processing enced increases during the 1 970s: manufacturingof raw materials (whether of their own or of of cocoa, chocolate and sugar confectionery,imported primary commodities), it is main- and canning and preserving of fruits and vege-tained that important obstacles to their bene- tables.fiting fully from such activity are the trade The developing country gains in the Unitedbarriers erected by the industrial countries States market benefited almost entirely (byto protect their processing industries. more than 90%) the Latin American countries,
Here we have looked only at market pene- with the largest gains (in absolute terms) beingtration of manufactures of food, beverages made by cocoa, chocolate and sugar con-and tobacco; these items are easily identifiable fectionery. In the EC the main beneficiariesforms of processed agricultural commodities. were the ASEAN countries which doubled the
T ablc 5. Market penetration of processed agriciultural products in 11 inzaJor indtustrial countries, 1970 and 1980
Southern Latin IndtistriallSIC World* Europe America ASEAN Other LDCs All LDCs cotuntrics
Processed agricultural products code 1970 1980 1970 1980 1970 1980 1970 1980 1970 19o0 1970 1980 1970 1980
Manufacture of food, beveragesand tobacco 31 8.966 11.122 0.332 0.311 1.741 1.826 0.277 0.449 1.166 1.161 3.485 3.717 5.217 7.191Slaughtering, preparing andpreserving meat 3111 12.252 14.148 0.252 0.165 1.627 0.916 0.032 0.064 0.657 0.679 2.539 1.798 9.019 11.642
Manufacture of dairy products 3112 5.549 8.264 0.024 0.016 0.025 0.019 0.000 0.001 0.005 0.008 0.055 0.044 5.400 8.145Canning and preserving of fruitsand vegetables 3113 10.380 13.899 1.871 1.910 0.402 1.285 0.266 0.628 1.634 2.338 4.121 6.070 5.786 7.449 0Canning, preserving and xprocessing of fish 3114 14.671 19.337 1.237 0.528 0.623 0.314 0.154 0.762 1.695 2.310 3.638 3.823 10.130 7.996 UManufacturing of vegetableand animal oils and fats 3115 20.305 12.479 1.084 0.481 4.133 3.838 '.962 2.964 3.573 2.312 10.482 9.489 9.208 9.935 tGrain mill products 3116 21.925 22.809 0.020 0.055 12.931 12.748 t 544 1.307 7.352 6.411 20.001 19.679 1.920 3.124 <Manufacture of bakery products 3117 1.166 2.104 0.007 0.028 0.002 0.015 0.001 0.018 0.019 0.051 0.029 0.112 1.136 1.987 tSugar factories and refineries 3118 22.588 25.749 0.098 0.028 8.447 8.242 2.945 2.461 5.926 6.347 16.681 16.499 5.612 9,212 0Manufacture of cocoa, chocolateand sugar confectionery 3119 7.346 12.073 0.098 0.260 0.439 1.655 0.032 0.275 1.220 1.578 1.795 3.753 5.489 8.263 tTiManufacture of food products,
ZN.E.S. 3121 4.510 6.867 0.130 0.135 0.750 1.218 0.127 0.177 0.340 0.362 1.344 1.887 3.106 4.958 HManufacture of prepared animalfeeds 3122 1.536 2.031 0.006 0.013 0.099 0.035 0.008 0.035 0.040 0.022 0.153 0.106 1.377 1.912
Distilling, rectifying andblending spirits 3131 11.5793 14.506 0.199 0.375 0.512 0.969 0.005 0.006 0.233 0.101 0.950 1.454 10.794 12.927WVine industries 3132 19.553 35.446 3.672 6.142 0.025 0.119 0.000 0.003 3.674 0.418 7.255 6.663 12.104 28.057Malt liquors and malt 3133 1.917 4.241 0.006 0.012 0.015 0.080 0.006 0.014 0.004 0.008 0.031 0.114 1.777 4.021Soft drinks and carbonatedwaters industries 3134 0.384 1.316 0.003 0.012 0.001 0.009 0.000 0.008 6.001 0.006 0.005 0.035 0.378 1.281Tobacco manufactures 3140 1.137 3.992 0.014 0.019 0.020 0.133 0.003 0.006 0.051 0.108 0.089 0.268 1.048 3.724
Source: World Bank, Market Penetration Project.*Including centrally planned economies.

Table 6. Market penetration of processed agricultitural products in the European Community, 1970 and 1980
Southern Latin industrialIsic World* Europe America ASEAN Other LDCs All LDCs countries
Processed agricultural products code 1970 1980 1970 1980 1970 1980 1970 1980 1970 1980 1970 1980 1970 1980 10-Z
Manufacture of food, beverages ttand tobacco 31 15.449 19.596 0.663 0.616 2.281 2.159 0.221 0.471 2.047 1.957 5.110 5.133 9.753 14.051
Slauglhtering, preparing andpreserving meat 3111 26.527 27.873 0.682 0.338 3.262 1.385 0.058 0.051 1.665 1.261 5.449 2.898 19.376 23.571 3
Manufacture of dairy products 3112 12.564 14.976 0.021 0.009 0.013 0.005 0.000 0.000 0.011 0.012 0.045 0.026 12.300 14.867 0Canning and preserving of fruits Zand vegetables 3113 23.725 33.332 3.884 5.089 0.657 2.014 0.483 0.527 3.596 4.031 8.266 11.284 14.177 20.933 °
Canning, preserving andprocessing of fish 3114 36.310 47.429 3.678 2.554 0.934 0.866 0.288 2.018 6.359 9.970 9.932 12.710 23.325 31.907 Z
Manufacturing of vegetable eand animal oils and fats 3115 38.978 45.781 2.138 1.120 8.415 9.867 2.362 5.203 9.000 6.656 19.894 21.452 17.664 24.222 C
Grain mill products 3116 25.015 30.230 0.046 0.128 13.149 13.236 0.432 1.366 9.251 11.062 21.595 24.147 3.411 6.072Manufacture of bakeiy products 3117 2.301 4.801 0.009 0.040 0.001 0.000 0.002 0.015 0.020 0.020 0.033 0.075 2.266 4.718Sugar factories and refineries 3118 19.303 20.021 0.247 0.058 4.477 3.722 0.016 0.031 5.817 7.587 10.176 11.528 8.571 8.411 t-Manufacture of coal, chocolate - n
and sugar confectionery 3119 12.255 18.164 0.166 0.469 0.545 0.881 0.052 0.153 2.064 2.551 2.913 4.143 9.230 13.928 0Manufacture of food products, z
N.E.S. 3121 12.187 18.855 0.352 0.340 P.225 1.873 0.148 0.180 0.794 0.714 2.512 3.093 9.433 15.698 HManufacture of prepared animal
feeds 3122 2.803 3.643 0.013 0.025 0.174 0.047 0.008 0.017 0.030 0.028 0.225 0.117 2.567 3.498Distilling, rectifying and
blending spirits 3131 8.283 15.179 0.394 0.686 0.915 1.325 0.005 0.004 0.523 0.194 1.933 2.252 6.273 12.783Wine industries 3132 18.523 36.411 3.242 6.739 0.010 0.103 0.000 0.000 4.510 0.472 7.880 7.356 10.435 28.269 tMalt liquors and malt 3133 2.840 4.192 0.013 0.020 0.006 0.007 0.000 0.001 0.008 0.004 0.027 0.032 2.684 4.083 -Soft drinks and carbonated w
waters industries 3134 1.184, 3.621 0.005 0.024 0.000 0.004 0.000 0.003 0.004 0.011 0.009 0-043 1.174 0.043Tobacco manufactures 3140 1.623 8.164 0.001 0.012 0.005 0.022 0.002 0.004 0.060 0.185 0.069 0.227 1.555 7.937
Source: World Bank, Market Penetration Project.*Including centrally planned economies.
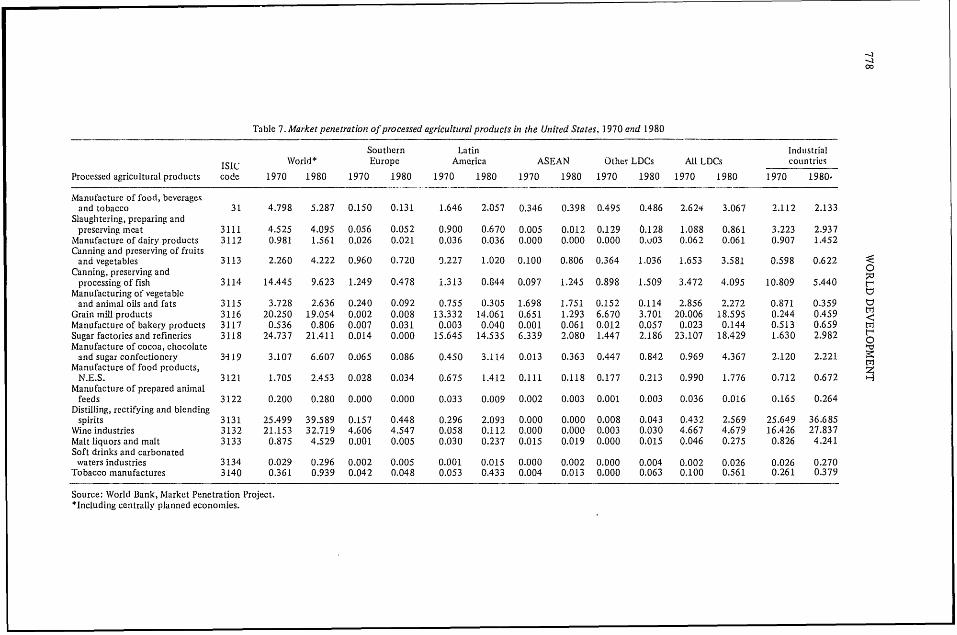
Table 7. Market penetration of processed agricultural products in the Ulnited States, 1970 and 1980
Southern Latin IndustrialIS1( World* Europe America ASEAN Other LDCs All LDCs countries
Processed agricultural products code 1970 1980 1970 1980 1970 1980 1970 1980 1970 1980 1970 1980 1970 1980-
Manufactture of food, beveragesand tobacco 31 4.798 5.287 0.150 0.131 1.646 2.057 0.346 0.398 0.495 0.486 2.624 3.067 2.112 2.133Slaughtering, preparing andpreserving meat 3111 4.525 4.095 0.056 0.052 0.900 0.670 0.005 0.012 0.129 0.128 1.088 0.861 3.223 2.937Manufacture of dairy products 3112 0.981 1.561 0.026 0.021 0.036 0.036 0.000 0.000 0.000 0.u03 0.062 0.061 0.907 1.452Canning and preserving of fruitsand vegetables 3113 2.260 4.222 0.960 0.720 0.227 1.020 0.100 0.806 0.364 1.036 1.653 3.581 0.598 0.622 <Canning, preserving and
0processing of fish 3114 14.445 9.623 1.249 0.478 1.313 0.844 0.097 1.245 0.898 1.509 3.472 4.095 10.809 5.440 t-Manufacturing of vegetableand animal oils and fats 3115 3.728 2.636 0.240 0.092 0.755 0.305 1.698 1.751 0.152 0.114 2.856 2.272 0.871 0.359 tGrain mill products 3116 20.250 19.054 0.002 0.008 13.332 14.061 0.651 1.293 6.670 3.701 20.006 18.595 0.244 0.459 <Manufacture of bakery products 3117 0.536 0.806 0.007 0.031 0.003 0.040 0.001 0.061 0.01]2 0.057 0.023 0.144 0.513 0.659 IdSugar factories and refineries 3118 24.737 21.411 0.014 0.000 15.645 14.535 6.339 2.080 1.447 2.186 23.107 18.429 1.630 2.982 tManufacture of cocoa, chocolate
Iand sugar confectionery 3-119 3.107 6.607 0.065 0.086 0.450 3.114 0.013 0.363 0.447 0.842 0.969 4.367 2.120 2.221 4Manufacture of food products, zN.E.S. 3121 1.705 2.453 0.028 0.034 0.675 1.412 0.111 0.118 0.177 0.213 0.990 1.776 0.712 0.672 HManufacture of prepared animal
feeds 3122 0.200 0.280 0.000 0.000 0.033 0.009 0.002 0.003 0.001 0.003 0.036 0.016 0.165 0.264Distilling, rectifying and blendingspirits 3131 25.499 39.589 0.157 0.448 0.296 2.093 0.000 0.000 0.008 0.043 0.432 2.569 25.649 36.685Wine industries 3132 21.153 32.719 4.606 4.547 0.058 0.112 0.000 0.000 0.003 0.030 4.667 4.679 16.426 27.837Malt liquors and malt 3133 0.875 4.529 0.001 0.005 0.030 0.237 0.015 0.019 0.000 0.015 0.046 0.275 0.826 4.241Soft drinks and carbonated
waters industries 3134 0.029 0.296 0.002 0.005 0.001 0.015 0.000 0.002 0.000 0.004 0.002 0.026 0.026 0.270Tobacco manufactures 3140 0.361 0.939 0.042 0.048 0.053 0.433 0.004 0.013 0.000 0.063 0.100 0.561 0.261 0.379
Source: WVorld Bank, Market Penetration Project.*Including centrally planned economies.
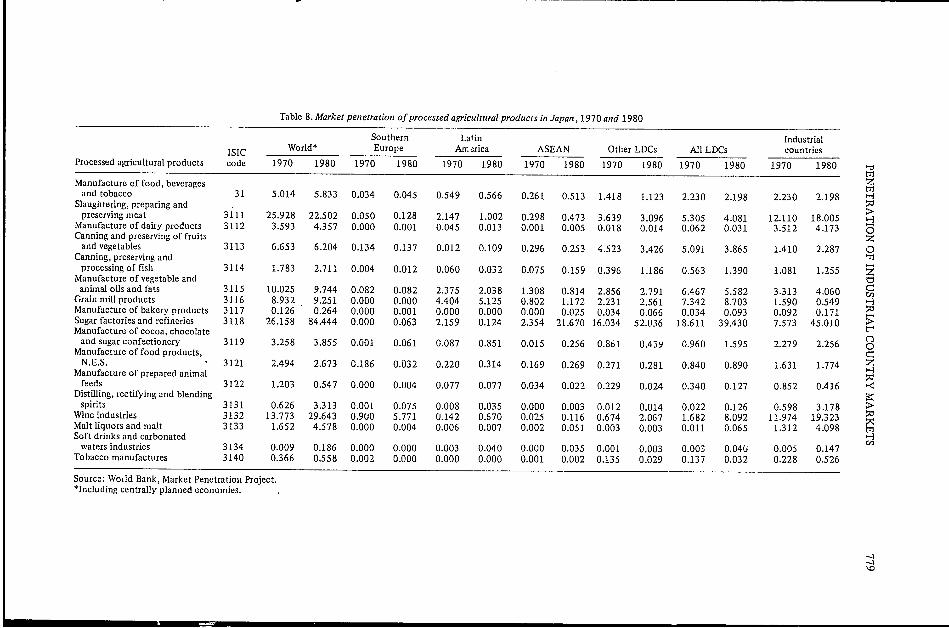
Table 8. Market penetration of processed agricultural products in Japan, 1970 and 1980
Southern Latin IndustrialISIC World* Europe Arrcrica ASEAN Otlher LDCs All LDCs countries
Processed agricultural products code 1970 1980 1970 1980 1970 1980 1970 1980 1970 1980 1970 1980 1970 1980 e:
Manufacture of food, beverages t1zand tobacco 31 5.014 5.833 0.034 0.045 0.549 0.566 0.261 0.513 1.418 1.123 2.230 2.198 2.230 2.198 H
Slaughtering, preparing and >preserving meat 3111 25.928 22.502 0.050 0.128 2.147 1.002 0.298 0.473 3.639 3.096 5.305 4.081 12.110 18.005 H
Manufacture of dairy products 3112 3.593 4.357 0.000 0.001 0.045 0.013 0.001 0.005 0.018 0.014 0.062 0.031 3.512 4.173 OCanning and preserving of fruits Z
and vegetables 3113 6.653 6.204 0.134 0.137 0.012 0.109 0.296 0.253 4.523 3.426 5.091 3.865 1.410 2.287 0Canning, preserving and T
processing of fislh 3114 1.783 2.711 0.004 0.012 0.060 0.032 0.075 0.159 0.396 1.186 0.563 1.390 1.081 1.255 zManufacture of vegetable and t
animal oils and fats 3115 10.025 9.744 0.082 0.082 2.375 2.038 1.308 0.814 2.856 2.791 6.467 5.582 3.313 4.060 CGrain mill products 3116 8.932 9.251 0.000 0.000 4.404 5.125 0.802 1.172 2.231 2.561 7.342 8.703 1.590 0.549 HManufacture of bakery products 3117 0.126 0.264 0.000 0.001 0.000 0.000 0.000 0.025 0.034 0.066 0.034 0.093 0.092 0.171Sugarfactoriesandrefineries 3118 26.158 84.444 0.000 0.063 2.159 0.124 2.354 21.670 16.034 52.036 18.611 39.430 7.573 45.010 >Manufacture of cocoa, chocolate
and sugar confectionery 3119 3.258 3.855 0.001 0.061 0.087 0.851 0.015 0.256 0.861 0.439 0.960 1.595 2.279 2.256 0Manufacture of food products, C
N.E.S. 3121 2.494 2.673 0.186 0.032 0.220 0.314 0.169 0.269 0.271 0.281 0.840 0.890 1.631 1.774 ZManufacture of prepared animal
feeds 3122 1.203 0.547 0.000 0.004 0.077 0.077 0.034 0.022 0.229 0.024 0.340 0.127 0.852 0.416 <Distilling, rectifying and blending
spirits 3131 0.626 3.313 0.001 0.075 0.008 0.035 0.000 0.003 0.012 0.014 0.022 0.126 0.598 3.178 >Wineindustries 3132 13.773 29.643 0.900 5.771 0.142 0.670 0.025 0.116 0.674 2.067 1.682 8.092 11.974 19.323 tMalt liquors and malt 3133 1.652 4.578 0.000 0.004 0.006 0.007 0.002 0.051 0.003 0.003 0.011 0.065 1.312 4.098 mSoft drinks and carbonated H
waters industries 3134 0.009 0.186 0.000 0.000 0.003 0.040 0.000 0.035 0.001 0.003 0.003 0.040 0.005 0.147Tobacco manufactures 3140 0.366 0.558 0.002 0.000 0.000 0.000 0.001 0.002 0.135 0.029 0.137 0.032 0.228 0.526
Source: World Bank, Market Penetration Project.*Including centrally planned economies.
'.

0
Table 9. Import penetration of basic agricultural exports of developing coui-tries in industrial countries and the European Community
All industrial countries European CommunityApparent Developing Import Apparent Developing Import
Commodity SITC code consumption countries' imports penetration ratio consumption countries' imports penetration oratio
1970 1980 1970 1980 1970 1980 1970 1980 1970 1980 1970 1980(thousand tons) (%) (thousand tons) (%O)
triSugar 0611 + 0612 141,143 169,250 11,068 6556 7.8 3.9 60,156 81,331 1900 1613 3.2 2.0 tTobacco 121 1649 1769 348 535 21.1 30.2 543 632 201 317 37.0 50.2 OBeef and veal 0111 19,603 20,561 453 176 2.3 0.9 6294 6532 322 85 5.1 1.3Wheat 041 67,279 86,629 633 118 0.9 0.1 40,078 49,121 624 93 1.6 0.2 t,,zRice 042 19,35,2 16,591 270 321 1.4 1.9 1000 1161 205 276 20.5 23.8 HMaize 044 125,443 152,426 6345 2061 5.1 1.4 23,812 25,863 4454 839 18.7 3.2Tomatoes 0544 12,464 15,971 658 758 5.3 4.7 5132 6957 285 391 5.6 5.6
Source: FAO and UN trade tapes.
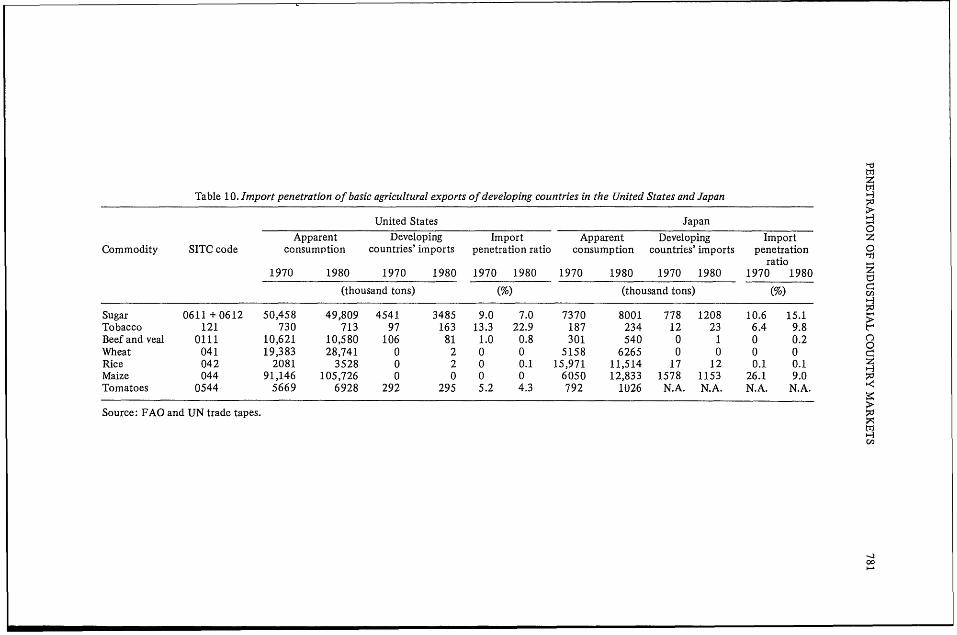
zTable 10. Import penetration of basic agricultural exports of developing countries in the United States and Japan
United States JapanApparent Developing Import Apparent Developing Import z
Commodity SITC code consumption countries' imports penetration ratio consumption countries' imports penetration 0ratio
1970 1980 1970 1980 1970 1980 1970 1980 1970 1980 1970 1980 Z(thousand tons) (%) (thousand tons) (%) C
Sugar 0611 +0612 50,458 49,809 4541 3485 9.0 7.0 7370 8001 778 1208 10.6 15.1Tobacco 121 730 713 97 163 13.3 22.9 187 234 12 23 6.4 9.8Beef and veal 0111 10,621 10,580 106 81 1.0 0.8 301 540 0 1 0 0.2 0Wheat 041 19,383 28,741 0 2 0 0 5158 6265 0 0 0 0Rice 042 2081 3528 0 2 0 0.1 15,971 11,514 17 12 0.1 0.1 ZMaize 044 91,146 105,726 0 0 0 0 6050 12,833 1578 1153 26.1 9.0Tomatoes 0544 5669 6928 292 295 5.2 4.3 792 1026 N.A. N.A. N.A. N.A.
Source: FAO and UN trade tapes.
ool

782 WORLD DEVELOPMENT
level of their penetration between 1970 and the United States are almost as large as imports1980. The largest gains were made in canning, into the EC. Given the differences noted above,preserving and processing of fish, manufacturing it is obvious that Latin American countries haveof vegetable and animal oils, and in grain mill increased their exports of these productsproducts. It seems from the data that supplv- faster than West African cocoa producers.side factors have been important in influencing Supply-side constraints in the Western Africanthe penetration rate of the developing countries. countries must be at least part of the explanationThis can be concluded from the fact that the for these developments.ASEAN countries have considerably improvedtheir share in all industrial country groupings -with the exception of the United States. The (b) Basic agricultural exportsgroup 'Other LDCs' which includes many ofthe Lome countries was not able to increase In Table 9 the share of developing countryits penetration in the EC; hindrances in the way exports in total industrial country consumptionof supply responses must be an important is shown to have fallen substantially for sugar,factor in this instance. beef and veal, and maize. The penetration ratio
Cocoa products are an example where the of tobacco has risen significantly. Developingdeveloping countries have been able to benefit country sugar exports to both the EC and thefrom a lowering of trade barriers on processed United States fell absolutely between 1970 andproducts. In this connection it is interesting to 1980; however, the decline of exports to thenote the differences in the performance of United States has been most important, withdeveloping countries exporting to the United total exports falling by over 1 million tonsStates and to the EC. In 1975, under the Lom6 (Tables 9 and 10). Japan, on the other hand,Convention (which includes all African cocoa has increased the participation of developingproducers), the EC made cocoa powder, cocoa country sugar exporters - increasing the levelbutter and cocoa paste duty free, Previously, of their imports by about 50%. We discuss theonly the cocoa beans imports were duty free. recent experience of these four commoditiesIn the United States imports of cocoa paste in detail below, especially with respect to thehave been duty free, while the MFN rates on commercial policies applying in the majorcocoa butter and cocoa powder were 3.0 and industrial countries.0.8%, respectively, prior to the Tokyo Roundof the MTN. These rates will be reduced tozero as an outcome of the Tokyo Round. (i) SugarGSP suppliers have enjoyed zero duties on Sugar is an important developing countrybutter and powder since 1976.5 Given that the export whose production and export earningsEC and the United States have essentially moved have been adversely affected by protectionto duty free entry for cocoa products (paste, against imports in the major industrial countriespowder and butter) since the mid-1970s, an as well as by protection in the USSR and Eastexpansion in imports of these processed pro- European countries. In recent years the Unitedducts and a decline in imports of cocoa beans States and Japan have been importLig 40-50%would be expected. As the reduction in tariffs and 70-75%, respectively, of their consump-was larger in the EC than in the United States tion requirements in the face of import controlsand as the EC reduction related to a specific and price support programmes for domesticgroup of countries, notably in West Africa, it producers. Within the EC, however, the pricewas to be expected that the move to processed supports and import controls have been instru-cocoa products would have been greater in mental in promoting the EC to the position ofrespect of imports in the EC and that the being a net exporter, when previously it was aAfrican cocoa producing countries may have net importer.expanded processing more than other develop- Sugar imports into the United States haveing countries. The data in Tables 6 and 7, been subject to country-specific quotas, whichhowever, show in fact that import penetration have been particularly severe with respect tohas expanded in the United States by a rapid refined sugar. Because of the nature of the trade16.3% per year whereas in the EC the rate was restraint the developing country producersmerely 3.6%. About 80% of the increase in the which have had access to the United StatesUnited States' market went to Latin American market (largely the Philippines and Centralcountries - notably Brazil, the second largest Americar and Caribbean countries) havecocoa producer next to the Ivory Coast. received a price premium over and above theImports of cocoa butter, paste and powder into free market price, which has served to reduce

PENETRATION OF INDUSTRIAL COUNTRY MARKETS 783
their incentive to lobby for freer access. How- (ii) Beef and vealever, with an increasing share of the industrial From Tables 9 and 1 0 it can be seen thatsweetener market (beverages, canned food, ice developing country beef and veal exports tocreams, bakery products) being taken by sugar the industrial countries fell over the periodsubstitutes - in particular High Fructose Corn 1970-1980 from 2.3% to less than 1% of totalSyrup (HFCS) - the prospects for developing consumption - falling absolutely by 60%.country exports to the United States are poor. This decrease was primarily due to the absoluteIn 1970 HFCS sales in the United States were decline of developing country exports to the60,000 tons and by 1980 they had grown to EC. The future of beef exports for the develop-2.1 million tons. By 1985 consumption of ing countries looks grim for some years intoHFCS in the United States could reach 4 the future. In the longer run, the growth ofmillion tons. Consumption of HFCS is also incomes in the presently fast growing develop-growing quickly in Japan and the EC, This ing countries, and the ensuing growth in theadded source of competition for sugar pro- demand for meat, should lead to larger marketsducers in the EC, United States and Japan for beef and veal and other red and white meatswill give impetus to their demands for pro- in the developing countries themselves. At thetection from sugar imports as they cannot get moment, however, the industrial countries areprotection from domestic production of sugar the major consumers of beef and exports to thesubstitutes such as HFCS. Ironically, protection major importers or potential importers amongof the sugar industry, especially in the United them are severely constrained. The NorthStates market, has been an important factor in American beef import market is large, but it isfostering the growth of substitute sweeteners. restricted by quotas and voluntary exportNow that they are established, HFCS producers restraint to Australia and New Zealand and thewill support sugar producers' demands for pro- Central American beef producers. Other develop-tection against imports, as controls on sugar ing country beef producers are not allowedimports protect manufacturers of sugar sub- into these markets because of the incidence ofstitutes as well as producers of sugar. foot-and-mouth and other diseases. However,
Sugar consumption in Japan is artificially even in the possible event of the elimination ofrestrained and prices to producers are raised foot-and-mouth disease in the more likely areasby the imposition of import duties to bring of Argentina and Uruguay, unless United Statesthe price of imports to predetermined consumer and Canadian policy changes, entry of any newprices. Despite this protection Japan remains exporters would have to be at the expense ofthe second largest importer of sugar in the free existing exporters.market. The level of import penetration remains The major depressing factor on the develop-high because the agricultural subsidy system has ment of beef exports from the developingnot encouraged a higher level of self-sufficiency countries has been the operation of the CAPin sugar due to competition from other crops and the expansion of the EC. Not only has thewhich also receive artificially increased prices. expansion of the EC placed what were impor-
In the EC self-sufficiency has been attained tant markets for the major developing countryby artificially increased producer prices which beef exporters (Argentina, Uruguay and Yugo-are supported by variable import levies intro- slavia) within the EC, but the operation of theduced in 1968 under the ( ommon Agricultural CAP has led to expansion of beef productionPolicy (CAP). The variable import levies make within the EC so that the EC is self-sufficient inthe domestic market virtually impenetrable to beef production and is subsidizing into thirdimports. The only exceptions to jhis restraint country markets at the expense of otheron sugar imports are: (a) drawback provisions exporters. This process will continue with thefor imporfs of sugar which are re-exported after entry of Greece and the likely entry of Spainprocessing; (b) the import quota provided for and Portugal, which have all been importantcertain African, Caribbean and Pacific countries export markets for the major developing countryunder the Lome Convention; and (c) production exporters.in the French Overseas Departments (Guade- Imports into other quickly growing beefloupe, Martinique, Reunion) which comes under markets such as Japan and Korea are alsothe domestic EC production quota. Since 1977 sharply constrained by restrictions (both tradethe EC has been a net exporter selling into and sanitation) which favour their highlythird-country markets at prices subsidized under inefficient romestic producers, and the likeli-CAP, to the detriment of other sugar-producing hood of 4inports growing quickly is small. Thecountries. residual, free world market is thus very small
and is presently dominated on the demand side

784 WORLD DEVELOPMENT
by the USSR, which has in the past been an can be isolated jointly within the FAO produc-opportunistic participant depending on the tion data and the UN trade data; however, theyperformance of its grains and meat sectors. are an important component of the total vege-Recently, however, the USSR has signed a long- table market and are important for developingterm beef agreement with Argentina, signalling country exporters adjacent to the Europeangreater stability in its meat imports. and North American markets. The consump-
tion of tomatoes in the industrial countries hasgrown at 2.5% p.a. between 1970 and 1980;
(iii) Tobacco however, the develophig country exports haveThe import penetration ratio of tobacco from not grown as fast (only 1.4% p.a.) so their
developing countries increased from 21 to 30% import penetration ratio has fallen from 5.3 tofor all industrial countries over the period 1970 4.7%. This decline has been wholly due to theto 1980, with substantial increases in the pene- failure of developing country exports to thetration ratio in the EC and the United States. In United States to expand. These exports are inabsolute terms most of the increase in imports effect tomatoes grown across the Mexicanfrom the developing countries went to the EC border solely for export to the United Stateswhere the share of the developing countries in and Canada. This trade has been the subject oftotal apparent consumption grew to 50% in recent anti-dumping action in the United States,1980 -- up from 37% in 1970. While develop- but the findings by the United States authoritiesing country imports and their penetration were in favour of the Mexican exporters.ratio increased substantially in the United States, Imports into the EC maintained theirtotal consumption of tobacco declined in the penetration ratio in the period 1970-1980.United States over the observation period. However, this trade with Southern EuropeanTobacco was one of the commodities for which and North African developing countries isthe ACP countries received preferential treat- likely to be of long-term concern because ofment in the Lome Convention. The reduction the proposed southward expansion of the EC.in import duties into the EC has obviously Greece, Portugal and Spain have accounted forbenefited ACP tobacco exporters such as about 17% of fresh fruit imports into the EC,Malawi, which in the 1970s was the fastest 24% of dried fruit imports, 11% of processedgrowing tobacco exporter among the developing fruit imports, 13% of fresh vegetable importscountries. and 16% of processed vegetable imports - where
Tobacco consumption in the industrialized these percentages are calculated on the basis ofcountries has been increasing annually at about EC imports which include intra-EC trade.1% since 1970 while production in these Greece, Portugal and Spain are competitivecountries has been increasing at less than 0.5% with the North African and Mediterraneanper annum. It is obvious that tobacco pro- countries for the off-season fruit and vege-duction in the major industrial country pro- tables market in EC. Under the protection ofducer, the United States, which has been on a CAP prices, the production of fruit and vege-declining trend since 1960 of about 0.5% p.a., tables in these new EC countries will be likelyhas lost its competitive edge, especially to to expand. Exports of fruit and vegetablesquickly growing developing country producers from Greece, Portugal and Spain which wouldsuch as Malawi, Yugoslavia, Dominican Republic otherwise have gone to other markets will beand Korea. If tobacco consumption continues directed (at least to a large extent) to the EC.to grow in the industrial countries at near The overall result will be a reduction in thehistoric rat, s (in spite of concerns about health total international market available for develop-and high levels of consumption taxation), the ing countries.prospects for developing country exports arebright. However, the decline in consumptionin the United States may be a sign of things to 3. CONCLUSIONScome. This decline reflects health concernswhich have resulted in reduced smoking levels Concern has been expressed about theas well as reduced content in cigarettes. Off- increase in the degree of protectionism in thesetting this development is the rapid increase industrial countries in the 1970s and the impactin tobacco consumption in developing countries. of this on exports of developing countries.
Studies of the impact of protection levels inindustrial countries on manufactured exports
(iv) Fresh vegetables from developing countries have shown thatTomatoes are the only fresh vegetable which despite some increases in protection, develop-
PENETRATION OF INDUSTRIAL COUNTRY MARKETS 785
ing countries as a whole were able to increase trial countries. However, the prospects fortheir level of penetration of industrial country sugar exports from developing countries tomarkets at a healthy average rate of about 8% industrial countries are bleak, The majorper annum between 1970 and 1979. The reliance industrial countries have highly protectedby developing countries on primary agricultural sugarbeet production. Moreover, they are underexports has diminished because of this growth severe competitive pressure from domesticin manufactures; however, agricultural exports production of sugar substitutes. Up to three-are still important - especially for the low quarters of the sweetener market is for industrialincome, oil-importing countries. Further, the use, of which the sugar substitutes (such asindustrial countries remain important importers HFCS) could capture two-thirds or more. Thisof these products. Therefore, the threat or can only lead to demands for higher protectionexistence of higher trade barriers to agricultural against sugar imports.exports is of major concern. Developing country tobacco imports have
We have not attempted to assess in detail done surprisingly well in the industrial markets,whether agricultural protection levels have particularly in the EC. The preferential tradingchanged in the industrial countries. This is very arrangement for tobacco exports from ACPdifficult particularly if non-tariff barriers are to countries under the Lome Convention seems tobe taken into account. Nor have we attempted be the important factor in this result. Prospectsto establish any empirical relationship between for tobacco exports are good, with consump-changes in protection and changes in import tion in developing cQuntries growing and withpenetration in the industrial markets. We have production in the major industrial countrymeasured changes in import penetration ratios producer, the United States, likely to continuefor both processed and basic agricultural pro- to increase only slowly or even to fall.ducts in industAal country markets during the The import penetration ratio of fresh1 970s. Some of the major changes observed tomatoes has fallen slightly. This trade isare related to known changes in protection largely between the contiguous countries oflevels and the prospects for developing country Mexico and the United States and Canadaexports of these products are discussed in the and between North African and Mediterraneanlight of likely future developments. countries and the EC countries. TV. fresh
Among the basic agricultural commodities vegetable trade has been under pressure fromattention is focused on four products, sugar, producer interest groups in both the Unitedbeef and veal, tobacco and fresh vegetables. States and the EC. In future, the possibleThese are basic commodities in which the accession of Portugal and Spain could meandeveloping countries are important exporters even greater pressures for protection withinand against which there is substantial pro- the EC as the production of the new entrantstection. Many other basic agricultural exports expands under the stimulus of the CAP.from developing countries, especially from Developing countries have been able tothose in tropical climates, do not have close increase their import penetration in processedsubstitutes in the industrial countries (which agricultural products (ISIC 31, Manufacture ofare located mainly in temperate regions) and Food, Beverages and Tobacco) in industrialare therefore not discriminated against in raw countries only marginally. They have beenmaterials form. However, they are discriminated nowhere near as successful as with otheragainst in processed form. manufactured exports. 6 Growth in their share
The import penetration ratios for both sugar of total consumption has been 1.7% per yearand beef and veal have fallen substantially. in the United States whereas penetration stag-Imports of beef and veal now comprise less nated both in the EC and in Japan. The factthan 1% of apparent consumption in industrial that penetration stagnated in the EC is sur-countries. This is a result both of sanitation prising given the stimulus provided by theregulations against countries with particular Lome Convention to a large group of developinganimal diseases and comprehensive protection countries but it can probably be explained byagainst beef and veal imports in all the industrial supply constraints.countries. Increases in exports from developing Of the product groups included in ISIC 31countries now depend primarily on markets in the share of only two increased - cocoa,the USSR and in fast growing countries in the chocolate and sugar confectionery, and canningMiddle East, Asia and Africa. Little change can and preserving of fruits and vegetables. The sharebe expected in this situation. of the other products either stagnated or fell.
Despite the decline in market penetration, The Latin American countries gained by farsugar is still a very important export to indus- the most from increased penetration of the
786 WORLD DEVELOPMENT
United States' market and the ASEAN countries been reduced significantly. These results raiseperformed well in Japan and in the EC. On the the question of whether, aside from protec-other hand, 'Other LDCs' that include many tionist barriers in industrial countries, many ofLom6 countries and which have significant the developing countries concerned have pro-trade relations with the EC did not do as well vided an appropriate economic environment foras might have been expected, especially in areas the expansion of processed agricultural exports.such as cocoa products where tariff levels have
NOTES
1. Various descriptive studies have been done on the ISIC classification for manufactured goods and pro-agricultural policies in industrial countries and their cessed agricultural commodities and the FAO classifi-effects [see e.g. Josling (1979) and Lutz and Bale cation for basic agricultural commodities).(1981)]. Some papers present rates of protection forspecific commodities in individual countries for 4. The 11 countries are: Australia, Belgium, Canada,individual years. However, we are not aware of a France, Germany, Italy, Japan, Netherlands, Sweden,study that presents an overview of the experience United Kingdom, and the United States.of the 1970s, where time series of nominal rates ofprotection have been computed for the major com- 5. If, however, imports of butter or powder from amodities and the major industrial countries. single country in any year exceed US$25 million
(in 1976 - increased annually in relation to their2. This project was executed under the direction GNP) or 50%o of United States imports of that product,of Helen Hughes. whichever is the lower, they must pay the full MFN
duty the following year. In 1979 imports of both3. Apparent consumption is estimated as: domestic butter and powder from the Ivory Coast and Brazilproduction plus imports minus exports. To compute exceeded this ceiling.this equation it is necessary to produce a concord-ance between the trade data (that uses the SITC 6. See Hughes and Waelbroeck (1981).classification) and the production data (that uses the
REFERENCES
Bale, M. and R. Duncan, 'Food prospects in the develop- policies and the interest of developing countries',ing countries: a qualified optimistic view', American ODIReview, No. 1 (1979).Economic Review, Vol. 73, No. 2 (May 1983). Lutz, E. and M. Bale, 'Agricultural protectionism in
Bale, M. and E. Lutz, 'Price distortions in agriculture industrialized countries and its global effects: aand their effects: an international comparison', survey of issues', Aussenwirtschaft (The SwissAmerican Journal of Agricultural Economics, Vol. Review of International Economic Relations),63, No. 1 (February 1981). Vol. 35, No. 4 (December 1980).
FAO, Trade Yearbook (1979). World Bank, 'The outlook for primary commodities',Hughes, H. and J. Waelbroeck, 'Can developing country World Bank Staff Commodity Working Paper,
exports keep growing in the 1980s?', The World No. 9 (January 1983).Economy, Vol. 4, No. 2 (June 1981). World Bank, World Development Report (1983).
Josling, T., 'The European Community agricultural

No. 255. Mohan Munasinghe, "Third World Energy Policies; Demand Manage-ment and Conservation," Energy Policy
No. 256. Keith Marsden and Alan Roe, "The Political Economy of Foreign Aid:A World Bank Perspective," Labour and Society
No. 257. James A. Hanson, "Contractionary Devaluation, Substitution inProduction and Consumption, and the Role of the Labor Market,"Journal of International Economics
No. 258. Christiaan Grootaert, "The Conceptual Basis of Measures of House-hold Welfare and Their Implied Survey Data Requirements," TheReview of Income and Wealth
No. 259. Guy Pfeffermann and Richard Webb, "Poverty and Income Distribu-tion in Brazil," The Review of Income and Wealth
No. 260. Pradeep K. Mitra, "A Theory of Interlinked Rural Transactions,"Journal of Public Economics
No. 261. David L. Lindauer and Richard H. Sabot, "The Public/Private WageDifferential in a Poor Urban Economy," Journal of DevelopmentEconomics
No. 262. J. B. Knight and R. H. Sabot, "Labor Market Discrimination in a PoorUrban Economy," Journal of Development Studies
No. 263. Carl Dahlman and Larry Westphal, "Technical Effort in IndustrialDevelopment: An Interpretative Survey of Recent Research," TheEconomics of New Technology in Developing Countries
No. 264. Michael Bamberger, "The Role of Self-Help Housing in Low-CostShelter Programs for the Third World," Built Environment
No. 265. Bela Balassa, "The Adjustment Experience of Developing Economiesafter 1973," IMF Conditionality
No. 266. Bela Balassa, "Outward Orientation and Exchange Rate Policy inDeveloping Countries: The Turkish Experience," The Middle EastJourrnal
No. 267. Dipak Mazumdar, "Segmented Labor Markets in LDCs," AmericanEconomic Review
No. 268. Stephen P. Heyneman and William A. Loxley, "The Effect of Primary-School Quality on Academic Achievement across Twenty-nine High-and Low-Income Countries," The American Journal of Sociology
No. 269. James R. Follain, Jr., Gill-Chin Lim, and Bertrand Renaud, "HousingCrowding in Developing Countries and Willingness to Pay forAdditional Space: The Case of Korea," Journal of Development Economics
No. 270. Bela Balassa, "Policy Responses to External Shocks in Sub-SaharanAfrican Countries," Journal of Policy Modeling
No. 271. Jaime de Melo and Sherman Robinson, "Trade Adjustment Policiesand Income Distribution in Three Archetype Developing Economies,"Journal of Development Economics
No. 272. J. B. Knight and R. H. Sabot, "The Role of the Firm in WageDetermination: An African Case Study," Oxford Economic Papers
No. 273. William G. Tyler, "The Anti-Export Bias in Commercial Policies andExport Performance: Some Evidence from Recent Brazilian Experi-ence," Weltwirtschaftliches Archiv
Issues of the World Bank Reprint Series are available free of charge fromthe address on the bottom of the back cover.

THE WORLD BANK
Headquarters: U1818 H Street, N.W.,Washington, D.C. 20433, U.S.A.
Telephone: (202) 477-1234Telex: WUI 64145 WORLDBANK
RCA 248423 WORLDBKCable address: INTBAFRAD
WASHINGTONDC
European Office:66, avenue d'I1na75116 Paris, France
Telephone: (1) 723-54.21Telex: 842-620628
Tokyo Office:Kokusai Building1-1, Marunouchi 3-chomeChiyoda-ku, Tokyo 100, Japan
Telephone: (03) 214-5001Telex: 781-26838
The full range of World Bank publications, both free and for sale, isdescribed in the Catalog of Publications; the continuing research programis outlined in Abstracts of Current Studies. The most recent edition ofeach is available without charge from:
PUBLICATIONS SALES UNITTHE WORLD BANK1818 H STREET, N.W.WASHINGTON, D.C. 20433U.S.A. ISSN 0253-2131