Embed Size (px)
Citation preview

APPENDIX 5
A.S. 26 aFILE Copy REST RIC T LJ
This report is restricted to use within the Bank.
INTERNATIONAL BANK FOR RECONSTRUCTION AND DEVELOPMENT
CURRENT ECONOMIC POSITION AND PROSPECTS
OF
INDIA
November 122 1954
Department of Operations
Asia and Middle East
Pub
lic D
iscl
osur
e A
utho
rized
Pub
lic D
iscl
osur
e A
utho
rized
Pub
lic D
iscl
osur
e A
utho
rized
Pub
lic D
iscl
osur
e A
utho
rized
Pub
lic D
iscl
osur
e A
utho
rized
Pub
lic D
iscl
osur
e A
utho
rized
Pub
lic D
iscl
osur
e A
utho
rized
Pub
lic D
iscl
osur
e A
utho
rized

Rate of Exc]iange of Indian Currency
1 Indian Rupee = U.S. $ 0.21
1 U.S. Dollar a Rs. 4.762
4

TABLE OF CONTENTS
Page No.
Basic Data
Summary andcGonclusions...................... i-ii
A. INTERNAL FINANCE ......... *.. *. ........ .... 1
I. The Financing of the First Three Yearsof the Five Year Plan................. 1 - 2
II. Financing of the Fourth Year of thePlan ............... * 3 -5
III. Honey Supply and Prices...........s - 6
Be PRODUCTION 6
I. Agricultural Production . ..... 6 - 7II. Industrial Productionn...... 7 - 8
C. FOREtGN TRADE & BALANCE OF PAYMENTS ........ 6.- 12
D. TI[41 PROGRESS OF ME. FITrV YEAR PL.l AND THEOUTLOOK .1.3.-,,........................... 13 - 17
E. THE FIVE YEAR PLAN AND IDyDIA'S CREDIT.'CORTHI2TESS 17 - 20
Appendix - Outline of the Five Year PlanS tatistinal Appendix

Basic Data
Area Total: 812 million acres (1.27 million sq. miles)Cultivated and fallow: 325 million acres
Population 1951 census - 357 million I
Rate of growth (19h7 - 1952): 1.2% per annum
Density of population (1953): 310 per sq. mile of land890 per sq. mile of cultivated land
1/ Plus an estimated 5 million for areas notincluded in the census.
National Income in 1950-51 (at 1950 - 1951 prices at factor cost)
Total: Rs. 95.5 billion (Rs. 88.7 billion at1948-49 prices)
Per Capita: Rs. 265 - U.S. $54
Acreage of Principal Crops in 1953-54 (millions of acres; final forecast)
Cereals 208.0 Sugarcane 4.3Pulses 49,3 Cotton 17.0Oilseeds 27.5 Jute 1.2
Composition of Foreign Trade (April 1952 - March 1954 average; percentageof total value)
Exports Imports
Jute manufactures 20 Metal manufactures 27Cotton manufactures 14 Foodgrains 21Tea 15 Petroleum 12Spices and tobaccr 6 Raw cotton 9Oilseeds and oils 5 Raiv Jute 3nther products 4 0o Other products 29
M/ Mainly: hides and skins, raw cotton, carpetwool, gums and resins, fruits and nuts, mang-anese ores, mica, and coal.
Balance ef payments in 1953* (exchange control data)
_o. Million)Exports 5,308Imports -5,664Services (net) 6ehRemittances and grants 320Unrecorded transactions with the Middle
East (net) -170Surplus on current aoc.unt 398L4ng-term capitd, errors & Qmissions -71Remaining surplus 327
*Calendar year.

Basic Data - 2
(Rs. Millions)Central Government Budget for 1954/55*
Disbursements
Ordinary expenditure 4.,671Disbursements not met from Revenue 3.1442Total Disbursements 8,113
Receipts
Ordinary revenue 4,517Small savings and provident funds (net) 606Deposits and cther items (net) 347New loans (net of repayments) 253Total Receipts 5,723
Budgetary Gap 2,390
Increase in fl?ating debt (Treasury Bills) 2,500
Increase in cash balances llO
Public Debt on March 31, 1954 (Rs. billions) 26.95
Of which: External Debt 1.41
Central Bank Reserves on October 1, 1954 (Rs. Millions)
Gold 1/ 11,176
Foreign Assets 7,316
Total 8,1492
* Fiscal year starting Lpril 1st,
1/ Revalued at present official rate of Rs. 166.7 per ounce.

INDIAINDUSTRIAL PRODUCTION INDEX(1948=100)
130 130MONTHLY \, s V
120 120
/vVIso It111 o100 100
D J D J D J D J D J D
1950 1951 1952 1953 1954SUPPLY OF FOOD GRAINS
(MILLIONS OF TONS) (MILLIONS OF PERSONS)
"1948-49 1949-50 1950-51 1951-52 1952-53 1953-54 9T55-56)
oFFICIAL GOLD AND FOREIGN EXCHANGE ASSETS(BILLIONS OF RUPEES)
10 .=.................. H 1 0
:.*.: . F;OR.E; IG5TOTAL LAST FRI Y OF MONTH..*
5 5
MONEY SUPPLY(BILLIONS OF RUPEES)
LAST FRIDAY OF MONTH
LOCAL PR ~OTA
20 . _ .*. 20
10 10
l1/19/54 1950 1951 1952 1953 1954No. 835 IBRD-Economic Staff

INDIAWHOLESALE PRICES: INDEXES(YEAR ENDING AUGUST 1939=100)
50MONTHLY ||i ,f , 0
450 450
/ h-_ _--> _ \oZGENERAL400 "NK~7 ̂ 400
350 FOODSTUFFS 2 \ t 350
30 ,,,, ,,,, ,ll ,, ,, ,l,, , , ,,, ,, 1Ill 300D J D J D J D J D J D
1950 1951 1952 1953 1954
GOVERNMENT REVENUES AND EXPENDITURES(BILLIONS OF RUPEES)
8YEAR ENDING MARCH | EXPENDITURES .......
_ l REVENU ES X § / ( ...........*EXPEN'.:U'-S
Q m . \ ,. ~~~~~~~~~~~~~ORDINARY .
4 4
1950-51 1951-52 1952-53 1953-54 1954-55(Budget)
*Excluding debt repayments.
GOVERNMENT DEPOSITS IN THE RESERVE BANK OF INDIA(BILLIONS OF RUPEES)
MONTHLY
22
0 0D J D J D J D J D J D
1950 1951 1952 1953 1954
11/9/54No. 836 IBRD -Economic Staff

INDIATOTAL EXTERNAL TRADE(MILLIONS OF RUPEES)
1000 1000MONTHLY 00, IMPORTS 800
800~ ~~~~~~ A hs w! o 00600~~~~~~~~~~~~~~0
600 B EX POR T-S NA 400400 ..N,, MANUFACTURED
: 's.N* ,,+ JUTE EXPORTS200 ,. *., liii II. 200
~~~~~~~~~~~~~~~~" .. I.... N... ...... .,,,- .-..
0 I I ii I I I O
EXTERNAL TRADE WITH U.S.(MILLIONS OF RUPEES)
500 500MONTHLY
400 A 400
300 _ .r 300_J i 1KIMPO RTS
200 - 200
100 1 100
EXTERNAL TRADE WITH U.K.(MILLIONS OF RUPEES)
200 20000MONTHLY l IloMPORTS 20
100 - - - ------------ ~ ~~~100
EXPORTSwy~
D J J D J D J D J D
1950 1951 1952 1953 1954
BALANCE OF PAYMENTS ON CURRENT ACCOUNT(BILLIONS OF RUPEES)
6 6HALF YEARS RECEIPTS PAYMENTS
HALF YEARS INVISIBLES- - INVISIBLESEXPORTS IMPORTS
4 .. 4
9 2
0- 0I 11 1 11 1 II I 11 1 11
11/9/54 1950 1951 1952 1953 1954No.837 IBRD - Economic Staff

- i -
SUM1,ARY AND CONCLUSIONS
1. The overall economic situation in India can be characterized asdevelopment with stability. Although development expenditures have beenincreased again in the fourth year of the Five Year Plan (1954/55), therehave been no signs of inflationary pressure. The total outlay in thepublic sector of the Plan (Central Government and States) proposed in thePlan amounts now to Rs. 22,390 millions ($4,702 millions). The expendi-tures incurred in the first three years are estimated at Rs. 9,166 millions.Of this amount, only 14% was provided from external assistance (loans and 'grants). There has been very little "deficit financing" during this period.
2. The estimate of the Central Go-ernment's budget for l954/55 en-visaged an overall deficit of Rs. 2,390 millions which it was proposed tomeet by the icisue of Treasury bills. However, this deficit will be sub-stantially smaller; the improvement in raising government loans in themarket as compared with the budget estimates above is about Rs. 860 millions;the Indian revenue budget ends usually with better results than estimated;and finally, it is unlikely that it would be possible to step up the rate ofinvestment by about 45% above the last year level. The financing of thefourth year of the Plan seems to be assured without creating inflationarypressure,
3. Foreign assistance authorized during the period March 1951 to July1954 and undrawn portions of IBRD loans sanctioned prior to 1951/52 to-gether amount to Rs. 2,342 millions. In the first three years of the Plan,Rs. 1,319 millions of this amount was utilized. During the current yearthe estimates of likely utilization are placed at Rs. 318 millions. IBRDloans negotiated since 1951/52 amount to Rs. 199 millions.
4. India's money supply folloVwed a dovrnward trend until this year. Themoderate increase in 1953/54 wvas due partly to an increase in foreign ex-change holdings. The money supply still remains below the pre-Korean level.
5. The movement in prices is also an evidence of relatively stable con-ditions. The wholesale price index which rose by about 1I) between December1952 and August 1953 declined to 389 at the end of 1953 and wmas at 381 inJuly 1954 which is about 4% below the pre-Korean level. The -wrholesale priceindex of food articles declined from 406 in July 1953 to 360 in July 1954.Less marked was the decline in working class consumer indices,
6. There has been a substantial improvement in agricultural productionover 1951/52. The index of agricultural output (19h9/50 - 100) rose from97.h in 1951/52 to 113.5 in 1953/54. The production of foodgrains reacheda total estimated-at 65.4 million tons in 195h/55 which exceeded the Plantarget by about 3.7 million tons. This increase in production has made itpossible to relax control on prices and movements of foodgrains. All re-strictions on rice were removed from July 10, 195h. Imports of foodgrainshave gone down and imports in the present year are largely for building upreserve stocks.

- ii -
7. Industrial production has continued to show an upward trend in re-cent years. The index ol' industrial production (1948 - 100) rose from 119in 1952 to 125 in 1953, and increased further to 128(on the monthly average)in the first quarter of 1954. The production of cotton textiles in 1953 of4,900 million yards was 4% higher than the 1955/56 target. There has beenan increase in production of cement, fertilizers, chemicals, while the out-put of jute manufactures in 1953 was about 10% less than in 1952.
Various new enterprises have gone into production and expansion andmodernization of industries continues at an increased rate.
8. Chiefly as a resuLt of reduced imports of foodgrains and raw cotton,India had a balance of payments surplus in the last two years. After a de-ficit of Rs. 1,360 millions in 1951/52, a surplus of Rs. 746 millions and Rs.640 millions was obtained in 1952/53 and 1953/54 respectively. A trade sur-plus with the dollar area amounted to 44L.5 millions in 1953/54 and a sur-plus continues also in the present year. After a decline in 1952, the of-ficial foreign exchange hloldings increased by Rs. 173 millions in 1953. Atthe end of that year foreign exchange holdings of the Reserve Bank of Indiatotalled Rs. 7,253 millioDns and they amounted to Rs. 7,320 millions ($1,537.2millions) at the end of September 195h. From the end of 1951 (the first yearof the Five Year Plan) to the end of September 195l4, the foreign assets de-clined from the equivalent of $1,640 millions to M,,537.2 millions or by aboutpl0O millions. India hais used little of the sterling balances released or to
be released durirn this period (EL75 millinns - -494 millions).
9. Thus the implementation of the Five Year Plan has been carried outunder conditions of financial stability, growing agricultural and industrialproduction and without balance of payments difficulties.
10. To achieve the proposed investment target of the Plan, about Rs.7,h00 millions would have to be provided in the last year of the Plan. Al-though it is difficult tD estimate at this stage the sources from which thisexpenditure would be financed, it is reasonable to expect that resources atleast equal to those of the present year would be available. However, shouldthe total amount proposed be spent, a gap might develop, which the Governmentwould propose to meet through"deficit financing." The higher level of nationalproduction and increased trade deficit financed with India's sterling bal-ances would probably absorb the greater part of the additional purchasingpower thus created. The performance of the Government of India in recentyears justifies the assumption that œdeficit financing't would be kept withinreasonable limits so as to avoid the creation of inflationary pressure.
11. Judging by the progress achieved during the first three years of thePlan and on the assumption that about 85-90% of the financing required forthe Plan in the public sector will be available, it may seem reasonable toexpect that a substantial part of the Plan wLll be carried out. The imple-mentation of the Five Year Plan will increase overall production in Indiaand should also increase her ability to service foreign obligations. Theexecution of the present plan should have various foreign exchange savingsand foreign exchange earning effects. Economic development of India will,

- iii -
of course, not end with the completion of the present plan; but the accom-plishment of the present plan will make it easier to reach a higher degreeof development in the future. In a foreseeable future, unless there is arapid increase of population, India should be able to produce most of itsfood and a better part of its consumer goods requirements. She will in-crease the production of various other industrial goods and also raw materials.Her pattern of trade wi'll change but she will continue to export various rawmaterials and some foodstuffs. With a modernization of plants, India shouldbe able to maintain her export position in jute manufactures and cotton tex-tiles and she will develop exports of other industrial commodities particularlyto nearby markets. These exports should increase in scope and composition.
12. The report entitled "The Five Year Plan of India and India's Credit-worthiness", dated February 14, 1952 (No. E-207a) stated that, taking intoaccount India's capacity to service foreign debt, the Bank could make addition-al loans up to a total of $60-70 millions in 1952 and that the whole of thisamount could be in dollars. Bank loans to India since that date have amountedto $42 millions, partly in currencies other than dollars. That report alsosuggested that the position be reviewed after about one year. A Bank Missionvisited India in September 1953, and concluded that, in view of the progressmade in the Five Year Plan and the general strengthening of India's economyin the preceding eighteen months, the Bank would be justified in making loansup to an amount substantially greater than that suggested in February 1952.Developments in past yeaxsfully support this conclusion.
13. The amount of external debt outstanding as of June 1, 1954 was $291.8millions of which $189.7 millions was the U.S. wheat loan. This total in-cludes amounts not yet disbursed. Service payments on the total amount ofdebt outstanding are estimated at $10.9 millions in 1954; they move up to4$14.5 millions in 1957 and 1958. A peak is reached in 1962 when servicecharges rise to $19.8 millions. In 1963 and 1964 service charges amount to$17.4 millions per year, declining to $14.3 millions in 1965 and 1966.Service charges move gradually downward to $11 millions in the period 1971/76. They amount to $12,3 millions in 1978 when it is estima-ted that therewill be outstanding sone $96 millions of the present external debt.
14. It should also be mentioned that during the present year India re-purchased an amount equivalent to $46.7 millions from the IMF, reducing itsobligation to the IMF to $53.3 millions. Finally, India's gold arid foreignassets totalled $1,777 millions at the end of August 1954 as compared with$1,729 millions at the end of 1952.

1-
A. INTERNAL FINANCE
I. THE FINANCING OF THE FIRST THREE YEARS OF THE FIVE YEAR PLAN
1. The most importanit feature in the Indian economic scene is the FirstFive Year Plan which was submitted by the Planning Commission to the Govern-ment on December 7, 1952. However, the execution of the Plan started onJuly 1, 1951 and the Plan includes various projects which were commenced asearly as in 1948, The total outlay in the public sector - Central Govern-ment and States - proposed in the Plan amounted to Rs. 20,690 millions($4,345 million). Last year this amount was increased to Rs. 22,390 millions($4,702 millicns).
2. Of the total investmentp 18% was to be spent on agriculture and con-munity development, 119$% on multipurpose projects, 7.9% on irrigation6.3% on pcwer, 23.5% on transport and communication, 7.9% on industi., 15.9%on social services, 5.8% on rehabilitation, and 2.8/o on others.
3. The outlay on the Development Program in the first three years (1951/52to 1953/54) is estimated to have been Rs. 9,166 millions (Rs. 2,606 millionsin 1951/52, Rs. 2,731 mi.llions in 1952/53, and Rs. 3.,829 millions in 1953/54).For the current year, an outlay of Rs. 5,588 millions has been proposed whichleaves a balance of over Rs. 7j,410 millions to be spent during the last yearof the Plan. When the Colombo Plan was prepared in 1950, it was envisagedthat the expenditure on developrent would rise gradually and that in thesecond half of the Plan the amount to be spent would be substantially higherthan in the first half*
14. The sources of finances for investment in the public sector are givenin the table on page 2.
5. During the first three years, foreign assistance provided a littlemore than 114% of the total developmental expenditure in the public sector.External assistance autlhorized during the period March 1951 to July 1954and undrawn portions of IBRD loans sanctioned prior to 1951/52 amount toRs. 2,342 millions. In the first three years of the Plan Rs. 1,319 mil-lions of this amount were utilized.
6. There was very little "deficit financing" during this period. "De-ficit financing" is defined in the Plan as the financing of the uncovereddeficit by drawing down Government cash balances and borrowing from the Re-serve Bark of India, In 1951/52, there emerged an overall budgetary surplusof Rs. 103 millions. In 1952/53, there was an overall defiGit of Rs. 670millions. About three-fourths of this deficit was covered by withdrawalsfrom cash balances and the rest by receipts from floating debts and fromliquidation of securities held in reserves. For the year 1953/54, the re-vised estimates placed the overall deficit at Rs. 1,426 millions, but in-dications are that the (deficit actually incurred has been much smaller. Thenet increase in the Central Governmentts outstanding floating debt was onlyRs. 200 millions as against the revised estimate of Rs. 800 millions.Similarly, whereas the aggregate of cash balances of Part A States was esti-mated to show a decline of Rs. 230 millions in 1953/54, it actually rose byRs. 20 nillions.

- 2 -
(Rs, Millions)
RevisedAccounts Acer,unts Estimates Estimates1951/52 1952/53 1953/54 1954/55
Total public expenditure on de-velopment (Centre and States) 2,606 2,731 3,839 5,588
Sources of Finance
Internal Financial Resources 1,957 2,321 3,574 5,lo4
Current surplus of publicauthorities and miscellaneousreceipts on capital accounts 10801 1,864 l,C,62 1,085
Net Domestic borrowing
i. long-term loans -227 157 380 432
ii. small savings and unfundeddebt 486 487 536 6o6
iii. floating debt (Treasurybills, ways and mearsadvances) -325 8 702 2,676
iv. use of Government cashbalances and investmentreserves 222 765 724 3(5
External Resources 649 410 255 484
Loans 609 336 21 33
Grants 4h 74 234 451
Total Resources available for publicexpenditure on Development 2,606 2,731 3,839 5,588
Source: Chapter on "India" presented at the Ottawa meeting of the Con-sultative Committee on Cooperative Economic Development in Southand South-East Asia (October 1954).

- 3-
II. F_GCFTHE FOURTH YEAR OF THE N
7. The 1954/55 Budget
Following are the figures for the Central Government s budget for1954/55 which indicates a further increase of expenditure on development:
Revised BudgetAccounts Estimates Estimates 1/1952/53 1953/54 1954/55 -
I. Expenditure in Revrenue Budget 3,961.8 4,306.4 41,670.9
II. Disbursements not met from Revenue 1.859.0 2,356.7 3,14141.8
Of which:Capital accounts not met fromRevenue 391.2 639.0 1^,457.5
Loans and advarnces by the CentralGovernment (net) 853G., lji65a4 11842.1
Tntal Disbursements (I plus II) 5,820.8 6,663.1 8,112.7
I. Revenue 14,351.0 14,136.9 h1,517.2
II. Receipts not inclu.ded in theRevenue Budget 834.4 2,0o43.3 3,705.1
Of which:Permanent debt (net) 277.6 - 2/ 252.6FIcating debt (net) - j 798.5 2,500Unfunded debt (net) 1487.3 536.4 606.1Other deposits & advances - 2/ 643.14 296.3
Total Receipts (I plus IT) 5,185.4 6,180.2 8,222.3
Overall Surplus or Deficit -635.4 -482.9 9Yo9q6
Of which:Revenue budget ourplus or deficit f389.2 -169.5 -153.7
Opening Balance 1,626.8 •991.4 508.5
Closing Balance 991.4 508.5 618.1
1/ Taking into account effect of budget proposals as voted byParliament.
2/ Repayments were larger than new floatations or deposits.

- 4 -
As shown in the table, the 1952/53 deficit was met by reducing theGovernment's cash balances without increasing the amount of floating debt.The budget estimate for 1953/54 indicated a deficit of Rs, l,281.4 million,not including the increase in Treasury bills. As explained in the previousparagraph, the deficit; was substantially smaller than expected.
8. The Central Government budget for 195h/55 shows a gap of Rs. 2,390million which it was proposed to meet by the issue of Treasury bills. TheFinance Minister stated in his Budget Speech in February 1954 that theamount to which it will be necessary to float Treasury bills would dependupon actual circumstances of the year as they develop. The budgetary gapis not likely to reach the estimated figure for the following reasons:
(a) Budgeting in India has been conservative and estimated def-icits in the revenue budget have usually turned out to besurpluses. It was estimated for instance that the Govern-ment cash balances will be reduced to Rs. 508.5 millionsat the endl of M'arch 1954, but they actually declined onlyto Rs. 809 millions.
(b) It was ex)ected that Rs. 750 millions would be raised innew loans in the market of which Rs. 498 millions was neededfor the repayment of maturing debt. On April 16, 1954 theGovernment floated a 31% National Plan Loan which remainedQn tap until September 15. Total subscriptions amounted toRs. 1,570 millions. Subscriptions to National Plan Certifi-cates, which continue to be on sale, totalled nearly Rs. h0millions on September 25. Thus the amount raised in new loansis about Rs. 860 millions larger than the budget estimate.
(c) Finally, it is doubtful whether it will be possible to stepUp the ra:e of investment from Rs. 3,829 millions to Rs.5,588 millions or by about 45%.
9. The amount of Treasury bills outstanding increased by Rs. 220 mil-lions between the end of Mlarch and the end of August 1954, but Governmentcash balances increased by Rs. 560 millions during the same period. Noinformation is available on month to month current expenditure of the Gov-ernment. However, judging from various indications, it may be said thatno recent symptoms of inflationary pressure are evident in India. It maybe assumed that it will be possible to finance the increased expenditureon development in the current year without any substantial borrowing fromthe Reserve Bank.
10. State Finances
According to t;he Plan, the States were to provide from currentrevenues Rs. 4,117 millions during the five years, or an annual averageof Rs. 823 millions. To achieve this target, the States were supposedto increase revenues *by an additional Rs. 2,320 millions over the fiveyear period (about Rs. 465 millions yearly). Tax revenues of the States,apart from the fact that their share in Central income tax and excisetaxes has increased b;y Rs. 200 millions as from 1952/53, have risen slowlyfrom Rs. 2,220 millions in 1950/51 to Rs. 2,297 millions in 1952/53. In1952/53 development expenditures by the States amounted to Rs. 1,572 millions

- 5 -
but only Rs. 547 millions were provided from budgetary resources. Inaddition to ordinary budget resourcesp the States mobilized substantialamounts thrnugh sale cf securities (an amount of Rs. 310 millions ofnew State loans between July and October 1953), withdrawal from cashreserves, and increasei in floating debt. The balance of developmentfinancing by States was obtained from loans and advances by tho CentralGovernment.
11. Although the State Governments have endeavoured to secure largerrevenues by enhancement of irrigation rates, increase in sales tax, re-vision of stamp duties, etc., the total amount of funds provided from ordi-nary budget resources will remain substantially below the target of theFive Year Plan.
III. MONEY SUPPLY AND PRICES
12. During the 1953/54 busy season, the expansion of the money sup-ply was more than the double of that of the preceding year. At the endof June 1954 the money supply was Rs. 660 millions higher than at theend of June 1953. This expansion has followed a decline in money supplyduring the period of cisinflation. In November 1951 the Reserve Bankstopped purchasing Qo-vernment bonds in the market and increased its dis-count rate from 3% to 31%. The money supply declined by Rs. 1,730 mil-3lions in 1951/52 and Rs * 410 millions in 1952/53.
During the period end August 1953 end August 1954, movements inthe principal acccunts of the Reserve Bank of India were as follows:
(Rs. Millions) Increase orEnd August 1953 End August 1954 Decrease
Notes in circulation 10,961 11,373 412Foreign assets 7,oo4 7,286 , 282Government of India Sebcurities 4,249 4,212 - 37Investments 889 917 f 28Government Treasury Bills 46 30 - 16Other Loans and Advances 107 154 f 47Central Government Depiosits 1,205 1,381 f 176Other Government Deposits 227 171 - 56Bank Deposits 459 646 / 187
During this period, notes in circulation increased by only Rs. 130 mil-lions more than foreign assets. Hardly any change has taken place inholdings of Government securities (including item "Investments in theBanking Department").
13. There has been a very marked improvement during the last two yearsin the amount of Government securities absorbed outside the Reserve Bank.In 1952/53 new money borrowed by the Central Government and the State out-side the Reserve Bank amounted to about Rs. 470 millions (gross). Thecash conversiton issue in June 1953 of the first 3 @ Naticnal Plan Bcnds,

-6.
1961 for Rs. 750 millions lwas fully subscribed. The continued strengthof the gilt-edged market in the busy season facilitated the issue ofiApril 19, 1954 of the 3i% National Plan Loan, 1964 at Rs. 98/8, givinga redemption yield of 3.68%. The loan is redeemable at par in 1964. Asmentioned already, an amount of Rs. 1,570 millions of this loan wias sub-scribed. The loan was a combined loan for the Central and State Govern-ments and was placed on tap without any limit in regard to the amount.Fluctuations of the Government of India securities index were confinedto a narrow range betw7een 90.3 and 90.9 (1949/50 = 100) in January andJuly 1954 respectivel;y.
14. The movement of prices is further evidence of relatively stableconditions. The wholesale price index rose frora 373 in December 1952 to410 for August 1953. Thereafter, prices began to decline and the year 1953closed wvith an index of 389. In July- 1954 the index wqas at 381 or about7 %/ lower than a year ago and about 4% below the pre-Korean level, Thewholesale price inde2 of food articles declined from 406 in July 1953 to360 in July 1954. Less marked was the decline in working class consumerprice indices (July 1953 - July 1954): in Bombay from 355 to 340;Calcutta 375 to 331; Madras 362 to 346; and Delhi 369 to 352.
B, PRODUCTION
I. AGI(CULTU RAL PROLJCTION
15. There has been a substantial increase in pi;oduction of foodgrainsin the last two years. The output of foodgrains (cereals, pulses andgrain) was 57.5 million tons in 1952/53 and reached a total estimated at65.4 million tons in 1953/54. Another good crop is expected in the cur-rent year. The increased production of foodgrains was due to a largeextent to two successive good monsoons, but the increase in the totalcultivated area reported to amount to 8% in the last three years,theincrease in the irrigated area, increased use of fertilizer and improvedseeds and spreading of Japanese methods of rice cultivation also hadfavorable effects on agricultural production.
16. The Plan target of 7.6 million tons of additional foodgrains wasexceeded in 1953/54 by about 3.7 million tons. This increase in foodproduction has made it possible to relax control on prices and movementsof foodgrains. On January 1, 1954 coarse grains were generally decon-trolled. All restrictions on race were removed effective from July 10,1954, and except for certain restrictions on inter-zonal and inter-Statemovements, all other controls on wheat have been lifted. Imports offoodgrains were reduced from 3.9 million tons in 1952 to 2 million tonsin 1953. The program for 1954 provides for food imports of about 2 mil-lion tons, which will be used largely for building up reserve stocks;actual imports will, however, be lower.
17. The estimated production of cotton was 14.6 million bales in 1953/54 as compared with 3.6 million bales in 1952/53. The output of oilseedsat 5.6 million tons in 1953/54 is close to the target for 1955/56 envis-aged in the Five Year Plan. The production of jute declined slightly in

- 7 -
1952/53 and there has been a substantial decline in 1953/54 due to ad7rerseweather conditions and relatively greater fall in price as compared to theprice of paddy, the main competing crop. On the whole, in the last twoyears, agricultural output has improved substantially; it rose from 97.4in 1951/52 (1949/50 = 1.00) to 102 in 1952/53 and 113.5 in 1953/54. Thisincrease had favorable effects on the whole economy: particularly on thebalance of trade.
The table below showis the improvement in agricultural output since19h9/50:
Index Numbers of Agricultural Production in India(1949/50 = 100)
1950/51 1952/53 1953/54
Cereals 90.3 lol.4 117.2Pulses 91.7 99 108.9
Total Foodgrains 90.5 101.1 116.1
Oilseeds 98.5 92.1 108.9Cotton 110.7 119.2 149.7Jute 106.3 149.1 101.3Tea 103.8 115.4 115.4Sugarcane 113.7 101.6 93.dTobacco 97.3 87.1 95.1
All Coxmmodities 95.6 102 113.5
II. TNDUSTRIAL PRODUCTION
18. Industrial production continued to show an upward trend in 1953.The index of industrial production (1948 - 100) rose from 119 in 1952 to125 in 1953. In the first quarter of 1954 the monthly average wvas 128,and this figure has risen further in the second quarter of 1954.
19. The following table shows production of some important industrialcomm.odities in 1951, 1552 and 1953:
Industrial Production
1951 1952 1953
Cotton cloth (yds. million) 4,076 4.,598 4,890Jute manufactures (000 tons) 875 952 869Finished steel (000 tons) 1,076 1,103 1,018Amonium sulphate (000 tons) 52.6 220.3 319.6Power aleohol (gallons million) 5.81 7.74 7.98Cement (000 tons) 3,196 3,538 3,780Paper & paperboards (000 tons) 131.9 137.5 138.2Vegetable oil products (000 tons) 172.3 190.8 191.4

- 8 -
20. The production of cotton textile mills in 1953 of 419oo millionyards was 4% higher thzan the 1955/56 target. Among basic industries,there has been increased production of chemicals, fertilizers cement,aluminum. Increases have been obtLined in sheet glass, power transformersand electric motors. The production of jute manufacturers declined during1953 chiefly because of lower foreign demand. In recent months, however,the working week in the jute industry has been raised from 42 to 45; hoursand in October to 48 hnours. 'After a decline in production in some branchesof engineering indust:r'ies, there has been a revival of output in severalengineering industries since the closing months of 1953.
21. It appears that the climate for private investment is improving asthe Government realizes that expansion of existing industries and theerection of new industries is needed, especially in view of increasing un-employment. Great emphasis is being placed now on the modernization of thetwo largest industries in India, namely, the jute and cotton industries.In September 1954,, the following resolution on rationalization was adoptedby The House of the People: "The House is of opinion that rationalizationof the textile and jute industries, where it is necessary in the c%untry'sinterests, must be encouraged, but the implementation of such schemes shouldbe so regulated as to cause the least amount of displacement o'f labor inthose industries, providing reasonable facilities for the employment ofsuch displaced labor". Following this step it will be necessary to examinethe existing social liegislation under which it is difficult to reduce thenumber of workers, even if production in the factory declines, In recentyears the Indian industry has complained about its rigid cost structure.
22. There also is a growing reAlization that it is not justifiable toencourage the old type cottage industries at the expense of factories (suchas is the case in the cotton textiles) but that cottage industries must bereorganized and modernized. In this connection, the report on small in-dustries prepared by a Ford Foundation team should be of great help. Fol-lovwing the recommendations of this report, the Government has decided toestablish four Institutes of Technology for small-scale industries. Thefunctions of these Institutes would be to assist in the spreading of theuse of suitable techniquea, to provide facilities for training, and toorganize market surveys and services,
C. FOREIGN TRADE AiD BALANCE OF PAYiENTS
23. Indiats balance of payments benefited from the Korean boom. How-ever, large imports of food and raw cotton resulted in a substantial tradedeficit in 1951/52 in spite of a high level of exports. Imports of food-grains were reduced from Rs. 2,303 millions in 1951/52 to Rs. 1,567 mil-lions and Rs. 725 millions in 1952/53 and 1953/54 respectively. Importsof raw cotton, which amounted to Rs. 1,372 millions in 1951/52 dropped toRs. 527 millions in 1953/54. As the table below shows, the trade deficitwas small and a substantial surplus on balance of payments current ac-count was achieved in the last two years:

-9 -
(Rs. Millions)
1951/52 1952/53 1953/54
Imports, C.ii.f. 9,34 4 6,132 5,679Exports, f.o.,b. 7,305 5, 999 5,385Trade balance -2,039 -133 -294Invisibles (net) including
official donations 7f679 /879 /934Current account (net) -1,360 L7It40
The terms of trade declined from 122 in 1951/52 (1948/h9 - 100) to 91 inthe two subsequent years. There has been an improvement in the terms oftrade in recent months; they stood at 97 in March and at 103 in April 1954.
214. After a decline in foreign exchange holdings of the Reser-e Bank ofIndia in 1952, there had been an increase of Rs. 173 millions in 1953. Atthe end of that year, foreign exchange holdings of the Reserve Bank ofIndia totalled Rs. '7,253 millions and they amounted to Rs. 7,320 millions(41,537.2 millions) at the end of September 1954. During 1954 India re-duced her rbligation to IB by $46.1 millions. The remaining obligation is$53.3 millions and the Gove-erYment of India intends to reduce it to $28 mil-lions by a further repurchaae of rupees equivalent t- Wp25,3 millions duringthe present year.
25. E-pc-rts
Tea, cotton textiles, and jute gocds account for more than half ofthe value of exports. The balance is made up of a number of commoditieswhich are individually of less importance. Export of oilseeds and oils wasrestricted during the boom on account of poor crops and increased domesticdemand, the volume of exports increased in 1952/53 but fell sharply in1953/154 on account of a glut in world markets Similarly, a substantialincrease in the volume of exports of hides and skins during 1952/53 was3ffset by a fall in prices which reduced their value te- below tteir 1951/52level, Amongst the lesser commodities, the most important increase bothin value and volume has been in exports of manganese, which rose from Rs.58 millions in 1948/49 to Rs. 243 millions in 1953/54; a sharp decline oc-curred., however, in. the spring of 1954. Exports of mica and pepper, too,have been substantial during this periode
26. Jute manufactures. Even at the height of the Korean boom, the volumeof jute7goods exports was 17% below the 91048/49 level. Supplies of rawjute be:'ng received. from Pakistan were -inadequate a,d donesCtic pr .ductionwas not h.-gh enough. to make good this shortfall, By T,he ti.me suies ofraw jute becainn easier, vrorld prices for jute goods had fa) len sharply.The Government of Inoia took various steps to help ~j-tL-e exp-,orts" In March1952 it removed all d3stinational controls which had oeen in force for anumber of years, I't also made a number of reductio.rs from March 1952 on-wards in the expcrt. duties Which had been sharply increased at tho heightof the boom; by September 1953 these duties were well below their pre-Korean level. The reduction in export duties helped to place the Indianindustry in a more competitive position, especially in the U.S. market; butit could writh advantage h.ave been made earlier. Exports of jute goods,particularly those of hessian, reached higher levels in the summner of 1954.By July 1954 the st,ocks of jute goods had fallen to the lowest level since1949. This account,s for the Jute Mill Associationts decision to increasethe working week to 45* hours, and more recently to 48 hours.

- 10 -
27. Cotton Textiles. Exports of cotton textiles have been until re-cently more affected by Government polioy, - which has aimed by a systemof annual export quotas at meeting the requirements of the domestic market, -
than by world conditions. Thus, although production continued to increase,exports dropped considerably in 1951/52 but partly recovered in the lasttwo years. The Indian textile industry derived some competitive advantagefrom devaluation. Exports reached a record level of l,12fl million yardsin 1950. The sharp drop in 1951/52 was mainly due to restrictions imposedby the Government ta ensure that supplies for the home market would beadequate. As production has continued to increase and with inflationarypressures within the country subsiding, availabilities for export by thebeginning of 1953 were again greater. In the meantime, however, wvorldtextile markets had been through a recession in 1952, and the Indian in-dustry was faced with increasing competition from Japan. Nevertheless,exports of cotton piecegoods increased further in 1953/5h, reaching afigure of 770 million yards, as compared with 620 million yards in 1952/53.
28. Tea. Exports of tea which amounted to less than 430 million lbs.in 19517m and in 1952/53 exceeded 470 million lbs. in 1953/5h. An un-expected depression had affected tlhe tea market in 1952/53, particularlylow quality teas, while stocks in the U.K. were being run down after theremoval of rationing. The sharp increase in coffee prices at the end of1953 contributed to develop the demand for tea as a substitute drink; teaprices which had been comparatively stable during the preceding three yearswent up by about one-third between the fall of 1953 and the spring of 1954.
29. The following table shows the value of exports of the three prin-cipal exports comnodities in the last three years:
(Rs. Millions)
1951/52 1952/53 1953/54
Jute manufactures 2,550 1,1400 1,130Cotton manufactures 690 82n 860Tea 94o 810 1,020
30. Imports
Imports of foodstuffs and industrial raw materials constitute aboutone-third of the total value of imports, and the fluctuations in the valueand volume of these commodities accounted to a large extent for the fluctu-ations of Indian imports in the last four years.
31. Foodgrains. Tvwo consecutive poor harvests made. necessary heeyy im-ports of foodgrains in 1951 and 1952. Imports of wheat made under a 4190millions "lWheat Loan" of the U.S* Government relieved the food situationin India. In 1952/53, a better harvest permitted to reduce fcodgrains im-ports to 2.1 million tons. Imports dropped further to 1.5 million tons inthe following year as a ccnsequence of the 1953/54 bumper crcp. Anotherbumper crop is expected in 1954/55.

-1-
32. Textile fibres. The volume of cotton imports was limited in 1950/51 by restrictions on U.S. exports, but their value soared as prices boomed.The high volmne of imports of 1951/52 partly represented a building-up ofstocks,and cotton imports dropped in the following year when these stockswere reduced. A continued low level of imports was made possible in 1953/54by a considerable increase in local production as well as further reductionof stocks. The volume of jute imports flumctuated on account of unsettledtrade relations with Pakistan. Substantial quantities of jute were importedin 1950/51, but the following two years witnessed a considerable decline,the consequences of which were partly made good by an increase in localproduction. A poor jute crop and a trade agreement with Pakistan resultedin a somewhat larger volume of jute imports in 1953/54. The value of juteimports soared to an unprecedented high of Rs. 480 millions during the 1951/52 speculative boom, but the price of raw jute declined thereafter to belowthe pre-Korean level and both in 1952/53 and 1953/5L the value of inportshas been less than Rs. 100 millions.
33. Manufactured Products
Imports of manufactured products have been comparatively more stablein value and in quantity, with some individual variations. The onlyimportant import items which have shown a consistent trend downward duringthis period have been fertilizers and metal manufactures. Heavy importsof fertilizers in 1951 and 1952 have been reduced in 1953 when the Sindrifertilizer plant went into production; similarly, imports of metal manu-factures have been restricted to protect the increase in domestic capacity.Most consumer goods showed a marked upward trend in 1950/51, but a downarrdtrend has taken place since, partly because of restrictions imposed by thecovernment and partly because demand has fallen as the anti-inflationarymeasures of the Govermment have made themselves felt. Recently, however,in view of the strong external financial position, the Government hasdecided to liberalize imports on a large scale. Steel and certain cate-gories of equipment were also imported in greater volume in 1953/54 by thestepping up of investments under the Five Year Plan.
34. The following table shows the value of the principal imports duringthe last three years.
(Rs. 1Pillions)
1951/52 1952/53 1953/54
Foodstuffs 2,850 1,620 870Raw:T jute 730 160 140Raw cotton 1,590 570 530Mletal manufactures 1,790 1,590 1,660Petroleum products 709 768 810 (est.)

- 12 -
35. Trade with Pakistan
India's trade with Pakistan since 1949 has been regulated by aseries of agreements. A three yearst agreement was concluded in Maarch1953 providing for minimum imports of raw jute from Pakistan and of coalfrom India. Refl4cting a fall of jute prices, the value of jute importsfrom Pakistan declined sharply after 1952. Pakistan imposed severe im-port restrictions in 1953; these restrictions have reduced Indian ex-ports to Pakistan of products other than coal to a mere trickle. Whilein 1952/53 India had a temporary trade surplus with Pakistan of nearlyRs. 100 millions, it had a trade deficit of about equal amount in 1953/54; this deficit was however smaller than those of 1950/51 and 1951/52.
36. Trade with the Dollar Area
In 1951/52, India had a trade deficit of 4319 millions with thedollar area. Exports amounted to 0381 milions and imports to $700millions; imports of food alone accounted for $336 millions. In 1952/53 and 1953/54, food imports declined to 4176 millions and $33.6 mil-lions respectively. Imports of raw cotton from the dollar area in thesethree years amounted to 4.168 millions, 36.4 millions and $8.h millions.The trade deficit with the dollar area was accordingly reduced to h44.5millions in 1952/53 and a trade surplus of 4Lh.5 millions was obtainedin 1953/54. The trade surplus has continued so far in the presentyear.
37. The improved foreign exchange position induced the Government ofIndia to liberalize imports and relax restrictions beginning with thesecond half of 1954. The quotas for various categories of goods havebeen liberalized without any increase in duty but liberalization of im-ports has been accompanied by an increase in import duty in the case ofmotor cars, woollen.fabrics, toilet requisites, boots and shoes, pencils,and razor blades.
38. Growing demand for fertilizers caused the Government to increaseimports of fertilizers to more than 100,000 tons. Finally, the lowerdomestic production.of sugar and spreading demand for white sugar in-duced the Government to consider imports of a record volume of 600,000tons of white sugar. In spite of these increased imports and relaxa-tion of import controls, it is doubtful that India will have a sub-stantial balance of payments deficit in 195h/55. However, "Indialsrequirements of foreign exchange reserves will rise in the coming yearsas money supply increases and provision has to be made for certainpayments due on capital accountt". 1/
I/ From the chapter on India prepared for the Ottawa meeting.

- 13 -
D. THE PROGRESS OF THE FIVE YEAR PLAN AND THE OUTLOOK
39. A brief history of the Five Year Plan might be useful here. A draftoutline of the Plan prepared by the Planning Commission and approved by theGovernment in 1951 (cluring the first year of the Plan) was divided in two parts.The first involved an expenditure if Rs. 14,930 millions which was to be im-plemented regardless of whether or not additional foreign assistance would beforthcoming. The second part involving an investment of Rs. 3,000 million wasnot yet prepared in detail at that time. It was thought that the second partcould be carried out only if and when India received adequate foreign assistanceThe first part of the Plan was in conformity with the proposed expenditure ofRs. 18,396 million for the Colombo Plan which extends over a period of six yearsOn December 7, 1952 the Planning Commission submitted to the Government a "T FiveYear Plan" with a total outlay in the public sector increased to Rs. 20,690million. The "Community Development Program' vrhich was not included in theoriginal "Five Year Plan" was started officially on October 2, 1952, but thereal work began later. Finally, about a year ago the Plan investment targethas again been raised by Rs. 1,750 million. The purpose of this expansion ofthe Plan was to provide more employment through various short-term projects.As the Plan went intc operation and as its targets were raised,additionalprojects had to be prepared or the execution of projects underway had to beaccelerated. A real evaluation of the Plan, particularly with regard to theachievement of the various investment and production targets, will be possibleonly toward the end cf the period of the Plan. It may be said, however, thatin various fields significant progress already has been obtained.
40. Schemes of minor irrigation have brought under irrigation and additionalarea of about 2.5 million acres up to the end of 1952. In the period 1951/52to 1953/54 more than 1.5 million acres have been brought under irrigation as aresult of the completion of the major irrigation schemes in the Plan. Theprogram of land reclamation carried out by the Central Government has resultedin reclamation of about 700,000 acres in the first three years of the Plan.Exact data reparding reclamation of land by State Tractor Organizations are notavailable. The use of fertilizers has considerably increased; the offtake ofa-monium sulphate has gone up from 200,000 tons in 1951 to about 423,000 tonsin 1953.
41.- In the sphere of power generation, additional power capacity of about450,oo0 00Il has been added in the first three years of the Plan.
42. On October 2, 1952 the Government started the Community DevelopmentProgram. A year later, the National Extension Scheme was inaugurated. Thebasic approach of the tro schemes is the same; the aim being to bring aboutan all-round development of rural life. The two schemes have been integratedbut the development activities undertaken in the Community Development Blocksare more intensive than those in the National Extension Service Blocks. About40.66 million persons are covered by the Community Development Program andNational Extension Service. It is intended that one-fourth of the rural areaof the country vill be covered during the first Plan period. About 4,h00village level workers and 738 supervisory staff were trained by the end of June1954. The idea of self help is one of the important aims of these programs.

_ 14 -
During the eighteen nonths ending DAarch 1954, the total voluntary contributionof the people in the 1952/53 community projects was a little less than halfthe total Government expenditure incurred in the same period. It is reportedthat the results so far obtained have been encouraging and as the administratiorand leaders of the vLllages gain more experience, there is reason to hope thatthe movement will ga-ther momentum.
43. The contribution to industrial production made by some of the new Stateenterprises lwTas as follows: The Sindri Fertilizer Factory, which went intoproduction in 1951/5?, reached an output of 249,000 tons of ammonium sulphatein 1953/5h and its a7verage daily capacity at present is about 965 tons asagainst a target of 1,000 tons; The Chittarangan Locomotive Factory produced64 locomotives in 19173/54. Indigenous manufacturers of locomotives can nowproduce about 80% of locomotive parts, the balance of 2C% being still imported.The Dry Core Cable Factory went int6 production in July 1954. The factory isto produce annually about 470 miles length of different specifications valuedat cost of about Rs. 10 millions. The production targets for the IndianTelephone Industries, that went into operation in 1951, have been stepped upto 60,000 telephones and 40,000 exchange lines yearly, which is more than doublethe original targets.
144. A government-owned iron and steel plant, with the initial target capacityof 500,000 tons per annum wrill be erected at Rourkela in Orissa State. Thetotal cost of the project is estimated at Rs. 750 millions, of wrhich aboutRs. 330 millions would be spent during the present Plan period. An agreementhas been signed wNith the German firms,Krupp and Demag,for technical and financiacollaboration.
45. As mentioned already, private industries have recorded substantial pro-gress in recent years, both in terms of increased production and installedcapacity. Arnong the nelw industrial projects, -hich went into production in1953/54, are the following: a paper mill with an annual capacity of 8,000 tons.a cement factory with an annual capacity of 165,000 tons; a staple fibrefac'tory with an annual capacity of 28,000 bales; a glass factory with an annualcapacity of 6,000 tcns; and six textile mills with 32,608 spindles and 350looms. A plant for the manufacture of calcium carbide (3,000 tons per annum)has started production recently. Various industrial enterprises are expectedto go into production during 1954/55. Among these are: three cement projects(new units as vwell as expansions) which would add 300,000 tons to the installedcapacity; a sheet glass factory with an annual capacity of 8,000 tons; in-stalled capacity for soda ash is likely to be augmented by 30,000 tons perannum during the next year. The oil refinery of Standard Vacuum Oil Companywent into production in July 1954. The Burma Shell refinery is expected to becompleted in 1955.
46. During the past year, the Government has accorded sanction for the esta-blishment of a number of new industrial projects. The more important ones area plant for the manufacture of heavy and medium trucks by Telco (Tata) intechnical and financial collaboration with M4ercedes-Benz (Germany), manufactureof industrial explosives, manufacture of dyes, establishment of a heavy steelcastings foundry by Telco.

- 1' -
47. The Plan estimated that during the five year period investment in theprivate sector would reach about Rs. 2,330 million. Actual investment in thefirst three years was only about Rs. 1,255 million. Increased investment ex-penditures are expected during the last two years of the Plan in the steel,oil refining, and chemical industries and in the generation of power. The paceof investment has been disappointing, and the Government of India has devotedmnLch attention to the problem of encouraging private industrial investment.The Government has taken a major step to ensure that as far as possible theavailability of finance should not be a limiting factor by supporting the esta-blishment of a pri-vate corporation to promote investment in industry. The corpo-ration will have capi-tal of Rs. 50 million to be subscribed by private interestsin India, the U.K. and the U.S.A., and the Government of India will make aninterest-free advance of Rs. 75 million. It is expected that this corporationwvhich will be called "The Industrial Credit and Investment Corporation of India",ill be established in early 1955. The Reserve Bank of India also appointed acommittee in October :L953 to inquire into ways and means of increasing fundsavailable for private industrial investment. In its report, this committeesuggested that lack of' finance was not a major cause for the low rate of invest-ment, and pointed to other factors which deterred private enterprise. Anothercommittee was established in 1953 to examine the extent to which the presenttax system might be considered deterrent to private investment.
48. In addition, the Government of India has recently established a National-Industrial Development Corporation, owned and managed by the Government of India,which would assist development of such industries not normally attractive toprivate enterprise. The nominal capital of the Corporation will be Rs. 1 mnil-lion but whatever funds would be needed for undertaking any new ventures wouldbe obtained from the Covernment as loan. The first meeting of the Corporationwas held on October 22, 1954. It is intended that the Corporation would extendtechnical and perhaps also financial assistance to private industries as well.
49. Substantial amounts were spent on the development and rehabilitationprogram of Indian Railways which aims at overtaking the arrears of replacementstill remaining from 7orld "rar II and at providing adequate transport facilitiesto meet the increased traffic demand. During the first three years of the Plan,the expenditure on the Railway Plan (excluding outlay on replacements for meet-ing current depreciation) is estimated at aboiit Rs. 1,100 millions. In 1954/55a provision of Rs. 650 millions has been made. Up to March 1954 orders have beenplaced for 1,662 locomotives of wAhich 510 locomotives have been received; ordersfor 4,899 coaching vehicles lhave been placed ail 2,713 vehicles have ben receivedup to 1953/54. In the first three years of the Plan, 26,700 wagons have beendelivered as comparddipith a total of 54,913 wagons for vrhich orders have beenplaced during the Plan period.
50. It should be pointed out that many important projects, such as the variousmultipurpose river projects, the expansion of the steel industry and fertilizerproduction, will be completed after the end of the first Five Year Plan and-therefore the full benefits from them will accrue to India at a later stage.
51. On the available evidence, it may be assumed that the targets of the Planwill be obtained to 80-90% which vill be certainly no mean achievement.

- 16 -
52. As pointed out in a previous chapter, financing of the fourth year ofthe Plan should offer no major difficulties. Present estimates are that de-velopment expenditure in the public sector will have to be stepped up to aboutRs. 7,4O0 millions in the last year (1955/56) in order to reach the target ofthe Plan.
53. Although it is too early to say with any certainty whether there willbe any difficulty in financing these expenditures, such evidence as there issuggest that the difficulty should not be too great. If we assume
(i) that the Central and State Governments will contribute from varioussources (including loans, small savings, provident funds, etc.) no more than isexpected during the present fiscal year, i.e., Rs. 2,600 millions;
(ii) that the utilized external assistance in the form of grants andloans will be about Rs. 400-500 millions more than the amount estimated in thecurrent year;
(iii) that the Governments will be able to make net borrowings from thepublic of Rs. 1,100-1,200 millions or about Rs. 650-750 millions more than isthe sum estimated in this yearts budget;
then there will be a gap of about Rs. 3,550-3,750 millions in 1955/56.
54;, Some of these assumptions are rather conservative. In particular, morefunds might be obtained from revenue, since revenues are likely to increaseindirectly as production increases and directly as a result of introduction ofvarious new tax measures by the States. Furthermore, if the experience of thecurrent year is any guide, receipts from borrowing should be higher than assumedabove.
55. Finally, it is unlikely that expenditures would reach the estimated levelalthough more and better prepared projects should be ready for execution andwork on projects on the way could be accelerated. The budget gap will mostprobably be less than. shown above.
56. If there should be a large deficit, the Government of India would haveeither to reduce the proposed rate of investment or borrow money from thebanking system by the issue of Treasury bills. As the Finance Minister pointedout in this yearts budget speech, there are signs that production cannot bemaintaired at the present level, or increased, without some increase of themoney supply in the hands of the public and he considered that there would beno undue risk run if the expected deficit in the current year of Rs. 2,500millions were met by the issue of Treasury bills.
57. The Finance Mlinister added that "deficit financing, subject to safeguardshas a definite part to plav in bringing into use the idle resources in thesystem". It is therefore probable that the Government would borrow money by theissue of Treasury bills to meet the budget deficit.
58. It is difficult to say in advance how far sales of Treasury bills ozother Government securities to the Reserve Bank would amount to borrowing om

- 17 -
the Reserve Bank and how far it jymd represent receipts from the public. Duringthe last three years, the Reserve Bank has been very successful in placingGovernment securitios in the hands of the public through open market operations.Should the issue of Treasury bills and perhaps also an expansion of privatecredit, due tn a higher rate of investment lead to an increase in the moneysupply and inx turn to a balance of payments deficit, India could meet thisdeficit from its sterling balances. She still has available about Rs. 2,000million of the sterling balane,es which were to be released during the Five YearPlan period. In that way, inflationary effects of the increased money v would be offset. Should, however, no substantial balance ef paeas a result of an expansion in the money supply (particularly created by deficitfinaxniig), this might then be taken as evidence that this expans ion was reallyneeded to maintain production at an increasing level and should, therefore, wtbe considered inflationary.
59. Judging by the past performance of the Government of India, one may expecithat 'deficit finaneing" would be kept within such limits as to avoid thecreation of real inflationary pressure.
E. THE FrVE YEAR FIAN AND INDIAtS CREDIWORTHINESS
6M. As a result of the increases in production anticipated to mate-rializeby the end of the Plan, the national income (at 1948Ah9 prices) is expectedto reach Rs. 100,000 millions, an increase by 11% over the 1950/51 level.Not all the benefits ef the investments undertaken during the period of thePlan will be realized in this period. Even if the Plan is implementod only to80-909 during the five years, it is certain that national production will in-crease by a good margin as can be seen already from the prmgress made during'the first three years,, There will be much more irrigated and reclaimed land,a substantially greatbr use of fertilizers, better seeds and various agri-Cultural implements. There rill be an expansion and also modernization ofvarious industries and an improvement of transportation. And as a whole, theIndian economy will have Poached a stage from 'ihich it should be easier toreach a higher degree of economic develepment,
61. The economic-development of India as outlined in the Plan will resultin substantial foreign exchange savings through direct substitution ofdomestic products for present imports. As noted, much of the increase innational income resulting from the Plan will not be realized until the yearsfollowing the Plan since a large part of current investment is coneentratedon projects such as irrigation and other agricultural improvements, powerand transportation, and even industries for wThich some time vill be requiredbefore all direct and indirect benefits are realized. It may also be ex-pected that a substant;ial rate of investment rill be maintained after thecompletion of the pre-sent five year program. The Planning Commission hasalready started prepaning a Second Five Year Plan. Judging by all availAbleevidence, more emphasis will be placed on promoting industrial expansion. Itis proposed, for example, to increase the production of steel to six milliontons and that of cemenit to ten million tons annually. It is assumed that thetotal proposed expenditure of the Second Five Year Plan will be higher than thatof the First Five Year Plan. How high the rate of investment may be in this

- 18 -
period subsequent to th. present five year program is, of course, uncertain andwill depend on the level of savings, on the extent to wshich savings can bemobilized for priority purposes, on foreign financial assistance includingprivate foreign investment., and on policies affecting ihe rate of capital forma-tion in the private sector. It may be said that the Government is aware thatthe rate of investment must be stepped up in order to provide employment and toproduce enough goods for the growing population of India and to make possible asteady increase in the standard of living.
62. A dynamic apprDach is therefore indicated toward India's longer rangebalance of payments prospects and creditwrorthiness. Over the next decade,India can be expected to reduce its dependence on imports for a wide range of-goods such as foodgrains, fertilizers, heavy chemicals, industrial explosives,dyestuffs, drugs, steel, refined petroleum products, and a large number of bothheavy and light manufactures including machinery and machine tools, automobilesand trucks, agricultural equipment, locomotives and rolling stock, telephoneequipment, synthetic fibres, and an increasing variety of other consumer goods.These savings should more than offset increase-in such imports as machinery andequipment, crude petroleum, non-ferrous metals, and other raw materials and alsoconsumer goods which can be expected to accompany a higher level of economicactivity.
63. With regard to exports, India should be able to continue exports of suchcommodities as tea, spices, tobacco, mica, various minerals, raw wAool, short-staple cotton, lac, hides and skins, cashew nuts, and others. In addition,increases in foreign exchange earnings may also be expected from such exportsas coal, iron ore, manganese and other minerals, cement, salt, vegetable oils,and increasing variety of light engineering products and other manufacturedgoods. In the field of jute manufactures, India will meet new competition ofthe Pakistan jute industry which will be felt especially in the United Statesmarket. As the price of raw jute and jute products has reached a level at whichjute once more has become a cheap packaging raterial, jute may acquire a sharein the increasing world consumption of packaging material which it was unable tosecure in the last decade on account of the high prices caused by a shortageof raw jute. In a competitive market, the experienced Calcutta industry shouldbe able to maintain its position, but it must accelerate the modernization ofits plants. However, it is unlikely that the production target of 1,200,000tons fixed by the Plan could be achieved. W1ith regard to cotton textile exportsit is doubtful that the Five Year Plan export target of 1,000 million yards willbe achieved, but substantial exports of cotton goods can be assumed is shown inrecent years (exports of 800-900 million yards are expected in 195h).
64. In a developing economy with diversified exports and changing patternof trade, it is not feasible to make a quantitative estimate of Vhat the netbalance of payments benefits of these additions to national output might be,Even writh an increasing per capita production of foodgrains, this might notbe reflected fully in a reduction in food import requirements since it is dif-ficult to say vrhat part of the additional output would be consumed by the culti-vators especially in the first years of the increased production. It may benoted, however, that these benefits will be added to a balance of paymentsposition which at the present time is reasonably satisfactory, particularly whentaking into account the rising rate of investment. The position at the moment,

- 19 -
however, has been substantially improved by two favorable harvests; and thegreatest uncertainty covering India's balance of payments problem at presentarises from the year-to-year variations in domestic food production and theconsequent fluctuations in food import requirements.
65. The Indian Planning Commission has estimated that with food importrequirements at about; 3 million tons (valued at Rs. 1,150 millions) and withan increase in the amiount of capital goods imports needed for development,India would still haxre a balance of payments deficit by the end of the Planin 1955/56. If it could be assumed that food imports would remain at presentrates, the position at the end of the plan would, on the basis of the Com-mission's projections, be a surplus rather than a deficit. And this would bebefore much of the expected increase in production from current investmentin irrigation and other agricultural improvements, power, and other longer-term undertakings would have been realized.
66. It is, of course, unrealistic to assume that India's food import re-quirements will remain consistently at their present level. It must be ex-pected that the leve;L of food imports will be increased in years of poormonsoon. Nevertheless, it can also be expected that current and planned in-vestment in irrigation (which over a decade is estimated to increase theirrigated area by 80% to 90%), in land reclamation and in other complementarybenefits to agricultural production will result not only in increasing theaverage annual output of food and other farm production but also in reducingyear-to-year variations in yield due to weather conditions. Furthermore, witha growing domestic ouitput of goods other than foodstuffs now imported, India'sability to adjust to years of poor harvests without excessive savings in thebalance of payments should be facilitated. It seems reasonable, therefore,to expect that India''s average balance of payments position will continue tobe strengthened, that the degree of dependence on food imports in years ofadverse weather conditions will be steadily reduced, and that present year-to-year variations in import requirements will be increasingly narrowed.
67. India's record of sound financial policies and its demonstrated abilityto overcome balance of payments difficulties through appropriate monetaryand fiscal measures are a further basis for confidence in increasing balanceof payments stabilityr.
68. The report entitled "The Five Year Plan of India and India's Credit-worthiness" dated February 14, 1952, concluded that in view of progress inIndia since previous assessments were made, India's capacity to serviceforeign debt was considerably greater than previously estimated. That reportstated that it would be appropriate for the Bank to make further loans in1952 up to a total of about $60-70 millions. In fact, further Bank loanssince that date have amounted to $42 millions. Taking into account India'sperformance since 19'51 and the expected effects of economic development onthe balance of payments, it is certain that India's capacity to serviceforeign debt is even greater today than at the time of the last assessment.

- 20 -
69. At present India has the following official foreign debt:
IBRD loans (as of October 1, 1954) $100.5 millions(of which: Repaid) $ 12.49 "
U.S. Wheat Loan $189.7 "Sterling Debt $ 14.3 "
70. The amount of external debt outstanding as of June 1, 1954 was $291.8millions. This total includes amounts not yet disbursed. Service paymentson the total amount are estimated at $10.9 millions in 1954; they move upto $14.5 millions in 1957 and 1958. A peak is reached in 1962 when servicecharges rise to $19.8 millions. In 1963 and 1964 service charges amount to$17.4 millions per year, declining to $14.3 millions in 1965 and 1966.Service charges move gradually downward to 411 millions in the period 1971/76. They amount to Q;12.3 millions in 1978 when it is estimated that onlysome $96 millions of the present external debt will remain outstanding.
71. In addition, India had an obligation of $99.88 millions to the Inter-national Monetary Fund. This ob'ligation was reduced in the current year to$53.3 millions. The gold and foreign assets of the Reserve Bank were $1.777millions at the end of August 1954, as compared with $1,729 millinns at the!nd-of 1952.
72. The position of India should be reviewed again when more is known aboutthe Second Five Year Plan.

APPENDIX
Outline of The Five Year Plan
I. Public Sector
The Five Year Plan, as submitted by the Planning Commission to theGovernment in December 1952, involved an outlay of about Rs. 20,690 millionin the period 1951/52 - 1955/56. Towards the end of 1953, the Plan was ex-panded by Rs. 1,700 million to a total of Rs. 22,390 million.
The division of expenditure by public authorities is shown in thetable below:
Rs. % ofBillions Total
Agriculture and CommunityDevelopment 4.03 18
Multipurpose projects 2.66 11.9Irrigation 1.75 7.9Power 1.42 6.3Transport and Communications 5.26 23.5Industry 1.77 7.9Social Services 3.56 15.9Pehabilitation 1.29 5.8Miscellaneous .63 2.8
The Plan set the following targets for principal agricultural crops:
1950/51 1955/56 Increase
Foodgrains (million tons) 54.0 )/ 61.6 / 7.6Sugar Cane (million tonsof gur) 5.6 6.3 L 0.7
Oilseeds (million tons) 5.1 5.5 / 0.4Cotton (million bales) 3.0 4.2 f 1.2Jute (million bales) 3.3 5.4 / 2.1
/ In 1949/50.
The electric-power--generating capacity is expected to be augmented by morethan 50% (from 2.3 million kw to 3.5 million kw) largely as a result of themulti-purpose irrigration schemes.
Of the expenditure on industry, Rs. 1,400 million is to be spent onlarge-scale industries, Rs. 270 million on cottage and small-scale industries,and Rs. 60 million on mineral developments and scientific and industrial

Appendix - 2
research. Most of the industrial projects on hand in the public sector willbe completed by 1953/54; this applies to the Sindri fertilizer factory whichhas commenced production in 1952, to the Chittaranjan locomotive factory, thedry core cable factory, and a newsprint plant. An amount of Rs. 300 millionis estimated to be spent during the period of the Plan on a new integratediron and steel plant, of which the total cost will eventually be Rs. 800 mil-lion.
The major part of the proposed expenditure on transportation, Rs. 500million yearly, will be on railways in addition to Rs. 300 million per annumestimated as required for the current depreciation of railway installationsand equipment.
Of the total proposed expenditure of Rs. 20.7 billion the outlay ofthe Central Government is Rs. 12,410 million, or almost 60% of the total.The Planning Commission assessed the resources which it thought will beavailable for the financing of the Plan. According to this estimate, anamount of Rs. 12,580 million, or about 61% of the total outlay, would befinanced from internal resources. The following table shows the individualitems of these resources expected to be available.
1951/56 Plan EstimatesSource
(billion rupees)
Center States Total
1. Public savings from:
(a) current revenue / 1.60 4.08 5.68(b) profits of railways 1.70 1.70
7.382. Private savings absorbed by
Government through:
(a) lcans from the public 0.36 0.79 1.15(b) small savings and other
unfunded debt 2.7 2.7(c) deposits, funds, and
misc. 0.9 0.451355.20
Total 1. plus 2. 12.58
2/ Savings from current revenue are defined as surpluses of revenue oversuch expenditures of the Government as have been treated as non-developmental in the Plan, i.e., total revenue minus expenditure ofnon-developmental nature on revenue and capital account.

Appendix -3
This would leave a gap of Rs. 8,110 million to be covered by external assis-tance and by the use of Rs. 2,900 million of sterling balances to be re-leased during the period of the Plan. The additions to the Plan of Rs. 1,700million represent a corresponding addition to the requirements of finance forthe Plan.
II. The Private Sector
The total investment in organized private industry was estimated atRs. 6,130 million, cf which:
Rs. Million
Expansion 2,330Moderni2ation and replacement 1,5C0Current depreciation not covered
by normal income tax allowances 800Additional working capital 1,500
It was assumed that these requirements would be financed as follows:
Rs. Million
Corporate savings 2,000New security issues 900Refunds of excess profit tax 600
3,500
Foreign investment 1,000Loans from Industrial Finance Corporation 200Assistance from public sector 50Bank credit and other sources of short-term finance - mostly for working capital 1,580
Production targets for various industries are given in the StatisticalAppendix Table 5.
Total gross investment in the public sector (including the yearly Rs.300 million on Railway Depreciation) and in organized industry would thusamount to nearly Rs, 30,000 million. Adding to it investment in construc-tion, non-organized sector of industry and trade, one arrives easily at atotal of Rs. 32,000 million. This does not include investment in the privateagricultural sector for which no estimate is available. The Plan assumed arate of saving of 5'S, rising gradually to 7% in the last year of the Plan,or by about one third. Based on the national income estimated for the firstyear of the Plan of Rs. 95,500 million, the savings would amount to aboutRs. 4,775 million.

STATISTICAL APPENDIX !/
1. National Income (net domestic products at factor cost: Rs. millions)
1948/49 1949/50 1950/51Current PricesAgriculture, forestry &fisheries 42.5 44.9 48.9
Mining, manufacturing &handicrafts 14.8 15.0 15.3
Commerce, transiDort & com-munication 16.0 16.6 16.9
Other services 13.4 13.8 14.4
TCTAL 86.7 90.3 95.5
1948/49 prices - Total 86.7 88.4 88.7Source: National Income Committee.
2. Principal Crops (crop years; in million long tons, except when other-wise stated)
1949/50 1950/51 1951/52 1952/53 1953/54 1954/55
Rice 23,2 20.3 20.7 22.5 27.1 27.0Wheat 6.3 6.4 5.8 6.8 7.2 7.6Other cereals 16.5 15.0 15.5 19.1 21.1 n.a.Pulses 8.0 8.3 8.3 8.6 9.9 n.a.Oilseeds 5.2 5.1 4.8 4.6 5.6 n.a.Sugar cane 4.9 5.6 5.9 5.3 5.4 5.7Cottoi 2/ 2.6 3.0 3.1 3.1 3.9 n.a.Jute .2/ 3.3 4.7 4.7 4.6 3.1 2.8
General Index(1949/50 = 100) 100.0 95.6 97.4 102.0 113.5 n.a.
2/ Expressed in terms of raw sugar (gur)./ In million bales of 392 lbs./ In million bales of 400 lbs.
Source: Ministry of Food and Agriculture; 1949 to 1953, revised finalestimates; 1953/54, final forecast; 1954/55, preliminary,based on acreage estimates.
j Except when otherwise stated, periods other than calendar yearsrefer to years beginning April 1st.

Statistical Appendix - 2
3. SuDply of Foodains 1/""Plan"Target
1949/50 1950/51 1951/52 1952/53 1953/54 1955/56
Local production 54.0 50.0 50.3 57.0 65.3 61.6Imports 3.0 2.1 L.8 2.1 1.5 3.0
Total supply (milliontons) 57.0 52.1 55.1 59.1 66.8 64.6
Population (includLngKashmir)(millions) 354 358 362 367 371 380
Supply per capita(tons) .161 .146 .152 .161 .180 .170 a
1/ Including wheat flour and pulses
2/ .162 without imports
Sources: Ministry of AgricultureDepartment of Commercial IntelligencePlanning Commission

Statistical Appendix - 3
4. Supplyo.f Raw Jute and Output of the Jute Industry ('000 long tons;Years beginning July Ist)
1949/50 1950/51 1951/52 1952/53 1953/54
Raw Jute
Local Production 554 590 835 824 560Net imports 1/ 178 460 327 237 264
Total supply 732 1050 1162 1061 824
Jute Manufactures /
Hessian 285 330 310 348 390Sacking 505 493 607 510 445Yarn and rope 35 35 29 34 31
Total output 2/ 825 858 946 892 866
Of which:
Local Consumption 117 114 147 167 117Exports 734 713 785 686 792
2/ Imports of Pakistan jute into Calcutta and mill stations, minus totaljute exports. Exports were 108,000 tons in 1949/50 and negligiblethereafter.
2/ I.J.M.A. mills only.
.2/ Difference between this figure and total supply mainly due to productionof mills outside I.J.M.A., losses at mills, and movements of raw jutestocks.
Source: Indian Tute Mills Association (IJMA)

Statistical Appendix - 4
5. Supply of Raw Cotton and Output of the Cotton Industry
(Million lbs; Years beginning August lst)
Raw Cotton 194-9/5 1950/51 1951/52 1952/53 1953/5.
Local production ./ 1140 1310 1510 1420 1790Imports 454 381 484 263 200*Exports 101 74 58 143 50*
Total net supply 1493 1617 1936 1540 1940*
Changes in Stocks -52 /108 /250 -287 -200*
Total consumption 1551 1509 1686 1827 2140*
Cotton Manufactures (million Yards)
1950 1951 1952 1953
Mills 3667 4076 4598 4890Handlooms * 636 1000 1000 1000
Total production 4303 5076 5598 5890
Of which exported 1120 823 593 592
/ This figure is not comparable with the figure given in Table 1.
X Estimated.
Sources: International Cotton Advisory Committee, for raw cotton.Ministry of Commerce and Industry, for manufactures.

Statistical Aptendix - S FirstHalf Target
6. Industrial Production 1950 1951 2 1953 1954 1955/5
EnergyCoal (million tons) 32.3 34.4 36.2 35.8 18.0 n.a.Electricity (billion
KWH) .2 5.28 5.95 6.30 6.88 n.a. 7.50
ManufacturingCotton cloth (yds. million) 3,667 4,076 4,598 4,890 2,072 2/ 4,700Jute manufactures (o00 tons) 835 875 952 869 432 1,200Woolen manufactures (million
lbs.) 18.0 17.7 16.6 17.0 6.6 2/ 25.0Finished steel (000 tons) 1,004 1,076 1,103 1,018 514 1/ 1,360Hurricane lanterns (000's) 2,807 3,977 3,523 4,313 2,006 2/ 6,000Diesel engines (units) 4,596 7,248 4,248 3,720 3,271 9/50,000Sewing machines (units) 30,888 44,480 50,040 62,424 41,474 91,500Cycles (complete)(000's) 103.1 144.3 197.0 264.2 128.3 / 530.0Complete Ring SpinningFrames (units) 260 276 288 204 88 700
Aluminum (tons) 3,596 3,848 3,566 3,758 1,729 12,000Copper (tons) 6,614 7,083 6,079 4,920 3,400 n.a.Electric lamps (millionunits) 14.3 15.5 20.9 19.8 8.9 2/ 30.0
Electric motors (000 HP) 81.6 141.6 157.2 162.0 71.5 / 320.0Dry cells (million units) 138 143 130 148 69 / 320Power transformers (000 KVA) 172 194 215 308 147 2/ 450Sulphuric acid (000 tons) 102.5 106.9 96.1 107.8 58.0 2/ 192.0Caustic soda (000 tons) 10,8 14.7 17.1 22.5 13.8 33.0Soda ash (000 tons) 43.8 47.5 44.3 56.9 24.0 ./ 78.0Superphosphates (000 tons) 52.4 61.0 46.7 46.9 39.7 ! 164.0Ammonium sulphate (000 tons) 47.3 52.6 220.3 319.6 122.9 v 470.0Liquid chlorine (000 tons) 3.97 5.27 6.24 8.57 3.57 a n.a.Paint & varnishes (000 tons)27.9 33.5 32.2 30.9 12.8 2/ 60.0Soap (000 tons) 72.7 83.4 86.4 80.1 28.4 2/ 200.0Glycerine (000 tons) 2.00 2.42 2.22 2.51 .90 2/ 2.70Sugar (000 tons) 977 1,115 1,494 1,291 755 2/ 1,500Matches (000 cases) 523 577 608 590 249 700Power alcohol (million im-perial gallons) 4.50 5.81 7.74 7.98 5.07 18.001
Rayon yarn (tons) - 2,088 3,588 3,456 2,322 8,000Cement (000 tons) 2,612 3,196 3,538 3,780 2,184 4,715Refractories (000 tons) 236 238 244 228 93 v n.a.Sheet glass (million sq.ft.) 9.6 11.1 9.0 22.8 8.5 2/ 26.0Automobile tires (000) 638 870 721 768 438 n.a.Cycle tires (000) 3,325 3,942 4,189 4,645 2,589 n.a.Margarine (Vanaspati)(tons) 171.6 172.3 190.8 191.4 n.a. 300.0Plywood Tea chests (millionsq. ft.) 41.4 60.6 78.2 49.5 20.3 100.0
Paper & paperboards (000tons) 108.9 131.9 137.5 138.2 68.2 188.0W
General Index (1946 = 100) 105 117 129 135 139 n.a.
2/ Years beginning April 1st.g/ First five months only.
Sources: Ministry of Commerce and Industry. Planning Commission.

StatisticalAp-pendix - 6
7. Price Indices 1950 1951 1952 1953 1954 2
Wholesale prices (July 1938-August 1939 = 100)
Food 410 410 360 381 367Raw materials 503 608 454 460 455Semi-manufactured articles 341 378 347 356 358Manufactured articles -348 396 378 367 375
Total 9/ 401 439 387 394 391
Cost of living (1944 = 100)
Urban working class 138 144 141 145 138
1/ First eight months./ Including miscellaneous articles.
Sources: Ministry of Commerce and Industry; and Ministry of Labour
8. Money Supply (Rs. billion; end of year)
1949 1950 1951 1952 1953 125L*
Currency with the public 12,2 12.0 11.7 11.2 11.5 11.8Deposits with the public 6.5 6.3 6.0 5.6 5.6 6.0
Total 18.7 18.3 17.7 16.8 17.1 17.8
* End of Junei.
Source: Reserve Bank of India
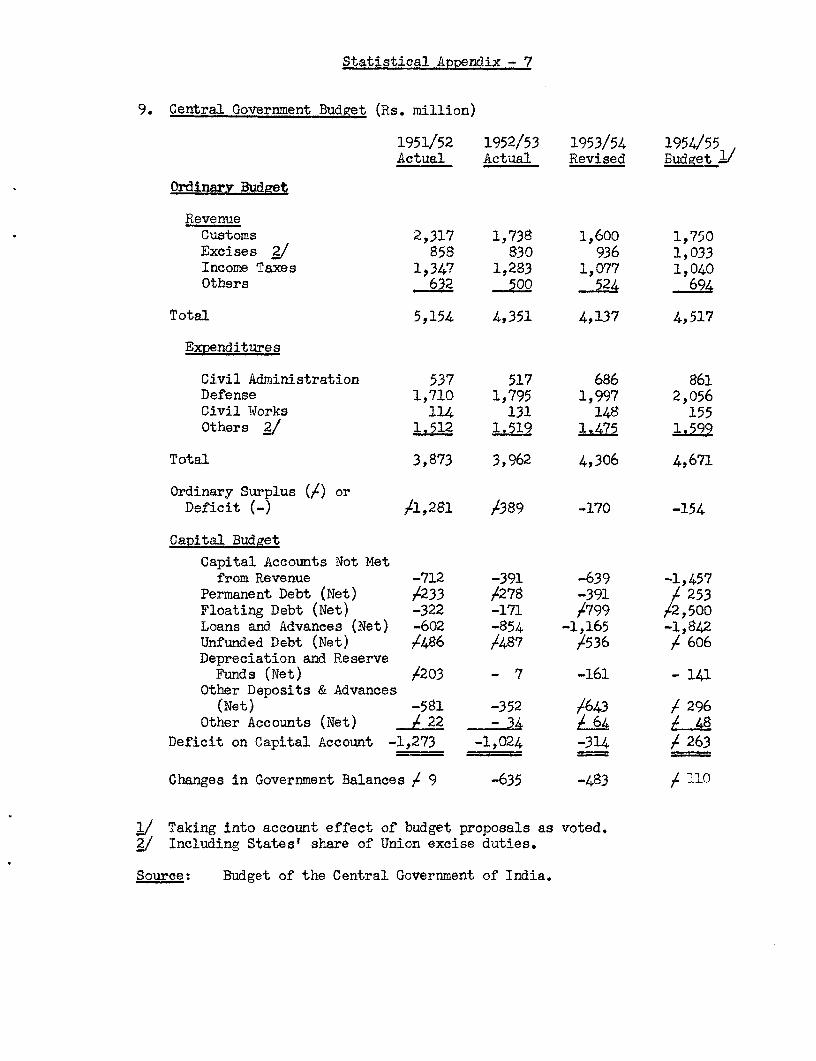
Statistical Appendix - 7
9. Central Government Budget (Rs. million)
1951/52 1952/53 1953/54 1954/55Actual Actual Revised Budget
Ordinary Budget
RevenueCustoms 2,317 1,738 1,600 1,750Excises / 858 830 936 1,033Income Taxes 1,347 1,283 1,077 1,040Others 632 500 524 694
Total 5,154 4,351 4,137 4,517
Expenditures
Civil Administration 537 517 686 861Defense 1,710 1,795 1,997 2,056Civil Works 114 131 148 155Others 2/ 1.512 1.519 1.475 1.599
Total 3,873 3,962 4,306 4,671
Ordinary Surplus (V) orDeficit (-) /1,281 /389 -170 -154
Capital Budget
Capital Accounts Not Metfrom Revenue -712 -391 -639 -1,457
Permanent Debt (Net) /233 /278 -391 / 253Floating Debt (Net) -322 -171 f799 /2,500Loans and Advances (Net) -602 -854 -1,165 -1,842Unfunded Debt (Net) /486 /487 /536 f 606Depreciation and ReserveFunds (Net) /203 - 7 -161 - 141
Other Deposits & Advances(Net) -581 -352 /643 / 296
Other Accounts (Net) / 22 - 34 a i 48Deficit on Capital Account -1,273 -1,024 -314 f 263
=
Changes in Government Balances / 9 -635 -483 f '10
2./ Taking into account effect of budget proposals as voted.g/ Including States' share of Union excise duties.
Source: Budget of the Central Government of India.

Statistical Appendix - 8
10. State Budaets (Rs. million)
1951/52 1952/53 1953/54 1954/55Actual 2 Actual Revised Budget
Revenue
Tax revenue / 2,799 3,028 3,242 3,255Other revenue 1.424_ 1,481 1.607 1.798
Total 4,223 4,509 4,849 5,053
Expenditure
Developmental expenditure 3 1,981 2,234 2,575 2,868Other Expenditure 2,115 2.242 2.455 2.592
Total 4,096 4,476 5,030 5,460
/ Excluding Part C States for which no data available.
v~/ Including the States' share of Central income taxes andexcise duties.
v/ Including Civil Works, Education, Scientific, Medical andPublic Health, Agriculture, Veterinary, Cooperation, Industries,Rural Development, Labour Welfare, Aviation and BroadcastingDepartments, Electricity scheme and Community development proj-ects. This amount is not identical with development expenditureunder the Five Year Plan.
Source: Reserve Bank of India

Statistical Appendix - 9
11. Central Government Debt 1/ (Rs. billions; March 31)
1920 1951 1952 1953 1954
Rupee loans (funded debt) 14.52 14.38 14.02 14.06 13.66Small savings 2.94 3.26 3.73 4.18 4.55Treasury bills 3.42 3.58 3.14 3.15 3.35Other rupee debt 3.58 3.79 3.85 3.63 3.98Foreign debt / .57 .61 1.46 1.44 1.41
Total 25.13 25.62 26.20 26.46 26.95
1/ Interest bearing obligations only.
Source: Reserve Bank of India
12. Foreign Exchange Reserve (Rs. billions; end of March)
1950 1951 1952 1953 1954 1954*
Sterling Assets of ReserveBank 8.59 8.84 7.23 7.24 7.53 7.31
Dollar Assets of Governmentand Banks .27 .27 .20 .35 .38 .35
X End of September.
Source: Reserve Bank of India and U.S. Federal Reserve Board.
13. Foreign Trade (Rs. billions)
1950 1951 1952 1953lt 2nd 1st 2nd 1st 2nd 1st 2nd lsthalf half half half half half half half half
Exports, includingre-export 2.51 2.92 4.03 3.55 3.20 3.08 2.52 2.79 2.46
Imports, c.i.f. 2.46 2.94 3.84 4.72 4.91 3.05 2.94 2.72 2.75
Trade Balance .07 .02 .19 -1.27 -1.71 .03 -. 42 .07 -. 29
Source: Foreign Trade and Navigation of India

Statistical Appendix - 10
14. Volume of Trade and Terms of Trade (1948/49 = 100)
_ j:.2 Quantity Index Price Index1950/51 1951/52 1952/53 1953/ 54 195 1 1/52 1952/53 1953/54
Exports
Jute Manufactures 68 83 73 82 134 216 114 89Tea 105 104 103 114 113 133 115 131Cotton manufactures 316 92 146 172 87 113 94 79Oilseeds and oils 167 104 148 40 123 148 116 117Hides and skins 128 133 143 147 130 138 99 114Spices 103 123 107 91 276 315 255 196Raw cotton 47 37 98 63 229 274 137 136
Total exports I/ 110 89 94 94 129 178 116 107
Imports
Metals & manufactures 98 100 76 61 128 130 141 175Foodgrains & flour 61 145 83 44 94 114 127 124Raw cotton 131 129 84 71 119 164 141 115Petroleum 128 158 160 176 137 154 154 161Chemicals / 58 97 53 83 95 105 103 99Raw jute 50 62 32 33 77 197 73 61
Total imports 2 83 108 74 64 106 147 128 118
Terms of Trade - - - - 122 121 91 91
2/ Including also commodities other than those shown above.g/ Excluding fertilizers.
Source: Foreign trade and navigation of India; including trade with Pakistan.

Statistical Appendix - 11
15. Balance of Payments / (Rs. Million)
1950 1951 1952 19531st 2nd 1st 2nd 1st 2nd 1st 2ndhalf half half half half half half half
Merchandise (net) 2/ -38 319 -171 -1226 -1121 186 -399 43Services (net) 74 82 188 131 345 320 251 11Remittances andgrants 55 82 66 77 158 129 153 167
Surplus or deficiton current account 91 483 83 -1018 -618 635 5 221
U.S. Food Loan - - - 380 385 141 - -
Other long-termcapital,errors and -16 -158 92 -41 -120 -333 194 78omissions .2/
Overall surplus ordeficit / 75 325 175 -679 -353 443 199 299
2 Including transactions with Pakistan.v Not comparable with trade figures because of time lags and of
differences in method of valuation. Also, imports in tradefigures (Table 12) include payments of freight and insurancepaid to Indian nationals, which are excluded in the balanceof payments figures.
/ Including short-term private capital and unrecorded transactionswith the Middle East.
_/ Representing a net accumulation or depletion of foreign assetsand liabilities.
Source: Reserve Bank of India.

Statistical Appendix - 12
16. Regional Balance of Payments (Rs. Million)
Sterling Area (excluding 1950 1951 1952 1953Pakistan)
Merchandise 210 672 157 -218Current invisibles / 476 601 660 635Official grants - 14 28 1
Total current account 686 1,287 845 418
Pakistan
Merchandise -20 -531 301 -67Current invisibles / - 65 92 45
Total current account -20 -466 393 -22
Dollar Area ?/
Merchandise 290 -643 -1,250 271Current invisibles / -25 25 61 45Official grants 21 - 77 176
Total current account 286 -618 -1,112 492
Other countries
Merchandise -199 -895 -143 -341Current invisibles j/ -179 -253 19 21Official grants - - 15 1
Total current account -378 -1,148 -109 -319
All Areas
Merchandise 281 -1,397 -935 -355Current invisibles / 272 438 832 746Official grants 21 14 120 178
Total current account 574 -945 17 569
1/ Including private donations.g/ Including 3elgiumi, Germany, and Switzerland through part of 1950; and
Japan through 1950 and part of 1951.
Source: Reserve Bank of India.

Statistical Appendix - 13
17. Commodity Structure of U.S. Trade with India ($ million)
1950 1951 1952 153LU.S. Imports
* Jute manufactures 90.5 104.8 103.3 64.8 38.8Pepper 36.8 34.2 27.6 20.7 9.8Manganese and Ilmenite 16.5 15.7 23.9 40.5 21.9Mica 20.6 17.5 9.4 9.7 3.2Hides and skins 16.9 20.5 14.9 13.0 6.1Tea 19.8 15.7 14.6 16.5 15.0Cashew nuts 15.1 19.2 18.7 19.4 8.1Gums and resins 11.0 15.1 11.9 9.6 3.7Raw wool and hair 8.6 7.3 12.4 5.8 4.3Cotton and manufactures 5.4 13.6 2.0 3.1 1.2Other products 21.2 26.2 26.3 25.0 lo.8
Total 260.4 289.8 265.0 228.1 222.9
U.S. Exports
Food grains 27.5 205.0 158.5 43.9 -Raw cotton 73.7 126.7 94.7 5.7 28.5Machinery and vehicles 53.9 62.4 49.8 46.8 34.5Petroleum products 6.3 15.5 26.6 17.5 8.9Chemicals 20.2 22.3 20.5 15.6 9.1Metals and manufactures 15.2 12.7 15.1 9.3 8.1Tobacco 5.2 5.0 4.3 1.4 .9Other products 9/ 10.1 14.7 11.3 11.1 7.3
Total / 212.1 464.3 380.8 151.3 97.3
India's Surplus or Deficit /48.3 -174.5 -115.8 /76.8 /25.6
/ First seven months/ Excluding special categories
Source: U.S. Department of Commerce