Embed Size (px)
Citation preview

El SalvadorC
alvo-Gonzalez and Lopez
Oscar Calvo-GonzalezJ. Humberto Lopez
Systematic Country Diagnostic
El SalvadorBuilding on Strengths for a New Generation
Pub
lic D
iscl
osur
e A
utho
rized
Pub
lic D
iscl
osur
e A
utho
rized
Pub
lic D
iscl
osur
e A
utho
rized
Pub
lic D
iscl
osur
e A
utho
rized

El SalvadorBuilding on Strengths for a New Generation
Oscar Calvo-Gonzalez and J. Humberto Lopez

© 2015 International Bank for Reconstruction and Development / The World Bank1818 H Street NW, Washington, DC 20433Telephone: 202-473-1000; Internet: www.worldbank.org
Some rights reserved1 2 3 4 18 17 16 15
This work is a product of the staff of The World Bank with external contributions. The findings, interpretations, and conclusions expressed in this work do not necessarily reflect the views of The World Bank, its Board of Executive Directors, or the governments they represent. The World Bank does not guarantee the accuracy of the data included in this work. The boundaries, colors, denominations, and other information shown on any map in this work do not imply any judgment on the part of The World Bank concerning the legal status of any territory or the endorsement or acceptance of such boundaries.
Nothing herein shall constitute or be considered to be a limitation upon or waiver of the privileges and immunities of The World Bank, all of which are specifically reserved.
Rights and Permissions
This work is available under the Creative Commons Attribution 3.0 IGO license (CC BY 3.0 IGO) http://creativecommons.org/licenses/by/3.0/igo. Under the Creative Commons Attribution license, you are free to copy, distribute, transmit, and adapt this work, including for commercial purposes, under the follow-ing conditions:
Attribution—Please cite the work as follows: Calvo-Gonzalez, Oscar, and J. Humberto Lopez. 2015. El Salvador: Building on Strengths for a New Generation. Systematic Country Diagnostic. Washington, DC: World Bank. License: Creative Commons Attribution CC BY 3.0 IGO
Translations—If you create a translation of this work, please add the following disclaimer along with the attribution: This translation was not created by The World Bank and should not be considered an official World Bank translation. The World Bank shall not be liable for any content or error in this translation.
Adaptations—If you create an adaptation of this work, please add the following disclaimer along with the attribution: This is an adaptation of an original work by The World Bank. Views and opinions expressed in the adaptation are the sole responsibility of the author or authors of the adaptation and are not endorsed by The World Bank.
Third-party content—The World Bank does not necessarily own each component of the content contained within the work. The World Bank therefore does not warrant that the use of any third-party-owned individual component or part contained in the work will not infringe on the rights of those third parties. The risk of claims resulting from such infringement rests solely with you. If you wish to re-use a component of the work, it is your responsibility to determine whether permission is needed for that re-use and to obtain permission from the copyright owner. Examples of components can include, but are not limited to, tables, figures, or images.
All queries on rights and licenses should be addressed to the Publishing and Knowledge Division, The World Bank, 1818 H Street NW, Washington, DC 20433, USA; fax: 202-522-2625; e-mail: [email protected].
Cover photo: © World Bank. Further permission required for reuse.Cover design: Florencia Micheltorena.
iii
Contents
Acknowledgments . . . . . . . . . . . . . . . . . . . . . . . . . . . . . . . . . . . . . . . . . . . . . . . . . . . . . . . . . . . . . . . . . ixAbout the Authors . . . . . . . . . . . . . . . . . . . . . . . . . . . . . . . . . . . . . . . . . . . . . . . . . . . . . . . . . . . . . . . . .xiAbbreviations . . . . . . . . . . . . . . . . . . . . . . . . . . . . . . . . . . . . . . . . . . . . . . . . . . . . . . . . . . . . . . . . . . . .xiii
Overview . . . . . . . . . . . . . . . . . . . . . . . . . . . . . . . . . . . . . . . . . . . . . . . . . . . . . . . . . . . . . . . . . . . . . 1
1 . Setting the Stage . . . . . . . . . . . . . . . . . . . . . . . . . . . . . . . . . . . . . . . . . . . . . . . . . . . . . . . . . . . . . 13Trends in Poverty Reduction and Shared Prosperity . . . . . . . . . . . . . . . . . . . . . . . . . . . . . . . . . . 13Drivers of Poverty and Shared Prosperity . . . . . . . . . . . . . . . . . . . . . . . . . . . . . . . . . . . . . . . . . . . 19Key Country Features Affecting Development . . . . . . . . . . . . . . . . . . . . . . . . . . . . . . . . . . . . . . . 24Notes . . . . . . . . . . . . . . . . . . . . . . . . . . . . . . . . . . . . . . . . . . . . . . . . . . . . . . . . . . . . . . . . . . . . . . . . . . 29
2 . Determinants of Economic Growth . . . . . . . . . . . . . . . . . . . . . . . . . . . . . . . . . . . . . . . . . . . . . 31Drivers of Growth . . . . . . . . . . . . . . . . . . . . . . . . . . . . . . . . . . . . . . . . . . . . . . . . . . . . . . . . . . . . . . . 31What Are the Factors that Constrain Growth the Most? . . . . . . . . . . . . . . . . . . . . . . . . . . . . . . . 36Identifying Policy Areas to Increase Growth . . . . . . . . . . . . . . . . . . . . . . . . . . . . . . . . . . . . . . . . . 48Notes . . . . . . . . . . . . . . . . . . . . . . . . . . . . . . . . . . . . . . . . . . . . . . . . . . . . . . . . . . . . . . . . . . . . . . . . . . 49
3 . Analysis of Inclusion . . . . . . . . . . . . . . . . . . . . . . . . . . . . . . . . . . . . . . . . . . . . . . . . . . . . . . . . . . 51Drivers of Inclusion . . . . . . . . . . . . . . . . . . . . . . . . . . . . . . . . . . . . . . . . . . . . . . . . . . . . . . . . . . . . . . 51What Are the Factors that Constrain Inclusion the Most? . . . . . . . . . . . . . . . . . . . . . . . . . . . . . 57Identifying Policy Areas to Boost Inclusion . . . . . . . . . . . . . . . . . . . . . . . . . . . . . . . . . . . . . . . . . 69Notes . . . . . . . . . . . . . . . . . . . . . . . . . . . . . . . . . . . . . . . . . . . . . . . . . . . . . . . . . . . . . . . . . . . . . . . . . . 70
4 . Sustainability Challenges . . . . . . . . . . . . . . . . . . . . . . . . . . . . . . . . . . . . . . . . . . . . . . . . . . . . . . 73Economic Sustainability . . . . . . . . . . . . . . . . . . . . . . . . . . . . . . . . . . . . . . . . . . . . . . . . . . . . . . . . . . 73Environmental Sustainability . . . . . . . . . . . . . . . . . . . . . . . . . . . . . . . . . . . . . . . . . . . . . . . . . . . . . . 77Social Sustainability . . . . . . . . . . . . . . . . . . . . . . . . . . . . . . . . . . . . . . . . . . . . . . . . . . . . . . . . . . . . . . 81Identifying Policy Areas to Buttress Sustainability . . . . . . . . . . . . . . . . . . . . . . . . . . . . . . . . . . . . 84Notes . . . . . . . . . . . . . . . . . . . . . . . . . . . . . . . . . . . . . . . . . . . . . . . . . . . . . . . . . . . . . . . . . . . . . . . . . . 86
5 . Synthesis and Priorities . . . . . . . . . . . . . . . . . . . . . . . . . . . . . . . . . . . . . . . . . . . . . . . . . . . . . . . 87Why Has It Proven So Difficult to Make Progress? . . . . . . . . . . . . . . . . . . . . . . . . . . . . . . . . . . . 87Opportunities: Building on Strengths. . . . . . . . . . . . . . . . . . . . . . . . . . . . . . . . . . . . . . . . . . . . . . . 94Prioritization . . . . . . . . . . . . . . . . . . . . . . . . . . . . . . . . . . . . . . . . . . . . . . . . . . . . . . . . . . . . . . . . . . 104Notes . . . . . . . . . . . . . . . . . . . . . . . . . . . . . . . . . . . . . . . . . . . . . . . . . . . . . . . . . . . . . . . . . . . . . . . . . 110
Appendix A: Poverty and Shared Prosperity: Measurement Issues . . . . . . . . . . . . . . . . . . . . 111
iv Contents
Appendix B: Additional Material . . . . . . . . . . . . . . . . . . . . . . . . . . . . . . . . . . . . . . . . . . . . . . . . 113
Bibliography . . . . . . . . . . . . . . . . . . . . . . . . . . . . . . . . . . . . . . . . . . . . . . . . . . . . . . . . . . . . . . . . . . 121
Boxes O.1 How Would You Want El Salvador To Be in the Future? . . . . . . . . . . . . . . . . . . . . . . . . . . . 11 1.1 Country Context . . . . . . . . . . . . . . . . . . . . . . . . . . . . . . . . . . . . . . . . . . . . . . . . . . . . . . . . . . . . 19 1.2 Benchmarking with Peer Countries . . . . . . . . . . . . . . . . . . . . . . . . . . . . . . . . . . . . . . . . . . . . 22 3.1 Uneven Progress Toward Gender Equality—With Self-Reinforcing Dynamics . . . . . . . 63 5.1 Implications of Remittances: Results from a CGE Model Estimation . . . . . . . . . . . . . . . . 91 5.2 Implications of Lowering Trading Costs: Results from a CGE Model Estimation. . . . . . .96 5.3 The Story of Texas Instruments in El Salvador (And the Almost Complete
Loss of an Export Cluster) . . . . . . . . . . . . . . . . . . . . . . . . . . . . . . . . . . . . . . . . . . . . . . . . . . . . . 99 5.4 Green Shoots—Selected Examples of Firms that Have Thrived . . . . . . . . . . . . . . . . . . . . 101
Figures O.1 Vicious Circle of Low Growth and High Violence . . . . . . . . . . . . . . . . . . . . . . . . . . . . . . . . . 4 O.2 Vicious Circle of Low Growth and High Migration . . . . . . . . . . . . . . . . . . . . . . . . . . . . . . . . 5 O.3 Vicious Circle of Low Growth and Low Savings and Investment . . . . . . . . . . . . . . . . . . . . 6 O.4 Priorities . . . . . . . . . . . . . . . . . . . . . . . . . . . . . . . . . . . . . . . . . . . . . . . . . . . . . . . . . . . . . . . . . . . . 7 1.1 Poverty Reduction Has Been Sluggish . . . . . . . . . . . . . . . . . . . . . . . . . . . . . . . . . . . . . . . . . . 13 1.2 Extreme Poverty (at $1.25/day) Is Below Three Percent of the Population . . . . . . . . . . . 14 1.3 Lower Poverty Reduction than in Other Countries, Especially Since 2008 . . . . . . . . . . . 15 1.4 Extreme Poverty in Rural Areas Has Fallen the Most . . . . . . . . . . . . . . . . . . . . . . . . . . . . . 15 1.5 Poverty Disparity Remains Large across the Territory . . . . . . . . . . . . . . . . . . . . . . . . . . . . 16 1.6 Lagging Behind on Shared Prosperity . . . . . . . . . . . . . . . . . . . . . . . . . . . . . . . . . . . . . . . . . . 16 1.7 The Income of the Bottom 40 Has Grown Faster than the Average in All Areas . . . . . . . 17 1.8 Middle Class Stagnant . . . . . . . . . . . . . . . . . . . . . . . . . . . . . . . . . . . . . . . . . . . . . . . . . . . . . . . 18 1.9 Many Live in Urban Slums, Even Households that Are Not in the Bottom 40 . . . . . . . . 18 1.10 The Labor Market Played A Key Role in Getting People Out of Poverty . . . . . . . . . . . . . 20 1.11 Different Patterns in the Role that Labor Income Played in Rural and Urban Areas . . . . . 21 1.12 Gini Coefficient among Urban, Rural, and National Households . . . . . . . . . . . . . . . . . . . 21 1.13 Gini Coefficient in El Salvador and Comparators, Latest Data Available . . . . . . . . . . . . . 21 1.14 Labor Income Accounts for the Decline in Inequality . . . . . . . . . . . . . . . . . . . . . . . . . . . . . 22 1.15 Per Capita GDP Growth in Comparator Countries Has Been Much Higher . . . . . . . . . . 23 1.16 El Salvador’s Growth Has Been Low for an Extended Period . . . . . . . . . . . . . . . . . . . . . . . 24 1.17 Crime Is among the World’s Highest . . . . . . . . . . . . . . . . . . . . . . . . . . . . . . . . . . . . . . . . . . . 26 1.18 Security Costs Are an Additional Burden that Limits Competitiveness . . . . . . . . . . . . . . 27 1.19 Small Businesses Often Restrict Activity in Fear of Crime . . . . . . . . . . . . . . . . . . . . . . . . . 28 2.1 Low Contribution of Total Factor Productivity to Growth . . . . . . . . . . . . . . . . . . . . . . . . . 31 2.2 A Declining Contribution of Investment . . . . . . . . . . . . . . . . . . . . . . . . . . . . . . . . . . . . . . . . 31
Contents v
2.3 The Rise and Fall of Maquila . . . . . . . . . . . . . . . . . . . . . . . . . . . . . . . . . . . . . . . . . . . . . . . . . . 32 2.4 Underperforming Export Growth . . . . . . . . . . . . . . . . . . . . . . . . . . . . . . . . . . . . . . . . . . . . . 32 2.5 There Are Global Competitors in the Garment Industry with Lower Wage Levels . . . . . 33 2.6 Terms of Trade and Real Effective Exchange Rate . . . . . . . . . . . . . . . . . . . . . . . . . . . . . . . . 34 2.7 Competitiveness Pressures Are Felt More Strongly on Tradables . . . . . . . . . . . . . . . . . . . 34 2.8 Foreign Direct Investment Is Low . . . . . . . . . . . . . . . . . . . . . . . . . . . . . . . . . . . . . . . . . . . . . 35 2.9 Foreign Direct Investment Is Focused on the Tertiary Sector to Serve the
Domestic Market . . . . . . . . . . . . . . . . . . . . . . . . . . . . . . . . . . . . . . . . . . . . . . . . . . . . . . . . . . . . 35 2.10 Energy Costs Are High . . . . . . . . . . . . . . . . . . . . . . . . . . . . . . . . . . . . . . . . . . . . . . . . . . . . . . . 37 2.11 Inefficient Logistics Is a Barrier to Exploit the Proximity to the US . . . . . . . . . . . . . . . . . 37 2.12 It Costs More to Ship a Container from Baltimore to San Salvador than to
Many Asian Destinations . . . . . . . . . . . . . . . . . . . . . . . . . . . . . . . . . . . . . . . . . . . . . . . . . . . . . 38 2.13 Low Investment Is Correlated with High Market Concentration across Countries . . . . . 39 2.14 Fewer Firms Are Created in Countries with High Market Concentration . . . . . . . . . . . . 39 2.15 Stagnant Productivity in Services . . . . . . . . . . . . . . . . . . . . . . . . . . . . . . . . . . . . . . . . . . . . . . 41 2.16 The Salvadoran Parliament Is the Most Polarized in Latin America . . . . . . . . . . . . . . . . . 43 2.17 Salvadoran Society Is Also Polarized, with a Shallow Political Center . . . . . . . . . . . . . . . 45 2.18 Secondary School Completion Is Very Low . . . . . . . . . . . . . . . . . . . . . . . . . . . . . . . . . . . . . 48 3.1 The Income of the Poorest Has Grown Faster than the Rest. . . . . . . . . . . . . . . . . . . . . . . . 51 3.2 Still, the Bottom 40 Account for Only 16 Percent of Total Income . . . . . . . . . . . . . . . . . . 52 3.3 The Growth in Earnings Has Been Faster for the Poor, Rural, and Less Educated . . . . . 53 3.4 Upward Mobility Is Limited across All Sectors of the Economy . . . . . . . . . . . . . . . . . . . . 53 3.5 Unemployment Is More Frequent among the Poor . . . . . . . . . . . . . . . . . . . . . . . . . . . . . . . 54 3.6 Since 2002 Retail & Hospitality and Agriculture Account for Half of
All Jobs Created . . . . . . . . . . . . . . . . . . . . . . . . . . . . . . . . . . . . . . . . . . . . . . . . . . . . . . . . . . . . . 54 3.7 Most Jobs Have Been Created in Low Wage Sectors . . . . . . . . . . . . . . . . . . . . . . . . . . . . . . 55 3.8 Jobs in Retail and Hospitality and Agriculture Are Often Unable to Lift
Workers from Being Chronically Poor. . . . . . . . . . . . . . . . . . . . . . . . . . . . . . . . . . . . . . . . . . 55 3.9 A Higher Share of Richer Households Receive Remittances . . . . . . . . . . . . . . . . . . . . . . . 56 3.10 But Remittances Are a Greater Share of Income for Poorer Households . . . . . . . . . . . . . 56 3.11 Remittances Are Important across the Entire Distribution of Income . . . . . . . . . . . . . . . 56 3.12 Remittances Respond to Labor Market Conditions in the US . . . . . . . . . . . . . . . . . . . . . . 56 3.13 Employment Has Grown Most in Services but Value Added Lagged
(Thus Labor Productivity in Services Has Declined) . . . . . . . . . . . . . . . . . . . . . . . . . . . . . . 57 3.14 Real Salaries Have Been Flat across the Economy for Over a Decade . . . . . . . . . . . . . . . . 58 3.15 School Attainment Has Improved . . . . . . . . . . . . . . . . . . . . . . . . . . . . . . . . . . . . . . . . . . . . . 59 3.16 The Majority of Students Still Drop Out of School Before Completing Secondary . . . . . . 59 3.17 Poor Learning Outcomes . . . . . . . . . . . . . . . . . . . . . . . . . . . . . . . . . . . . . . . . . . . . . . . . . . . . . 60 3.18 Access to Opportunities Is More Unequal than in Other Countries in LAC . . . . . . . . . . 61 3.19 Inequities in Learning Outcomes Start Early in Life . . . . . . . . . . . . . . . . . . . . . . . . . . . . . . 62 3.20 Learning Outcomes in Mathematics Are Average among Countries in LAC . . . . . . . . . 62 3.21 The Potential for a Demographic Dividend . . . . . . . . . . . . . . . . . . . . . . . . . . . . . . . . . . . . . 65
vi Contents
3.22 Under 5 Mortality MDG Achieved . . . . . . . . . . . . . . . . . . . . . . . . . . . . . . . . . . . . . . . . . . . . . 67 3.23 Public Spending in Social Sectors Has Increased . . . . . . . . . . . . . . . . . . . . . . . . . . . . . . . . . 67 3.24 Some Social Programs Are More Targeted than Others . . . . . . . . . . . . . . . . . . . . . . . . . . . 68 3.25 Spending in Social Programs Is Concentrated in the Less Targeted Ones . . . . . . . . . . . . 68 3.26 Financial Inclusion Is Low . . . . . . . . . . . . . . . . . . . . . . . . . . . . . . . . . . . . . . . . . . . . . . . . . . . . 69 4.1 A Small State . . . . . . . . . . . . . . . . . . . . . . . . . . . . . . . . . . . . . . . . . . . . . . . . . . . . . . . . . . . . . . . 73 4.2 Rising Public Debt . . . . . . . . . . . . . . . . . . . . . . . . . . . . . . . . . . . . . . . . . . . . . . . . . . . . . . . . . . 74 4.3 Fiscal Position Compares Unfavorably with Other Countries . . . . . . . . . . . . . . . . . . . . . . 77 4.4 People Increasingly Identify Crime as the Main Problem in the Country . . . . . . . . . . . . 81 4.5 Crime Is Seen as a Bigger Problem in El Salvador than Elsewhere in LAC . . . . . . . . . . . 82 4.6 Poor Housing Creates the Conditions for Crime to Thrive . . . . . . . . . . . . . . . . . . . . . . . . 83 5.1 Vicious Circle of Low Growth and High Violence . . . . . . . . . . . . . . . . . . . . . . . . . . . . . . . . 88 5.2 Vicious Circle of Low Growth and Migration . . . . . . . . . . . . . . . . . . . . . . . . . . . . . . . . . . . . 89 5.3 Children Often Live in Households Where At Least One Parent Has Migrated . . . . . . . 92 5.4 Vicious Circle of Low Growth and Low Savings and Investments . . . . . . . . . . . . . . . . . . . 92 5.5 Higher Manufacturing Base than Other Countries . . . . . . . . . . . . . . . . . . . . . . . . . . . . . . . 98 5.6 Dynamic Export Performance in Selected Manufacturing Sectors . . . . . . . . . . . . . . . . . . 98 B5.3.1 Exports in the Product Space . . . . . . . . . . . . . . . . . . . . . . . . . . . . . . . . . . . . . . . . . . . . . . . . . 99 5.7 In Sectors Such as Plastics There Is Already a Revealed Comparative Advantage . . . . . 101 5.8 Priorities . . . . . . . . . . . . . . . . . . . . . . . . . . . . . . . . . . . . . . . . . . . . . . . . . . . . . . . . . . . . . . . . . . 105 A.1 Income Growth from National Accounts (GNI) and Household Surveys, LAC . . . . . . 112 A.2 Poverty and Growth Rates, Percent . . . . . . . . . . . . . . . . . . . . . . . . . . . . . . . . . . . . . . . . . . . 112 B.1 Volatility and Average Growth in Latin America and the Caribbean
Countries, 2001–13 . . . . . . . . . . . . . . . . . . . . . . . . . . . . . . . . . . . . . . . . . . . . . . . . . . . . . . . . . 113 B.2 Average Real GDP per Capita Growth (2011–13) Compared to Lower
Middle Income Countries . . . . . . . . . . . . . . . . . . . . . . . . . . . . . . . . . . . . . . . . . . . . . . . . . . . 113 B.3 Average Real GDP per Capita Growth (2011–13) Compared to Latin America
and the Caribbean Countries . . . . . . . . . . . . . . . . . . . . . . . . . . . . . . . . . . . . . . . . . . . . . . . . 114 B.4 Value Added by Sector . . . . . . . . . . . . . . . . . . . . . . . . . . . . . . . . . . . . . . . . . . . . . . . . . . . . . . 114 B.5 Employment Added by Sector . . . . . . . . . . . . . . . . . . . . . . . . . . . . . . . . . . . . . . . . . . . . . . . . 114 B.6 Value Added by Sector . . . . . . . . . . . . . . . . . . . . . . . . . . . . . . . . . . . . . . . . . . . . . . . . . . . . . . 115 B.7 Comparison of Tradables and Non-Tradables Sectors (Indices, 1990 = 100) . . . . . . . . 115 B.8 Gross Fixed Public Capital Formation, Percent of GDP, Average 2000–13 . . . . . . . . . . 116 B.9 Gross Fixed Public Capital Formation, Percent of GDP, Average 2000–13 . . . . . . . . . . 116 B.10 OECD Product Market Regulation Indices . . . . . . . . . . . . . . . . . . . . . . . . . . . . . . . . . . . . . 116 B.11 School Enrollment by Age and Gender . . . . . . . . . . . . . . . . . . . . . . . . . . . . . . . . . . . . . . . . 117
Maps 1.1 The Bottom 40 Are Concentrated in Large Urban Areas but Rural Areas
Have a Higher Share of Population among the Bottom 40 . . . . . . . . . . . . . . . . . . . . . . . . . 17 1.2 But There Are Still Large Differences in Human Development across Departments . . . . . . 18

Contents vii
4.1 Precarious Housing Adds to the Vulnerabilities Faced by the Bottom 40 . . . . . . . . . . . . 78 A.1 Growth of Income of the Bottom 40 and Mean Income by Department . . . . . . . . . . . . 112 B.1 Map of El Salvador . . . . . . . . . . . . . . . . . . . . . . . . . . . . . . . . . . . . . . . . . . . . . . . . . . . . . . . . . 119
Tables 1.1 Profile of the Poor . . . . . . . . . . . . . . . . . . . . . . . . . . . . . . . . . . . . . . . . . . . . . . . . . . . . . . . . . . . 14 2.1 Backward Linkages of Different Economic Activities . . . . . . . . . . . . . . . . . . . . . . . . . . . . . 41 2.2 Top Obstacles to Growth (As Reported by Firms) . . . . . . . . . . . . . . . . . . . . . . . . . . . . . . . . 46 2.3 Emerging Focus Areas to Boost Growth . . . . . . . . . . . . . . . . . . . . . . . . . . . . . . . . . . . . . . . . 47 4.1 Selected Economic Indicators, 2008–13 . . . . . . . . . . . . . . . . . . . . . . . . . . . . . . . . . . . . . . . . 75 4.2 Selected Economic Indicators and Forecasts, 2014–19 . . . . . . . . . . . . . . . . . . . . . . . . . . . . 76 A.1 Nominal Value of the Poverty Lines (US Dollars) . . . . . . . . . . . . . . . . . . . . . . . . . . . . . . . 111 B.1 Standard Deviation of GDP Growth and Output Gap . . . . . . . . . . . . . . . . . . . . . . . . . . . . 117 B.2 Selected Social Sector Indicators . . . . . . . . . . . . . . . . . . . . . . . . . . . . . . . . . . . . . . . . . . . . . . 117 B.3 Selected Infrastructure Indicators. . . . . . . . . . . . . . . . . . . . . . . . . . . . . . . . . . . . . . . . . . . . . 118


ix
Acknowledgments
We would like to thank the members of the El Salvador Country Team from all Global Practices and IFC, as well as all the partners and stakeholders in El Salvador, who contrib-uted to the preparation of this Systematic Country Diagnostic (SCD). We are grateful for their inputs, knowledge and advice.
C. Felipe Jaramillo (Director, MDI) provided guidance in the early stages of the preparation of this SCD and Augusto de la Torre (Chief Economist, LCR) chaired the Quality Enhancement Review meeting that provided guidance to the team during the preparation phase. The core team that prepared this report included Theresa Osborne, Kinnon Scott, Liliana Sousa, Elizaveta Perova, Mateo Salazar (GPVDR), Luc Razafimandimby, Matias Antonio (GMFDR), Eduardo Cuevas (Country Head, IFC), Pablo Acosta, Emma Monsalve (GSPDR), Lisa Bhansali, Francesca Recanatini, Samantha Fien-Helfman (GGODR), Ana Campos (GSURR), Klas Sander (GENDR), Jaime Frias (GTCDR), Ayat Soliman (Program Leader), Kathy Lindert (Program Leader), Maria del Camino Hurtado, Mary Rose Parrish, Nayda Avalos, Desiree Gonzalez (LCC2C), and Luis Alvaro Sanchez.
Other members of the Country Team con-tributed inputs and participated in work-shops, including: Frank Sader (IFC), Melissa Adelman, Bob Hawkins (GEDDR), Todd Johnson, Bartley Higgins (GEEDR), Carter Brandon, Sarah Guel (GENDR), Svetlana Edmeades (GFADR), Rekha Reddy (GFMDR), Lourdes Linares, Jorge Luis Silva, Tomas Socias, Maria Guadalupe Toscano (GGODR), Amparo Gordillo (GHNDR), Leonardo Hernandez, Gilles Thirion
(GMFDR), Louise Cord (Practice Manager), Megan Rounseville (GPVDR), Nancy Banegas, (GSPDR), Marcelo Fabre, Augustin Maria, Catalina Marulanda, Victoria Stanley, Andres Villaveces, Bontje Zangerling (GSURR), Marialisa Motta (Practice Manager), Mayra Alfaro, Tania Begazo, Ana Cebreiro, Emiliano Duch, Roberto Echandi, Tanja Goodwin, Martha Licetti, Lucia Villaran (GTCDR), Elene Allende, Elena Gasol, Rocio Sanchez (GTIDR), Robin Rajack, Alma Kanani (LCRDE), Fabrizio Zarcone (Country Manager), Maryanne Sharp, Jania Ibarra, and Angels Maso (LCC2C). Rolf Parta facilitated the prioritiza-tion workshop. Inputs were also received from Maros Ivanic (DECAR), Faya Hayati, Calvin Djiofack (GMFDR), Guillermo Beylis (LCRCE), Andrea Kucey (BPSSP), Jaime de Pinies, and Pablo Rodas.
The team would like to thank the peer re-viewers, Alberto Leyton, Ambar Narayan, and David Rosenblatt, for their comments. Thanks are also owed to colleagues with whom the team was able to discuss the SCD instrument, including members of the SCD Advisory Working Group, Sudarshan Canagarajah, Daniel Lederman, and Trang Van Nguyen. We thank other teams preparing SCDs for useful exchanges, in particular Fritzi Koehler, Kinnon Scott, Susana Sanchez, Ana Maria Oviedo, Marco Hernandez, Raju Singh, Barbara Cunha, Samuel Freije, and Gallina Andronova Vincelette. Thanks also to Uma Ramakrishnan (IMF) for comments and to Jeff Tanner and Zaks Lubin for sharing their experience pre-paring the Constraints Analysis while at the Millennium Challenge Corporation.


About the Authors
Oscar Calvo-Gonzalez is Practice Manager in the Poverty Global Practice of the World Bank and was previously Program Leader in the Central America Department where he led lending operations and analytical work on diverse economic policy issues. Before working on Central America he was coun-try economist for Peru and a member of the country economic teams for Bolivia, Azerbaijan, and Turkey. Prior to joining the World Bank in 2006 he worked as a Principal Economist at the European Central Bank. He holds a PhD from the London School of Economics and has published articles in ref-ereed journals and edited books on wide- ranging issues such as decentralization and public expenditure, dollarization, financial stability, the EU budget, Spanish economic history, and foreign aid conditionality.
J . Humberto Lopez is the Director of the Central America Department of the World Bank’s Latin American Region with responsi-bility for the Bank’s portfolio, lending, strat-egy, and dialogue for Guatemala, El Salvador,
Honduras, Nicaragua, Costa Rica, and Panama. During his years in the World Bank, he has occupied positions of significant re-sponsibility including Director for Economic Policy and Poverty Reduction of the Latin American region; Deputy Chief of Staff of the World Bank Group during the first year of President Jim Yong Kim, and Manager for Economic Policy and Poverty Reduction East Africa. Humberto has an extensive publica-tion record in diverse areas such as fiscal policy, optimal currency areas and real ex-change rate misalignment, armed conflict and development, and pro-poor growth. He has also been the editor of three books on Free Trade Agreements, Remittances and Development, and the Latin American Investment Climate, and was the lead author of the World Bank 2006 Latin American Flagship on growth and poverty reduction. Before joining the World Bank permanently, Humberto was a Professor of Economics at the University of Salamanca (Spain) and a Visiting Professor at Louisiana State University, Baton Rouge (US).
xi


xiii
Abbreviations
ARENA Alianza Republicana Nacional (National Republican Alliance)ATM Automated Teller MachineCAPRA Central America Probabilistic Risk AssessmentCEDAW Convention on the Elimination of All Forms of Discrimination against WomenCEMLA Centro de Estudios Monetarios Latinoamericanos (Latin American Monetary
Studies Center)CEPAL Comisión Económica para América Latina (ECLAC in English)CGE Computable General EquilibriumDIGESTYC Dirección General de Estadísticas y Censos (General Directorate for Statistics and
Censuses)ECLAC Economic Commission for Latin America and the Caribbean (CEPAL in
Spanish)EHPM Encuesta de Hogares de Propósitos MúltiplesFDI Foreign Direct InvestmentFMLN Frente Farabundo Martí de Liberación Nacional (National Liberation Front
Farabundo Martí)GDP Gross Domestic ProductGMM General Method of MomentsGoES Government of El SalvadorGTAP Global Trade Analysis ProjectILO International Labor OrganizationIMF International Monetary FundIT Information technologyIUDOP Instituto Universitario de Opinión Pública (Public Opinion University Institute)LAC Latin America and the CaribbeanLAPOP Latin America Public Opinion PollMDG Millennium Development GoalMAPAS Monitoreo de los Avances de País en Agua Potable y Saneamiento (Monitoring of
Country Progress in Drinking Water and Sanitation)SCD Systematic Country DiagnosticSERCE Second Regional Comparative and ExplanatorySIEPAC Sistema de Interconexión Eléctrica de los Países de América Central (Electricity
Interconnection System for the Countries of Central America)SME Small and medium enterprisePPP Public Partnership ProgramTIMSS Trends in International Mathematics and Science StudyUN United NationsUNESCO United Nations Educational, Scientific and Cultural Organization

xiv Abbreviations
UNDP United Nations Development ProgramUNFPA United Nations Population FundUNISDR United Nations International Strategy for Disaster ReductionUNODC United Nations Office of Drug and CrimeUS United Sates of AmericaUSAID United States Agency for International DevelopmentUSG United States GovernmentVAT Value Added TaxWHO World Health Organization
Overview 1
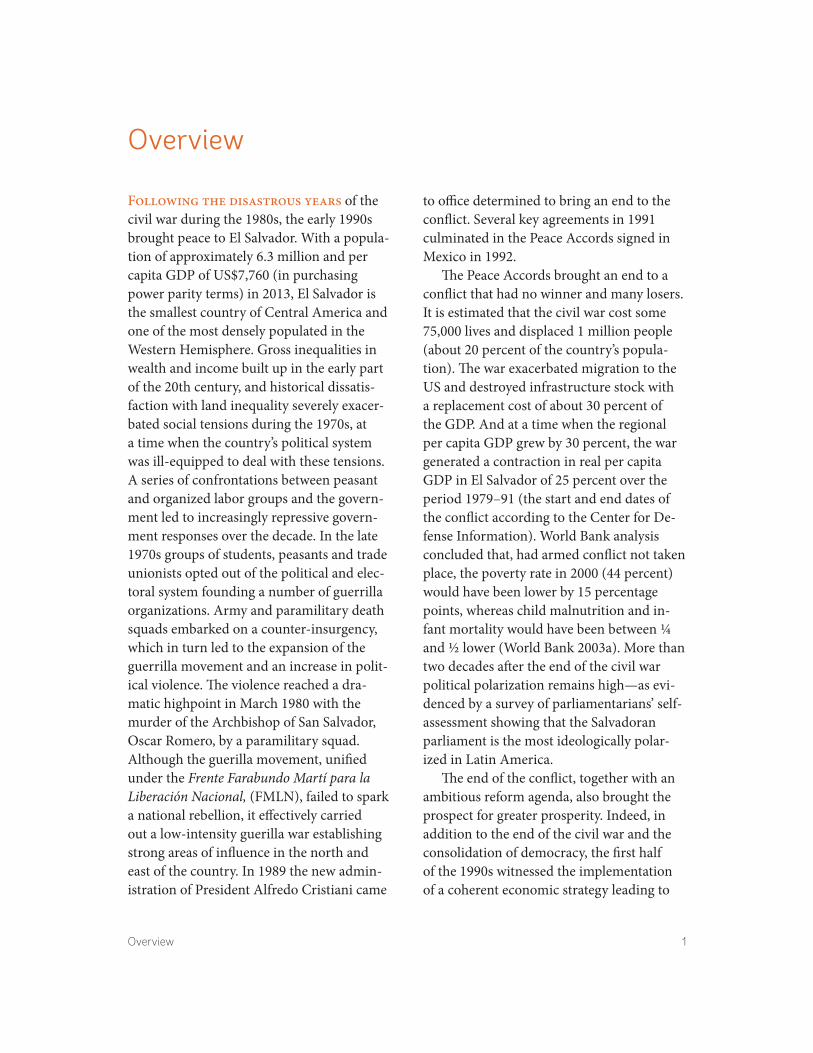
Following the disastrous years of the civil war during the 1980s, the early 1990s brought peace to El Salvador. With a popula-tion of approximately 6.3 million and per capita GDP of US$7,760 (in purchasing power parity terms) in 2013, El Salvador is the smallest country of Central America and one of the most densely populated in the Western Hemisphere. Gross inequalities in wealth and income built up in the early part of the 20th century, and historical dissatis-faction with land inequality severely exacer-bated social tensions during the 1970s, at a time when the country’s political system was ill-equipped to deal with these tensions. A series of confrontations between peasant and organized labor groups and the govern-ment led to increasingly repressive govern-ment responses over the decade. In the late 1970s groups of students, peasants and trade unionists opted out of the political and elec-toral system founding a number of guerrilla organizations. Army and paramilitary death squads embarked on a counter-insurgency, which in turn led to the expansion of the guerrilla movement and an increase in polit-ical violence. The violence reached a dra-matic highpoint in March 1980 with the murder of the Archbishop of San Salvador, Oscar Romero, by a paramilitary squad. Although the guerilla movement, unified under the Frente Farabundo Martí para la Liberación Nacional, (FMLN), failed to spark a national rebellion, it effectively carried out a low-intensity guerilla war establishing strong areas of influence in the north and east of the country. In 1989 the new admin-istration of President Alfredo Cristiani came
to office determined to bring an end to the conflict. Several key agreements in 1991 culminated in the Peace Accords signed in Mexico in 1992.
The Peace Accords brought an end to a conflict that had no winner and many losers. It is estimated that the civil war cost some 75,000 lives and displaced 1 million people (about 20 percent of the country’s popula-tion). The war exacerbated migration to the US and destroyed infrastructure stock with a replacement cost of about 30 percent of the GDP. And at a time when the regional per capita GDP grew by 30 percent, the war generated a contraction in real per capita GDP in El Salvador of 25 percent over the period 1979–91 (the start and end dates of the conflict according to the Center for De-fense Information). World Bank analysis concluded that, had armed conflict not taken place, the poverty rate in 2000 (44 percent) would have been lower by 15 percentage points, whereas child malnutrition and in-fant mortality would have been between ¼ and ½ lower (World Bank 2003a). More than two decades after the end of the civil war political polarization remains high—as evi-denced by a survey of parliamentarians’ self- assessment showing that the Salvadoran parliament is the most ideologically polar-ized in Latin America.
The end of the conflict, together with an ambitious reform agenda, also brought the prospect for greater prosperity. Indeed, in addition to the end of the civil war and the consolidation of democracy, the first half of the 1990s witnessed the implementation of a coherent economic strategy leading to
Overview
2 Overview
the stabilization of the economy and the reactivation of growth. Structural reforms implemented at the time included trade lib-eralization, financial sector strengthening, re-privatization of the financial sector and other state enterprises, comprehensive tax reform, pension reform, and improvements in the competitiveness environment for pri-vate investment. Per capita GDP, which had declined by an average of about 3 percent per year over the 1980s grew by almost 4 percent per year over 1990–95, and poverty which in 1991 was above 60 percent was cut to less than 50 percent in 1995. Indeed, the World Bank’s Country Economic Memorandum of 1995 argued that “Stabilization and adjust-ment measures implemented since 1989 and the return to peace have laid the foundations for sustained growth in El Salvador.”
However, by the late 1990s the economy slowed down noticeably and started to fall behind comparator countries in a process that has extended to the present day. Despite the reforms undertaken to modernize the country faster growth did not materialize after 1995. In fact, growth slowed down; the average growth rate over 1996–2001 was less than 1 percent. Within the Latin American context, the Salvadoran growth slowdown was also significant. Median Latin American growth also fell but the deceleration was not of a comparable magnitude. Since 2000, real annual per capita GDP growth has averaged 1.5 percent, well below the growth rates ob-served in lower middle income countries (2.5 percent) or in a set of peer countries that share similar structural characteristics as El Salvador (3.9 percent). Moreover, economic mobility is limited and the country’s mid-dle class has not grown as it has in much of Latin America over the last decade. This dis-appointing performance has contributed to a
continued flow of migrants out of the coun-try in search for better opportunities and today about 2 million people of Salvadoran origin live in the U.S.
In terms of development, low growth stands out as the dominant feature. Out of 72 countries for which roughly comparable data on household income is available, only five countries had a lower growth of mean income than El Salvador since 2000. Not only has economic growth been low, but the trend since 2000 has been downward. In ad-dition, the 2008 crisis hit the country hard given its heavy dependence on the US for remittances and exports; and recovery has been slow. In fact, in the period 2011–13 the economy grew at 1.9 percent annually, well below the LAC average (3.7 percent) and the middle income average (4.5 percent).
Although inequality has declined, slow growth has limited progress on poverty re-duction. The income of the bottom 40 per-cent of the population has been increasing at a faster rate than the income of the overall population and income inequality, as mea-sured by the Gini index, has declined (from 0.49 in 2004 to 0.44 in 2012). However, pov-erty reduction has been sluggish. This is hardly a surprise given the low growth rates and the empirical finding that growth is the driver of almost three-quarters of the changes in poverty in the country. In turn, this ex-plains why poverty levels in 2012 are only slightly below those of 2000 (41 and 44 per-cent respectively) and why poverty reduction stands below its peers in Latin America and the Caribbean and among lower middle in-come countries. Labor income has driven poverty reduction, followed at a distance by remittances, but the contribution of labor in-come has been constrained by the low and declining economic growth.

Overview 3
El Salvador’s predicament has been widely studied and our findings are largely consistent with the existing literature on the country’s drivers of growth, inclusion, and sustainability.
Low investment and low productivity growth are the most cited causes of the growth performance of the country. The analysis in this report confirms the central-ity of these two factors. Over the last two decades the growth slowdown can be mainly attributed to decreasing contributions of both capital and total factor productivity. At around 15 percent of GDP investment is among the lowest of in the world for its in-come group and total factor productivity growth over the past twenty years has been below 0.2 percent per year. But what is be-hind these factors? From a macroeconomic perspective, the most recent growth diag-nostics analysis undertaken jointly by the El Salvador and the US governments concludes that there are two binding constraints to growth: security/crime and low productivity of the tradables sector. But many other fac-tors have been put forward as additional ex-planations for the stagnation of the Salvadoran economy. Unfavorable terms of trade, natu-ral disasters, and slow labor accumulation are also factors often discussed in the litera-ture. Reflecting on the heavy reliance on re-mittances coupled with the high share of consumption in GDP has led some practi-tioners to label the Salvadoran economic development model as one of promoting the import of consumer goods and the export of labor.
Other studies have focused on the low re-turns to productive investment. Drivers of the low formal enterprise profitability include high wages for the given level of skills, the costs of protecting against crime, high costs
of services like electricity and transport, and insufficient learning of better technologies and business practices. Given these competi-tiveness pressures the tradable sector has been stagnant. The fastest growing sector has been services, whose productivity has been decreasing, constraining the growth of workers’ earnings and hence inclusion. At the level of the enterprises, a high degree of concentration in industry and limited entry for the production of non-traded goods especially is also having a negative impact on the adoption of new technologies, ham-pering within-firm-productivity growth. The ability of the government to foster competition is weak and the perception of corruption is high. Uncertainty about the appropriation of gains is arguably another factor that drives the low investment. This uncertainty stems in part from mistrust in the political arena.
More recently studies have stressed the negative impact of crime and violence. The economic cost of this violence is very high, 11 percent of GDP annually including ma-terial losses, public and private security and health costs. An analysis of constraints using the growth diagnostics methodology was undertaken by the US and Salvadoran Governments as part of their Partnership for Growth (USG-GoES 2011). This updated growth diagnostics concludes that lack of se-curity is one of binding constraints to growth together with low productivity of the trad-ables sector.
Underlying these challenges is a political sphere plagued by mistrust and highly po-larized, acting as a bottleneck to structural change. El Salvador has at times been slow to respond to rising challenges with the con-sequence that they escalate into major con-straints over time. The pervasive political

4 Overview
mistrust—a legacy of the recent political history—partly explains the delayed or lin-gering responses. For example, the policy response after the 2008 global crisis rightly focused on fiscal reform and consolidation with some success in mobilizing resources but limited gains in reigning in untargeted subsidies. The fiscal challenge remains today. The political polarization and mistrust ap-pear to prevent agreement across the board on critical national priorities. The country for example has been slow to respond to the threats to its industry and exports from Asian competitors. The rising threat from crime and violence, while widely acknowl-edged as extremely damaging across the board, has not coalesce countervailing forces to keep the threat at bay.
These elements described above are also identified in this report as important bottle-necks. This report, however, goes a step beyond and argues that escaping from the apparent low growth equilibrium will be complex because the identified bottlenecks reinforce each other. In particular, this SCD identifies three inter-connected vicious cir-cles that hamper growth and shared prosper-ity: (a) the cycle of low growth and violence; (b) the cycle of low growth and migration; and (c) the cycle of low growth, savings and investment.
First, there is a vicious circle between low economic growth and violence (see figure O.1). Low growth limits the income and the opportunities of the population, therefore creating incentives for some individuals to join a gang or narco group which may offer significant short term earning opportunities (particularly in countries where impunity levels are high and the gangs have a strong and widespread presence in the country). In turn, high levels of violence (El Salvador is
one of the three Central American countries where the homicide rate is at the top of global rankings) have a significant negative impact on the investment climate (security costs in El Salvador represent about 3.5 percent of firms annual sales, and these is increasing ev-idence that crime and extortions are prompt-ing firms to exit the market place altogether). The higher risks and costs of insecurity deter investment and reduce firm profitability, re-sulting in lower productivity growth—which in turn hampers overall economic growth in a self-reinforcing negative cycle.
The second is the vicious circle between low growth and high remittances (see figure O.2). The interaction of low growth and vio-lence pushes many Salvadorans to migrate in search of better opportunities, often follow-ing relatives who previously migrated for similar reasons. Two million Salvadorans al-ready live in the U.S. and provide a strong pull factor for further migration. A large real wage gap keeps attracting migrants to the U.S., with Salvadoran migrant families in the
FigurE O.1 Vicious Circle of Low growth and High Violence
Low economicgrowth
Lack ofopportunities
Violence
Lowinvestment
Perceptionof instability
Highsecurity
costs
Lowproductivity
growth
Low firmprofitability
Policy lever:violence
prevention& law
enforcement

Overview 5
U.S. averaging about five times more in per capita income than their counterparts back home. Violence is another “push” factor for migration, with a strong correlation between victimization and intentions to migrate. The migration flows from El Salvador to the U.S. have been accompanied by large remittance flows, amounting to 16 percent of GDP in 2012. These remittances have in all likeli-hood contributed to a better standard of living in the country, and macroeconomic stability. But the outcome of migration re-mittances also results in complex dynamics. Increases in capital inflows associated with migrant remittances lead to an increase in consumer demand. In turn, as households see their incomes rise, reservation wages in-crease and labor supply falls. Remittances sent by Salvadoran migrants have been found to reduce both the labor participation rates (by about 10 percentage points) and the number of hours worked (between 5 and 12 hours per week) by those at the receiving end due to the income effect generated by
remittances. And remittances have also been found to lead to real exchange rate apprecia-tion. These effects would have contributed to lower the competitiveness of the economy, limiting the ability of Salvadoran firms to compete in low value added tradable sectors. At the same time low education outcomes (a constant in Central American countries) also prevent the country from moving fast to high value added tradable sectors rely-ing on the skills of the labor force to offset the above-described Dutch disease forces. Higher wages and lower skills and labor force participation, plus real exchange rate appreciation associated with higher capital inflows from remittances, combine to reduce El Salvador’s competitiveness—and ulti-mately, growth.
A third vicious circle involves the self- reinforcing dynamics of low growth, savings and investment (see Figure O.3). Remit-tances have the potential to smooth con-sumption. And yet, there is little evidence that remittances in the country have been used as insurance. Indeed, there is evidence indicating that in El Salvador the propensity to save out of the remittances income is lower than the corresponding savings rate from non-remittance income (2 to 4 per-centage points depending on whether the comparison is done controlling for house-hold characteristics). This contributes to a lower aggregate saving rate in a country that already stands out as having a particularly low savings ratio (11 percent of GDP), and to a lower aggregate investment rate, and ul-timately lower economic growth. Although service providers are widely used to channel remittances, regular use of accounts in finan-cial institutions by households and MSMEs is much more limited. Only 6 percent of the bottom 40 percent have an account with
FigurE O.2 Vicious Circle of Low growth and High Migration
Violence
Higherwages &
lower laborforce
participation
MigrationRemittances
Lower competitiveness
Inadequateskills due to
pooreducationalattainment
Policy lever:improving
education andskills to
compete
Loweconomic
growth

6 Overview
formal financial institutions. Lack of finan-cial access limits the capacity of the financial sector to intermediate between savers and investors. Low savings contribute to low ag-gregate investment, which is also constrained by high energy and logistics costs. In turn, low investment hampers economic growth.
Thus, the reasons behind the low growth are reinforced by the low growth itself once the effects of migration and remittances are taken into account. While admittedly it is difficult to quantitatively assess the weight of each of these forces, it is nevertheless critical to take them into account for prioritization purposes.
Building on strengthsOn a more positive note, El Salvador pos-sesses a number of opportunities that could provide a basis to propel the country to a higher growth path. El Salvador has not made an effective use of its opportunities. The cur-rent forecast is for the country to grow at
around 2 percent over the medium term. The authorities envisage a higher growth path, an-chored on reforms to make a fuller use of the opportunities available. Areas of opportunity include migration, geographic and cultural proximity to large export markets, and a still relatively large manufacturing base.
First, make more of the opportunities that migration affords. Missing in El Salvador, at least in part, are some of the ingredients as-sociated with the positive impact of a dias-pora on development. These include migrants returning to retire at home and prepare to do so by investing, skilled migrants returning home bringing back skills (including entre-preneurship), the diaspora providing a net-work for selling goods abroad, the diaspora strengthening the demand for governance, and remittances encouraging increased fi-nancial literacy and savings.
Second, a strategic location that places the country well as an investment destina-tion. El Salvador is strategically located close to the U.S. and has the basic infrastructure in place, in some cases highly competitive like in air transportation. In addition to the geo-graphic location and connectivity, the coun-try is connected through its diaspora abroad, which has a direct experience of the foreign markets and serves as a valuable entry point. This knowledge and understanding of selected markets and cultures abroad is a potentially solid point of comparative advantage, vis-à-vis potential competitors.
Third, an industrial base that can support an expansion of the tradable sector. At 20 percent of GDP the manufacturing sector is large by LAC and by middle-income coun-try standards. Although maquila stills plays an important role, there are segments of the industry with skills in applying sophisticated technologies and connecting with the global
FigurE O.3 Vicious Circle of Low growth and Low Savings and investment
Consumption (especiallyimports)
Remittances
Low investment
Low economic
growth
Migration
Violence Policy levers:Improving productive
services and increasing financial inclusionLow
savings

Overview 7
economy. These advanced activities have emerged and survived despite the adverse conditions. Around them networks of sup-pliers and skills development have developed that provide effective examples that under the right conditions can be scaled up or rep-licated in other activities.
Priorities—the need for a “big push”Breaking the vicious circles identified will require a “big push.” Marginal interventions are unlikely to help break the self-reinforcing dynamics that have kept El Salvador trapped in a vicious circle that links low economic
growth, high migration, and high violence. Given the numerous challenges faced by the country a mechanical approach to identify priorities would miss important nuances and result in a simplistic list of priorities. In practice, the approach followed to identify priorities took into account three key consid-erations. First, given the existence of self- reinforcing dynamics, entry points that could help break those vicious circles were identified as priorities. Second, areas where improvement may be a sine qua non condi-tion for progress were also identified as pri-orities. Third, consideration was given to issues that would complement progress in different areas.
FigurE O.4 Priorities
Sustainable improvements also require prioritizing: • Strengthening of the fiscal position to safeguard fiscal sustainability• Forging political consensus to build a more transparent and effective state• Improving the resilience of the country to natural disasters
Priority:Strengthening violence
prevention and law enforcement
Priority:Improving
education andskills to compete
Increased economic growth
Higher savingsand investment
Lowerviolence
Increased opportunitiesand competitiveness
Breaking the vicious circles
Priority:Improving productive
services and increasingfinancial inclusion

8 Overview
Priority areas to break the vicious circles include:
(i) Strengthening violence prevention and law enforcement;
(ii) Improving education and skills to com-pete; and,
(iii) Improving productive services and in-creasing financial inclusion.
The importance of strengthening violence prevention and law enforcement derives from the high social and economic costs imposed by crime and violence. The homicide rates in El Salvador since 2000 have been among the top 5 countries in the word; at 30 per 100,000 the homicide rate is five times the world aver-age and had reached a peak of 60 homicides per 100,000 before a truce between gangs (maras) was agreed to in March 2012. The widespread availability of small firearms facili-tated the expansion of violence. The maras, created among the Salvadoran migrant com-munities in the US, have further fueled vio-lence as their members returned to El Salvador (either voluntarily or deported) and intro-duced to the country a criminal enterprise that lured the youth by providing a sense of iden-tity. Today the maras count their members in the tens of thousands. This environment has been welcoming to drug trafficking. In addi-tion to paying for private security costs, which are among the highest in the world, there is increasing evidence that fear of crime, and in particular extortions, prompts some busi-nesses to exit from the marketplace altogether.
Improving education and skills would positively impact growth, inclusion, and sus-tainability. Higher learning outcomes, even at the current levels of attendance, would better equip the youth for the acquisition of skills necessary in the domestic market or in the markets where people migrate. A more
educated and skilled population in the do-mestic market would alleviate the relatively high costs of labor. For migrants, it will rep-resent better opportunities abroad, and possi-bly higher remittances into the country. Moreover, the country may follow an active policy of training migrants focused on skills that facilitate entry into selected labor mar-kets abroad. It is also likely that improved ed-ucational outcomes contribute to the higher retention rates at the secondary level. Educa-tion is a key building block for other priori-ties, in particular reducing crime and violence.
Improving productive services would help improve competitiveness, which is cur-rently negatively impacted by expensive pro-ductive services, including electricity and logistics. The supply mix of electricity has been shifting to non-renewable sources, thus increasing costs. The energy sector is highly privatized but there are concerns about how to induce the entry of the private sector into competitive activities—gas, solar, etc. In ad-dition, in view of the high cost of generation and the dominance of thermal power, energy efficiency would bring important cost, envi-ronmental, and fiscal benefits. In road trans-portation, the constraint is not so much the physical infrastructure but high costs arising from a concentration in the provision of ser-vices. The prospects today are for further in-creases in the prices for productive services.
Increasing financial inclusion could help increase the development impact of remit-tances by raising savings and investments. The financial sector is sound but financial in-clusion is low; the bulk of the remittances are transferred outside the banking sector. This results in an incentive to consume given the limited rates of saving and investment. The low level of savings means that the economy

Overview 9
can accommodate only a low level of invest-ment as FDI inflows are relatively small.
But sustainable progress will also require prioritizing:
• Strengthening of the fiscal position to safeguard fiscal sustainability
• Forging political consensus to build a more transparent and effective state
• Improving the resilience of the country to natural disasters
Strengthening the fiscal position is a pre-requisite for further progress. Fiscal deficits and slower economic growth since the global crisis have increased public debt. Public debt relative to GDP went from 40 percent in 2008 to 58 percent in 2013. There are no immediate concerns about debt sustainability, but contin-uing the growth and fiscal trends of the recent past would increase the debt to GDP ratio up to 70 percent in 2019. So stabilizing debt lev-els will require fiscal adjustment between 1.5 percent and 3.5 percent of GDP depending of the target level for the public debt. The most significant fiscal issue now are the manage-ment of the pension debt issued as the coun-try transitioned from a defined contribution system and improving the targeting of subsi-dies in electricity, gas, water and transport. The current environment of low oil prices may provide an opportunity to address subsidy reform. A higher rate of economic growth would alleviate the fiscal difficulties, finance priority expenditures and investments, and boost the income of the bottom 40. At the same time, there is scope for mobilizing addi-tional tax revenues—which at around 15 percent of GDP remain comparatively low.
Forging political consensus to build a more transparent and effective state will help across a number of areas. A weak state has been unable to contain and reduce the
impact of crime and violence. Impunity pre-vails as the criminal conviction rate is less than 5 percent. Police and judiciary are widely perceived as corrupt and the Supreme Court has the lowest level of citizen confi-dence among major public institutions. Pri-vate security expanded to fill the vacuum; Enterprise Surveys suggest that firms spend 3.4 percent of sales in protection, amongst the highest percentages in the world. The quality of public institutions has remained stagnant, which has not helped to build trust among the citizenry. In addition, the diffi-culty of the state in providing security has exacerbated a lack of trust by the citizens in public institutions. The weakness of the state shows also in its limited capacity to mobi-lize internal revenues and spend them effectively.
Finally, improving the resilience of the country to natural disasters will help ensure the sustainability of progress in the above areas. El Salvador is also one of the countries in the world that is most affected by weath-er-related events and other natural hazards. Combined, El Salvador incurs annual losses of around 2.5 percent of GDP due to natural disasters. These losses add to fiscal pressures and constrain wealth accumulation. Climate change is expected to increase the frequency and severity of the weather-related events.
ProcessConsultations with stakeholders helped to inform this SCD. This SCD has drawn on ex-isting material, new analyses commissioned for this SCD (such as a Computable General Equilibrium model), and, crucially, on a set of consultations with a broad range of experts and stakeholders in El Salvador. Throughout the consultations there was a broad consen-sus on the diagnosis of the challenges faced
10 Overview
by El Salvador. Above all, there was a wide recognition of the importance that migration plays in the country. In addition, the themes of political polarization, violence, and institu-tional quality and capacity were also broadly identified as the ultimate causes for the stag-nation that has affected El Salvador. Consul-tations proved also very useful in identifying some of the opportunities and strengths on which the country can build on, such as an already diverse manufacturing sector. The fact that this SCD was being prepared simul-taneously as the Government’s Five-Year Development Plan provided ample opportu-nities for cross-fertilization.
Knowledge gapsAlthough there are many analyses of the na-ture and causes of El Salvador’s stagnation this SCD identifies some knowledge gaps in the existing analyses. In identifying knowl-edge gaps the SCD focused on areas where new information could help inform specific actions in the priority areas. A number of concrete knowledge gaps were identified: (a) What is the impact of frequent natural disasters on the more vulnerable? (b) How do we explain the paradox of a widespread perception of corruption with low bribe pay-ments? (c) To what extent is high crime the
result of limited opportunities and how does it affect shared prosperity? (d) How does limited domestic competition affect shared prosperity? (e) Why is the rate of female labor force participation low? and, (f) Why so many students drop out of school?
This SCD is structured as follows: A first chapter sets the stage by reviewing trends in poverty reduction and shared prosperity and providing a first approximation at the drivers of these trends. This introductory chapter also presents some key country features. The following three chapters provide analyses of the main factors affecting growth, inclusion, and sustainability. These three chapters de-scribe in greater detail the nature of the chal-lenges, dig deeper into exploring the causes behind, and identify policy areas that could be critical for boosting growth and inclusion and ensuring sustainability. The fifth and final chapter provides three related but dis-tinct contributions. First, it provides a syn-thesis of the analysis under the three previous chapters. Second, it provides a discussion of potential entry points for policy action, re-flecting also on what are some the existing strengths in the country. And, third, it con-cludes with a discussion of the priorities to boost shared prosperity, including a discus-sion of why they were identified as priorities as well as a discussion of potential actions.

Overview 11
BOX O.1 How Would You Want El Salvador To Be in the Future?
Throughout the preparation of this SCD the team often wondered about the hopes and aspirations of the new generation of Salvadorans. This helped us to keep in mind the for-ward-looking nature of this work. In this spirit, the World Bank’s Country Office asked fifth grade students in schools across El Salvador to picture how they would like their country to be in the future. One of the most common themes in the drawings was the wish for a future without violence.

Setting the Stage 13
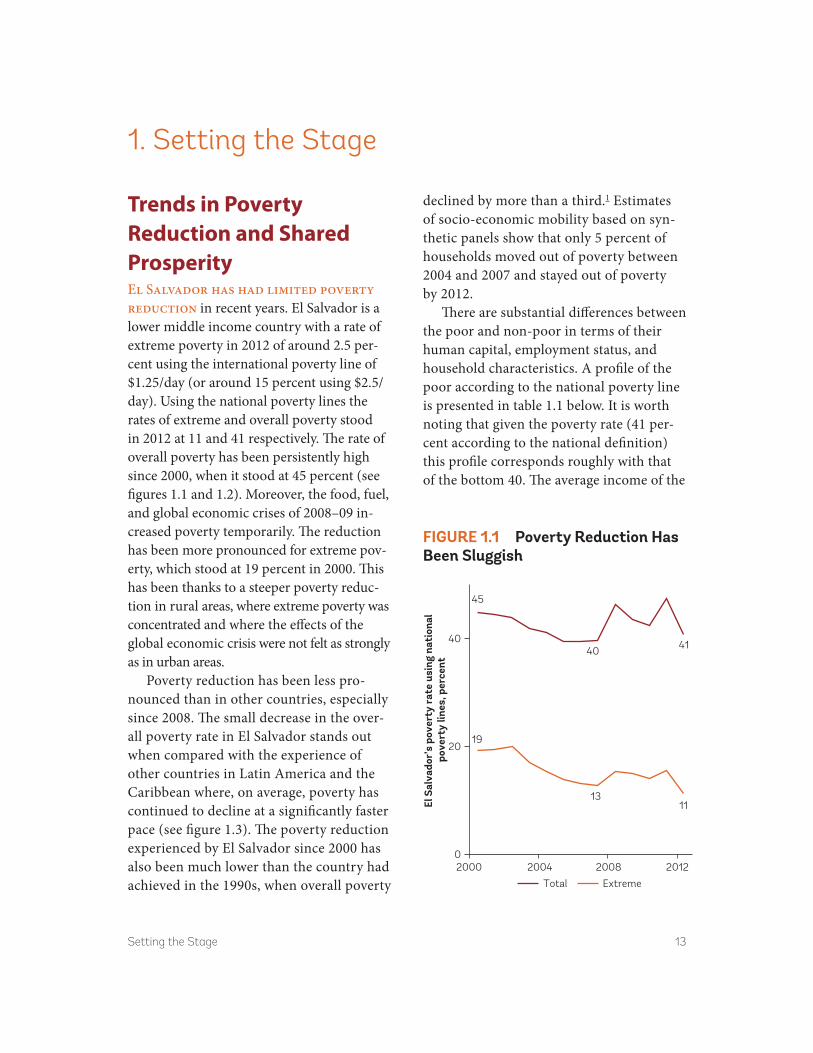
Trends in Poverty Reduction and Shared ProsperityEl Salvador has had limited poverty reduction in recent years. El Salvador is a lower middle income country with a rate of extreme poverty in 2012 of around 2.5 per-cent using the international poverty line of $1.25/day (or around 15 percent using $2.5/day). Using the national poverty lines the rates of extreme and overall poverty stood in 2012 at 11 and 41 respectively. The rate of overall poverty has been persistently high since 2000, when it stood at 45 percent (see figures 1.1 and 1.2). Moreover, the food, fuel, and global economic crises of 2008–09 in-creased poverty temporarily. The reduction has been more pronounced for extreme pov-erty, which stood at 19 percent in 2000. This has been thanks to a steeper poverty reduc-tion in rural areas, where extreme poverty was concentrated and where the effects of the global economic crisis were not felt as strongly as in urban areas.
Poverty reduction has been less pro-nounced than in other countries, especially since 2008. The small decrease in the over-all poverty rate in El Salvador stands out when compared with the experience of other countries in Latin America and the Caribbean where, on average, poverty has continued to decline at a significantly faster pace (see figure 1.3). The poverty reduction experienced by El Salvador since 2000 has also been much lower than the country had achieved in the 1990s, when overall poverty
declined by more than a third.1 Estimates of socio- economic mobility based on syn-thetic panels show that only 5 percent of households moved out of poverty between 2004 and 2007 and stayed out of poverty by 2012.
There are substantial differences between the poor and non-poor in terms of their human capital, employment status, and household characteristics. A profile of the poor according to the national poverty line is presented in table 1.1 below. It is worth noting that given the poverty rate (41 per-cent according to the national definition) this profile corresponds roughly with that of the bottom 40. The average income of the
1. Setting the Stage
FigurE 1.1 Poverty reduction Has Been Sluggish
El S
alva
dor’
s po
vert
y ra
te u
sing
nat
iona
l po
vert
y lin
es, p
erce
nt
45
40 41
19
1311
0
20
40
2000 2004 2008 2012
Total Extreme

14 Setting the Stage
non-poor is close to four times that of the poor. On average, a person living in poverty has three years less schooling than a non- poor person. The household composition is also noticeably different, with the share of children under 12 years old being around 12 percentage points higher among poor households than non-poor households. The poor are ten percentage points more likely to be self-employed and twice as likely to be an unpaid family worker as the non-poor. Women living in poverty are less likely to be economically active than their non-poor counterparts, showing a 20 percentage points gap in labor force participation, but there is no evidence that female headed households are more likely to be poor. While, as noted in figure 1.4 above, poverty rates in urban areas are lower than in rural areas, the number of urban poor is slightly
FigurE 1.2 Extreme Poverty (at $1.25/day) is Below Three Percent of the Population
Source: World Bank staff based on Encuesta de Hogares de Propósitos Múltiples (EHPM).
Poverty rate using internationallines, percent
42
3635
8
2.9 2.5
20
40
02004 2008 2012
$4/day $2.5/day $1.25/day
TaBLE 1.1 Profile of the Poor(2012, National Definition)
Non-poor Poor Non-poor Poor
Household characteristics Labor force (%)
Age of head 49.2 47.6 Employee 63.8 46.2
Female-headed, percent 35.9 33.8 Employer 4.6 1.8
Per capita daily incomea 11.3 3.1 Self-employed 23.4 34.4
Yrs. of education of head 7.5 4.3 Unpaid worker 6.6 13.1
Household size 3.4 4.5 Women active (aged 25–65) 57.8 37.8
Live in urban area (%) 70.4 57.1 Men active (aged 25–65) 82.3 82.8
Proportion age 0–12 (%) 15.5 27.2
Proportion age 13–18 (%) 10.6 14.2 Employment sector (%)
Proportion age 19–70 (%) 65.8 51.9 Construction 5.1 5.4
Proportion age 70+ (%) 8.2 6.7 Domestic services 4.4 4.6
Employer (%) Manufacturing 16.3 14.2
Private employee 88.7 98.1 Primary sector 12.7 37.0
o/w Private small 41.3 24.1 Retail 30.2 23.6
Private large 58.7 75.9 Services 25.3 12.3
Public employee 11.3 1.9 Utilities 5.9 3.0
Source: World Bank staff calculations with data from EHPM 2012 (DIGESTYC 2013).Note: Large firms are defined here as more than 5 workers and small firms as less than 5. Given that the poverty rate as per the national definition is 41 percent this profile mirrors that of the bottom 40 of the population.a. In 2005 US dollars.

Setting the Stage 15
FigurE 1.4 Extreme Poverty in rural areas Has Fallen the Most
Source: World Bank staff calculations using EHPM.
Extreme and moderate poverty rates in urban and rural areas (national definitions), percent
0
20
40
60
2000 2004 2008 2012
Urban (moderate)Rural (moderate)Rural extreme Urban extreme
higher than the number of rural poor (57 percent of the poor live in urban areas). Finally, the poor are much more likely than the non-poor to work in the primary sector.
There are also differences in the preva-lence of poverty across the territory. While there is already a higher number of poor living in urban areas (as shown in table 1.1 above), spatial disparities in the rate of poverty remain large. In fact, poverty rates in some of the poorer departments are al-most 30 percentage points higher than in the San Salvador department. The five de-partments with the largest centers (San Salvador, San Miguel, Santa Ana, La Libertad, and Sonsonate) are also the five departments with the lowest poverty rates (see figure 1.5). Access to services and con-nectivity differs also across the territory
(Amaya and Cabrera 2012). At the same time, the poor concentrates in the five de-partments with large urban centers, as they hold around 57 percent of the poor nation-wide (see further below and, for a broader country context, see box 1.1).
Shared prosperityThe growth of the income of the bottom 40 percent has been low compared to other countries. El Salvador is one of the few coun-tries in the world where the growth of mean income has been negative but there has been some growth of the income for the bottom 40 percent (see figure 1.6). Real mean per capita income decreased by 0.6 percent p.a. from 2006 to 2011, while the real per capita income of the bottom 40 increased by 1.1 percent p.a. However, the growth of the bot-tom 40 in El Salvador lagged that of many
FigurE 1.3 Lower Poverty reduction than in Other Countries, Especially Since 2008
Poverty rate using $4/day line, percent
0
10
20
30
40
50
2003 2007 2012
Latin America and the CaribbeanEl Salvador
Source: World Bank staff calculations using EHPM.

16 Setting the Stage
other countries. Out of 72 countries for which roughly comparable data is available, there were 54 countries that had higher income growth of the bottom 40 percent than El Salvador. And only five out of the 72 coun-tries worldwide had a lower growth of mean
income than El Salvador.2 This Salvadoran pattern of higher (but still low) growth of the bottom 40 emerged as a result of a particu-larly high growth in the very bottom of the income distribution (see discussion under the chapter on inclusion below) which also helped reduce extreme poverty as shown above.3
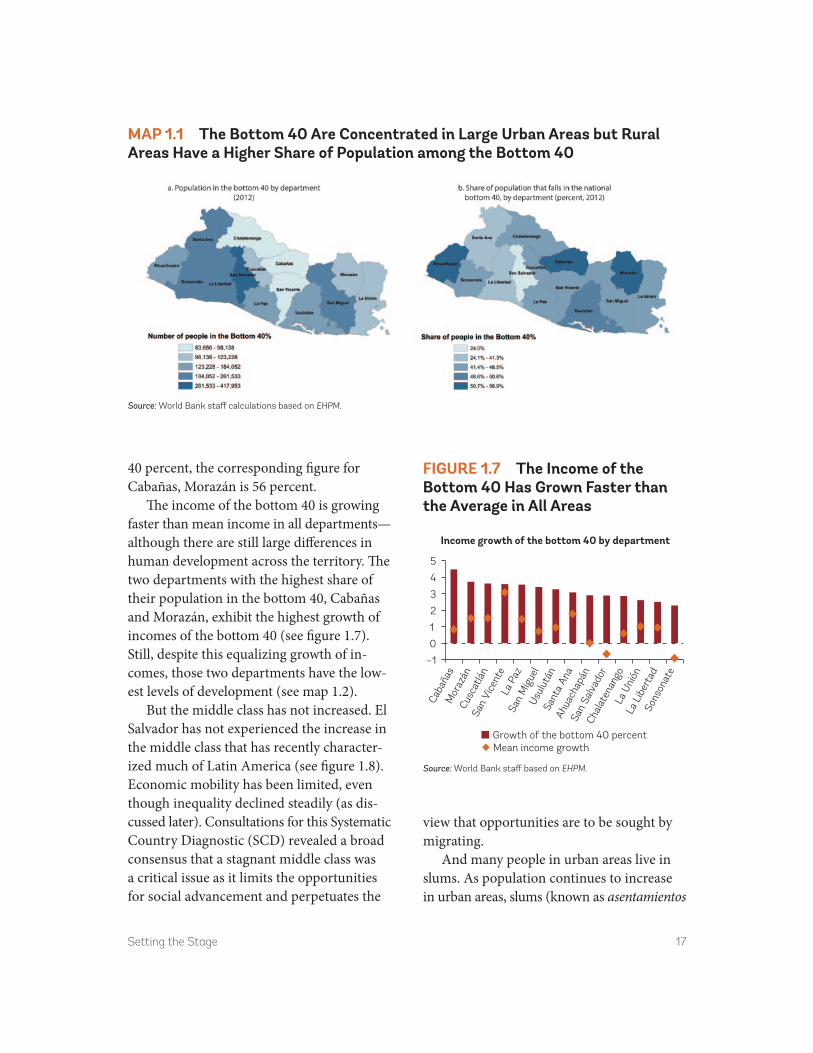
The bottom 40 is more concentrated in largely urban departments but rural depart-ments have a higher share of the population that falls in the national bottom 40. Around 57 percent of all the people in the bottom 40 of the national income distribution live in the five departments with the largest cities (San Salvador, San Miguel, Santa Ana, La Libertad, and Sonsonate). Still, as shown in map 1.1 below the mostly rural depart-ments of Ahuachapán, Cabañas, Morazán, San Vicente, and Usulatán have the highest share of the population with incomes in the national bottom 40 percent. While in the de-partment of San Salvador only 26 percent of the population fall in the national bottom
FigurE 1.5 Poverty Disparity remains Large across the Territory
Source: World Bank staff based on EHPM.
Poverty rate by department, 2012
0
10
20
30
40
50
60
Cabañ
as
Ahuachap
án
Morazá
n
Usulutá
n
San V
icente
Sonsonat
e
La Unión
La Paz
Chalate
nango
San M
iguel
Santa
Ana
Cuscat
lán
La Liber
tad
San Salv
ador
FigurE 1.6 Lagging Behind on Shared Prosperity
Source: World Bank.Note: Based on real mean per capita consumption or income measured at 2005 Purchasing Power Parity (PPP).
Growth across 72 countries of mean incomeand income of the bottom 40, circa 2006–11
–5
0
5
10
15
–5 5 15
Gro
wth
of t
he in
com
eof
the
bot
tom
40
Growth of mean income
El Salvador
Setting the Stage 17
40 percent, the corresponding figure for Cabañas, Morazán is 56 percent.
The income of the bottom 40 is growing faster than mean income in all departments— although there are still large differences in human development across the territory. The two departments with the highest share of their population in the bottom 40, Cabañas and Morazán, exhibit the highest growth of incomes of the bottom 40 (see figure 1.7). Still, despite this equalizing growth of in-comes, those two departments have the low-est levels of development (see map 1.2).
But the middle class has not increased. El Salvador has not experienced the increase in the middle class that has recently character-ized much of Latin America (see figure 1.8). Economic mobility has been limited, even though inequality declined steadily (as dis-cussed later). Consultations for this Systematic Country Diagnostic (SCD) revealed a broad consensus that a stagnant middle class was a critical issue as it limits the opportunities for social advancement and perpetuates the
view that opportunities are to be sought by migrating.
And many people in urban areas live in slums. As population continues to increase in urban areas, slums (known as asentamientos
FigurE 1.7 The income of the Bottom 40 Has grown Faster than the average in all areas
Source: World Bank staff based on EHPM.
1
–1
0
2
3
4
5
Caba
ñas
Mor
azán
Cusc
atlá
nSa
n Vi
cent
eLa
Paz
San
Mig
uel
Usul
után
Sant
a An
aAh
uach
apán
San
Salv
ador
Chal
aten
ango
La U
nión
La L
iber
tad
Sons
onat
e
Income growth of the bottom 40 by department
Growth of the bottom 40 percentMean income growth
MaP 1.1 The Bottom 40 are Concentrated in Large urban areas but rural areas Have a Higher Share of Population among the Bottom 40
Source: World Bank staff calculations based on EHPM.

18 Setting the Stage
urbanos precarios) have grown. There are around 2,500 slums in the country housing almost half a million households (FLACSO, MINED, and PNUD 2010). Those living in slums are the most vulnerable to be affected by disasters and crime. In some cases house-
holds with incomes above the bottom 40 are still living in slums and suffering precarious living conditions. For example, the number of households living in slums in San Salvador is 30,000 larger than the number of house-holds in the bottom 40 (see figure 1.9).
MaP 1.2 But There are Still Large Differences in Human Development across Departments
Source: UNDP.
FigurE 1.8 Middle Class Stagnant
Source: Ferreira et al. 2013.
0
10
20
30
40
50
2003 2007 2012
El SalvadorLatin America and the Caribbean
Share of the population in the middle class(income $4–$10/day per person), percent
FigurE 1.9 Many Live in urban Slums, Even Households that are Not in the Bottom 40
127
157
0
50
100
150
200
San
Salv
ador
La L
iber
tad
Sant
a An
aSa
n M
igue
lSo
nson
ate
Usul
után
Ahua
chap
án
La P
az
La U
nión
Cusc
atlá
n
Mor
azán
Chal
aten
ango
San
Vice
nte
Caba
ñas
Number of households, by department
Bottom 40 Urban slums
Source: FLACSO, MINED, and PNUD (2010) and World Bank staff calculations based on EHPM.

Setting the Stage 19
Drivers of Poverty and Shared ProsperityLabor income and remittances have played the largest role in contributing to pov erty reduction. An analysis of the
contribution of different income sources to the reduction of poverty since 2000 shows the importance of labor income as a source for poverty reduction (see figure 1.10 below), especially for getting people out of extreme poverty and for lifting rural
BOX 1.1 Country Context
El Salvador is a small middle-income country with a large diaspora. With a population of 6.3 million and a gross domestic product (GDP) of $23.8 billion in 2012, El Salvador’s per capita GDP stands at around $3,800 in nominal terms. El Salvador is the smallest and most densely populated country in Central America. Population density is ten times the average for the Latin America and the Caribbean region. Almost two-thirds of the people live in urban areas and less than 1 percent is considered to be indigenous.
Around 2 million people of Salvadoran origin live in the U.S. and remittances accounted to around $3.9 billion in 2012 (over 16 percent of GDP). El Salvador is exposed to numer-ous natural hazards, including tropical storms, earthquakes, and volcanic eruptions. With a homicide rate of around 41 deaths per 100,000 people El Salvador’s is one of the highest in the world. Besides a high level of homicides the country also suffers from high levels of extortion and other crimes related to street gangs, so-called maras. The services sector ac-counts for more than 60 percent of GDP and the economy has been officially dollarized since 2001.
Since the end of the twelve-year civil war in 1991, El Salvador has made progress in con-solidating peace and democracy, but politics remains polarized. The national political stage is dominated by two main political parties—the National Republic Alliance (ARENA) and the Farabundo Martí National Liberation Front (FMLN). ARENA held the executive branch of the Government from 1991 until March 2009, when the FMLN candidate, Mauricio Funes, won the presidential election. While the smooth handover of political power marked an important landmark in the country’s political history the political envi-ronment remained highly polarized.
The FMLN narrowly won the presidential election held in March 2014 and President Salvador Sánchez Cerén assumed office on June 1, 2014. The twin goals of ending extreme poverty and boosting shared prosperity are fully aligned with the objectives of the new adminis-tration which released its Five-Year Development Plan in January 2015. The 2014–19 Development Plan lays out the high-level objectives of a country that is more productive, educated, and safe (El Salvador: Productivo, Educado y Seguro).

20 Setting the Stage
households out of poverty. However, for urban households remittances have played a more significant role. The role of remit-tances, which often result from a conscious intra-household decision to migrate and take advantage of foreign labor markets as a source of income, merits further attention and will be discussed further below.
Unpacking the contribution of labor in-come shows significant differences between urban and rural areas. In rural areas the positive contribution of labor income to poverty reduction resulted mainly from in-creases in income of men, while in urban areas both men and women exhibited a similar pattern. In urban areas the only positive contributor to poverty reduction resulted from the labor income of newly employed men and women, but not from
the labor income of previously employed men and women. In rural areas both fac-tors, income from newly and previously employed workers, contributed to a reduc-tion of poverty (see figure 1.11).
Government transfers have played only a limited role in reducing extreme poverty, and only in rural areas. As shown in figure 1.10 above the role of government transfers has been limited in reducing poverty. The highest contribution of government transfers has been to reduce extreme poverty in rural areas, but even in that case the contribution has been limited compared to other sources of income: 82 percent of the reduction of ex-treme poverty in rural areas can be explained by labor income, while remittances explain 13 percent, and government transfers only 4 percent.
FigurE 1.10 The Labor Market Played a Key role in getting People Out of Poverty
Source: World Bank staff calculations based on EHPM.
Contributions of different income sources to the reduction of poverty since 2000
Other Pensions Government transfers Remittances Labor income
a. Extreme poverty
National Rural Urban–16
–12
–8
–4
0
4
b. Overall poverty
–16
–12
–8
–4
0
4
National Rural Urban
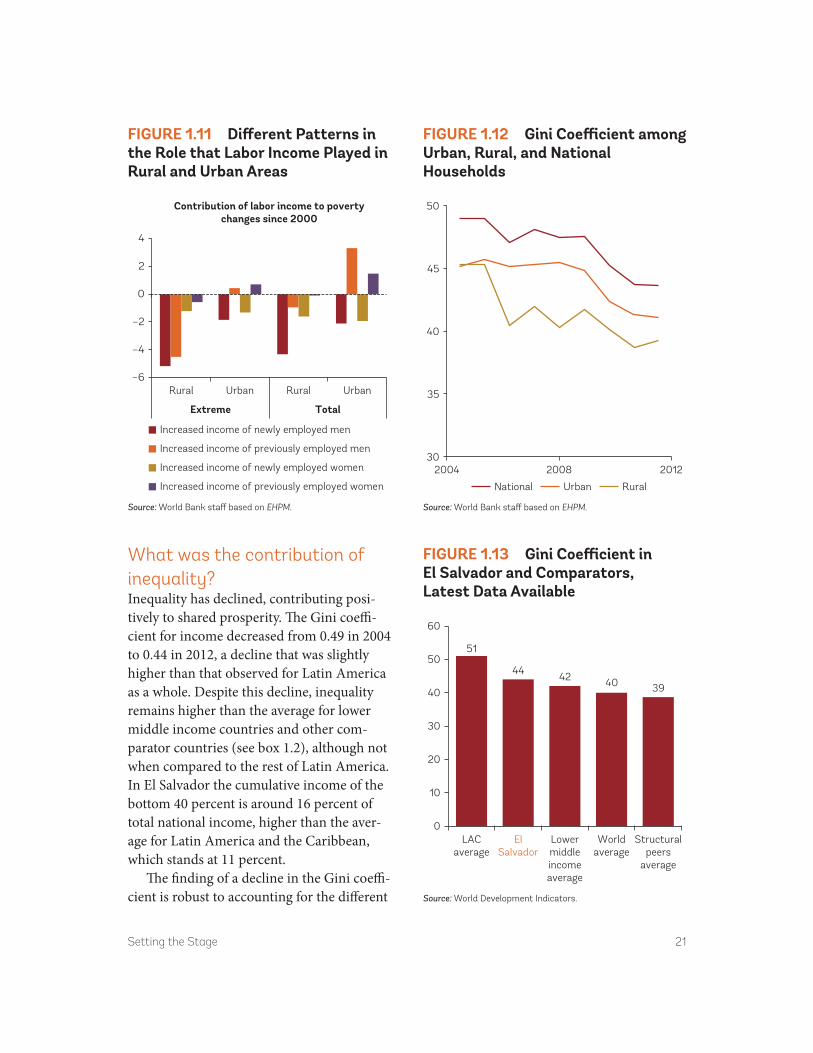
Setting the Stage 21
What was the contribution of inequality?Inequality has declined, contributing posi-tively to shared prosperity. The Gini coeffi-cient for income decreased from 0.49 in 2004 to 0.44 in 2012, a decline that was slightly higher than that observed for Latin America as a whole. Despite this decline, inequality remains higher than the average for lower middle income countries and other com-parator countries (see box 1.2), although not when compared to the rest of Latin America. In El Salvador the cumulative income of the bottom 40 percent is around 16 percent of total national income, higher than the aver-age for Latin America and the Caribbean, which stands at 11 percent.
The finding of a decline in the Gini coeffi-cient is robust to accounting for the different
FigurE 1.12 gini Coefficient among urban, rural, and National Households
Source: World Bank staff based on EHPM.
30
35
40
45
50
2004 2008 2012
National Urban Rural
FigurE 1.13 gini Coefficient in El Salvador and Comparators, Latest Data available
Source: World Development Indicators.
51
4442 40 39
0
10
20
30
40
50
60
LACaverage
ElSalvador
Lowermiddleincomeaverage
Worldaverage
Structuralpeers
average
FigurE 1.11 Different Patterns in the role that Labor income Played in rural and urban areas
Source: World Bank staff based on EHPM.
–6
–4
–2
0
2
4
Rural Urban Rural Urban
Extreme Total
Contribution of labor income to povertychanges since 2000
Increased income of newly employed men
Increased income of previously employed men
Increased income of newly employed women
Increased income of previously employed women

22 Setting the Stage
inflation rates experienced by the different deciles of the income distribution. The de-crease in inequality as measured by the Gini coefficient is not the result of using a con-sumer price index that may mask differing trends in the prices faced by those with very different income levels. Adjusting for decile- specific inflation rates results in a lower but similar rate of reduction in the Gini coeffi-cient since 2000. While in the standard cal-culation the Gini coefficient decreased by 6 percentage points using the decile-specific inflation rates results in a decrease of around 4 percentage points.4
The decrease in inequality was driven largely by labor income in both urban and rural settings. Nationally, labor income ex-plains 72 percent of the decline in income inequality since 2000, while remittances ex-plain 7 percent, and government transfers explain only 3 percent of the reduction in overall inequality. The role of the labor income
BOX 1.2 Benchmarking with Peer Countries
This SCD benchmarks El Salvador vis-à-vis countries in the same region (Latin America and the Caribbean), countries in the same income classification (lower middle income) and a set of structurally similar countries (“structural peers”).
Structural peers are countries anywhere in the world that meet three criteria that also de-fine El Salvador:
■ Population between 3 and 12 million (El Salvador’s population is 6.4 million) ■ GDP per capita between $2,500 and $6,000 (El Salvador’s GDP per capita is $3,800) ■ Positive net outmigration and remittance inflows at least 3 percent of GDP
Using the above criteria the structural peers for El Salvador are: Armenia, Bosnia and Herzegovina, the Dominican Republic, Georgia, Serbia, and Tunisia. References to “Structural peers average” in this SCD indicate the unweighted average for these countries (including El Salvador).
–0.12
–0.10
–0.08
–0.06
–0.04
–0.02
0
Contributions of different income sources to thereduction of inequality since 2000
National Rural Urban
Other
PensionsGovernment transfers
RemittancesLabor income
FigurE 1.14 Labor income accounts for the Decline in inequality
Source: World Bank staff based on EHPM.

Setting the Stage 23
in decreasing inequality is even more impor-tant in the case of rural households, where it explains fully 89 percent of the decline in inequality and remittances only 1 percent. The limited role played by remittances de-spite the large volume of those transfers is explained by the fact that remittances are re-ceived by households along the entire distri-bution of income (as discussed further in chapter 3 on inclusion).
What was the contribution of growth?Economic growth was the main driver of the (limited) poverty reduction observed. To ex-plore the role that growth has played in pov-erty reduction we perform a Datt-Ravallion decomposition of poverty changes, which at-tempts to identify the relative contributions of growth and changes in inequality for any given poverty change. Before the global eco-nomic crisis of 2008, when poverty reduc-tion in terms of $4/day took place in El Salvador, growth accounted for about 72 percent of the poverty reduction and in-equality for about 28 percent.5 El Salvador has benefited from a high growth-poverty elasticity, especially for extreme poverty. It is estimated that during the decade of 2000 a one percent change in GDP was associated with a 2.2 percent change in extreme poverty (Cadena et al. 2013).
Given the low overall growth, the in-crease in the income of the bottom 40 has been unusually high. Estimates using the methodology of Dollar, Kleinberg, and Kraay (2013) suggest that the growth of the bottom 40 in El Salvador was seven times higher than predicted given its average income growth. This finding holds even if the model is re-estimated to assuming that the country
has the average pro-poor bias of the Latin American region. It is also worth noting that the income of the bottom 40 percent has grown faster than for the total population across all geographic areas as discussed above.
Worryingly, growth has been low for an extended period, becoming a drag on shared prosperity. Since 2000 real per capita GDP growth in El Salvador has been significantly lower than in countries with similar income levels, structural characteristics, or any of the other sets of comparators (see figure 1.15 above). For example, among its group of structural peers El Salvador’s per capita GDP growth has been the lowest. Among the 48 lower middle income countries for which data is available, El Salvador ranked in the bottom quarter. Moreover, growth has been below par for an extended period of time and the trend has been one of further falling behind (see figure 1.16 above). While the im-pact of the global economic crisis of 2008
3.9
2.5 2.52.0
1.5
0
1
2
3
4
Average annual real per capita GDP growth2000–13, percent
Structuralpeers
average
Lowermiddleincomeaverage
Worldaverage
LACaverage
ElSalvador
FigurE 1.15 Per Capita gDP growth in Comparator Countries Has Been Much Higher
Source: World Bank.

24 Setting the Stage
was significant, the volatility of growth has diminished over time and has not been par-ticularly high.6
El Salvador’s development prospects are influenced heavily by four key characteristics: a large diaspora, frequent natural disasters, high crime and violence, and the fact that the economy is dollarized. The rest of this sec-tion introduces these four key characteristics that shape both the development challenges and the space for policy interventions.
Key Country Features Affecting DevelopmentA Large DiasporaAround one in three Salvadorans lives abroad, especially in the US. An estimated 2 million Hispanics of Salvadoran origin resided in the United States in 2011, according to the US Census Bureau’s American Community
Survey as analyzed by the Pew Research Center. Salvadorans in this statistical profile are people who self-identified as Hispanics of Salvadoran origin; meaning that either they themselves are Salvadoran immigrants or they trace their family ancestry to El Salvador. Of the 2 million self-declared Salvadorans in the US a full 1.2 million were born in El Salvador and migrated to the US, while 800,000 are descendent of Salvadoran mig rants but were born in the US themselves. Even if we only consider the 1.2 million migrants born in El Salvador as the relevant stock of migrants that still im-plies that more than one in five Salvadorans reside in the US.
The pace of migration picked up in the 1980s in the context of the civil war and accelerated after the end of the war. Over the last three decades an average of 60,000 Salvadorans emigrated annually. While the first wave of migration coincided with the war, the pace of migration did not slow down after the peace was secured. In fact the aver-age number of migrants per year actually increased. In the 1980s the country lost an-nually around 29,000 people due to migra-tion. In the 1990s this figure increased to around 63,000 per year and remained at around 62,000 in the first decade of the 21st century. Only in the aftermath of the global economic crisis has there been a decrease in migration, averaging around 37,000 migrants per year in 2010–12, although it is too early to tell whether this is just a temporary phe-nomenon or a reversal of a long-standing trend. Public opinion polls indicate that 23 percent of Salvadorans intend to migrate, one of the highest levels among Latin American countries (LAPOP 2012 surveys).
Migrants are more likely to be younger, slightly more educated, and male. Around
–4
–2
0
2
4
6
8
10GDP growth, percent
1990 2000 2010
Lower middle income countries’ averageEl Salvador
FigurE 1.16 El Salvador’s growth Has Been Low for an Extended Period
Source: World Bank.
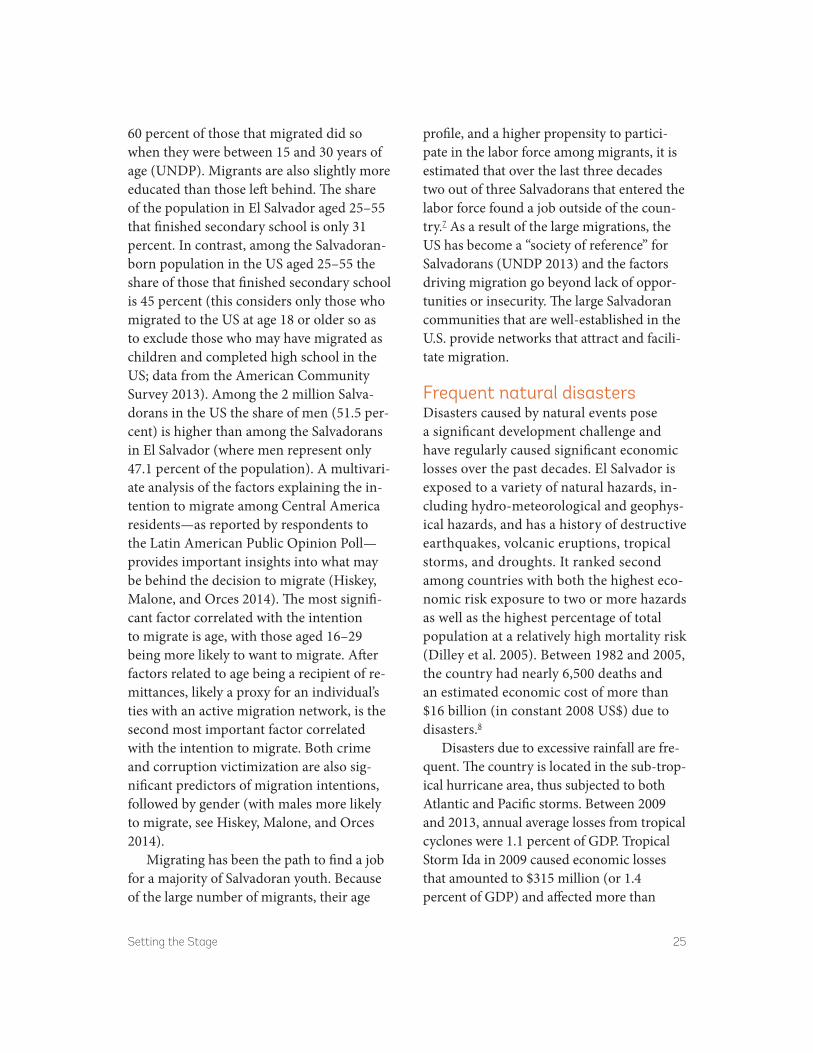
Setting the Stage 25
60 percent of those that migrated did so when they were between 15 and 30 years of age (UNDP). Migrants are also slightly more educated than those left behind. The share of the population in El Salvador aged 25–55 that finished secondary school is only 31 percent. In contrast, among the Salvadoran-born population in the US aged 25–55 the share of those that finished secondary school is 45 percent (this considers only those who migrated to the US at age 18 or older so as to exclude those who may have migrated as children and completed high school in the US; data from the American Community Survey 2013). Among the 2 million Salva-dorans in the US the share of men (51.5 per-cent) is higher than among the Salvadorans in El Salvador (where men represent only 47.1 percent of the population). A multivari-ate analysis of the factors explaining the in-tention to migrate among Central America residents—as reported by respondents to the Latin American Public Opinion Poll—provides important insights into what may be behind the decision to migrate (Hiskey, Malone, and Orces 2014). The most signifi-cant factor correlated with the intention to migrate is age, with those aged 16–29 being more likely to want to migrate. After factors related to age being a recipient of re-mittances, likely a proxy for an individual’s ties with an active migration network, is the second most important factor correlated with the intention to migrate. Both crime and corruption victimization are also sig-nificant predictors of migration intentions, followed by gender (with males more likely to migrate, see Hiskey, Malone, and Orces 2014).
Migrating has been the path to find a job for a majority of Salvadoran youth. Because of the large number of migrants, their age
profile, and a higher propensity to partici-pate in the labor force among migrants, it is estimated that over the last three decades two out of three Salvadorans that entered the labor force found a job outside of the coun-try.7 As a result of the large migrations, the US has become a “society of reference” for Salvadorans (UNDP 2013) and the factors driving migration go beyond lack of oppor-tunities or insecurity. The large Salvadoran communities that are well-established in the U.S. provide networks that attract and facili-tate migration.
Frequent natural disastersDisasters caused by natural events pose a significant development challenge and have regularly caused significant economic losses over the past decades. El Salvador is exposed to a variety of natural hazards, in-cluding hydro-meteorological and geophys-ical hazards, and has a history of destructive earthquakes, volcanic eruptions, tropical storms, and droughts. It ranked second among countries with both the highest eco-nomic risk exposure to two or more hazards as well as the highest percentage of total population at a relatively high mortality risk (Dilley et al. 2005). Between 1982 and 2005, the country had nearly 6,500 deaths and an estimated economic cost of more than $16 billion (in constant 2008 US$) due to disasters.8
Disasters due to excessive rainfall are fre-quent. The country is located in the sub- trop-ical hurricane area, thus subjected to both Atlantic and Pacific storms. Between 2009 and 2013, annual average losses from tropical cyclones were 1.1 percent of GDP. Tropical Storm Ida in 2009 caused economic losses that amounted to $315 million (or 1.4 percent of GDP) and affected more than

26 Setting the Stage
three million people, while Tropical Storm Agatha caused losses of $111 million in 2010. Most recently, Tropical Depression 12E in October 2011 affected nearly 70 percent of all municipalities and was the most severe weather event recorded in El Salvador. The population affected by the event was esti-mated at 1,424,091 people (55 percent of the country’s population), of which more than 56,000 had to evacuate their houses. The eco-nomic damages and losses caused by Tropical Depression 12E in El Salvador is estimated at $902 million, which represents 4.3 percent of the country’s GDP in 2010. In addition, droughts have also had large socio-economic impacts, for example in 1998 and 2001, dam-aging the crops of 400,000 people living on subsistence incomes.
Moreover, a high percentage of its popu-lation lives along six active volcanoes and in areas highly exposed to geological hazards. The last two major earthquakes in January and February 2001 led to economic losses of $1.85 billion, representing approximately 13 percent of El Salvador’s 2001 GDP. These earthquakes killed 1,159 people and affected 1.6 million people. Other major earthquakes within the last century include those of 1986 (1,500 people dead) and 1917 (1,050 people dead). Estimated national losses from a one in a 100-year earthquake total US$5.7 billion (25 percent of current GDP). On the other hand, the largest population centers are located close to active volcanoes. San Miguel, the second-largest city in the coun-try with around 250,000 inhabitants, is lo-cated just 7 kilometers away from a volcano (Chaparrastique) which has had five erup-tions in the last two decades. The capital city of San Salvador, with over one-third of the country’s population, is also located next to an active volcano (Quetzaltepec) with a
history of large eruptions, the last of which took place in 1917.
High levels of crime and violenceCrime and violence put at risk the sustain-ability of social gains. El Salvador faces a particularly difficult challenge from crime and insecurity. One indicator of the sever-ity of crime is that El Salvador has been since 2000 among the top 5 countries in the world in homicide rate (UNODC 2013; see also figure 1.17). Since 2000 the number of homicides has always been above 30 per 100,000, five times the world average, and peaked at over 60 homicides per 100,000 before a truce declared between maras (gangs) in March 2012. The truce has since unraveled and homicides went up again in 2014. The economic costs of violence in El Salvador are estimated to be around 11 per cent of GDP including material losses, public and private security, and health costs (Acevedo 2008; World Bank 2011a).
52
23
8 6 60
20
40
60Homicides per 100,000, average 2000–12
ElSalvador
LACaverage
Lowermiddleincomeaverage
Worldaverage
Structuralpeers
average
FigurE 1.17 Crime is among the World’s Highest
Source: UNODC 2013.

Setting the Stage 27
In 2010 crime overtook economic issues as the number one problem in the country as perceived by the population (see further below in the sustainability chapter). Crime is a key development issue for El Salvador.
Violence in El Salvador has multiple causes, some of which are external. First, the country’s history of civil war and the wide-spread availability of small firearms were conducive for violence to take hold. A sec-ond key factor is the rise of the maras, cre-ated originally in the US among Salvadoran migrants. Many of the gang members were subsequently deported back to El Salvador, often after having served prison terms in the US. These deported gang members brought with them the maras to El Salvador and turn them into a criminal enterprise that attracted many disadvantaged youths in part due to the strong sense of identity that the maras provided. The increase in deportations from the US in recent years has also helped to ex-pand the ranks of the maras in El Salvador. A third key factor is the increase in drug trafficking through Central America in re-cent years, with the maras and drug cartels now increasingly tied.9 While violence is a complex issue, it is clear already from the list of factors mentioned above that many of the causes that have exacerbated violence in El Salvador have a strong exogenous component.
Given weak institutions, crime poses a challenge to the state’s capacity to enforce the law and undermines economic sentiment. The state is not able to deliver citizen secu-rity. Impunity is high, with a criminal con-viction rate of less than 5 percent. This contributes to a lack of confidence in public institutions and even concerns among some members of the public about a possible state capture. Police and the judiciary are widely
perceived as corrupt and the Supreme Court has the lowest level of citizen confidence among major public institutions. The lack of confidence in the police has led to private se-curity personnel outnumbering the police force. Private security costs are substantial and affect the competitiveness of Salvadoran firms (see figure 1.18). Threats and extortion have become widespread.10 While hard evi-dence is often unavailable, existing surveys indicate that in fear of crime a significant number of small firms have responded by for example reducing opening hours. Extortion can sometimes be so high, and its enforce-ment so brutal, that some firms are simply opting to go out of business (see figure 1.19). Reporting to the police is rare due to lack of confidence in security institutions and fear of reprisals.
A dollarized economyEl Salvador officially dollarized its economy in 2001. From 1993 through 2000 El Salvador operated under a pegged exchange rate. As of
3.4
1.9 1.7 1.5 1.2
0
1
2
3
4Firms’ security costs as percent of annual sales
ElSalvador
Lowermiddleincomeaverage
Worldaverage
LACaverage
Structuralpeers
average
FigurE 1.18 Security Costs are an additional Burden that Limits Competitiveness
Source: World Bank Enterprise Surveys.
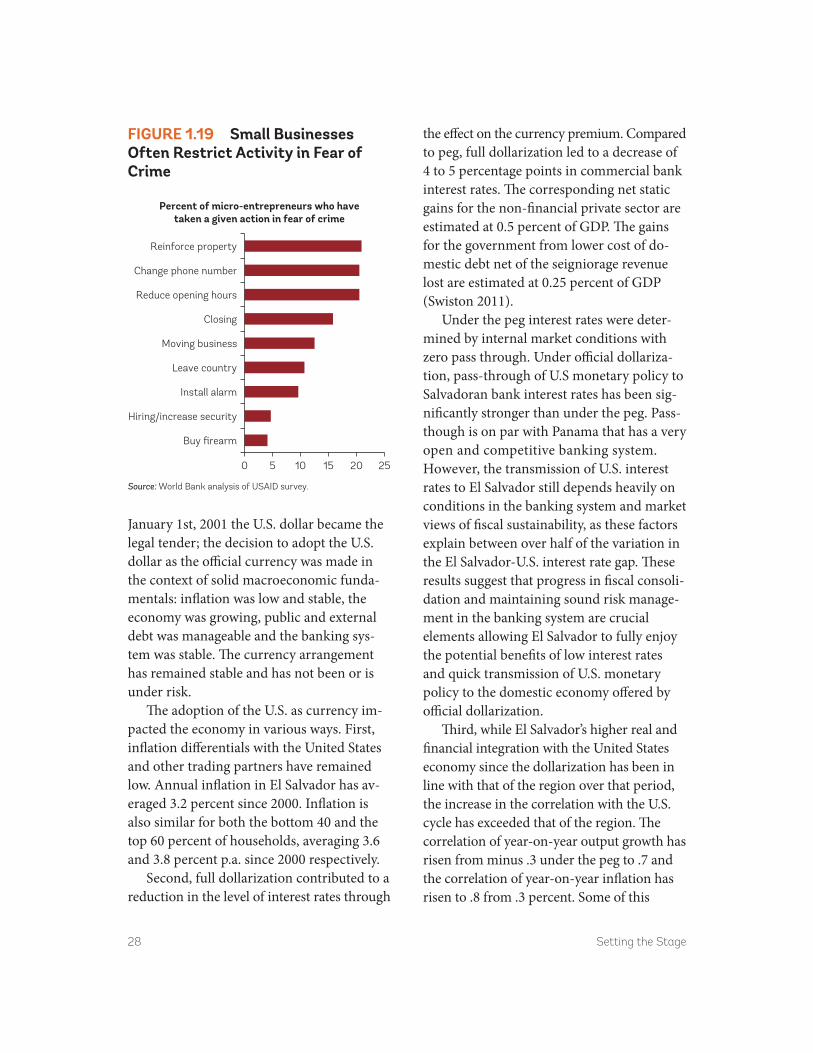
28 Setting the Stage
January 1st, 2001 the U.S. dollar became the legal tender; the decision to adopt the U.S. dollar as the official currency was made in the context of solid macroeconomic funda-mentals: inflation was low and stable, the economy was growing, public and external debt was manageable and the banking sys-tem was stable. The currency arrangement has remained stable and has not been or is under risk.
The adoption of the U.S. as currency im-pacted the economy in various ways. First, inflation differentials with the United States and other trading partners have remained low. Annual inflation in El Salvador has av-eraged 3.2 percent since 2000. Inflation is also similar for both the bottom 40 and the top 60 percent of households, averaging 3.6 and 3.8 percent p.a. since 2000 respectively.
Second, full dollarization contributed to a reduction in the level of interest rates through
the effect on the currency premium. Compared to peg, full dollarization led to a decrease of 4 to 5 percentage points in commercial bank interest rates. The corresponding net static gains for the non-financial private sector are estimated at 0.5 percent of GDP. The gains for the government from lower cost of do-mestic debt net of the seigniorage revenue lost are estimated at 0.25 percent of GDP (Swiston 2011).
Under the peg interest rates were deter-mined by internal market conditions with zero pass through. Under official dollariza-tion, pass-through of U.S monetary policy to Salvadoran bank interest rates has been sig-nificantly stronger than under the peg. Pass-though is on par with Panama that has a very open and competitive banking system. However, the transmission of U.S. interest rates to El Salvador still depends heavily on conditions in the banking system and market views of fiscal sustainability, as these factors explain between over half of the variation in the El Salvador-U.S. interest rate gap. These results suggest that progress in fiscal consoli-dation and maintaining sound risk manage-ment in the banking system are crucial ele ments allowing El Salvador to fully enjoy the potential benefits of low interest rates and quick transmission of U.S. monetary policy to the domestic economy offered by official dollarization.
Third, while El Salvador’s higher real and financial integration with the United States economy since the dollarization has been in line with that of the region over that period, the increase in the correlation with the U.S. cycle has exceeded that of the region. The correlation of year-on-year output growth has risen from minus .3 under the peg to .7 and the correlation of year-on-year inflation has risen to .8 from .3 percent. Some of this
Percent of micro-entrepreneurs who havetaken a given action in fear of crime
0 5 10 15 20 25
Buy firearm
Hiring/increase security
Install alarm
Leave country
Moving business
Closing
Reduce opening hours
Change phone number
Reinforce property
FigurE 1.19 Small Businesses Often restrict activity in Fear of Crime
Source: World Bank analysis of USAID survey.

Setting the Stage 29
synchronization could stem from the effects of official dollarization itself. When compared with other countries in the region operating under a peg, there is no evidence that moving to a more flexible exchange rate policy would yield sizeable improvements in terms of cycli-cal stabilization for the El Salvador.
Having a fully dollarized economy calls for particular attention to having a sound fi-nancial system and a prudent fiscal policy.
The absence of a lender of last resort puts ad-ditional emphasis on preventing situations of stress in the financial system. Similarly, since the authorities no longer have recourse to monetary and exchange rate policy to cush-ion any shocks, fiscal policy becomes the only tool through which the government can undertake countercyclical policy, making the building up of fiscal buffers during good times all the more important.
Notes 1. While poverty estimates from the 1990s are
not strictly comparable, the methodological differences do not appear to drive the differ-ences in poverty reduction observed between the two decades (Cadena et al. 2013).
2. This analysis is based on income from as esti-mated from household surveys. While there are differences on any given year between the survey-based household income and the gross national income as derived from the national accounts, over the period for which data is available the average growth rates of the two measures are fairly similar and in line with the relationship observed for other countries in the Latin America and the Caribbean region (see appendix for further details).
3. Analyses based on synthetic panels that fol-low the same households over time show even steeper growth incidence curves where the poorer parts of the distribution grow faster; see Ferreira et al. (2013, 105).
4. World Bank, Inequality in a Lower Growth Latin America, Semiannual Report of the World Bank Chief Economist Office for Latin America and the Caribbean, Fall (2014, 55).
5. From 2007 to 2012 changes in poverty ($4/day) were too small to perform this decomposition.
6. The standard deviation of growth rates or of the output gap since 2000 has been lower than the average for the Latin America and the Caribbean region and similar to the average for lower middle income countries. However, growth has been so low in El Salvador that an alternative measure of volatility that takes this
into account, like the coefficient of variation, shows a slightly different picture whereby El Salvador has been affected by greater volatility than other countries in Latin America and the Caribbean (see appendix).
7. See UNDP (2013, 95). The number is so high that it is worth explaining it in detail: dur-ing the last three decades each year 20,000 people entered the 15–30 year old group in El Salvador, of which around 11,000 were employed. In comparison, of more than 60,000 migrants each year around 36,000 were in the 15–30 year old group. Given a labor force par-ticipation rate of 77 percent among Salvadoran immigrants in the US and an unemployment rate of 10 percent among Salvadoran migrants in the US (CEMLA, BID, and FOMIN 2013), it can be estimated that during the last three decades every year around 24,000 Salvadorans aged 15–30 became employed in the US.
8. The use of the term “natural disasters” is to be understood as disasters triggered by natural events since in fact a disaster only arises once the natural event meets human activity, and in particular inadequate location of housing, inadequate infrastructure, etc. Disasters can often be prevented (or at least minimized) by improving land use planning, construction standards, etc.
9. World Bank (2011a) and Shifter (2012) pro-vide a good overview of the growing literature on violence in Central America. However, this literature still suffers from limited quan-titative information that could allow robust

30 Setting the Stage
empirics. For an early attempt at conducting such empirical work see Cruz, Argüello, and Gonzalez (2001).
10. The homicide rate dropped sharply from 70 per 100,000 inhabitants in 2011 to 36 in 2012 and 39 in 2013 as a result of a truce between
maras. However, robbery, extortion and threats reported by individuals in surveys before and after the truce show almost identi-cal levels of victimization: 23 percent in 2011 and 24 percent for the May 2012–April 2013 period (IUDOP 2014).

Determinants of Economic Growth 31
Drivers of GrowthGrowth accounting decompositions suggest a modest contribution to growth of total factor productivity (TFP) and a declin-ing one from capital. Over the last two decades the slowdown of growth can be attributed to decreasing contributions to growth of both capital and TFP while the increase in the con-tribution of labor has not been enough to offset the other factors (see figure 2.1). The decreasing contribution of capital and TFP is the result of a low and declining rate of capi-tal accumulation. El Salvador stands out for both a lower investment rate than its compara-tors and its downward trend (see figure 2.2).
As of 2013 gross capital formation stood at around 14 percent of gross domestic product (GDP), putting El Salvador in the bottom decile of countries worldwide. Both public and private investment is low (see figure B.9).
High consumption drives growth and fuels import growth. Consumption as a share of GDP reached 102 percent of GDP in 2013, a value which is higher than any of the compara-tor countries and among the highest in the world. Exports stood at 41 percent of GDP while imports amounted to 61 percent of GDP. The gap between the shares of exports and imports continues to widen as import growth continues to outpace exports. From 2010 to 2013 imports grew at 2.5 percent p.a. while
2. Determinants of Economic Growth
1.6 1.41 0.8
0.70.7
0.91.0
0.8
0.2
–0.5
0.3
–1
0
1
2
3
1995–2000
2000–2005
Contribution of different factors of productionto economic growth, percentage points
2005–2010
2010–2012
TFP Labor Capital
FigurE 2.1 Low Contribution of Total Factor Productivity to growth
Source: World Bank.
0
5
10
15
20
25
30
1990–94
1995–99
2000–04
Gross capital formation (five-year averages),percent of GDP
2005–09
2010–13
Lower middle income average LAC
Structural peersEl Salvador
FigurE 2.2 a Declining Contribution of investment
Source: World Bank.

32 Determinants of Economic Growth
exports grew at 1.5 percent p.a. Growth has been sluggish across all economic sectors. With the exception of mining, a sector which accounts for less than 1 percent of GDP, no sector has grown above 3 percent p.a. in the period 2010–13. Among the best performing sectors are construction, which grew at 2.3 percent p.a., and government services, which grew at 2.8 percent p.a. Among the largest sectors of the economy, manufacturing grew at 1.5 percent p.a. and retail and hospitality grew at 1.8 percent p.a.
While growth is low across the board, trad-ables underperform non-tradables. El Salva-dor opened up its economy significantly in the 1990s. The average tariff came down from 22 percent in 1990 to 2.5 percent in 2000 and has fallen further since. At the time of this open-ing up it was expected that El Salvador would benefit from its access to world markets. Ini-tially, maquila exports, typically textiles as-sembled in El Salvador for export to the US, soared.1 Starting in the mid-2000s, however, competition from other countries started to
erode the competitiveness of Salvadoran ma-quila exports, which started to fall in absolute terms (see figure 2.3). While other exports have picked up since they have not done so at a fast enough rate to compensate the decline in maquila exports. Few firms enter the export market when compared to other countries (Lederman et al. 2014, 12). As a result, and despite the openness and outward orientation of El Salvador (with exports plus imports over 100 percent of GDP), the growth of exports has not kept up with its comparators (see figure 2.4).
The pressures of external competition on manufacturing have led to fewer jobs in man-ufacturing. Employment in services has grown but with lower productivity. While the econ-omy still retains a relatively large manufactur-ing base, relatively few jobs are being created in manufacturing. At its peak manufacturing accounted for 33 percent of employment but has since dropped to 27 percent (see figure B.5). As jobs in services have a lower labor productivity than in services this structural
0
1
2
3
4
5
6
1994 2000
Exports by and other goods,in billions of US dollars
maquila
2006 2012
Maquila Others
FigurE 2.3 The rise and Fall of Maquila
Source: World Bank.
6.7 6.5 6.0 5.24.32
0
4
6
8
Lowermiddleincomeaverage
Worldaverage
Real growth of exports, average annualpercentage change from 2000 to 2013
Structuralpeers
average
LACaverage
ElSalvador
FigurE 2.4 underperforming Export growth
Source: Central Bank of El Salvador.

Determinants of Economic Growth 33
transformation has actually decreased pro-ductivity.
The decline in textile maquila exports is due in part to increasing competition from lower wage producers. Among the top 25 apparel-exporting countries in the world El Salvador’s wage costs are in the middle of the range (see figure 2.5). There are numerous gar-ment producing countries with wages that are significantly lower than in El Salvador. For example, minimum wages for garment industry workers in India or Vietnam are one- third lower than in El Salvador. This implies that for the textile industry to be competitive in El Salvador it needs to specialize in higher value activities. The presence of relatively high wage producers among the top 25 apparel-exporting countries in the world (as shown in figure 2.5) suggests that it remains
possible to be competitive in the industry provided higher productivity is achieved.
And competitiveness has been undermined. There are many indicators that competitive-ness is under pressure. Among the few Salva-doran firms that enter the export market El Salvador has the second-lowest exporter sur-vival rates among a set of 29 countries for which comparable data is available (see Lederman et al. 2014). Another sign of a limited competitiveness is the fact that ex-ports are concentrated in terms of products, destinations, and firms.2 The different evolu-tion of the tradables and non-tradables sec-tors is also indicative of the competitiveness pressures on tradables. Prices and salaries in tradable sectors are falling relative to non-trad-ables while productivity in tradables outpaces non- tradables (see figure 2.7).
0
200
400
600
800
1,000
Monthly minimum wages in the garment industry for the top 25 apparel-exporting countries, inUS$ as of January 2014
Sri Lan
ka
Bangla
desh
Pakist
an
Cambodia
Vietnam India
Mexico
Egypt
Tunisia
El Salv
ador
Indonesia
Thailan
d
Guatem
alaChina
Peru
Philippines
Malays
ia
Morocc
o
Honduras
Turkey
Panam
a
Taiwan
, China
Hong Kong,
SAR, China
South K
orea
Lowest relevant rate applicable to unskilled garment worker
Highest relevant rate applicable to unskilled garment workers
FigurE 2.5 There are global Competitors in the garment industry with Lower Wage Levels
Source: ILO 2014.Note: Singapore does not have a minimum wage and is omitted.

34 Determinants of Economic Growth
Negative terms of trade have contributed to the underperformance in tradables. The rise in oil prices during the 2000s and down-ward price pressures on textiles from global competition led to an overall negative evolu-tion of El Salvador’s terms of trade over the last decade (see figure 2.6 below). In addi-tion to worsening terms of trade the increased competition globally has led to a decrease in volumes of Salvadoran textile exports. A vol-ume index of maquila textile exports set at 100 in 2005 declined almost continuously over the following years and dropped to 64 in 2013.
As the country has experienced a real exchange rate appreciation. The real effec-tive exchange rate measured using inflation remains stable. However, taking into
account the evolution of productivity and wages suggests that the real exchange rate, which had been undervalued in the 1990s, appreciated over the last two decades and is no longer undervalued (Cabrera 2014). In fact, recent estimates of the equilibrium real effective exchange rate suggest an over-valuation up to 9 percent and a cyclically- adjusted current account deficit about 1 percent of GDP higher than its equilibrium value (IMF 2015a).
Given the eroding external competitive-ness the limited foreign investment that has been attracted has focused on serving the domestic market. The model under which the maquila in El Salvador was developed was one of attracting foreign direct invest-ment (FDI) inflows based on relatively low
60
80
100
120
140
160
180
January 2000
Indices, January 2000 = 100
January 2005 January 2010Import prices
Real effectiveexchange rate
Terms of trade
Export prices
FigurE 2.6 Terms of Trade and real Effective Exchange rate
Source: Central Bank of El Salvador.
Indices, 1990 = 100
0
50
100
150
200
1990 2000 2010
Productivity of tradables/non-tradables
Salaries in tradables/non-tradables
Prices of tradables/non-tradables
FigurE 2.7 Competitiveness Pressures are Felt More Strongly on Tradables
Source: Cabrera 2014.

Determinants of Economic Growth 35
wages, tax incentives, and special access to the US market. Such a model was fast erod-ing in the early 2000s as the US opened its market to new competitors (ECLAC 2003). Attracting FDI has proved to be challenging. El Salvador stands out as having attracted much less FDI than its comparators since 2000 (see figure 2.8). FDI inflows are also lower than a benchmark value estimated from a regression that controls for popula-tion and GDP (Lederman et al. 2014, 124). In addition, close to 80 percent of the FDI inflows have gone into the services sector, with little in the manufacturing or primary and extractive sectors (see figure 2.9). When the country opened up it was expected that FDI would focus on export-oriented activi-ties rather than on the domestic services
FigurE 2.8 Foreign Direct investment is Low
Source: World Bank.
Average 2000–13, percentof GDP
4.94.3 4.3 4.2
2.4
0
2
4
6
LAC
aver
age
World
aver
age
Struct
ural
peers
aver
age
Lower m
iddle
incom
e ave
rage
El Salv
ador
Share of FDI by recipient sectorin LAC countries, percent
0
20
40
60
80
100
Surinam
e
Guyana
Venez
uela, R
B
Urugu
ay
Parag
uay
Trinidad
and Tobag
oBra
zil
Colombia
Peru
Ecuad
or
Bolivia
Nicara
gua
Argen
tina
Mexico
Chile
Costa R
ica
Dominica
n Rep
ublic
Guatem
ala
HondurasBeli
ze
Jam
aica
Panam
a
El Salv
ador
Haiti
Baham
as, T
he
Antigua a
nd Bar
buda
Barbad
os
Services Manufacturing Primary & extractives
FigurE 2.9 Foreign Direct investment is Focused on the Tertiary Sector to Serve the Domestic Market
Source: World Bank Chief Economist Office for Latin America and the Caribbean, Semiannual Report (April 2014).

36 Determinants of Economic Growth
sector as it happened in the 2000s. A recent analysis of FDI, including a survey of would-be investors, identified that the existing tax incentives are no longer effective and a bro-ader competitiveness agenda is required.3
What Are the Factors that Constrain Growth the Most?A review of existing analyses points to low investment as the proximate cause for low growthThe low economic growth that has character-ized El Salvador in recent decades has been the focus of much study. El Salvador was one of the first case studies of the “growth diag-nostics” methodology (Hausmann and Rodrik 2005). These authors highlight the relatively few number of new products that enter the export basket of El Salvador as evi-dence of a lack of “self-discovery” of new in-dustries by Salvadoran firms. Low investment is identified as a binding constraints to growth in El Salvador but cannot be attributed to a lack of savings given that returns to capital were low. Low investment is therefore attrib-uted to low returns on projects.
Low investment and the corresponding low productivity growth are the most cited causes of the growth performance of the coun-try (Acevedo 2003; Central Bank of El Salva-dor 2005; Zegarra et al. 2007). But many other factors have been put forward as additional explanations for the stagnation of the Salva-doran economy. Unfavorable terms of trade, natural disasters, and slow labor accumula-tion are also factors often discussed in the lit-erature (Cabrera, Fuentes, and de Morales 2005). The heavy reliance on remittances
coupled with the high share of consumption in GDP has led analysts to label the Salvadoran economic development model as one of pro-moting the import of consumer goods and the export of labor (UNDP 2013). Some have gone on to argue that the opening of the Sal-vadoran economy has been excessive and is at the root of the poor economic performance (Cáceres and Flores 2013).
A more recent growth diagnostics con-cludes that there are two binding constraints to growth: security/crime and low produc-tivity of the tradables sector. An analysis of constraints using the growth diagnostics methodology was undertaken by the US and Salvadoran Governments as part of their Partnership for Growth (USG-GoES 2011). This updated growth diagnostics concludes that there are two binding constraints to growth: security/crime and low productivity of the tradables sector. The analysis, however, added the caveat that more data was needed to es-tablish the criticality of constraints on credit to small and medium enterprises (SMEs), cli-mate change, government effectiveness in com-merce and justice, education, and migration.
The World Bank has also produced a num-ber of analyses focused on growth in El Salvador. The 2003 Country Economic Mem-orandum benchmarks El Salvador against Latin America and the Caribbean (LAC) coun-tries on a range of growth determinants and identified savings and investment rates as par-ticularly low. It then concludes on the impor-tance of improving the conditions for investment (including addressing insecurity and infra-structure), fostering innovation, increasing foreign trade, and improving education. In the 1995 Country Economic Memorandum con-straints to growth in El Salvador are explored by comparing it with fast growing Asian coun-tries. It documents negative TFP growth and

Determinants of Economic Growth 37
concludes on the need to increase physical and human capital, openness, and productiv-ity. The remainder of this section updates some of the work on the determinants of growth in El Salvador.
Why is investment low?Returns to capital are low. Leaving aside the issue of whether savings may also constrain investment, to which we will return later, the available evidence suggests that returns to cap-ital have often been below real interest rates (USG-GoES 2011, 27). Capital productivity, as estimated from a growth accounting frame-work, has been declining since 1995; in addi-tion, while regular data on capacity utilization is not available, an estimate suggests that the under-utilization rate of capital may be around 54 percent (Amaya and Cabrera 2013).The view that returns to capital are low has long been identified as a factor behind low growth in El Salvador.4
As firms face low revenues and high costs, including energy. Firms face high costs of pro-duction in a number of areas. Regarding en-ergy, in part due to the high dependence on oil,
which accounts for 36 percent of electricity generation, electricity prices are high—espe-cially for industrial users (see figure 2.10 above). Although the energy sector was privatized in the 1990s the small size of the domestic market and the regulatory framework have been fac-tors limiting new investments in this area that could have diversified energy sources and brought prices down.5 Recently collected data on product market regulations suggests that the regulatory framework in El Salvador may not be as conducive to competition among electricity generators as in other countries. For example, in El Salvador third-party access con-ditions to the electricity transmission grid are subject to negotiation, rather than regulated, which can limit the entry of new market play-ers in the electricity generation market.
Transport and logistics costs are also high. In the 2012 logistics performance index ranks El Salvador below the averages for many of its comparators (see figure 2.11 below). Sim-ilarly, the UN liner shipping connectivity index ranks El Salvador 92nd of 155 countries. Available data suggests that it costs more to ship a container from the East coast of the US
27
Electricity price for industrial use, US cents/kwh (2012)
811
19
0
10
20
30
South
Kor
ea
Phillipines
Vietnam
Thailan
d
Malays
iaChina
Indonesia
Mexico
Brazil
Dominica
n Rep
ublic
Honduras
Colombia
El Salv
ador
United Sta
tes
Latin
America
and
the C
aribbea
nAsia
FigurE 2.10 Energy Costs are High
Sources: World Bank LAC Regional Study on Energy Pricing (forthcoming). Data for El Salvador from CNE table 6, Q1 with information of SIGET bulletin 2013.
2.8 2.82.7 2.6 2.5
2
3
Worldaverage
Structuralpeers
average
Logistics performance index, 2012
LACaverage
ElSalvador
Lowermiddleincomeaverage
FigurE 2.11 inefficient Logistics is a Barrier to Exploit the Proximity to the uS
Source: World Bank.

38 Determinants of Economic Growth
to San Salvador than to many ports in Asia (see figure 2.12: It costs more to ship a con-tainer from Baltimore to San Salvador than to many Asian destinations). In part this is due to the lower volumes of shipping necessarily associated with a small market size but also reflects an overall limited efficiency of the sec-tor. Port reform is still pending and perfor-mance of the main port of Acajutla lags that of other ports in the region. For example, a recent econometric analysis of the techni-cal efficiency of ports in Latin America and the Caribbean ranks Acajutla 54th out of 67 ports analyzed, with an efficiency score of only 23 percent (where the efficient technical frontier is set 100) (Morales Sarriera et al. 2013).
Limited competition also affects transport and logistics costs. Carriers on many inter-national routes are organized into cartels—so-called liner conferences—that confer on shipping prices and market shares, with sig-nificant impact on trade volumes. A recent study finds that eliminating the ability of cargo carriers to price above marginal cost would boost trade volumes in Latin America by
15 percent (Hummels, Lugovsky, and Skiba 2009). However, inefficiencies in transport and logistics also play a role. In trucking, for example, border frictions, wait times, traffic congestion, high empty backhaul, informal payments, and crime and insecurity all con-tribute to raising costs of road freight substan-tially.6 Air transport also presents potential barriers to competition as regulations give room for incumbent airlines to influence new entry through a public consultation phase dur-ing the approval process of air traffic right applications.
Several markets in El Salvador are unusu-ally concentrated, even for a small economy, which is consistent with data on barriers to entry and rivalry.7 There is limited firm entry in El Salvador compared to other countries, (see figures 2.13 and 2.14 below) which may contribute to lower investment.8 The evidence suggests in fact a higher degree of market concentration in non-tradable industries in El Salvador than in most countries, ranking third out of 71 countries in terms of con-centration.9 Measures of product market reg-ulations also suggest that there is scope
0
5,000
10,000Price of shipping a 20-foot container, US dollars
Rome
Le Hav
re
Singapore
Shangh
ai
Tokyo
Buenos A
ires
Manila
Kota K
unabulu M
alays
ia
Labuan
port Mala
ysia
Multan, P
akist
an
Jakar
ta
Panam
a City
Cape T
own
Maputo
Santia
go
Guatem
ala C
ity
Mombas
a
Rio de Jan
eiro
Johan
nesburg
San Salv
ador
Lima
Dar es
Salaam
Puerto
Corte
s
FigurE 2.12 it Costs More to Ship a Container from Baltimore to San Salvador than to Many asian Destinations
Source: Quoted Prices from shipping-worldwide.com for 10 MT 20 foot container (39 cubic meters) valued as $20,000 (dry goods).
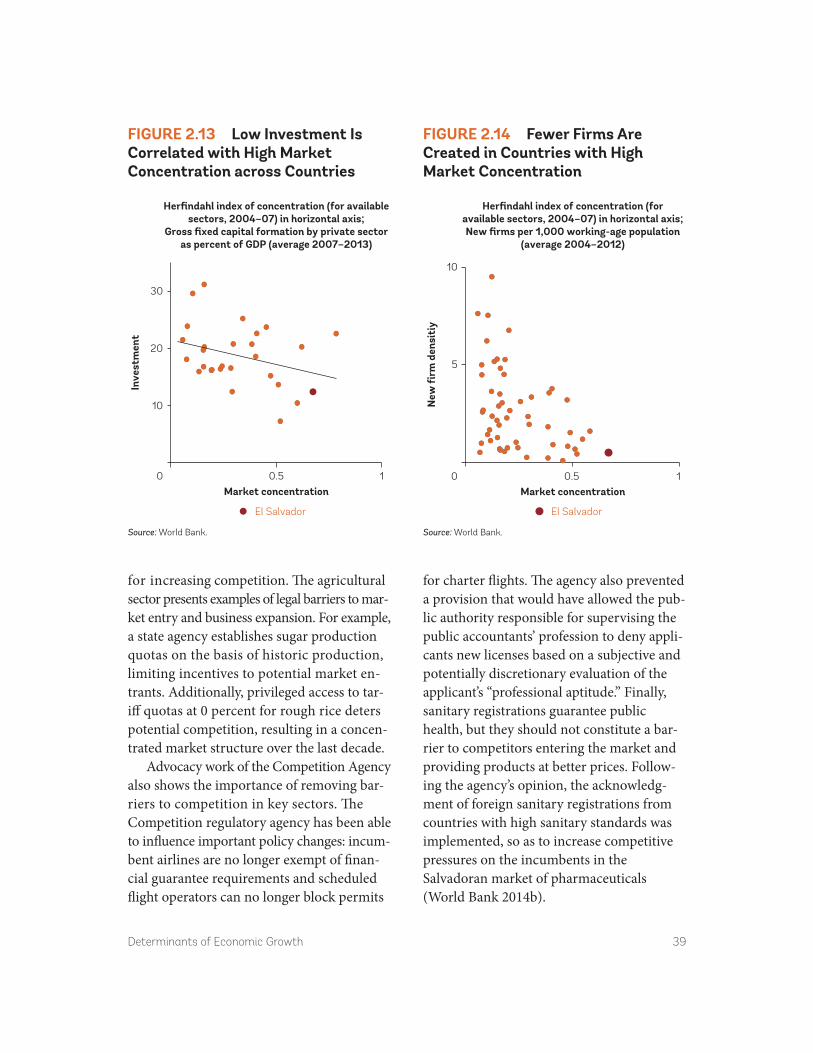
Determinants of Economic Growth 39
for increasing competition. The agricultural sector presents examples of legal barriers to mar-ket entry and business expansion. For example, a state agency establishes sugar production quotas on the basis of historic production, limiting incentives to potential market en-trants. Additionally, privileged access to tar-iff quotas at 0 percent for rough rice deters potential competition, resulting in a concen-trated market structure over the last decade.
Advocacy work of the Competition Agency also shows the importance of removing bar-riers to competition in key sectors. The Competition regulatory agency has been able to influ ence important policy changes: incum-bent airlines are no longer exempt of finan-cial guarantee requirements and scheduled flight operators can no longer block permits
for charter flights. The agency also prevented a provision that would have allowed the pub-lic authority responsible for supervising the public accountants’ profession to deny appli-cants new licenses based on a subjective and potentially discretionary evaluation of the applicant’s “professional aptitude.” Finally, sanitary registrations guarantee public health, but they should not constitute a bar-rier to competitors entering the market and providing products at better prices. Follow-ing the agency’s opinion, the acknowledg-ment of foreign sanitary registrations from countries with high sanitary standards was implemented, so as to increase competitive pressures on the incumbents in the Salvadoran market of pharmaceuticals (World Bank 2014b).
0
10
20
30
0.5 1
Inve
stm
ent
Market concentration
Herfindahl index of concentration (for availablesectors, 2004–07) in horizontal axis;
Gross fixed capital formation by private sectoras percent of GDP (average 2007–2013)
El Salvador
FigurE 2.13 Low investment is Correlated with High Market Concentration across Countries
Source: World Bank.
0
5
10
0.5 1
New
firm
den
siti
y
Market concentration
Herfindahl index of concentration (foravailable sectors, 2004–07) in horizontal axis;New firms per 1,000 working-age population
(average 2004–2012)
El Salvador
FigurE 2.14 Fewer Firms are Created in Countries with High Market Concentration
Source: World Bank.
40 Determinants of Economic Growth
Limited competition increases the prices of services on which industry relies and con-tributes to a stagnant productivity growth in services. There is also microeconomic evidence on the impact of limited competition on the prices of non-tradables. This is the case of trucking, discussed above, and where despite there being many trucking companies, the de-gree of competition varies by route because of domestic restraints on competition and the prohibition on international competition on national routes. Research shows that imperfect competition accounts for at least one-third of trucking prices on national routes (Osborne, Pachón, and Araya 2014). Combined with the macroeconomic level data this evidence sug-gests that El Salvador suffers from too little competition. Limited competition, together with regulatory issues, contributes to a stag-nant productivity of the services sector in
El Salvador, where output per worker remains effectively flat over the last decade (see figure 2.15). Since the structure of the economy has been moving away from manufacturing and towards services the type of structural trans-formation that has happened in El Salvador has decreased productivity.
Salvadoran firms are characterized by un-dertaking little innovation. A number of in-dicators point to a rather limited innovative activity. For example, according to the 2014–15 World Economic Forum Global Competi-tiveness Index, El Salvador was ranked 121 (out of 144 economies) based on patent ap-plications per capita. Given the low degree of competition observed in El Salvador a plau-sible hypothesis is that limited competition contributes to a lack of innovation, under-mines competitiveness and negatively impacts shared prosperity. An analysis of the factors
KNOWLEDgE gaP How Does Limited Domestic Competition affect Shared Prosperity?
Measures of product market regulations, data on firm creation, and available microeconomic studies such as the one on the trucking industry, air transport, electricity and agriculture sectors, all suggest some room for increasing competition in El Salvador. This may be one of the reasons behind limited innovation in the country, as illustrated for example by the fact that the percentage of firms introducing a new product in a given period is fewer in El Salvador than in the majority of countries for which this data is available (Lederman et al. 2014, 8). Limited competition is likely affecting innovation and the ability to enter export markets, undermining the growth potential and therefore job prospects. In addition, lim-ited competition may push domestic prices up and thus undermine welfare for the popu-lation as a whole, including the bottom 40 percent of the income distribution. For example, in 2008 the national Regulatory Agency for Competition detected a cartel agreement be-tween the most important wheat flour companies. This market-sharing agreement was particularly harmful for consumers as an average household in El Salvador spends 13 percent of its total consumption on bread. However, there is limited evidence that documents sys-tematically how competition conditions affect in practice shared prosperity.
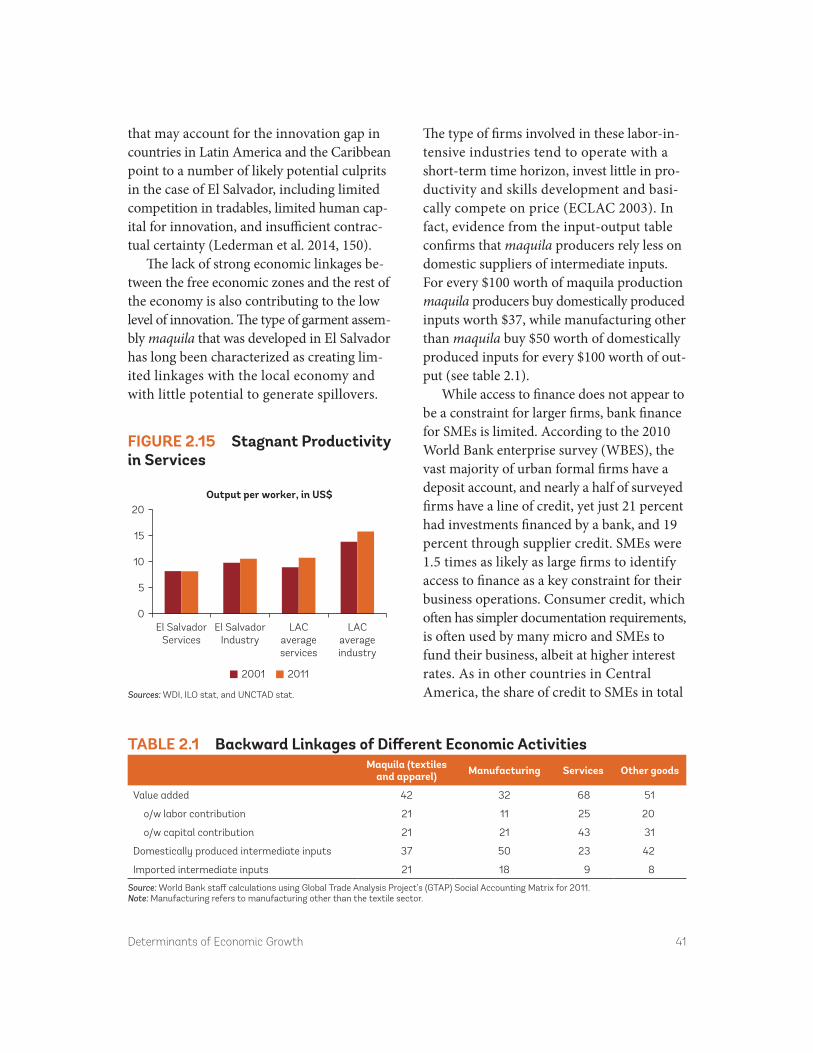
Determinants of Economic Growth 41
that may account for the innovation gap in countries in Latin America and the Caribbean point to a number of likely potential culprits in the case of El Salvador, including limited competition in tradables, limited human cap-ital for innovation, and insufficient contrac-tual certainty (Lederman et al. 2014, 150).
The lack of strong economic linkages be-tween the free economic zones and the rest of the economy is also contributing to the low level of innovation. The type of garment assem-bly maquila that was developed in El Salvador has long been characterized as creating lim-ited linkages with the local economy and with little potential to generate spillovers.
The type of firms involved in these labor-in-tensive industries tend to operate with a short-term time horizon, invest little in pro-ductivity and skills development and basi-cally compete on price (ECLAC 2003). In fact, evidence from the input-output table confirms that maquila producers rely less on domestic suppliers of intermediate inputs. For every $100 worth of maquila production maquila producers buy domestically produced inputs worth $37, while manufacturing other than maquila buy $50 worth of domestically produced inputs for every $100 worth of out-put (see table 2.1).
While access to finance does not appear to be a constraint for larger firms, bank finance for SMEs is limited. According to the 2010 World Bank enterprise survey (WBES), the vast majority of urban formal firms have a deposit account, and nearly a half of surveyed firms have a line of credit, yet just 21 percent had investments financed by a bank, and 19 percent through supplier credit. SMEs were 1.5 times as likely as large firms to identify access to finance as a key constraint for their business operations. Consumer credit, which often has simpler documentation requirements, is often used by many micro and SMEs to fund their business, albeit at higher interest rates. As in other countries in Central America, the share of credit to SMEs in total
0
5
10
15
20
El SalvadorServices
El SalvadorIndustry
Output per worker, in US$
LACaverageservices
LACaverageindustry
2001 2011
FigurE 2.15 Stagnant Productivity in Services
Sources: WDI, ILO stat, and UNCTAD stat.
TaBLE 2.1 Backward Linkages of Different Economic activitiesMaquila (textiles
and apparel) Manufacturing Services Other goods
Value added 42 32 68 51
o/w labor contribution 21 11 25 20
o/w capital contribution 21 21 43 31
Domestically produced intermediate inputs 37 50 23 42
Imported intermediate inputs 21 18 9 8
Source: World Bank staff calculations using Global Trade Analysis Project’s (GTAP) Social Accounting Matrix for 2011.Note: Manufacturing refers to manufacturing other than the textile sector.
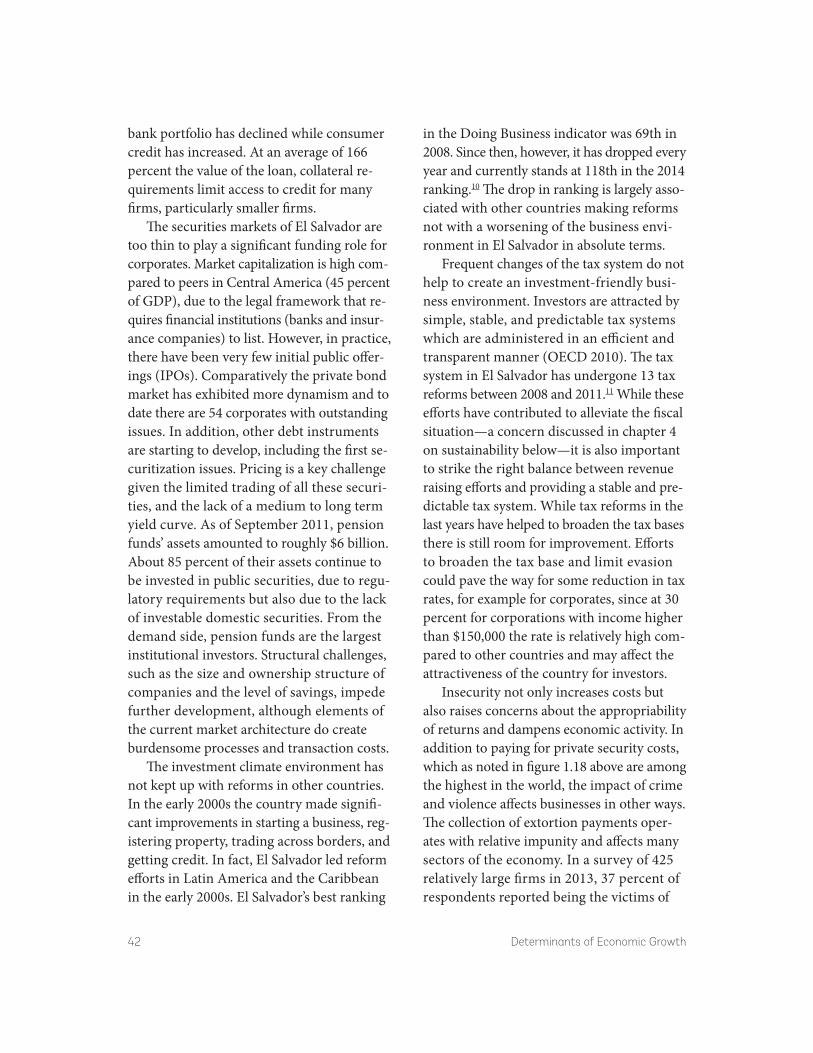
42 Determinants of Economic Growth
bank portfolio has declined while consumer credit has increased. At an average of 166 percent the value of the loan, collateral re-quirements limit access to credit for many firms, particularly smaller firms.
The securities markets of El Salvador are too thin to play a significant funding role for corporates. Market capitalization is high com-pared to peers in Central America (45 percent of GDP), due to the legal framework that re-quires financial institutions (banks and insur-ance companies) to list. However, in practice, there have been very few initial public offer-ings (IPOs). Comparatively the private bond market has exhibited more dynamism and to date there are 54 corporates with outstanding issues. In addition, other debt instruments are starting to develop, including the first se-curitization issues. Pricing is a key challenge given the limited trading of all these securi-ties, and the lack of a medium to long term yield curve. As of September 2011, pension funds’ assets amounted to roughly $6 billion. About 85 percent of their assets continue to be invested in public securities, due to regu-latory requirements but also due to the lack of investable domestic securities. From the demand side, pension funds are the largest institutional investors. Structural challenges, such as the size and ownership structure of companies and the level of savings, impede further development, although elements of the current market architecture do create burdensome processes and transaction costs.
The investment climate environment has not kept up with reforms in other countries. In the early 2000s the country made signifi-cant improvements in starting a business, reg-istering property, trading across borders, and getting credit. In fact, El Salvador led reform efforts in Latin America and the Caribbean in the early 2000s. El Salvador’s best ranking
in the Doing Business indicator was 69th in 2008. Since then, however, it has dropped every year and currently stands at 118th in the 2014 ranking.10 The drop in ranking is largely asso-ciated with other countries making reforms not with a worsening of the business envi-ronment in El Salvador in absolute terms.
Frequent changes of the tax system do not help to create an investment-friendly busi-ness environment. Investors are attracted by simple, stable, and predictable tax systems which are administered in an efficient and transparent manner (OECD 2010). The tax system in El Salvador has undergone 13 tax reforms between 2008 and 2011.11 While these efforts have contributed to alleviate the fiscal situation—a concern discussed in chapter 4 on sustainability below—it is also important to strike the right balance between revenue raising efforts and providing a stable and pre-dictable tax system. While tax reforms in the last years have helped to broaden the tax bases there is still room for improvement. Efforts to broaden the tax base and limit evasion could pave the way for some reduction in tax rates, for example for corporates, since at 30 percent for corporations with income higher than $150,000 the rate is relatively high com-pared to other countries and may affect the attractiveness of the country for investors.
Insecurity not only increases costs but also raises concerns about the appropriability of returns and dampens economic activity. In addition to paying for private security costs, which as noted in figure 1.18 above are among the highest in the world, the impact of crime and violence affects businesses in other ways. The collection of extortion payments oper-ates with relative impunity and affects many sectors of the economy. In a survey of 425 relatively large firms in 2013, 37 percent of respondents reported being the victims of

Determinants of Economic Growth 43
extortions (Encuesta de Competitividad Empre-sarial). Smaller businesses located in more marginal areas are particularly affected by this problem and suffer extortion rates that can be up to 50 percent of their revenue.
Some businesses are simply exiting the marketplace in fear of crime. There is increas-ing survey evidence that fear of crime, and in particular extortions, prompts some businesses to exit from the marketplace altogether (see also figure 1.19 above). The issue of security is a concern not only for employers but also for workers and consumers. Over 40 percent of the population reports having changed their shopping and recreation habits in fear of crime and over 5 percent changed jobs due to fears of crime (LAPOP 2012). Among busi-nesses surveyed by the Encuesta de Competi-tividad Empresarial 25 percent reported having cut investment plans. Among the population as a whole, security is identified by 65 percent of Salvadorans as the most important prob-lem facing the country (LAPOP 2014).
Concerns about the appropriability of re-turns to investment are also fueled by lack of trust in the government and a perception of instability. Despite having had peaceful demo-cratic transitions of power since the peace agreements of 1992, political instability is still ranked fourth among the obstacles mentioned by firms in the latest Enterprise Survey. Trust in state institutions is also undermined by insecurity.12 Rule of law indicators have not significantly improved over the last two de-cades according to the Worldwide Governance Indicators. Trust in the legislative and politi-cal parties is among the lowest of all institu-tions in the country. El Salvador ranks 135th (out of 144 countries) in public trust in poli-ticians (2012–13 Global Competitiveness Re-port). Surveys often highlight fears of policy instability among the highest concerns of the
private sector. In this regard, it is important to stress that actual policy changes have been relatively modest. Yet despite having had pol-icy stability perceptions of instability remain.
A highly polarized political climate in Con-gress likely contributes to the perception of instability. More than two decades after the end of the civil war political polarization remains high. The traditional two parties, ARENA and FMLN, remain seen as ideolog-ically opposed to each other as in the past. In fact, the self-assessed ideological differences between the two parties the Salvadoran par-liament suggest that it is the most polarized in Latin America (see figure 2.16).
The polarization in Congress reflects to some extent that of the society at large. El Salvador is in fact a society where relatively few people declare themselves to be in the political center. As shown in figure 2.17 below, the percentage of Salvadorans that declare themselves to be from the extreme right and
0
5
10
Ideological difference between the two largestparliamentary parties, as per self-evaluation of
surveyed parliamentarians
El Salv
ador
BoliviaPer
u
Nicara
guaChile
Costa R
ica
Ecuad
or
Urugu
ay
Guatem
ala
Mexico
Panam
a
Colombia
HondurasBra
zil
Dominica
n Rep
ublic
Parag
uay
Argen
tina
FigurE 2.16 The Salvadoran Parliament is the Most Polarized in Latin america
Source: World Bank staff calculations based on surveys of Programa de Élites Latinoamericanas of University of Salamanca.

44 Determinants of Economic Growth
the extreme left are relatively high, forming a W-shape of political leanings among the population which contrasts with the patterns observed in other countries where the center is the preferred option of a significant portion of the population and extreme positions are a minority. Overall, political polarization
makes it difficult to reach consensus even on policies that would appear to be relatively un-controversial and makes governing a chal-lenging task.
In addition to the above discussion, to iden-tify the key constraints to unlock economic growth in El Salvador is also helpful to review
KNOWLEDgE gaP The Paradox of a Widespread Perception of Corruption but Low Bribe Payments
The data collected through various sources (Latino Barometer, Latin American Public Opin-ion Poll, Worldwide Governance Indicators, Enterprise Surveys) report widespread cor-ruption (by citizens and businesses). For example, 87 percent of respondents feel the police is corrupt or extremely corrupt and 81 percent feel the judiciary is corrupt or extremely (Transparency International’s 2013 Global Corruption Barometer for El Salvador). Accord-ing to the Enterprise Surveys 60 percent of Salvadoran firms consider corruption as a major constraint in doing business, compared to 40 percent on average in Latin America. How-ever the actual percentage of respondents reporting to pay a bribe is about 11 percent—a low number and in contradiction with the widespread perception of corruption. A few factors could help explain this apparent contradiction in the data:
1. Respondents may be reticent to admit to have paid a bribe (a well-known phenomenon recently studied by Kraay and Murrell 2013);
2. An open and lively press may influence respondents and bias them toward believing that corruption is more widespread and common than what it is in reality;
3. Bribe payment is only one form of corruption and this may not be the most common and/or threatening to the country. Other forms may be more common (like nepotism or corruption in public procurement or elite capture) that have not been captured in the existing surveys
To reconcile this apparent contradiction it would be important to gather additional data on different types of corruption present in the country. The data collection should be de-tailed and rich enough to explore whether firms of different size and/or located in differ-ent provinces and/or working in different sectors are more or less affected by different types of corruption. This exercise could help understand the most significant challenges faced by firms and identify clear policy measures to address them. It would also help bet-ter understand the extent and the mechanisms through elite capture by a small group of vested interests may be operating in the country.

Determinants of Economic Growth 45
a variety of comparative studies available in the literature that can inform the identifica-tion of the areas that could have held growth back and could therefore have the highest impact on growth methods. Thus, prior to identifying the key priority areas for boosting growth we also review, in turn cross-country benchmarking, and micro and perception data.
Cross-country benchmarkingCross-country regressions have been com-monly used to identify the determinants of growth. Growth regressions are used to iden-tify which of a large number of factors are statistically and economically significant de-terminants of growth rates. Cross-country growth regressions provide a useful input for the analysis. Of particular interest are studies that not only estimate the determinants of growth but also benchmark the performance of individual countries in Latin America for each of the explanatory variables. In this regard,
two sources are particularly useful. The first one is a study of economic growth in LAC by Loayza et al. (2005). The second one is a forthcoming LAC regional study by Araujo et al. (2014) which updates and builds on the work by Loayza et al. (2005) and increases the sample in terms of country coverage and time period.
In a first step, these analyses estimate the impact of the explanatory variables on eco-nomic growth in a large panel of countries, taking into account potential biases. The ana-lyzed explanatory factors include: transitional convergence (initial GDP), cyclical rever-sion (initial output gap), structural policies in areas such as education, financial depth or public infrastructure, and stability policies, such as lack of price stability or cyclical vol-atility. In both cases, the impact of these fac-tors on economic growth is analyzed relying on system General method of moments (GMM) estimation, an econometric estimation tech-nique that takes into account unobserved country-specific effects and joint endoge-neity of the explanatory variables (growth drivers) with the dependent variable (eco-nomic growth) in a dynamic model of panel data. Loayza et al. (2005) uses an unbalanced panel of 78 countries with non-overlapping five-year observations that span the period from 1961 to 1999. Araujo et al. (2014) ex-pands the sample to 126 countries using five-year non-overlapping panel data from 1970 to 2010.
The estimation results can give a sense of the relative importance of the factors behind growth; however, important limitations of the approach have to be taken into account. First, as for any econometric estimation, the results may be biased due to omitted variables; second, instruments used for the GMM esti-mation may be mis-specified; and third, the
0
10
20
30
40
Left Center Right
El Salvador
On a scale of left to right from 1 to 10 where doyou consider yourself politically? Percentrespondents in population at each point
0
10
20
30
40
Left Center Right
Costa Rica
FigurE 2.17 Salvadoran Society is also Polarized, with a Shallow Political Center
Source: World Bank staff calculations based on LAPOP.

46 Determinants of Economic Growth
proxies for the explanatory factors may not adequately capture the actual concept that is being analyzed. Given these limitations, the results from the econometric analysis are cross- checked with additional analyses and country-specific knowledge to form a plausi-ble overall picture.
In a second step, a benchmark exercise explores the growth that a country could have achieved if it were a top performer in terms of each of the explanatory variables. This type of counterfactual exercise highlights the areas with the largest impact on per capita income for a given country. This is the approach fol-lowed by both Loayza et al. (2005) and Araujo et al. (2014), although with slightly different specifications. The scenarios studied in Loayza et al. (2005) correspond to a hypothetical situation in which the determinants of growth in each country would improve to be on par with the top 25 percent of the countries. In Araujo et al. (2014), one of the scenarios considered corresponds to an improvement in the determinants of growth to the 90th percentile of LAC. This helps determine the possible effects that a stellar performance (relative to the rest of LAC) in specific policy-sensitive areas might have had for a country’s level of GDP per capita. In addition, Araujo et al. (2014) consider what would be the impact on GDP per capita if the determinants of growth were to improve to the average levels observed in OECD countries.
The analysis by Loayza et al. (2005) sug-gests that education, infrastructure, and the government burden have the largest impact on growth in El Salvador. Improving educa-tion performance to the top 25 percent of Latin American countries is estimated that it could contribute an additional 1 percentage point to GDP growth while bringing infra-structure to that level would add 0.4 percent-age points of GDP. In contrast, stabilization policies, financial depth and external condi-tions would have a much smaller impact.13
The analysis by Araujo et al. (2014) sug-gests that growth would pick up most from reforms to enhance El Salvador’s openness, infrastructure, financial depth, and educa-tion. The finding that greater openness could lead to higher growth, in turn driven by El Salvador’s underperformance in exports, is consistent with the analysis on the loss of competitiveness presented above. As in the case of Loayza et al. (2005), there is no sig-nificant impact on growth from an improve-ment in variables related to macroeconomic stabilization, reflecting the fact that El Salva-dor has already achieved a high degree of macroeconomic stability.
Perception dataMicroeconomic survey data can provide fur-ther insights into the key constraints to growth. Data collected through the WBES in particu-lar provides a wealth of information about
TaBLE 2.2 Top Obstacles to growth (as reported by Firms)2006 2010
Top five concerns of firms • Crime, theft and disorder• Practices of the informal sector• Corruption• Access to finance• Electricity
• Practices of the informal sector• Crime, theft, and disorder• Access to finance• Political instability• Inadequately educated workforce
Source: World Bank Enterprise Surveys.

Determinants of Economic Growth 47
the experience of firms and what may prevent them from growing. The Enterprise Surveys, two of which were conducted for El Salvador (2006 and 2010), provide useful data on the perceptions of firms about what they experi-ence as key constraints to growth. Perception data from the WBES suggest a number of areas that are to some extent aligned with the results of the cross-country benchmarking (see table 2.2). This is particularly the case for the lack of an adequately educated workforce (education in the cross-country bench marking) and electricity (infrastructure in the cross- country benchmarking).
Firm-level econometric analysisBut Enterprise Surveys provide much more than just perception data. A second type of data collected in these surveys is objective in nature. Importantly, this data relates to both firm performance (e.g., sales, employment, and productivity) and investment climate con-straints (e.g., how much does a firm pay in bribes, as opposed to the perception of a given respondent on the extent of corrup-tion). The availability of these objective mea-sures help nuance some of the findings. For
example, in the case of corruption—one of the top two obstacles–the 2010 Enterprise Survey shows that the percentage of firms who pay bribes is relatively small.
The econometric analysis of firm-level data helps to shed light on the areas that would have most impact on growth. Because of the availability of objective measures of firm performance and of the seriousness of investment climate constraints, it is possible to estimate econometrically the relationship between investment climate characteristics and firm productivity. This is the exercise that Fajnzylber and Lopez (2008) undertake using a pooled sample of more than 10,000 firms from across Latin America. Similar ca-veats apply as mentioned for the economet-ric analysis of the benchmarking part of the analysis.
Results from the micro-econometric anal-ysis suggest that regulatory compliance, se-curity, crime, and bribes are the areas that would have the most impact. Regulatory com-pliance captures the effect of regulation and institutional quality and is proxied by three variables that are likely to be a reflection of excessive or arbitrarily enforcement of regu-lations.
TaBLE 2.3 Emerging Focus areas to Boost growthCross-country benchmarking Micro survey data
Emerging focus areasLoayza et al.
(2005)araujo et al.
(2014)
2006 Enterprise
survey
2010 Enterprise
Survey
Micro-econometric
analysis
Areas that would have the most impact
EducationInfrastructure Government burden
Openness InfrastructureFinanceEducation
CrimeInformalityCorruptionFinanceElectricity
InformalityCrimeFinancePolitical instabilityEducation
Regulatory compliance SecurityCrimeBribes
CrimeEducationFinanceInfrastructureGovernance (capturing regulatory compliance, informality, political instability, and openness)

48 Determinants of Economic Growth
Emerging focus areas from the comparative studiesDifferent sources suggest a broad range of areas that have undermined growth, includ-ing education, crime and violence, access to finance, infrastructure, and state capacity or regulatory compliance (see table 2.3). The cross-country benchmarking exercise con-cluded that improvements would mainly come from education, infrastructure, as well as structural reforms that could result into greater exports and trade openness. The analysis of microeconomic survey data high-lighted crime and violence and regulatory compliance. Some issues such as crime, edu-cation, and access to finance were raised in most of the analyses. There were however, a number of factors that were raised in some but not all analyses, perhaps due to the use of different methodologies and definitions.
Identifying Policy Areas to Increase GrowthTaking all the analyses reviewed above, including the country-specific discussion as well as the review of the comparative studies, helps us to identify the following broad areas that could have the most impact on growth:
Reducing crime and violence—which can help alleviate a vicious circle between violence, high costs, low productivity and low invest-ment, and low growth. A strategy to reduce crime and violence is necessarily long-term and must target an enhanced accountabil-ity of government, greater transparency of the public actions to contain impunity and the strengthening of the judicial system. On the one hand it is critical to increase the costs to individuals from undertaking criminal activities. On the other hand it is
essential to increase the benefits to them from engaging in productive activities. In the short to medium term, there are entry points around creating income and learning opportunities to steer the youth away from joining criminal organizations, providing in-centives and skills for gang members to exit, and working with imprisoned populations to facilitate reinsertion into society.
Education: quality and access—This can boost skills and enhance competitiveness and ultimately growth. While the issue of ed-ucation will be discussed in greater detail in the chapter on inclusion below, it is impor-tant to stress at this point that higher learn-ing outcomes would better equip the youth for the acquisition of skills necessary in the domestic market or in the markets where people migrate. The low retention rates at the secondary level is an issue where El Salvador stands out as having very low completion rates (see figure 2.18). The education entry points and long-term objectives have been amply studied and discussed. They include pre-school education, improving teacher skills and capacity, measuring outcomes,
61 52 5140 32
0
20
40
60
Structuralpeers
average
Worldaverage
Share of 25–29 year olds with completedsecondary education or higher, percent, 2010
LACaverage
ElSalvador
Lowermiddleincomeaverage
FigurE 2.18 Secondary School Completion is Very Low
Source: World Bank.

Determinants of Economic Growth 49
introducing IT and English language, and tailoring and expanding the existing voca-tional and training institutions to respond to the needs of the market. The diaspora could also provide trained personnel that fits the needs of the market—e.g., language skills.
Addressing financial inclusion can help break the vicious circle of low growth, and low savings and investment. Although interest rates are low, access to credit by small and medium enterprises is constrained, limiting the expansion of these employment-inten-sive sectors. The low level of use of banking services by the population makes savings difficult. Fourth, El Salvador is one of the countries in the region with less knowl-edge-intensive business services (technical and quality services, research and develop-ment activities, and professional services). Improvements in this area will also help Salvadoran entrepreneurs move away from business models that rely on low-cost compe-tition to those that rely on more innovation and productivity increases, as well as attract-ing foreign firms interested in pursuing higher value added activities.
Improving the availability of productive services, including energy, connectivity, and knowledge-intensive services would help im-prove competitiveness and boost growth. El Salvador’s infrastructure stock compares rel-atively well in some key indicators such as access to electricity, telecom access or the share of paved roads (see table B.3). However, the
challenge is often with regard to the cost of the services. First, in electricity the challenge is to reduce costs over the long haul and to diversify supply to reduce vulnerability. Local technology is available to increase geother-mal supply, there is considerable potential for wind power, and installations that manage liquefied natural gas can help reduce the cost of energy. Second, regarding connectivity, the bases are in place to generate rapid gains. The expansion of the airport in San Salvador will ease the pressure that has been building as demand is outstripping capacity. Greater competition in cargo transportation by road can reduce costs. Improvements in customs are needed to facilitate trade within the Cen-tral American market. Third, improving access to information technology infrastructure, such as broadband, could help make the most of the strong links that El Salvador has with large markets such as the US.
Forging a political consensus to build a transparent and effective state would help across a number of areas. The limited capac-ity of the state stands as a major constraint to growth, employment and poverty reduction. Inadequate institutional designs favor opaque practices that hide objectives, designs and outcomes. The lack of transparency limits ef-ficiency and prevents the dialogue and anal-ysis to improve them. Bringing about desired institutional transformations will take time, but immediate actions in selected areas may help trigger the process of reform.
Notes 1. In 2005 the US accounted for 84 percent of
all maquila exports and 90 percent of maquila exports to the US were of textile products. Before 2004 data on maquila exports was not disaggregated by country of export or product.
2. Two destination markets account for 90 percent of exports and only 15 firms generate 37 percent of exports (Berti 2014). The origin of exports is also concentrated (see appendix). The Herfindahl index of exports in 2009–11 was 0.05, lower than the averages for LAC,
50 Determinants of Economic Growth
lower middle income countries, and the world (0.17, 0.23, and 0.21 respectively) but higher than the average for the structural peers (0.04)
3. El Salvador Investment Reform Memorandum (World Bank 2015b).
4. Hausmann and Rodrik (2005, 69) noted that “Low investment, associated with low per-ceived returns to capital, is therefore both a cause and a symptom of the economic chal-lenge that confronts El Salvador.”
5. The disappointing lack of investment in elec-tricity generation was already discussed in the World Bank’s 2005 Investment Climate Assessment which noted the high degree of uncertainty regarding the expected returns of investment. The reason was that remuner-ation of generators was based exclusively on the basis of the spot price for energy, provid-ing a return on invested capital of marginal producers only sporadically when prices are high due to limited supplies from hydro resources.
6. Road freight prices are particularly high at 26 cents per ton-kilometer on national routes and 13.5 cents internationally, rates that stand out even relative to other inefficient markets (Osborne, Pachón, and Araya 2014).
7. Although there is no empirical evidence on the effect of the size of the economy on trade and competition policy, theory suggests that when trade barriers are lifted, competition policy plays an important role in facilitating trade by tackling anti-competitive behavior that hin-ders entry of foreign importers and export of products from within national boundaries Gal (2009).
8. Evidence from OECD countries shows that regulatory reform of product markets is as-sociated with an increase in investment, with entry liberalization playing a particularly im-portant role (Alesina et al. 2005).
9. The concentration is not only higher than in other countries but also higher than a “bench-mark” estimate derived from a regression analysis to control for a number of variables that could potentially influence the market concentration index that one would normally expect in a given country (Lederman et al. 2014, 17).
10. The rankings of a given year are not strictly comparable with previous years due to changes in the methodology over time (which could imply revisions to the rankings of previous years) and to slight changes in the number of countries covered.
11. The changes were of four types: (a) creation of new taxes on specific goods, (b) increases of income tax rates, (c) expansion of the tax base (elimination of some VAT and personal income tax exemptions), and (d) strengthen-ing of tax and customs administration. The tax system has four main taxes and contribu-tions: taxes on real estate transfers, VAT, spe-cial taxes on consumption to be discouraged, and income taxes. Although dominated by VAT, a recent study by FUNDE shows that the tax system in El Salvador is neutral or slightly progressive following the changes in the tax system in 2009 (FUNDE 2013).
12. Political system support is negatively correlated with being a victim of a crime or corruption, as well as with higher education (LAPOP 2012).
13. As is common in the literature, both Loayza et al. (2005) and Araujo et al. (2014) classify the determinants of growth in different categories, including structural factors—such as human capital or infrastructure—and those determi-nants of growth that are related to stabilization policies—such as inflation. Similar results to Loayza et al. (2005) are found by Swiston and Barrot (2011), whose results suggest that in-vestment and education would have the great-est impact on growth.
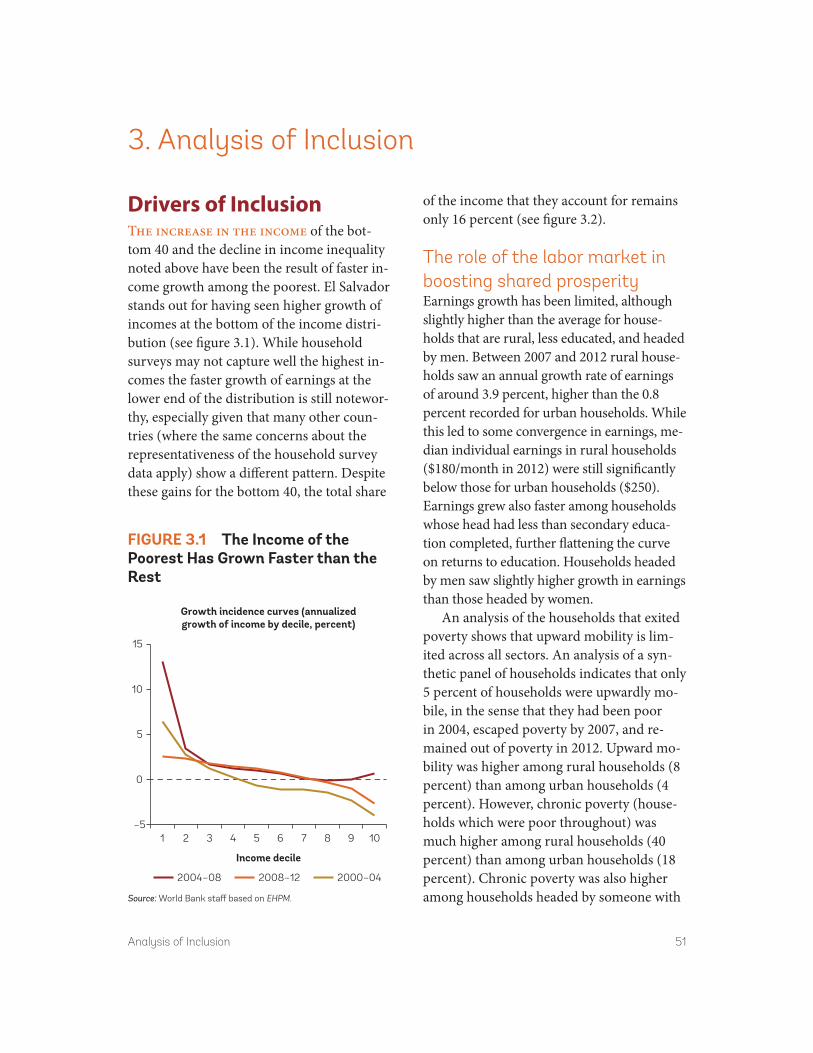
Analysis of Inclusion 51
Drivers of InclusionThe increase in the income of the bot-tom 40 and the decline in income inequality noted above have been the result of faster in-come growth among the poorest. El Salvador stands out for having seen higher growth of incomes at the bottom of the income distri-bution (see figure 3.1). While household surveys may not capture well the highest in-comes the faster growth of earnings at the lower end of the distribution is still notewor-thy, especially given that many other coun-tries (where the same concerns about the representativeness of the household survey data apply) show a different pattern. Despite these gains for the bottom 40, the total share
of the income that they account for remains only 16 percent (see figure 3.2).
The role of the labor market in boosting shared prosperityEarnings growth has been limited, although slightly higher than the average for house-holds that are rural, less educated, and headed by men. Between 2007 and 2012 rural house-holds saw an annual growth rate of earnings of around 3.9 percent, higher than the 0.8 percent recorded for urban households. While this led to some convergence in earnings, me-dian individual earnings in rural households ($180/month in 2012) were still significantly below those for urban households ($250). Earnings grew also faster among households whose head had less than secondary educa-tion completed, further flattening the curve on returns to education. Households headed by men saw slightly higher growth in earnings than those headed by women.
An analysis of the households that exited poverty shows that upward mobility is lim-ited across all sectors. An analysis of a syn-thetic panel of households indicates that only 5 percent of households were upwardly mo-bile, in the sense that they had been poor in 2004, escaped poverty by 2007, and re-mained out of poverty in 2012. Upward mo-bility was higher among rural households (8 percent) than among urban households (4 percent). However, chronic poverty (house-holds which were poor throughout) was much higher among rural households (40 percent) than among urban households (18 percent). Chronic poverty was also higher among households headed by someone with
3. Analysis of Inclusion
FigurE 3.1 The income of the Poorest Has grown Faster than the rest
Source: World Bank staff based on EHPM.
–5
0
5
10
15
1 2 3 4 5 6 7 8 9 10
Income decile
Growth incidence curves (annualizedgrowth of income by decile, percent)
2004–08 2008–12 2000–04

52 Analysis of Inclusion
only primary education and those employed in agriculture, and slightly higher among male-headed households.
Upward mobility required large increases in income but small negative income shocks were enough to push people back into pov-erty. Moving out of poverty was associated with substantial income growth—from 28 to 45 percent, depending on location. In con-trast, a much smaller fall in income, around 10 percent, was enough to push a household into poverty. Households in and out of pov-erty experienced substantial income growth but the level of income growth was not enough to lift them out of poverty. As shown in fig-ure 3.4 those that escaped poverty were in almost all cases from the second quintile, in-dicating that poverty depth among those in
the lowest quintile is a particular challenge. More broadly, the asymmetry of mobility and income growth also highlights the im-portance of the challenge of vulnerability.
Unemployment is more frequent among the poor. With open unemployment hovering around 6 percent one of the main concerns regarding the labor market in the country is underemployment. Still, unemployment is a particular challenge for the poor and espe-cially for the extreme poor. The latter suffer an unemployment rate that is twice the national average (see figure 3.5). Male unem-ployment rate, at around 7 per cent, is signifi-cantly higher than female (4 percent). Rural and urban unemployment rates are broadly similar and depending on the year it varies on which one is slightly higher than the other.
FigurE 3.2 Still, the Bottom 40 account for Only 16 Percent of Total income
Source: World Bank staff based on EHPM.
2
Cum
ulat
ive
inco
me
(%)
Perc
ent
of t
he t
otal
inco
me
0
20
40
60
80
100
12.9
54.6
92.0
5 11 14 17 20 23 26 29 32 37 40 43 46 49 52 55
Cumulative income by percentile
58 61
64 67
70 73 76 79 84 87
90 93 96
1
0
5
10
158
Poor Vulnerable Middle class Rich

Analysis of Inclusion 53
FigurE 3.3 The growth in Earnings Has Been Faster for the Poor, rural, and Less Educated
Source: World Bank, Central Bank of El Salvador, and US Bureau of Labor Statistics.
2.8
Total
Male
Female
Urban
Rural
No form
al ed
uction
Primar
y inco
mplet
ed
Primar
y com
pleted
Secondar
y com
pleted
Postse
condar
y inco
mplet
ed
Postse
condar
y com
pleted
Non poorPoor
Lowest q
uintile
Highest q
uintile2 3 4
Secondar
y inco
mplet
ed
2.9 2.3
0.8
3.9
1.5
3.8 2.7
3.9
–
(0.5)
0.1
0.5 2.9
4.0 3.3
4.2
2.3
1.0
–2
0
2
4
6
8
10
0
200
400
600
2007 2012 Annual growth rate (percent, right axis)
Median individual earnings in 2007 and 2012 (US$) and annual growth rate (percent)
FigurE 3.4 upward Mobility is Limited across all Sectors of the Economy
Source: World Bank staff calculations with data from SEDLAC.Note: Lower bound estimates using synthetic panels constructed as in Dang et al. (2011). Chronic refers to households who were poor in all three periods (income below US$ 4 a day per person PPP). Upward refers to households poor in 2004 but not-poor in both 2007 and 2012. Downward refers to households non-poor in 2004 but poor in the following two periods. Vulnerable are those that have moved into and out of poverty. Non-vulnerable those who have been non-poor throughout. Education, sector and gender variables refer to the characteristics of the head of household in 2004.
0
20
40
60
80
100
NATIONALUrb
anRur
alEd
ucat
ion:
Prim
ary
Educ
atio
n: S
econ
dary
Educ
atio
n: T
ertia
ry
Agric
Man
ufCon
stru
ctRet
ailSe
rvice
sOth
erHea
d fe
male
Head
male
Quint
ile 1
Quint
ile 2
Quint
ile 3
Quint
ile 4
Quint
ile 5
Vulnerable Non-vulnerable Upward Downward Chronic
Intra-generational mobility, 2004–2007–2012
Perc
ent
of h
ouse
hold
s

54 Analysis of Inclusion
Returning to the issue of underemployment, one of the main challenges is the high degree of informality, with over half of the urban working population being informal.
Job growth has taken place in relatively low wage sectors. Employment has grown at around 1 percent p.a. since 2000, in line with what one could expect given the low economic growth. Median earnings have in-creased little (up from $216/month in 2007 to $228/month in 2012) and job growth has taken place in relatively low wage sectors. Job growth has taken place mainly in the ter-tiary sector, where labor productivity is de-clining (see figure 3.6 below).1 In the last decade the sector that increased employment the most was retail and hospitality, which created over 110,000 additional jobs. Since the 2008 crisis employment in agriculture
has rebounded, although it is still far from its levels in previous decades and remains, like retail, a low wage sector. Among higher wage sectors only financial services in the private sector and the public administration added more than 40,000 jobs in the last decade.
Jobs in retail and hospitality and agricul-ture are often unable to lift workers out of poverty due to the low earnings associated with those jobs. While since 2002 job growth has taken place mainly in retail and hospital-ity and in agriculture the low wages typically earned in those sectors make it difficult to escape poverty by working in them. An anal-ysis of the sector of employment of upwardly mobile households and those that remained chronically poor shows that retail and hospi-tality and agriculture are the two sectors of employment which are more represented
FigurE 3.5 unemployment is More Frequent among the Poor
Source: DIGESTYC.Note: All definitions are official.
0
5
10
15
Perc
ent
20
2000 2003 2006
Share of active labor force unemployed
2009 2012
Extreme poor Poor Total
FigurE 3.6 Since 2002 retail & Hospitality and agriculture account for Half of all Jobs Created
Sources: World Bank (Social Sector Expenditure and Institutional Review, forthcoming) and Central Bank of El Salvador.
0
20
40
60
80
100
Number of jobs created from 2002 to 2012
Perc
ent
Retail and hospitality
ManufacturingMining
HealthcarePublic administration Financial servicesAgriculture
ConstructionTransport and communicationDomestic service

Analysis of Inclusion 55
among the chronically poor than among the upwardly mobile (see figure 3.8). The sec-tors which account for a significantly higher share among the upwardly mobile than among the chronic poor are construction and manufacturing. Unfortunately, as seen above, those two sectors have seen almost no job growth since 2002.
The role of transfers in boosting shared prosperityRemittances remain an important source of income for many households, including the bottom 40. As discussed above, after labor income, remittances are the second most im-portant contributor to the reduction of pov-erty and inequality, with public transfers a distant third. An analysis of the incidence of remittances by income decile and over time, see figures 3.9–3.12 below, suggest the following stylized facts. First, remittances
FigurE 3.7 Most Jobs Have Been Created in Low Wage Sectors
Sources: World Bank (Social Sector Expenditure and Institutional Review, forthcoming) and Central Bank of El Salvador.
0
100
200
300
400
500
–20 30 80 130 180
Med
ian
earn
ings
Jobs created since 2002 (in thousands)
Median earnings and employmentchange by sector
Agriculture
Retail &hospitality
Financialservices
Public administration
FigurE 3.8 Jobs in retail and Hospitality and agriculture are Often unable to Lift Workers from Being Chronically Poor
Source: World Bank staff calculations with data from SEDLAC (CEDLAS and The World Bank).
43
15
21
129
31
12
27
16 14
0
10
20
30
40
Agriculture Retail and hospitality Other services
Share of households by sector of employment of the head of household among the chronicallypoor and among the upwardly mobile
Manufacturing Construction
Share in chronic poor Share in upwardly mobile

56 Analysis of Inclusion
FigurE 3.9 a Higher Share of richer Households receive remittances
Source: World Bank staff calculations based on EHPM and US Bureau of Labor Statistics.
0
10
20
30
1 2 3 4 5 6 7 8 9 10
Deciles
Share of households that receive remittances,by decile (percent)
2004 2012
FigurE 3.10 But remittances are a greater Share of income for Poorer Households
Source: World Bank staff calculations based on EHPM and US Bureau of Labor Statistics.
0
20
40
60
80
100
Remittances as a share of household income(among recipient households, percent)
1 2 3 4 5 6 7 8 9 10
Deciles2004 2012
FigurE 3.11 remittances are important across the Entire Distribution of income
Source: World Bank staff calculations based on EHPM and US Bureau of Labor Statistics.
0
5
10
15
1 2 3 4 5 6 7 8 9 10
Deciles
Remittances as a share of total decile incomeincludes non-recipient households, percent)
2004 2012
FigurE 3.12 remittances respond to Labor Market Conditions in the uS
Source: World Bank staff calculations based on EHPM and US Bureau of Labor Statistics.
15,000
18,000
21,000
24,000
100
200
300
400
January2004
January2007
January2010
Remittances to El Salvador and Hispanicemployment in the US
January2013
Remittances to El Salvador (US$ millions, left axis)
Hispanic employment level in the US(in thousands, right-axis)

Analysis of Inclusion 57
remain in 2012 almost as important as they were in 2004 but somewhat less so. This de-crease in the share of households that receive remittances helps to explain the relatively small effect that remittances had on poverty reduction as shown in figure 1.10 above. The share of households in the bottom 40 that re-ceive remittances was approximately the same in 2004 and 2012 (13 percent). Second, for households in the bottom 40 that receive remittances they typically account for over half of total household income. Even for the top 60 percent of the income distribution, for households that receive remittances ac-count typically between one-fifth of income (for the top decile) and half of the income (for the fifth decile).Third, as a share of total decile income remittances are most impor-tant for the middle deciles. This helps to ex-plain why remittances contributed to a small
decrease in inequality. Finally, remittances are sensitive to labor market conditions in the US. As a result remittances are likely to be pro-cyclical and exacerbate the fluctua-tions in the business cycle.
What Are the Factors that Constrain Inclusion the Most?Why is wage growth low?Low wage growth is associated with stagnant labor productivity. Since 1990 the increase in employment in services has not been matched by the increase in value added (see figure 3.13). Thus, value added per worker has de-clined. This helps to explain why wages have remained stagnant. In the case of agriculture, employment was declining until around the
FigurE 3.13 Employment Has grown Most in Services but Value added Lagged (Thus Labor Productivity in Services Has Declined)
Source: Central Bank of El Salvador.
a. Primary b. SecondaryIndices of value added, employment, and value added per worker by sector, 1990 = 100
c. Tertiary
199050
100
150
200
250
20100
100
50
150
200
250
20101990 19900
100
50
150
200
250
2010EmploymentValue addedValue added per worker

58 Analysis of Inclusion
time of the global economic crisis in 2008. As value added increased slightly this was a period of slight increases in labor productiv-ity. Since 2008, however, employment has increased at a faster rate than value added, putting also pressure on the ability to pay higher wages in the sector. Only in manu-facturing has labor productivity increased steadily over time, although employment in the sector has remained effectively flat.
The majority of jobs created in El Salvador are characterized by low productivity. Many of the jobs created have taken place in ser-vices, where real output per worker declined. Real salaries have stagnated and unit labor costs have increased. In the case of jobs in the tradables sector, while productivity has increased, external competition has put
downward pressure on prices and constrained wage growth. As a result real wages have been stagnant across all sectors of the econ-omy for a prolonged period of time (see fig-ure 3.14 below).
Productivity growth is constrained by the low skill content of most jobs. An analysis of the skill content of the tasks undertaken by the labor force in El Salvador shows that there remains a gap compared with the skills structure of the US or other countries such as Costa Rica (Aedo and Walker 2012, 104). Compared to those countries El Salvador’s labor force still performs tasks with a larger content of routine manual and non-routine manual physical skills.
Access to education has improved but the majority of workers still have limited schooling
FigurE 3.14 real Salaries Have Been Flat across the Economy for Over a Decade
Source: Cabrera (2014).
50
100
150
200
250
1990 2000
Average salary in US$ per month, deflated using 1990 prices
2010
Finance Transport Manufacturing Retail and hospitalityAgriculture Construction Public sector
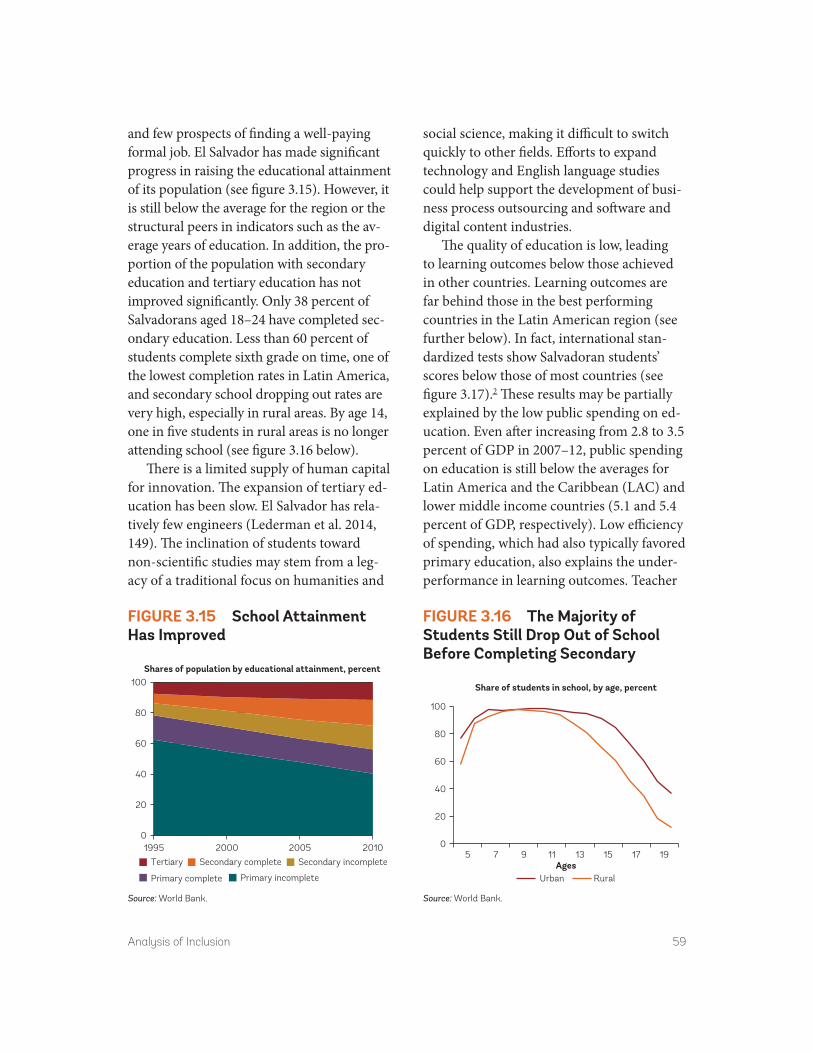
Analysis of Inclusion 59
and few prospects of finding a well- paying formal job. El Salvador has made significant progress in raising the educational attainment of its population (see figure 3.15). However, it is still below the average for the region or the structural peers in indicators such as the av-erage years of education. In addition, the pro-portion of the population with secondary education and tertiary education has not improved significantly. Only 38 percent of Salvadorans aged 18–24 have completed sec-ondary education. Less than 60 percent of students complete sixth grade on time, one of the lowest completion rates in Latin America, and secondary school dropping out rates are very high, especially in rural areas. By age 14, one in five students in rural areas is no longer attending school (see figure 3.16 below).
There is a limited supply of human capital for innovation. The expansion of tertiary ed-ucation has been slow. El Salvador has rela-tively few engineers (Lederman et al. 2014, 149). The inclination of students toward non-scientific studies may stem from a leg-acy of a traditional focus on humanities and
social science, making it difficult to switch quickly to other fields. Efforts to expand technology and English language studies could help support the development of busi-ness process outsourcing and software and digital content industries.
The quality of education is low, leading to learning outcomes below those achieved in other countries. Learning outcomes are far behind those in the best performing countries in the Latin American region (see further below). In fact, international stan-dardized tests show Salvadoran students’ scores below those of most countries (see figure 3.17).2 These results may be partially explained by the low public spending on ed-ucation. Even after increasing from 2.8 to 3.5 percent of GDP in 2007–12, public spending on education is still below the averages for Latin America and the Caribbean (LAC) and lower middle income countries (5.1 and 5.4 percent of GDP, respectively). Low efficiency of spending, which had also typically favored primary education, also explains the under-performance in learning outcomes. Teacher
FigurE 3.15 School attainment Has improved
Source: World Bank.
0
20
40
60
80
100
1995 2000
Shares of population by educational attainment, percent
2005 2010
Primary complete Primary incomplete
Tertiary Secondary complete Secondary incomplete
FigurE 3.16 The Majority of Students Still Drop Out of School Before Completing Secondary
Source: World Bank.
0
20
40
60
80
100
5 7 9 11
Share of students in school, by age, percent
13 15 17 19Ages
Urban Rural
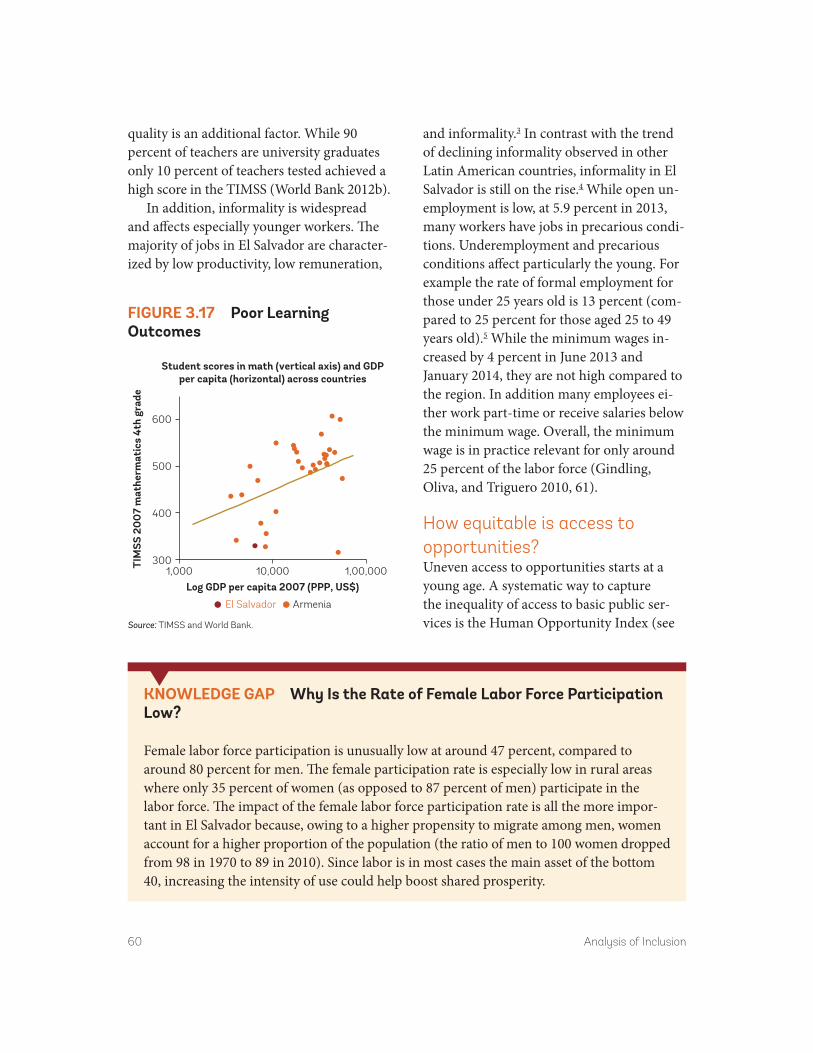
60 Analysis of Inclusion
quality is an additional factor. While 90 percent of teachers are university graduates only 10 percent of teachers tested achieved a high score in the TIMSS (World Bank 2012b).
In addition, informality is widespread and affects especially younger workers. The majority of jobs in El Salvador are character-ized by low productivity, low remuneration,
and informality.3 In contrast with the trend of declining informality observed in other Latin American countries, informality in El Salvador is still on the rise.4 While open un-employment is low, at 5.9 percent in 2013, many workers have jobs in precarious condi-tions. Underemployment and precarious conditions affect particularly the young. For example the rate of formal employment for those under 25 years old is 13 percent (com-pared to 25 percent for those aged 25 to 49 years old).5 While the minimum wages in-creased by 4 percent in June 2013 and January 2014, they are not high compared to the region. In addition many employees ei-ther work part-time or receive salaries below the minimum wage. Overall, the minimum wage is in practice relevant for only around 25 percent of the labor force (Gindling, Oliva, and Triguero 2010, 61).
How equitable is access to opportunities?Uneven access to opportunities starts at a young age. A systematic way to capture the inequality of access to basic public ser-vices is the Human Opportunity Index (see
KNOWLEDgE gaP Why is the rate of Female Labor Force Participation Low?
Female labor force participation is unusually low at around 47 percent, compared to around 80 percent for men. The female participation rate is especially low in rural areas where only 35 percent of women (as opposed to 87 percent of men) participate in the labor force. The impact of the female labor force participation rate is all the more impor-tant in El Salvador because, owing to a higher propensity to migrate among men, women account for a higher proportion of the population (the ratio of men to 100 women dropped from 98 in 1970 to 89 in 2010). Since labor is in most cases the main asset of the bottom 40, increasing the intensity of use could help boost shared prosperity.
FigurE 3.17 Poor Learning Outcomes
Source: TIMSS and World Bank.
300
400
500
600
1,000 10,000 1,00,000TIM
SS 2
007
mat
herm
atic
s 4t
h gr
ade
Log GDP per capita 2007 (PPP, US$)
Student scores in math (vertical axis) and GDPper capita (horizontal) across countries
El Salvador Armenia

Analysis of Inclusion 61
figure 3.18). The Human Opportunity Index is an indicator that measures how a child’s access to basic opportunities such as educa-tion, water, electricity and sanitation is af-fected by his or her circumstances—such as place of residence or education of the house-hold head. The index shows that El Salvador ranks below most other countries in the LAC region for which the index is available. With lower access to basic public services, chil-dren may not be able to develop the skills re-quired to become competitive adults in the labor force. Promoting more egalitarian ac-cess to basic goods and quality services early in life will likely both reduce inequality of outcomes in adulthood and increase eco-nomic efficiency, thereby strengthening the virtuous circle between growth and poverty reduction. This is particularly important be-cause individual household characteristics other than income greatly affected social mobility in El Salvador from 1996 to 2011 (Cuesta, Ñopo, and Pizzolitto 2007; UNDP 2013). In this respect, it is important to note that access to opportunities has been im-proving over time.6
Inequities in access to education start early in life and increase with the age of chil-dren. A significant portion of poor family children do not attend pre-schools (only 38 percent in bottom quintile) and many enter late in first grade. Dropping out of school starts much earlier among the lowest quin-tile, around 10 years of age. By age 15 the gap in attendance between the lowest and high-est quintiles is 20 percentage points. The in-equities build up over time and by the time the students are of university age only 5 percent of those from households in the low-est quintile enroll in tertiary education.
Unequal education opportunities trans-late into worse learning outcomes among the bottom 40. El Salvador has achieved the Millennium Development Goal (MDG) of universal primary education, but the enroll-ment rates for other levels of education and the quality of the learning across the board are still low. The gross enrollment rate in upper secondary education in 2011 was 46 percent, the lowest in Central America. Inequities in the quality of education lead to worse learning outcomes for the bottom 40.
FigurE 3.18 access to Opportunities is More unequal than in Other Countries in LaC
Source: Molinas et al. 2010.
40
60
80
100Human opportunity index, 2010
Chile
Urug
uay
Mex
icoCo
sta
Rica
Vene
zuela
, RB
Arge
ntin
aJa
maic
aEc
uado
rCo
lom
bia
Braz
il
Latin
Am
erica
and
the
Carib
bean
ave
rage
Dom
inica
n Re
publ
icPa
ragu
ayPa
nam
a
Peru
Guat
emala
El S
alvad
orNi
cara
gua
Hond
uras

62 Analysis of Inclusion
The proportion of 7 year olds who can read varies greatly by quintile. Only 55 percent of children from the bottom 40 percent can read while 73 percent of those in the top 60 percent can (see figure 3.19). The difference is larger if one compares the lowest quintile (48 percent of 7 year olds can read) with the highest quintile (84 percent can read).
Public spending on education in El Salvador has been steadily growing but re-mains relatively low. In 2012 public spending on education reached 3.5 percent of GDP, which is lower than the average for the LAC (4.9 percent) and the (OECD) (5.6 percent). A disproportionally high share of public spending in education (61 percent) still goes to basic education.
The increase in public spending on educa-tion has not translated into improvements in learning outcomes (see also figure 3.20 for a comparison with other countries on learning outcomes in mathematics). Differences in learning outcomes are greater between rural and urban areas than between boys and girls. For example, results from UNESCO’s Second Regional Comparative and Explanatory (SERCE) study for Latin America indicate that the percentage of pupils below the lowest performance benchmark in third-grade math was much higher in rural than urban areas (14 and 6 percent, respectively) while it was similar for girls and boys nationwide (11 and
FigurE 3.19 inequities in Learning Outcomes Start Early in Life
Source: World Bank 2015a.
4862 67 71
84
0
20
40
60
80
Q1 Q2
Proportion of seven year old children who canread, by quintile (2012, percent)
Q3 Q4 Q5
FigurE 3.20 Learning Outcomes in Mathematics are average among Countries in LaC
Source: SERCE.
0
Cuba
Costa R
ica
Urugu
ayChile
Mexico
Argen
tina
Brazil
Colombia
Parag
uay
El Salv
ador
Ecuad
or
Nicara
gua
Peru
Panam
a
Guatem
ala
Dominica
n
Republic
20
40
Third grade mathematics learning outcomes, percent of pupils in different performance levels
60
80
100
Highest Intermediate high Intermediate Intermediate low Lowest

Analysis of Inclusion 63
10 percent, respectively). The concentration of training opportunities in the capital and among large employers is another source of inequity (USAID 2008).
There is a relatively large number of youth that neither studies nor works (the so-called ninis). The share of 15–18 year olds that are neither in school nor working is 16 percent. It is also particularly noteworthy that there are three times more women than men who neither study nor work. Since labor is in most cases the main asset of the bottom 40, increasing the intensity of use could help boost shared prosperity. What drives the decision to drop out and remain outside of
the labor force is a question insufficiently studied and understood. The phenomenon of ninis contributes to the intergenerational persistence of inequality and has a strong gender dimension as two out of every three ninis across Latin America are women (see also box 3.1).
The phenomenon of the ninis affects mainly the bottom 40. It is estimated that nearly 60 percent of ninis in Latin America are from a household in the bottom 40 per-cent (De Hoyos, Rogers, and Szekely 2015). The nini phenomenon is also linked to crime (Chioda 2015). These links create additional risks for youth and the society as a whole.
BOX 3.1 uneven Progress Toward gender Equality—With Self-reinforcing Dynamics
El Salvador has made important efforts to recognize and advance the rights of women by signing and ratifying major international treaties and passing several important pieces of domestic legislation. However improvements in the legal framework have not fully trans-lated into comparable progress in gender equality of endowments, such as health, educa-tion, economic opportunities, family dynamics voice and agency. Many of these factors entail mutually-reinforcing dynamics, for example, with interactions between dropping out of school, teenage pregnancy, female labor force participation, economic dependence on remittances from absent male partners and fathers who have migrated, and differenti-ated impacts of crime and violence.
Reproductive health and teenage pregnancy: El Salvador has made progress on all of the reproductive health indicators over the last decade. Maternal mortality has decreased, the share of women receiving prenatal care increased, and the prevalence of contraceptive use grew. These improvements, however, have not been equally enjoyed throughout the coun-try as socioeconomic characteristics, including poverty, education, and location greatly impact health indicators. Abortion is illegal under any circumstances, which has prompted the UN’s Committee on the Elimination of Discrimination against Women to call for a national dialogue on the consequences of that restrictive legal framework in 2008. Similar concerns have been reiterated more recently by the UN’s Committee on Economic, Social and Cultural Rights in 2014. Adolescent fertility, an important proxy
box continues next page

64 Analysis of Inclusion
indicator for women’s agency, has decreased from 100 to 76 births per 1,000 women aged 15 to 19 between 2000 and 2012, but remains high among rural and less educated teens (see also World Bank 2012e). UNFPA reports that 32 percent of prenatal inscriptions in El Salvador in 2013 were for women under the age of 19, and two percent of these were for very young girls, ages 10–14.
Education—and the ninis: Secondary school dropout is high overall for El Salvador (only 40 percent of Salvadorans ages 25 to 20 have completed high school). Gender differences for school exit are small overall, but drop-out rates are higher for girls in upper secondary school. The self-claimed reasons for dropping out are different, with girls more likely to declare “lack of interest” or “personal reason” for not being in school (possibly related to household duties) and boys more likely to leave school for “economic reasons.” Moreover, what teen boys and girls do after leaving school differs significantly. Gender norms that af-fect young men and women’s roles within the family and society are likely to impact indi-vidual decisions to continue or to leave school. Among the youth aged 15 to 24, women are more likely than men to be neither studying nor working: 35 percent of women vs. 10 percent of men in that age group are so-called ninis, short for ni trabajan, ni estudian. Female ninis often mention the need to do household work as a predominant reason to drop out of school and 45 percent of them are either married or living with a partner, compared to 10 percent of male ninis.
Labor force participation and economic opportunity: Female labor force participation lags behind regional averages and, as identified in the main text above, the factors contrib-uting to this low female labor force participation constitute a knowledge gap. However, fe-male unemployment rate is lower than the regional average and the male unemployment rate. Women in El Salvador are also less likely than men to have an informal job. In addi-tion, the gender wage gap is among the lowest in the region: in 2010 women received on average 87 percent of men’s remuneration. The combination of low participation rates and relatively good indicators of the quality of labor force participation suggests the existence of some barriers to entering labor force, which discourage the less qualified. Gender norms may constitute one such barrier. However, this hypothesis needs further investigation.
Migration, dependency, parental absence, and family dynamics: Males are significantly more likely to migrate than females, and females in households that receive remittances have lower labor force participation rates. Micro-econometric evidence has uncovered that remittances reduce labor force participation for women at all ages, with a higher neg-ative impact at younger ages, presumably allowing maternity options or home-based activities (Acosta 2006). However, this can put young women in a situation of being de-pendent on income support from remittances of male partners living abroad. It also raises
BOX 3.1 continued
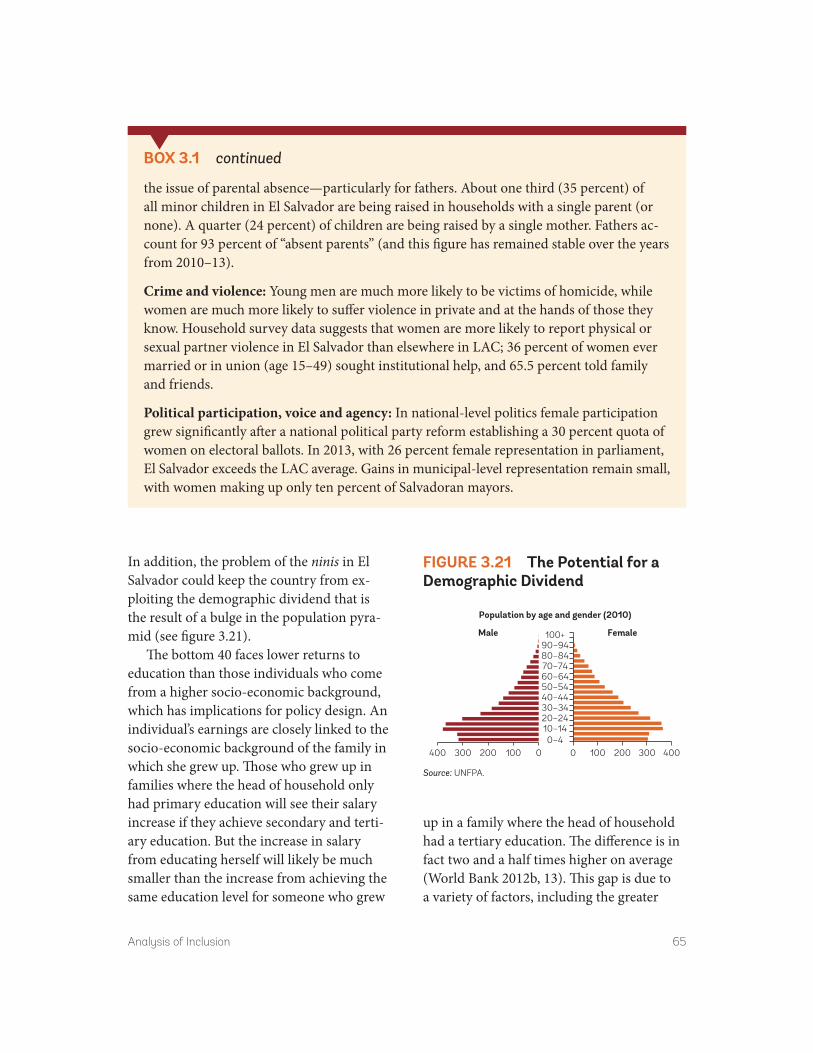
Analysis of Inclusion 65
the issue of parental absence—particularly for fathers. About one third (35 percent) of all minor children in El Salvador are being raised in households with a single parent (or none). A quarter (24 percent) of children are being raised by a single mother. Fathers ac-count for 93 percent of “absent parents” (and this figure has remained stable over the years from 2010–13).
Crime and violence: Young men are much more likely to be victims of homicide, while women are much more likely to suffer violence in private and at the hands of those they know. Household survey data suggests that women are more likely to report physical or sexual partner violence in El Salvador than elsewhere in LAC; 36 percent of women ever married or in union (age 15–49) sought institutional help, and 65.5 percent told family and friends.
Political participation, voice and agency: In national-level politics female participation grew significantly after a national political party reform establishing a 30 percent quota of women on electoral ballots. In 2013, with 26 percent female representation in parliament, El Salvador exceeds the LAC average. Gains in municipal-level representation remain small, with women making up only ten percent of Salvadoran mayors.
BOX 3.1 continued
In addition, the problem of the ninis in El Salvador could keep the country from ex-ploiting the demographic dividend that is the result of a bulge in the population pyra-mid (see figure 3.21).
The bottom 40 faces lower returns to education than those individuals who come from a higher socio-economic background, which has implications for policy design. An individual’s earnings are closely linked to the socio-economic background of the family in which she grew up. Those who grew up in families where the head of household only had primary education will see their salary increase if they achieve secondary and terti-ary education. But the increase in salary from educating herself will likely be much smaller than the increase from achieving the same education level for someone who grew
up in a family where the head of household had a tertiary education. The difference is in fact two and a half times higher on average (World Bank 2012b, 13). This gap is due to a variety of factors, including the greater
FigurE 3.21 The Potential for a Demographic Dividend
Source: UNFPA.
0100200300400
Male
Population by age and gender (2010)
0 100 200 300 4000–4
10–1420–2430–3440–4450–5460–6470–7480–8490–94100+ Female
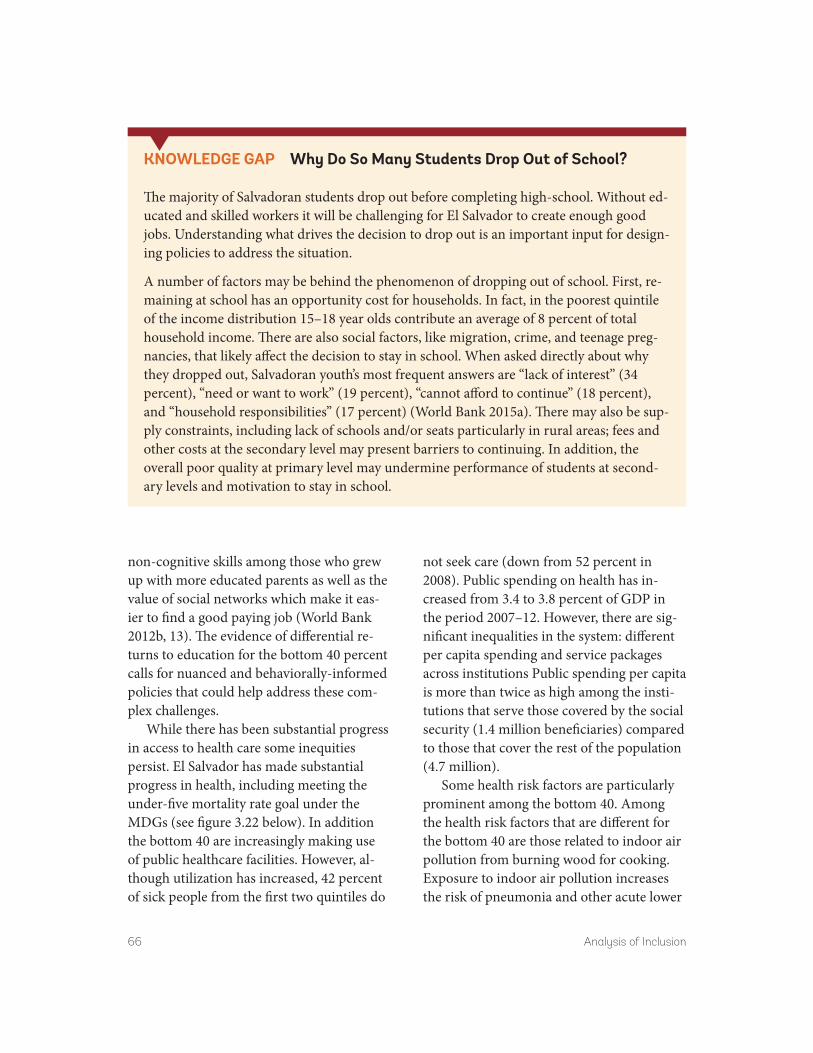
66 Analysis of Inclusion
non-cognitive skills among those who grew up with more educated parents as well as the value of social networks which make it eas-ier to find a good paying job (World Bank 2012b, 13). The evidence of differential re-turns to education for the bottom 40 percent calls for nuanced and behaviorally-informed policies that could help address these com-plex challenges.
While there has been substantial progress in access to health care some inequities persist. El Salvador has made substantial progress in health, including meeting the under-five mortality rate goal under the MDGs (see figure 3.22 below). In addition the bottom 40 are increasingly making use of public healthcare facilities. However, al-though utilization has increased, 42 percent of sick people from the first two quintiles do
not seek care (down from 52 percent in 2008). Public spending on health has in-creased from 3.4 to 3.8 percent of GDP in the period 2007–12. However, there are sig-nificant inequalities in the system: different per capita spending and service packages across institutions Public spending per capita is more than twice as high among the insti-tutions that serve those covered by the social security (1.4 million beneficiaries) compared to those that cover the rest of the population (4.7 million).
Some health risk factors are particularly prominent among the bottom 40. Among the health risk factors that are different for the bottom 40 are those related to indoor air pollution from burning wood for cooking. Exposure to indoor air pollution increases the risk of pneumonia and other acute lower
KNOWLEDgE gaP Why Do So Many Students Drop Out of School?
The majority of Salvadoran students drop out before completing high-school. Without ed-ucated and skilled workers it will be challenging for El Salvador to create enough good jobs. Understanding what drives the decision to drop out is an important input for design-ing policies to address the situation.
A number of factors may be behind the phenomenon of dropping out of school. First, re-maining at school has an opportunity cost for households. In fact, in the poorest quintile of the income distribution 15–18 year olds contribute an average of 8 percent of total household income. There are also social factors, like migration, crime, and teenage preg-nancies, that likely affect the decision to stay in school. When asked directly about why they dropped out, Salvadoran youth’s most frequent answers are “lack of interest” (34 percent), “need or want to work” (19 percent), “cannot afford to continue” (18 percent), and “household responsibilities” (17 percent) (World Bank 2015a). There may also be sup-ply constraints, including lack of schools and/or seats particularly in rural areas; fees and other costs at the secondary level may present barriers to continuing. In addition, the overall poor quality at primary level may undermine performance of students at second-ary levels and motivation to stay in school.

Analysis of Inclusion 67
respiratory infections in young children and lung cancer in adults. Among the bottom 40 percent the use of firewood as a cooking fuel is common in around 40 percent of house-holds. The issue is particularly important in rural areas, where 67 percent of households burn wood.7
A challenge faced by the health is to en-sure that improvements in access to health services translate in improvements in quality. Although institutional deliveries increased, maternal mortality did not decrease accord-ingly (see figure 3.22). In addition, epidemi-ological changes in the country profile need to be reflected in the health system. This im-plies, for example, the inclusion of manage-ment of chronic conditions in primary health care strategy.
Public spending in social programs has in-creased significantly in the last years. Social sector spending increased from 10 percent of GDP in 2007 to 12.4 percent of GDP in 2012. As of the latter year, social protection and labor (including social security and subsidies) accounted for the largest portion of social spending, 5 percent of GDP, followed by health (3.8 percent), and education (3.5 percent) (see figure 3.23 above). In real terms, overall social spending per capita increased at an annual av-erage rate of 3.2 percent from 2007 to 2012.
But spending in social programs is insuf-ficiently targeted. While public expenditure on social programs has increased in recent years, it remains poorly targeted with the bulk of expenditure being accounted for by the gas and electricity subsidies. Those
FigurE 3.22 under 5 Mortality MDg achieved
Source: World Bank 2015a.Note: MDG = millennium development goal.
59
32
16
150
110
81
20
38
0
20
40
60
80
100
120
140
160
1990 2000 2012 2015
MDG 4 achieved
MDG 5target
MDG 4target
Child
Maternal mortality
Maternal and child mortality (deaths per 1,000live births)
FigurE 3.23 Public Spending in Social Sectors Has increased
Source: World Bank 2015a.
10.010.4
11.9 11.8 12.1 12.4
0
2
4
6
8
10
12
14
2007 2008 2009
Public expenditure as percent of GDP
2010 2011 2012HealthSocial assistance and labor
EducationSocial security

68 Analysis of Inclusion
subsidies have much less of a pro-poor focus as they benefit almost all quintiles equally (see figure 3.24 below). Expenditure, how-ever, is concentrated on those programs that are less targeted (see figure 3.25 below). As a result the bottom 40 percent of the income distribution benefits from only 0.8 percent of GDP across all social sector programs while the top 60 percent benefits from 1.2 percent of GDP in social assistance when all pro-grams are considered.
There are also specific challenges of con-nectivity in the more isolated rural areas. An analysis of the movement of goods and peo-ple between municipalities shows that the less connected municipalities typically over-lap with those with highest levels of poverty
(see appendix, Amaya and Cabrera 2012, 2013).
High costs of services such as broadband put the bottom 40 at a disadvantage to ex-ploit the benefits of information and com-munications technology. For the lowest quintile the cost of broadband would be equivalent to 19 percent of their income. Only 10 percent of schools are connected to the internet. Fixed broadband only reaches about one third of municipalities. Limited competition between telecommunications operators that control access to the four sub-marine cables and charge relatively high prices to wholesalers (who then transfer the high prices to retail customers) may be a fac-tor driving the high prices.
FigurE 3.24 Some Social Programs are More Targeted than Others
Source: World Bank 2015a.
0
20
40
60
80
100
CCT
rura
l (CS
R)Un
iver
sal p
ensio
nCC
T ur
ban
(CSU
)Sc
hool
feed
ing
Scho
ol s
uppl
ies
Gas
subs
idy
Elec
tric
ity s
ubsid
y
Moretargeted
Beneficiaries of social programs by quintile,percent
Lesstargeted
Q1Q2Q3Q4Q5
FigurE 3.25 Spending in Social Programs is Concentrated in the Less Targeted Ones
Source: World Bank 2015a.
Q1Q2Q3Q4Q5
0.0
0.2
0.4
0.6
0.8
CCT
rura
l (CS
R)Un
iver
sal p
ensio
nCC
T ur
ban
(CSU
)Sc
hool
feed
ing
Scho
ol s
uppl
ies
Gas
subs
idy
Elec
tric
ity s
ubsid
y
Expenditure is highest inthe less targeted programs
Social public expenditure as a percent of GDP,by program and quintile of beneficiary

Analysis of Inclusion 69
Financial inclusion of the bottom 40 is a major challenge. The vast majority of the population reporting that they do not use formal financial services. Although remit-tances service providers are widely used in El Salvador, regular use of accounts at fi-nancial institutions is much more limited. There are 10 commercial bank branches per 100,000 adults, which is below the level in neighboring countries such as Costa Rica (23), Honduras (23). Most provision of fi-nancial services takes place in San Salvador, where regulated financial institutions have about half of their branch and ATM pres-ence. Only 14 percent of the Salvadoran population has an account at a formal fi-nancial institution, well below the Latin American average of 39 percent and just 6 percent of the bottom 40 had an account in a formal financial institution, a figure which is much lower than any of the comparator sets (see figure 3.26). There are also differ-ences in gender and geographic area in the proportion of those having an account: 10 and 18 percent for females and males re-spectively, and 11 and 18 percent for rural and urban respectively.
These gaps in access to finance are not being narrowed, as the financial sector is growing slowly. El Salvador’s financial sys-tem has been growing more slowly than the regional average. At 44 percent in 2013, pri-vate sector credit to GDP is below its ex-pected value, based on predictions given its income and indicators of its level of develop-ment. It also lags relative to regional averages for Central America and LAC. Growth rates for credit to the private sector are the lowest in Central America. Deposit growth rates are also low. Similar to other countries in Central America, the securities markets of El Salvador is limited in size and importance as
a source of funding for corporates. Insurance market premiums are 2.1 percent of GDP.
Identifying Policy Areas to Boost InclusionBased on the above analysis the follow-ing policy areas emerge as critical to boost inclusion:
Improving education, which by increase opportunities will help address the vicious circles from low opportunities to violence and migration. The bottom 40 is particu-larly affected by poor learning outcomes. Inequities start early in life—as noted above, only 55 percent of children from the bottom 40 percent can read. Low quality of educa-tion is also likely one of the contributing fac-tors to the high school drop-out rate, which limits the use of opportunities at home and abroad. Improving education will help ad-dress the lack of quality employment oppor-tunities that is driven by the expansion of the non-traded sector creates low productivity
FigurE 3.26 Financial inclusion is Low
Source: Global Financial Inclusion Database.
38
2520
156
0
10
20
30
40
Worldaverage
Structuralpeers
average
LACaverage
Share of the bottom 40 with an account in aformal financial institution, percent (2011)
Lowermiddleincomeaverage
ElSalvador
70 Analysis of Inclusion
jobs. Among the institutional challenges faced by the education sector include scaling up full-time school model that started as a pilot in primary schools in selected munici-palities. More broadly, the school-based management system has been disproportion-ally focused on monitoring financial re-sources, and very little on quality standards.
Addressing gaps in access to finance and to quality basic services, which will help ad-dress the vicious circle of low savings and in-vestment and low growth. As noted above, El Salvador ranks among the countries in LAC with a low Human Opportunity Index. In addition to improving education, there is a broader agenda in improving access of the bottom 40 to basic opportunities, including water and sanitation and healthcare. The bottom 40 are also considerably under- banked. Greater financial inclusion can also help increase savings out of the large remit-tance flows that many Salvadoran house-holds receive.
Improving the targeting of the social protection system. Currently public social expenditure is concentrated on those pro-grams that are less targeted. As a result the bottom 40 percent of the income distribution
benefits from only 0.8 percent of GDP across all social sector programs while the top 60 percent benefits from 1.2 percent of GDP in social assistance across when all programs are considered. Improving the tar-geting of social expenditures can help to make the state’s action more visible to citi-zens. In fact, despite the very wide coverage of subsidies like electricity, transport, gas, or water, when asked in the LAPOP 2012 sur-vey if they received assistance from the gov-ernment only 10.5 percent of Salvadorans responded affirmatively. At the same time Salvadorans appear to have an attitude of openness to efforts of the government to re-duce inequalities. For example, on a 0–100 scale, Salvadorans average 83 on the opin-ion, as expressed in the same LAPOP 2012 survey, that the government should imple-ment policies to reduce income inequality. This locates El Salvador as one of the coun-tries in LAC where government intervention to promote equality is most favored. Above all, increasing the targeting of social expen-ditures could result in savings that could be redeployed to address the needs for im-proved access to basic services identified above.
Notes 1. As a result the contribution of structural
change to labor productivity growth became negative in the period 2005–09 (Amaya and Cabrera 2013, 17), a result which is also found in other countries in Latin America (McMillan and Rodrik 2011).
2. TIMSS scores for girls and boys in fourth-grade math were relatively similar (325 and 334 respectively).
3. While informality is widespread it is also worth noting that comparable evidence suggests that informality in El Salvador as measured by either the legal or productive
definitions is lower than the average for Latin America and the Caribbean region (Perry et al. 2007, 29).
4. El Salvador is, one of only two out of nine countries for which data is available where informality has increased in recent years (see World Bank 2012d, 56). In addition the share of workers employed in large firms declined, again in contrast with the experience of other Latin American countries.
5. For an analysis of the labor market see World Bank, “Better Jobs in Central America: The Role of Human Capital” (2012a) and its

Analysis of Inclusion 71
companion “Mejores empleos en El Salvador: El rol del capital humano.” On youth see World Bank, “Youth Development and Economic Opportunities in El Salvador” (2010).
6. The Human Opportunity Index improved since 1995 and there is also evidence that intergenerational mobility in educational
attainment increased from 1995 to 2009 (Ferreira et al. 2013, 8).
7. The issue of using wood as fuel for cooking also has an environmental sustainability impli-cation since it is estimated that only 42 percent of the wood is collected in a sustainable way (Wang et al. 2013).


Sustainability Challenges 73
Economic SustainabilityRising to the development challenges identified is made difficult by the lack of state capacity and fiscal space. The lack of confi-dence in public institutions is in part a reflec-tion of a relatively ineffective state.1 Weak state capacity is both a function of limited public revenues and manifests itself in the difficulty of raising revenue, especially from direct taxes.2 Resources available to the Sal-vadoran state have been comparatively low (see figure 4.1). Tax revenues throughout the 1990s averaged 10 percent of Gross Domestic Product (GDP) and only reached 12 percent of GDP in 2005. Since then, and despite the impact of the global economic crisis, tax reve-nues have increased to around 15 percent of GDP in 2013. Despite tax efforts over the last five years, fiscal deficit has increased
and averaged 4 percent of GDP over the last three years. El Salvador has raised tax reve-nue from 13.8 percent of GDP in 2003 to 15.8 of GDP in 2014.3
Increased spending has outpaced efforts to increase revenues. Limited public revenues has traditionally constrained public investment, which has averaged less than 3 percent of GDP (among the lowest in the world see appen-dix) and social spending. Since 2008 there has been an increase in social spending which has brought El Salvador closer to, although still below, the rates of social spending that are common in the rest of Latin America (World Bank 2015a). Social sector spending increased by around two percentage points from 10.4 to 12.4 percent of GDP between 2008 and 2012. This fully accounts for the increase in overall public expenditures since 2008.4 As this increased spending has outpaced the rise in revenues, the resulting deficits have led to higher fiscal deficits, averaging 4 percent of GDP over the last three years, and an in-crease in public debt (including pensions) from around 40 percent of GDP in 2008 to around 58 percent of GDP in 2013 (see figure 4.2 and tables 4.1 and 4.2). Due to the fiscal imbalances since the crisis the fiscal po-sition of El Salvador today compares unfavor-ably with comparator countries (see figure 4.3).
While there are no immediate risks to debt sustainability, the increase in public debt since the 2008 global economic crisis will require measures to keep it in check. A debt sustain-ability analysis suggests that if current spend-ing and growth trends were to continue public debt would increase to around 70 percent of GDP by 2019.5 Estimates of the needed fiscal
4. Sustainability Challenges
17.3 16.6 15.7 14.612.9
0
5
10
15
20
Structuralpeers
average
Tax revenue to GDP, average 2000–2013,percent
Worldaverage
LACaverage
Lowermiddleincomeaverage
ElSalvador
FigurE 4.1 a Small State
Source: World Bank.
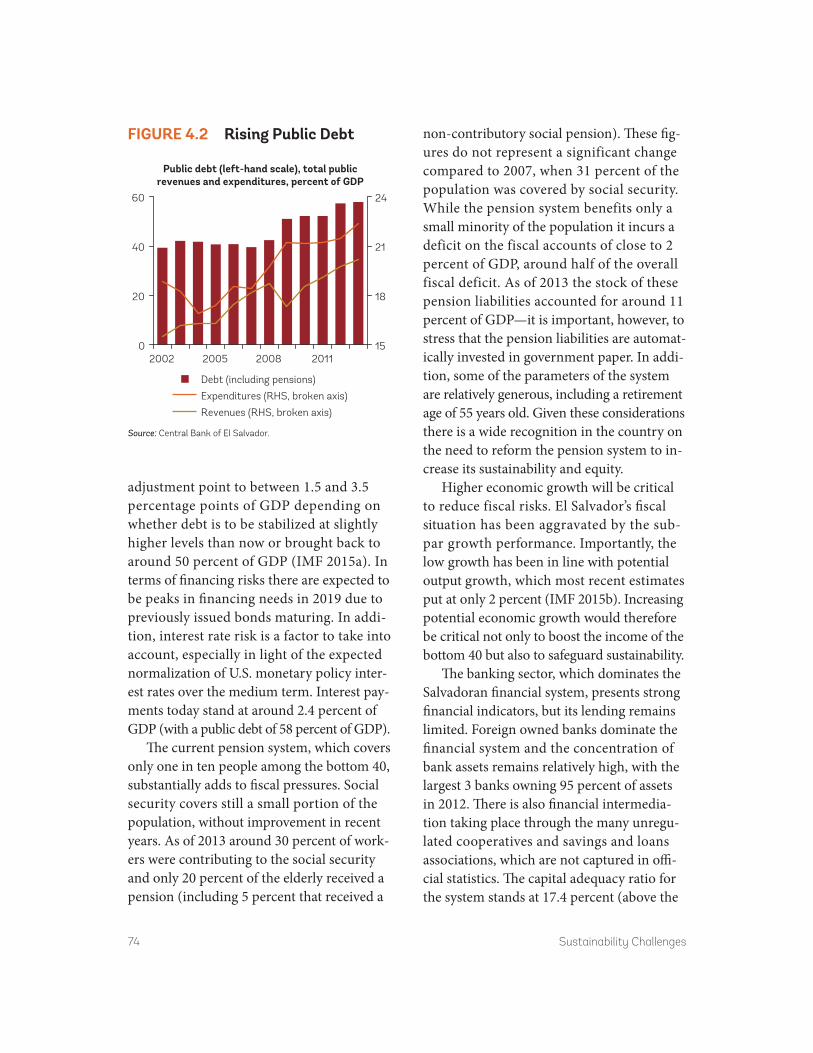
74 Sustainability Challenges
adjustment point to between 1.5 and 3.5 percentage points of GDP depending on whether debt is to be stabilized at slightly higher levels than now or brought back to around 50 percent of GDP (IMF 2015a). In terms of financing risks there are expected to be peaks in financing needs in 2019 due to previously issued bonds maturing. In addi-tion, interest rate risk is a factor to take into account, especially in light of the expected normalization of U.S. monetary policy inter-est rates over the medium term. Interest pay-ments today stand at around 2.4 percent of GDP (with a public debt of 58 percent of GDP).
The current pension system, which covers only one in ten people among the bottom 40, substantially adds to fiscal pressures. Social security covers still a small portion of the population, without improvement in recent years. As of 2013 around 30 percent of work-ers were contributing to the social security and only 20 percent of the elderly received a pension (including 5 percent that received a
non-contributory social pension). These fig-ures do not represent a significant change compared to 2007, when 31 percent of the population was covered by social security. While the pension system benefits only a small minority of the population it incurs a deficit on the fiscal accounts of close to 2 percent of GDP, around half of the overall fiscal deficit. As of 2013 the stock of these pension liabilities accounted for around 11 percent of GDP—it is important, however, to stress that the pension liabilities are automat-ically invested in government paper. In addi-tion, some of the parameters of the system are relatively generous, including a retirement age of 55 years old. Given these considerations there is a wide recognition in the country on the need to reform the pension system to in-crease its sustainability and equity.
Higher economic growth will be critical to reduce fiscal risks. El Salvador’s fiscal situation has been aggravated by the sub- par growth performance. Importantly, the low growth has been in line with potential output growth, which most recent estimates put at only 2 percent (IMF 2015b). Increasing potential economic growth would therefore be critical not only to boost the income of the bottom 40 but also to safeguard sustainability.
The banking sector, which dominates the Salvadoran financial system, presents strong financial indicators, but its lending remains limited. Foreign owned banks dominate the financial system and the concentration of bank assets remains relatively high, with the largest 3 banks owning 95 percent of assets in 2012. There is also financial intermedia-tion taking place through the many unregu-lated cooperatives and savings and loans associations, which are not captured in offi-cial statistics. The capital adequacy ratio for the system stands at 17.4 percent (above the
15
18
21
24
0
20
40
60
2002 2005 2008 2011
Public debt (left-hand scale), total publicrevenues and expenditures, percent of GDP
Debt (including pensions)
Expenditures (RHS, broken axis)
Revenues (RHS, broken axis)
FigurE 4.2 rising Public Debt
Source: Central Bank of El Salvador.

Sustainability Challenges 75
TaBLE 4.1 Selected Economic indicators, 2008–132008 2009 2010 2011 2012 2013
Production and prices
Nominal GDP (US$ billion) 21.4 20.7 21.4 23.1 23.8 24.3
Real GDP growth (%) 1.3 −3.1 1.4 2.2 1.9 1.7
Inflation rate (CPI) 5.5 0.1 2.1 5.1 0.8 0.8
Gross domestic investment (% of GDP) 15 13 13 14 14 15
Public sector 2 2 2 2 3 3
Private sector 13 11 11 12 12 13
Gross national savings (% of GDP) 8 12 11 9 9 9
Public sector 0 −3 −2 −2 −1 −1
Private sector 8 15 13 11 10 10
External sector
Current account (% of GDP) −7.1 −1.5 −2.5 −4.8 −5.4 −6.5
Merchandise trade balance −21.9 −15.0 −16.5 −18.4 −18.8 −19.6
Services −1.0 −0.4 −0.4 −0.3 0.2 0.3
Primary income −1.8 −2.7 −2.5 −2.8 −3.7 −4.0
Remittances 17.5 16.7 16.8 16.6 16.9 16.9
Terms of trade (% change) −9.5 12.6 −5.6 −2.5 0.5 −1.6
FDI (net) (% of GDP) 4.2 1.8 −1.1 0.9 2.0 0.6
Public Sector
Revenues and grants (% of GDP) 17.4 16.4 17.8 18.2 18.9 19.3
Current revenues, o/w: 17.2 15.9 17.0 17.3 18.2 19.0
Tax revenues 13.5 12.6 13.5 13.8 14.4 15.4
Non tax revenues 2.9 2.8 3.0 2.8 3.1 3.1
Others 0.8 0.5 0.5 0.7 0.7 0.5
Spending and net lending (% of GDP) 20.6 22.1 22.0 22.2 22.8 23.4
Current spending, o/w 17.5 19.0 18.9 19.3 19.4 20.2
Wages and salaries 7.1 8.0 8.0 8.3 8.4 8.7
Goods and services 3.8 4.2 4.4 4.0 3.9 4.4
Interests 2.4 2.6 2.4 2.2 2.3 2.4
Current transfers 4.1 4.2 4.1 4.7 4.7 4.6
Capital spending 3.1 3.1 3.2 2.9 3.4 3.2
Primary balance (% of GDP) −0.8 −3.1 −1.9 −1.7 −1.6 −1.6
Overall fiscal balance (incl. pensions, % of GDP) −3.2 −5.7 −4.3 −3.9 −3.9 −4.1
Total public debt (% of GDP) 45.4 51.0 52.2 52.2 57.3 57.8
Source: World Bank staff estimates for 2014 and forecasts for 2015–19. Historical data from the Central Bank of El Salvador.

76 Sustainability Challenges
TaBLE 4.2 Selected Economic indicators and Forecasts, 2014–192014 2015 2016 2017 2018 2019
Production and prices
Nominal GDP (US$ billion) 25.0 26.2 27.3 28.6 29.7 30.9
Real GDP growth (%) 2.0 2.2 2.4 2.6 2.3 2.0
Inflation rate (CPI) 2.0 2.0 2.0 2.0 2.0 2.0
Gross domestic investment (% of GDP) 15 15 15 16 15 15
Public sector 2 3 3 3 3 3
Private sector 12 12 13 13 12 12
Gross national savings (% of GDP) 9 10 10 9 9 8
Public sector −1 −1 −2 −2 −2 −3
Private sector 11 11 11 11 11 11
External sector
Current account (% of GDP) −5.5 −4.9 −5.6 −6.5 −6.3 −6.2
Merchandise trade balance −19.4 −18.7 −19.4 −20.1 −19.8 −19.5
Services 0.8 0.8 0.8 0.8 0.8 0.8
Primary income −4.4 −4.4 −4.4 −4.5 −4.5 −4.7
Remittances 17.5 17.5 17.4 17.3 17.3 17.2
Terms of trade (% change) 2.1 1.9 0.2 0.1 0.0 0.5
FDI (net) (% of GDP) 0.5 1.7 1.8 2.1 1.9 1.9
Public Sector
Revenues and grants (% of GDP) 19.0 19.0 19.4 19.5 19.5 19.4
Current revenues, o/w: 18.8 18.8 19.0 19.1 19.2 19.2
Tax revenues 15.2 15.2 15.4 15.6 15.6 15.6
Non tax revenues 3.1 3.1 3.1 3.1 3.1 3.1
Others 0.5 0.5 0.5 0.4 0.5 0.5
Spending and net lending (% of GDP) 23.0 23.4 24.0 24.3 24.6 24.9
Current spending, o/w 20.0 20.2 20.8 20.9 21.2 21.7
Wages and salaries 8.9 9.1 9.1 9.1 9.1 9.1
Goods and services 4.2 4.1 4.1 4.1 4.1 4.1
Interests 2.5 2.7 3.0 3.2 3.5 3.9
Current transfers 4.4 4.3 4.3 3.4 4.5 4.6
Capital spending 3.0 3.2 3.4 3.4 3.4 3.2
Primary balance (% of GDP) −1.5 −1.7 −1.6 −1.6 −1.6 −1.6
Overall fiscal balance (incl. pensions, % of GDP) −4.0 −4.4 −4.6 −4.8 −5.1 −5.5
Total public debt (% of GDP) 60.0 61.9 63.9 65.9 68.5 71.4
Source: World Bank staff estimates for 2014 and forecasts for 2015–19. Historical data from the Central Bank of El Salvador.
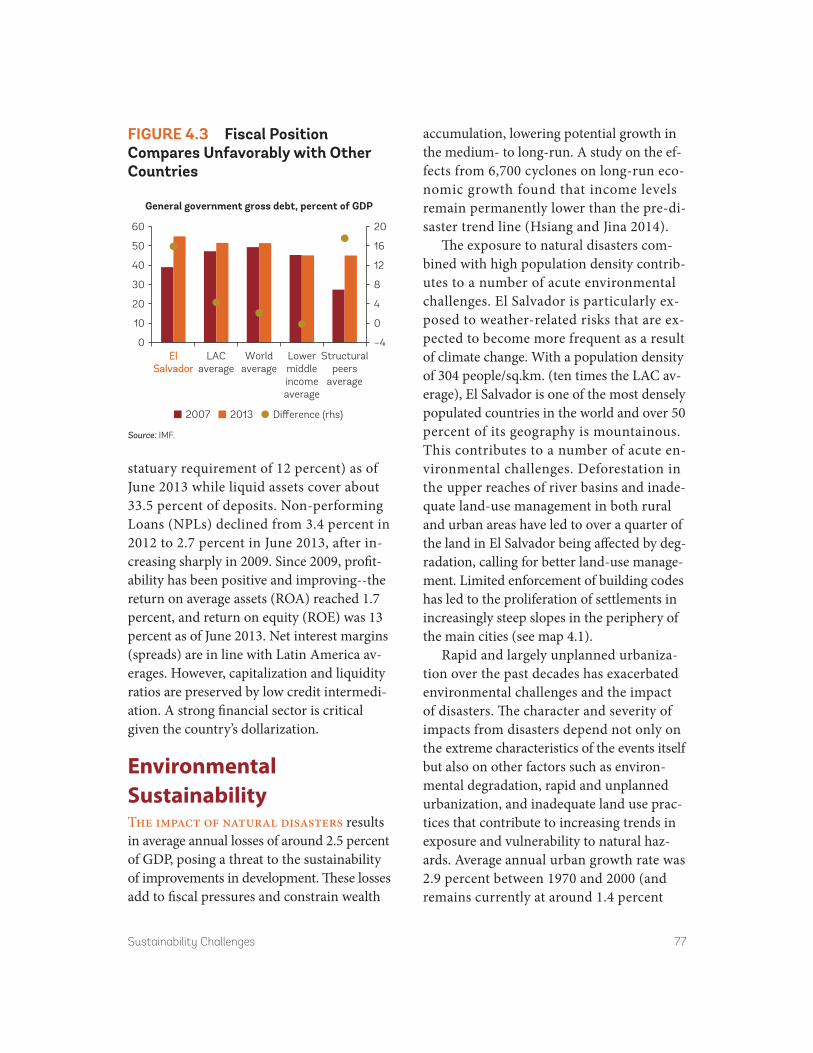
Sustainability Challenges 77
statuary requirement of 12 percent) as of June 2013 while liquid assets cover about 33.5 percent of deposits. Non-performing Loans (NPLs) declined from 3.4 percent in 2012 to 2.7 percent in June 2013, after in-creasing sharply in 2009. Since 2009, profit-ability has been positive and improving--the return on average assets (ROA) reached 1.7 percent, and return on equity (ROE) was 13 percent as of June 2013. Net interest margins (spreads) are in line with Latin America av-erages. However, capitalization and liquidity ratios are preserved by low credit intermedi-ation. A strong financial sector is critical given the country’s dollarization.
Environmental SustainabilityThe impact of natural disasters results in average annual losses of around 2.5 percent of GDP, posing a threat to the sustainability of improvements in development. These losses add to fiscal pressures and constrain wealth
accumulation, lowering potential growth in the medium- to long-run. A study on the ef-fects from 6,700 cyclones on long-run eco-nomic growth found that income levels remain permanently lower than the pre-di-saster trend line (Hsiang and Jina 2014).
The exposure to natural disasters com-bined with high population density contrib-utes to a number of acute environmental challenges. El Salvador is particularly ex-posed to weather-related risks that are ex-pected to become more frequent as a result of climate change. With a population density of 304 people/sq.km. (ten times the LAC av-erage), El Salvador is one of the most densely populated countries in the world and over 50 percent of its geography is mountainous. This contributes to a number of acute en-vironmental challenges. Deforestation in the upper reaches of river basins and inade-quate land-use management in both rural and urban areas have led to over a quarter of the land in El Salvador being affected by deg-radation, calling for better land-use manage-ment. Limited enforcement of building codes has led to the proliferation of settlements in increasingly steep slopes in the periphery of the main cities (see map 4.1).
Rapid and largely unplanned urbaniza-tion over the past decades has exacerbated environmental challenges and the impact of disasters. The character and severity of impacts from disasters depend not only on the extreme characteristics of the events itself but also on other factors such as environ-mental degradation, rapid and unplanned urbanization, and inadequate land use prac-tices that contribute to increasing trends in exposure and vulnerability to natural haz-ards. Average annual urban growth rate was 2.9 percent between 1970 and 2000 (and remains currently at around 1.4 percent
–4
0
4
8
12
16
20
0
10
20
30
40
50
60
ElSalvador
ElSalvador
LACaverage
Worldaverage
General government gross debt, percent of GDP
Lowermiddleincomeaverage
Structuralpeers
average
2007 2013 Difference (rhs)
FigurE 4.3 Fiscal Position Compares unfavorably with Other Countries
Source: IMF.

78 Sustainability Challenges
annually while the rural population is de-creasing by 0.7 percent annually). Limited urban planning and the high prevalence of poverty in urban areas has led to around 30 percent of urban dwellers living in slums with limited public services and exposed to risks, in particular the lack of adequate drainage increases the probability of land-slides and floods. In addition, limited en-forcement of land use regulations and poor construction practices have led to the pro-liferation of settlements in increasingly steep slopes or along the river protection areas in the periphery of the main cities, in-creasing exposure and vulnerability to haz-ards such as mudslides (World Bank 2014a,
adapted from PCC 2012. Managing the Risks of Extreme Events and Disasters to Advance Climate Change Adaptation).
More than 80 percent of the population lives in municipalities exposed to at least three types of disaster risks. There are few measures to fully evaluate the factors affect-ing social vulnerability and to measure the impact of disaster on poverty, and, to date, limited quantitative evidence exists which can identify the causal impact of disasters on shared prosperity and poverty (see box on knowledge gap below). A study of the im-pacts of Tropical Cyclone Agatha in 2010 in Guatemala finds that the storm resulted in a sizable and possibly persistent deterioration
MaP 4.1 Precarious Housing adds to the Vulnerabilities Faced by the Bottom 40
Source: World Bank.Note: Red areas indicate new settlements in the steepest slopes.

Sustainability Challenges 79
of human welfare among affected households, affecting their capacity to finance consump-tion of food and durable goods, as well as their children’s education, and pushing some of them back into poverty, and that urban households were as vulnerable as rural ones (Baez et al. 2015).
Acute environmental challengesUrban air pollution, including indoor air pol-lution (IAP), has important health impacts. Current air pollution in El Salvador is above WHO guidelines. With increasing urbaniza-tion and increasing use of automobiles, these figures are expected to increase. Air pollution levels in urban areas in El Salvador are already beyond the regional average and continued urbanization is likely to further add to this in the future. Further, more than 20 percent of people still use solid fuels for cooking, which is above the regional aver-age. The use of solid fuels is the main source for IAP and has important health impacts. The WHO estimates that IAP causes 22
deaths (per 100,000) and 495 Disability-Adjusted life years (DALYs) lost.6 Continued high levels of air pollution will impact pro-ductivity across all groups of society and will impact health and education situation, especially of children and young adults. Finally, energy subsidies on petroleum products not only distort markets in favor of inefficient energy use, but also add to the fiscal burden.
Solid waste management is still limited. Only half of the population in El Salvador is served by municipal waste collection, which is much lower than other countries in the region. With increased available cash income through economic develop-ment and remittances, demand for con-sumption goods is likely to increase with associated accumulation of solid waste. A specific area of solid waste management is the emergence of medical waste that comes with the increase in health care facilities and health services and requires special disposal management.
KNOWLEDgE gaP What is the impact of Frequent Natural Disasters on the More Vulnerable?
Identifying the causal effects of disasters on poverty and shared prosperity is challenging but necessary. Although the occurrence of a natural hazard could be considered exoge-nous, its transformation into a disaster is not. Less resourceful households located in haz-ard-prone areas are more vulnerable to the impacts of disasters and have less resilience to recover from them. While an exercise to understand the intersection of local exposure to climate sensitive hazards and social vulnerability was recently carried out for El Salvador (Amaya and Cabrera 2012), there is still a need to better understand this relationship and importantly fully integrate hazard exposure and social vulnerability into a comprehensive vulnerability assessment for the country, the linkages between disaster and poverty in El Salvador and how to improve coping and adaptive capacities for the poor.

80 Sustainability Challenges
Herbicide use is inadequately managed. The use of herbicides in Salvadoran agricul-ture is significantly higher than in other countries with possible future impacts on rivers and other aquatic systems, under-ground freshwater aquifers, and ocean pollu-tion. Throughout the value chain, herbicides pose a significant health risk for all humans working or handling these agro-chemicals as well as those exposed to improper manage-ment and disposal.
Improving land-use management. With over a quarter of the land in El Salvador af-fected by degradation and 16 percent of the people affected, land degradation has tradi-tionally been a challenge in the country and has been driven by high population density and the mountainous geography (over 50 percent of El Salvador is mountainous).
Environmental issues in urban areas are driven by rapid urbanization and the rela-tively high share of the population living in slums. The degree of urbanization (65 per-cent) is below the Latin America average (79 percent), but the urban population grows at 1.4 percent annually while the rural popula-tion is declining at an annual rate of −0.7 percent. Limited urban planning and the high prevalence of poverty in urban areas has led to around 30 percent of urban dwell-ers living in slums with limited public ser-vices and exposed to risks. Only half of the population is served by municipal waste col-lection, which is much lower than other countries in the region, and IAP levels in urban areas due to the use of solid fuels for cooking are also higher than the regional av-erage and are estimated to cause 22 deaths per 100,000 people (WHO).
There has been progress in expanding access to water and sanitation, although cov-erage is still not universal. While El Salvador
is on track to reach the MDG’s water and san-itation targets, sustaining the achieved results is compromised by rapid urban population growth and an insufficient investment in the sector. The population without access to im-proved drinking water services decreased from 26 percent in 1990 to 12 percent in 2010, and the population without access to improved sanitation services decreased from 25 percent in 1990 to 13 percent in 2010. There are some regional differences with urban areas enjoying higher access (94 per-cent in water and 89 percent in sanitation) than rural areas (76 percent in water and 83 percent in sanitation). Existing services show important quality limitations: 48 percent of the drinking water supply is qualified as in-termittent, 50 percent of the population re-ports deficiencies in the quality of water provided, and only 4.5 percent of the popula-tion reports that wastewater receives some treatment.
Investments in urban water and sanitation have been insufficient to offset urban popu-lation growth. The lack of investment is es-pecially critical in urban sanitation, where the MDG targets will not be met and the cover-age levels may continue decreasing. Further-more, the current tariff schemes do not cover operation costs, result in low quality services, and represent a barrier to service expansion.7 The efficiency of the sector is low as over 40 percent of the water is not billed for as a re-sult of high losses stemming from old infra-structure, theft, or high consumption from users to which a flat rate is billed (31 percent of users were not metered). Ninety percent of consumers are effectively receiving subsi-dized water yet the water sector accounts for over two thirds of all the complaints that the national consumer protection agency receives (UNDP 2010, 146–49).

Sustainability Challenges 81
The bottom 40 lives in more precarious housing, more vulnerable to both natural di-sasters and crime. Despite the destructive im-pact of the 2001 earthquake the main housing deficit is not a quantitative but a qualitative one. Some 41 percent of households experi-ence some deficit in their housing in access to services (electricity, water, sanitation), qual-ity of materials, overcrowding, or lack secure tenure (see appendix). This puts El Salvador in the fifth place among 18 Latin American countries in housing deficits. While there has been a steady improvement in the materials used, the rapid expansion of urban areas has often taken place with limited planning. Urban population growth is being accompanied by large increases in the urban footprint.8 Set-tlements have often been built in steep slopes, which add to the risks of mudslides (see map 4.1). Settlements in peri-urban areas are also more likely to be affected by criminal activity. The lack of adequate housing, together with low quality, or in some cases no public ser-vices in the neighborhood, perpetuates in-equality and undermines shared prosperity.
Climate change makes it all the more crit-ical to address these environmental and disaster- related challenges. El Salvador is particularly exposed to weather-related risks that are expected to become more frequent as a result of climate change, such as hurri-canes, floods, and droughts. Climate change is also expected to affect in the long-run the viability of traditional crops such as coffee. Although coffee has long ceased to hold the preeminent place in the Salvadoran economy that it held during much of the twentieth cen-tury, exports of coffee still amounted to around $300 million (or 6 percent of exports) and coffee is the second largest crop in area under cultivation after corn.9 Coffee is still an im-portant source of employment in rural areas,
with the coffee harvest alone providing ap-proximately 130,000 jobs.
Social SustainabilityThe main challenge to social sustain-ability stems from high levels of crime and violence. Salvadorans increasingly identify crime as the biggest problem in the country (see figure 4.4), more so than in any other country in Latin America (see figure 4.5).
The risks of violence affect dispropor-tionately the bottom 40. One way in which violence affects the bottom 40 disproportion-ately is in public transport in urban areas, which is used largely by the less well-off and which has been particularly hard-hit by
0
20
40
60
80
100
20062008
20102004
2012
Inflation Poverty UnemploymentOthers
Main problem in the country, percent ofrespondents
Economic issues Gangs Violence Crime
FigurE 4.4 People increasingly identify Crime as the Main Problem in the Country
Source: LAPOP.

82 Sustainability Challenges
criminals (USG-GoES 2011). Protecting the labor force while transiting to and from work will help increase the welfare of the popula-tion as a whole and of the bottom 40 in par-ticular since they are particularly reliant on public transport.
Slums create added pressures on social sus-tainability. As slums have become common
in all urban centers the share of households that live in such setting closely resembles the bottom 40. In fact, around 41 percent of households are considered to suffer a qualitative housing deficit (see figure 4.6), among the top five highest in Latin America and the Caribbean. Slums are one of the well-known environmental risk factors that contribute to crime and violence. Social vulnerability and socioeconomic conditions also influence coping and adaptive capacities with regard to hazards posed by natural disasters.
A number of challenges in tackling crime and violence relate to the area of justice and security (World Bank 2013). Overall, limited comparable data—for example on spending in prevention—as well as limited impact evaluations of interventions pose challenges to derive evidence-based policies. In addition to strengthening the statistical capacity, coor-dination efforts to develop a comprehensive plan for the sectors—possibly based around key indicators and through a results-in-formed budgeting framework, appear to be the most promising areas for engagement. With regard to specific areas in the justice and security sector—beyond prevention—key issues are as follows:
Police patrolling was the primary destina-tion of security spending. In 2011, almost 45
KNOWLEDgE gaP How Does Crime affect the Welfare of the Bottom 40 Percent?
There is limited information as to how crime affects the welfare of the bottom 40 percent. However, data collection in this area is necessarily difficult and existing surveys of percep-tions or victimization are not without caveats. Efforts to improve data and to analyze it would be critical to support an evidence-based approach to policy-making in this area.
0
10
20
30
40
Crime as main problem in the country, percentof respondents by country
El S
alva
dor
El S
alva
dor
Cost
a R
ica
Jam
aica
Dom
inic
an R
epub
licG
uate
mal
aEc
uado
rPe
ruM
exic
oPa
nam
aU
rugu
ayBe
lize
Hon
dura
sN
icar
agua
Colo
mbi
aPa
ragu
ayBr
azil
Hai
tiG
uyan
a
FigurE 4.5 Crime is Seen as a Bigger Problem in El Salvador than Elsewhere in LaC
Source: LAPOP.

Sustainability Challenges 83
percent of security spending was dedicated to this purpose. The overall composition of spending in Police Patrolling had not changed significantly during the last five years. Costs associated with personnel are by far the largest component, accounting for almost 80 percent of expenditures. Goods such as fuel, tires and car parts, guns and other equipment together with uniforms and food represent the second main source of spending (13 percent), followed by investments (3.3 percent), services (2.8 percent) and financial costs (1.2 percent).
Public spending on crime investigation and prosecution of charges is low compared to other segments of the security and justice services chain, but resources have been in-creasing faster than the workload. Combined, spending on Investigation from the police and the Attorney General’s Office represent half or the resources spent by criminal courts and one third of the expenditures on police patrolling.
The Judiciary is the only segment where public spending has been falling systemati-cally as a share of total security and justice spending. Spending on personnel rep-resents the largest and a growing share of the spending in the justice or judiciary segment.
Public spending in prisons and rehabilita-tion increased during the period, but it was not enough to meet the needs of this task. Spending has increased by almost 30 percent more than the total spending in the sector. The penitentiary system is in poor condition, unable to support its current population and, much less, to rehabilitate prisoners to be re-inserted in society.
Challenges regarding the human re-sources in the justice and security sector seem to be more qualitative than quantita-tive. The country has one of the highest numbers of police, prosecutors and public defenders in the region.
0
20
40
60
Percent of households with a qualitative housing deficit, access to infrastructure (electricity,water, and sanitation), materials, overcrowding, or lack of secure tenure
Nic
arag
uaG
uate
mal
a
Peru
Hon
dura
sEl
Sal
vado
rPa
ragu
ay
Boliv
iaD
omin
ican
Rep
ublic
Ecua
dor
Pana
ma
Arg
entin
a
Mex
ico
Braz
il
Uru
guay
Vene
zuel
a, R
B
Colo
mbi
a
Chile
Cost
a R
ica
FigurE 4.6 Poor Housing Creates the Conditions for Crime to Thrive
Source: Bouillon 2012.

84 Sustainability Challenges
Identifying Policy Areas to Buttress SustainabilityBased on the analysis presented above the following policy areas emerge as critical to boost sustainability:
Strengthening the fiscal positionPublic debt sustainability in El Salvador hinges mainly on sustaining fiscal discipline and strong economic growth. El Salvador’s chal-lenge is to stabilize and eventually reduce its debt level to create much needed fiscal space for growth and poverty reduction purposes and keep financing requirements manage-able. While growth plays a key role in ensur-ing the sustainability of the fiscal position, reforms are needed to avoid further deterio-ration of the debt ratios. Fiscal adjustments will require measures to increase revenue, reduce/reassign expenditures, and improve public expenditure management as well as debt management.
The main challenge on the revenue side is to achieve sustainable increases while avoid-ing that uncertainty over the tax framework further discourages investment. Over the last years tremendous efforts have been made at increasing revenue. Tax revenue has increased by almost 2 percent of GDP between 2008 and 2013—from 13.5 percent of GDP to 15.3 percent of GDP. This objective has been achieved through various measures includ-ing changes in tax rates, simplifying the tax system and tax administration. However, El Salvador still generates lower revenues than would be required by their substantial unmet social and infrastructure expenditure needs. Over the recent past, El Salvador has been running a primary fiscal deficit of well above
1.1 percent of GDP, which contributed to the large increase in debt. Tax adequacy is also low considering international and even re-gional trends. On average, regional tax rev-enue is estimated at 17.5 percent of GDP. Comparing El Salvador’s performance with that of other Latin American countries sug-gests that there is room for improving tax revenue performance. Possible measures in-clude but are not limited to increasing tax rates such as the VAT, limiting tax expendi-tures, creating new taxes, and improving en-forcement. Revenue mobilization efforts will help alleviate the fiscal situation but, as noted above, it is also important to strike the right balance between revenue raising efforts and providing a stable and predictable tax system.
The challenge in managing expenditure is complex and requires a good balancing act given the social and economic needs. El Salvador’s total Non-Financial Public Sector expenditure has averaged over 22 percent of GDP since 2008, increasing from 20.6 percent of GDP in 2008 to 23.8 percent of GDP in 2013. Overall public investment is low at 2.9 percent of GDP in 2013. Equally, social ex-penditures are still relatively low. Reducing drastically social expenditures in this context could be counterproductive given the magni-tude of the social needs. These aspects limit the prospects for reducing social expenditures significantly. However, as noted in Chapter 3 on inclusion, there is scope for improved tar-geting of social expenditures. Analyzing it from the budget structure angle, the potential for reducing expenditures substantially is also complicated by the structure of current ex-penditures. The bulk of current expenditures is allocated to salary and wages (37 percent of the budget), goods and services (19 percent of the budget) transfers—mainly subsidies—(17 percent of the budget), and interest payments

Sustainability Challenges 85
(12 percent of the budget). Salary and wages and interest payments are rigid, therefore ex-penditure reduction is likely to be limited to goods and services and subsidies, the latter posing the greatest challenge but also poten-tial opportunity.
Improve the country’s disaster resilienceMove from a reactive to a preventive approach. Natural disasters hit the poor and bottom 40 given where they live. It is critical to move from a reactive to a preventive approach to disaster risk management to increase disaster resilience. In addition, risk reduction and mitigation measures could be enhanced.
An effective budget management strategy that allows for the rapid mobilization of re-sources in case of a disaster while protecting fiscal accounts. Ideally this strategy combines budget allocation and reserves, contingent funds, and risk transfer instruments to safe-guard against disasters of all layers of frequency and magnitude.
There is a need to improve knowledge and assessment of disaster risk in order to reduce existing high levels of vulnerability in public assets. Such public assets span the education, health and other infrastructure sectors. A probabilistic risk assessment of 20 percent of the educational infrastructure in San Salvador, conducted under the umbrella of the Central America Probabilistic Risk Assessment Pro-gram (CAPRA), demonstrated the high vul-nerability of school buildings and the necessity to ramp up efforts to make them resilient to natural hazards. It is important to conduct ad-ditional assessments that provide complemen-tary understanding of the vulnerability of public, and especially school, buildings, and improve current practices to mitigate or avoid
those risks. Overall, stronger focus is needed on the structural dimensions of resilience.
It is also key to improve territorial and sector planning processes to appropriately integrate risk reduction criteria. In order to promote efficient disaster risk management and reduce vulnerability, substantial efforts are needed to augment the knowledge base of disaster risk at the local and sectoral lev-els. In addition to information and data, di-saster risk management needs to be better integrated into the urban development deci-sion-making process. To this end, it is criti-cal to strengthen the institutional framework and capacity for including disaster risk man-agement in land use planning and building codes and enforcing their application. In this context, the improvement and application of risk management in planning tools is needed to help reduce the constant regeneration of unacceptably high levels of vulnerability gen-erated from inadequate land use and water management as well as inappropriate build-ing practices.
There is a need to bring programs and plans up to scale to cover the entire country to benefit from a climate smart landscape ap-proach. Mitigation actions in the land use sector could bring substantial benefits for adaptation to climate change. An inter-sec-toral approach would enhance tackling the key drivers of forest loss and landscape deg-radation, and expansion of non-sustainable agricultural and livestock activities; urban growth and infrastructure development; ille-gal logging and firewood extraction; forest fires; and the expansion of productive activi-ties into mangrove ecosystems because of the economic value of these ecosystems and their importance for rural development and pov-erty alleviation. There is a need for finance options towards an adaptation-based

86 Sustainability Challenges
mitigation approach, which is framed under The National Program for the Restoration of Ecosystems and Landscapes (albeit with no budgetary provisions at the moment), such as strengthening the coffee plantations which are mainly managed in the modality of shade coffee and serve as a complex agroforestry system.
Provide securityFocus on prevention. Crime and violence is preventable. Still the Government of El Sal-vador only spends 3 percent of its citizen se-curity budget in prevention. Prevention is the most efficient way of responding to crime and violence and should be a key component of any sustainable strategy for the promotion of citizen security and social development. There are rigorously evaluated interventions that have demonstrated the success and
cost-effectiveness of this approach. This is particularly the case for youth violence prevention.
The importance of a broad national con-sensus. The authorities need to generate a national consensus around a minimum set of principles and objectives to guide a com-prehensive citizen security policy in the country, bringing all major parties, private sector, civil society, and development part-ners together.
Protecting youth at risk. One of the key challenges and opportunities of the new admin-istration is how to develop effective approaches to protect youth at risk from joining gangs. One way to do this is by supporting municipal based approaches that integrate the territo-ries and populations with high concentration of gangs with the rest of municipality in terms of access.
Notes 1. While state capacity is notoriously difficult
to benchmark across countries, an indicator such as the institutions pillar of the Global Competitiveness Report shows El Salvador lagging behind the averages for the region, lower middle income countries, the world, and the set of structural peers.
2. From 1992, when the VAT was introduced, to 2005 indirect taxes accounted for 70 percent of all tax revenues. Despite efforts to increase income tax collections that ratio is still around 63 percent as of 2013.
3. During this period, the country passed 13 tax reforms, including the creation of new taxes on specific goods and increasing rates (cor-porate and personal income tax, and selective taxes on consumption).
4. The fiscal position was already, however, under increasing stress even before the global economic crisis. Estimates of the cyclically adjusted fiscal balance suggest a structural deficit that had been growing steadily every year from around 2.7 percent
of GDP in 2000 to 4.2 percent of GDP in 2010 (Oliva 2011).
5. The key assumptions in this baseline scenario for the debt sustainability analysis were as fol-lows: (a) GDP is growth was expected to av-erage 1.9 percent over 2014 to 2019, which is equal to the historical average from 2003 to 2013; (b) Primary expenditure was projected to remain higher than revenue leading to an average primary deficit of 1.6 percent of GDP.
6. DALYs represent the sum of years of potential life lost due to premature mortality and the years of productive life lost due to disability.
7. MAPAS (2014). 8. The three largest metropolitan areas, San
Salvador, Santa Ana, and San Miguel grew in size during the first decade of this century by 30 percent, 120 percent, and 60 percent re-spectively (World Bank 2012c).
9. Data refers to 2012 which, given the impact of the coffee leaf rust in bringing down output and exports since 2013, may better reflect the medium-term conditions of the sector.
Synthesis and Priorities 87
To go beyond the proximate causes of El Salvador’s stagnation requires us to ad-dress also why it has proven so difficult to make progress and on which strengths can the country build. To identify the policy areas that could have the most impact in boosting shared prosperity in El Salvador it is not enough to undertake the benchmark-ing exercise and above analysis. Simply doing so would ignore two additional aspects. First, it is important to consider why, despite many efforts, it has been particularly difficult to make progress. Second, despite the numer-ous challenges discussed above, El Salvador has some existing strengths on which it can build. Any systematic diagnostic of the situa-tion in the country cannot overlook those strengths and the potential they bring.
Why Has It Proven So Difficult to Make Progress?In the midst of a civil war, the early 1980s was a period of economic policy un-certainty and increased state interventionism. In the midst of the civil war that affected the country in the 1980s a number of drastic changes affected significantly the economic policy environment. As the civil war intensi-fied the country faced a severe economic cri-sis which brought down per capita Gross Domestic Product (GDP) by 25 percent, halved exports, and pushed inflation up to 20 percent in the first three years of the 1980s. In the midst of this crisis, and in an effort to support for the insurgent groups, the
government increased the degree of interven-tion in the economy, introducing price and exchange controls, increased public spend-ing, nationalized banks and directed credit, and took over the exporting of sugar and coffee. These measures were ineffective and were also broadly rejected by the private sec-tor (UNDP 2013, 87).
This was followed by a swift adoption of liberalizing reforms in the 1990s and 2000s. By the early 1990s, in a much different con-text characterized by the signature of the peace agreements in 1992 and the end of the cold war, the country set out to implement a sweeping reform agenda aimed at opening up the economy and reducing the degree of state intervention. More than 250 price con-trols were dismantled from 1989 to 1994 and the regulatory framework for privatizing key sectors such as banking, electricity, and tele-communications was enacted. Privatizations in those sectors then took place throughout the 1990s. The state also divested itself from many other activities it had come to operate, including sugar mills, free trade zones, ho-tels, cement, etc.). El Salvador joined the Generalized Agreement on Tariffs and Trade in 1990, eliminated export taxes on sugar and coffee, reduced unilaterally import tar-iffs and eliminated most non-tariff barriers. It also enacted new laws for free trade zones and the promotion of exports in 1990. The record of policy reforms continued into the 2000s. For example El Salvador became one of the top reformers in the Doing Business indicators in the mid-2000s.
In summary, El Salvador’s underperfor-mance has taken place despite relatively
5. Synthesis and Priorities

88 Synthesis and Priorities
ambitious policy reforms in the last two decades. El Salvador has been, as a well-known diagnostic put it, a star reformer but, however, it has not been a star per-former (Hausmann and Rodrik 2005). Addressing this puzzle is the subject of the next section of this diagnostic.
A hypothesis: three vicious circles reinforcing stagnationThe challenge in El Salvador is not to identify the proximate causes of its relative stagnation but how those causes are inter-connected and what entry points there may be to break what can be characterized as vicious circles. The hypothesis explored here is that progress towards the goal of boosting shared prosperity has been ham-pered in El Salvador by a number of vicious circles that have reinforced stagnation and has made efforts at effecting change ineffective.
Vicious circle of low growth and high violenceThere is a vicious circle between low eco-nomic growth and violence. Low growth limits the income and the opportunities of the population, therefore creating incentives for some individuals to join a gang or narco group which may offer significant short term earning opportunities (particularly in coun-tries where impunity levels are high and the gangs have a strong and widespread presence in the country). In turn, high levels of vio-lence (El Salvador is one of the three Central American countries where the homicide rate is at the top of global rankings) have a sig-nificant negative impact on the investment climate (security costs in El Salvador rep-resent about 3.5 percent of firms annual sales, and these is increasing evidence that crime and extortions are prompting firms to exit the market place altogether). The higher risks and costs of insecurity deter investment and reduce firm profitability resulting in lower productivity growth—which in turn hampers overall economic growth in a self-reinforcing negative cycle.
Vicious circle of low growth and migrationLimited growth and the ensuing lack of op-portunities are pushing many to migrate. The main motivation for Latin American mi-grants is economic (Niimi and Ozden 2008, 52). There is a large real wage gap that keeps attracting immigrants to the US. The average annual earnings of a Salvadoran immigrant working full-time in the US in 2011 was $33,600 for men and $26,400 for women (CEMLA 2013). This results in a per capita income for Salvadorans in the US of around
FigurE 5.1 Vicious Circle of Low growth and High Violence
Low economicgrowth
Lack ofopportunities
Violence
Lowinvestment
Perceptionof instability
Highsecurity
costs
Lowproductivity
growth
Low firmprofitability
Policy lever:violence
prevention& law
enforcement

Synthesis and Priorities 89
$19,800 or more than five times higher than the equivalent per capita income in El Salvador. Significantly, this ratio has not shown signs that it is decreasing significantly (the per capita income of Salvadorans in the US in 2004 was slightly less than six times that in El Salvador; UNDP 2005).
Another key push factor for migration is the situation of widespread violence. While it is difficult to pinpoint exactly the causes of migration one source of informa-tion stems from the LAPOP surveys that capture an individuals’ intention to migrate as well as many individual characteristics. Based on such data, estimates on the deter-minants of the intention to migrate among Salvadorans find that, in addition to the economic situation, other variables that are also strongly correlated with the intention to migrate include the degree of satisfac-tion with one’s life, having relatives abroad, victimization, and age (Arnold, Hamilton, and Moore 2011).
High migration rates have led to the high importance of remittances, with beneficial impact on the welfare of recipients. Both the volume and the importance of remittances as a share of GDP have seen a trend increase over the last two decades, although the global economic crisis put a temporary pause in this trend. At over 16 percent of GDP remittances are an important source of income for many Salvadoran households. Around 13 percent of households in the bottom 40 receive remittances, a share which has been relatively stable over time, while the corresponding figure for the top 60 is 18 percent. As in other countries, households at the very bottom of the in-come distribution are less likely to be recipi-ents of remittances (among the lowest decile only 8 percent of households receive remit-tances). This is in part driven by the fact that receiving remittances is likely to in-crease income so significantly that the household may no longer be in the lowest decile of the income distribution. While many households in the top 60 percent re-ceive remittances the overall share of remit-tances in their income is much smaller than for the bottom 40. As a result remittances have an equalizing impact. Estimates sug-gest that without remittances the Gini coef-ficient would be around 2 percentage points higher (Acosta et al. 2008). Among recipient households remittances reduced poverty at the $2/day by 40 percent in 2000.
Remittances are contributing to a Dutch disease syndrome through higher wages and real exchange rate appreciation. Increases in capital inflows lead to an increase in con-sumer demand while, as households see their incomes rise, reservation wages increase and labor supply falls. In a small, open economy, this translates into an increase only in the
FigurE 5.2 Vicious Circle of Low growth and Migration
Violence
Higherwages &
lower laborforce
participation
MigrationRemittances
Lower competitiveness
Inadequateskills due to
pooreducationalattainment
Policy lever:improving
education andskills to
compete
Loweconomic
growth

90 Synthesis and Priorities
price of non-tradable goods and services, leading to a reallocation away from the trad-able sector to the non-tradable sector and a real exchange rate appreciation. Among Latin America and the Caribbean (LAC) economies, the impact of a one percentage increase in remittances as a proportion of GDP is estimated to lead to a real exchange rate appreciation of 2.5 percent if remit-tances are taken as exogenous, and 18–24 percent if the models correct for reverse cau-sality in which real exchange rates also affect the migrants decision to send remittances (Lopez, Molina, and Bussolo 2008). Lartey, Mandelman, and Acosta (2009) confirm Dutch disease in El Salvador, finding real ex-change rate appreciation due to remittances using quarterly macroeconomic data. Furthermore, they find that both altruistic remittances (which are largely directed to consumption) and self-interested remit-tances (investments by migrants) result in a reallocation of resources to the non-tradable sector and a real exchange rate appreciation.
The real exchange rate appreciation un-dermines competitiveness. A computable general equilibrium (CGE) modeling exer-cise undertaken for this SCD sheds light on the mechanisms through which competitive-ness of the Salvadoran firms is affected by re-mittances. A simulated increase in remittances would lead to increase in prices (especially in services), wages, and imports, and will result in a decline in exports, espe-cially of textiles (see box 5.1).
Migration has also reduced the labor force significantly. In its most direct way mi-gration implies the removal of a labor force that otherwise would be available in country. Estimates suggest that there is a negative contribution of migration through brain drain as the country spends more educating
migrants than it receives as remittances (Cabrera 2011 as quoted in USG-GoES 2011). The impact of this removal from the domestic labor force is aggravated by the fact that migrants are a self-selected group which tends to be more educated—as is indeed the case among Salvadoran migrants—and more entrepreneurial. As a result migration may lower both the contribution of labor to growth but also had an impact on labor pro-ductivity growth.
Migration has also contributed to the re-duction in the labor force indirectly: females in households that receive remittances have lower labor force participation rates. Micro-econometric evidence has uncovered that re-mittances reduce labor for participation for women at all ages, with a higher negative im-pact at younger ages, presumably allowing maternity options or home-based activities (Acosta 2006). The finding that receiving re-mittances reduces the participation of women in the labor force explains the hori-zontal arrow between remittances and drop-ping out of the labor force shown in figure above.
And migration may be undermining the incentive of the youth left behind to invest in education. Although returns to education are high in El Salvador and Guatemala, returns to education in the U.S. among Salvadoran are low (much lower than for those born and educated in the US) and educated Salvadoran immigrants often end up in low-skilled jobs in the US. This may be because of the low quality of education in Central America, or because incompatibilities in the education systems mean that employers in the US do not value the education immi-grants have received in El Salvador. On top of this, wages for low-skilled labor in the US are often higher than those for high-skilled
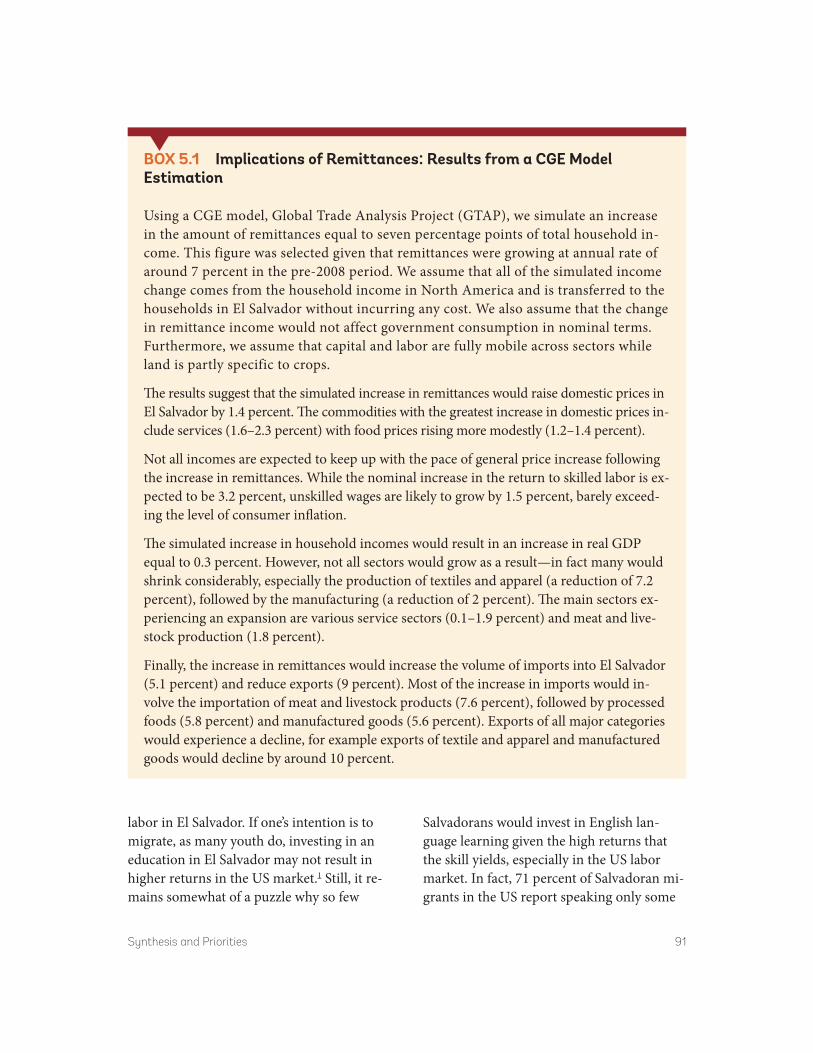
Synthesis and Priorities 91
labor in El Salvador. If one’s intention is to migrate, as many youth do, investing in an education in El Salvador may not result in higher returns in the US market.1 Still, it re-mains somewhat of a puzzle why so few
Salvadorans would invest in English lan-guage learning given the high returns that the skill yields, especially in the US labor market. In fact, 71 percent of Salvadoran mi-grants in the US report speaking only some
BOX 5.1 implications of remittances: results from a CgE Model Estimation
Using a CGE model, Global Trade Analysis Project (GTAP), we simulate an increase in the amount of remittances equal to seven percentage points of total household in-come. This figure was selected given that remittances were growing at annual rate of around 7 percent in the pre-2008 period. We assume that all of the simulated income change comes from the household income in North America and is transferred to the households in El Salvador without incurring any cost. We also assume that the change in remittance income would not affect government consumption in nominal terms. Furthermore, we assume that capital and labor are fully mobile across sectors while land is partly specific to crops.
The results suggest that the simulated increase in remittances would raise domestic prices in El Salvador by 1.4 percent. The commodities with the greatest increase in domestic prices in-clude services (1.6–2.3 percent) with food prices rising more modestly (1.2–1.4 percent).
Not all incomes are expected to keep up with the pace of general price increase following the increase in remittances. While the nominal increase in the return to skilled labor is ex-pected to be 3.2 percent, unskilled wages are likely to grow by 1.5 percent, barely exceed-ing the level of consumer inflation.
The simulated increase in household incomes would result in an increase in real GDP equal to 0.3 percent. However, not all sectors would grow as a result—in fact many would shrink considerably, especially the production of textiles and apparel (a reduction of 7.2 percent), followed by the manufacturing (a reduction of 2 percent). The main sectors ex-periencing an expansion are various service sectors (0.1–1.9 percent) and meat and live-stock production (1.8 percent).
Finally, the increase in remittances would increase the volume of imports into El Salvador (5.1 percent) and reduce exports (9 percent). Most of the increase in imports would in-volve the importation of meat and livestock products (7.6 percent), followed by processed foods (5.8 percent) and manufactured goods (5.6 percent). Exports of all major categories would experience a decline, for example exports of textile and apparel and manufactured goods would decline by around 10 percent.

92 Synthesis and Priorities
English (CEMLA 2014). The limited invest-ment even in skills that would yield high re-turns even in the US, such as English language skills, suggests that besides incen-tives other factors may be at play.
Parental absence due to migration may also be having an effect on the children’s education. Disentangling the effects of mi-gration on human capital formation is difficult. On one hand, remittances provide income that is often used to keep children in school—and indeed this is the case in El Salvador where receiving remittances in-creases school attendance among girls through the ages of 17 and boys through the ages of 14 (Acosta 2006). On the other hand, it has now been documented in other coun-tries that the absence of parents because of migration, especially during children’s ado-lescent years, can have a negative effect on the behavior of children left behind (McKenzie and Rapoport 2006). For exam-ple, parental absence as a result of migration may translate into less parental inputs into education acquisition and may also require remaining children to undertake housework or work to help meeting short-term labor and cash shortages. In El Salvador, where currently 19 percent of all children live in households where at least one parent has migrated (see figure 5.3), the negative im-pact of parental migration on the children’s investment in education may be significant.
Overall, while migration and the accom-panying remittances support welfare they also contribute to a stagnant economy. Estimates for the Latin America and Caribbean region suggest that remittances are also associated with increased economic growth: doubling the share of remittances in GDP is associated with growth increasing by 0.5–1.3 percentage points, with roughly half
of this growth resulting from remittances being channeled into increased investment (Acosta et al. 2008). However, in the case of El Salvador such an increase in investment has not materialized, and hence growth has not been boosted by remittances. The experi-ence of El Salvador may stem ultimately from the fact that the greatest driver of rising remittances is rising migration, which has an
FigurE 5.3 Children Often Live in Households Where at Least One Parent Has Migrated
0
10
20
30
40
La U
nión
Caba
ñas
San
Mig
uel
Mor
azán
Chal
aten
ango
Usu
lutá
nSa
n Vi
cent
eSa
nta
Ana
La L
iber
tad
La P
azSo
nson
ate
Cusc
atla
nA
huac
hapá
nSa
n Sa
lvad
or
Both Mother Father
Average
Share of children with at least one parent livingabroad, by department (2012, percent)
Source: World Bank staff based on EHPM.
FigurE 5.4 Vicious Circle of Low growth and Low Savings and investments
Consumption (especially imports)
Remittances
Low investment
Low economic
growth
Migration
Violence Policy levers:Improving productive
services and increasing financial inclusionLow
savings

Synthesis and Priorities 93
opportunity cost. Net of that cost, there may be little reason to expect large growth effects of remittances in the origin economy (Clemens and McKenzie 2014).
Vicious circle of low growth and low savings and investmentReceiving migrant remittances appears to lower the savings rate. When faced with limited access to credit and insurance mar-kets, remittances have the potential to smooth consumption. There is little evi-dence, however, that remittances in El Salvador have been used as insurance. The propensity to save out of the remittances in-come is lower than the corresponding sav-ings rate from non-remittance income (Acosta, Fajnzylber, and Lopez 2008, 139). Remittances in El Salvador are pro-cyclical, as they are sensitive to labor market condi-tions in the US, in contrast to the situation in other LAC countries, which respond to reductions in real output below trend with more than a proportional increase. At the same time, though remittances have re-sulted in increased consumption in El Salvador and consumer credit accounts for a significant proportion of private debt in El Salvador, receipt of remittances between 1995 and 2001 did not lead to higher con-sumer debt (Anzoategui, Demirguc-Kunt, and Martinez Peria 2014).2
In fact, El Salvador stands out as having a particularly low savings ratio. Gross national savings stood at an average of 11 percent of GDP in 2000–13, lower than any of its com-parators (structural peers were closest, at 13 percent, averages for LAC, lower middle in-come countries, and the world were much higher at 16, 20, and 201 percent of GDP respectively).
This is normally explained by the lack of investment opportunities given the persis-tently low growth. Most analysts suggest that the main constraint behind low invest-ment is the lack of profitable investment opportunities. The cost of capital is not par-ticularly high either, which confirms this view (USG-GoES 2011). This constitutes a vicious cycle by itself, in which low invest-ment leads to low growth and fewer invest-ment opportunities, feeding into ever lower investment. The declining contribution of capital to GDP growth obtained from the growth accounting decomposition shown in figure 2.1 above is evidence that this vi-cious cycle is at play.
But low investment and low savings likely reinforce each other. In principle the low savings ratio is not necessarily a bind-ing constraint for growth because the country could have access to foreign sav-ings. In fact, under that logic, increasing the domestic savings rate in the absence of an improvement in investment opportuni-ties would simply lead to those additional savings being invested abroad. In practice, however, investment and savings rates are highly correlated across countries. There are no shortage of explanations of this finding, long-known as the Feldstein-Horioka puzzle, but for our purposes it may suffice to note that in a world where investors exhibit home bias raising the sav-ings rate could in fact help boost the in-vestment rate.
And an underdeveloped financial system makes saving difficult. As noted above only 6 percent of the bottom 40 have an account in a formal financial institution, less than half the average in lower middle income countries and less than a third of the aver-age in LAC.

94 Synthesis and Priorities
Entry points: education, security, and financial inclusionEducation, security, and financial inclusion appear to be areas where efforts to break the vicious circles could potentially focus. A fur-ther discussion on prioritization will be un-dertaken later in this chapter but at this stage it seems appropriate to reflect on what possi-ble entry points there may be to break the vi-cious circles. By their very nature, the vicious circles described above are difficult to break. Migration and remittances, for example, would appear to be relatively difficult to in-fluence through policy interventions. Other areas, however, may be more amenable to policy action. Improving education or finan-cial inclusion may be such areas. Improving security, while in itself a most difficult chal-lenge, also appears to be a critical entry point given that violence is at the core of the vi-cious circles described above.
Opportunities: Building on StrengthsMaking the most of remittancesRemittances are likely to remain a signifi-cant source of income for many Salvadoran households. Although Salvadoran migrants in the US remit a lower share of their in-come, around 13 percent, compared to Hondurans (27 percent) or Guatemalans (30 percent) (CEMLA 2014), trends in re-mitting have been broadly stable and driven by labor market conditions in the US. In addition, the outflow of migrants is still on-going. Asked about whether they intend to migrate within the next three years, over 23 percent of Salvadorans they answer that they intend to migrate, one of the highest levels among Latin American countries
(LAPOP 2012 surveys). Given that, as dis-cussed above, the most important correlate of the intention to migrate is age (with younger individuals more likely to report intending to migrate), and taking into ac-count the still very young population (see population pyramid in figure 3.21 above), El Salvador is likely to continue experienc-ing outmigration and in turn receiving ever higher remittances.
How can remittances lead to higher sav-ings and investment rates? Education and in-stitutions are critical. The available literature suggests that remittances are more effective at raising investment and growth in coun-tries with higher levels of human capital, strong institutions, and good policy environ-ments (Calderon, Fajnzylber, and Lopez 2008, 366). This provides a further rationale for addressing education and skills and state capacity.
Education will not only help maximize the impact of remittances but it is also a binding constraint in and of it itself. The decrease of earning premiums for second-ary education since 1998 has led some to argue that there is only limited demand for an educated workforce and therefore no ev-idence that this is a binding constraint to growth (USG-GoES 2011). However, the percentage of firms in the Enterprise Survey that mention an inadequately edu-cated workforce as their biggest obstacle has doubled between 2006 and 2010, from 3.7 to 7.4 percent (which is now above the average for lower middle income coun-tries). And 30 percent of firms identify an inadequately educated workforce as a major constraint compared to only 6 percent of firms identify labor regulations as a major constraint. Sixty percent of firms state that the most difficult skills to find when hiring
Synthesis and Priorities 95
are technical ones (which include ability to speak a foreign language, problem solving and analytical thinking). There is also evi-dence that educational provision does not adequately meet demand in the science and technology sector (UNCTAD 2011). Efforts at workforce development and training can result in higher skilled job creation and at-traction (USAID 2008). Overall, there is in-creasing evidence that education is a binding constraint to growth.
Exploring ways to increase the savings rate out of remittances would also be im-portant. While remittances in El Salvador have historically been spent on consump-tion goods, recent research suggests that creating tools that enable immigrants to have more control over how remittances are spent would lead to more savings and investment. In a randomized experiment setting, Ambler, Aycinena, and Yang (2014) found that providing matching funds for educational remittances in El Salvador led to increased educational expenditures ($3.72 for every dollar received), higher private school attendance and lower youth labor supply. However, the take-up rate by migrants was low, with only 18.5 percent of migrants offered a 3:1 match and 6.9 percent of migrants offered a 1:1 match tak-ing part in the program. In a separate ran-domized controlled trial among Salvadoran immigrants in the Washington, DC metro-politan area, Ashraf et al. (2015) found that senders of remittances would prefer that re-mittances be saved at a higher rate than re-mittance beneficiaries (21.2 percent versus 2.6 percent). Additionally, when migrants were given more control over how remit-tances were spent through shared savings accounts they remitted more and the recip-ient household saved more. In a related
development, advances in technology have facilitated the creation of commitment sav-ings accounts that can be customized to an individual’s goals and may help increase savings rates. Given the low levels of finan-cial inclusion exploring innovative schemes through mobile banking would be worthwhile.
Making the most of geographic and cultural proximity to large marketsEl Salvador’s experience confirms that trade agreements create opportunities but do not guarantee results. The benefits of trade agreements appear to be related to a comple-mentary agenda which includes the quality of institutions, human capital, infrastructure, and technology adoption and upgrading. In the case of Central America this comple-mentary agenda is large (see Lopez and Shankar 2011). In the latest Enterprise Survey 27 percent of firms identified cus-toms and trade regulations as a major con-straint and 32 percent identified transportation as a major constraint. Improving connectivity is likely to give a boost to exports. Estimates from a CGE model simulation suggest that a reduction in trading costs of around 18 percent (equiva-lent to achieving the same transport costs as in the US-Costa Rica corridor) would in-crease exports by around 1 percent, although it would also increase imports, by around 1.5 percent (see box 5.2).
El Salvador’s geographic and cultural proximity to the US provides a significant opportunity. The fact that El Salvador’s pop-ulation has a deep familiarity with the US culture and marketplace represents a poten-tial asset. Geographic proximity to the US is

96 Synthesis and Priorities
a contributing factor, in addition to having a vibrant air transport hub, behind the devel-opment of export markets for some services such as airline plane maintenance service. Proximity to the US is one of the factors that is supporting the development of the soft-ware industry in neighboring Guatemala. This is because thanks to the heavy flow of people back and forth from the US, develop-ers of digital content are very in touch with North American culture, which gives them a competitive advantage. Being in the same time zone as the US and having a qualified
workforce with good English-language skills are potential factors driving El Salvador’s competitive advantage.
Making the most of regional integrationThe integration of markets and infrastruc-ture networks has extraordinary power to stimulate growth through efficiency gains, technology spillovers and investment. However, despite several notable bright spots in economic cooperation, the promise of
BOX 5.2 implications of Lowering Trading Costs: results from a CgE Model Estimation
Using a CGE model, GTAP, we simulate an increase in the efficiency of trading costs for trade between the US and El Salvador which would bring its costs down to the level of Costa Rica, which is the best regional performer in terms of import costs with the US. Bilateral trade costs between the US and Costa Rica are reported at $80 per shipment in 2011, while they stand at $95 for El Salvador; we therefore simulate an 18.7 percent im-provement in the efficiency of transport services for trade.
The general macroeconomic impact of the reduction in trading costs is expected to be small due to the size of the shock, increasing domestic prices by only 0.1 percent and un-skilled wages by 0.5 percent. The largest decline in prices is expected among textile and apparel (0.3 percent) manufactured goods (0.1 percent).
Even though the overall output of El Salvador would barely change, some sectors are ex-pected to experience noticeable changes in output as a result of the simulated change in trading costs. The largest growth is expected to occur in textiles and apparel which would grow by 1.9 percent. The largest reduction is expected in the sector of other manufactured goods which is expected to contract by 0.9 percent.
The reduction in trading costs would also have a noticeable implication for El Salvador’s exports, whose volume is expected to grow by 1 percent, and imports which are expected to grow by 1.5 percent. At the sectoral level, the largest increase in imports is expected for grains (3 percent) and textiles and apparel (2.4 percent). The greatest increase in exports is predicted for textiles and apparel (3.4 percent).

Synthesis and Priorities 97
greater regional integration among the Central American countries has remained largely unfulfilled. Central America’s efforts at forming greater regional economic ties have been ongoing for decades, most notably on the trade side stretching from the estab-lishment of a Central American Common Market in the 1970s to the Dominican Republic-Central America Free Trade Agreement and the EU-Central America Free Trade Agreement.
There have been several significant inte-gration successes outside of trade, including in the energy sector. The Sistema de Interconexión Eléctrica de los Países de América Central (SIEPAC), a transmission line project which came into being in June 2013 and connects the electricity grids of Panama, Costa Rica, Honduras, El Salvador, Guatemala, and Nicaragua. While its benefits have so far been limited, that interconnec-tion could enhance investment opportunities for large-scale energy projects, as well as im-prove the efficiency and the security of elec-tricity supply in Central America. Further integration with Mexico, especially in the area of energy, could also help lower the costs of energy. Financial interconnectedness is also on the rise, with almost all the banks in the region expanding operations into neighboring countries, although differences in legal and regulatory frameworks have lim-ited greater connectedness.
But Central America has not fully real-ized the gains expected from integration ef-forts. Exporters have not experienced appreciable growth in either export lines or markets since the signing of the regional free trade agreements. Bilateral trade in Central America remains an agenda of largely un-tapped opportunities, as evidenced by the negative elasticity of bilateral trade to
different factors including adjacency and time adjusted distance (Marcelo, Stokenberga, and Schwartz 2010). This un-tapped potential can be attributed to defi-ciencies in infrastructure, burdensome processes and congestion at the border crossings limiting trade, even where dis-tances are short. Poor road quality, particu-larly on secondary and unpaved rural roads, has led to road transport prices averaging 17 cents per ton-kilometer in Central America, one of the highest road transportation costs in the world (Osborne, Pachón, and Araya 2014). In addition, port reforms are still pending. Burdensome customs procedures, lack of regulatory harmonization (for exam-ple in terms of phytosanitary standards for agricultural exports), few established trade linkages, an atomized shipping industry, sparse information sharing on cargo and backhaul in trucking, and relatively few op-tions and competition for shipping also limit the gains from trade free trade agreements. Transport and logistics costs can surpass 50 percent of the final price of goods traded, and it has been estimated that intraregional exports in Central America could double if the region achieved the adjacency and time distance factors of a truly integrated region (Marcelo, Stokenberga, and Schwartz 2010).
Making the most of the manufacturing baseEl Salvador retains a relatively large manu-facturing base. At 20 percent of value added manufacturing is significantly higher in El Salvador than in the set of comparators (see figure 5.5 below). This high share of manu-facturing is not the simply the result of the maquila boom in the 1990s. In fact, El Salvador has a long-standing tradition of

98 Synthesis and Priorities
manufacturing that dates back decades and established itself early on as the manufac-turing center in Central America. Besides manufacturing El Salvador was also an early adopter of other technologically ad-vanced areas of activity such as geothermal energy, which it started to produce in 1975 and on which it has become a regional leader. A number of industrial niches where El Salvador has seen significant ex-port growth. As shown in figure 5.6 below, exports of organic chemicals, synthetic fi-bers, and special fabrics have multiplied by six or more since 2005, while exports of plastics have roughly tripled since 2005. Plastics have now become the second larg-est export good after textiles (in a classifica-tion of exports into 98 product groups). The increase in the export of plastics, which went from 3 percent of total exports in 2005 to 6 percent of total exports in 2013, as well as related groups such as synthetic
fibers suggesting a growing competitiveness of El Salvador in the plastics-synthetic fi-bers cluster. The planned introduction of natural gas through the Acajutla port, while primarily for power generation, also pro-vides an opportunity to make available lower cost feedstock, further enhancing the competitiveness of this industry. While this analysis is not intended to be comprehen-sive it suggests that is realistic for El Salvador to build on existing strengths in its manufacturing base.
Available analyses suggest a number of manufacturing sub-sectors that are grow-ing. Drawing on the “product space” and on an analysis of revealed comparative ad-vantage and labor productivity by sector, Amaya and Cabrera (2013) suggest that there are in fact a number of clusters of economic activity that hold great poten-tial for El Salvador (box 5.3). These in-clude a broad range of activities, from
FigurE 5.5 Higher Manufacturing Base than Other Countries
20
1613 12
0
10
20
Share of manufacturing in value added(percent of GDP, average 2011-2013)
ElSalvador
Structuralpeers
average
LACaverage
Worldaverage
Lowermiddleincomeaverage
12
Source: World Bank.
FigurE 5.6 Dynamic Export Performance in Selected Manufacturing Sectors
0
2
4
6
8
10
1 100 10,000Rat
io e
xpor
ts in
201
3/ex
port
s in
200
5
Value of exports (US$ million, 2013)
Value of exports by sector (US$ million, 2013)in horizontal axis; Ratio of exports in 2013
over exports in 2005 by sector
Plastics
Synthetic fibersOrganic chemistry Special fabrics
Source: Central Bank of El Salvador.
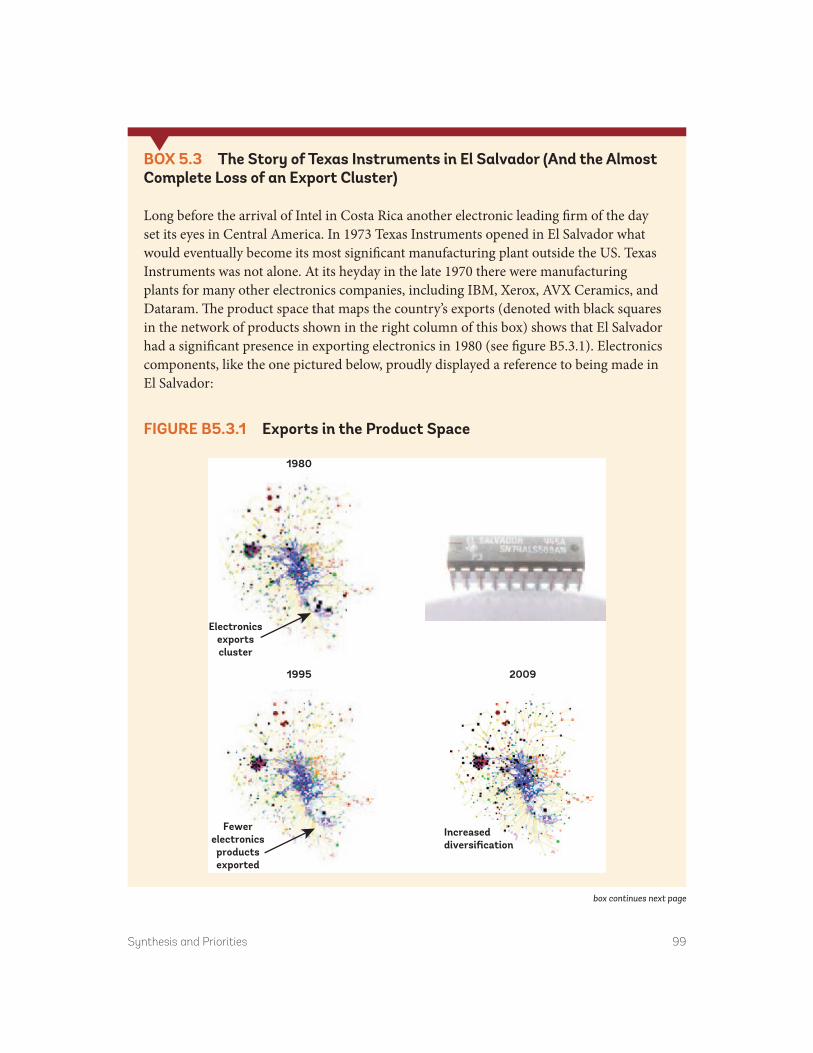
Synthesis and Priorities 99
BOX 5.3 The Story of Texas instruments in El Salvador (and the almost Complete Loss of an Export Cluster)
Long before the arrival of Intel in Costa Rica another electronic leading firm of the day set its eyes in Central America. In 1973 Texas Instruments opened in El Salvador what would eventually become its most significant manufacturing plant outside the US. Texas Instruments was not alone. At its heyday in the late 1970 there were manufacturing plants for many other electronics companies, including IBM, Xerox, AVX Ceramics, and Dataram. The product space that maps the country’s exports (denoted with black squares in the network of products shown in the right column of this box) shows that El Salvador had a significant presence in exporting electronics in 1980 (see figure B5.3.1). Electronics components, like the one pictured below, proudly displayed a reference to being made in El Salvador:
box continues next page
1980
Electronicsexportscluster
1995
Fewerelectronics
productsexported
2009
Increaseddiversification
FigurE B5.3.1 Exports in the Product Space

100 Synthesis and Priorities
special aircraft and refrigerators to medi-cines, synthetic fibers, alcohol, and paint. Some pockets of El Salvador manufactur-ing are sophisticated enough to be able to export vaccines and hormones or to be part of global value chains that produce smartphones. Identifying specific bottle-necks that may be preventing further growth of these niches would be an impor-tant contribution of public policy.
And some of those sectors already show a revealed comparative advantage. While an analysis of revealed comparative advantage is necessarily backward looking it can help identify pockets where further export growth could materialize in the short-term. The
cluster around plastics, which was identified as high growth, is one such example where it has already reached the stage where it en-joys a revealed comparative advantage (see figure 5.7).
A number of successful firms have proven that the opportunities identified above can be realized. The strengths and opportunities highlighted above are not just theoretical. Box 5.4 below provides concrete examples of firms that have survived and thrived by making the most of the manufacturing base, of the Central American regional market, and of the geographic proximity and connec-tivity to large markets. These are firms that are generating skilled manufacturing jobs
The arrival of Texas Instruments to El Salvador followed the adoption of the 1974 Export Promotion Law, which provided for tax holidays, unrestricted repatriation of profits, guarantees against expropriation, and a specialized recruiting agency for laborers. Texas Instruments operated out of the San Bartolo Free Trade Zone and employed at its peak around 5,000 workers in two manufacturing facilities and drew on 300 local suppliers.
Like most other foreign firms, Texas Instruments closed its operations in El Salvador in the early- to mid-1980s due in part to difficult operating conditions in the midst of the civil war. In the first three years of the 1980s it is estimated that capital outflows exceeded $1 billion. The promising electronics cluster did not survive. The product space for 1995 shows a much diminished presence in the exports of electronics, and indeed a significant reduction in the diversification of exports. While it is difficult to regain a footing in a rap-idly evolving market such as electronics, and indeed the electronics sector has yet to make a comeback in El Salvador, the product space for 2009 shows a promising increased in the diversification of exports.Sources: Bleakley 1984; Ibarra 2010; Amaya and Cabrera 2013.
BOX 5.3 continued
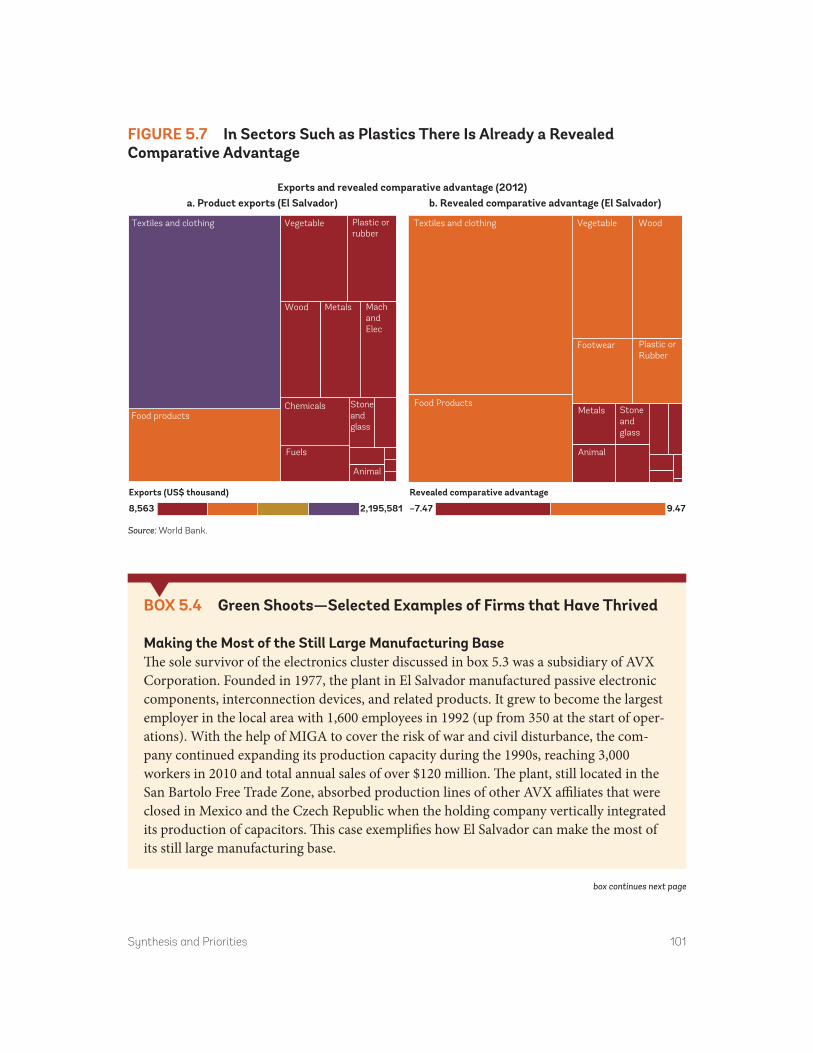
Synthesis and Priorities 101
FigurE 5.7 in Sectors Such as Plastics There is already a revealed Comparative advantage
Textiles and clothing
a. Product exports (El Salvador)Exports and revealed comparative advantage (2012)
Exports (US$ thousand)
8,563 2,195,581
Vegetable
Wood
ChemicalsFood products
Fuels
Animal
Stoneandglass
Metals MachandElec
Plastic orrubber
b. Revealed comparative advantage (El Salvador)
–7.47 9.47
Revealed comparative advantage
Textiles and clothing Vegetable Wood
Food Products
Animal
Stoneandglass
Metals
Footwear Plastic orRubber
Source: World Bank.
BOX 5.4 green Shoots—Selected Examples of Firms that Have Thrived
Making the Most of the Still Large Manufacturing BaseThe sole survivor of the electronics cluster discussed in box 5.3 was a subsidiary of AVX Corporation. Founded in 1977, the plant in El Salvador manufactured passive electronic components, interconnection devices, and related products. It grew to become the largest employer in the local area with 1,600 employees in 1992 (up from 350 at the start of oper-ations). With the help of MIGA to cover the risk of war and civil disturbance, the com-pany continued expanding its production capacity during the 1990s, reaching 3,000 workers in 2010 and total annual sales of over $120 million. The plant, still located in the San Bartolo Free Trade Zone, absorbed production lines of other AVX affiliates that were closed in Mexico and the Czech Republic when the holding company vertically integrated its production of capacitors. This case exemplifies how El Salvador can make the most of its still large manufacturing base.
box continues next page

102 Synthesis and Priorities
Making the Most of regional integrationBon Appetit was established in 1982 by the Zablah family with the idea to export ethnic foods towards migrant workers in the US (a “nostalgic” market). Although nostalgic ex-ports did not take off at that time the company survived through the 1980s by supplying the Salvadoran army. Trying to diversify its revenue sources, the company started experi-menting with non-carbonated beverages and launched the bottled flavored drink called Frutsi, which was a success and prompted the opening of a new plant in La Libertad. The new plant allowed them to reach a packaging and royalty deal with Del Monte drinks.
With the opening up of the economy in the early 1990s the country lowered tariffs on im-ported goods, bringing in competition. The army contract ended and Del Monte changed its royalty agreement into a manufacturing agreement with reduced profit margins. The company needed to reinvent itself and raised $2 million of equity through the sale of 30 percent of its shares to the Inter-American Investment Corporation (IIC), to upgrade its plant and the Gatorade sports drink for Quaker (which meant letting go of the food busi-ness lines). The company grew and increased its productivity by obtaining the permit for 12 hour shifts (which was seen as key to profitability and further growth).
In 2000 Quaker was bought by PepsiCo, opening the door for dialogue with the regional bottler Central American Bottling Corporation (CABCORP)—the preferred bottling partner of PepsiCo. CABCORP acquired 50 percent of the company in 2002 and ex-panded production capacity. The company continued to grow and began exporting large volumes to Guatemala, Honduras, and Nicaragua. After 6 years of increased product lines, CABCORP increased its ownership stake to 95 percent in 2009 (changing the company name to Livsmart). By being part of a larger company, Livsmart was able to face increasing competition, since in 2008 the Mexican Company Jumex inaugurated its state-of-the art processing and bottling juice plant in El Salvador ($20 million invest-ment), from where it exports to over 20 countries and serves the Central America mar-ket. As the end of 2012, Livsmart generated 17 percent of all of CABCORP’s EBITDA, or approximately $21.3 million, with sales of over $130 million. It served markets in Guatemala, El Salvador, Honduras, Nicaragua, Costa Rica, Panama, Puerto Rico, Haiti, the Dominican Republic, Mexico and United States (mainly south Florida and Texas).
Making the Most of Proximity to Large MarketsAeroman is a company dedicated to the aeronautic maintenance, repair and overhaul (MRO) of airplanes (fuselage maintenance, not turbine maintenance). Its history is di-rectly linked to that of TACA (now Avianca), which dates back to 1931 in Honduras. TACA was founded by New Zealander Lowell Yerex, with the idea of having a TACA
BOX 5.4 continued

Synthesis and Priorities 103
franchise in each Latin-American country to provide air transportation services. After financial troubles, only TACA International based out of San Salvador remained, and which was sold to Howard Hughes in the mid-1940s and to the Kriette family of El Salvador. In 1985 the maintenance department of the company moved to El Salvador and created Aeroman to be able to operate locally. The company operated normally during the next five years servicing TACA’s 7 planes but, in 1992, TACA signed a strategic alliance with Copa Airlines of Panama and subsequently took control of AVIATECA of Guatemala, LACSA of Costa Rica, and NICA of Nicaragua. This more than quadrupled TACA’s fleet to 30 planes, and Aeroman needed to grow its service capacity. Aeroman built a new han-gar in 1994 with the capacity of 4 bays (measurement of the capacity to service a plane at the same time, where 1 bay = 1 plane), in order to service TACA’s fleet and leaving 25 percent of spare capacity to service third parties. By now Aeroman employed 700 highly skilled workers. In general terms, the highest cost of an MRO is the salary of its employ-ees (70 percent), and the higher the productivity of its workers the higher the chances of getting new customers (since it will offer lower prices for its services).
The growth strategy worked and new clients were signed up for the maintenance service, tak-ing advantage of the strategic geographic location of San Salvador’s airport and in particular its proximity to the North American market. Despite the challenging market conditions after September 11, by 2003 the 4 bays were fully utilized. To continue growing Aeroman decided to find a partner with a world class reputation as an MRO. In 2006 Air Canada’s Technical Services (ACTS) bought 80 percent of Aeroman for $44.7 million and planned to invest $110 million to expand capacity from 4 to 16 bays by 2016. Aeroman continued to add one addi-tional bay per year, reaching 12 “production lines” by 2011. The results in El Salvador were phenomenal with over 2,300 employees and revenues of around $120 million. In contrast Canada’s operations of ACTS were struggling and Aeroman was put on sale. After a bidding process, the Kriette family bought back control of the 80 percent of Aeroman.
Demand for Aeroman’s services kept rising and by 2014 all 12 bays were fully utilized. Once again Aeroman has new plans for expansion. The expansion will break new ground globally, since no single MRO worldwide has more than 12 bays in a single location. Besides the ad-vantages of the proximity to the North American market Aeroman’s expansion has been possible thanks to the well-functioning laws and regulations regarding the airport, the port authority, the tax exceptions for free trade zones (the airport being one of them), the excellent hand labor found in El Salvador, and a memorandum of understanding signed with govern-ment authorities to keep the operating environment as is. Future growth will likely depend on a reform of the Aeronautical Law that facilitates the entrance of new airlines and customers.Sources: Interviews with Jorge Zablah, founder of Bon Appetit and Ernesto Ruiz, Chairman of the Board and ex CEO of Aeroman, AVX financial reports, Investment Policy Review El Salvador 2010 UNCTAD, MIGA, USDA Annual Update of Retail Food Report 2013/14, El Salvador Retail Foods, The Central American Bottling Corporation Offering Memorandum, May 23 2013.
BOX 5.4 continued

104 Synthesis and Priorities
and where labor productivity is often in the order of $40,000 per year.
PrioritizationApproach to prioritizationThe approach followed aimed to identify priorities to accelerate progress towards the goal of boosting shared prosperity. The pri-oritization is firmly anchored on a number of explicit criteria. First, the extent to which improvements in a given area would have substantial impacts on the twin goals. For example, the analysis in chapters 2, 3, and 4 explicitly considered how each of the topics analyzed affected the bottom 40. Second, this SCD also considered the time horizon of impacts, whether improvement in a par-ticular area may be a precondition or com-plement progress in other areas. Finally, the prioritization also explicitly considered the strength of the supporting evidence and the feasibility of taking action, noting the diffi-culties in a number of areas (but not dis-counting an area as a priority for these reasons).
In identifying priorities the approach fol-lowed took into account a number of consid-erations particularly relevant in the case of El Salvador. Given the numerous challenges faced by the country an overly mechanical approach would risk missing important nu-ances and result in a simplistic list of priori-ties. In practice, the approach followed three key considerations, as follows.
First, given that the analysis identified the existence of self-reinforcing dynamics, entry points that could help break those vicious circles were identified as priorities. Building on existing strengths of the country was also considered here. The basis for this emphasis stems from taking into account
areas that complement progress in other areas. In the case of El Salvador this proves to be a critical aspect to derive priorities. This led to the identification of three areas where policy levers could help address the vicious circles: (a) strengthening violence prevention and law enforcement; (b) im-proving education and skills to compete; and, (c) improving productive services and financial inclusion.
Second, areas where improvement in a particular area may be a sine qua non condi-tion for progress were also to be identified as priorities. Any effort to inform public dis-cussion of the country’s priorities would be remiss if it would obviate those areas where action needs to be taken to avoid signifi-cantly negative consequences. This led to the identification of the strengthening of the fis-cal situation as a priority area.
Third, consideration was given also to structural issues that cut across and would complement progress in different areas. In some cases progress would be greatly en-hanced if some structural changes could be enacted. By their very nature those changes would have a broad impact on a number of areas. This led to the identification of the importance of forging a political consensus to build a more transparent and efficient state and of improving the resilience of the country to disasters triggered by natural events as critical for sustaining progress.
The identified priorities were also in-formed by extensive consultations with stakeholders in the country. In terms of process the SCD has drawn on abundant background that has identified key con-straints to economic growth, inclusion, and sustainability, and has undertaken consultations with stakeholders and ex-perts in El Salvador.
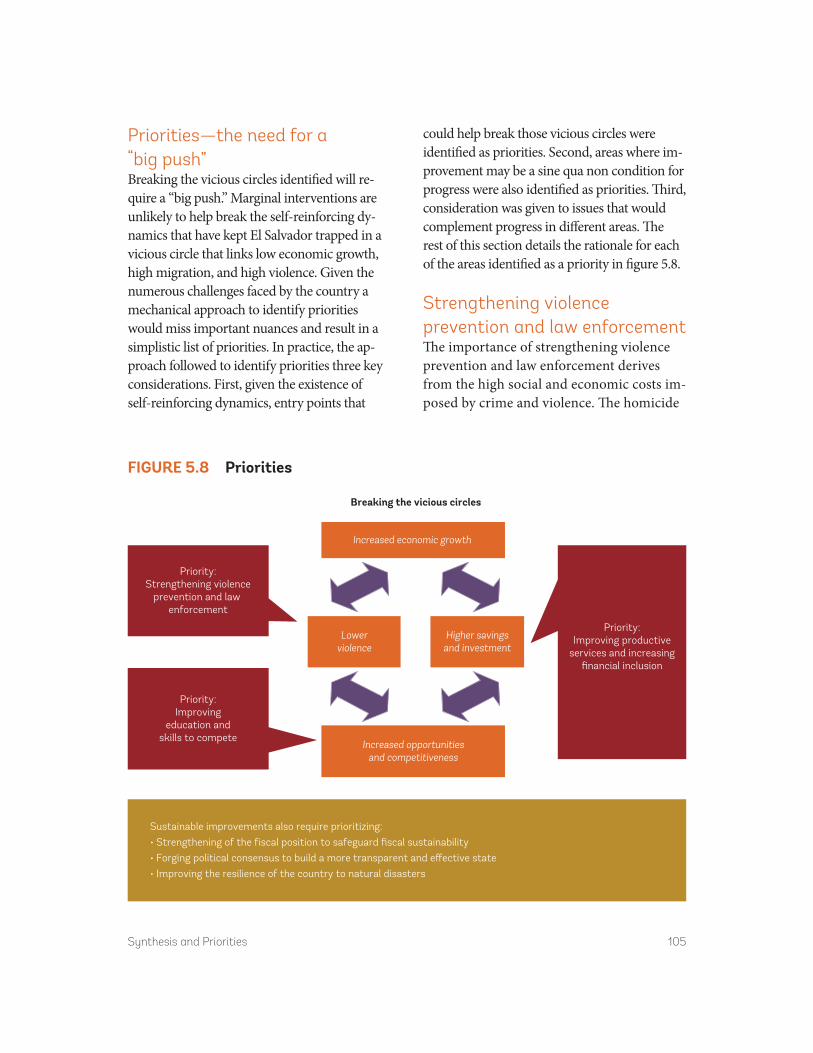
Synthesis and Priorities 105
Priorities—the need for a “big push”Breaking the vicious circles identified will re-quire a “big push.” Marginal interventions are unlikely to help break the self-reinforcing dy-namics that have kept El Salvador trapped in a vicious circle that links low economic growth, high migration, and high violence. Given the numerous challenges faced by the country a mechanical approach to identify priorities would miss important nuances and result in a simplistic list of priorities. In practice, the ap-proach followed to identify priorities three key considerations. First, given the existence of self-reinforcing dynamics, entry points that
could help break those vicious circles were identified as priorities. Second, areas where im-provement may be a sine qua non condition for progress were also identified as priorities. Third, consideration was given to issues that would complement progress in different areas. The rest of this section details the rationale for each of the areas identified as a priority in figure 5.8.
Strengthening violence prevention and law enforcementThe importance of strengthening violence prevention and law enforcement derives from the high social and economic costs im-posed by crime and violence. The homicide
FigurE 5.8 Priorities
Sustainable improvements also require prioritizing: • Strengthening of the fiscal position to safeguard fiscal sustainability• Forging political consensus to build a more transparent and effective state• Improving the resilience of the country to natural disasters
Priority:Strengthening violence
prevention and law enforcement
Priority:Improving
education andskills to compete
Increased economic growth
Higher savingsand investment
Lowerviolence
Increased opportunitiesand competitiveness
Breaking the vicious circles
Priority:Improving productive
services and increasingfinancial inclusion

106 Synthesis and Priorities
rates in El Salvador since 2000 have been among the top 5 countries in the word; at 30 per 100,000 the homicide rate is five times the world average and had reached a peak of 60 homicides per 100,000 before a truce be-tween gangs (maras) was agreed to in March 2012. The economic cost of this violence is very high, 11 percent of GDP annually in-cluding material losses, public and private security and health costs. The widespread availability of small firearms facilitated the expansion of violence. The maras, created among the Salvadoran migrant communi-ties in the US, have further fueled violence as their members returned to El Salvador (either voluntarily or deported) and intro-duced to the country a criminal enterprise that lured the youth by providing a sense of identity. Today the maras count their members in the tens of thousands. This en-vironment has been welcoming to drug traf-ficking. In addition to paying for private security costs, which are among the highest in the world, there is increasing evidence that fear of crime, and in particular extor-tions, prompts some businesses to exit from the marketplace altogether.
Significantly lower levels of crime and violence would impact positively economic growth, inclusion and sustainability. In terms of impact on the twin goals, the bottom 40 stands out as having the most to gain from a reduction in crime and violence since they are often the most affected by crime and violence. Lower crime and violence would imply that the costs of production fall as ex-penditures associated with buying protection are reduced. Smaller enterprises will gain the most in relative terms, with a potential posi-tive impact on employment and hence inclu-sion. In addition, the drop in crime and violence may incentivize migrants to return
and in preparation for their return to invest, as in real estate. With more attractive oppor-tunities, migrants can return to invest and transfer skills back. The drop in crime and violence can also be a boon for creating strong value chains, potentially contribute to an increase in exports, and open space for new areas of economic activity such tourism. The reduction in crime and violence en-hances social sustainability and improves the credibility and legitimacy of the state.
Addressing crime and violence would complement progress in other priority areas and help break the vicious circle from low growth to migration to low growth. Although data collection in this area could be improved the evidence that supports the link between crime and violence and the twin goals appears to be strong. Addressing crime and violence will support other pri-orities, in particular education, as fear of crime may be a factor that is behind the high drop-out rates. A strategy to reduce crime and violence is necessarily long-term and must target an enhanced accountability of government, greater transparency of the public actions to contain impunity and the strengthening of the judicial system. In the short to medium term, there are entry points around creating income and learning opportunities to steer the youth away from joining criminal organizations, providing incentives and skills for gang members to exit, and working with impris-oned populations to facilitate reinsertion into after they leave.
Improving education and skills to competeImproving education and skills would posi-tively impact growth, inclusion, and sustain-ability. Higher learning outcomes, even at

Synthesis and Priorities 107
the current levels of attendance, would better equip the youth for the acquisition of skills necessary in the domestic market or in the markets where people migrate. A more edu-cated and skilled population in the domes-tic market would alleviate the relatively high costs of labor. For migrants, it will rep-resent better opportunities abroad, and pos-sibly higher remittances into the country. Moreover, the country may follow an active policy of training migrants focused on skills that facilitate entry into selected labor mar-kets abroad. It is also likely that improved educational outcomes contribute to the higher retention rates at the secondary level. Education is a key building block for other priorities, in particular reducing crime and violence.
A broad increase in educational out-comes would impact growth, inclusion, and sustainability. Higher learning outcomes, even at the current levels of attendance, would better equip the youth for the acqui-sition of skills necessary in the domestic market or in the markets where people mi-grate. A more educated and skilled popula-tion in the domestic market would alleviate the relatively high costs of labor. For mi-grants, it will represent better opportunities abroad, and possibly higher remittances into the country. Moreover, the country may follow an active policy of training mi-grants focused on skills that facilitate entry into selected labor markets abroad. It is also likely that improved educational out-comes contribute to the higher retention rates at the secondary level. Education is a key building block for other priorities, in particular reducing crime and violence.
The entry points to improve education have been amply studied and discussed. They include pre-school education, improving
teacher skills and capacity, measuring out-comes, introducing IT and English, and tai-loring and expanding the existing vocational and training institutions to respond to the needs of the market. The diaspora could also provide trained personnel that fits the needs of the market—e.g., language skills.
Improving productive services and increasing financial inclusionReducing the high costs of productive ser-vices as well as reducing the regulatory burden on businesses will generate addi-tional investment, employment and growth. First, in electricity the challenge is to re-duce economic costs over the long haul and to diversify supply to reduce vulnerability. Local technology is available to increase geothermal supply, there is considerable potential for wind power, and installations that manage LNG can support increases in the supply of gas. Facing these challenges may require a review of the current regula-tory environment. Second, in terms of con-nectivity, the bases are in place to generate rapid gains. The expansion of the airport in San Salvador will ease the pressure that has been building as the growth in demand is outstripping capacity. Greater competition in cargo transportation by road can reduce costs. Improving access to information technology infrastructure, such as broad-band, could help make the most of the strong links that El Salvador has with large markets such as the US. Improvements in customs services are needed to facili-tate trade within the Central American market.
Increasing financial inclusion can help raise savings and generate additional

108 Synthesis and Priorities
investment. Although interest rates as quoted are low by regional standards, ac-cess to micro, small and medium enter-prises is constrained, limiting the expansion of these employment intensive sectors. In addition, the low level of use of the banking services by the population rep-resents penalizes savings with serious micro and macro consequences. While this is an area where the evidence base is mixed, given the great potential of tapping into the large remittance flows, it is considered to be a priority for boosting shared prosperity in the country.
But sustainable progress will also require prioritizing:
• Strengthening of the fiscal position to safeguard fiscal sustainability
• Forging political consensus to build a more transparent and effective state
• Improving the resilience of the country to natural disasters
Strengthening of the fiscal position to safeguard fiscal sustainabilityPublic debt sustainability hinges mainly on sustaining fiscal discipline and strong eco-nomic growth. El Salvador’s challenge is to stabilize and eventually reduce its debt level to create much needed fiscal space for growth and poverty reduction purposes and keep fi-nancing requirements manageable. While growth plays a key role in ensuring the sus-tainability of the fiscal position, reforms are needed to avoid further deterioration of the debt ratios. Fiscal adjustments will re-quire measures to increase revenue, reduce/reassign expenditures, and improve public
expenditure management as well as debt management.
Strengthening the fiscal position is a prerequisite for further progress. Fiscal deficits and slower economic growth since the global crisis have increased public debt. Public debt relative to GDP went from 40 percent in 2008 to 58 percent in 2013. There are no immediate concerns about debt sustainability, but continuing the growth and fiscal trends of the recent past would increase the debt to GDP ratio up to 70 percent in 2019. So stabilizing debt lev-els will require fiscal adjustment between 1.5 percent and 3.5 percent of GDP de-pending of the target level for the public debt. The most significant fiscal issue now are the management of the pension debt is-sued as the country transitioned from a de-fined contribution system and improving the targeting of subsidies in electricity, gas, water and transport. The current environ-ment of low oil prices may provide an op-portunity to address subsidy reform. A higher rate of economic growth would alle-viate the fiscal difficulties, finance priority expenditures and investments, and boost the income of the bottom 40. At the same time, there is scope for mobilizing addi-tional tax revenues—which at around 15 percent of GDP remain comparatively low.
Forging political consensus to build a more transparent and effective stateThe limited capacity of the state stands as a major constraint to growth, employment and poverty reduction. Inadequate institu-tional designs favor opaque practices that hide objectives, designs and outcomes. The lack of transparency limits efficiency and

Synthesis and Priorities 109
prevents the dialogue and analysis to im-prove them. Bringing about desired institu-tional transformations will take time, but immediate actions in selected areas can trigger the process of reform. First, the ra-tionalization of subsidies, such as in elec-tricity, that have had a negligible impact on the reduction of poverty will favor inclusion and foster fiscal strength. Similarly, address-ing the growing pension debt originating in the particular way in which the country transitioned from a defined to a contribu-tion system will help consolidate the fiscal position. Second, improving access and quality to health and education services will help especially the bottom 40, which lags behind in access to basic opportunities. Third, given the limited public resources from now to the medium and long haul, careful prioritization of public investment with an eye on the impact on development outcomes is required. In addition, the gov-ernment can develop a strategy and build the capacity for engaging the private sector in selected infrastructure projects. Lastly, greater transparency of the public sector, in-cluding budgetary actions and outcomes, can help build the credibility of the state and enhance the sustainability of basic insti-tutions in the country.
A weak state has also been unable to con-tain and reduce the impact of crime and vio-lence. Impunity prevails as the criminal conviction rate is less than 5 percent. Police and judiciary are widely perceived as corrupt and the Supreme Court has the lowest level of citizen confidence among major public in-stitutions. Private security expanded to fill the vacuum; Enterprise Surveys suggest that firms spend 3.4 percent of sales in protec-tion, amongst the highest percentages in the world. The quality of public institutions has
remained stagnant, which has not helped to build trust among the citizenry. In addition, the difficulty of the state in providing secu-rity has exacerbated a lack of trust by the cit-izens in public institutions. The weakness of the state shows also in its limited capacity to mobilize internal revenues and spend them effectively.
Underlying the limited effectiveness of the state is a highly polarized political arena where limited consensus is the norm. The political polarization and mistrust prevent agreement across the board on critical na-tional priorities. The country for example has been slow to respond to the threats to its industry and exports from Asian com-petitors. The rising threat from crime and violence, while widely acknowledged as ex-tremely damaging across the board, has not coalesce countervailing forces to keep the threat at bay.
Improving the resilience of the country to natural disastersMoving from a reactive to a preventive ap-proach to disaster risk management will lower social and economic cots of disasters. El Salvador is also one of the countries in the world that is most affected by weather- related events and other natural hazards. Combined, El Salvador incurs annual losses of around 2.5 percent of GDP due to natu-ral disasters. These losses add to fiscal pres-sures and constrain wealth accumulation. Climate change is expected to increase the frequency and severity of the weather- related events.
The government can complete adopting mechanisms to finance responses to disas-ter, through insurance or contingent funds and improving the administrative capacity

110 Synthesis and Priorities
to respond. In addition risk reduction and mitigation measures could be enhanced. Improving resilience to disasters will also require improving the quality of housing and basic services in urban areas and ad-dressing environmental degradation. Over the long haul, the challenge is to introduce and enforce the appropriate guidelines for the construction of buildings, the location of business and populations, and the uses of land.
In conclusionEl Salvador has the potential to boost shared prosperity. To do so it can build on some
strengths and opportunities available to the country, including making the most of the large flows of remittances, its geographic and cultural proximity to large nearby mar-kets, the ongoing process of regional inte-gration, and an existing manufacturing base. At the same time, it must be recog-nized that progress will not be easy. El Salvador’s predicament is being stuck in a low growth trap, in which migration and low growth reinforce each other through a variety of vicious circles. The priorities identified in this systematic county diag-nostic are mindful of this and therefore focus on efforts at breaking out of such state of reinforcing stagnation.
Notes 1. For a longer discussion of these issues see
World Bank (2012a). 2. These results, however, may be outdated
as banks have increasingly expanded ac-cess to loans and other financial tools for
consumers receiving remittances. More recent research in other countries finds causal evidence that remittance receipt leads to more consumer debt (Ambrosius and Cuecuecha 2014).

Appendix A: Poverty and Shared Prosperity: Measurement Issues 111
Since 1992, El Salvador has conducted the Encuesta de Hogares de Propósitos Múltiples (EHPM), a continuous survey from January to December of each year. This survey inclu-des data on income and consumption. The sampling frame changed in 2003. Currently, the survey has national coverage and is rep-resentative for El Salvador as a whole (distin-guishing between urban and rural areas), re gions (also by urban and rural areas), and departments. With the new sampling frame it is possible to calculate indicators for the coun-try’s 50 main municipalities. In 2007, results were further adjusted to the new Census and, as of 2008, the sample frame is based on the newest Censo de Población y Vivienda (2007).
Although El Salvador introduced the U.S. dollar as its official currency in 2001 (with a fixed exchange rate of 8.75 colones per dol-lar), surveys continued to be conducted and published in colones until 2003. For the cur-rent analysis, data previous to 2004 were
converted to dollars using the exchange rate of 8.75 colones per U.S. dollar. The survey al-lows two different welfare aggregates to be con-structed, one based on income and one based on consumption. This document’s main results rely on an income aggregate. To enable com-parison across time, income has been conver-ted to constant prices of 2000, which is the base year for the Consumer Price Index (CPI).
El Salvador’s official poverty lines use dif-ferent consumption baskets for urban and ru-ral areas. The cost of these food baskets is up dated annually, and the overall poverty line is twice the extreme (food) poverty line. The General Directorate of Statistics and Cen suses (Dirección General de Estadística y Censos, DIGESTYC) relies on income to cal-culate poverty and presents results by house-holds. The value of the poverty line at the household level is the value of the individual poverty line multiplied by the average size of the household in each year (table A.1).
Appendix A: Poverty and Shared Prosperity: Measurement Issues
TaBLE a.1 Nominal Value of the Poverty Lines (uS Dollars)Per household Per capita
2000 2005 2010 2000 2005 2010
Total
Urban 256.5 273.1 336.6 63.6 70.6 90.2
Rural 197.0 175.1 236.8 40.8 39.2 55.6
Extreme
Urban 128.2 136.5 168.3 31.8 35.3 45.1
Rural 98.5 87.5 118.4 20.4 19.6 27.8
Average household size
Urban 4.0 3.9 3.7
Rural 4.8 4.5 4.2
Source: Dirección General de Estadísticas y Censos de El Salvador (DYGESTIC).

112 Appendix A: Poverty and Shared Prosperity: Measurement Issues
The value of the line at the per capita level is not publicly available: some numbers in table A.1 were calculated by the authors using the value of the poverty line at the household
level and the average size of the household. Estimations presented here are at the indi-vidual level and thus differ from official estimates.
FigurE a.2 Poverty and growth rates, Percent
Source: World Bank staff based on EHPM.
35
40
45
50
2000 2004 2008 2012
Overall poverty (left axis)Real per capita GDP growth(inverted scale, right axis)
–6
–4
0
2
4
6
–2
FigurE a.1 income growth from National accounts (gNi) and Household Surveys, LaC
8
6
4
2
0
1 2 3
SLVMEX PRY
CRI
GTM
PAN
DRYDOM
BRA
COLECU
ARG
PER
CHL
BOLHNO
NIC
Income growth according to national accounts
Inco
me
grow
th a
ccor
ding
tohh
sur
veys
4 5 6
El Salvador
Source: World Bank staff based on SEDLAC.
MaP a.1 growth of income of the Bottom 40 and Mean income by Department
Source: World Bank staff calculations based on EHPM.
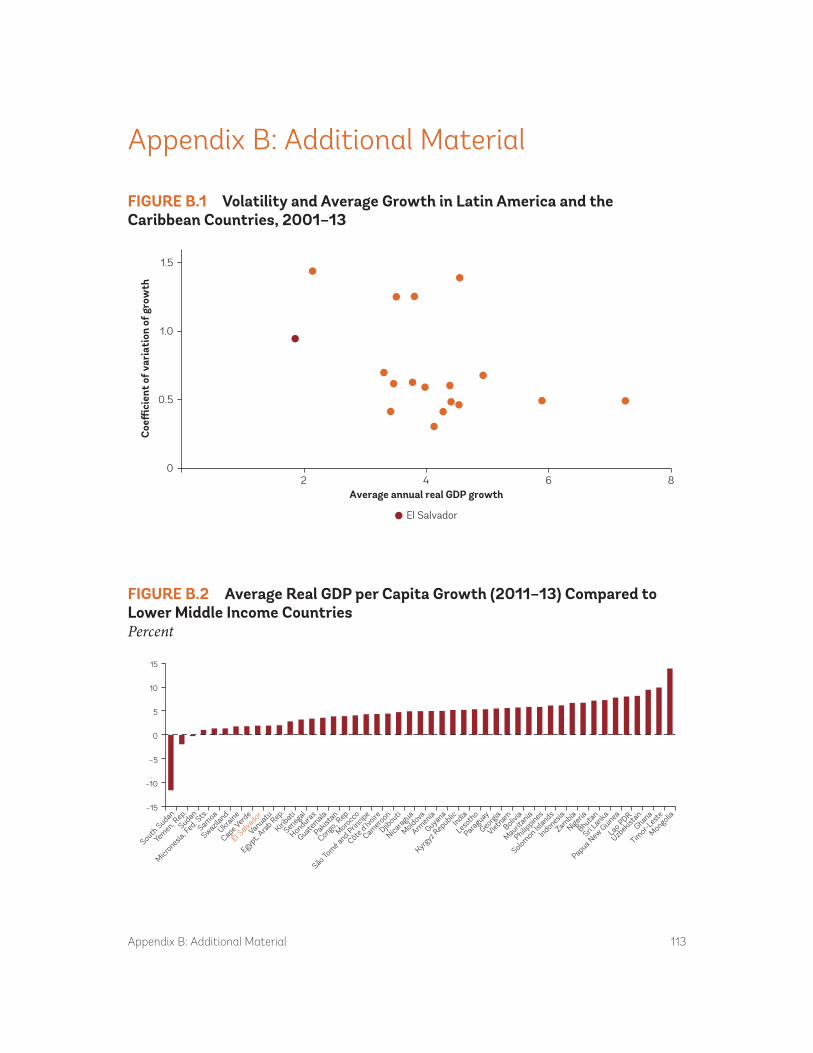
Appendix B: Additional Material 113
Appendix B: Additional Material
FigurE B.1 Volatility and average growth in Latin america and the Caribbean Countries, 2001–13
0
0.5
1.0
1.5
2 4 6 8
Coeffi
cien
t of v
aria
tion
of g
row
th
Average annual real GDP growth
El Salvador
FigurE B.2 average real gDP per Capita growth (2011–13) Compared to Lower Middle income CountriesPercent
–5
–10
–15
0
5
10
15
South Sudan
Yem
en, R
ep.
Sudan
Micrones
ia, Fe
d. Sts
.
Samoa
Swazila
nd
Ukraine
Cape V
erde
El Salv
ador
Vanuat
u
Egypt, A
rab R
ep.
Kiribat
i
Seneg
al
Hondura
s
Guatem
ala
Pakist
an
Congo, R
ep.
Morocc
o
São To
mé a
nd Princip
e
Côte d'Iv
oire
Camero
on
Djibouti
Nicara
gua
Moldova
Armen
ia
Guyana
Kyrgy
z Rep
ublicIndia
Leso
tho
Parag
uay
Georg
ia
Vietnam
Bolivia
Maurit
ania
Philippines
Solomon Is
lands
Indonesia
Zambia
Nigeria
Bhutan
Sri Lan
ka
Papua N
ew G
uinea
Lao PDR
Uzbek
istan
Ghana
Timor-L
este
Mongolia

114 Appendix B: Additional Material
FigurE B.5 Employment added by SectorPercent
0
20
40
60
80
100
1990 2000 2010
Tertiary sector Secondary sector Primary sector
FigurE B.3 average real gDP per Capita growth (2011–13) Compared to Latin america and the Caribbean CountriesPercent
Source: World Bank.
–5
0
5
10
15
St. Lucia
Dominica
Grenad
a
Jam
aica
St. Vince
nt and th
e Gre
nadines
Brazil
Belize
Mexico
Honduras
Guatem
ala
Venez
uela, R
B
Dominica
n Rep
ublicHait
i
Costa R
ica
Surinam
e
Nicara
gua
Argen
tina
Guyana
Colombia
Parag
uay
Bolivia
Ecuad
orPer
u
Panam
a
El Salv
ador
FigurE B.4 Value added by SectorPercent
0
20
40
60
80
100
1990 2000 2010
Tertiary sector Secondary sector Primary sector

Appendix B: Additional Material 115
FigurE B.6 Value added by SectorPercent
0
500
1,000
1,500
2,000
2,500
1990 2000 2010
Finance
Retail, restaurants, and hotels Electricity, gas, and water
Other services Transport and communications
Mining
Construction
Manufacturing Agriculture, forestry, and fisheries
Source: Central Bank of El Salvador.
FigurE B.7 Comparison of Tradables and Non-Tradables Sectors (indices, 1990 = 100)
Tradables Non-tradables
a. Productivity
0
50
100
150
200
1990 2000 2010
b. Prices
0
100
200
300
400
1990 2000 2010
c. Real salaries
0
40
80
120
1990 2000 2010
Source: Cabrera 2014.
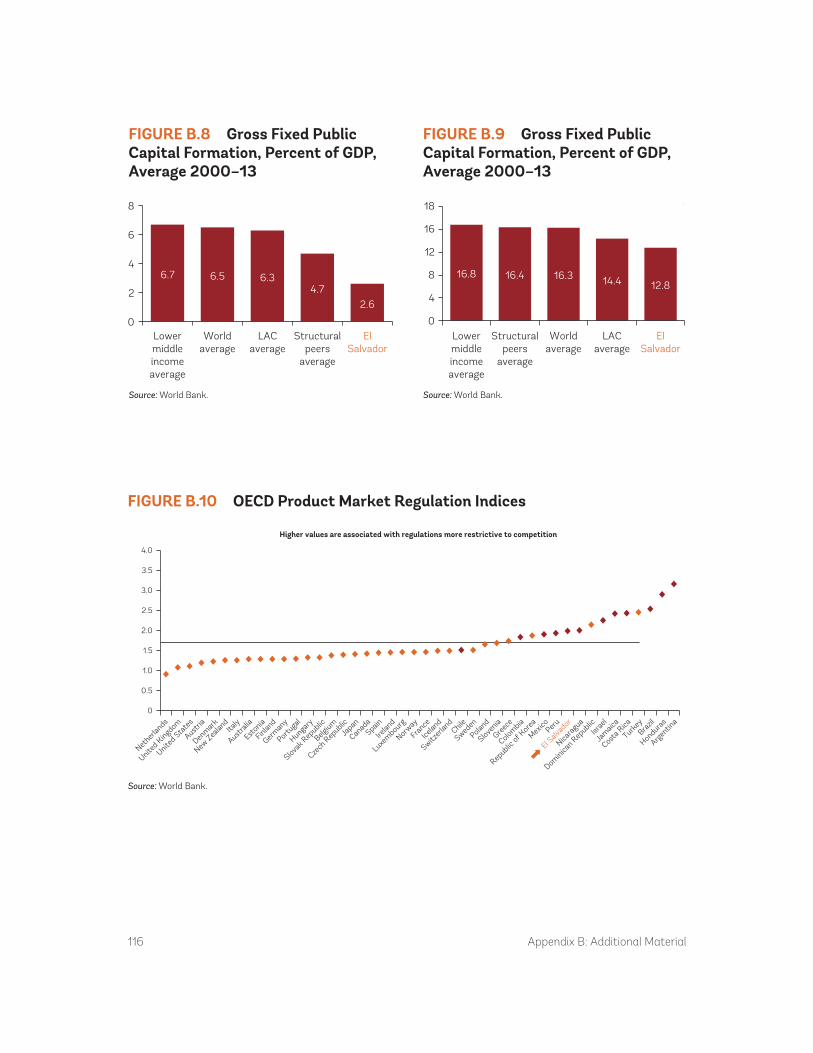
116 Appendix B: Additional Material
FigurE B.8 gross Fixed Public Capital Formation, Percent of gDP, average 2000–13
6.7 6.5 6.34.7
2.6
0
2
4
6
8
Lowermiddleincomeaverage
Worldaverage
LACaverage
Structuralpeers
average
ElSalvador
Source: World Bank.
FigurE B.9 gross Fixed Public Capital Formation, Percent of gDP, average 2000–13
16.8 16.4 16.3 14.4 12.8
0
4
8
12
16
18
Lowermiddleincomeaverage
Structuralpeers
average
Worldaverage
LACaverage
ElSalvador
Source: World Bank.
FigurE B.10 OECD Product Market regulation indices
Higher values are associated with regulations more restrictive to competition
0
0.5
1.0
1.5
2.0
2.5
3.0
3.5
4.0
Nether
lands
United K
ingdom
United Sta
tes
Austria
Denm
ark
New Zea
land
Italy
Austra
lia
Estonia
Finland
Germ
any
Portuga
l
Hungary
Slovak R
epublic
Belgium
Czech
Rep
ublicJa
pan
Canad
aSpain
Irelan
d
Luxem
bourg
Norway
France
Icelan
d
Switzer
land
Chile
Sweden
Poland
Slovenia
Greec
e
Colombia
Republic
of Kore
a
MexicoPer
u
El Salv
ador
Nicara
gua
Israe
l
Dominica
n Rep
ublic
Jam
aica
Costa R
ica
Turkey
Brazil
Honduras
Argen
tina
Source: World Bank.

Appendix B: Additional Material 117
FigurE B.11 School Enrollment by age and gender
Boys Girls
50
20
40
60
80
100
6 7 8 9 10 11 12Ages
Perc
ent
13 14 15 16 17 18 19 20
Source: World Bank.
TaBLE B.1 Standard Deviation of gDP growth and Output gapStandard deviation of gDP growth Standard deviation of gDP gap
1960–99 2000–11 1960–99 2000–11
El Salvador 4.7 1.8 5.2 1.9
LAC average 4.7 3.2 4.7 3.2
Lower middle income average 1.6 1.5 1.4 1.5
TaBLE B.2 Selected Social Sector indicatorsEl Salvador LaC 7
2000–05 2006–11 2000–05 2006–11
Education
School enrollment, preprimary (% gross) 49.8 60.2 66.1 82.2
School enrollment, primary (% gross) 109.1 114.4 113.2 113.2
School enrollment, secondary (% gross) 58.6 63.5 79.1 86.5
School enrollment, tertiary (% gross) 20.8 22.5 30.7 45.3
Primary completion rate, total (%) 82.9 92.3 99.1 103.7
Pupil-teacher ratio, primary 45 34.7 24.8 23
Health
Pregnant women with prenatal care (%) 86 94 92.2 96
Undernourishment (% of pop) 9.9 11.8 11.7 9.6
Immunization, measles (% 12–23 m) 94.5 94.7 94.9 94.9
Improved sanitation facilities (% of pop) 84 86.6 80.4 83.5
Improved water source (% of pop) 84 87 91.4 93.4
Hospital beds (per 1,000 people) 0.9 0.9 2 2.1
table continues next page
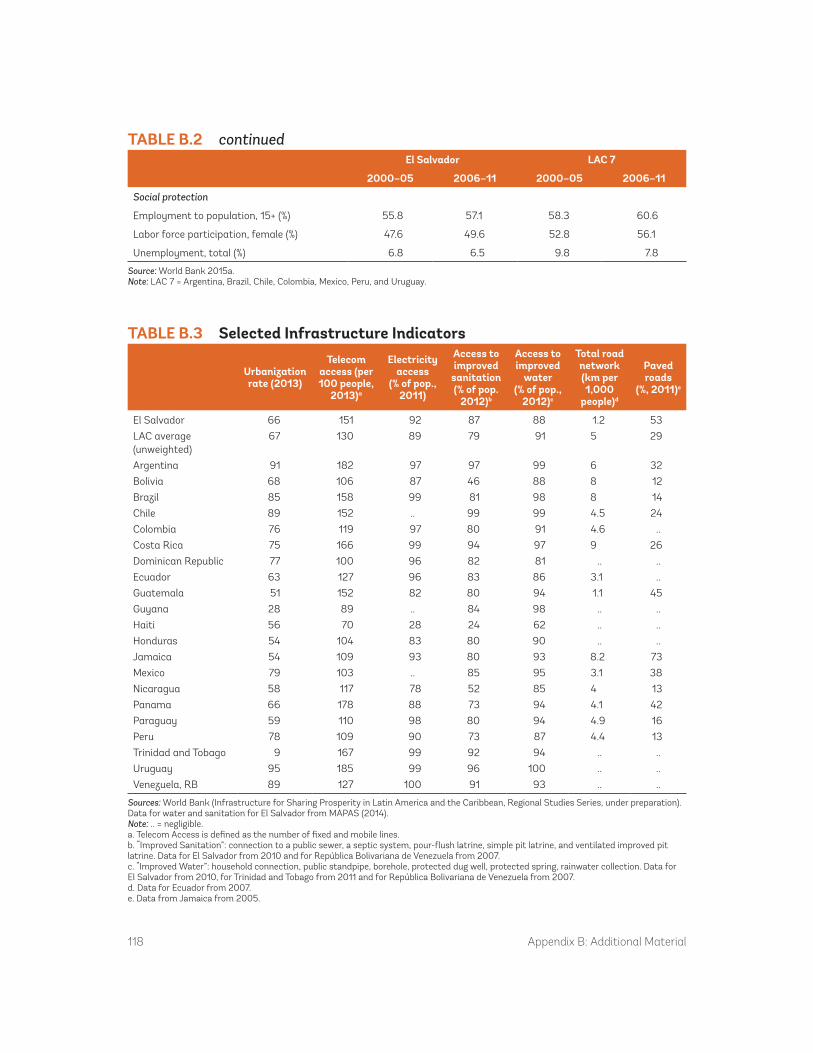
118 Appendix B: Additional Material
TaBLE B.3 Selected infrastructure indicators
urbanization rate (2013)
Telecom access (per 100 people,
2013)a
Electricity access
(% of pop., 2011)
access to improved
sanitation (% of pop.
2012)b
access to improved
water (% of pop.,
2012)c
Total road network (km per 1,000
people)d
Paved roads
(%, 2011)e
El Salvador 66 151 92 87 88 1.2 53
LAC average (unweighted)
67 130 89 79 91 5 29
Argentina 91 182 97 97 99 6 32
Bolivia 68 106 87 46 88 8 12
Brazil 85 158 99 81 98 8 14
Chile 89 152 .. 99 99 4.5 24
Colombia 76 119 97 80 91 4.6 ..
Costa Rica 75 166 99 94 97 9 26
Dominican Republic 77 100 96 82 81 .. ..
Ecuador 63 127 96 83 86 3.1 ..
Guatemala 51 152 82 80 94 1.1 45
Guyana 28 89 .. 84 98 .. ..
Haiti 56 70 28 24 62 .. ..
Honduras 54 104 83 80 90 .. ..
Jamaica 54 109 93 80 93 8.2 73
Mexico 79 103 .. 85 95 3.1 38
Nicaragua 58 117 78 52 85 4 13
Panama 66 178 88 73 94 4.1 42
Paraguay 59 110 98 80 94 4.9 16
Peru 78 109 90 73 87 4.4 13
Trinidad and Tobago 9 167 99 92 94 .. ..
Uruguay 95 185 99 96 100 .. ..
Venezuela, RB 89 127 100 91 93 .. ..
Sources: World Bank (Infrastructure for Sharing Prosperity in Latin America and the Caribbean, Regional Studies Series, under preparation). Data for water and sanitation for El Salvador from MAPAS (2014).Note: .. = negligible.a. Telecom Access is defined as the number of fixed and mobile lines.b. “Improved Sanitation”: connection to a public sewer, a septic system, pour-flush latrine, simple pit latrine, and ventilated improved pit latrine. Data for El Salvador from 2010 and for República Bolivariana de Venezuela from 2007.c. “Improved Water”: household connection, public standpipe, borehole, protected dug well, protected spring, rainwater collection. Data for El Salvador from 2010, for Trinidad and Tobago from 2011 and for República Bolivariana de Venezuela from 2007.d. Data for Ecuador from 2007.e. Data from Jamaica from 2005.
TaBLE B.2 continuedEl Salvador LaC 7
2000–05 2006–11 2000–05 2006–11
Social protection
Employment to population, 15+ (%) 55.8 57.1 58.3 60.6
Labor force participation, female (%) 47.6 49.6 52.8 56.1
Unemployment, total (%) 6.8 6.5 9.8 7.8
Source: World Bank 2015a.Note: LAC 7 = Argentina, Brazil, Chile, Colombia, Mexico, Peru, and Uruguay.

Appendix B: Additional Material 119
MaP B.1 Map of El Salvador
La Libertad
Acajutla
La Hachadura
Armenia
Chalchuapa
Metapán
Aguilares
Ilobasco
Olocuilta
San Luis
Tecoluca
Ciudad Barrios
La Herradura Jiquilisco
Intipuca
Santa Rosade Lima
NuevaEsparta
Osicala
Jocoaitique
Santiagode María
Suchitoto
NuevaConcepción
Tejutla
La Palma
Candelaria dela Frontera
Izalco
NuevaSan Salvador
Chalatenango
Sensuntepeque
Cojutepeque
San Vicente
Zacatecoluca
Usulután
San Miguel
San Francisco(Gotera)
La Unión
Sonsonate
Ahuachapán
SantaAna
SANSALVADOR
Paz
EmbalseCerrón Grande
Lago deIllepango
Laguna deOlomega
Lago deCoatepeque
Lago deGüija
Lempa
Lem
pa
Jiboa
Lempa
Torola
Goa
scor
án
Grande de San Miguel
L APA Z
S A NV I C E N T E
U S U L U T Á N
S A N M I G U E L L AU N I Ó N
M O R A Z Á N
C A B A Ñ A S
C H A L AT E N A N G O
S O N S O N AT E
SAN
TA A
NA
A
H U A C H A P Á N
CU
S CA
T L ÁN
SA
N S
ALV
AD
OR
L AL I B E R TA D
La Libertad
Acajutla
La Hachadura
Armenia
Chalchuapa
Metapán
Aguilares
Ilobasco
Olocuilta
San Luis
Tecoluca
Ciudad Barrios
La Herradura Jiquilisco
Intipuca
Santa Rosade Lima
NuevaEsparta
Osicala
Jocoaitique
Santiagode María
Suchitoto
NuevaConcepción
Tejutla
La Palma
Candelaria dela Frontera
Izalco
NuevaSan Salvador
Chalatenango
Sensuntepeque
Cojutepeque
San Vicente
Zacatecoluca
Usulután
San Miguel
San Francisco(Gotera)
La Unión
Sonsonate
Ahuachapán
SantaAna
SANSALVADOR
HONDURASGUATEMALA
L APA Z
S A NV I C E N T E
U S U L U T Á N
S A N M I G U E L L AU N I Ó N
M O R A Z Á N
C A B A Ñ A S
C H A L AT E N A N G O
S O N S O N AT E
SAN
TA A
NA
A
H U A C H A P Á N
CU
S CA
T L ÁN
SA
N S
ALV
AD
OR
L AL I B E R TA D
PACIFIC OCEAN
Golfo deFonseca
Bahía de
La Unión Bahía de Jiquilisco
Paz
EmbalseCerrón Grande
Lago deIllepango
Laguna deOlomega
Lago deCoatepeque
Lago deGüija
Lempa
Lem
pa
Jiboa
Lempa
Torola
Goa
scor
án
Grande de San Miguel
To Quezaltepeque
To Nueva
Ocotepeque
To Jutiapa
To Jalpatagua
To Taxisco
To Marcala
To Nacaome
To Ipala
Volcán deVicente
(2,182 m)
Volcán deSan Miguel(2,130 m)
CerroEl Pital
(2,730 m)
Volcán deSanta Ana(2,365 m)
90°W
90°W
89°W 88°W
89°W 88°W
13°N
14°N14°N
EL SALVADOR
0 10 20 30
0 2010 30 Miles
40 Kilometers IBRD 33401R
NO
VEM
BER 2006
E L SALVADORSELECTED CITIES AND TOWNS
DEPARTMENT CAPITALS
NATIONAL CAPITAL
RIVERS
MAIN ROADS
PAN AMERICAN HIGHWAY
RAILROADS
DEPARTMENT BOUNDARIES
INTERNATIONAL BOUNDARIES
This map was produced by the Map Design Unit of The World Bank. The boundaries, colors, denominations and any other information shown on this map do not imply, on the part of The World Bank Group, any judgment on the legal status of any territory, o r any endo r s emen t o r a c c e p t a n c e o f s u c h boundaries.


Bibliography 121
Acevedo, Carlos. 2003. “La experiencia de crec-miento económico en El Salvador durante el siglo XX,” Serie de Estudios Económicos y Sectoriales, RE2-03-003, Inter-American Development Bank.
Acevedo, Carlos. 2008. “Los costos económicos de la violencia en El Salvador.” América Latina Hoy 50: 71–88.
Acosta, Pablo. 2006. “Labor Supply, School Attendance, and Remittance from International Migration: The Case of El Salvador.” Policy Research Working Paper 3903, World Bank.
Acosta, Pablo, Cesar Calderon, Pablo Fajnzylber, and J. Humberto Lopez. 2008. “Do Remittances Lower Poverty Levels in Latin America?” In Remittances and Development: Lessons from Latin America, edited by Pablo Fajnzylber and J. Humberto Lopez. Latin American Development Forum Series, World Bank.
Acosta, Pablo, Pablo Fajnzylber, and J. Humberto Lopez. 2008. “Remittances and Household Behavior: Evidence for Latin America.” In Remittances and Development: Lessons from Latin America, edited by Pablo Fajnzylber and J. Humberto Lopez. Latin American Development Forum Series, World Bank.
Aedo, Cristian, and Ian Walker. 2012. Skills for the 21st Century in Latin America and the Caribbean. World Bank.
Alesina, Alberto, Silvia Ardagna, Giuseppe Nicoletti, and Fabio Schiantarelli. 2005. “Regulation and Investment.” Journal of the European Economic Association 3 (4): 791–825.
Amaya, Pablo, and Oscar Cabrera. 2012. “Territorios Funcionales en El Salvador.” Documento de Trabajo 15. Serie Estudios Territoriales. Programa Dinámicas territori-ales Rurales de Centro Latinoamericano para el Desarrollo Rural, Santiago, Chile.
———. 2013. “La Transformación Estructural: Una solución a la trampa de bajo crecimiento económico en El Salvador.” Documento de Trabajo del Banco Central de Reserva de El Salvador 2013—01.
Ambler, Kate, Diego Aycinena, and Dean Yang. 2014. “Channeling Remittances to Education: A Field Experiment among Migrants from El Salvador.” NBER Working Paper 20262, National Bureau of Economic Research.
Ambrosius, Christian, and Alfredo Cuecuecha. 2014. “Do Remittances Increase Borrowing?” Discussion Paper 2014/19, School of Business & Economics, Freie Universitaet Berlin.
Anzoategui, Diego, Asli Demirguc-Kunt, and María Soledad Martinez Peria. 2014. “Remittances and Financial Inclusion: Evidence from El Salvador.” World Development 54: 338–349.
Araujo, Jorge, Ekaterina Vostroknutova, Konstantin Wacker, and Mateo Clavijo. 2014. “Understanding the Latin American and the Caribbean Income Gap: What Is Preventing LAC from Converging to Higher Income Levels?” World Bank.
Arnold, Alex, Paul Hamilton, and Jimmy Moore. 2011. “Who Seeks to Exit? Security, Connections, and Happiness as Predictors of Migration Intentions in the Americas.” Americas Barometer Insights 64, Latin American Public Opinion Project (LAPOP), Vanderbilt University.
Ashraf, Nava, Diego Aycinena, Claudia Martinez, and Dean Yang. 2015. “Savings in Transnational Households: A Field Experiment among Migrants from El Salvador.” The Review of Economics and Statistics 97 (2): 332–351.
Berti, Giovanni. 2014. “A 20 años de apertura comercial ¿puede nuestro modelo de inserción internacional ser un motor de crecimiento?” Mimeo.
Bleakley, Fred R. 1984. “Americans in Business in El Salvador: Juggling Risk, Fear and Returns.” The New York Times, March 25.
Bouillon, Cesar Patricio. 2012. Room for Improvement: Housing Markets in Latin America and the Caribbean. Development in the Americas Series, Inter-American Development Bank.
Bibliography
122 Bibliography
Brown, Anna, and Patten, Eileen. 2013. “Hispanics of Salvadoran Origin in the United States, 2011,” Pew Research Center Hispanic Trends.
Cabrera, Oscar. 2011. “Algunas piezas en el puz-zle del tipo de cambio real y el crecimiento económico en El Salvador.” Mimeo.
Cabrera, Oscar. 2014. “Una política económica por el empleo digno y el crecimiento inclu-sivo,” www.oscarcabreramelgar.com.
Cabrera, Oscar, Julieta Fuentes, and Hada Desirée de Morales. 2005. “Hechos estilizados en el crecimiento economico de El Salvador 1978–2004: una propuesta de acciones de política económica en el corto y mediano plazo.” Documento de trabajo 2005–02, Banco Central de Reserva de El Salvador.
Cáceres, Luis René, and Alfredo I. Flores. 2013. “Brecha comercial y estancamiento económico en Centroamérica (1990–2008).” Comercio Exterior 63 (2): 37–52.
Cadena, Kiyomi E., Adriana Cardozo Silva, Leonardo Lucchetti, and Kinnon Scott. 2013. Central America in the New Millennium: Six Different Stories of Poverty and Inequality. World Bank.
Calderon, Cesar, Pablo Fajnzylber, and J. Humberto Lopez. 2008. “Remittances and Growth: The Role of Complementary Policies.” In Remittances and Development: Lessons from Latin America, edited by Pablo Fajnzylber and J. Humberto Lopez. Latin American Development Forum Series, World Bank.
CEDAW (Convention on the Elimination of All Forms of Discrimination against Women). 2008. “Observaciones finales del Comité para la Eliminación de la Discriminación contra la Mujer: El Salvador.” United Nations CEDAW C/SLV/CO/7.
CEMLA (Centro de Estudios Monetarios Latinoamericanos). 2013. “El perfil de la población de origen salvadoreño en Estados Unidos.” CEMLA and Inter-American Development Bank.
CEMLA, BID, and FOMIN. 2013. El perfil de la población de origen salvadoreño en Estados Unidos, February.
Central Bank of El Salvador. 2005. “Hechos Estilizados en el Crecimiento Económico de
El Salvador (1978-2004),” Documento de Trabajo 2005-002, Banco Central de Reserva de El Salvador.
Chioda, Laura. 2015. Crime Prevention in LAC: Never Too Early, Never Too Late, Never Too Comprehensive. Latin America and the Caribbean Regional Study, World Bank.
Clemens, Michael, and David McKenzie. 2014. “Why Don’t Remittances Appear to Affect Growth?” Policy Research Working Paper 6856, World Bank.
Cruz, Jose Miguel, Alvaro Trigueros Argüello, and Francisco Gonzalez. 2001. “Factores so-ciales y económicos asociados al crimen vio-lento en El Salvador.” In Crimen y Violencia en Latinoamérica, edited by Pablo Fajnzylber, Daniel Lederman, and Norman Loayza. Banco Mundial and Alfaomega.
Cuesta, Jose, Hugo Ñopo, and Georgina Pizzolitto. 2007. “Using Pseudo-Panels to Measure Income Mobility in Latin America.” Working Paper 625, Inter-American Development Bank Research Department.
Dang, Hai-Anh, Lanjouw, Peter, Luoto, Jill, and McKenzie, David. 2011. “Using Repeated Cross-Sections to Explore Movements in and out of Poverty,” World Bank Policy Research Working Paper 5550.
Datt, Gaurav, and Martin Ravallion. 1992. “Growth and Redistribution Components of Changes in Poverty Measures: A Decomposition with Applications to Brazil and India in the 1980s.” Journal of Development Economics 38: 275–95.
De Hoyos, Rafael, Halsey Rogers, and Miguel Szekely. 2015. Out of School and Out of Work: Challenges & Solutions Around the Ninis in Latin America. Latin America and the Caribbean Regional Study, World Bank.
De la Torre, Augusto, Alain Ize, and Sergio L. Schmukler. 2012. Financial Development in Latin America and the Caribbean: The Road Ahead. Latin American and Caribbean Studies, World Bank.
Dilley, Maxx, Robert S. Chen, Uwe Deichmann, Arthur L. Lerner-Lam, and Margaret Arnold. 2005. Natural Disaster Hotspots: A Global Risk Analysis. Washington, DC: World Bank.

Bibliography 123
Dollar, David, Tatjana Kleinberg, and Aart Kraay. 2013. “Growth Still Is Good for the Poor.” Policy Research Working Paper 6568, World Bank.
ECLAC (Economic Commission for Latin America and the Caribbean). 2003. Foreign Investment in Latin America and the Caribbean. United Nations.
Fajnzylber, Pablo, and J. Humberto Lopez. 2008. “The Development Impact of Remittances in Latin America.” In Remittances and Development: Lessons from Latin America, edited by Pablo Fajnzylber and J. Humberto Lopez. Latin American Development Forum Series, World Bank.
Ferreira, Francisco H. G., Julian Messina, Jamele Rigolini, Luis-Felipe Lopez-Calva, Maria Ana Lugo, and Renos Vakis. 2013. Economic Mobility and the Rise of the Latin American Middle Class. Latin American and Caribbean Studies, World Bank.
FLACSO, MINEC, and PNUD. 2010. Mapa de pobreza urbana y exclusión social. Volumen 1. Conceptos y metodología. San Salvador, El Salvador.
FUNDE. 2013. “El Salvador: Análisis de Sostenibilidad Fiscal.” Fundación Nacional para el Desarrollo, San Salvador.
Gal, Michael S. 2009. “Antitrust in a Globalized Economy: The Unique Enforcement Challenges Faced by Small and Developing Jurisdictions.” Fordham International Law Journal 33 (1): 1–56.
Gindling, T. H., J. A. Oliva, and Á. Triguero. 2010. “El impacto de los salarios mínimos en el mercado de trabajo de El Salvador.” Fundación Salvadoreña para el Desarrollo Económico y Social (FUSADES).
Government of El Salvador. 2015. El Salvador. Productivo, Educado y Seguro. Plan Quinquenal de Desarrollo 2014–2019.
Hausmann, Ricardo, and Dani Rodrik. 2005. “Self-Discovery in a Development Strategy for El Salvador.” Economia 6 (1): 43–101.
Hiskey, Jonathan, Mary Malone, and Diana Orces. 2014. “Violence and Migration in Central America.” Americas Barometer Insights: 2014, No. 101. USAID, Americas Barometer, LAPOP, Vanderbilt University.
Hsiang, Solomon, and Amir Jina. 2014. “The Causal Effects of Environmental Catastrophe on Long-Run Economic Growth: Evidence from 6,700 Cyclones.” Working Paper 20352, NBER Working Paper Series, National Bureau of Economic Research.
Hummels, David, Volodymyr Lugovsky, and Alexandre Skiba. 2009. “The Trade Reducing Effects of Market Power in International Shipping.” Journal of Development Economics 89 (1): 89–97.
Ibarra, Lito. 2010. “Texas Instruments: Made in El Salvador.” Conversaciones en línea, La Prensa Gráfica, September 19.
ILO (International Labour Organization). 2014. “Minimum Wages in the Global Garment Industry.” ILO Regional Office for Asia and the Pacific Research Note.
IMF (International Monetary Fund). 2015a. 2014 Article IV Consultation—Staff Report, Press Release, and Statement by the Authorities of El Salvador. Country report 15/13.
———. 2015b. El Salvador—Selected Issues.IUDOP. 2014. La situación de la seguridad y la
justicia, 2009–2014. Entre expectativas de cam-bio, mano dura militar y treguas pandilleras. San Salvador: IUDOP.
Kraay, Aart, and Peter Murrell. 2013. “Misunder-standing Corruption.” Policy Research Work-ing Paper 6488, World Bank.
LAPOP (Latin American Public Opinion Project). 2012. Database. http://www.vanderbilt.edu / lapop/.
LAPOP (Latin American Public Opinion Project). 2014. Database. http://www.vanderbilt.edu / lapop/.
Lartey, Emmanuel K. K., Federico S. Mandelman, and Pablo A. Acosta. 2012. “Remittances, Exchange Rate Regimes and the Dutch Disease: A Panel Data Analysis.” Review of International Economics 20 (2): 377–95.
Lederman, Daniel, Julian Messina, Samuel Pienknagura, and Jamele Rigolini. 2014. Latin American Entrepreneurs: Many Firms but Little Innovation. Latin American and Caribbean Studies, World Bank.
Loayza, Norman, Fajnzylber, Pablo, and Calderon, Cesar. 2005. “Economic Growth

124 Bibliography
in Latin America and the Caribbean: Stylized Facts, Explanations, and Forecasts.” Washington DC: World Bank.
Loayza, Norman, Klaus Schidt-Hebbel, and Luis Serven. 2000. “What Drives Private Saving across the World? Review of Economics and Statistics 82 (2): 165–81.
Lopez, J. Humberto, Luis Molina, and Maurizio Bussolo. 2008. “Remittances, the Real Exchange Rate, and the Dutch Disease Phenomenon.” In Remittances and Development: Lessons from Latin America, edited by Pablo Fajnzylber and J. Humberto Lopez. Latin American Development Forum Series, World Bank.
Lopez, J. Humberto, and Rashmi Shankar, eds. 2011. Getting the Most Out of Free Trade Agreements in Central America. Directions in Development, Trade, World Bank.
MAPAS. 2014. El Salvador: Monitoreo de los Avances de País en Agua Potable y Saneamiento. World Bank.
Marcelo Gordillo, Darwin, Aiga Stokenberga, and Jordan Schwartz. 2010. “Understanding the Benefits of Regional Integration to Trade: The Application of a Gravity Model to the Case of Central America.” Policy Research Working Paper 5506, World Bank.
Martinez, W. Alirio. 2014. “Patrón Comercial, Competitividad y Crecimiento Económico de El Salvador 1990–2012.” Central Bank of El Salvador.
Martinez Peria, Soledad, Yira Mascaro, and Florencia Moiseszowicz. 2008. “Do Remittances Affect Recipient Countries’ Financial Development?” In Remittances and Development: Lessons from Latin America, ed-ited by Pablo Fajnzylber and J. Humberto Lopez. Latin American Development Forum Series, World Bank.
McKenzie, David, and Hillel Rapoport. 2006. “Can Migration Reduce Educational Attainment? Evidence from Mexico.” Journal of Population Economics 24 (4): 1331–58.
McMillan, Margaret, and Dani Rodrik. 2011. “Globalization, Structural Change, and Productivity Growth.” NBER Working Paper 17143, National Bureau of Economic Research.
Molinas, Jose R., Ricardo Paes de Barros, Jaime Saavedra, Marcelo Giugale with Louise J. Cord, Carola Pessino, and Amer Hasan. 2010. Do Our Children Have a Chance? The 2010 Human Opportunity Report for Latin America and the Caribbean. World Bank.
Morales Sarriera, Javier, Gonzalo Anaya, Tomnas Serebrisky, Cecilia Briceño-Garmendia, and Jordan Schwartz. 2013. “Benchmarking Container Port Technical Efficiency in Latin America and the Caribbean: A Stochastic Frontier Analysis.” Policy Research Working Paper 6680, World Bank.
Niimi, Yoko, and Caglar Ozden. 2008. “Migration and Remittances in Latin America: Patterns and Development.” In Remittances and Development: Lessons from Latin America, edited by Pablo Fajnzylber and J. Humberto Lopez. Latin American Development Forum Series, World Bank.
OECD (Organisation for Economic Co-operation and Development). 2010. “Tax Policy Reform and Economic Growth.” OECD Tax Policy Studies 20, Paris.
Oliva, José Andrés. 2011. “Déficit estructural y cíclico en El Salvador.” Análisis económico 12.
Osborne, Theresa, María Claudia Pachón, and Gonzalo Enrique Araya. 2014. “What Drives the High Price of Road Freight Transport in Central America?” Policy Research Working Paper No. 6844, World Bank.
Perry, Guillermo E., Omar S. Arias, J. Humberto Lopez, William F. Maloney, and Luis Serven. 2006. Poverty Reduction and Growth: Virtuous and Vicious Cycles. Latin American and Caribbean Studies, World Bank.
Perry, Guillermo E., William F. Maloney, Omar S. Arias, Pablo Fajnzylber, Andrew D. Mason, and Jaime Saavedra-Chanduvi. 2007. Informal-ity: Exit and Exclusion. Latin American and Caribbean Studies, World Bank.
Shifter, Michael. 2012. Countering Criminal Violence in Central America. Council Special Report 64, Council of Foreign Relations.
Swiston, Andrew. 2011. “Official Dollarization as a Monetary Regime: Its Effects on El Salvador.” IMF Working Paper 11/129, International Monetary Fund.
Bibliography 125
Swiston, Andrew and Barrot, Luis-Diego. 2011. “The Role of Structural Reforms in Raising Economic Growth in Central America,” International Monetary Fund Working Paper WP/11/248.
UNCTAD (United Nations Conference on Trade and Development). 2011. El Salvador: Science, Technology, and Innovation Policy Review.
UNDP (United Nations Development Programme). 2005. Informe sobre Desarrollo Humano El Salvador 2005. Una mirada al nuevo nosotros. El impacto de las migraciones. Programa de las Naciones Unidas para el Desarrollo.
———. 2010. Informe sobre Desarrollo Humano El Salvador 2010. De la pobreza y el consumismo al bienestar de la gente. Propuestas para un nuevo modelo de desarrollo. Programa de las Naciones Unidas para el Desarrollo.
———. 2013. Informe sobre Desarrollo Humano El Salvador 2013. Imaginar un nuevo país. Hacerlo posible. Programa de las Naciones Unidas para el Desarrollo.
UNODC (United Nations Office of Drug and Crime). 2013. Global Study on Homicide 2013.
USAID (United States Agency for International Development). 2008. El Salvador Workforce Development Assessment. San Salvador: USAID.
USG-GoES (US Government and Government of El Salvador). 2011. Partnership for Growth: El Salvador. Constraints Analysis.
Wang, Xiaoping, Janina Franco, Omar R. Masera, Karin Troncoso, and Marta X. Rivera. 2013. ¿Qué Hemos Aprendido del Uso de Biomasa para Cocinar en los Hogares de América Central? ESMAP Report 76222, World Bank.
World Bank. 1995. El Salvador—Meeting the Challenges of Globalization: Country Economic Memorandum and Private sector Assessment. Report 14109-ES.
———. 2003a. “The Economic and Social Costs of Armed Conflict in El Salvador.” Dissemination note 8, Conflict Prevention and Reconstruction Unit, World Bank.
———. 2003b. El Salvador—Country Economic Memorandum. Report 26238.
———. 2005. El Salvador: Investment Climate Assessment. 2 vols, Report 32711–SV.
———. 2010. Youth Development and Economic Opportunities in El Salvador.
———. 2011a. Crime and Violence in Central America: A Development Challenge.
———. 2011b. Una (R)evolución de género en marcha. Ampliación de las oportunidades económicas para las mujeres en América Central: Revisión de la última década.
———. 2012a. Better Jobs in Central America: The Role of Human Capital.
———. 2012b. Mejores empleos en El Salvador: El rol del capital humano.
———. 2012c. El Salvador: Country Land Assessment. Report no. 82312–SV.
———. 2012d. Semiannual Report. Office of the Chief Economist for Latin America and the Caribbean. October.
———. 2012e. Teenage Pregnancy and Opportunities in Latin America and the Caribbean.
———. 2013. Estudio Institucional y sobre Gasto Público en Seguridad y Justicia en El Salvador.
———. 2014. Semiannual Report. Office of the Chief Economist for Latin America and the Caribbean. April.
———. 2014. Changing Mindsets to Transform Markets: Lessons Learned from the First Annual Awards in Competition Policy Advocacy.
———. 2015a. Central America Social Sectors Expenditure and Institutional Review.
———. 2015b. El Salvador: Investment Reform Memorandum.
———. 2015c. Understanding the Latin American and the Caribbean Income Gap. What Is Preventing LAC from Converging to Higher Income Levels?
Zegarra, Luis Felipe, Martha Rodriguez, and Carlos Acevedo (2007), “Competitiveness and Growth in Latin America—Country Case: El Salvador,” ES-P1028. Washington DC: Country Department Central America, Mexico, Panama and Dominican Republic (CID), Inter-American Development Bank.

Since the end of the civil War in 1992, El Salvador has advanced on both the social and political fronts. Despite this progress and the recent reductions in income inequality, poverty remains high, largely as a result of low economic growth. This Systematic Country Diagnostic argues that the challenge in El Salvador is not to identify the proximate constraints to growth, but how those constraints are interconnected and what entry points may help break what can be characterized as “vicious circles.”
The Systematic Country Diagnostic identifies three interconnected vicious circles that hamper growth and shared prosperity: (1) a cycle of low growth and violence; (2) a cycle of low growth and migration; and (3) a cycle of low growth, savings and investment. Moreover, it also notes action on the identified entry points will require a “big push” (rather than marginal interventions) that helps break the existing development dynamics. But this Systematic Country Diagnostic also identifies some strengths that El Salvador could build on to propel growth. Areas of opportunity include migration with the positive impact of diaspora on development, geographic and cultural proximity to large export markets, particularly the U.S., and an industrial base that can support an expansion of the tradable sector. At 20 percent of GDP, the manufacturing sector is large by Latina American and by middleincome country standards.
El Salvador
SKU K8331